Advanced Strategies to Minimize Electrochemical Interference in Biosensors for Biomedical Research
This article provides a comprehensive analysis of strategies to reduce electrochemical interference, a critical challenge that compromises the sensitivity, specificity, and reliability of biosensors.
Advanced Strategies to Minimize Electrochemical Interference in Biosensors for Biomedical Research
Abstract
This article provides a comprehensive analysis of strategies to reduce electrochemical interference, a critical challenge that compromises the sensitivity, specificity, and reliability of biosensors. Aimed at researchers, scientists, and drug development professionals, it explores the foundational sources of noise, from electronic and environmental to biological origins. The scope extends to methodological innovations in materials science, bioreceptor engineering, and system design, alongside advanced troubleshooting techniques leveraging artificial intelligence and multi-mode sensing for optimization. Finally, the article covers validation frameworks and performance comparisons, establishing a pathway for developing robust, clinically viable biosensing platforms for precision medicine and point-of-care diagnostics.
Understanding the Enemy: A Deep Dive into the Sources and Impact of Electrochemical Interference
In the pursuit of robust and reliable electrochemical biosensors, researchers and developers must contend with a spectrum of interference signals, or "noise," that can obfuscate the target analytical signal. This noise, if unmitigated, compromises sensitivity, selectivity, and the overall accuracy of a biosensor, particularly in complex matrices like blood, serum, or saliva. Effectively classifying and understanding these interferences is the first critical step in developing strategies to suppress them. This guide frames the challenge of interference within the broader thesis of advancing biosensor research, providing a practical toolkit for troubleshooting the most common issues encountered during experimental development. The content is structured to directly address the problems faced by researchers, scientists, and drug development professionals, offering clear FAQs, detailed protocols, and actionable solutions to enhance the performance of their electrochemical platforms.
Noise Classification and Troubleshooting FAQs
Electrochemical biosensors are susceptible to various interferences that can be systematically categorized into electronic, environmental, and biological noise. The table below summarizes these key interference types, their sources, and their impact on the sensor signal.
Table 1: Classification of Interferences in Electrochemical Biosensors
| Noise Category | Type of Interference | Source / Cause | Effect on Sensor Signal |
|---|---|---|---|
| Electronic | Thermal Noise | Random thermal motion of charge carriers in the electrode and electronic components [1]. | Increases baseline current/voltage fluctuations, raising the limit of detection. |
| Electronic | Flicker Noise (1/f) | Imperfections and heterogeneity on the electrode surface [1]. | Causes low-frequency signal drift, obscuring slow or small Faradaic processes. |
| Environmental | Electromagnetic Interference (EMI) | External electromagnetic fields from power lines, radio transmitters, or other lab equipment [2]. | Introduces erratic, high-frequency spikes or an unstable baseline in the measured signal. |
| Biological | Biofouling | Non-specific adsorption of proteins, cells, or other biomolecules onto the electrode surface [1] [2]. | Passivates the electrode, reducing electron transfer kinetics and signal amplitude over time. |
| Biological | Cross-reactivity | Lack of perfect specificity in the biorecognition element (e.g., antibody, aptamer) [3]. | Generates a false positive signal from structurally similar molecules that are not the target analyte. |
Electronic Noise: Thermal and Flicker
Q1: My baseline current shows significant random fluctuations, even in a pure buffer solution. What could be the cause and how can I minimize it?
A: This is a classic symptom of electronic noise, primarily Thermal (Johnson-Nyquist) noise. This inherent noise arises from the random thermal motion of electrons in the electrochemical cell and the circuitry of your potentiostat. Its magnitude is proportional to the square root of the resistance and temperature.
- Troubleshooting Steps:
- Control Temperature: Perform experiments in a temperature-controlled environment (e.g., an incubator or Faraday cage with temperature regulation) to minimize thermal drift.
- Check Connections: Ensure all cables and electrode connections are secure and clean, as poor contacts increase resistance and noise.
- Shield the System: Use a Faraday cage to enclose your electrochemical setup. This will not directly reduce thermal noise but is crucial for isolating the system from external electromagnetic interference (EMI), which often compounds the problem.
- Signal Averaging: Employ multiple scans and use the averaged signal in your measurements. Thermal noise is random, so averaging multiple runs can help cancel it out.
Q2: I observe a persistent low-frequency drift in my baseline during long-term or slow-scan measurements. How can I address this?
A: This signal drift is typically characteristic of Flicker Noise (1/f noise), which is dominant at low frequencies. In electrochemical systems, this is often related to surface phenomena and heterogeneity on the electrode.
- Troubleshooting Steps:
- Electrode Polishing: Ensure your solid working electrode (e.g., Glassy Carbon Electrode, GCE) is meticulously polished to a mirror finish using progressively finer alumina slurry. A reproducible and smooth surface minimizes 1/f noise [4].
- Surface Characterization: Use techniques like Atomic Force Microscopy (AFM) or Scanning Electron Microscopy (SEM) to verify the homogeneity of your electrode surface or the nanomaterial coating you have applied.
- Electrode Modification: Employ nanomaterials like graphene or carbon nanotubes that provide a large, uniform electroactive surface area. This can help distribute the electrochemical processes more evenly, reducing noise originating from surface defects [1].
Environmental Noise: Electromagnetic Interference (EMI)
Q3: My voltammograms show unpredictable, sharp spikes that are not reproducible. What is the likely source?
A: These erratic spikes are a hallmark of Electromagnetic Interference (EMI). Your setup is likely picking up ambient electromagnetic radiation from sources like AC power lines, fluorescent lights, switches, or motors in nearby equipment.
- Troubleshooting Steps:
- Use a Faraday Cage: This is the most effective solution. Always conduct sensitive electrochemical measurements inside a properly grounded Faraday cage.
- Check Grounding: Ensure your potentiostat and all other instruments are connected to a common, proper ground.
- Isolate Power Sources: Run the instrument on battery power if possible, or use a line conditioner to filter AC power noise. Move cell phones and other wireless devices away from the setup.
Biological Noise: Biofouling and Cross-reactivity
Q4: The sensitivity of my biosensor decreases significantly after exposure to complex biological samples like serum or blood. Why?
A: This loss of sensitivity is most likely due to Biofouling. Proteins, lipids, and cells non-specifically adsorb onto your electrode surface, forming an insulating layer that blocks electron transfer and access to the biorecognition elements [1] [2].
- Troubleshooting Steps:
- Surface Passivation: Co-modify your electrode with anti-fouling agents. Common solutions include:
- Poly(ethylene glycol) (PEG) and its derivatives: Form a hydrophilic, steric barrier that repels proteins [2].
- Self-Assembled Monolayers (SAMs): Dense, well-ordered monolayers (e.g., of alkanethiols on gold) can reduce non-specific adsorption.
- Hydrogels: Create a hydrated physical barrier against fouling agents.
- Use Nanomaterials: Certain nanomaterials like reduced Graphene Oxide (rGO) can offer improved biocompatibility and reduced fouling compared to bare electrodes [1].
- Sample Dilution or Pre-treatment: If compatible with your detection limit, dilute the sample in a clean buffer or use centrifugal filters to remove large fouling agents.
- Surface Passivation: Co-modify your electrode with anti-fouling agents. Common solutions include:
Q5: My sensor shows a positive signal for a non-target molecule that is structurally similar to my analyte. How can I improve specificity?
A: This is the challenge of Cross-reactivity, where your biorecognition element (e.g., antibody, aptamer) interacts with non-target analytes.
- Troubleshooting Steps:
- Biorecognition Element Engineering: Screen for and use high-affinity aptamers or monoclonal antibodies with higher specificity. For enzymes, ensure substrate specificity is high.
- Use a Dual-Recognition System: Design a sandwich-type assay that requires two separate recognition events to generate a signal, which dramatically increases specificity.
- Optimize Assay Conditions: Fine-tune the pH, ionic strength, and incubation time of your assay. Suboptimal conditions can promote weak, non-specific binding.
- Introduce Blocking Agents: During the immobilization and assay steps, use blocking buffers containing inert proteins (e.g., Bovine Serum Albumin - BSA) or casein to occupy any non-specific binding sites on the electrode surface.
Detailed Experimental Protocols for Mitigating Interferences
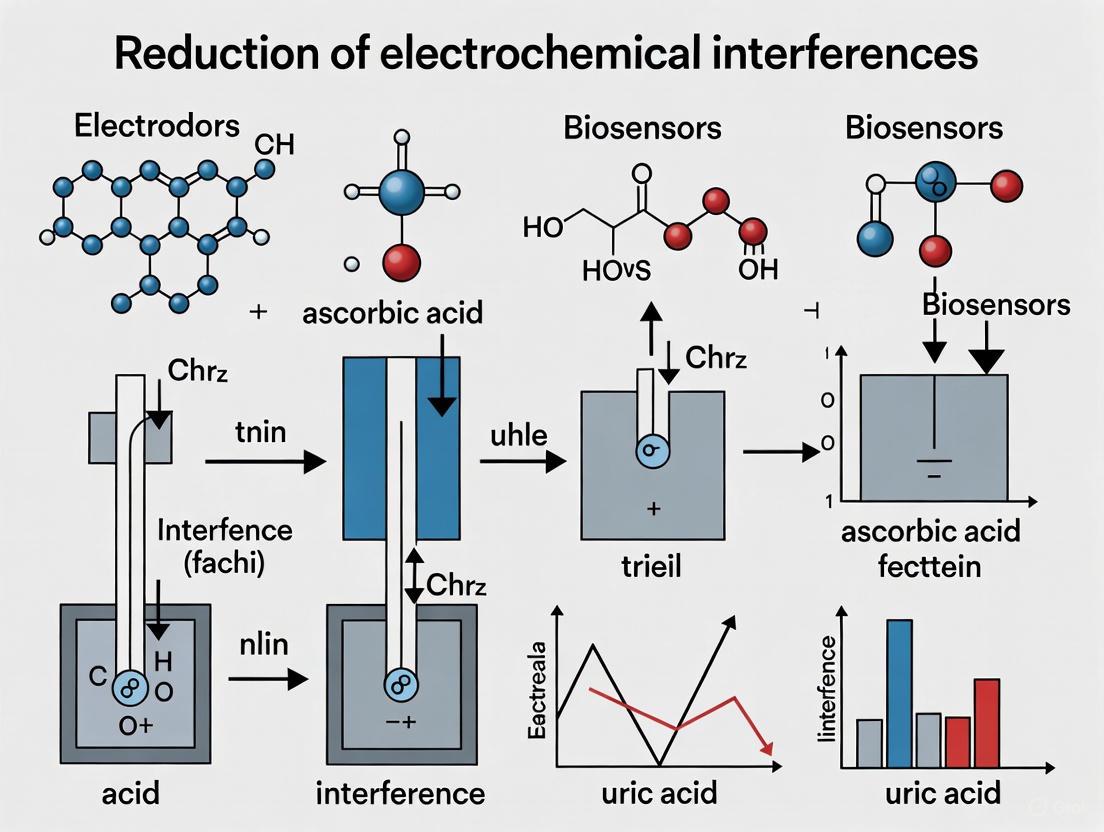
Protocol: Minimizing Interference from Ascorbic Acid using a BDD Electrode and Mediator Selection
This protocol is adapted from a study demonstrating low-interference detection of glucose and lactate [5]. It provides a concrete methodology for tackling a common source of environmental interference in enzymatic biosensors.
1. Objective: To detect glucose or lactate in human serum with minimal interference from ascorbic acid (AA) by using a Boron-Doped Diamond (BDD) working electrode and the electron mediator menadione (MD).
2. Principle: The BDD electrode exhibits a high overpotential for the oxidation of AA, resulting in a slow reaction rate and lower background current. Furthermore, menadione has a lower formal potential than AA, leading to a slow redox reaction rate between them. This synergistic combination minimizes the signal contribution from the interfering species [5].
3. Materials and Reagents:
- Working Electrode: Boron-Doped Diamond (BDD) electrode.
- Control Electrodes: Au, Glassy Carbon (GC), or Indium Tin Oxide (ITO) electrodes for comparison.
- Electron Mediators: Menadione (MD), Ru(NH₃)₆³âº, 4-amino-1-naphthol, 1,4-naphthoquinone.
- Enzymes: Glucose oxidase (GOx) for glucose detection; Lactate oxidase (LOx) for lactate detection.
- Biochemicals: D-glucose, L-lactate, Ascorbic Acid (AA).
- Buffer: Phosphate Buffered Saline (PBS), pH 7.4.
4. Experimental Procedure:
- Step 1: Electrode Preparation. Clean the BDD electrode according to the manufacturer's instructions (e.g., sonicate in ethanol and DI water).
- Step 2: Immobilization. Prepare an enzyme-mediator mixture. For the glucose sensor, mix GOx and MD in a suitable buffer. Deposit a precise volume (e.g., 5 µL) of this mixture onto the active area of the BDD electrode and allow it to dry under ambient conditions or a gentle nitrogen stream [5] [4].
- Step 3: Electrochemical Measurement.
- Use a standard three-electrode system (BDD working, Pt counter, Ag/AgCl reference).
- Immerse the electrode in a stirred PBS solution (pH 7.4).
- Apply the required potential for the redox cycling (e.g., 0.2 V vs. Ag/AgCl for MD-based detection).
- Record the amperometric current (i-t curve).
- Successively add aliquots of the glucose/lactate standard solution to the cell and record the steady-state current after each addition.
- Step 5: Interference Test. Repeat the above measurement in the presence of a physiologically relevant concentration of Ascorbic Acid (e.g., 0.1 mM) to demonstrate the minimal interference effect.
5. Expected Results: The combination of BDD electrode and menadione should yield a highly linear response to the target analyte (glucose/lactate) with a low detection limit (e.g., ~3 µM for glucose in ENN redox cycling), while the current response from the addition of AA will be negligible compared to other electrode-mediator combinations [5].
Protocol: Constructing a Carbon Nanotube-Based Impedimetric Biosensor to Combat Biofouling and Enhance Sensitivity
This protocol outlines the construction of a biosensor using carbon nanotubes to increase surface area and improve signal-to-noise ratio, while also incorporating strategies to reduce biofouling [1].
1. Objective: To fabricate a label-free impedimetric biosensor with enhanced sensitivity and reduced biofouling for the detection of a specific DNA sequence or protein.
2. Principle: Single-Walled Carbon Nanotubes (SWCNTs) provide a large surface area for immobilizing biomolecules (e.g., ssDNA probes or antibodies) and facilitate efficient electron transfer. The porous, nanoscale structure can help mitigate some fouling, and further passivation can be applied. The binding of the target analyte increases the charge-transfer resistance (Rct), which is measured using Electrochemical Impedance Spectroscopy (EIS) [1] [6].
3. Materials and Reagents:
- Working Electrode: Glassy Carbon Electrode (GCE) or screen-printed gold electrode.
- Nanomaterial: Carboxylated Single-Walled Carbon Nanotubes (SWCNTs-COOH).
- Cross-linker: 1-Ethyl-3-(3-dimethylaminopropyl)carbodiimide (EDC) and N-Hydroxysuccinimide (NHS).
- Biorecognition Element: Amino-modified ssDNA probe or specific antibody.
- Anti-fouling Agent: Poly(ethylene glycol) Thiol (SH-PEG) for gold surfaces, or BSA for blocking.
- Redox Probe: 5 mM [Fe(CN)₆]³â»/â´â» in PBS.
4. Experimental Procedure:
- Step 1: Electrode Modification with SWCNTs.
- Polish the GCE and clean it.
- Disperse SWCNTs-COOH in DI water (e.g., 1 mg/mL) and sonicate to create a stable suspension.
- Deposit a known volume (e.g., 10 µL) of the SWCNT suspension onto the GCE surface and let it dry under ambient conditions (drop-coating) [4].
- Step 2: Functionalization with Biorecognition Element.
- Activate the carboxyl groups on the SWCNTs by incubating the modified electrode in a solution of EDC and NHS for 1 hour.
- Rinse the electrode to remove excess EDC/NHS.
- Incubate the electrode with a solution containing the amino-modified ssDNA probe or antibody for several hours to allow covalent immobilization via amide bond formation [1].
- Step 3: Anti-fouling Passivation.
- Incubate the functionalized electrode in a solution of SH-PEG (for gold) or BSA (for general use) to block any remaining non-specific binding sites.
- Rinse thoroughly with buffer.
- Step 4: EIS Measurement.
- Perform EIS in the redox probe solution over a frequency range (e.g., 0.1 Hz to 100 kHz) at a fixed DC potential.
- Record the Nyquist plot. The diameter of the semicircle corresponds to the Rct.
- Incubate the biosensor with the target analyte and measure the EIS again. An increase in Rct indicates successful target binding.
5. Expected Results: The SWCNT-modified electrode will show a significantly lower initial Rct compared to a bare electrode, indicating enhanced electron transfer. Upon target binding, a clear and measurable increase in Rct will be observed. The passivated sensor should maintain its performance with a minimal change in baseline Rct when exposed to a complex, fouling-rich sample like diluted serum [1].
The Scientist's Toolkit: Essential Research Reagent Solutions
Table 2: Key Materials and Reagents for Interference Mitigation
| Item | Function / Application | Example in Use |
|---|---|---|
| Boron-Doped Diamond (BDD) Electrode | Working electrode material with a wide potential window, low background current, and low susceptibility to fouling. | Used with menadione mediator for low-interference detection of glucose and ascorbic acid [5]. |
| Menadione | An electron mediator with a low formal potential, reducing its reactivity with common interfering species like ascorbic acid [5]. | Synergistic use with BDD electrode in enzymatic (EN) redox cycling biosensors. |
| Carbon Nanotubes (SWCNTs/MWCNTs) | Nanomaterial used to modify electrode surfaces; provides a large surface area, enhances electron transfer, and increases biomolecule loading capacity [1]. | Covalent immobilization of DNA probes for enhanced sensitivity in impedimetric detection [1]. |
| Graphene Oxide (GO) & Reduced GO (rGO) | 2D nanomaterial with high surface area and excellent conductivity. rGO, in particular, is favorable for electrochemical biosensing [1]. | SERS-based biosensor platform; acts as a binding layer and signal enhancer when combined with metallic nanoparticles [7]. |
| EDC & NHS Cross-linkers | Carbodiimide chemistry agents used to activate carboxyl groups for covalent immobilization of biomolecules (with primary amines) onto electrode surfaces [1] [3]. | Creating stable, covalently bonded layers of antibodies or DNA on COOH-functionalized nanomaterials. |
| Poly(ethylene glycol) (PEG) | Anti-fouling polymer used to create a hydrophilic, steric barrier on surfaces, minimizing non-specific protein adsorption [2]. | Incorporated into self-assembled monolayers (SAMs) on gold electrodes to improve performance in serum. |
| Metal-Organic Frameworks (MOFs) | Porous crystalline materials that can be used for signal amplification and to enhance selectivity in sensing interfaces [2]. | Used in advanced surface engineering to lower detection limits for specific disease biomarkers. |
| Shanciol B | Shanciol B, MF:C25H26O6, MW:422.5 g/mol | Chemical Reagent |
| Isoprocarb-d3 | Isoprocarb-d3, MF:C11H15NO2, MW:196.26 g/mol | Chemical Reagent |
Visualizing Experimental Workflows
Interference Mitigation Strategy Diagram
BDD Electrode Experimental Workflow
Frequently Asked Questions (FAQs)
1. What are the most common sources of interference in electrochemical biosensors? In complex real samples, electrochemical sensors are susceptible to several types of interference that can degrade performance. Key sources include:
- Chemical Interference: Signals from non-target substances with similar redox potentials can cause signal overlap and cross-interference, especially when detecting biomarkers in biological fluids like blood or saliva [8].
- Matrix Effects: The complex physiological environment itself can cause non-specific binding and electrode fouling, where proteins and other molecules adsorb to the sensor surface, blocking the active sites and reducing signal strength over time [9].
- Environmental Factors: Changes in temperature, humidity, and long-term usage can lead to signal drift, where the baseline signal changes, making accurate calibration difficult [8].
2. How does interference lead to a higher Limit of Detection (LoD)? Interference elevates the baseline noise of the sensor system. At low analyte concentrations, the target signal can be obscured by this noise, making it indistinguishable. This low signal-to-noise ratio makes it difficult for the sensor to reliably confirm the presence of trace amounts of the analyte, thereby increasing the practical LoD [8]. For instance, without strategies to mitigate interference, a sensor might fail to detect a biomarker at clinically relevant low concentrations [9].
3. What mechanisms cause false positives and false negatives?
- False Positives occur when interference from other substances generates a signal that the sensor misinterprets as the target analyte. For example, in complex samples, other electroactive compounds can be misjudged as the biomarker of interest [9].
- False Negatives happen when interference masks the signal from the actual target. This can be due to signal suppression from electrode fouling, where the sensor surface is blocked, or when the target is present at a concentration too close to the elevated noise floor caused by interference [8] [10].
4. Can AI/ML truly help overcome these interference issues? Yes, Artificial Intelligence (AI) and Machine Learning (ML) offer powerful, data-driven approaches to combat interference. They do not eliminate the physical/chemical interference but can mathematically separate the desired signal from the noise [8] [9].
- Feature Extraction and Noise Reduction: ML algorithms can process raw, complex sensor data to identify and extract the unique "fingerprint" of the target analyte while suppressing noise and signals from interferents [8] [9].
- Modeling Complex Relationships: They can learn the nonlinear relationship between the sensor's signal and the target concentration, even in the presence of drift or multiple interferents, leading to more accurate calibration models [8].
- Multiplexed Signal Decoding: For sensors designed to detect multiple targets at once, ML is particularly effective at deconvoluting overlapping signals, significantly enhancing selectivity and accuracy [8].
5. What are some experimental strategies to minimize interference?
- Surface Engineering: Using three-dimensional (3D) immobilization materials like hydrogels, metal-organic frameworks (MOFs), or porous carbon can increase probe density and improve binding efficiency, which helps enhance sensitivity and selectivity against interferents [11].
- Material Selection: Incorporating advanced nanomaterials like polydopamine-based coatings or violet phosphorene can improve biocompatibility, reduce fouling, and increase the signal-to-noise ratio [8] [12].
- Sensor Design: Employing mediators or specific electrode modifications can create a more selective electron transfer pathway, reducing the influence of other electroactive species [8].
Experimental Protocols & Troubleshooting Guides
Protocol 1: Assessing and Mitigating Signal Drift
Objective: To evaluate and correct for signal drift caused by environmental factors and sensor aging.
Materials:
- Electrochemical workstation (e.g., potentiostat)
- Your biosensor system (working, reference, and counter electrodes)
- Standard buffer solutions
- Temperature and humidity control chamber (optional but recommended)
Methodology:
- Baseline Recording: Immerse the sensor in a stable standard solution. Record the baseline current or potential over an extended period (e.g., 1-2 hours) under constant, controlled conditions.
- Drift Characterization: Plot the baseline signal over time. The slope of this plot indicates the drift rate.
- ML-Assisted Compensation:
- Collect a dataset of sensor signals alongside reference measurements (e.g., from a standard lab technique) taken at multiple time points.
- Train a machine learning model (e.g., a time-series forecasting model like ARIMA or a recurrent neural network) to learn the relationship between the drifting sensor signal and the true reference value.
- Integrate this model into your data processing pipeline to predict and subtract the drift component from future sensor readings [8].
Troubleshooting Tip: If drift is excessive, investigate the stability of your reference electrode and the consistency of your sensor's surface modification. A poorly fabricated or aged reference electrode is a common source of drift.
Protocol 2: Enhancing Selectivity in Complex Samples
Objective: To improve sensor accuracy when detecting a specific target in a mixture of interfering substances.
Materials:
- Functionalized biosensor
- Target analyte standard
- Potential interfering substances (e.g., ascorbic acid, uric acid, acetaminophen for biological samples)
- Buffer for sample dilution
Methodology:
- Individual Calibration: Measure the sensor's response to the target analyte across a range of concentrations in a clean buffer to establish a standard curve.
- Interference Test: Spike a constant, physiologically relevant concentration of the target analyte into samples that also contain high concentrations of potential interferents. Measure the sensor response for each mixture.
- Data Processing with ML:
- Use techniques like Principal Component Analysis (PCA) to visualize if the data from target and interference clusters can be separated.
- Train a classification or regression model (e.g., Support Vector Machine or Artificial Neural Network) on the raw or pre-processed voltammetric/impendence data. The model will learn to recognize the complex pattern unique to the target, even against a noisy background [8] [9].
- Validation: Test the ML-enhanced sensor on a blind set of complex samples (e.g., diluted serum) and compare its performance against a standard method.
Troubleshooting Tip: If selectivity remains low, consider refining the feature extraction step for your ML model or re-evaluating the specificity of your biorecognition element (e.g., antibody or aptamer).
Table 1: Common Interference Types and Their Impact on Sensor Performance
| Interference Type | Primary Cause | Effect on LoD | Effect on False Results | Primary Mitigation Strategies |
|---|---|---|---|---|
| Chemical Interference [8] [9] | Similar redox potentials of non-target molecules | Increases | Increases both False Positives & Negatives | Machine Learning signal deconvolution; Use of selective mediators |
| Signal Drift [8] | Environmental changes (temp, humidity); sensor aging | Increases | Increases False Positives over time | ML-based drift compensation; Environmental control; Robust reference electrodes |
| Matrix Effects / Fouling [9] [11] | Non-specific adsorption of proteins/lipids | Increases | Increases False Negatives (signal suppression) | 3D surface engineering (e.g., hydrogels, MOFs); Anti-fouling coatings (e.g., polydopamine) |
| Low Signal-to-Noise at Trace Levels [8] | Weak target signal obscured by system noise | Defines the fundamental LoD | Increases False Negatives | Nanomaterial-enhanced signal amplification; ML for noise reduction |
Table 2: Performance of AI/ML Models in Addressing Sensor Challenges
| Sensor Challenge | ML Algorithm Applied | Key Performance Outcome | Reference Context |
|---|---|---|---|
| Nonlinear Signal-Concentration Relationship | Artificial Neural Networks (ANNs) | Accurate modeling of saturation behavior, expanding dynamic range | [8] |
| Signal Drift Compensation | Time-Series Forecasting Models | Corrected for long-term signal decay, improving accuracy from >10% to <3% error | [8] |
| Multiplexed Detection & Cross-Talk | Support Vector Machines (SVM) | Enabled simultaneous quantification of multiple biomarkers with high selectivity | [8] |
| Low-Concentration Accuracy | Combined with optimized nanomaterials (e.g., BiFeO3/MXene) | Achieved ultra-sensitive Pb2+ detection with a significantly lowered LoD | [8] |
The Scientist's Toolkit: Key Research Reagent Solutions
Table 3: Essential Materials for Developing Interference-Resistant Biosensors
| Material / Reagent | Function | Example in Application |
|---|---|---|
| Metal Nanoparticles (e.g., Au, Pt) [11] | Enhance electrical conductivity and provide a high-surface-area scaffold for probe immobilization. | Gold nanoparticles used in a BiFeO3/Ti3C2 MXene platform for sensitive Pb2+ detection [8]. |
| Carbon-Based Nanomaterials (Graphene, CNTs) [11] | Improve electron transfer kinetics and increase the electroactive surface area. | 3D graphene oxide structures used to enhance performance in influenza virus sensors [11]. |
| Metal-Organic Frameworks (MOFs) [11] | Provide ultra-high porosity and tunable chemistry for efficient 3D capture of target molecules. | MOFs used in trimetallic sensors for detecting p-Nitrophenol in soil [8]. |
| Hydrogels [11] | Create a biocompatible, hydrated 3D matrix that reduces non-specific adsorption and increases probe loading. | Used as a matrix for biomolecule capture in 3D-based biosensors [11]. |
| Aptamers [8] | Serve as synthetic, stable recognition elements that can be selected for high specificity to a target. | Used in platforms for detecting mycophenolic acid and THC/CBD, overcoming cross-interferences [8]. |
| Machine Learning Algorithms [8] [9] | Process complex electrochemical data to extract features, reduce noise, and model nonlinear relationships. | Used to distinguish biomarkers in complex mixtures and compensate for signal drift [8]. |
| (Rac)-Ruxolitinib-d9 | (Rac)-Ruxolitinib-d9, MF:C17H18N6, MW:315.42 g/mol | Chemical Reagent |
| Antitubercular agent-13 | Antitubercular agent-13|Pks13 Inhibitor|For Research | Antitubercular agent-13 is a potent Pks13 inhibitor for tuberculosis research. It targets mycolic acid biosynthesis. For Research Use Only. Not for human use. |
Visualized Workflows and Relationships
Diagram 1: Interference Impact Pathway
Diagram 2: AI-Enhanced Sensor Workflow
Frequently Asked Questions (FAQs)
Q1: My electrochemical biosensor shows inconsistent results between measurements. What could be causing this?
Inconsistent results often stem from instability at the electrode-electrolyte interface. Key factors include:
- Self-Assembled Monolayer (SAM) Instability: Repeated electrochemical interrogation, such as cyclic voltammetry (CV) scans, can cause reorganization or degradation of thiolated nucleic acid and mercapto alcohol monolayers on gold surfaces. This leads to changes in packing density and false changes in charge-transfer resistance (R~ct~) [13].
- Electrode Fouling: Non-specific adsorption of proteins or other molecules from complex samples (e.g., blood, serum) can block active sites and increase background noise [14].
- Redox Mediator Degradation: Partial degradation of common redox mediators like
[Fe(CN)~6~]^(3−/4−)can produceCN−anions, which contribute to etching the gold electrode surface, permanently altering its properties [13].
Q2: Why is the sensitivity of my sensor lower than expected when detecting low analyte concentrations?
A lower-than-expected sensitivity is frequently a problem of signal-to-noise ratio.
- High Background Noise: Electronic noise (e.g., thermal noise, 1/f flicker noise from electrode material imperfections) and environmental electromagnetic interference can mask the weak signal from low-concentration analytes [14].
- Suboptimal Electron Transfer Kinetics: Slow electron transfer kinetics at the electrode surface can dampen the Faradaic signal. This can be influenced by the electronic structure of the electrode material, including its density of states near the Fermi level and quantum capacitance [15].
- Inefficient Probe Immobilization: Low or uneven packing density of biorecognition elements (e.g., aptamers) on the transducer surface reduces the number of available binding sites, leading to a weaker signal [13].
Q3: I am observing a high rate of false positives. How can I improve the selectivity of my biosensor?
False positives are typically caused by interference from non-target molecules.
- Non-Specific Adsorption: Interferents present in complex sample matrices can adsorb onto the sensor surface or the molecularly imprinted polymer (MIP), producing a signal that mimics the target [16].
- Cross-Reactivity: The biorecognition element (e.g., an aptamer) may have affinity for molecules structurally similar to the target analyte.
- Solution: Employ a differential sensing strategy. Using a pair of sensors—such as two molecularly imprinted polymer (MIP) sensors for different analytes—allows you to subtract the signal contribution from non-specific adsorption common to both, significantly enhancing selectivity [16].
Troubleshooting Guides
Problem 1: Drifting Baseline and Signal Instability
This problem manifests as an unstable baseline current or impedance, making it difficult to distinguish the true signal.
| Troubleshooting Step | Action / Protocol | Key Parameters & Expected Outcome |
|---|---|---|
| Inspect SAM Stability [13] | Characterize the monolayer pre- and post-CV using EIS. Fit data to a modified Randles circuit to track R~ct~ and capacitance. | Protocol: Immobilize thiolated DNA on Au electrode, then backfill with MCH. Run 10 CV cycles (0.8 V to -0.15 V, 100 mV/s). Measure EIS after cycles 1, 5, and 10. Outcome: A stable SAM shows <5% change in R~ct~ after 10 cycles. |
| Verify Electrode Cleaning [13] | Clean the gold electrode to remove adsorbed contaminants and oxide layers before SAM formation. | Protocol: Electrochemically clean in 0.5 M H~2~SO~4~ or 0.1 M KOH via CV until a stable voltammogram for a clean Au surface is achieved. Outcome: A clean, reproducible Au surface voltammogram. |
| Check Redox Mediator [13] | Use a fresh redox mediator solution and avoid repeated use. | Protocol: Prepare [Fe(CN)~6~]^(3−/4−) solution daily in degassed buffer. Outcome: Improved signal stability and reduced electrode etching. |
The following workflow outlines the systematic approach to diagnosing and resolving baseline drift:
Problem 2: Poor Signal-to-Noise Ratio in Low Concentration Detection
A poor signal-to-noise ratio (SNR) obscures the detection of low-concentration analytes, raising the limit of detection.
| Troubleshooting Step | Action / Protocol | Key Parameters & Expected Outcome |
|---|---|---|
| Assess Electronic Noise [14] | Use a Faraday cage to shield the setup. Use twisted-pair cables and ensure proper grounding. | Protocol: Place electrochemical cell inside a grounded Faraday cage. Outcome: Significant reduction in 50/60 Hz power line noise and environmental EMI. |
| Evaluate Electrode Material [14] [15] | Switch to advanced carbon nanomaterials with high conductivity and innate antifouling properties. | Protocol: Fabricate electrodes using novel carbon nanomaterials (e.g., LIG, N-doped graphene). Outcome: Reduced thermal/flicker noise and higher sensitivity due to tunable electronic structure. |
| Apply Antifouling Coatings [14] | Apply a coating to reduce non-specific binding in complex matrices. | Protocol: Form a nanocomposite antifouling layer (e.g., BSA/prGOx/GA) or use PEG. Outcome: Reduced false positives from serum/blood components, leading to a cleaner signal. |
Problem 3: Low Selectivity and Specificity
The sensor responds to interferents, leading to false positives and inaccurate quantification.
| Troubleshooting Step | Action / Protocol | Key Parameters & Expected Outcome |
|---|---|---|
| Implement a Differential Strategy [16] | Use a dual-sensor system to correct for non-specific adsorption. | Protocol: Fabricate two MIP sensors for different analytes (e.g., AP and SMR). Use the current difference between them as the signal indicator. Outcome: Interference from non-specific adsorption is reduced by an order of magnitude. |
| Optimize Probe Packing Density [13] | Systematically vary the concentration of thiolated probe DNA during SAM formation to find the optimal density. | Protocol: Immobilize thiolated DNA at concentrations from 0.1 to 5 µM. Characterize with chronocoulometry and EIS. Outcome: A packing density that maximizes signal for target binding while minimizing non-specific adsorption. |
| Validate with Controls [13] | Always run control experiments with non-complementary targets or on NIP surfaces. | Protocol: Test sensor response against a panel of structurally similar molecules. Outcome: Confirmation that the signal change is due to specific target-probe interaction. |
The diagram below illustrates the core principle of the differential sensing strategy for enhancing selectivity:
The Scientist's Toolkit: Key Research Reagent Solutions
The following table details essential materials and their functions for developing robust electrochemical biosensors, as derived from the cited research.
| Item | Function / Rationale | Example Application |
|---|---|---|
| Thiolated Nucleic Acids (Aptamers) | Forms the biorecognition SAM on gold surfaces. The thiol group provides a stable Au-S bond for immobilization [13]. | Affinity-based detection of specific targets (proteins, small molecules) [17] [13]. |
| Mercaptohexanol (MCH) | A short-chain alkanethiol used as a diluent in mixed SAMs. It minimizes non-specific adsorption and helps orient the nucleic acid probes upright [13]. | Backfilling SAMs to create a well-ordered, low-fouling sensing interface on gold electrodes [13]. |
| Potassium Hexacyanoferrate(II/III) | A common outer-sphere redox probe for characterizing electrode kinetics and interface integrity via EIS and CV [13] [15]. | Quantifying charge-transfer resistance (R~ct~) and monitoring SAM formation and stability [13]. |
| Ruthenium Hexamine (RuHex) | A cationic redox probe used in chronocoulometry to determine the surface coverage of anionic DNA probes [13]. | Measuring the surface density (molecules/cm²) of immobilized nucleic acid probes [13]. |
| Ni~2~P Nanoparticles | A noble-metal-free electrocatalyst used to modify the electrode surface, enhancing sensitivity and electron transfer [16]. | Serving as an electrode modifier in molecularly imprinted polymer (MIP) sensors for small molecules [16]. |
| Laser-Induced Graphene (LIG) | A 3D porous graphene material with high conductivity and abundant edge defects that enhance electroactivity and electron transfer kinetics [15]. | Fabricating high-sensitivity, flexible electrodes for sensing and energy storage applications [15]. |
| Polypyrrole (PPy) | A conductive polymer used for electropolymerization to create MIP membranes. It offers strong adherence and rapid response [16]. | Creating synthetic recognition cavities for specific molecules in MIP-based sensors [16]. |
| Anti-Influenza agent 3 | Anti-Influenza agent 3, MF:C16H22ClNOS, MW:311.9 g/mol | Chemical Reagent |
| Tiropramide-d5 | Tiropramide-d5, MF:C28H41N3O3, MW:472.7 g/mol | Chemical Reagent |
Engineering Solutions: Material, Design, and Immobilization Strategies for Cleaner Signals
Frequently Asked Questions (FAQs)
Q1: What are the key advantages of using carbon nanostructures in electrochemical biosensors? Carbon nanostructures like graphene, carbon nanotubes (CNTs), and carbon nanofibers offer high electrical conductivity, a large surface area, and good biocompatibility [18]. Their extended sp² hybridized network facilitates rapid electron transfer during redox reactions, which is crucial for enhancing sensor sensitivity and achieving a low limit of detection [18].
Q2: How do Metal-Organic Frameworks (MOFs) improve biosensor performance? MOFs possess a high surface area and tunable porosity [19]. This allows for selective adsorption and release of biomolecules, significantly enhancing the sensitivity and selectivity of the sensor. Their structure can be tailored by changing metal ions and organic linkers to optimize them for specific sensing tasks [19].
Q3: Why are metallic nanoparticles like gold and silver used in biosensors? Metallic nanoparticles provide high catalytic activity and ease of functionalization [18]. Their nano-dimensional size contributes to enhanced synergy and catalytic activity, which allows for improved signal amplification and selectivity. They can also act as carriers for biomolecules, increasing the loading capacity of recognition elements [18].
Q4: What is a common challenge when working with carbon-based materials, and how can it be mitigated? Some carbon materials can be hydrophobic, which may limit their compatibility with biomolecules [18]. This challenge can be addressed through surface modifications and functionalization with specific chemical groups to improve hydrophilicity and biocompatibility [18].
Q5: How can I verify if the signal from my biosensor electrode is functioning correctly? A good practice is to test your electronics independently of the sensor. You can short the reference (RE) and counter (CE) electrodes together, and then short the working electrode (WE) to that connection via a large resistor (e.g., 1 MΩ). Applying a series of bias voltages and measuring the resulting output can help verify if the electronics are producing sensible signals [20].
Troubleshooting Guides
Guide 1: Addressing Poor Electrical Conductivity in Nanomaterial-Based Electrodes
Problem: The modified electrode exhibits insufficient electrical conductivity, leading to a weak or noisy signal.
Possible Causes and Solutions:
- Cause 1: Inadequate Dispersion of Nanomaterials.
Agglomerated nanoparticles or carbon nanotubes can create poor electrical pathways.
- Solution: Implement more rigorous sonication protocols during nanomaterial preparation. Use appropriate surfactants or solvents to improve dispersion stability [21].
- Cause 2: Non-optimized Nanomaterial Loading.
Excessive loading of insulating components (e.g., certain metal oxides or ligands in MOFs) can hinder electron transfer.
- Solution: Titrate the concentration of the nanomaterial in the composite. Refer to established data, such as that for nanodiamond-enhanced fluids, where a 0.0338 volume fraction resulted in a 98-fold increase in conductivity, to find the optimal balance between surface area and conductivity [21].
- Cause 3: Incompatible Surface Chemistry.
The functional groups on the nanomaterial may not facilitate efficient electron transfer to the biorecognition element.
- Solution: Explore different surface modification techniques. For carbon nanotubes, functionalization with groups that improve biocompatibility and electron transfer kinetics is often necessary [18].
Guide 2: Managing Non-Specific Binding and Electrochemical Interferences
Problem: The biosensor shows a high background signal or responds to non-target analytes, reducing its selectivity.
Possible Causes and Solutions:
- Cause 1: Ineffective Electrode Surface Passivation. Uncovered areas of the electrode are susceptible to non-specific adsorption of proteins or other interfering species.
- Cause 2: Interference from Redox-Active Species in the Sample. Molecules like ascorbic acid or uric acid in biological samples can be oxidized at similar potentials as the target analyte.
Guide 3: Ensuring Stability and Reproducibility
Problem: Sensor performance degrades over time or varies between different fabrication batches.
Possible Causes and Solutions:
- Cause 1: Leaching of Biorecognition Elements. Enzymes, antibodies, or DNA may not be stably immobilized on the sensor surface.
- Cause 2: Poor Mechanical Stability of the Nanocomposite Film.
The nanomaterial coating may detach from the transducer surface during operation or washing.
- Solution: Enhance the adhesion between the nanolayer and the electrode. This can be achieved by using linker molecules or employing in-situ synthesis techniques, such as directly growing MOFs on the flexible substrate of a wearable sensor [19].
Table 1: Electrical Conductivity Enhancement from Selected Nano-enhanced Fluids
This table provides a reference for the scale of conductivity improvement achievable with different nanomaterials, which is directly relevant to electrode modification [21].
| Base Fluid | Nanoparticle Type | Observation on Electrical Conductivity | Relevance as a Conductive Fluid |
|---|---|---|---|
| Ethylene Glycol | Nanodiamond (0.0338 vol frac.) | 98 times higher than base fluid | Yes |
| Ethylene Glycol | In₂O₃ (0.0081% at 333.15 K) | 27,300% growth | Yes |
| Ethylene Glycol | Graphene | Enhancement up to 220% | Yes |
| Water | Al₂O₃ (0.2% at 25.9 °C) | Highest value: 2370 µS/cm | Yes |
| Water | Fe₃O₄ | Considerable enhancement with concentration/temperature increase | Yes |
Table 2: Essential Research Reagent Solutions for Nanomaterial-Enhanced Biosensors
This table lists key materials and their functions in developing these advanced biosensors [18] [19] [23].
| Material Category | Example Reagents | Primary Function in Biosensor Development |
|---|---|---|
| Carbon Nanomaterials | Graphene, CNTs, Carbon Black | High surface area conductive support; enhances electron transfer kinetics and biomolecule immobilization. |
| Metal/Metal Oxide NPs | Gold NPs, Platinum NPs, ZnO, Fe₃O₄ | Electrocatalysts for signal amplification; carriers for biomolecules; improve sensitivity and selectivity. |
| MOFs | 2D MOFs (e.g., C-MOF) | Tunable porous structure for selective analyte adsorption; scaffold for creating synergistic composites. |
| Surface Modifiers | Alkane-thiolates (for SAM) | Create a defined interface on electrodes; reduce non-specific binding; allow for bioreceptor attachment. |
| Permselective Membranes | Nafion | Coating to repel charged interfering substances (e.g., ascorbic acid) in complex samples like blood. |
Experimental Protocol: Constructing a Carbon Nanotube/MOF-Modified Biosensor Electrode
Aim: To fabricate a working electrode with enhanced conductivity and surface area for sensitive electrochemical detection of a target biomarker (e.g., glucose).
Materials:
- Glassy Carbon Electrode (GCE)
- Carboxylated Multi-Walled Carbon Nanotubes (MWCNTs)
- Precursors for a specific MOF (e.g., Zn²⺠ions and 2-methylimidazole for ZIF-8)
- Phosphate Buffered Saline (PBS), pH 7.4
- Enzyme (e.g., Glucose Oxidase, GOx)
- Cross-linking agent (e.g., EDC/NHS chemistry)
- Nafion solution (~0.5% in alcohol)
Methodology:
- Preparation of MWCNT Dispersion: Disperse 1 mg of carboxylated MWCNTs in 1 mL of dimethylformamide (DMF) and sonicate for 30-60 minutes to obtain a homogeneous, black dispersion.
- Electrode Pre-treatment: Polish the bare GCE with alumina slurry (0.05 µm) on a microcloth, followed by rinsing with distilled water and drying.
- Modification with MWCNTs: Drop-cast 5 µL of the MWCNT dispersion onto the clean GCE surface and allow it to dry under ambient conditions. This forms a highly conductive base layer.
- In-situ Growth of MOF Layer: Immerse the MWCNT/GCE into an aqueous solution containing the MOF precursors (e.g., 50 mM Zn(NO₃)₂ and 100 mM 2-methylimidazole) for a predetermined time (e.g., 2-4 hours) at room temperature to grow a porous MOF film directly on the nanostructured surface.
- Enzyme Immobilization: Activate the carboxylic groups on the MOF or CNT surface using EDC/NHS. Then, incubate the electrode with a solution of the enzyme (e.g., 10 mg/mL GOx) for several hours to covalently bind the biorecognition element.
- Application of Nafion Membrane: Finally, drop-cast 3 µL of a 0.5% Nafion solution to form a thin protective layer that minimizes fouling and rejects anionic interferents.
Validation: The performance of the modified electrode should be validated using Cyclic Voltammetry (CV) and Electrochemical Impedance Spectroscopy (EIS) in a standard redox probe like [Fe(CN)₆]³â»/â´â». A decrease in electron transfer resistance and an increase in peak current, compared to the bare electrode, indicate successful modification. The biosensing capability is then tested by measuring the amperometric response upon the addition of the target analyte (e.g., glucose) [24] [23].
Workflow and Troubleshooting Diagram
The following diagram outlines a logical workflow for developing and troubleshooting a nanomaterial-based biosensor.
Troubleshooting Guides & FAQs
This technical support center provides solutions for researchers working with advanced biorecognition elements to mitigate electrochemical interferences in biosensor development.
Frequently Encountered Experimental Issues
Q1: My electrochemical biosensor shows high non-specific binding in complex samples like serum, leading to inaccurate readings. How can I improve specificity?
A: High non-specific binding is a common challenge. Implement a dual-recognition system to enhance selectivity.
- Recommended Action: Integrate Molecularly Imprinted Polymers (MIPs) with an aptamer on your sensor platform. The MIP provides robust, shape-complementary cavities, while the aptamer offers high biological affinity. This synergistic combination creates two independent recognition events that must both occur for a signal, drastically reducing false positives from matrix interferents [25] [26].
- Protocol Enhancement: When fabricating the MIP via electropolymerization (e.g., using dopamine as a monomer), ensure thorough template removal by performing multiple cycles of cyclic voltammetry in a suitable washing buffer. Incomplete template removal is a primary cause of high background signal and reduced binding capacity [25].
Q2: The sensitivity of my aptamer-based sensor is lower than expected. What strategies can I use to amplify the signal?
A: Low sensitivity often stems from poor electron transfer kinetics at the electrode interface.
- Recommended Action: Functionalize your electrode with conductive nanomaterials. A highly effective approach is to electrodeposit bimetallic nanoparticles, such as Platinum-Gold Nanoparticles (PtAuNPs), onto a covalent organic framework (COF) modified electrode [25].
- Protocol Enhancement: The COF structure, for example, COFWOTA synthesized from N, N, N', N'-tetrakis(4-aminophenyl)-1, 4-phenylenediamine and 2, 5-dimethoxyterephthalaldehyde, provides a vast surface area and a hierarchical network. The deposited PtAuNPs significantly enhance conductivity and facilitate electron transfer, leading to a lower detection limit and higher signal-to-noise ratio [25].
Q3: The reproducibility of my MIP-based sensor is poor between different production batches. How can I achieve more consistent results?
A: Reproducibility issues in MIPs often arise from inconsistencies during the polymerization process.
- Recommended Action: Strictly control the monomer-to-template ratio, polymerization time, and temperature. Automating the electropolymerization step can minimize operator-induced variability [27].
- Protocol Enhancement: Utilize a standardized protocol with purified reagents. Characterize each batch of MIPs using electrochemical impedance spectroscopy (EIS) to ensure consistent charge-transfer resistance (Rct) values for a control solution before proceeding with target analyte testing [28].
Q4: What is the best way to immobilize an aptamer on a gold electrode surface to ensure optimal binding activity?
A: Proper immobilization is crucial for maintaining aptamer conformation and function.
- Recommended Action: Use a thiolated aptamer to form a self-assembled monolayer on the gold electrode via a stable Au-S bond. This provides a well-oriented and dense surface coverage [25] [27].
- Protocol Enhancement: After immobilization, backfill the electrode with a short-chain mercaptan (e.g., 6-mercapto-1-hexanol) to passivate unreacted gold sites. This step minimizes non-specific adsorption and helps to orient the aptamer for better target accessibility [25].
Performance Data of Advanced Biorecognition Systems
The following table summarizes the analytical performance of state-of-the-art biosensors utilizing dual-recognition elements, demonstrating their superiority in mitigating interference.
Table 1: Performance Metrics of Advanced Biosensors for Specificity and Sensitivity
| Target Analyte | Biorecognition Strategy | Electrode Modification | Linear Range | Detection Limit | Application in Real Samples |
|---|---|---|---|---|---|
| Chlorpyrifos (CPF) [25] | MIP & Aptamer (Dual-recognition) | PtAuNPs/COFWOTA/GCE | 10.0 fM to 1.0 nM | 9.34 fM | Vegetables and fruits (Recovery: 96.67–100.33%) |
| Progesterone [25] | MIP & Aptamer (Dual-recognition) | SnO₂–graphene/AuNPs | 10.0 pM to 10.0 μM | 1.73 fM | Not Specified |
| Gatifloxacin (GTX) [25] | MIP (Single-recognition) | Not Specified | 1.00 × 10â»Â¹â´ to 1.00 × 10â»â· M | 2.61 × 10â»Â¹âµ M | Antibiotic pollutants |
Experimental Protocol: Fabrication of a Dual-Recognition MIP-Aptamer Sensor
This detailed protocol is for constructing an ultrasensitive chlorpyrifos sensor, adaptable for other targets [25].
1. Electrode Modification with Conductive COF and Nanoparticles:
- Synthesize COFWOTA via Schiff base condensation between N, N, N', N'-tetrakis(4-aminophenyl)-1, 4-phenylenediamine and 2, 5-dimethoxyterephthalaldehyde.
- Deposit the COF onto a clean Glassy Carbon Electrode (GCE) surface.
- Electrochemically deposit bimetallic PtAuNPs onto the COF/GCE to form a PtAuNPs/COFWOTA/GCE. This nanocomposite layer enhances the interfacial surface area and electron transport.
2. Aptamer Immobilization:
- Immobilize the terminal amine-modified aptamer onto the PtAuNPs/COFWOTA/GCE via covalent bonding. The PtAuNPs serve as an excellent anchor for the biorecognition element.
3. Molecular Imprinting via Electropolymerization:
- Immerse the Apt/PtAuNPs/COFWOTA/GCE in a solution containing the template molecule (CPF) and the functional monomer (dopamine).
- Perform electropolymerization using cyclic voltammetry to form a polydopamine film embedded with CPF molecules around the aptamer.
- Carefully remove the CPF template molecules from the polymer matrix by cycling in a washing buffer, leaving behind specific complementary cavities.
4. Electrochemical Measurement:
- Perform square wave voltammetry (SWV) or EIS measurements in the presence of the target analyte.
- The binding of CPF to both the MIP cavity and the aptamer causes a measurable change in current or impedance, which is proportional to its concentration.
The workflow for this protocol is summarized in the following diagram:
The Scientist's Toolkit: Essential Research Reagents
Table 2: Key Materials and Their Functions in Advanced Biosensor Development
| Reagent / Material | Function in Experiment | Key Characteristic |
|---|---|---|
| Covalent Organic Frameworks (COFs) [25] | High-surface-area platform for immobilizing receptors and nanomaterials. | Enhanced interfacial surface area, tunable pore dimensions, and predictable functional properties. |
| Platinum-Gold Nanoparticles (PtAuNPs) [25] | Signal amplification; enhances electron transport kinetics and anchors biorecognition elements. | Excellent electrical conductivity and catalytic activity. |
| Thiolated or Amine-Modified Aptamers [25] [27] | High-affinity biological recognition element. | Allows for stable covalent immobilization on electrode surfaces (Au-S bond or amide linkage). |
| Dopamine (Functional Monomer) [25] | Forms the Molecularly Imprinted Polymer (MIP) matrix via electropolymerization. | Forms a robust polymer film (polydopamine) with good adhesion and biocompatibility. |
| Electrochemical Impedance Spectroscopy (EIS) [28] | Label-free transduction method to monitor binding events at the electrode surface. | Sensitive to subtle changes at the electrode-electrolyte interface (e.g., charge-transfer resistance). |
| 2-Deoxy-D-glucose-13C | 2-Deoxy-D-glucose-13C, MF:C6H12O5, MW:165.15 g/mol | Chemical Reagent |
| H-Trp-Phe-Tyr-Ser(PO3H2)-Pro-Arg-pNA | H-Trp-Phe-Tyr-Ser(PO3H2)-Pro-Arg-pNA, MF:C49H59N12O13P, MW:1055.0 g/mol | Chemical Reagent |
This technical support guide addresses the critical challenge of reducing electrochemical interferences in biosensors through the strategic design of three-dimensional (3D) probe immobilization scaffolds. For researchers and scientists in drug development, achieving high capture efficiency of biorecognition probes (such as antibodies, oligonucleotides, or enzymes) is paramount for developing sensitive, specific, and reliable diagnostic devices. This resource provides targeted troubleshooting and methodologies for working with hydrogel, graphene oxide, and porous silica—three key scaffold materials that enhance biosensor performance by increasing probe loading capacity and optimizing signal transduction.
Frequently Asked Questions (FAQs)
1. Why should I use a 3D scaffold instead of a traditional 2D surface for my electrochemical biosensor? 3D scaffolds provide a significantly larger surface area for the immobilization of capture probes compared to flat, two-dimensional (2D) surfaces. This increased area allows for a higher density of biorecognition elements, which directly enhances the binding capacity for target analytes and improves the sensor's sensitivity. The 3D architecture also positively influences electrode reaction kinetics and reduces the diffusion time of analytes to the immobilized probes, leading to faster response times and a lower limit of detection [29]. Furthermore, 3D structures can be engineered from flexible and biocompatible materials, making them superior for implantable biosensor applications [29].
2. How does moving to a 3D scaffold help mitigate electrochemical interferences? The use of 3D scaffolds can contribute to interference mitigation in several ways. Firstly, the high probe-loading capacity can improve the specific signal relative to non-specific background noise. Secondly, conductive 3D materials like graphene can enhance electron transfer efficiency, which is beneficial for signal clarity [30] [31]. More direct strategies include functionalizing the scaffold with selective membranes or using the material's inherent properties. For instance, one innovative approach uses a conductive membrane that can be held at a specific potential to electrochemically deactivate redox-active interferents before they reach the underlying sensor, while allowing the target analyte to pass through unaltered [32].
3. My hydrogel scaffold is mechanically weak. How can I improve its stability? Pure hydrogels can indeed be mechanically weak, which limits their utility. A common and effective strategy is to form composite materials by doping the hydrogel network with reinforcing nanomaterials. For example, incorporating two-dimensional (2D) materials like graphene or its derivatives (graphene oxide, reduced graphene oxide) into the 3D hydrogel network has been shown to significantly improve the composite's mechanical strength and electrical conductivity without sacrificing biocompatibility [30]. This synergy creates a more robust and functional scaffold for biosensing.
4. What is the advantage of using porous silica in a biosensor scaffold? Porous silica is an attractive material due to its tunable pore size, high surface area, and chemical stability. Its well-defined and controllable 3D porous structure provides an excellent platform for immobilizing a large number of probes. Additionally, the silica surface can be readily functionalized with various chemical groups (e.g., silanes) to facilitate the covalent attachment of biorecognition elements, enhancing the stability of the immobilized layer [33] [29].
Troubleshooting Guides
Common Scaffold Preparation and Immobilization Issues
Table 1: Troubleshooting Probe Immobilization on 3D Scaffolds
| Problem | Potential Cause | Solution |
|---|---|---|
| Low Probe Loading | Scaffold pore size is too small for probe diffusion. | Optimize synthesis parameters to create larger, interconnected pores. For silica, use a template to control pore architecture [29]. |
| Poor Signal Output | Inadequate conductivity of the scaffold matrix. | Dope hydrogel with conductive materials like graphene or metal nanoparticles to enhance electron transfer [30] [31]. |
| Non-Specific Binding | Scaffold surface is not sufficiently bio-inert. | Implement blocking agents (e.g., BSA) or modify surface chemistry with antifouling polymers like PEG [24]. |
| Probe Leaching | Weak attachment between probe and scaffold. | Shift from physical adsorption to stronger covalent bonding strategies using cross-linkers like EDC/NHS or glutaraldehyde [29]. |
| Inconsistent Results | Non-uniform scaffold fabrication or uneven probe immobilization. | Use controlled deposition methods like electrodeposition or layer-by-layer assembly to ensure homogeneity [33]. |
Guide 1: Mitigating Electrochemical Interferences
Objective: To minimize the impact of redox-active species in complex samples (e.g., blood, urine) that can cause false positives or elevated background signals.
Workflow: The following diagram illustrates a strategic workflow for integrating interference mitigation into your 3D biosensor design.
Key Strategies:
- Material Selection: Opt for 3D scaffold materials known for their selective electrochemical properties. Graphene-based composites, for instance, offer excellent electrical conductivity that can be tuned for specific sensing applications [30] [31].
- Conductive Membrane Integration: A highly effective method involves encapsulating the sensor with a conductive membrane, such as a gold-coated track-etch membrane. By applying a specific potential to this membrane, redox-active interferents can be electrochemically deactivated before they reach the sensing element. Research has demonstrated this can reduce interference by up to 72% [32].
- Surface Passivation: Ensure that all non-active areas of the biosensor are thoroughly blocked with a passivating agent to minimize non-specific adsorption of interfering compounds.
Guide 2: Optimizing Capture Probe Density
Objective: To maximize the number of active biorecognition probes immobilized within the 3D scaffold, thereby enhancing the sensor's sensitivity.
Workflow: A multi-faceted approach is required to maximize the density and activity of your capture probes.
Methodology:
- Scaffold Characterization: Begin by quantifying the specific surface area and pore size distribution of your scaffold material using techniques like BET analysis. This data is crucial for understanding its theoretical loading capacity.
- Surface Functionalization:
- Graphene Oxide: Rich in oxygen-containing groups (carboxyl, epoxy) that can be activated with EDC/NHS chemistry for covalent coupling to amine-containing probes [30] [31].
- Porous Silica: Silanol groups allow for functionalization with silane coupling agents (e.g., APTES) to introduce amine, thiol, or other functional groups for subsequent probe attachment [29].
- Hydrogel: Functional monomers (e.g., with carboxyl groups) can be incorporated during polymerization. Alternatively, hydrogels can be doped with functionalized nanomaterials like graphene oxide to provide anchor points for probes [30] [34].
- Validation: Use fluorescently labeled probes to visually confirm uniform distribution within the 3D matrix. Quantify immobilization efficiency by measuring probe concentration in solution before and after immobilization (e.g., via UV-Vis spectroscopy).
Experimental Protocols
Protocol 1: Fabrication of a 3D Graphene Oxide-Hydrogel Composite Scaffold
This protocol outlines the synthesis of a hybrid scaffold that combines the high water content and biocompatibility of a hydrogel with the enhanced electrical conductivity and mechanical strength of graphene oxide [30] [34].
Materials:
- Graphene oxide (GO) aqueous dispersion
- Pyrrole monomer
- Cross-linker (e.g., poly(ethylene glycol) diacrylate)
- Initiator system (e.g., Ammonium persulfate (APS) and Tetramethylethylenediamine (TEMED))
- Phosphate Buffered Saline (PBS), pH 7.4
Step-by-Step Method:
- Hydrogel Pre-Mixture: Prepare your standard hydrogel monomer solution (e.g., based on acrylamide or alginate) in PBS.
- GO Incorporation: Add a calculated volume of GO dispersion (e.g., 1 mg/mL) to the hydrogel pre-mixture and vortex thoroughly to achieve a homogeneous blend.
- Gelation: Add the cross-linker and initiator to the GO-hydrogel mixture according to your established hydrogel protocol. Pipette the solution onto your electrode surface and allow it to polymerize under controlled conditions (e.g., 37°C for 30 minutes).
- Post-Assembly (Optional): For enhanced conductivity, the composite can be subjected to a mild chemical or thermal reduction step to convert graphene oxide to reduced graphene oxide (rGO) within the hydrogel network [34].
- Equilibration: Rinse the polymerized scaffold with PBS to remove any unreacted reagents and to hydrate it fully before probe immobilization.
Protocol 2: Probe Immobilization via Covalent Coupling
This is a general protocol for covalently attaching amine-containing probes (e.g., antibodies, amino-modified DNA) to a carboxyl-functionalized scaffold (such as GO-hydrogel or functionalized porous silica).
Materials:
- Carboxylated 3D scaffold on electrode
- Capture probe (antibody, DNA, etc.)
- EDC (1-Ethyl-3-(3-dimethylaminopropyl)carbodiimide) and NHS (N-Hydroxysuccinimide)
- MES buffer (0.1 M, pH 5.5) and PBS buffer (0.1 M, pH 7.4)
Step-by-Step Method:
- Activation: Prepare a fresh solution of EDC (e.g., 40 mM) and NHS (e.g., 10 mM) in MES buffer. Incubate the scaffold with the activation solution for 30-60 minutes at room temperature with gentle shaking to convert the carboxyl groups to NHS esters.
- Rinsing: Thoroughly rinse the scaffold with MES buffer to remove excess EDC/NHS.
- Immobilization: Immediately incubate the activated scaffold with a solution of your capture probe (typically 10-100 µg/mL in PBS, pH 7.4) for 2-4 hours at room temperature or overnight at 4°C.
- Quenching and Blocking: Rinse the scaffold with PBS to remove physically adsorbed probes. Incubate with a blocking solution (e.g., 1% BSA in PBS) for at least 1 hour to deactivate any remaining active esters and to block non-specific binding sites.
- Storage: The functionalized biosensor can be stored in PBS at 4°C until use.
The Scientist's Toolkit: Research Reagent Solutions
Table 2: Essential Materials for 3D Probe Immobilization
| Reagent / Material | Function in Experiment | Example from Literature |
|---|---|---|
| Graphene Oxide (GO) | Provides a high-surface-area 2D nanomaterial with functional groups for covalent probe attachment; enhances conductivity when reduced [30] [31]. | Used in a 3D porous rGO-PPy composite to immobilize B. subtilis via coordination and electrostatic interactions for a BOD biosensor [34]. |
| EDC / NHS Cross-linker | Activates carboxyl groups on the scaffold surface, enabling stable covalent bond formation with amine-containing probes [29]. | A standard chemistry for creating amide bonds to immobilize antibodies and enzymes on functionalized surfaces. |
| Polyvinyl Alcohol (PVA) / Alginate | Forms biocompatible hydrogel matrices that can entrap probes and cells; allows for diffusion of analytes and substrates [29]. | Common hydrogel materials used for immobilizing microorganisms and biomolecules in biosensors. |
| (3-Aminopropyl)triethoxysilane (APTES) | Functionalizes silica and metal oxide surfaces with primary amine groups, creating a linker layer for probe conjugation [29]. | Used to modify porous silica and other metal oxides to facilitate the covalent attachment of biomolecules. |
| Gold Nanoparticles (AuNPs) | Used in electrodeposition to create 3D nano-structured surfaces on electrodes; increases conductive surface area for probe immobilization [33]. | Electrodeposited on 3D scaffolds to enhance electrical conductivity and provide a platform for thiol-based probe immobilization. |
| Ferricyanide Mediator | Serves as an artificial electron acceptor in mediated biosensors, shuttling electrons from biochemical reactions to the electrode surface [32] [34]. | Used in a mediated BOD biosensor with immobilized B. subtilis to facilitate electrochemical detection [34]. |
| Nlrp3-IN-4 | NLRP3-IN-4|Potent NLRP3 Inflammasome Inhibitor | |
| Bace1-IN-12 | Bace1-IN-12, MF:C29H28Cl2N6O, MW:547.5 g/mol | Chemical Reagent |
Table 3: Performance Comparison of 3D Scaffold Materials
| Scaffold Material | Key Advantage | Demonstrated Performance Metric | Consideration for Interference Reduction |
|---|---|---|---|
| Hydrogel-Graphene Composite | High biocompatibility & enhanced conductivity | 72% reduction in redox interference with conductive membrane [32]. | Can be integrated with conductive membranes; doping with graphene improves electrical signal quality. |
| 3D Porous Graphene-Polypyrrole | Large surface area & tunable surface chemistry | Linear BOD detection range of 4-60 mg/L [34]. | Inherent conductivity allows for potential strategies to selectively bias the scaffold. |
| Porous Silica | High mechanical stability & well-defined porosity | Excellent platform for high-density probe loading [29]. | Non-conductive nature may require incorporation of conductive elements for electrochemical sensing. |
| Metal Nanoparticle Coatings | Significant increase in electroactive surface area | Enables ultra-sensitive detection; improves signal-to-noise ratio [33]. | The metal surface itself must be chosen and potentially protected to avoid non-specific adsorption. |
Microfluidic biosensors represent a powerful synergy of microfluidic technology and biosensing elements, creating miniaturized "lab-on-a-chip" systems that automate the entire process from sample input to analytical result [35]. This system-level integration is pivotal for automating sample processing and, crucially, for reducing interferences in electrochemical biosensing. By enabling precise fluid control at microscopic scales (handling volumes from 10â»â¹ to 10â»Â¹â¸ liters), microfluidic systems mitigate key challenges such as fouling, non-specific binding, and diffusion limitations that traditionally plague electrochemical detection in complex matrices [36] [37]. The inherent characteristics of microfluidics—including laminar flow, high surface-to-volume ratios, and rapid heat transfer—directly enhance biosensor performance by improving reaction yields, conversion efficiencies, and signal-to-noise ratios [35]. For researchers focused on minimizing electrochemical interferences, the controlled microenvironment within microfluidic channels provides an unparalleled platform for implementing sophisticated interference-filtering strategies directly within the analytical workflow.
Technical Support Center: FAQs and Troubleshooting
Frequently Asked Questions (FAQs)
Q1: How does microfluidic integration specifically reduce interferences in electrochemical biosensors? Microfluidics reduces interferences through several integrated mechanisms. First, the precise spatial and temporal control over fluids allows for on-chip sample preparation steps like separation, purification, and washing, which can isolate the analyte from interferents before it reaches the detection chamber [35]. Second, the laminar flow regime (low Reynolds number) dominant at the microscale enables predictable fluid behavior, allowing for the design of channels that strategically remove interfering substances via diffusion-based sorting or by creating chemical gradients [35]. Third, integration facilitates miniaturized detection volumes, which localize the electrochemical reaction, confine the diffusion of redox species, and thereby enhance the signal relative to background noise [37].
Q2: What are the key considerations when selecting a material for my microfluidic biosensor? The choice of material is critical and involves trade-offs between performance, fabrication complexity, and cost, especially for electrochemical applications. The following table summarizes the key characteristics of common materials:
Table: Key Materials for Microfluidic Chip Fabrication
| Material | Advantages | Disadvantages | Best for Electrochemical Sensing? |
|---|---|---|---|
| PDMS (Elastomer) | High optical clarity, gas permeability for cells, easy prototyping [35] | Hydrophobic, prone to analyte absorption, can leach uncured oligomers [38] | Caution advised; surface modification often needed to prevent interference [38] |
| Glass | Excellent optical properties, high chemical resistance, rigid, low intrinsic fluorescence [39] [35] | Brittle, higher cost, complex and hazardous fabrication (e.g., HF etching) [39] | Excellent, due to inertness and established surface chemistry [39] |
| PMMA (Thermoplastic) | Good optical clarity, low cost, amenable to mass production [39] | Susceptible to organic solvents, lower chemical resistance [39] | Good, with proper surface passivation to minimize non-specific binding |
| Paper | Very low cost, self-pumping via capillarity, disposable [39] [40] | Lower sensitivity, susceptible to evaporation, limited flow control [39] | Promising for low-cost, single-use POC sensors; may have higher background [39] |
| Silicon | High thermal conductivity, excellent fabrication precision [35] | Opaque, high cost, complex fabrication [35] | Limited; opacity hinders some detection methods, but can be used with embedded electrodes |
Q3: My electrochemical signal is unstable. Could this be related to fluidic flow in the chip? Yes, unstable flow is a common culprit. To diagnose and resolve this:
- Check for Bubbles: Bubbles are a major cause of signal noise and drop-out. Degas your buffers before use and ensure all fluidic connections are tight. Incorporating bubble traps into your chip design can be highly effective.
- Verify Pump Performance: Ensure your syringe or peristaltic pump is calibrated and functioning correctly. pulsations from the pump can cause regular signal fluctuations. Dampeners can help smooth the flow.
- Inspect Channel Integrity: Clogs or damaged channels can create turbulent flow and backpressure, leading to signal drift. Flush the system with a cleaning solution and inspect under a microscope.
Q4: What are the best practices for immobilizing biorecognition elements (e.g., aptamers, antibodies) inside a microchannel to ensure stability and minimize non-specific binding? Effective immobilization is key to sensor stability and selectivity.
- Surface Activation: For glass, PDMS, or PMMA, use an oxygen plasma treatment to create hydroxyl groups, followed by silane chemistry (e.g., (3-Aminopropyl)triethoxysilane, APTES) to create a functional linker layer [37].
- Covalent Binding: Immobilize your biorecognition elements (antibodies, aptamers) via covalent bonds to the linker layer. For example, use EDC/NHS chemistry to crosslink amino-modified aptamers to an APTES-functionalized surface [37]. This prevents leakage and ensures a stable, dense receptor layer.
- Surface Passivation: After immobilizing your capture probe, passivate the remaining surface area with an inert protein (e.g., Bovine Serum Albumin - BSA) or a commercial blocking solution (e.g., SuperBlock). This is a critical step to minimize non-specific adsorption of interferents, a major source of false positives and background noise [37].
Troubleshooting Guide
Table: Common Experimental Issues and Solutions
| Problem | Potential Causes | Diagnostic Steps | Solutions |
|---|---|---|---|
| High Background Noise (Electrochemical) | 1. Non-specific binding of sample matrix components.2. Adsorption of redox mediators or reaction products.3. Electronic interference from pumping system. | 1. Run a negative control (sample without analyte).2. Test with buffer alone.3. Check signal with pump temporarily off. | 1. Optimize surface passivation protocol (e.g., use different blocking agents).2. Increase stringency of wash steps (e.g., more volumes, add mild detergent).3. Use electrical shielding and ground the system properly [41]. |
| Signal Drift Over Time | 1. Fouling of the electrode or channel surface.2. Evaporation from reservoirs (especially in open systems).3. Gradual degradation of the immobilized biorecognition element. | 1. Inspect electrode surface microscopically.2. Measure fluid volume in waste reservoir.3. Test a freshly prepared chip. | 1. Incorporate a periodic, gentle cleaning cycle (e.g., low-pH buffer).2. Seal reservoirs or use oil overlays to prevent evaporation.3. Ensure stable storage conditions (e.g., buffer, temperature) for chips. |
| Poor Reproducibility Between Chips/Runs | 1. Inconsistent surface chemistry/immobilization.2. Manufacturing variability in channel dimensions.3. Inaccurate fluidic control (flow rate variations). | 1. Use a fluorescent tag to quantify immobilization density.2. Measure channel dimensions under a microscope.3. Calibrate pumps and check for leaks. | 1. Standardize and rigorously control the immobilization protocol (time, temperature, concentration).2. Move to a more reproducible fabrication method (e.g., injection molding over soft lithography).3. Use high-precision pumps and verify flow rates regularly. |
| Low Sensitivity / Signal | 1. Inefficient transport of analyte to the sensor surface.2. Loss of bio-recognition element activity.3. Channel clogging. | 1. Measure analyte concentration in waste vs. input.2. Test the activity of the bio-recognition element in solution.3. Visually inspect channels for clogs. | 1. Use mixing structures (e.g., serpentine channels, herringbone mixers) to enhance mass transport [38].2. Optimize immobilization chemistry to preserve activity; avoid harsh conditions.3. Pre-filter complex samples and use channels with appropriate dimensions. |
Essential Experimental Protocols
Protocol: Fabrication of a PDMS Microfluidic Chip with Integrated Electrodes via Soft Lithography
This protocol outlines the creation of a reusable microfluidic chip suitable for integrating screen-printed or thin-film electrodes.
1. Master Mold Creation:
- Design: Create your channel network design (typically a single inlet, serpentine mixing/detection channel, and outlet) using CAD software. Feature widths should be >50 µm for ease of fabrication and to reduce clogging [42].
- Printing: Print the design as a high-resolution transparency mask.
- Alternative (Low-Cost): As demonstrated in recent work, a positive master can be created by laser-engraving a self-adhesive paper sheet (e.g., ~900 µm thick) and affixing it to a glass slide [42].
- Traditional (SU-8): Spin-coat a silicon wafer with SU-8 photoresist, expose through the mask, and develop to create a relief pattern.
2. PDMS Molding and Bonding:
- Preparation: Mix PDMS base and curing agent thoroughly at a 10:1 ratio. Degas the mixture in a vacuum desiccator until all bubbles are removed.
- Molding: Pour the degassed PDMS over the master mold. Cure in an oven at 55-65°C for at least 1-2 hours [42].
- Peeling and Punching: Carefully peel the cured PDMS slab from the mold. Use a blunt biopsy punch to create inlet and outlet ports.
- Bonding: Clean a glass slide (which can have pre-patterned electrodes) and the PDMS slab with oxygen plasma. Bring the activated surfaces into immediate contact to form an irreversible seal [35].
Protocol: Immobilization of Aptamer Probes for Electrochemical Detection
This protocol details the functionalization of a gold working electrode integrated within a microfluidic channel for an aptamer-based sensor, a common strategy for sepsis or mycotoxin detection [43].
1. Surface Cleaning and Activation:
- Flush the channel with ethanol and deionized water, then with a piranha solution (3:1 Hâ‚‚SOâ‚„:Hâ‚‚Oâ‚‚) CAUTION: Piranha is extremely corrosive and must be handled with extreme care. Rinse extensively with water.
- Alternatively, electrochemically clean the gold electrode by performing cyclic voltammetry (e.g., from -0.2 to +1.5 V) in 0.5 M Hâ‚‚SOâ‚„ until a stable voltammogram is achieved.
2. Aptamer Immobilization:
- Prepare a 1-5 µM solution of thiol-modified DNA aptamer in immobilization buffer (e.g., 10 mM Tris, 1 mM EDTA, 0.1 M NaCl, pH 7.4).
- Introduce the aptamer solution into the microfluidic channel and incubate for 12-16 hours at room temperature. This allows the thiol group to form a stable Au-S bond.
- Rinse the channel with buffer to remove unbound aptamers.
3. Passivation:
- To passivate the remaining gold surface and minimize non-specific binding, flush the channel with a 1-6 mM solution of 6-mercapto-1-hexanol (MCH) for 30-60 minutes. This step is critical for reducing background interference and improving the stability of the aptamer monolayer [43].
- Rinse thoroughly with the assay buffer.
4. Validation:
- The modified electrode can be validated electrochemically using techniques like Electrochemical Impedance Spectroscopy (EIS) or cyclic voltammetry in a solution containing a redox probe like [Fe(CN)₆]³â»/â´â». Successful immobilization and passivation will show a characteristic increase in charge transfer resistance (Râ‚).
The Scientist's Toolkit: Essential Research Reagents and Materials
Table: Key Reagent Solutions for Microfluidic Biosensor Development
| Reagent/Material | Function/Application | Key Considerations |
|---|---|---|
| Polydimethylsiloxane (PDMS) | Elastomer for rapid prototyping of microfluidic chips via soft lithography [35]. | Prone to absorbing small molecules; requires surface modification for many applications. |
| (3-Aminopropyl)triethoxysilane (APTES) | Silane coupling agent; used to create an amine-functionalized surface on glass or PDMS for subsequent biomolecule immobilization [37]. | Must be used under anhydrous conditions for reproducible results. |
| EDC/NHS Chemistry | Crosslinkers for activating carboxyl groups to form amide bonds with primary amines; used for covalent immobilization of proteins/peptides [37]. | Solutions are unstable in water; must be prepared fresh. |
| Bovine Serum Albumin (BSA) | A common blocking agent used to passivate surfaces and minimize non-specific binding of interferents [37]. | Can be used at 1-5% w/v in buffer. Alternative blockers (e.g., casein, SuperBlock) may offer better performance for specific samples. |
| 6-Mercapto-1-hexanol (MCH) | A short-chain alkanethiol used to create a well-ordered, passivating monolayer on gold surfaces, crucial for optimizing the conformation and accessibility of thiol-modified aptamers [43]. | Helps displace non-specifically adsorbed aptamers and creates a hydrophilic surface that resists fouling. |
| Redox Probes (e.g., [Fe(CN)₆]³â»/â´â») | Used to characterize electrode surface modifications and performance via cyclic voltammetry or EIS. | A significant change in peak current or charge transfer resistance after each modification step confirms successful surface engineering. |
| Topoisomerase IV inhibitor 2 | Topoisomerase IV inhibitor 2, MF:C33H30FN7O6S, MW:671.7 g/mol | Chemical Reagent |
| Crk12-IN-2 | Crk12-IN-2, MF:C23H33F2N5O3S2, MW:529.7 g/mol | Chemical Reagent |
Workflow and System Diagrams
Microfluidic Biosensor Workflow
Interference Reduction Mechanisms
Beyond Basics: AI, Multi-Mode Sensing, and Advanced Anti-Fouling for Optimal Performance
Technical Troubleshooting Guides
Guide 1: Troubleshooting Poor Model Generalization to New Biosensor Data
Problem: Your machine learning model, trained to predict analyte concentration from electrochemical signals, performs well on training data but poorly on new experimental batches or unseen sample types. This is often caused by overfitting to spurious shortcuts in the training data rather than learning the genuine electrochemical artifacts [44].
Investigation & Solutions:
- Check for Data Diversity: Audit your training dataset. Does it encompass the full expected range of experimental variables (e.g., pH, temperature, interferent concentrations, electrode fouling levels)? Models trained on narrow, "clean" lab data often fail in real-world conditions [45]. Incorporate data from multiple sensor fabrication batches and different operating conditions.
- Implement Feature-Space Noise Injection: To force the model to learn more robust features, introduce structured noise during training. Techniques like Positive-incentive Noise (PiN) can be applied. PiN involves jointly training a noise generator with your detection model to create feature-space perturbations that suppress shortcut-sensitive directions while amplifying stable, causal forensic cues in the data [44].
- Validate with Out-of-Distribution Data: Always hold out a portion of your data from a completely different experimental run (different day, new buffer solution, new sensor chip) for validation. This provides a more realistic estimate of real-world performance than a random train-test split [44].
Recommended Experimental Protocol:
- Objective: Train a robust model for glucose concentration prediction resistant to signal drift.
- Procedure:
- Collect a large dataset from multiple biosensor electrodes over several days, intentionally varying buffer pH (±0.5), temperature (±2°C), and introducing common interferents like ascorbic acid at low concentrations.
- Partition data by experimental batch, not randomly.
- Implement a PiN-CLIP or similar noise injection framework during model training.
- Validate the final model on a entirely new batch of sensors fabricated a week later.
- Expected Outcome: Model performance on the held-out batch should show less than 10% degradation in RMSE compared to the training set performance.
Guide 2: Mitigating Redox-Active Interference in Complex Samples
Problem: Your electrochemical biosensor gives inaccurate readings in complex biological samples (e.g., blood, serum) due to signal interference from other electroactive species.
Investigation & Solutions:
- Hardware Solution - Conductive Membrane: Employ a conductive membrane encapsulation strategy. This involves placing layers of a gold-coated track-etch membrane over the sensor surface. By applying a specific potential to this membrane, redox-active interferents can be electrochemically deactivated before they reach the sensor, while the target analyte passes through unaltered. This method has been shown to reduce redox-active interference by up to 72% [32].
- Software Solution - ML-based Signal Disentanglement: If hardware modification is not feasible, use machine learning to "unscramble" the signal. Train a model (e.g., a regression model) on data collected from samples containing known concentrations of both the target analyte and common interferents. The model can learn to isolate the signal contribution of the target analyte [45].
Recommended Experimental Protocol:
- Objective: Reduce ascorbic acid interference in a glucose oxidase-based biosensor.
- Procedure (Hardware Approach):
- Fabricate your standard glucose sensor.
- Encapsulate the sensor surface with three layers of gold-coated track-etch membrane.
- Apply a optimized potential to the membrane to oxidize ascorbic acid before it reaches the underlying working electrode.
- Calibrate the sensor in buffer and then test in serum samples with and without the membrane.
- Expected Outcome: An 8-fold decrease in detection limit and a significant reduction in signal offset in the presence of ascorbic acid [32].
Guide 3: Correcting for Noisy or Erroneous Sensor-Generated Data
Problem: Biosensor data streams, especially from continuous monitoring or high-throughput systems, are contaminated with noise, dropouts, or physiologically implausible values.
Investigation & Solutions:
- Predictive Noise Correction Pipeline: Implement a multi-stage predictive correction methodology. This involves:
- Identify and Flag: Define ranges for valid readings. Flag values outside these ranges as "erroneous" and treat them as missing.
- Feature Selection: Use an algorithm like ReliefF to identify the most relevant sensor parameters and other contextual features that correlate with the erroneous reading.
- Predict and Replace: Build a Random Forest classifier or regressor to predict the most likely true value for the missing entry based on the selected features and the context of other sensor readings.
- Insert and Proceed: Replace the erroneous value with the predicted one [46].
- Leverage Ensemble Models: For direct signal prediction, use stacked ensemble models that combine multiple algorithms (e.g., Gaussian Process Regression, XGBoost, Artificial Neural Networks). These have been shown to achieve superior prediction stability and lower error (e.g., RMSE of 0.143) compared to individual models [47].
Recommended Experimental Protocol:
- Objective: Clean a noisy dataset from a high-throughput biosensing platform.
- Procedure:
- Manually curate a subset of data to establish valid value ranges for each parameter.
- Automatically flag invalid entries in the full dataset.
- Use the ReliefF algorithm to rank feature importance for predicting a target parameter.
- Train a Random Forest model on the clean data to predict the target parameter.
- Use this model to predict and replace all flagged values for that parameter.
- Iterate for all noisy parameters.
- Expected Outcome: A reconstructed dataset suitable for accurate machine learning and knowledge discovery, with noise significantly reduced [46].
Frequently Asked Questions (FAQs)
Q1: What are the most influential features to include when building an ML model for biosensor optimization?
A: Based on comprehensive model interpretation studies using SHAP and permutation analysis, the most influential parameters for predicting biosensor response are typically:
- Enzyme amount
- pH of the measurement environment
- Analyte concentration
- Glutaraldehyde concentration (a common crosslinker) [47] These four factors can account for more than 60% of the predictive variance in the model. You should prioritize the accurate measurement and systematic variation of these parameters in your experiments [47].
Q2: My data is limited. How can I possibly train a robust machine learning model?
A: Limited data is a common challenge. You can employ several strategies:
- Data Augmentation: Artificially expand your dataset by applying realistic transformations to your existing data, such as adding small random noise, simulating baseline drift, or applying scaling to mimic concentration changes [48].
- Leverage Pre-trained Models: Use models pre-trained on large public electrochemical datasets and fine-tune them on your specific, smaller dataset. This transfer learning approach can significantly reduce the amount of data you need [44].
- Synthetic Data Generation: For advanced users, Generative AI methods can be used to create realistic synthetic biosensor data that follows the same statistical patterns as your real data, though this requires careful validation [48].
Q3: What machine learning model should I start with for analyzing my biosensor data?
A: For regression tasks (e.g., predicting concentration), a systematic evaluation of 26 models suggests starting with tree-based models like Decision Tree Regressors or XGBoost. They provide an excellent balance of high accuracy (achieving near-perfect R² = 1.00 in some studies), computational efficiency, and interpretability [47]. For classification tasks (e.g., real vs. synthetic signal), Convolutional Neural Networks (CNNs) or vision-transformer based models adapted for signal processing are a powerful choice [44].
Q4: How can AI help with the actual design of the biosensor, not just the data?
A: AI operates at multiple levels of biosensor design:
- Biorecognition Element Design: AI can predict the 3D structure of proteins and nucleic acids, helping to engineer enzymes with higher stability or select optimal aptamer sequences for a target analyte [49].
- Material Optimization: ML models can predict the performance of different nanomaterial composites (e.g., graphene, MXenes) based on their properties, guiding the selection of the most effective sensing interface [50] [49].
- Experimental Parameter Tuning: AI-driven optimization algorithms can efficiently navigate the complex parameter space (e.g., polymer scan number, crosslinker ratio) to find the optimal fabrication conditions with fewer experiments [47].
Table 1: Performance Comparison of Machine Learning Models for Biosensor Signal Prediction
| Model Category | Example Algorithms | Best RMSE Achieved | R² | Key Advantages |
|---|---|---|---|---|
| Tree-Based | Decision Tree, XGBoost, Random Forest | 0.1465 [47] | 1.00 [47] | High accuracy, good interpretability, hardware efficient |
| Kernel-Based | Support Vector Regression (SVR) | Varies (Higher) [47] | Varies [47] | Effective for non-linear relationships |
| Gaussian Process | Gaussian Process Regression (GPR) | 0.1465 [47] | 1.00 [47] | Provides uncertainty estimates |
| Artificial Neural Networks | Wide Neural Networks, Multilayer Perceptrons | 0.1465 [47] | 1.00 [47] | Can model highly complex, non-linear data |
| Stacked Ensemble | Combining GPR, XGBoost, and ANN | 0.143 [47] | ~1.00 [47] | Best overall performance and stability |
Table 2: Key Experimental Parameters and Their Impact on Biosensor Response
| Parameter | Function in Biosensor Fabrication | Relative Influence (from SHAP Analysis) | Optimization Insight |
|---|---|---|---|
| Enzyme Amount | Biological recognition element; catalyzes reaction with analyte. | High [47] | Critical for sensitivity; has a non-linear optimal point. |
| pH | Affects enzyme activity and stability of immobilization. | High [47] | Has a narrow optimal window; must be tightly controlled. |
| Analyte Concentration | The target molecule being measured. | High [47] | Primary variable for calibration curves. |
| Glutaraldehyde Concentration | Crosslinking agent for immobilizing biomolecules. | Medium [47] | Can often be minimized to reduce cost without sacrificing performance. |
| Conducting Polymer Scan Number | Influences polymer film thickness and conductivity. | Lower [47] | Important for signal transduction but less critical than top parameters. |
Workflow & System Diagrams
AI-Enhanced Biosensor Data Processing
Conductive Membrane Interference Mitigation
The Scientist's Toolkit: Research Reagent Solutions
Table 3: Essential Materials for Advanced Electrochemical Biosensing
| Material / Reagent | Primary Function & Rationale | Key References |
|---|---|---|
| Graphene-based Nanomaterials (e.g., Graphene Oxide, rGO) | Provides high electrical conductivity and large surface area for enhanced signal transduction and biomolecule immobilization. [31] | [31] |
| Gold-coated Track-Etch Membranes | Serves as a conductive physical barrier to selectively deactivate redox-active interferents via an applied potential. [32] | [32] |
| Enzymes (e.g., Glucose Oxidase) | Acts as a catalysis-based biorecognition element; provides high specificity for the target analyte. [51] | [51] |
| Glutaraldehyde | A common crosslinker for covalently immobilizing biomolecules (e.g., enzymes) onto the sensor surface. [47] | [47] |
| Artificial Recognition Elements (e.g., Aptamers, MIPs) | Synthetic receptors offering an alternative to antibodies; can provide superior stability and customizability. [51] | [51] |
| Asic-IN-1 | Asic-IN-1, MF:C23H25N3O2, MW:375.5 g/mol | Chemical Reagent |
Your Technical Support Center
This resource provides targeted troubleshooting guides and FAQs for scientists developing multi-modal biosensors, with a specific focus on mitigating electrochemical interferences.
Frequently Asked Questions (FAQs)
1. How does a triple-mode biosensor improve detection accuracy? A triple-mode biosensor utilizes three independent sensing strategies (e.g., colorimetric, fluorescent, and electrochemical) to cross-validate results [52] [53]. This multi-modal approach effectively minimizes false positives and false negatives, which are common pitfalls in single-mode detection systems. If one signal mode is compromised by interference, the other two can provide confirmation, leading to more dependable biosensing conclusions [53] [54].
2. Can the experimental protocol for a commercial assay kit be modified for multi-modal detection? Yes, assay protocols can be very robust. Modifications to sample volume, incubation times, or the use of various sequential schemes can lead to significant changes in sensitivity and help reduce non-specific sample matrix effects. However, any changes must be thoroughly qualified to ensure they achieve acceptable accuracy, specificity, and precision for your specific analytical needs [55].
3. What are the primary sources of electrochemical interference in complex samples? Biological samples contain electroactive species (e.g., ascorbic acid, uric acid, acetaminophen) that can be oxidized or reduced at the electrode surface, generating a current that is indistinguishable from the signal generated by the enzymatic reaction product (e.g., Hâ‚‚Oâ‚‚). This leads to inaccuracies in concentration measurements [56].
4. What strategies can eliminate electrochemical interferences? Several methods have been developed to improve selectivity [56]:
- Permselective Membranes: Coating the electrode with membranes (e.g., Nafion) that repel interfering anions or cations based on their charge.
- Use of Electron Mediators: Incorporating a redox mediator to shuttle electrons from the enzyme to the electrode at a lower working potential, where interferents are not electroactive.
- Pre-oxidizing Electrodes: Applying a potential to pre-oxidize interferents before the actual measurement.
- Direct Electron Transfer: Designing systems where the enzyme directly transfers electrons to the electrode, circumventing the need for reaction products that interferents affect.
Troubleshooting Guides
Issue 1: High Background Signal in One Detection Mode
This problem often manifests as a consistently high signal in the negative control, reducing the assay's signal-to-noise ratio and dynamic range.
- Potential Causes and Solutions:
- Cause: Non-specific cleavage or binding. In CRISPR-based systems, ensure the crRNA is highly specific and that the Cas protein (e.g., Cas12a) is not partially activated.
- Solution: Re-blast the crRNA sequence and optimize its concentration. Include additional negative controls with single-base mismatched targets.
- Cause: Incomplete washing of signal probes. For systems using immobilized probes like MNPs-ssDNA-HRP, residual unbound probes can cause background [53].
- Solution: Increase the number of wash steps after probe immobilization and after the CRISPR cleavage reaction. Use magnetic separation thoroughly between steps.
- Cause: Cross-talk between detection chemistries. The reagents for one mode (e.g., the TMB substrate for colorimetry) might be slightly active in another mode (e.g., producing a weak electrochemical response).
- Solution: Physically separate the detection steps if possible. For homogeneous assays, ensure reaction terminators are used (e.g., Hâ‚‚SOâ‚„ to stop the TMB reaction) [53] before reading the next signal.
Issue 2: Inconsistent Results Between Different Modes
A sample tests positive in one mode but negative or weak in another, undermining the cross-validation principle.
- Potential Causes and Solutions:
- Cause: Different sensitivity limits for each mode. The limit of detection (LOD) can vary between the colorimetric, fluorescent, and electrochemical systems.
- Solution: Perform a calibration curve for each mode independently using the same set of standard samples. Establish the linear range and LOD for each to set appropriate cut-off values. Refer to the performance data in the table below for expected ranges.
- Cause: Signal quenching or enhancement from sample matrix. Components in the sample (e.g., from serum, saliva, or food samples) can quench fluorescence or foul the electrode surface [52] [54].
- Solution: Dilute the sample to a Minimum Required Dilution (MRD) that minimizes matrix effects. Use spike-and-recovery experiments to confirm that the analyte can be accurately measured in your specific sample matrix [55].
- Cause: Incorrect signal readout order or timing. Some signals are transient (e.g., certain fluorescent products), while others are stable (e.g., stopped colorimetric reactions).
- Solution: Establish and strictly adhere to a standardized readout sequence with defined timings for each measurement.
Issue 3: Poor Signal in Electrochemical Mode Amidst Strong Colorimetric/Fluorescent Signals
This indicates a specific failure at the electrode interface, often related to interferences or fouling.
- Potential Causes and Solutions:
- Cause: Electrode fouling by proteins or other macromolecules. This creates a barrier, impeding electron transfer and reducing sensitivity [56].
- Solution: Use a permselective membrane like Nafion to block larger molecules. Implement regular electrode cleaning and polishing protocols. Consider using disposable screen-printed electrodes.
- Cause: Interference from electroactive species in the sample. This is a classic challenge in complex matrices like blood or food [56].
- Solution: Employ the interference elimination strategies listed in FAQ #4. Using a mediator-based system to lower the working potential is often the most effective approach.
- Cause: Inefficient electron transfer in a homogeneous system. In immobilization-free electrochemical biosensors, the diffusion of the electroactive tag (e.g., Methylene Blue) to the electrode surface may be hindered.
- Solution: Optimize the concentration of the redox reporter and the duration of the incubation step before electrochemical reading [54].
Performance Data for Triple-Mode Biosensors
The following table summarizes key performance metrics from recent advanced triple-mode biosensing platforms, providing benchmarks for your own system development.
| Biosensor Platform / Target | Detection Modes | Limit of Detection (LOD) | Dynamic Range | Key Application |
|---|---|---|---|---|
| CPF-CRISPR [53](Target: MRSA mecA gene) | Colorimetric, Photothermal*, Fluorescent | 10¹ CFU/mL (Fluorescent) | Not explicitly stated | Detection of drug-resistant bacteria in clinical samples |
| HELEN-DR [54](Target: Influenza A, B, SARS-CoV-2) | Electrochemical, Fluorescent, Colorimetric | 0.3 aM (synthetic DNA)100 CFU/mL (engineered bacteria) | Not explicitly stated | Simultaneous detection of multiple respiratory viruses in serum, saliva, and swabs |
| CRISPR-Cas12a Dual-Mode [52](Target: Salmonella) | Colorimetric, Photothermal* | 1 CFU/mL | 10Ⱐto 10⸠CFU/mL | Detection of pathogenic bacteria in food samples |
Note: Photothermal detection is a variant of colorimetric detection that measures the heat generated from a colored product.
Detailed Experimental Protocols
This protocol outlines the steps for a CRISPR/Cas12a-powered biosensor that outputs colorimetric, photothermal, and fluorescent signals.
A. Preparation of MNPs-ssDNA-HRP Signal Probe
- Activation: Mix 40 µL of carboxyl-coated magnetic nanoparticles (MNPs, 10 mg/mL) with 8 µL of 100 µM NH₂-ssDNA-Biotin in 80 µL of MES Buffer (50 mM, pH 6.0).
- Incubation: Shake at room temperature for 30 minutes.
- Conjugation: Add 40 µL of a freshly prepared EDC solution (50 mg/mL) and shake for 4 hours at room temperature.
- Washing: Separate the MNPs-ssDNA-Biotin magnetically and wash three times with MES Buffer.
- HRP Labeling: Resuspend in 400 µL of Streptavidin-HRP (0.35 µg/mL) and shake for 20 minutes.
- Blocking: After magnetic separation and washing, block with 0.5% BSA for 30 minutes to minimize background. Wash three more times. The probe is now ready.
B. Triple-Mode Detection Assay
- CRISPR/Cas12a Activation:
- In a reaction tube, combine:
- 4 µL of 1 µM LbCas12a
- 20 µL of 200 nM crRNA (specific to your target, e.g., mecA gene)
- 1 µg of the prepared MNPs-ssDNA-HRP probe
- 2 µL of the RPA-amplified sample
- 1x NEBuffer r2.1 to volume.
- Incubate at 37°C for 30 minutes. The activated Cas12a will cleave the ssDNA, releasing HRP into the solution.
- In a reaction tube, combine:
- Magnetic Separation: Place the tube on a magnetic rack. The supernatant now contains the released HRP, while the beads have cleaved DNA strands.
- Signal Readout:
- Colorimetric:
- Mix 10 µL of the supernatant with 50 µL of TMB substrate.
- Incubate in the dark for 5 minutes. A blue color (oxTMB) develops.
- For quantification, add 15 µL of 2 M H₂SO₄ to stop the reaction (turns yellow) and measure absorbance at 450 nm.
- Photothermal:
- Use the oxTMB solution (before acid addition) from the colorimetric step.
- Irradiate with an 808 nm NIR laser (5 W/cm²) for 2 minutes.
- Measure the temperature change using a portable infrared camera.
- Fluorescent:
- To the magnetic beads from Step B.2, add a TdT reaction mix: 5 µL Reaction Buffer (5x), 3 µL dTTP (100 mM), 1 µL TdT (10 U/µL), 2 µL BSA (0.1%), and 14 µL H₂O.
- Incubate at 37°C for 1 hour to form poly-T tails.
- Wash the beads. Add a mix of 7 µL Ascorbic Acid (80 mM), 3.5 µL CuSO₄ (0.8 mM), and 31.5 µL MOPS Buffer (pH 7.5) to synthesize fluorescent copper nanoclusters (CuNCs) on the poly-T scaffold.
- Measure fluorescence with excitation at 340 nm.
- Colorimetric:
This protocol describes a homogeneous, immobilization-free system for simultaneous electrochemical, fluorescent, and colorimetric detection.
A. Probe Design and Principle
- The core is a triple-mode probe: FAM-RNA-MB. It has a central RNA sequence flanked by a fluorophore (FAM) and an electrochemical tag (Methylene Blue, MB).
- Recognition: The RNA sequence hybridizes with the target DNA.
- Cleavage: The RNA strand in the DNA-RNA duplex is cleaved by RNase H.
- Signal Generation: Cleavage releases the FAM and MB tags, leading to:
- Fluorescence: De-quenching of FAM.
- Electrochemical: Diffusion of the small MB molecule to the electrode surface, generating a current.
- Colorimetric: The free FAM solution has a visible color under ambient light.
B. Assay Procedure
- Sample Amplification: Perform Recombinase Polymerase Amplification (RPA) on the extracted RNA/DNA using 5'-phosphorylated primers.
- ssDNA Generation: Treat the RPA product with λ-exonuclease to generate target ssDNA.
- Homogeneous Detection:
- In a single tube, mix the target ssDNA with the FAM-RNA-MB probe and RNase H with its buffer.
- Incubate at 37°C for 40 minutes.
- Triple-Mode Readout:
- Electchemical: Directly transfer an aliquot to an electrochemical cell containing a buffer like PBS. Measure the current from MB without any washing steps.
- Fluorescent: Measure the fluorescence intensity of FAM in the same reaction tube.
- Colorimetric: Visually observe the color of the solution under light or measure absorbance.
Signaling Pathways and Workflows
Diagram: CPF-CRISPR Biosensor Workflow
Diagram: HELEN-DR Homogeneous Biosensor Principle
The Scientist's Toolkit: Research Reagent Solutions
| Reagent / Material | Function in Triple-Mode Biosensing |
|---|---|
| CRISPR/Cas12a System | Provides the core recognition and signal transduction mechanism; its collateral cleavage activity is used to activate all downstream signals [52] [53]. |
| Magnetic Nanoparticles (MNPs) | Serve as a versatile scaffold for immobilizing signal probes (e.g., ssDNA-HRP), enabling easy separation and purification of reaction components via magnetic racks [53]. |
| Horseradish Peroxidase (HRP) | A key enzyme label that catalyzes the oxidation of TMB, generating both a colorimetric change (blue color) and a photothermal signal under NIR light [53]. |
| TMB Substrate | A chromogenic substrate that yields a colored (oxTMB) and photothermally active product upon enzymatic oxidation by HRP [53]. |
| Terminal Deoxynucleotidyl Transferase (TdT) | A template-independent DNA polymerase used to synthesize long poly-T sequences on DNA primers, which act as scaffolds for fluorescent copper nanoclusters (CuNCs) [53]. |
| Triple-Mode Probe (FAM-RNA-MB) | A single probe that integrates a fluorophore (FAM) and an electrochemical tag (MB) on an RNA backbone, enabling homogeneous, immobilization-free detection across three modes upon RNase H cleavage [54]. |
| RNase H | A crucial enzyme for homogeneous assays; it specifically cleaves the RNA in a DNA-RNA hybrid, releasing the signal tags (FAM and MB) for detection [54]. |
| Permselective Membranes (e.g., Nafion) | Used to coat electrochemical electrodes to repel interfering anionic molecules (like ascorbate and urate) commonly found in biological samples, thereby improving selectivity [56]. |
| Electron Mediators (e.g., Ferrocene) | Shuttle electrons from the enzyme's redox center to the electrode surface, allowing the biosensor to operate at a lower potential and avoid the electrochemical window where interferents are active [56]. |
Troubleshooting Guide: PEG/BSA-Based Antifouling Coatings
FAQ: My PEG-based antifouling coating is still showing protein adsorption. What could be wrong?
Answer: Inadequate surface coverage is a common cause. Polyethylene glycol (PEG) antifouling performance depends heavily on achieving high grafting density. If the underlying adhesive layer (e.g., Polydopamine/PDA) remains exposed, it provides sites for protein attachment. A recommended solution is to "backfill" with Bovine Serum Albumin (BSA). The larger BSA molecules can cover exposed PDA areas that PEG might not have reached, creating a more complete antifouling barrier [57].
Experimental Protocol - Backfilling with BSA:
- Prepare your substrate (e.g., Polycarbonate/PC, PDMS, or glass).
- Apply the Polydopamine (PDA) coating by polymerizing dopamine in an aqueous solution on the substrate.
- Graft Polyethylene Glycol (PEG) onto the PDA-coated surface.
- Incubate the PDA-PEG coated substrate with a BSA solution to allow BSA adsorption onto any remaining exposed PDA areas.
- Rinse thoroughly to remove any unbound BSA [57].
Expected Outcome: Research has demonstrated that backfilling PDA-PEG surfaces with BSA significantly reduces fibrinogen adsorption. The lowest adsorption (75 ng cmâ»Â²) was achieved on PC substrates treated with this method [57].
FAQ: How do I determine the optimal ratio of hydrogel in a PDMS composite coating?
Answer: The hydrogel concentration is critical. Insufficient hydrogel will not form an effective hydration layer, while excessive hydrogel can diminish the coating's mechanical and antifouling properties. Systematic testing is required to find the optimal balance for your specific system [58].
Experimental Protocol - Optimizing PS-PEG Hydrogel in PDMS:
- Preparation: Use a physical blending method to create composite coatings with varying weights (e.g., 0%, 10%, 20%, 30%) of PS-PEG hydrogel in PDMS [58].
- Characterization: Test key physicochemical properties:
- Surface Energy: Use a dynamic contact angle meter.
- Mechanical Properties: Perform tensile testing to determine breaking strength, elongation rate, and elastic modulus.
- Interlayer Adhesion: Assess using a scribing method [58].
- Antifouling Evaluation:
- Protein Adsorption Test: Use Bovine Serum Albumin fluorescent protein (BSA-FITC) to measure adsorption and calculate desorption rates.
- Marine Bacteria Adhesion Test: Quantify bacterial adherence and removal rates after rinsing.
- Benthic Diatom Adhesion Test: Measure chlorophyll concentration after washing to assess algal adhesion [58].
Expected Outcome: One study found that adding 20 wt% PS-PEG hydrogel resulted in optimal performance: a surface energy of 19.21 mJ/m², a bacterial removal rate of 54.29%, and a protein desorption rate 84.19% higher than pure PDMS [58].
Performance Data of Antifouling Coatings
The following table summarizes quantitative data from key studies on innovative antifouling coatings, providing a benchmark for expected performance.
Table 1: Quantitative Performance of Antifouling Coatings
| Coating System | Optimal Composition | Key Performance Metrics | Test Organism/Molecule | Reference |
|---|---|---|---|---|
| PS-PEG Hydrogel/PDMS | 20 wt% PS-PEG Hydrogel | Surface Energy: 19.21 mJ/m²; Bacterial Removal Rate: 54.29%; Protein Desorption: >84.19% vs. PDMS | Marine Bacteria, Diatoms, BSA | [58] |
| PDA-PEG/BSA "Backfilled" | PDA-PEG + BSA | Fibrinogen Adsorption: ~75 ng cmâ»Â² (on Polycarbonate) | Fibrinogen | [57] |
| NO-Releasing Coating | S-nitroso-N-acetylpenicilamine (SNAP) | Reduction in Bacterial Adhesion: ~90% (over 7 days in animal model) | Bacteria | [59] |
The Scientist's Toolkit: Essential Research Reagents
Table 2: Key Reagents for Antifouling Biosensor Research
| Reagent/Material | Function in Antifouling Research | Key Characteristic |
|---|---|---|
| Polyethylene Glycol (PEG) | Creates a hydrophilic, protein-repellent layer by forming a hydration barrier. | Biocompatible; effective at high grafting density [59] [57]. |
| Bovine Serum Albumin (BSA) | "Backfilling" agent to block exposed sites on adhesive under-layers (e.g., PDA). | Large protein size provides broad coverage [57]. |
| Polydopamine (PDA) | Versatile bioadhesive that forms a thin film on various substrates, enabling subsequent grafting. | Material-independent coating; excellent platform for functionalization [57]. |
| Polydimethylsiloxane (PDMS) | Base polymer for fouling-release coatings; low surface energy makes it hard for organisms to adhere strongly. | Highly elastic; hydrophobic; synergizes with hydrogels [58]. |
| PS-PEG Hydrogel | Provides a dynamic, hydrating surface that mimics biological systems and facilitates foulant release. | Forms a hydration layer; exhibits "low adhesion" and "desorption" properties [58]. |
| Nitric Oxide (NO) Donors (e.g., SNAP) | Biocidal agent that disperses biofilms by generating oxidative/nitrosative stress within the biofilm. | Mimics natural endothelium function; effective at sub-lethal concentrations [59]. |
Experimental Workflow and Mechanism Diagrams
Antifouling Coating Development Workflow
Synergistic Antifouling Mechanism of Hydrogel/PDMS
Nitric Oxide (NO) Biofilm Dispersal Mechanism
Troubleshooting Guide: Common Experimental Issues and Solutions
This section addresses specific challenges you might encounter when working with redox mediators and catalytic nanomaterials in biosensor development.
FAQ 1: My biosensor shows a weak or negligible electrochemical signal. What could be wrong?
A weak signal often points to issues with electron transfer efficiency or the integrity of the sensing layer.
- Solution A: Verify Immobilization and Activity of Biorecognition Elements.
- Check: Ensure your enzyme (e.g., laccase) or other bioreceptor is properly immobilized and retains its activity. A loss in catalytic activity will directly lead to a reduced signal.
- Action: Test the enzymatic activity in solution before and after immobilization using a standard spectrophotometric assay [60].
- Solution B: Evaluate the Redox Mediator Function.
- Check: Confirm that the redox mediator is effectively shuttling electrons. The mediator should have good electrochemical activity and a suitable redox potential to interact with both the bioreceptor and the electrode.
- Action: Perform cyclic voltammetry (CV) on the modified electrode in a blank buffer to characterize the electroactivity of the immobilized nanoparticles or mediators, as demonstrated with noble metal hexacyanoferrates [60].
- Solution C: Inspect Electrical Connections and Electrode Integrity.
- Check: Simple hardware or connection failures can mimic a weak signal.
- Action: Establish that you are having correct communications with your potentiostat. Short the working, reference, and counter electrodes via a resistor and apply a series of bias voltages to see if you can measure sensible currents, indicating the electronics are functioning correctly [20].
FAQ 2: The biosensor response is unstable or highly variable between measurements.
Signal instability can arise from non-specific interactions, leaching of components, or environmental factors.
- Solution A: Minimize Non-Specific Binding.
- Check: Complex sample matrices (like blood or wastewater) can cause fouling or false signals.
- Action: Incorporate effective blocking agents and use surface architectures that suppress non-specific interactions. For DNA-based sensors, using a sturdy tetrahedral tripod (TT) structure can enhance capture efficiency and reduce background interference [61].
- Solution B: Ensure Robust Immobilization.
- Check: The catalytic nanomaterials or enzymes may be leaching from the electrode surface.
- Action: Optimize your immobilization strategy (e.g., covalent bonding, entrapment in polymers) to enhance stability. Nanostructured carriers like carbon nanotubes and metal-organic frameworks can provide high surface area and robust mechanical stability for immobilization [60].
- Solution C: Control Experimental Conditions.
- Check: The performance of biological components is sensitive to pH and temperature.
- Action: Perform assays in buffered solutions and maintain a constant temperature. The reaction should be as independent as possible of physical parameters like stirring, pH, and temperature for reliable analysis [24].
FAQ 3: My sensor lacks the necessary selectivity for the target analyte in a complex sample.
Selectivity is a major barrier in moving sensors from the lab to real-world applications [62].
- Solution A: Engineer Specificity through Bioreceptor Choice.
- Check: The inherent selectivity of your bioreceptor (enzyme, antibody, aptamer) may be insufficient for the sample matrix.
- Action: Consider using functional nucleic acids (DNAzymes, aptamers) as receptors. These can be selected in vitro to bind a wide range of targets with high specificity, even for highly toxic molecules where raising antibodies is difficult [62].
- Solution B: Employ Multi-Step Assays with Washing.
- Check: Interferents are being detected along with your target.
- Action: Implement a sandwich-type assay or use magnetic beads to separate bound and unbound components after the recognition event, thus washing away interferents [63].
FAQ 4: How can I tune the dynamic range of my sensor to match a specific detection threshold?
The dynamic range of a sensor is often limited by the inherent affinity of the receptor [62].
- Solution: Utilize a General Signal Amplification Strategy.
- Action: Integrate signal amplification strategies that are independent of the binding event. Signal-based amplification methods, such as using enzyme labels that generate an insoluble product or employing nanoparticles with high electrocatalytic activity, can significantly lower the detection limit and extend the dynamic range without redesigning the receptor [64]. For example, gold nanoparticles (AuNPs) can act as carriers for multiple enzyme labels, dramatically amplifying the output signal [63].
Experimental Protocols: Key Methodologies
Protocol 1: Construction of a Laccase-Based Amperometric Biosensor Using Bimetallic Nanoparticles
This protocol is adapted from research on developing highly sensitive biosensors for catechol detection [60].
1. Synthesis of CuCo Bimetallic Nanoparticles (CuCo/NPs):
- Method: Use a chemical reduction method or chemical bath deposition.
- Procedure:
- Prepare aqueous solutions of copper(II) sulphate and cobalt salt (e.g., chloride or nitrate).
- Mix the solutions under vigorous stirring.
- Add a reducing agent (e.g., sodium borohydride) dropwise to the mixture to reduce the metal ions to their zero-valent state, forming nanoparticles.
- Collect the synthesized NPs by centrifugation, wash thoroughly with water, and re-disperse in a suitable solvent (e.g., water or ethanol). Store the suspension at 4°C until use [60].
2. Immobilization on a Graphite Electrode (GE):
- Method: Co-immobilization of NPs and enzyme.
- Procedure:
- Polish the graphite electrode to a mirror finish with alumina slurry and rinse with distilled water.
- Deposit the CuCo/NPs suspension onto the electrode surface and allow it to dry.
- Apply a solution of purified laccase (from Trametes zonatus) onto the NP-modified electrode.
- Let the enzyme adsorb, then rinse gently to remove any unbound laccase. The biosensor (laccase/CuCo/GE) is now ready for use [60].
3. Electrochemical Characterization and Catechol Detection:
- Technique: Cyclic Voltammetry (CV) and Amperometry.
- Procedure:
- Characterization: Perform CV in a standard buffer (e.g., 0.1 M phosphate buffer, pH 7.0) to confirm the electroactivity of the CuCo/NPs.
- Detection: Use amperometry under a constant applied potential. Add successive aliquots of a catechol standard solution to the electrochemical cell under stirring. Measure the steady-state current change, which is proportional to the catechol concentration. This specific configuration demonstrated a sensitivity of 4523 A·M−1·m−2 for catechol [60].
Protocol 2: Signal Amplification Using Gold Nanoparticles (AuNPs) as Multienzyme Carriers
This protocol outlines the use of AuNPs to amplify signals in an immunoassay format [63].
1. Preparation of AuNP-Antibody-Enzyme Conjugates:
- Procedure:
- Synthesize or purchase citrate-stabilized AuNPs (e.g., 10-20 nm diameter).
- Incubate the AuNPs with a solution containing both anti-target antibody and horseradish peroxidase (HRP) enzyme. The proteins adsorb onto the AuNP surface through ionic or hydrophobic interactions.
- Block remaining surface sites with a blocking agent like bovine serum albumin (BSA) to prevent non-specific binding.
- Purify the conjugate by centrifugation and re-suspend in a storage buffer [63].
2. Assay Execution (Sandwich Immunoassay):
- Procedure:
- Immobilize a capture antibody on a solid support (e.g., paramagnetic beads or electrode).
- Incubate with the sample containing the target antigen (e.g., a cancer biomarker like CA15-3).
- After washing, add the AuNP-antibody-HRP conjugate to form a sandwich complex.
- Wash again to remove unbound conjugate.
- For electrochemical detection, add an appropriate substrate for HRP (e.g., TMB/H2O2). The catalytic action of the multiple HRP enzymes on each AuNP generates an amplified electrochemical signal [63].
Research Reagent Solutions: Essential Materials and Their Functions
Table: Key Reagents for Biosensor Development with Redox Mediators and Nanomaterials.
| Reagent / Material | Function / Role in Biosensing | Example from Literature |
|---|---|---|
| Laccase Enzyme | Biorecognition element that catalyzes the oxidation of phenolic compounds (e.g., catechol), reducing Oâ‚‚ to Hâ‚‚O. Used as a model receptor for environmental monitoring [60]. | |
| Bimetallic Nanoparticles (e.g., CuCo/NPs) | Redox-active nanomaterials that act as electron transfer mediators between the enzyme and the electrode, enhancing signal transduction [60]. | |
| Gold Nanoparticles (AuNPs) | Serve as both electrocatalysts (e.g., for the hydrogen evolution reaction) and as carriers for multiple enzyme labels, enabling significant signal amplification [63]. | |
| Iridium Oxide Nanoparticles (IrOâ‚‚ NPs) | Novel nanomaterial tags with high electrocatalytic activity for water oxidation at neutral pH, useful for biosensing in physiological conditions. Also enhance electrode conductivity [63]. | |
| Hexaammineruthenium(III) Chloride (RuHex) | An electroactive compound that powerfully adsorbs to the DNA phosphate backbone via electrostatic attraction, serving as a signal reporter in nucleic acid-based electrochemical biosensors [61]. | |
| Tetrahedral Tripods (TTs) | A sturdy, synthetic DNA nanostructure used to immobilize capture probes on the electrode surface. Enhances capture efficiency and reduces non-specific interference [61]. | |
| Functional Nucleic Acids (Aptamers, DNAzymes) | Synthetic receptors obtained via SELEX that can bind to a wide range of targets (ions, small molecules, proteins) with high affinity and selectivity, overcoming the limitations of natural receptors [62]. |
Core Concepts and Workflow Visualizations
Diagram: Electron Transfer Pathways in a Nanomaterial-Enhanced Biosensor
Diagram: Signal Amplification Strategy Using Nanoparticle Carriers
Proving Efficacy: Validation Frameworks and Comparative Analysis of Biosensor Platforms
Frequently Asked Questions (FAQs)
Q1: My electrochemical biosensor shows a high background signal, leading to poor Limit of Detection (LoD). What could be the cause? A high background signal is often due to non-specific binding or electrochemical interferences from the sample matrix. To address this:
- Improve Surface Blocking: Ensure your electrode surface is properly blocked with agents like bovine serum albumin (BSA) to cover any active sites not occupied by your biorecognition element (e.g., antibody, enzyme) [65].
- Optimize Electrode Material: Consider using specialized electrode materials or hydrogels designed to minimize non-specific interactions. Some advanced surfaces exhibit extremely low electrostatic surface charge, which reduces interference [65].
- Employ a Washing Protocol: Implement stringent washing steps after the sample incubation to remove unbound or weakly bound molecules.
Q2: How can I improve the sensitivity of my graphene-based gas sensor for detecting specific analytes like NOâ‚‚? The sensitivity of graphene-based sensors is highly dependent on defect engineering [66].
- Introduce Controlled Defects: Deliberately introducing specific types of defects in the graphene lattice can create more active sites for gas molecule adsorption, thereby enhancing the sensor's response. The nature of these defects, not just their quantity, is critical for sensitivity and selectivity [66].
- Material Selection: Different graphene-based materials (GBM), such as ball-milled few-layered mesoporous graphene (FLMG), inherently possess more defects and may offer higher sensitivity compared to pristine, mechanically exfoliated graphene [66].
- Utilize UV Irradiation: Continuous UV irradiation at room temperature can enhance sensor performance by promoting faster and more complete desorption of analyte molecules between measurements, preventing performance degradation [66].
Q3: Why does my biosensor's performance degrade over multiple measurement cycles, and how can I stabilize it? Performance degradation is often linked to sensor fouling or incomplete regeneration [67] [66].
- Fouling Prevention: For electrochemical biosensors, using specific polymer-doped electrodes can help prevent surface fouling [67]. For graphene-based gas sensors, the issue is often incomplete recovery, where analyte molecules do not fully desorb.
- Forced Recovery: Implement a recovery step between measurements. For gas sensors, this can be achieved through continuous UV irradiation or thermal treatment to clean the sensor surface [66]. For biosensors, ensure your regeneration buffer effectively dissociates the analyte from the immobilized ligand without denaturing it.
Q4: What are the primary advantages of LED photometry (PEDD) over traditional spectrophotometry for colorimetric sensing? A comparative study found that a low-cost Paired Emitter–Detector Diode (PEDD) system outperformed laboratory-grade spectrophotometry and camera-based imaging in key metrics [68].
- Superior Performance: The PEDD approach demonstrated significant improvements in measurement range (×16.39), dynamic range (×147.06), accuracy (×1.79), and sensitivity (×107.53) compared to a spectrophotometer [68].
- Cost-Effectiveness and Scalability: The PEDD system is a versatile, high-performance solution that reduces dependence on complex lab-based instrumentation, making it ideal for decentralized, cost-effective industrial applications [68].
Q5: Can machine learning (ML) help with sensor cross-sensitivity and selectivity issues? Yes, AI and machine learning are powerful tools for enhancing sensor selectivity, especially in complex environments [69].
- Pattern Recognition: ML algorithms can process data from sensor arrays (e.g., electronic noses) to identify unique patterns for different analytes, even when individual sensor elements are not perfectly selective [69].
- Data Processing: Machine learning helps interpret large sensing datasets, remove signals from contaminants, and can compensate for environmental variables like temperature and humidity, leading to higher effective sensitivity and selectivity [67] [69].
Troubleshooting Guides
Issue: Poor Selectivity in Graphene-Based Gas Sensors
Problem: Your sensor responds to multiple gases, not just the target analyte (e.g., NOâ‚‚).
| Step | Action & Rationale |
|---|---|
| 1 | Characterize Material Defects. Use Raman spectroscopy to go beyond the basic I(D)/I(G) ratio. Analyze D, D′, and D″ bands to understand the specific nature of defects, as different defect types influence selectivity [66]. |
| 2 | Apply Machine Learning. Use algorithms like LASSO regression to correlate specific Raman spectral features with sensor performance metrics. This data-driven approach can identify which material properties are key for discriminating your target analyte [66]. |
| 3 | Tune Sensing Material. Based on the ML analysis, select or engineer a graphene-based material with a defect profile optimized for your target analyte. For instance, materials with a higher density of certain defect types may show preferential binding for NOâ‚‚ over CO [66]. |
| 4 | Validate with Gas Mixtures. Test the optimized sensor not just with pure analytes but with complex mixtures that mimic real-world conditions to confirm improved selectivity [66]. |
Issue: Signal Instability in Electrochemical Biosensors
Problem: The sensor signal drifts over time or is unstable during measurement.
| Step | Action & Rationale |
|---|---|
| 1 | Verify Immobilization Protocol. Ensure the biological receptor (enzyme, antibody) is correctly immobilized. Check for common errors: free amines in the immobilization buffer, incorrect pH or salt concentration, or use of an inactive ligand [65]. |
| 2 | Check for Non-Specific Binding. Run a control with a sample lacking the target analyte. A significant signal suggests non-specific binding. Switch to a sensor surface with low non-specific binding properties, such as a linear polycarboxylate hydrogel [65]. |
| 3 | Inspect Electrode Surface. Look for signs of fouling or degradation. Implementing a anti-fouling layer, such as a poly(2-acrylamido-2-methyl-1-propane) sulfonic acid polymer, can stabilize the signal [67]. |
| 4 | Audit Buffer Composition. Ensure the buffer is compatible and does not contain components that degrade the electrode or the biorecognition element over time [65]. |
Quantitative Performance Data
The following table summarizes key performance metrics for different sensor architectures as reported in recent literature, providing a benchmark for your own systems.
Table 1: Benchmarking Sensor Architectures on Key Performance Metrics
| Sensor Architecture | Target Analyte | Limit of Detection (LoD) | Key Advantage / Selectivity Mechanism | Reference |
|---|---|---|---|---|
| LED Photometry (PEDD) | pH (Colorimetric) | Not explicitly stated | Superior Sensitivity & Dynamic Range: Demonstrated 107x higher sensitivity and 147x wider dynamic range than spectrophotometry. | [68] |
| Graphene-Based Chemiresistive | NOâ‚‚ | ~20 parts per billion (ppb) | Defect Engineering: Sensitivity and selectivity are tuned by controlling the type and density of defects in the graphene lattice. | [66] |
| Electrochemical (Enzyme-based) | Glucose | 0 - 35 mM (Range) | Enzyme Specificity: Uses glucose oxidase for high specificity; can be miniaturized for in-situ monitoring (e.g., microneedle sensors). | [67] |
| Electrochemical (Immunosensor) | Interleukin (Cytokine) | 0.3 - 100 nM (Range) | Antibody Affinity: Uses specific antibodies for high selectivity; can be integrated with portable readers. | [67] |
| Surface-Enhanced Raman Scattering (SERS) | Food Contaminants | (Varies by analyte) | Molecular Fingerprinting: Provides unique vibrational spectra for highly selective identification of chemical structures. | [70] |
Experimental Protocols
Protocol: Evaluating Optical Sensing Methods for Colorimetric Bio/Chemical Detection
This protocol is adapted from a study comparing spectrophotometry, LED photometry (PEDD), and imaging [68].
1. Objective: To systematically compare the resolution, accuracy, sensitivity, and limit of detection of three optical sensing methods using a common colorimetric pH indicator (Bromocresol Green).
2. Materials:
- Reagents: Bromocresol green (BCG) powder, 0.1 M HCl, 0.1 M KOH, ultrapure water.
- Labware: 50 mL polypropylene vials, 3 mL cuvettes, calibrated pH meter.
- Instruments: UV-Vis Spectrophotometer (e.g., Cary 50), custom PEDD setup, camera imaging system.
3. Methodology:
- Sample Preparation:
- Prepare a 50 µM stock solution of BCG.
- Titrate solutions to span a pH range from 2 to 8 using HCl and KOH.
- Add a consistent volume of BCG stock to each pH solution to achieve a final concentration of 25 µM BCG.
- Transfer 2 mL of each final solution to a cuvette for analysis.
- Optical Analysis Setup:
- Spectrophotometry: Measure absorption spectra from 350 nm to 750 nm in 1 nm increments.
- LED Photometry (PEDD): Use a 3D-printed black cuvette holder to mount paired emitter-detector diodes. Measure the charge-discharge characteristics of the detector diode.
- Imaging: Replace the detector diode with a camera. Capture images under consistent lighting conditions within a light-enclosed box.
- Data Analysis: For each method, plot the measured signal (absorbance, discharge time, pixel intensity) against pH. Calculate and compare metrics like dynamic range, sensitivity, and limit of detection.
Protocol: Assessing Defect Engineering in Graphene-Based NOâ‚‚ Sensors
This protocol is based on research investigating the role of defects in sensor performance [66].
1. Objective: To correlate the defect characteristics of various graphene-based materials (GBM) with their sensitivity and selectivity for NOâ‚‚ detection at room temperature.
2. Materials:
- Sensing Materials: A selection of non-oxidized GBMs (e.g., mechanically exfoliated graphene, CVD-grown multilayer graphene, ball-milled few-layered graphene).
- Fabrication: Interdigitated electrodes or a pre-patterned substrate for sensor construction.
- Characterization: Raman spectrometer, gas calibration system with controlled NOâ‚‚ concentrations, UV light source.
3. Methodology:
- Sensor Fabrication: Deposit different GBM samples onto separate sensor platforms to create multiple devices.
- Material Characterization: Perform a detailed Raman spectroscopy analysis on each GBM. Move beyond the I(D)/I(G) ratio by analyzing the characteristics of the D, D′, D″, and 2D bands to create a defect "fingerprint."
- Gas Sensing Measurements:
- Expose all sensors to a range of NOâ‚‚ concentrations (e.g., from sub-ppm to several ppm) at room temperature.
- Apply continuous UV irradiation during the measurement cycle to aid molecule desorption and enhance recovery.
- Record the resistive response of each sensor.
- Data Analysis:
- Use machine learning tools (e.g., LASSO regression) to find correlations between the Raman spectral features (defect characteristics) and the sensor performance metrics (sensitivity, selectivity, LoD).
- Identify which specific defect types are most beneficial for detecting NOâ‚‚.
Signaling Pathways and Workflows
Workflow for Sensor Optimization via Defect Engineering
This diagram visualizes the data-driven process of optimizing a graphene-based sensor by linking material properties to performance.
Diagram Title: Data-Driven Sensor Optimization Workflow
Optical Sensing Comparison Workflow
This diagram outlines the experimental workflow for a comparative study of different optical sensing methods.
Diagram Title: Optical Sensing Method Comparison
The Scientist's Toolkit: Research Reagent Solutions
Table 2: Essential Materials for Sensor Development and Characterization
| Item | Function / Application | Example & Notes |
|---|---|---|
| Bromocresol Green (BCG) | A colorimetric pH indicator. Used as a standard analyte for benchmarking and comparing the performance of optical sensing systems. | Used in a comparative study of spectrophotometry, PEDD, and imaging [68]. |
| Graphene-Based Materials (GBM) | The active sensing layer in chemiresistive gas sensors. Different types provide tunable sensitivity and selectivity. | Includes mechanically exfoliated graphene, CVD graphene, and ball-milled graphene. Defect engineering is key to performance [66]. |
| Prussian Blue Nanoparticles | An electron mediator for electrochemical biosensors. Used to modify electrode surfaces and detect products like hydrogen peroxide. | Used in the development of cholesterol and lactate biosensors to improve efficiency [67]. |
| Screen-Printed Electrodes (SPE) | Low-cost, disposable platforms for rapid electrochemical detection. Ideal for decentralized testing. | Can be modified with polymers (e.g., polyaniline) or nanomaterials to prevent fouling and enhance signal [67]. |
| Hydrogel Chip Surfaces | A 3D matrix for immobilizing ligands in surface-based sensors (e.g., SPR). Minimizes non-specific binding. | Advanced hydrogels (e.g., linear polycarboxylate) offer lower non-specific binding compared to traditional carboxymethyldextran [65]. |
| UV Light Source | A tool for enhancing the performance of graphene-based gas sensors. Aids in desorption of gas molecules at room temperature. | Enables faster recovery and prevents performance degradation after multiple analyte exposures [66]. |
Troubleshooting Guides
Guide: Mitigating Redox-Active Interferences in Complex Matrices
Problem: High background noise or false-positive signals in electrochemical biosensors when testing in serum, blood, or saliva.
Explanation: Biological fluids contain abundant interfering species like ascorbate, urate, and acetaminophen that are electrochemically active. These molecules can be oxidized at the working electrode potential, generating a current that is indistinguishable from the target analyte signal, thereby increasing detection limits and compromising accuracy [32].
Solution: Implement a conductive membrane encapsulation strategy.
Procedure:
- Sensor Preparation: Fabricate your standard electrochemical biosensor (e.g., a first-generation glucose oxidase sensor).
- Membrane Encapsulation: Encapsulate the sensor surface with three layers of gold-coated track-etch membranes.
- Potential Application: Apply a specific, optimized potential across the conductive membrane layers.
- Mechanism: The applied potential electrochemically deactivates (oxidizes or reduces) the redox-active interferents as they approach the sensor surface. The redox-inactive target analyte passes through the membrane unaltered to be detected at the sensor surface [32].
Expected Outcome: This method has been shown to achieve a 72% reduction in redox-active interference and an 8-fold decrease in detection limit [32].
Guide: Managing Sample Collection Variability in Saliva
Problem: Inconsistent and non-reproducible results when using saliva as a diagnostic matrix.
Explanation: The composition of saliva is dynamic and influenced by factors such as salivary flow rate, circadian rhythm, diet, age, physiological status, and the method of collection itself. The use of cotton swabs, for example, can introduce unwanted bias by absorbing critical biomarkers [71].
Solution: Standardize saliva collection and handling protocols.
Procedure:
- Patient Preparation: Instruct subjects to rinse their oral cavity with water prior to collection to reduce contaminants and food debris [71].
- Collection Method: Avoid cotton swabs. Use specialized collection devices designed for saliva (see Table 3 for examples). Draining, spitting, and suctioning are common, reliable approaches [71].
- Sample Handling: Process samples promptly or store them according to the stability of your target biomarker. Note that saliva does not clot, which can simplify storage compared to blood [71].
Expected Outcome: Standardized protocols minimize pre-analytical variability, enabling more reliable reproduction of results across different investigators and populations [71].
Frequently Asked Questions (FAQs)
FAQ 1: Why is validation in complex matrices like blood and saliva so crucial for biosensor development?
Validation in these matrices is fundamental for establishing clinical relevance. While biosensors may perform excellently in buffer solutions, biological fluids like serum, blood, and saliva present a challenging "hostile" environment. They contain a complex mix of proteins, lipids, cells, and electroactive compounds that can foul the sensor surface, inhibit the biorecognition element, or generate non-specific signals. Assessing robustness in these real-world samples ensures the sensor's accuracy, selectivity, and stability for practical medical diagnostics [32] [24].
FAQ 2: What are the key advantages of using saliva over blood for clinical diagnostics?
Saliva offers several compelling advantages as a diagnostic fluid [71] [72]:
- Non-invasive Collection: Painless procurement encourages patient compliance and facilitates frequent monitoring.
- Safety: Saliva contains factors that inhibit the infectivity of pathogens like HIV, making samples safer to handle.
- Cost-Effectiveness: Collection requires minimal training, no specialized personnel, and is easier to ship and store than blood.
- Rich Information: Despite being less complex than blood, saliva contains a wide array of microbial, immunologic, and molecular biomarkers (DNA, RNA, proteins, exosomes) that reflect both oral and systemic health [72].
FAQ 3: What are the main types of bioreceptors used in electrochemical biosensors and their applications?
Electrochemical biosensors rely on various bioreceptors for specificity. The table below summarizes the most common types [73] [67] [24]:
Table 1: Key Bioreceptors in Electrochemical Biosensors
| Bioreceptor | Principle of Interaction | Example Applications |
|---|---|---|
| Enzymes | Catalytic conversion of a specific substrate | Glucose monitoring (Glucose Oxidase), Lactate detection, Pesticide detection (Tyrosinase) [67] |
| Antibodies | Specific antigen-antibody binding (Immunosensors) | Detection of proteins (e.g., Interleukin, Immunoglobulins), pathogens [67] |
| Nucleic Acids | Hybridization with complementary DNA/RNA sequences | Detection of viral genomes (e.g., COVID-19, HPV), genetic biomarkers [72] |
| Whole Cells | Metabolic activity or cellular response | Microbial fuel cells, environmental toxin monitoring [73] |
FAQ 4: How can I improve the sensitivity of my electrochemical immunosensor?
Improving sensitivity often involves signal amplification and optimizing the surface architecture. Strategies include:
- Use of Nanomaterials: Nanomaterials like nanoparticles, nanowires, and fullerenes provide a high surface-to-volume ratio, increasing the immobilization capacity for bioreceptors and enhancing electron transfer [67].
- Enzymatic Labels: In sandwich-style immunosensors (similar to ELISA), enzymes such as Horseradish Peroxidase (HRP) can be conjugated to a secondary antibody. The enzyme catalyzes a reaction that produces a large amount of electroactive product, amplifying the signal [24].
- Surface Engineering: Precise control over the surface nano-architecture and functionalization is critical to maximize specific binding and minimize non-specific adsorption, which directly impacts the signal-to-noise ratio [24].
Experimental Data & Protocols
Quantitative Data on Complex Matrices
Table 2: Characteristics of Common Clinical Matrices for Biosensor Validation [71] [72]
| Matrix | Key Components & Challenges | Average Volume/Collection | Advantages for Diagnostics |
|---|---|---|---|
| Saliva | Water (99%), proteins, enzymes, hormones, DNA, RNA, exosomes, microbial flora. Challenge: Dynamic composition, presence of bacterial DNA [72]. | 0.3-0.7 mL/min; 1-1.5 L/day [71] | Non-invasive, safe to handle, cost-effective, rich in biomarkers [71] [72] |
| Blood (Serum/Plasma) | Cells, proteins, hormones, electrolytes, metabolites, lipids. Challenge: Complex, requires clotting or centrifugation, high protein content can cause fouling. | N/A | Traditional "gold standard," comprehensive physiological picture, well-established protocols. |
| Sweat | Water, electrolytes (Na+, K+), lactic acid, urea, trace minerals. Challenge: Low analyte concentrations, variable secretion rates [72]. | N/A | Non-invasive, suitable for continuous wearable sensors [72]. |
Detailed Experimental Protocol: Conductive Membrane Interference Mitigation
This protocol details the method for mitigating redox-active interferences using a conductive membrane strategy, as highlighted in the troubleshooting guide [32].
Objective: To encapsulate an electrochemical biosensor with a conductive membrane to reduce signals from redox-active interferents while allowing target analyte detection.
Materials:
- Fabricated electrochemical biosensor (e.g., Glucose Oxidase sensor).
- Gold-coated track-etch membranes.
- Potentiostat.
- Solution of redox-active interferents (e.g., 0.1 mM Ascorbic Acid, 0.1 mM Uric Acid).
- Solution of target analyte (e.g., Glucose).
- Phosphate Buffered Saline (PBS), pH 7.4.
Workflow:
Step-by-Step Procedure:
- Sensor Preparation: Start with a fully characterized and calibrated first-generation biosensor (e.g., a glucose oxidase sensor on a screen-printed electrode).
- Membrane Encapsulation: Carefully layer three gold-coated track-etch membranes over the active sensor surface, ensuring full coverage and good electrical contact.
- System Assembly: Integrate the membrane-encapsulated sensor into the electrochemical flow cell or measurement setup.
- Potential Optimization: Using a potentiostat, apply a specific potential to the conductive membrane layers. This potential must be optimized to deactivate the specific redox-active interferents present in your target matrix without affecting the analyte.
- Validation Testing:
- Baseline: Record the sensor's amperometric response to a PBS solution.
- Interference Test: Record the response after adding a known concentration of interferents (e.g., ascorbic acid).
- Analyte Test: Record the response after adding the target analyte (e.g., glucose).
- Compare the signal from the interferents with and without the membrane potential applied. The reported result is a 72% reduction in the interference signal and an 8-fold improvement in the detection limit for the target analyte [32].
The Scientist's Toolkit
Table 3: Essential Research Reagents and Materials for Biosensor Validation
| Item | Function/Explanation | Example Products/Brands |
|---|---|---|
| Specialized Saliva Collection Devices | Standardizes sample collection, minimizes adsorption and contamination, and improves reproducibility compared to homemade methods [71]. | Salimetrics Saliva Collection Aid, Oasis DNA·SAL, DNA Genotek ORAcollect [71] |
| Screen-Printed Electrodes (SPEs) | Disposable, cost-effective, mass-producible electrodes that form the core of many portable electrochemical biosensors. Can be modified with nanomaterials [67]. | Various suppliers (e.g., Metrohm, DropSens) |
| Gold-coated Membranes | Key component for the conductive membrane interference mitigation strategy. The gold coating provides conductivity for applying the deactivating potential [32]. | Commercially available track-etch membranes can be custom-coated. |
| Enzymes (e.g., Glucose Oxidase) | Act as the primary biorecognition element in catalytic biosensors. They provide high specificity for the target analyte [67] [24]. | Available from numerous biochemical suppliers (e.g., Sigma-Aldrich) |
| Nanomaterials (e.g., Prussian Blue Nanoparticles) | Used to modify electrode surfaces to enhance sensitivity, facilitate electron transfer, and lower detection limits. Prussian blue is an effective electrocatalyst for hydrogen peroxide [67]. | Available from nanomaterial specialists or synthesized in-lab. |
Visualized Workflows and Mechanisms
Biosensor Mechanism and Interference
This diagram illustrates the fundamental components of a biosensor and the challenge of redox-active interferences.
Conductive Membrane Protection Mechanism
This diagram details the working principle of the conductive membrane strategy for protecting the biosensor.
Technical Support Center
Troubleshooting Guide
Issue 1: Poor Reproducibility in Multiplexed Electrochemical Biosensors
- Problem: High coefficient of variation (CV) between replicate sensors or assay runs.
- Root Cause: Inconsistent electrode fabrication and uneven bioreceptor immobilization are primary culprits. Variations in electrode surface topography (roughness) and insufficiently controlled production settings can lead to signal drift [74].
- Solution:
- Calibrate Electrode Fabrication: Utilize Semiconductor Manufacturing Technology (SMT) and calibrate production settings to ensure electrode thickness is greater than 0.1 μm and surface roughness is less than 0.3 μm [74].
- Optimize Bioreceptor Immobilization: Employ a streptavidin-biotin system improved with a unique GW linker. This linker provides an optimal balance of flexibility and rigidity, promoting uniform orientation and function of the immobilized bioreceptors [74].
- Validation: Adhere to Clinical and Laboratory Standards Institute (CLSI) guidelines. Ensure the biosensor platform achieves a CV of less than 10% for reproducibility [74].
Issue 2: Cross-Reactivity and Signal Overlap in Multiplexed Detection
- Problem: Inability to distinguish signals from different targets in a multiplexed panel, leading to false positives or inaccurate quantification.
- Root Cause: Spectral overlap in optical sensors or non-specific binding in electrochemical sensors [75].
- Solution:
- Spatial Segregation: Design sensors with multiple individual detection regions or microfluidic channels on a single chip, each functionalized with a specific probe [75].
- Signal Differentiation: For optical platforms, use fluorophores with minimal spectral overlap and employ linear unmixing algorithms to resolve individual signals [76]. For electrochemical sensors, apply multiplexed strategies using multiple complementary surfaces or experimental conditions to validate hits and isolate specific signals [77].
- Biointerface Design: Carefully select specific probes (e.g., antibodies, aptamers) and optimize the biofunctionalization protocol to minimize non-specific binding [75].
Issue 3: Inadequate Sensitivity and Accuracy for Clinical Use
- Problem: The biosensor fails to meet the required clinical sensitivity and accuracy standards for point-of-care (POC) diagnostics.
- Root Cause: Limitations in signal transduction, suboptimal reaction conditions, or interference from the sample matrix [74].
- Solution:
- Platform Optimization: Develop a dedicated biosensor platform (e.g., Semiconductor Manufacturing Electrochemical Biosensor, SMEB) that integrates optimized SMT electrodes with an enhanced biomediator [74].
- Signal Enhancement: Incorporate signal amplification strategies, such as using highly vertical ZnO nanorods to enhance accuracy or enzyme-based amplification [74].
- Standardized Protocols: Define and follow strict Standard Operating Procedures (SOPs), optimize reaction conditions (e.g., buffer, incubation time), and simplify measurement technology to reduce user-induced errors [74].
Frequently Asked Questions (FAQs)
Q1: What are the key advantages of multiplexed biosensors over single-analyte tests? Multiplexed biosensors offer several key advantages: they allow for the simultaneous detection and quantification of multiple biomarkers from a single, small sample volume. This enhances reproducibility and reliability, reduces the average analysis time per biomarker, requires fewer materials, and provides a more comprehensive diagnostic profile, which is crucial for monitoring complex diseases [78].
Q2: What are the critical performance benchmarks for a POC diagnostic biosensor? According to the Clinical and Laboratory Standards Institute (CLSI), a biosensor intended for POC use should demonstrate a coefficient of variation (CV) of less than 10% for reproducibility, accuracy, and stability. Meeting these benchmarks is essential for clinical adoption [74].
Q3: How can cross-reactivity be minimized in a multiplexed optical biosensor? Cross-reactivity can be minimized through several strategies:
- Probe Design: Using highly specific probes like aptamers, which offer high specificity and selectivity [79].
- Spatial Separation: Physically separating detection areas on the sensor chip [75].
- Spectral Resolution: Employing fluorophores with distinct emission spectra and using computational techniques like linear unmixing to resolve overlapping signals [76].
Q4: What strategies can improve the stability of bioreceptors on the sensor surface? Using a streptavidin biomediator provides strong binding affinity for biotinylated bioreceptors, which enhances stability. Further improvement can be achieved by introducing a GW linker between the mediator and the bioreceptor, which optimizes orientation and function, thereby increasing overall biosensor stability [74].
Experimental Protocols for Key Evaluations
Protocol 1: Evaluating Reproducibility and Accuracy of an Electrochemical Biosensor
- Objective: To determine the inter-assay and intra-assay CV and assess accuracy against a standard method.
- Materials: Optimized SMT-produced electrodes (thickness >0.1 μm, roughness <0.3 μm), streptavidin biomediator with GW linker, biotinylated bioreceptor (e.g., anti-cTnI antibody), target analyte (e.g., cTnI protein), electrochemical workstation [74].
- Methodology:
- Sensor Preparation: Immobilize the biotinylated bioreceptor onto the streptavidin-GW modified electrode.
- Sample Analysis: Run a minimum of 20 replicates of samples containing low, medium, and high concentrations of the target analyte across different production batches of sensors [74].
- Data Analysis: Calculate the mean signal, standard deviation, and CV for each concentration level. The platform should meet the CLSI guideline of CV < 10% [74]. Compare results with a gold standard method (e.g., ELISA) to establish accuracy.
Protocol 2: Multiplexed Screening Using SPR Biosensors
- Objective: To simultaneously screen a fragment library against multiple challenging drug targets.
- Materials: Flow-based SPR biosensor system, target proteins (e.g., AChBP, LSD1/CoREST complex), fragment library (e.g., 90 to 1056 compounds), series S sensor chips [77].
- Methodology:
- Surface Preparation: Use a multiplexed strategy by creating multiple complementary surfaces. Immobilize different target proteins or the same target under different conditions in separate flow cells [77].
- Screening: Inject the fragment library compounds across all flow cells simultaneously.
- Hit Identification and Validation: Identify binding responses in each flow cell. Use reference surfaces for subtraction of non-specific binding. Validate initial hits using orthogonal methods to confirm specificity and mode-of-action [77].
The table below consolidates key performance metrics and specifications from the literature to aid in platform comparison.
Table 1: Key Performance Metrics and Specifications for Biosensor Platforms
| Platform / Characteristic | Key Metric / Specification | Value / Description | Application Context |
|---|---|---|---|
| General POC Standard (CLSI) [74] | Coefficient of Variation (CV) | < 10% | Reproducibility, Accuracy, Stability |
| SMT-Produced Electrodes [74] | Electrode Thickness | > 0.1 μm | Optimized for label-free affinity detection |
| Surface Roughness | < 0.3 μm | Optimized for label-free affinity detection | |
| Colorimetric Aptasensor [79] | Detection Time | ~ 5 minutes | Rapid POC testing for RBP4 |
| Limit of Detection (LOD) | 90.76 ± 2.81 nM | Detection of Retinol-Binding Protein 4 | |
| Photoelectrochemical Immunosensor [79] | Linear Detection Range | 1 pg mLâ»Â¹ to 1000 ng mLâ»Â¹ | Detection of Cardiac Troponin I (cTnI) |
| M-DNA Sensor [79] | Limit of Detection (LOD) | 2.1 nM | Detection of Silver Ions (Agâº) |
Workflow and Relationship Visualizations
Multiplexed Biosensor Development Workflow
Cross-Reactivity Problem-Solution Analysis
The Scientist's Toolkit: Research Reagent Solutions
Table 2: Essential Materials and Reagents for Multiplexed Biosensor Development
| Research Reagent / Material | Function / Application | Key Characteristics / Examples |
|---|---|---|
| SMT-Produced Electrodes [74] | Serves as the transducer in electrochemical biosensors. | High reproducibility. Calibrated thickness (>0.1µm) and roughness (<0.3µm) for optimal performance. |
| Streptavidin Biomediator with GW Linker [74] | Immobilizes biotinylated bioreceptors on the sensor surface. | Provides strong binding affinity (streptavidin-biotin) and optimized orientation/function via the GW linker. |
| Aptamers [79] | Act as highly specific recognition elements for targets. | High specificity, thermal stability, low cost, ease of production compared to antibodies. Used for RBP4, small molecules. |
| Semiconducting Polymer Dots (Pdots) [79] | Function as optical probes in fluorescence-based biosensors. | Large absorption, high brightness, tunable emission, excellent photostability, biocompatibility. |
| Metal-Organic Frameworks (MOFs) [79] | Used to construct optical sensing platforms for multiplexed detection. | High surface area, tunable properties, can be engineered for single- or multi-emission signals (ratiometric sensing). |
| Fluorescent Protein (FP) Biosensors [76] | Enable real-time monitoring of molecular activities in live cells for multiplexed cellular imaging. | Genetically encoded; readouts include changes in localization, intensity, FRET, or spectral profile. |
Technical Support Center
Frequently Asked Questions (FAQs)
Q1: What are the most common sources of electrochemical interference in complex samples like blood or food? A1: In complex samples, interferences primarily come from substances with similar redox potentials to your target analyte (e.g., ascorbic acid, uric acid, acetaminophen in biological fluids), proteins that foul the electrode surface, and varying ionic strength or pH. Utilizing selective recognition elements (aptamers, MIPs) and 3D nanostructured materials can significantly improve specificity [8] [11]. Machine learning algorithms can also be trained to distinguish target signals from these interferences [8] [80].
Q2: Our sensor signal drifts significantly during long-term monitoring. What could be the cause? A2: Signal drift is often caused by environmental factors (temperature, humidity), sensor aging, biofouling, or reference electrode instability [8] [81]. To mitigate this:
- Material Selection: Use stable, antifouling coatings like hydrogels or polydopamine [81] [82].
- Device Design: Ensure proper encapsulation to protect electronic components from humidity [83].
- Data Processing: Implement machine learning-based drift compensation algorithms that can model and correct for the signal decay over time [8].
Q3: How can we improve the reproducibility of our sensor fabrication process? A3: Low reproducibility often stems from inconsistent electrode surfaces or manual fabrication steps.
- Automated Fabrication: Transition from manual methods to laser ablation [84], inkjet printing [84], or screen printing for more consistent electrode patterning.
- Surface Characterization: Routinely use techniques like Scanning Electron Microscopy (SEM) and electrochemical impedance spectroscopy (EIS) to verify the consistency of electrode surface morphology and properties [84].
- Standardized Protocols: Develop and strictly adhere to standardized protocols for surface modification and biorecognition element immobilization.
Q4: What are cost-effective electrode materials that do not compromise performance? A4: While gold is excellent, its cost is high. Consider:
- Gold Leaf Electrodes (GLEs): Laminating gold leaf onto adhesive substrates followed by laser patterning is a rapidly fabricated, low-cost alternative to vapor-deposited gold [84].
- Conductive Polymers: Polymers like PEDOT:PSS and polyaniline are lower-cost, flexible, and biocompatible, making them suitable for wearable sensors [81] [82] [83].
- Carbon-Based Materials: Graphene and carbon nanotubes are cost-effective in ink forms and offer high conductivity and surface area [81] [84].
Troubleshooting Guides
Problem: Inconsistent results between sensor batches.
| Potential Cause | Solution |
|---|---|
| Inconsistent electrode surface cleanliness. | Implement a rigorous and standardized pre-cleaning protocol (e.g., electrochemical cycling in sulfuric acid, plasma treatment) before functionalization [84]. |
| Variation in biorecognition element immobilization. | Use precise dispensing systems (e.g., automated pipettes, inkjet printers) and quantify immobilization density using a standard method like EIS or quartz crystal microbalance [11]. |
| Uncontrolled storage conditions for finished sensors. | Store sensors in a stable, inert environment (e.g., dry, nitrogen atmosphere) and establish a validated shelf-life. |
Problem: Poor sensitivity and high limit of detection in real samples.
| Potential Cause | Solution |
|---|---|
| Signal suppression from the sample matrix. | Dilute the sample or implement a sample preparation step (e.g., filtration, dilution with buffer) to reduce complexity. Use magnetic beads for pre-concentration and separation of the target from the matrix [84]. |
| Non-specific binding (NSB) masking the specific signal. | Incorporate blocking agents (e.g., BSA, casein) during assay development. Use co-polymer coatings like PEG or zwitterionic materials to create non-fouling surfaces [80] [82]. |
| Suboptimal transducer design. | Increase the effective surface area using 3D nanostructures (e.g., metal-organic frameworks, porous graphene, hydrogels) to load more capture probes [81] [11]. |
Problem: Sensor fails during in-vivo or wearable testing.
| Potential Cause | Solution |
|---|---|
| Mechanical failure due to stiffness mismatch with tissue. | Use flexible and stretchable substrates (e.g., polyurethane, PDMS, ultrathin parylene) and conductors (e.g., silver nanowires, conductive polymers) to ensure conformal contact and durability [81] [83]. |
| Biofouling from proteins and cells. | Apply antifouling hydrogels or self-healing polymer coatings that resist protein adsorption [81] [80]. |
| Unstable device-tissue interface causing signal noise. | Design ultrathin (<5 μm) devices that adhere via van der Waals forces and use soft, conductive adhesives like hydrogel electrolytes for stable electrical contact [83]. |
Experimental Protocols for Key Validation Experiments
Protocol 1: Assessing Sensor Reproducibility and Batch-to-Batch Variation
This protocol is designed to quantitatively evaluate the reproducibility of your sensor fabrication process.
1. Objective: To determine the inter-batch and intra-batch coefficient of variation (CV) for the sensor's key performance metrics.
2. Materials:
- Fabricated sensors from at least three independent production batches (n≥5 per batch).
- Standard solution of target analyte at a known concentration within the linear dynamic range.
- Electrochemical workstation (e.g., potentiostat).
- Data analysis software.
3. Methodology:
- Step 1: For each sensor, perform three consecutive measurements in the standard solution using your established detection technique (e.g., DPV, EIS).
- Step 2: Record the output signal (e.g., peak current, charge transfer resistance) for each measurement.
- Step 3: Calculate the average signal and standard deviation for each sensor.
- Step 4: Calculate the intra-batch CV (standard deviation / mean signal for sensors within the same batch).
- Step 5: Calculate the inter-batch CV (standard deviation of the mean signals from each batch / grand mean of all batch means).
4. Acceptance Criterion: For commercial-grade sensors, the inter-batch CV should typically be <10%, and ideally below 5% [84]. A higher CV indicates poor fabrication control.
Protocol 2: Accelerated Shelf-Life Testing for Long-Term Stability
This protocol estimates the sensor's operational stability and storage shelf-life under accelerated conditions.
1. Objective: To evaluate the degradation of sensor performance over time under stressed storage conditions.
2. Materials:
- 30 sensors from a single, validated batch.
- Controlled environment chambers (e.g., for temperature and humidity control).
3. Methodology:
- Step 1: Divide sensors into three groups and store them under different conditions:
- Group A (Control): 4°C, dry, and dark.
- Group B (Accelerated): 37°C, 75% relative humidity.
- Group C (Stress): 45°C, 90% relative humidity.
- Step 2: At predetermined time points (e.g., 1, 2, 4, 8 weeks), retrieve 3 sensors from each group.
- Step 3: Test the retrieved sensors with the standard solution as in Protocol 1.
- Step 4: Plot the normalized sensor response (vs. initial response) against time for each storage condition. Use the Arrhenius equation model to extrapolate shelf-life at recommended storage temperatures.
4. Data Interpretation: A significant drop in signal (>20%) or an increase in CV in Group B or C compared to the control indicates instability. This helps identify if the failure point is in the biorecognition element, the transducer, or the encapsulation [83].
Protocol 3: Evaluating Selectivity in Complex Matrices
This protocol verifies that the sensor can accurately detect the target analyte in the presence of common interferents.
1. Objective: To quantify sensor response to potential interfering substances and calculate selectivity coefficients.
2. Materials:
- Functionalized sensors.
- Standard solution of the target analyte.
- Solutions of potential interferents at physiologically relevant maximum concentrations (e.g., 0.2 mM ascorbic acid, 0.5 mM uric acid, 1 mM glucose, 1 mg/mL BSA).
3. Methodology:
- Step 1: Measure the sensor response for the target analyte standard.
- Step 2: Separately, measure the sensor response for each individual interferent solution.
- Step 3: Measure the sensor response for a mixture containing the target analyte and all interferents.
- Step 4: Calculate the selectivity coefficient (K) using the formula: ( K = (\Delta I{interferent} / C{interferent}) / (\Delta I{target} / C{target}) ), where (\Delta I) is the signal change and (C) is the concentration. A smaller K value indicates better selectivity.
4. Advanced Method: For sensors using ML, train a classification model with data from the target and various interferents to create a "fingerprint" library for robust discrimination [8] [80].
The Scientist's Toolkit: Essential Research Reagent Solutions
| Reagent / Material | Function in Biosensor Development |
|---|---|
| Magnetic Beads (MBs) | Used for pre-concentration and separation of target analytes (e.g., pathogens) from complex samples, reducing matrix effects and improving sensitivity and limit of detection [84]. |
| Molecularly Imprinted Polymers (MIPs) | Synthetic polymer receptors with cavities complementary to a target molecule. They offer a stable, low-cost alternative to antibodies for selective capture, enhancing sensor stability and reducing fabrication cost [80] [82]. |
| Gold Nanoparticles (AuNPs) | Enhance electron transfer and provide a high-surface-area platform for immobilizing biorecognition elements (e.g., thiol-modified aptamers, antibodies), thereby amplifying the electrochemical signal [11]. |
| Conductive Hydrogels | Serve a dual purpose: (1) as a biocompatible, often antifouling interface that minimizes non-specific binding; and (2) as a 3D scaffold that increases the loading capacity for biorecognition elements, boosting sensitivity [81] [82]. |
| Metal-Organic Frameworks (MOFs) | Porous crystalline materials that provide an extremely high surface area for probe immobilization. Their tunable porosity can be used to pre-concentrate analytes and enhance selectivity [11] [80]. |
Workflow and Interference Mitigation Diagrams
Sensor Development and Validation Workflow
Electrochemical Interference Mitigation Pathways
Conclusion
The effective mitigation of electrochemical interference is paramount for the transition of biosensors from research laboratories to clinical and point-of-care settings. A synergistic approach, combining advanced materials with intelligent system design and data analytics, is the key to unlocking unprecedented levels of sensitivity and reliability. Foundational understanding of noise sources informs the strategic selection of nanomaterials and bioreceptors, while AI-driven optimization and multi-mode validation provide robust frameworks for troubleshooting and performance confirmation. Future directions will be shaped by the continued integration of machine learning for real-time adaptive sensing, the development of novel inherently anti-fouling materials, and the pursuit of scalable, multiplexed platforms. These advancements promise to revolutionize personalized medicine by enabling accurate, continuous monitoring of biomarkers in complex physiological environments, ultimately improving patient outcomes through early and precise diagnostics.
References
- 1. : perspective on functional nanomaterials... Electrochemical biosensors [https://biomaterialsres.biomedcentral.com/articles/10.1186/s40824-019-0181-y]
- 2. Engineering signal interfaces for enhanced ... [https://www.sciencedirect.com/science/article/abs/pii/S0165993625001785]
- 3. From Biomarkers to Biosensors: Modern Approaches for ... [https://www.mdpi.com/2079-6374/15/9/603]
- 4. A brief review on methods and materials for electrode ... [https://link.springer.com/article/10.1007/s44373-024-00012-8]
- 5. Low- interference and sensitive electrochemical detection of glucose... [https://pubmed.ncbi.nlm.nih.gov/38246930/]
- 6. sciencedirect.com/topics/engineering/ electrochemical - biosensors [https://www.sciencedirect.com/topics/engineering/electrochemical-biosensors]
- 7. Breakthrough Biosensor Uses Nanomaterials to Detect ... [https://globalbiodefense.com/2025/09/04/breakthrough-biosensor-nanomaterials-dna-detection/]
- 8. Application of Machine Learning to Improve the Accuracy ... [https://www.sciencedirect.com/science/article/abs/pii/S0165993625003371]
- 9. AI-Empowered Electrochemical Sensors for Biomedical ... [https://pubmed.ncbi.nlm.nih.gov/40862948/]
- 10. Biosensors, Artificial Intelligence Biosensors, False Results ... [https://pmc.ncbi.nlm.nih.gov/articles/PMC12025796/]
- 11. Electrochemical biosensors based on the 3D immobilization of ... [https://pubs.rsc.org/en/content/articlehtml/2025/ra/d5ra03744a]
- 12. Biosensors, Volume 15, Issue 9 (September 2025) [https://www.mdpi.com/2079-6374/15/9]
- 13. Effects of Experimental Conditions on the Signaling Fidelity ... [https://pmc.ncbi.nlm.nih.gov/articles/PMC7934090/]
- 14. A guide to reducing noise and increasing sensitivity in ... [https://blog.igii.uk/a-guide-to-reducing-noise-and-increasing-sensitivity-in-biosensors]
- 15. Perspectives on electron transfer kinetics across graphene ... [https://www.nature.com/articles/s41598-025-04357-x]
- 16. A differential strategy to enhance the anti-interference ... [https://www.sciencedirect.com/science/article/abs/pii/S0925400522006190]
- 17. Machine-Learning-Aided Advanced Electrochemical ... [https://pubmed.ncbi.nlm.nih.gov/40489203/]
- 18. Innovative Carbonaceous Materials and Metal/Metal Oxide ... [https://pmc.ncbi.nlm.nih.gov/articles/PMC11642939/]
- 19. 2D MOF structure, electrochemical biosensing in ... [https://www.nature.com/articles/s41699-025-00603-y]
- 20. LMP 91000 trouble shooting for biosensor readers [https://www.zimmerpeacocktech.com/knowledge-base/faq/lmp91000-trouble-shooting/]
- 21. A Review on Electrical Conductivity of Nanoparticle ... [https://pmc.ncbi.nlm.nih.gov/articles/PMC6915432/]
- 22. Nanomaterial Interfaces: From Fundamentals to Applications [https://www.mdpi.com/journal/materials/special_issues/Nanomaterial_Interfaces_From_Fundamentals_to_Applications]
- 23. Electrochemical Sensors and Their Applications: A Review [https://www.mdpi.com/2227-9040/10/9/363]
- 24. Electrochemical Biosensors - Sensor Principles and ... [https://pmc.ncbi.nlm.nih.gov/articles/PMC3663003/]
- 25. MIPs and aptamer-based dual-recognition electrochemical ... [https://www.sciencedirect.com/science/article/pii/S092583882505337X]
- 26. Recent progress on electrochemical (bio)sensors based on ... [https://www.sciencedirect.com/science/article/pii/S266605392200039X]
- 27. Guide to Selecting a Biorecognition Element for Biosensors [https://pmc.ncbi.nlm.nih.gov/articles/PMC6416154/]
- 28. Electrochemical Impedance Spectroscopy-Based Biosensors ... [https://pmc.ncbi.nlm.nih.gov/articles/PMC12293632/]
- 29. 3D biosensors in advanced medical diagnostics of high ... [https://www.sciencedirect.com/science/article/abs/pii/S0956566319300259]
- 30. 3D hydrogel scaffold doped with 2D graphene materials for ... [https://www.sciencedirect.com/science/article/abs/pii/S0956566316302366]
- 31. Innovations in graphene-based electrochemical biosensors in ... [https://pmc.ncbi.nlm.nih.gov/articles/PMC11982133/]
- 32. A novel conductive membrane sensor protection technique ... [https://www.sciencedirect.com/science/article/pii/S2590137023000638]
- 33. Electrochemical biosensors based on the 3D ... [https://pmc.ncbi.nlm.nih.gov/articles/PMC12376872/]
- 34. A Mediated BOD Biosensor Based on Immobilized B. ... [https://www.mdpi.com/1424-8220/17/11/2594]
- 35. Microfluidic Biosensors: Enabling Advanced Disease ... [https://pmc.ncbi.nlm.nih.gov/articles/PMC11945667/]
- 36. Recent advancements in microfluidic-based biosensors for ... [https://www.sciencedirect.com/science/article/pii/S2590137024000530]
- 37. Microfluidics Integrated Biosensors: A Leading Technology ... [https://pmc.ncbi.nlm.nih.gov/articles/PMC4721704/]
- 38. Sensor integration into microfluidic systems: trends and ... [https://www.sciencedirect.com/science/article/pii/S0958166923000885]
- 39. a promising analytical tool for on-site detection of mycotoxins [https://www.nature.com/articles/s41538-025-00444-5]
- 40. Emerging Trends in Microfluidics [https://elveflow.com/microfluidic-reviews/emerging-trends-in-microfluidics/]
- 41. Electrochemical biosensors: The beacon for food safety ... [https://www.sciencedirect.com/science/article/pii/S0308814625005357]
- 42. Interfacial Engineering-Free Microfluidics: Toward a Mild ... [https://www.mdpi.com/2072-666X/16/7/733]
- 43. Electrochemical Aptamer-Based Biosensors for Sepsis ... [https://pmc.ncbi.nlm.nih.gov/articles/PMC12292998/]
- 44. How Noise Benefits AI-generated Image Detection [https://arxiv.org/html/2511.16136v1]
- 45. Machineâ€Learningâ€Aided Advanced Electrochemical ... [https://pmc.ncbi.nlm.nih.gov/articles/PMC12369699/]
- 46. A predictive noise correction methodology for manufacturing ... [https://journalofbigdata.springeropen.com/articles/10.1186/s40537-020-00367-w]
- 47. Machine learning-based prediction and interpretation of ... [https://www.sciencedirect.com/science/article/abs/pii/S0026265X25030048]
- 48. Automated data processing and feature engineering for ... [https://www.sciencedirect.com/science/article/pii/S2949715924000027]
- 49. AI-Enhanced Electrochemical Sensing Systems [https://www.mdpi.com/2079-6374/15/9/565]
- 50. Artificial intelligence−powered electrochemical sensor [https://www.sciencedirect.com/science/article/pii/S2405844024139953]
- 51. Artificial Intelligence in Point-of-Care Biosensing: Challenges ... [https://pmc.ncbi.nlm.nih.gov/articles/PMC11172335/]
- 52. CRISPR-Cas12a-Powered Dual- Mode Biosensor for Ultrasensitive and... [https://pubmed.ncbi.nlm.nih.gov/34281340/]
- 53. A colorimetric, photothermal, and fluorescent triple - mode CRISPR/cas... [https://jnanobiotechnology.biomedcentral.com/articles/10.1186/s12951-023-02262-x]
- 54. An electrochemical, fluorescent, and colorimetric triple ... [https://www.sciencedirect.com/science/article/abs/pii/S0925400524004520]
- 55. Troubleshooting & FAQs [https://www.cygnustechnologies.com/resources/faqs/?srsltid=AfmBOoqvgU6JFFF9ek9PiTod2Zi4fngmRZ_siedGDjjgvMQHd-Xt1ozn]
- 56. Elimination of electrochemical interferences in glucose ... [https://www.sciencedirect.com/science/article/abs/pii/S0165993610000269]
- 57. Polydopamine–polyethylene glycol–albumin antifouling coatings on multiple substrates - Journal of Materials Chemistry B (RSC Publishing) [https://pubs.rsc.org/en/content/articlelanding/2018/tb/c7tb02636f]
- 58. Anti-marine biofouling adhesion performance and mechanism of PDMS fouling-release coating containing PS-PEG hydrogel - ScienceDirect [https://www.sciencedirect.com/science/article/abs/pii/S0025326X23007798]
- 59. Bio-inspired strategies for designing antifouling biomaterials | Biomaterials Research | Full Text [https://biomaterialsres.biomedcentral.com/articles/10.1186/s40824-016-0064-4]
- 60. Nanomaterials as Redox Mediators in Laccase-Based ... [https://pmc.ncbi.nlm.nih.gov/articles/PMC9496325/]
- 61. Multifunctional electrochemical biosensor with “tetrahedral tripodsâ€... [https://pubs.rsc.org/en/content/articlehtml/2021/ra/d1ra02424h]
- 62. Overcoming Major Barriers to Developing Successful Sensors ... [https://pmc.ncbi.nlm.nih.gov/articles/PMC9197978/]
- 63. Catalytic/carrier nanomaterials [https://www.nanobiosensors.org/research/catalyticcarrier-nanomaterials/]
- 64. Recent Advances in Signal to Improve... Amplification [https://pmc.ncbi.nlm.nih.gov/articles/PMC9234564/]
- 65. Products | SPR Biosensors | FAQ [https://www.xantec.com/products/spr_biosensors/faq.php]
- 66. Defect engineering role for sensitivity and selectivity of ... [https://www.sciencedirect.com/science/article/abs/pii/S0039914024018897]
- 67. Recent Advances in Electrochemical Biosensors [https://pmc.ncbi.nlm.nih.gov/articles/PMC8472208/]
- 68. A Comparative Study of Optical Sensing Methods for ... [https://pmc.ncbi.nlm.nih.gov/articles/PMC12251617/]
- 69. AI empowers intelligent chemical sensing systems [https://www.the-innovation.org/article/doi/10.59717/j.xinn-inform.2025.100014]
- 70. Advancing food safety and quality assessment - RSC Publishing [https://pubs.rsc.org/en/content/articlehtml/2025/ay/d5ay00647c]
- 71. Salivary Biomarkers: Toward Future Clinical and ... [https://pmc.ncbi.nlm.nih.gov/articles/PMC3811231/]
- 72. Promising applications of human-derived saliva biomarker ... [https://www.nature.com/articles/s41368-022-00209-w]
- 73. Fundamentals of bio-electrochemical sensing [https://www.sciencedirect.com/science/article/pii/S266682112300073X]
- 74. Improving the reproducibility, accuracy, and stability of an ... [https://www.sciencedirect.com/science/article/abs/pii/S0956566320301081]
- 75. Challenges and perspectives of multi-virus biosensing ... [https://pmc.ncbi.nlm.nih.gov/articles/PMC9868144/]
- 76. Decoding Molecular Network Dynamics in Cells: Advances ... [https://www.mdpi.com/2079-6374/15/9/614]
- 77. Multiplexed experimental strategies for fragment library ... [https://www.sciencedirect.com/science/article/pii/S2472555223000679]
- 78. Multiplexed immunosensors for point-of-care diagnostic ... [https://www.sciencedirect.com/science/article/pii/S0956566322000902]
- 79. Nanometre-Scale Biosensors Revolutionizing Applications ... [https://pmc.ncbi.nlm.nih.gov/articles/PMC10669404/]
- 80. and Taste-Based Biosensors: Moving Towards Integrated, ... [https://www.mdpi.com/1424-8220/25/22/7000]
- 81. Advances in materials for wearable biosensors [https://www.sciencedirect.com/science/article/abs/pii/S1877117325000754]
- 82. Polymer-Based Electrochemical Sensors for the Diagnosis of ... [https://pmc.ncbi.nlm.nih.gov/articles/PMC12106273/]
- 83. Materials strategy and device fabrication for stable closed ... [https://www.nature.com/articles/s44328-025-00045-y]
- 84. A Cost-Effective and Rapid Manufacturing Approach for ... [https://pmc.ncbi.nlm.nih.gov/articles/PMC11944730/]