Optimizing Biosensor Fabrication for Maximum Specificity: Advanced Materials, Methodologies, and Machine Learning
This article provides a comprehensive guide for researchers and drug development professionals on optimizing biosensor fabrication to achieve maximum specificity, a critical parameter for clinical diagnostics and biomedical research.
Optimizing Biosensor Fabrication for Maximum Specificity: Advanced Materials, Methodologies, and Machine Learning
Abstract
This article provides a comprehensive guide for researchers and drug development professionals on optimizing biosensor fabrication to achieve maximum specificity, a critical parameter for clinical diagnostics and biomedical research. It explores foundational principles of biorecognition and signal transduction, details advanced fabrication methodologies and novel materials like graphene and MXenes, and presents systematic troubleshooting and optimization strategies, including the use of machine learning. The content further covers rigorous validation protocols and comparative analysis of different biosensor configurations, offering a holistic framework for developing highly specific biosensing platforms for applications in precision medicine, point-of-care testing, and therapeutic monitoring.
Core Principles and Recognition Elements for High-Specificity Biosensing
The specificity of a biosensor is fundamentally determined by the selective interaction between its bioreceptor and the target analyte [1]. This biorecognition event is the critical first step in biosensor operation, initiating a process that ultimately generates a measurable signal proportional to the analyte concentration [2]. The fundamental principle can be represented by the following equation:
Analyte + Bioreceptor ⇌ Analyte-Bioreceptor Complex → Signal [1]
Achieving high specificity is paramount for developing reliable biosensors for complex applications in clinical diagnostics, environmental monitoring, and food safety, where distinguishing between structurally similar compounds is essential [3] [4]. The binding affinity and kinetic parameters of this interaction directly govern the biosensor's performance, including its detection limit, dynamic range, and selectivity against potential interferents [2]. Within the broader context of optimizing biosensor fabrication, engineering and immobilizing the bioreceptor to preserve its native binding capabilities is therefore a primary research focus [4].
Core Components Governing Specificity
A biosensor is an integrated receptor-transducer device that converts a biological response into an analyzable signal [2]. The components most critical to specificity are the analyte and the bioreceptor, which participate in the biorecognition event, and the transducer, which converts this event into a measurable signal [1] [2].
Table 1: Core Biosensor Components Involved in Specificity
| Component | Description | Role in Specificity |
|---|---|---|
| Analyte | The substance of interest that is detected (e.g., glucose, pathogen, toxin) [2]. | The target whose unique structural features are recognized by the bioreceptor. |
| Bioreceptor | A biological molecule that recognizes the target analyte (e.g., enzyme, antibody, nucleic acid) [1] [2]. | Provides the binding site with high affinity and selectivity for the target analyte. |
| Transducer | Converts the biorecognition event into a measurable signal (e.g., electrochemical, optical) [1] [3]. | Must faithfully transduce the specific binding event without significant background noise. |
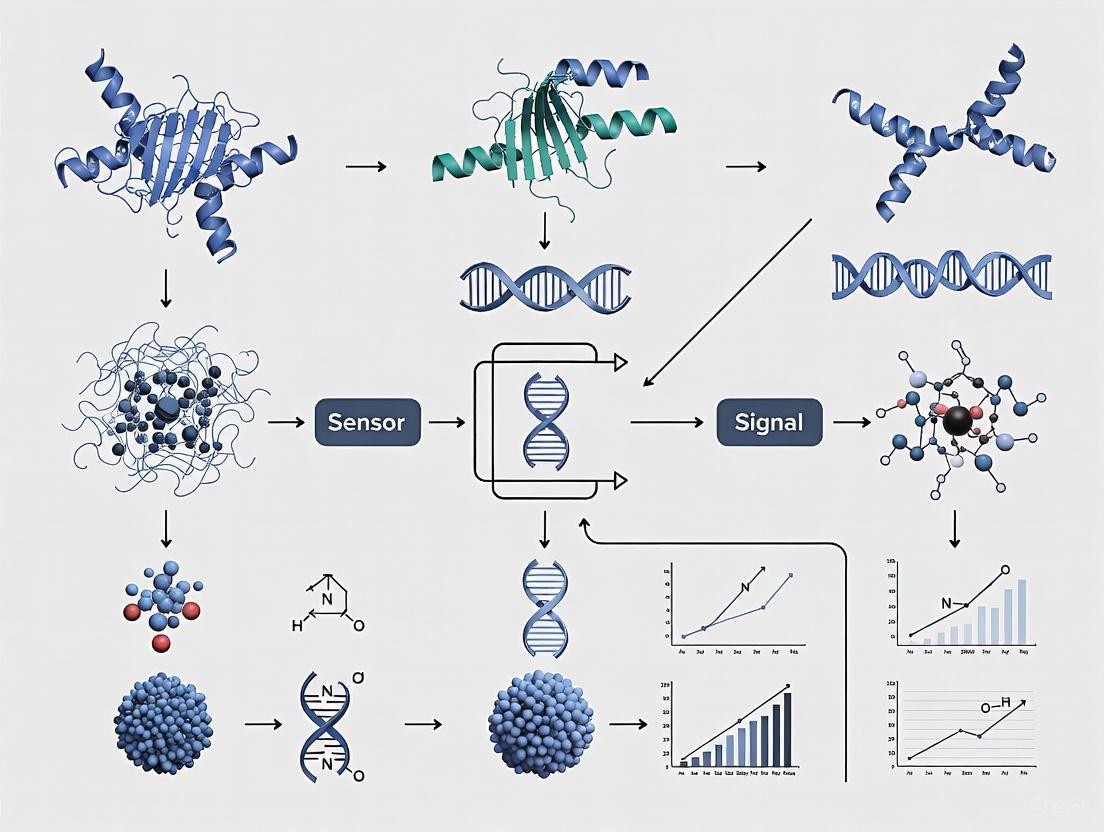
The design of a typical biosensor, highlighting the flow of information from analyte binding to signal output, is illustrated below.
Bioreceptor Types and Their Specificity Mechanisms
Bioreceptors can be classified into several major types, each with a distinct mechanism for achieving specificity [1] [3].
Enzymes as Bioreceptors
Enzymes are catalytic proteins that recognize specific substrates. Their specificity arises from the complementary three-dimensional structure of the active site, which binds the target substrate with high selectivity [1] [3]. The subsequent catalytic conversion of the substrate into a product provides the basis for the signal generation, as seen in the classic glucose biosensor using the enzyme glucose oxidase [1] [3].
Antibodies as Bioreceptors
Antibodies (immunosensors) are proteins generated by the immune system that possess exceptional specificity for a unique epitope on an antigen (the analyte) [1] [3] [4]. The strength of the antibody-antigen interaction (affinity) is a key determinant of biosensor sensitivity and specificity. Antibodies are widely used for detecting proteins, viruses, and whole bacterial cells [4].
Nucleic Acids as Bioreceptors
DNA or RNA probes function as bioreceptors through the principle of complementary base pairing (hybridization) [1] [3]. A single-stranded nucleic acid probe is immobilized on the sensor surface and selectively binds to its complementary target sequence, allowing for the detection of specific genetic markers or pathogens [3] [4].
Other Bioreceptors
Other bioreceptors include whole cells (which respond to analytes via integrated cellular pathways), aptamers (synthetic single-stranded DNA or RNA molecules that bind targets with high affinity), and biomimetic receptors like molecularly imprinted polymers (MIPs), which are synthetic polymers with tailor-made cavities for specific analyte recognition [3] [4].
Table 2: Comparison of Bioreceptor Types for Specificity
| Bioreceptor | Mechanism of Specificity | Key Advantage | Key Limitation |
|---|---|---|---|
| Enzyme | Lock-and-key fit in the active site; catalytic reaction [3]. | High specificity and catalytic signal amplification. | Limited to specific reactions; sensitivity to environmental conditions [3]. |
| Antibody | High-affinity binding to a specific antigenic epitope [3] [4]. | Exceptional specificity; wide range of available targets. | Costly production; potential for cross-reactivity with similar epitopes [3]. |
| Nucleic Acid | Watson-Crick base pairing with a complementary sequence [3]. | High specificity; ability to detect SNPs and genetic variations. | Requires knowledge of target sequence; susceptible to nuclease degradation [3]. |
| Aptamer | Folding into a 3D structure that binds the target with high affinity. | Chemical stability, in vitro selection, and modifiability. | Selection process can be complex; potential for nonspecific binding. |
| Molecularly Imprinted Polymer (MIP) | Size, shape, and functional group complementarity in a synthetic cavity [3] [4]. | High physical/chemical stability; simple synthesis. | Can have lower binding affinity and selectivity compared to biological receptors [3]. |
Experimental Protocol: Assessing Bioreceptor-Analyte Binding Kinetics
This protocol details the use of Surface Plasmon Resonance (SPR) to characterize the binding kinetics between an immobilized antibody (bioreceptor) and its soluble antigen (analyte). SPR is a label-free technique that provides real-time data on binding specificity, affinity, and rates.
Materials and Reagents
Table 3: Research Reagent Solutions for Binding Kinetics Assay
| Item | Function/Description |
|---|---|
| SPR Instrument | Optical biosensor platform to monitor biomolecular interactions in real-time. |
| Sensor Chip (CM5) | Gold surface with a carboxymethylated dextran matrix for ligand immobilization. |
| Anti-Target Antibody | The purified bioreceptor to be immobilized on the sensor chip. |
| Target Antigen | The analyte for binding characterization; prepare a dilution series. |
| Running Buffer (e.g., HBS-EP) | Provides a consistent chemical environment (pH, ionic strength). |
| Amine Coupling Kit | Contains N-ethyl-N'-(3-dimethylaminopropyl)carbodiimide (EDC), N-hydroxysuccinimide (NHS), and ethanolamine HCl for covalent immobilization. |
Step-by-Step Procedure
Step 1: Surface Activation
- Dock the CM5 sensor chip in the SPR instrument.
- Prime the system with running buffer at a continuous flow rate (e.g., 10 µL/min).
- Inject a 1:1 mixture of EDC and NHS (from the amine coupling kit) for 7 minutes to activate the carboxyl groups on the dextran matrix, forming reactive ester groups.
Step 2: Ligand Immobilization
- Dilute the anti-target antibody in sodium acetate buffer (pH 5.0) to a concentration of 10-50 µg/mL.
- Inject the antibody solution over the activated surface for 5-10 minutes. The primary amines on the antibody will covalently couple to the activated matrix.
- Inject ethanolamine HCl for 7 minutes to deactivate and block any remaining activated ester groups.
Step 3: Data Acquisition (Binding Kinetics)
- Set the instrument temperature to 25°C.
- Prepare a series of antigen concentrations (e.g., 0, 3.125, 6.25, 12.5, 25, 50 nM) in running buffer.
- Program an automated cycle for each analyte concentration:
- Association Phase: Inject the antigen for 3-5 minutes to monitor binding.
- Dissociation Phase: Switch back to running buffer for 5-10 minutes to monitor complex dissociation.
- Regeneration: Inject a brief pulse (30 seconds) of a regeneration solution (e.g., 10 mM Glycine-HCl, pH 2.0) to remove all bound antigen without damaging the immobilized antibody.
Step 4: Data Analysis
- Subtract the signal from a reference flow cell (activated and blocked, but no antibody immobilized) to correct for bulk refractive index changes and non-specific binding.
- Fit the corrected, real-time sensorgram data to a 1:1 Langmuir binding model using the instrument's software to determine the association rate constant (ka), dissociation rate constant (kd), and the overall equilibrium dissociation constant (KD = kd/ka).
The experimental workflow for this protocol is summarized in the following diagram.
Transduction Methods for Monitoring Specific Interactions
The specific biorecognition event must be transduced into a quantifiable signal. The choice of transducer is critical for the overall performance of the biosensor [1] [3].
Table 4: Transduction Principles and Their Application to Specificity
| Transducer Type | Principle | How Specificity is Confirmed |
|---|---|---|
| Electrochemical | Measures changes in electrical properties (current, potential, impedance) due to the biorecognition event [1] [3] [4]. | Specific binding causes a change in interfacial electron transfer, which is measured against a control. |
| Optical (e.g., SPR, Fluorescence) | Measures changes in light properties (e.g., refractive index, wavelength, intensity) [1] [3]. | Real-time monitoring of binding; specific binding shows a characteristic association/dissociation curve. |
| Piezoelectric | Measures changes in the resonance frequency of a crystal due to mass change upon analyte binding [1]. | A frequency shift is directly linked to mass loading from the specific binding of the analyte. |
| Thermal | Measures the change in enthalpy (heat) from the biochemical reaction [1] [3]. | The specific binding event is exothermic or endothermic, producing a unique thermal signature. |
The foundation of biosensor specificity lies in the robust and selective interaction between the bioreceptor and its target analyte. A deep understanding of the kinetics and thermodynamics of this interaction is essential for researchers and engineers aiming to optimize biosensor fabrication. By systematically selecting the appropriate bioreceptor, carefully immobilizing it to preserve function, and employing precise transduction methods, it is possible to develop highly specific biosensors. These devices are crucial for advancing applications in drug development, clinical diagnostics, and environmental monitoring, where distinguishing target molecules in complex mixtures is paramount.
The performance of a biosensor is fundamentally dictated by the specificity and affinity of its biorecognition element. These biological molecules are responsible for the selective binding of the target analyte, forming the critical first step in the sensing mechanism. Within the context of optimizing biosensor fabrication for maximum specificity, the choice between antibodies, aptamers, and enzymes is paramount. Antibodies, with their well-established role in diagnostics, offer high specificity but present challenges in stability and production. Aptamers, as synthetic alternatives, provide superior stability and design flexibility, enabling the development of robust and reusable sensors. Enzymes, prized for their catalytic activity, facilitate the conversion of the recognition event into an amplifiable signal. This application note provides a detailed comparison of these biorecognition elements and outlines standardized protocols for their integration into biosensing platforms, with a specific focus on enhancing analytical specificity for research and drug development applications.
Comparative Analysis of Biorecognition Elements
The selection of an appropriate biorecognition element is a critical first step in biosensor design, directly impacting the sensor's sensitivity, specificity, stability, and practical applicability. Table 1 provides a quantitative comparison of the key characteristics of antibodies, aptamers, and enzymes.
Table 1: Comparative Properties of Biorecognition Elements
| Property | Antibodies | Aptamers | Enzymes |
|---|---|---|---|
| Biochemical Nature | Proteins (Immunoglobulins) | Single-stranded DNA or RNA | Proteins |
| Molecular Size | ~150 kDa [5] [6] | ~15 kDa (5-10 times smaller than antibodies) [5] | Varies (e.g., Glucose Oxidase ~160 kDa) |
| Binding Affinity | Nanomolar range [5] | 1–1000 nM [5] | Defined by Michaelis-Menten constant (KM) |
| Target Range | Primarily immunogenic molecules [5] | Broad (ions, small molecules, proteins, cells) [7] [5] | Specific substrates and cofactors |
| Production Method | In vivo (animals) or in vitro (phage display) [5] [6] | In vitro (SELEX) [7] [8] | Microbial fermentation, extraction from tissues |
| Batch-to-Batch Variability | High (biologically derived) [5] | Negligible (chemically synthesized) [5] | Can be significant |
| Stability | Sensitive to temperature, pH; irreversible denaturation [5] | Thermally stable; can renature after denaturation [5] | Varies; generally sensitive to harsh conditions |
| Optimal pH Range | 5.0 - 9.0 [5] | DNA: 5.0 - 9.0; RNA: 6.0 - 8.5 [5] | Narrow, activity-specific range |
| Thermal Denaturation Point | 60–75 °C [5] | DNA: 40–80 °C; RNA: 40–70 °C [5] | Varies; often denatures below 70°C |
| Modification & Labeling | Limited, can affect binding [5] | Highly customizable (e.g., redox labels, thiol groups) [5] [8] | Can be engineered, but may affect activity |
| Typical Biosensor Role | Capture probe (Immunosensor) [6] | Capture probe and/or signal transducer (Aptasensor) [9] | Biological catalyst (Catalytic biosensor) |
Key Selection Criteria for Maximum Specificity
- Antibodies are the "gold standard" for specificity against immunogenic targets, making them ideal for clinical diagnostics where a vast library of validated antibodies exists. Their primary limitations include sensitivity to environmental conditions and the cold chain requirement for storage and shipping [5] [6].
- Aptamers excel in applications requiring detection of small molecules, toxins, or non-immunogenic targets. Their chemical synthesis ensures minimal batch-to-batch variation, and their small size allows for high-density immobilization on sensor surfaces, potentially increasing sensitivity. A significant advantage for electrochemical biosensors is their ability to be engineered to undergo conformational changes upon target binding, enabling reagentless, real-time detection [5] [9].
- Enzymes are indispensable for catalytic biosensors, where the signal is generated from the turnover of a substrate. They are key in detecting metabolites like glucose and lactate. Their specificity is high for their substrate, but they are generally not used for direct binding to a wide range of non-substrate analytes unlike antibodies and aptamers.
Application Notes & Experimental Protocols
Protocol 1: Aptamer Selection via Magnetic Bead-Based SELEX
This protocol describes the selection of single-stranded DNA (ssDNA) aptamers using magnetic bead-based SELEX (Systematic Evolution of Ligands by EXponential Enrichment), a widely used method for generating high-affinity aptamers against specific targets [7] [8].
Principle: A random ssDNA library is incubated with target molecules immobilized on magnetic beads. Bound sequences are separated from unbound ones using a magnetic field, eluted, and amplified by PCR. This iterative process enriches the pool with sequences having high affinity and specificity for the target.
Workflow Diagram: Magnetic Bead-Based SELEX
Materials:
- NHS-activated Magnetic Beads: Solid support for covalent target immobilization.
- Target Molecule (e.g., Paclitaxel, Leucovorin): The analyte for which an aptamer is desired.
- Random ssDNA Library: A diverse pool of ~10^14 unique sequences, typically 40-80 bases long with fixed primer regions.
- Binding Buffer (BB): Typically containing salts (e.g., NaCl, MgClâ‚‚) and buffering agents (e.g., Tris, HEPES) to promote binding.
- PCR Reagents: Taq polymerase, dNTPs, forward and reverse primers.
- Magnetic Separation Rack: For efficient partitioning of bead-bound complexes.
Step-by-Step Procedure:
- Target Immobilization: Covalently conjugate the target molecule (e.g., 1 mg/mL) to NHS-activated magnetic beads according to the manufacturer's protocol. Block any remaining active sites to prevent non-specific binding [8].
- Library Preparation: Denature the ssDNA library (e.g., 300 nmol) by heating to 90°C for 5-10 minutes, then rapidly cool on ice (4°C for 10 min) to allow proper folding. Equilibrate to room temperature for 5 minutes [8].
- Incubation and Binding: Incub the pre-folded ssDNA library with the target-conjugated beads in binding buffer for 1-2 hours under gentle rotation at room temperature [8].
- Partitioning and Washing: Place the tube in a magnetic rack to separate the beads. Carefully discard the supernatant containing unbound sequences. Wash the beads 3-5 times with binding buffer to remove weakly bound sequences [7] [8].
- Elution: Elute the specifically bound ssDNA by adding a small volume of elution buffer (e.g., 90°C TE buffer) and incubating for 10 minutes. Separate the eluate containing the bound sequences using the magnetic rack [8].
- Amplification: Amplify the eluted ssDNA by PCR using primers complementary to the fixed regions of the library. For DNA aptamers, this generates double-stranded DNA (dsDNA). For RNA aptamers, reverse transcription is required [7].
- ssDNA Regeneration: Purify the PCR product and generate ssDNA for the next selection round. This can be achieved via strand separation using streptavidin-coated beads (if a biotinylated primer was used) or asymmetric PCR [7].
- Counter-Selection (Negative Selection): Introduce counter-selection rounds after a few positive selection cycles. Incubate the enriched pool with "blank" beads (without target) or with related non-target molecules. Collect the unbound sequences to eliminate binders to the support matrix or non-target analytes [7] [8].
- Monitoring and Completion: Monitor the enrichment of binding sequences after each round, for example, by measuring the amount of recovered DNA. Typically, after 8-15 rounds, the pool is sufficiently enriched. The final pool is cloned, sequenced, and the resulting individual aptamer candidates are tested for affinity (Kd) and specificity [8].
Protocol 2: Fabrication of an Electrochemical Aptasensor
This protocol details the development of a "signal-on" electrochemical aptasensor (E-AB sensor) for the detection of a small molecule drug, such as a chemotherapeutic agent [9] [8].
Principle: A thiolated aptamer is immobilized on a gold electrode surface and labeled with a redox tag (e.g., Methylene Blue). In the absence of the target, the aptamer is flexible, keeping the tag distant from the electrode, resulting in a low electron transfer rate (low current). Upon target binding, the aptamer undergoes a conformational change that brings the redox tag closer to the electrode surface, facilitating electron transfer and producing a measurable increase in current ("signal-on") [5] [9].
Workflow Diagram: Electrochemical Aptasensor Operation
Materials:
- Screen-Printed Gold Electrodes (SPGEs): Disposable, cost-effective sensor platforms.
- Thiol-Modified Aptamer: The ssDNA aptamer, selected via SELEX, modified at the 5' or 3' end with a thiol (-SH) group.
- Redox Tag (e.g., Methylene Blue): A molecule that undergoes reversible reduction/oxidation, attached to the aptamer.
- Mercaptohexanol (MCH): A short-chain alkanethiol used to passivate the gold surface and create a well-oriented aptamer monolayer.
- Electrochemical Cell and Potentiostat: Instrumentation for performing electrochemical measurements.
- Binding Buffer (PBS, pH 7.4): Physiologically compatible buffer for the binding reaction.
Step-by-Step Procedure:
- Electrode Pretreatment: Clean the gold working electrode of the SPGE electrochemically (e.g., by cyclic voltammetry in sulfuric acid) or via plasma cleaning to ensure a clean, reproducible surface.
- Aptamer Immobilization: Incubate the gold electrode surface with a solution (e.g., 10 µL) of the thiolated aptamer (e.g., 1 µM) overnight at 4°C in a humidified chamber. This allows the formation of a stable Au-S bond, covalently tethering the aptamer to the electrode [8].
- Surface Passivation: Rinse the electrode with buffer to remove loosely bound aptamers. Subsequently, incubate the electrode with 1 mM MCH for 30-60 minutes at room temperature. MCH backfills the gold surface, displaces non-specifically adsorbed aptamers, and forces the remaining aptamers into an upright orientation, which minimizes non-specific adsorption and improves binding efficiency [8].
- Baseline Measurement: Wash the functionalized aptasensor with buffer. Place it in an electrochemical cell containing only the binding buffer. Perform electrochemical measurements, such as Electrochemical Impedance Spectroscopy (EIS) or Cyclic Voltammetry (CV), to record the baseline signal (current or charge transfer resistance) [9].
- Target Detection: Incubate the aptasensor with a sample solution containing the target analyte (e.g., Paclitaxel) for a defined period (e.g., 15-30 minutes) to allow binding and conformational switching.
- Signal Measurement: Wash the sensor gently and perform the same electrochemical measurement in a clean buffer. The change in signal (e.g., increase in current in a "signal-on" sensor) is recorded.
- Calibration and Quantification: The magnitude of the signal change is correlated with the target concentration. A calibration curve is constructed using standard solutions of known concentration, enabling the quantification of the target in unknown samples [8].
The Scientist's Toolkit: Research Reagent Solutions
Table 2 lists key reagents and materials essential for the experiments described in these protocols.
Table 2: Essential Research Reagents and Materials
| Item | Function/Application | Example/Brief Explanation |
|---|---|---|
| NHS-activated Sepharose/Magnetic Beads | Solid support for target immobilization during SELEX. | Enables covalent coupling of target proteins or small molecules via primary amines for partitioning [7] [8]. |
| Thiol-Modified Oligonucleotides | Covalent immobilization of aptamers on gold surfaces. | The thiol group (-SH) forms a stable gold-sulfur (Au-S) bond, essential for creating stable aptasensors [8]. |
| Screen-Printed Electrodes (Gold, Carbon) | Disposable, miniaturized electrochemical sensor platforms. | Provide a cost-effective and reproducible base for developing electrochemical biosensors; ideal for prototyping [8]. |
| Mercaptohexanol (MCH) | Surface passivation agent. | Backfills gold surfaces after aptamer immobilization to create a well-ordered monolayer, reducing non-specific binding and improving aptamer orientation [8]. |
| Redox Reporters (Methylene Blue, Ferrocene) | Electroactive labels for signal transduction. | Tagged on aptamers; a change in their proximity to the electrode surface upon target binding generates the measurable electrochemical signal [5] [9]. |
| Systematic Evolution of Ligands by EXponential Enrichment (SELEX) | In vitro selection process for aptamer discovery. | A method to isolate high-affinity nucleic acid binders from a vast random sequence library against a specific target [7] [5]. |
| Phaeosphaone D | Phaeosphaone D, MF:C20H27N3O3S2, MW:421.6 g/mol | Chemical Reagent |
| D-Lyxose-13C-3 | D-Lyxose-13C-3, MF:C5H10O5, MW:151.12 g/mol | Chemical Reagent |
Biosensors are analytical devices that convert a biological response into a quantifiable and processable signal [10]. They are comprised of two main components: a bio-receptor that specifically binds to the target analyte (e.g., enzymes, antibodies, nucleic acids) and a transducer, which converts the biological recognition event into a measurable output signal [11] [10]. The transducer is a pivotal element, defining the fundamental classification, functionality, and compatibility of the biosensor, especially in wearable applications [11]. The collaboration between suitable bio-receptors and efficient signal conversion mechanisms enables the detection of a wide range of analytes from bodily fluids and the measurement of vital signs, thereby playing a crucial role in clinical diagnostics, environmental monitoring, and personal health tracking [11] [10].
This document details the operating principles, experimental protocols, and key optimization strategies for three major transducer platforms: electrochemical, optical, and surface plasmon resonance (SPR). The content is framed within a broader thesis on optimizing biosensor fabrication for maximum specificity, providing researchers and drug development professionals with practical application notes and methodologies.
Electrochemical Transduction Platforms
Platform Principles and Applications
Electrochemical biosensors, the first to be scientifically proposed and successfully commercialized, utilize electrodes to recognize and quantify alterations in the electrical characteristics of a biological sample following a biorecognition event [12] [11] [10]. The signal transduction occurs via a bio-electrochemical component that serves as the main transduction element, making these sensors robust, easily miniaturized, and capable of excellent detection limits even with small analyte volumes [10]. They are particularly advantageous for point-of-care testing due to their close link to low-cost microelectronic production [10].
The detection is typically based on an enzyme system that catalytically converts analytes into products that can be oxidized or reduced at a working electrode [10] [13]. These sensors are traditionally categorized based on the measured electrical property:
- Amperometric: Measures current generated by a redox reaction at the working electrode (held at a constant potential) [10].
- Potentiometric: Measures the accumulation of charge or potential difference between the working and reference electrodes when zero or negligible current flows between them [10].
- Impedimetric: Measures the impedance (both resistance and reactance) of a system, often to monitor binding events that alter the conductive properties at the electrode interface [10].
- Field-Effect Transistor (FET)-Based: Uses transistor technology where the potentiometric effect at a gate electrode modulates the current flow through the transistor channel [10].
A recent breakthrough demonstrates the significant enhancement of electrochemical signal amplification using Organic Electrochemical Transistors (OECTs). This method electronically couples enzymatic or microbial fuel cells with OECTs, amplifying weak electrical signals by three orders of magnitude (factors of 1,000 to 7,000) and improving the signal-to-noise ratio [14]. This approach overcomes challenges of direct biomolecule-sensor integration and opens doors for highly sensitive, low-power biosensors for applications like arsenite detection in water and lactate sensing in sweat [14].
Table 1: Key Performance Metrics for Electrochemical Transducers
| Transducer Type | Measured Quantity | Typical Applications | Key Advantages |
|---|---|---|---|
| Amperometric | Current from redox reaction | Glucose monitoring, neurotransmitter detection | High sensitivity, well-established protocols |
| Potentiometric | Potential / charge accumulation | pH sensing, ion detection (Kâº, Naâº) | Simple instrumentation, wide dynamic range |
| Impedimetric | Impedance (Resistance & Reactance) | Pathogen detection, protein binding studies | Label-free, real-time kinetic evaluation |
| FET-Based | Modulated channel current | DNA hybridization, virus detection | Ease of miniaturization, high sensitivity |
| OECT-Amplified | Amplified current | Ultrasensitive medical diagnostics, environmental monitors (e.g., arsenite) | Extreme signal amplification (1000-7000x), low power, low noise [14] |
Experimental Protocol: Fabrication and Measurement of an OECT-Amplified Biosensor
This protocol details the methodology for creating a highly sensitive biosensor by integrating a microbial fuel cell with an Organic Electrochanical Transistor (OECT), based on recent research [14].
Research Reagent Solutions and Materials
Table 2: Essential Materials for OECT-Amplified Biosensor
| Item Name | Function / Explanation |
|---|---|
| Organic Electrochemical Transistor (OECT) | Thin-film transistor acting as the signal amplifier; operates in aqueous environments with high sensitivity and low-voltage [14]. |
| Microbial Fuel Cell | Contains electroactive bacteria (e.g., engineered E. coli); metabolizes organic substrates to produce a current proportional to the target analyte [14]. |
| Electroactive Bacteria (e.g., engineered E. coli) | Biological recognition element. Can be engineered with specific responsive pathways (e.g., for arsenite) to generate electrical signals upon analyte presence [14]. |
| Channel Polymer Material (e.g., PEDOT:PSS) | Conductive polymer forming the OECT channel. Its properties are crucial for transistor performance and amplification efficiency [14]. |
| Phosphate Buffered Saline (PBS) or Synthetic Sweat | Electrolyte solution providing a stable ionic environment for the fuel cell and OECT operation, mimicking real-world conditions [14]. |
| Potentiostat/Galvanostat | Electronic instrument used to apply potentials and measure the resulting currents from the fuel cell and the OECT. |
| Microfabrication Equipment (e.g., spin coater, mask aligner) | For patterning and fabricating the miniaturized OECT and fuel cell components on a substrate (e.g., glass slide) [14]. |
Step-by-Step Procedure
OECT Fabrication:
- Pattern micro-electrodes (source, drain, gate) onto a glass slide using standard photolithography and metal deposition (e.g., Au) techniques.
- Spin-coat the channel polymer (e.g., PEDOT:PSS) onto the predefined channel area between the source and drain electrodes. Anneal as required to solidify the film.
Microbial Fuel Cell Preparation:
- Culture electroactive bacteria (e.g., Shewanella oneidensis or engineered E. coli) in a suitable growth medium.
- For analyte-specific detection, genetically engineer the bacteria to possess an electron transfer pathway responsive to the target (e.g., an arsenite-responsive promoter driving the expression of electron transfer genes).
- Immobilize the bacteria within the anode chamber of a miniaturized fuel cell.
Electronic Coupling:
- Connect the OECT and the microbial fuel cell in either a cathode-gate or anode-gate configuration using electrical wires. The cathode-gate configuration is recommended for superior amplification and to avoid potential device degradation [14].
- Place the coupled system in a controlled electrolyte environment (e.g., PBS).
Measurement and Data Acquisition:
- Use a potentiostat to apply a constant drain voltage (VD) to the OECT.
- The gate voltage (VG) is effectively defined by the potential generated by the microbial fuel cell.
- Introduce the target analyte (e.g., glucose, lactate, arsenite) to the microbial fuel cell chamber.
- The bacterial metabolism or specific response to the analyte will generate a current in the fuel cell. This small change modulates VG, causing a large, amplified change in the OECT's drain current (ID).
- Record the time-dependent change in ID
Optical Transduction Platforms
Platform Principles and Applications
Optical biosensors are a powerful class of sensors that use light as the transduction medium to detect the interaction between a biological recognition element and the target analyte [12] [13]. They are known for their high specificity, sensitivity, and capability for direct, real-time, and label-free detection [13]. The detection typically relies on measuring changes in optical properties such as absorbance, luminescence, fluorescence, polarization, or refractive index induced by the biorecognition event [13].
The first stage of optical transduction involves a chemical interaction between the analyte and an indicator phase to produce an optically detectable signal [15]. This interaction can take several forms:
- Direct Indicators: Reversible binding of the analyte to an indicator, commonly used in optical pH sensors [15].
- Integrating Reagents: Irreversible reaction with the analyte, requiring measurement of the product formation rate [15].
- Catalysis by Immobilized Enzymes: A steady-state measurement of an optically detectable substrate or product [15].
- Antibody-Based Recognition: High selectivity using competitive binding assays, though often with longer response times [15].
A prominent subtype is the nanomechanical optical biosensor, which uses a microcantilever. When molecules bind to one side of the cantilever, the induced differential surface stress causes a measurable deflection, which is typically detected by a reflected laser beam [13]. Another significant category is optical fiber sensors, where the indicator phase is often immobilized on the fiber, and the evanescent field is used for sensing [15].
Table 3: Key Performance Metrics for Optical Transducers
| Transducer Type | Measured Optical Property | Typical Applications | Key Advantages |
|---|---|---|---|
| Direct Indicator-Based | Absorbance, Fluorescence | pH sensing, ion concentration (Kâº, Naâº) | Continuous measurements, reversible |
| Fluorescence-Based | Fluorescence Intensity / Quenching | Oxygen sensing, immunoassays | Very high sensitivity |
| Fiber Optic | Change in Evanescent Wave / Refractive Index | In-vivo physiological monitoring (pH, pOâ‚‚) | Miniaturization, safe for in-vivo use [15] |
| Nanomechanical (Microcantilever) | Deflection of a laser beam (Surface Stress) | Label-free DNA hybridization, protein recognition | Extreme sensitivity (femtomolar), real-time, label-free [13] |
Experimental Protocol: Fabrication of a Fluorescence-Based Optical Fiber pH Sensor
This protocol outlines the steps for creating a common optical biosensor: a fluorescence-based pH probe using an optical fiber [15].
Research Reagent Solutions and Materials
Table 4: Essential Materials for Optical Fiber pH Sensor
| Item Name | Function / Explanation |
|---|---|
| Optical Fiber | Waveguide that transmits light to and from the sensing region. |
| Fluorescent pH Indicator Dye | The chemical indicator whose fluorescence properties (intensity or wavelength) change with pH [15]. |
| Polymer Matrix (e.g., porous polymer film) | A substrate for immobilizing the indicator dye on the fiber tip, permeable to H⺠ions but not to the indicator [15]. |
| Covalent Coupling Agents (e.g., silanes) | Used to chemically bond the indicator dye to the polymer matrix or directly to the fiber tip to prevent leaching [15]. |
| Fluorescence Spectrophotometer | Instrument containing a light source to excite the dye and a detector to measure the emitted fluorescence intensity. |
| Flow Cell or Sample Chamber | A holder that fixes the sensor probe in place during measurement in the sample solution. |
Step-by-Step Procedure
Fiber Tip Preparation:
- Carefully cleave the end of an optical fiber to ensure a smooth, clean surface.
- Clean the fiber tip with suitable solvents (e.g., acetone, ethanol) and treat it with an oxygen plasma to create reactive hydroxyl groups on the surface.
Indicator Immobilization:
- Covalently immobilize the fluorescent pH indicator dye to the fiber tip. This can be achieved by:
- Silanizing the fiber tip with a reagent like 3-aminopropyltriethoxysilane (APTES).
- Subsequently reacting the amine-functionalized surface with an NHS-ester derivative of the fluorescent dye.
- Alternatively, the dye can be physically entrapped within a porous polymer film (e.g., polyacrylamide) that is then coated onto the fiber tip [15].
- Covalently immobilize the fluorescent pH indicator dye to the fiber tip. This can be achieved by:
Sensor Calibration:
- Connect the prepared sensor probe to the fluorescence spectrophotometer.
- Immerse the sensor tip in a series of standard buffer solutions with known pH values (e.g., from pH 6.0 to 8.5).
- For each buffer, record the fluorescence emission intensity at the characteristic wavelength upon excitation.
- Plot the fluorescence intensity versus pH to create a calibration curve.
Sample Measurement:
- Place the sensor probe into the unknown sample solution.
- Measure the fluorescence intensity under the same conditions used for calibration.
- Determine the pH of the sample by comparing the measured fluorescence intensity to the calibration curve.
Surface Plasmon Resonance (SPR) Platforms
Platform Principles and Applications
Surface Plasmon Resonance (SPR) biosensors are a highly sensitive and prominent class of optical biosensors that have emerged as a leading technology for label-free, real-time monitoring of biomolecular interactions [16] [17]. They function by detecting changes in the refractive index at the surface of a thin metal film (typically gold) upon binding of a target analyte to an immobilized biorecognition element [16]. The core principle involves the excitation of surface plasmons—collective oscillations of electrons at the metal-dielectric interface—by incident light at a specific angle. The binding of analyte molecules to the sensor surface alters the refractive index, leading to a shift in this resonance angle or wavelength, which is measured in real-time [16].
SPR sensors are extensively used to study kinetics, affinity, and specificity of interactions involving proteins, nucleic acids, hormones, cells, and other biomolecules [16]. A significant challenge has been detecting analytes at ultra-low concentrations, down to the single-molecule level. Recent advances employ multi-objective optimization algorithms to concurrently enhance multiple sensing parameters, leading to dramatically improved performance [16] [17]. One such study achieved a 230.22% increase in sensitivity, a 110.94% improvement in the Figure of Merit (FOM), and a 90.85% enhancement in the depth of the resonant dip, culminating in a limit of detection (LOD) as low as 54 ag/mL (0.36 aM) for mouse IgG, enabling single-molecule detection capabilities [16] [17].
Table 5: Key Performance Metrics for SPR Biosensors
| Performance Parameter | Description | Standard Performance | Algorithm-Optimized Performance [16] |
|---|---|---|---|
| Sensitivity (S) | Shift in resonance signal per unit change in refractive index (nm/RIU) | ~7,415 nm/RIU (Baseline in cited study) | 24,482.86 nm/RIU (+230.22%) |
| Figure of Merit (FOM) | Ratio of Sensitivity to Resonance Dip Width (1/RIU) | ~17.41 1/RIU (Baseline) | 36.72 1/RIU (+110.94%) |
| Depth of Resonant Dip (DRD) | The magnitude of the reflectivity minimum | Baseline | +90.85% enhancement |
| Limit of Detection (LOD) | Lowest detectable concentration of analyte | > 1 fg/mL for single molecules | 54 ag/mL (0.36 aM) for mouse IgG |
Experimental Protocol: Algorithm-Assisted Optimization of an SPR Biosensor
This protocol describes a comprehensive method for optimizing the design parameters of a prism-coupled Kretschmann-configuration SPR biosensor using a multi-objective Particle Swarm Optimization (PSO) algorithm [16].
Research Reagent Solutions and Materials
Table 6: Essential Materials for SPR Biosensor Optimization
| Item Name | Function / Explanation |
|---|---|
| SPR Prism Coupler | High-refractive-index prism (e.g., BK7) to couple incident light to the surface plasmons in the metal layer. |
| Metal Deposition System (e.g., e-beam evaporator) | For depositing thin, uniform layers of chromium (adhesive layer) and gold (active plasmonic layer) onto the prism. |
| Optical Setup | Includes a tunable laser light source, polarizer, and a high-resolution angular or spectral detector. |
| Bio-receptor Molecule | The specific capture agent (e.g., antibody, DNA strand) immobilized on the gold surface to bind the target analyte. |
| Particle Swarm Optimization (PSO) Algorithm Software | Custom or commercial software to run the multi-objective optimization algorithm for designing the sensor parameters. |
Step-by-Step Procedure
Define Optimization Objectives and Parameters:
- Set the key performance metrics to be optimized: Sensitivity (S), Figure of Merit (FOM), and Depth of Resonant Dip (DFOM).
- Define the design parameters to be tuned: incident angle, chromium adhesive layer thickness, and gold layer thickness.
Implement the Multi-Objective PSO Algorithm:
- Model the SPR system (prism/Cr/Au/analyte) as a multi-layer structure and use the transfer matrix method to compute its optical characteristics.
- Configure the PSO algorithm to iteratively search for the combination of design parameters (incident angle, Cr thickness, Au thickness) that maximizes the composite fitness function based on S, FOM, and DFOM.
- Run the algorithm for a sufficient number of iterations (e.g., 150) until the fitness function converges to a maximum value [16].
Sensor Fabrication Based on Optimized Parameters:
- Using the optimal parameters provided by the algorithm (e.g., specific Au and Cr thicknesses), fabricate the SPR chip.
- Clean the gold surface of the SPR chip via plasma treatment.
- Functionalize the gold surface by creating a self-assembled monolayer (e.g., using thiol chemistry) and immobilize the bio-receptor (e.g., anti-mouse IgG antibody) onto it.
Performance Validation:
- Set up the SPR instrument with the incident angle fixed at the optimized value.
- Flow a series of known concentrations of the target analyte (e.g., mouse IgG) over the sensor surface.
- Record the sensorgram (resonance shift vs. time) for each concentration.
- Plot the steady-state resonance shift against the logarithm of analyte concentration to establish a calibration curve and determine the Limit of Detection (LOD).
The integration of nanomaterials into biosensing platforms has marked a revolutionary advance in diagnostic technology, primarily by addressing the critical challenge of specificity. Specificity, the ability of a biosensor to selectively identify a target analyte within a complex biological matrix, is paramount for accurate diagnosis, environmental monitoring, and food safety. Traditional biosensors often struggle with cross-reactivity and insufficient selectivity. Nanomaterials such as graphene, carbon nanotubes (CNTs), and metal nanoparticles possess unique physicochemical properties—including an exceptionally high surface-to-volume ratio, tunable surface chemistry, and superior electronic properties—that make them ideal for enhancing specificity. Their functionalization with various biorecognition elements allows for precise molecular interactions, significantly reducing false-positive signals and enabling the detection of biomarkers at ultralow concentrations. This document, framed within a broader thesis on optimizing biosensor fabrication, provides detailed application notes and experimental protocols for employing these nanomaterials to achieve maximum specificity in research settings.
Performance Comparison of Nanomaterial-Enhanced Biosensors
The table below summarizes key performance metrics of biosensors utilizing graphene, carbon nanotubes, and metal nanoparticles, highlighting their role as specificity enhancers.
Table 1: Performance Metrics of Nanomaterial-Based Biosensors for Specificity Enhancement
| Nanomaterial | Target Analyte | Biorecognition Element | Detection Limit | Linear Range | Key Advantage for Specificity |
|---|---|---|---|---|---|
| Graphene (FET) | Ferritin (for anemia) | Anti-ferritin antibodies | Not Specified | Not Specified | Label-free, real-time response in complex saliva samples [18] |
| Graphene (SPR) | Hemoglobin | Not Specified | Not Specified | Not Specified | High-sensitivity, label-free clinical detection in blood [18] |
| CNT-FET | SARS-CoV-2 Spike Protein | Antibodies | Not Specified | Not Specified | Rapid, accurate diagnostics via specific antibody conjugation [19] |
| CNT-FET | Salmonella enterica | Aptamer | Not Specified | Not Specified | High precision for single-pathogen detection [19] |
| Platinum NP (Electrochemical) | Glutamate | Glutamate Oxidase | 0.03 µM | 1–925 µM | Excellent selectivity for neurotransmitters in brain tissue [20] |
| Platinum NP (Electrochemical) | Organophosphorus Pesticides (Malathion) | Acetylcholinesterase (AChE) | 4.9 × 10â»Â¹âµ M | 4.9×10â»Â¹âµ to 1×10â»â¹ M | Specific enzyme inhibition mechanism [20] |
| Gold NP (Optical) | Cancer Biomarkers | Antibodies | Femto- to Picomolar | Not Specified | Strong LSPR enhances sensitivity in colorimetric assays [21] |
Application Notes and Experimental Protocols
Graphene-Based Field-Effect Transistor (FET) Biosensor
Application Note: Graphene's high carrier mobility and large surface area make it an excellent channel material for FET biosensors. Its atomically thin structure is exquisitely sensitive to electrostatic changes induced by the binding of a target biomolecule to a functionalized surface, enabling label-free, highly specific detection. This protocol details the fabrication of a GFET for the detection of ferritin in saliva, a non-invasive method for diagnosing iron deficiency anemia [18].
Experimental Protocol: Fabrication and Detection of Salivary Ferritin
- Objective: To construct a GFET biosensor functionalized with anti-ferritin antibodies for the specific, label-free detection of ferritin in human saliva.
Materials:
- Graphene film (synthesized via CVD or mechanical exfoliation)
- Silicon wafer with a SiOâ‚‚ layer (back-gate electrode)
- Photoresist and developer
- Electron beam evaporator for electrode deposition
- Gold (Au) and Chromium (Cr) source
- 1-Pyrenebutyric acid N-hydroxysuccinimide ester (PBASE) linker
- Anti-ferritin antibody solution (monoclonal, 100 µg/mL in PBS)
- Phosphate Buffered Saline (PBS), pH 7.4
- Ethanolamine solution (1M, pH 8.5) for blocking
- Saliva samples (centrifuged and filtered)
Procedure:
- Device Fabrication:
- Transfer a monolayer of graphene onto a pre-cleaned SiOâ‚‚/Si substrate.
- Pattern the graphene channel using photolithography and oxygen plasma etching.
- Deposit source and drain electrodes (typically 10/50 nm Cr/Au) using photolithography and an e-beam evaporator.
- Surface Functionalization:
- Incubate the GFET chip in a 2 mM solution of PBASE in dimethylformamide (DMF) for 1 hour. The pyrene group of PBASE non-covalently anchors to the graphene surface via π-π stacking.
- Rinse thoroughly with DMF and PBS to remove unbound linkers.
- Immerse the chip in the anti-ferritin antibody solution and incubate for 2 hours at 4°C. The NHS ester group of PBASE covalently binds to amine groups on the antibodies.
- Rinse with PBS to remove physically adsorbed antibodies.
- Block non-specific sites by incubating with 1M ethanolamine for 30 minutes.
- Electrical Measurement and Detection:
- Mount the functionalized GFET in a liquid-cell measurement setup.
- Apply a fixed drain-source voltage (Vds) and monitor the drain-source current (Ids) while applying a sweeping gate voltage (Vg) through a reference electrode in the solution to obtain the Dirac point transfer characteristic.
- Introduce the prepared saliva sample (calibrant or unknown) into the cell.
- Monitor the real-time shift in the Dirac point voltage (∆VDirac) upon binding of ferritin to the immobilized antibodies. This shift is proportional to the analyte concentration.
- Device Fabrication:
Data Analysis: Plot the ∆VDirac as a function of ferritin concentration to generate a calibration curve. The specificity can be validated by testing against other common salivary proteins.
Carbon Nanotube-Based FET (CNT-FET) Biosensor
Application Note: CNT-FETs leverage the exceptional electronic properties of semiconducting single-walled carbon nanotubes (SWCNTs). Functionalization of the CNT surface with specific biorecognition elements like aptamers or antibodies allows for the highly specific detection of pathogens and biomarkers through changes in conductance. This protocol describes the development of an aptamer-functionalized CNT-FET for detecting Salmonella enterica [19].
Experimental Protocol: Aptamer-Functionalized CNT-FET for Pathogen Detection
- Objective: To fabricate a CNT-FET biosensor functionalized with an aptamer for the specific, label-free detection of Salmonella enterica.
Materials:
- Semiconducting SWCNTs (aqueous suspension)
- SiOâ‚‚/Si substrate with pre-patterned Au/Cr electrodes
- PBASE linker
- Amino-terminated DNA aptamer specific to Salmonella enterica
- N-(3-Dimethylaminopropyl)-N′-ethylcarbodiimide (EDC) and N-Hydroxysuccinimide (NHS)
- 2-(N-morpholino)ethanesulfonic acid (MES) buffer
- Salmonella enterica culture (inactivated)
- Tris-EDTA (TE) buffer and PBS
Procedure:
- CNT Channel Formation:
- Deposit the SWCNT suspension onto the SiOâ‚‚/Si substrate between the pre-patterned source and drain electrodes, followed by rinsing and drying to form a random network CNT channel.
- Aptamer Immobilization:
- Incubate the CNT-FET device in a 5 mM PBASE solution in DMF for 2 hours. Rinse with DMF and MES buffer.
- Activate the PBASE's NHS ester by treating the device with a fresh mixture of EDC and NHS in MES buffer for 30 minutes.
- Rinse with MES buffer and immediately incubate with the amino-terminated aptamer solution (1 µM in TE buffer) for 3 hours. The activated NHS ester forms a stable amide bond with the aptamer's terminal amine group.
- Rinse with PBS to remove unbound aptamers.
- Electrical Measurement and Detection:
- Place the functionalized CNT-FET in a custom measurement setup.
- Apply a fixed Vds and record Ids while sweeping the liquid-gate voltage (Vg) to obtain the transfer characteristic.
- Introduce solutions containing varying concentrations of Salmonella enterica or control bacteria.
- Record the change in device conductance (or Ids at a fixed Vg) in real-time upon target binding.
- CNT Channel Formation:
Data Analysis: The specific binding of the pathogen to the aptamer induces a measurable shift in the transfer curve. The sensitivity and specificity are determined by the response to the target pathogen versus non-target bacteria.
Platinum Nanoparticle-Based Electrochemical Biosensor
Application Note: Platinum nanoparticles (Pt NPs) exhibit exceptional electrocatalytic properties, particularly towards the oxidation of hydrogen peroxide (Hâ‚‚Oâ‚‚), a common byproduct of oxidase-based enzymatic reactions. This makes them ideal for enhancing the sensitivity and specificity of enzymatic electrochemical biosensors. This protocol outlines the construction of a Pt NP-based biosensor for the detection of L-glutamate, a key neurotransmitter [20].
Experimental Protocol: Pt NP/Enzyme Biosensor for Glutamate Detection
- Objective: To develop a highly sensitive and selective electrochemical biosensor for L-glutamate by immobilizing glutamate oxidase (GluOx) on a Pt NP-modified electrode.
Materials:
- Glassy carbon electrode (GCE)
- Platinum nanoparticle (Pt NP) colloid or precursors for electrochemical deposition
- Graphene oxide (GO) or reduced graphene oxide (rGO) dispersion
- Glutamate Oxidase (GluOx)
- EDC and NHS
- Chitosan solution (0.5% w/v in acetic acid)
- L-glutamate standard solutions
- PBS (pH 7.4)
Procedure:
- Electrode Modification:
- Polish the GCE with alumina slurry and sonicate in water and ethanol.
- Drop-cast a known volume of GO/rGO dispersion onto the GCE surface and dry.
- Electrodeposit or drop-cast Pt NPs onto the GO/rGO-modified GCE to form a Pt NP/rGO nanocomposite.
- Enzyme Immobilization:
- Activate the carboxylic groups on the nanocomposite by treating with EDC/NHS solution for 1 hour.
- Rinse and incubate the electrode with GluOx solution (2 mg/mL in PBS) overnight at 4°C.
- Alternatively, mix GluOx with a chitosan solution and drop-cast the mixture onto the modified electrode, allowing it to dry and form a stable hydrogel film.
- Amperometric Detection:
- Connect the biosensor to a potentiostat in a three-electrode configuration (biosensor as working electrode, Ag/AgCl reference, Pt wire counter).
- Immerse the electrode in stirred PBS and apply a constant potential of +0.7V (vs. Ag/AgCl) to oxidize Hâ‚‚Oâ‚‚.
- Allow the background current to stabilize.
- Spike with successive additions of L-glutamate standard solution.
- Record the amperometric current-time (i-t) response. The steady-state current increase after each addition is proportional to the glutamate concentration.
- Electrode Modification:
Data Analysis: Plot the steady-state current versus glutamate concentration to obtain the calibration curve. The sensor's specificity is confirmed by testing against other amino acids like glutamine and aspartic acid, which should not generate a significant response.
The Scientist's Toolkit: Essential Research Reagents
Table 2: Key Reagents for Nanomaterial Biosensor Fabrication
| Reagent / Material | Function / Role in Specificity Enhancement | Example Application |
|---|---|---|
| PBASE (1-pyrenebutyric acid N-hydroxysuccinimide ester) | A heterobifunctional crosslinker; pyrene group anchors to carbon nanomaterials via π-π stacking, NHS ester group covalently binds to amine groups on antibodies/aptamers. | Stable functionalization of Graphene FETs and CNT-FETs [19] [18]. |
| EDC & NHS Crosslinkers | Activate carboxylic acid groups on nanomaterials or support matrices to form stable amide bonds with amine-containing biomolecules. | Covalent immobilization of enzymes on Pt NP composites [20]. |
| Specific Aptamers | Single-stranded DNA/RNA oligonucleotides that bind to targets (proteins, cells) with high affinity and specificity; offer stability and design flexibility. | High-precision detection of pathogens like Salmonella on CNT-FETs [19]. |
| Monoclonal Antibodies | Provide high binding specificity and affinity to unique epitopes on target antigens, forming the primary recognition layer. | Detection of disease-specific biomarkers (SARS-CoV-2, ferritin) [19] [18]. |
| Chitosan | A natural biopolymer; forms a porous, biocompatible hydrogel matrix for entrapping enzymes and nanoparticles on electrode surfaces. | Immobilization of glutamate oxidase in Pt NP biosensors [20]. |
| Polyethyleneimine (PEI) | A polymer dopant; can modulate the conductivity and charge of CNTs, and provide primary amine groups for biomolecule conjugation. | Used in polymer doping strategies for CNT-FETs [19]. |
| GlcN-6-P Synthase-IN-1 | GlcN-6-P Synthase-IN-1, MF:C20H21N7S, MW:391.5 g/mol | Chemical Reagent |
| Acetylcysteine-15N | Acetylcysteine-15N, MF:C5H9NO3S, MW:164.19 g/mol | Chemical Reagent |
Advanced Fabrication Techniques and Immobilization Strategies for Enhanced Specificity
Within the framework of optimizing biosensor fabrication for maximum specificity, the choice of enzyme immobilization strategy is a critical determinant of analytical performance. Enzyme-based biosensors rely on the precise confinement of biological catalysts on the transducer surface to facilitate specific analyte recognition and signal generation [22] [23]. Among the available techniques, cross-linking and entrapment represent two fundamentally different philosophies for enzyme stabilization. Cross-linking creates strong, covalent intermolecular bonds between enzyme molecules, often using a bifunctional reagent like glutaraldehyde, resulting in robust, carrier-free aggregates [22] [24]. In contrast, entrapment confines enzymes within the porous matrix of a polymer or silica gel, protecting them from the external environment while allowing substrate and product diffusion [22] [25]. This application note provides a comparative analysis of these two methods, detailing their principles, experimental protocols, and implications for biosensor specificity, stability, and sensitivity, to guide researchers and drug development professionals in selecting the optimal immobilization approach.
Principle and Comparative Analysis
The core distinction between the two methods lies in the nature of enzyme confinement. Cross-linking is a chemical immobilization method based on the formation of covalent bonds. It typically involves the use of bifunctional cross-linkers, most commonly glutaraldehyde, which react with free amino groups (e.g., from lysine residues) on the enzyme's surface to form stable, intermolecular cross-links [22] [26]. This can be performed with or without an inert carrier protein, such as Bovine Serum Albumin (BSA), to form Cross-Linked Enzyme Aggregates (CLEAs) or Cross-Linked Enzyme Crystals (CLECs) [24] [27].
Entrapment, conversely, is a physical method where enzymes are enclosed within a three-dimensional lattice. The enzyme is not bound to the matrix itself but is mechanically restricted within the pores of a polymer network, such as alginate, polyacrylamide, or silica gel, formed around it [25] [26]. This matrix permits the free diffusion of substrates and products while retaining the enzyme.
The following table summarizes the key characteristics of each method.
Table 1: Comparative Analysis of Cross-linking and Entrapment Immobilization Techniques
| Parameter | Cross-Linking | Entrapment |
|---|---|---|
| Bonding/Confinement | Covalent bonding between enzyme molecules [22] [26] | Physical enclosure within a polymer matrix [25] [27] |
| Required Enzyme Purity | High (often requires crystallized or highly pure enzymes) [24] | Moderate to Low |
| Impact on Enzyme Activity | High risk of activity loss due to conformational changes or modification of active sites [22] [24] | Generally minimal conformational change and activity loss [25] [26] |
| Stability & Reusability | High operational and storage stability; strong binding prevents enzyme leakage [22] [27] | Good stability; enzyme leaching is possible if pore size is too large [25] [27] |
| Mass Transfer Limitations | Low to Moderate | Can be significant; diffusion of substrates and products through the matrix can limit reaction rate [25] [28] |
| Method Simplicity & Cost | Simple procedure but can be expensive due to need for pure enzymes and cross-linking reagents [24] | Generally simple and cost-effective [26] |
| Best Suited for Biosensor Applications | Systems requiring high stability and minimal enzyme leakage, where activity loss can be tolerated or mitigated [23] | Systems with smaller substrates where diffusion is not a major constraint, and for preserving high enzyme activity [23] |
The following diagram illustrates the fundamental structural differences and process workflows for these two immobilization methods.
Figure 1: Workflow and structural comparison of cross-linking and entrapment methods. Cross-linking creates covalent bonds between enzyme molecules, while entrapment encapsulates them within a porous polymer network.
Experimental Protocols
Protocol for Enzyme Immobilization via Cross-Linking
This protocol describes the synthesis of Cross-Linked Enzyme Aggregates (CLEAs) using glutaraldehyde, a common and effective cross-linker [22] [27].
Research Reagent Solutions:
- Enzyme Solution: Prepare a concentrated solution of the highly pure target enzyme in a suitable buffer (e.g., 0.1 M phosphate buffer, pH 7.0).
- Glutaraldehyde Solution: A 2-25% (v/v) solution of glutaraldehyde in the same buffer. The concentration must be optimized to balance stability and activity retention.
- Precipitant: A water-miscible organic solvent such as acetone, ethanol, or ammonium sulfate, selected based on compatibility with the enzyme.
- Washing Buffer: A standard buffer (e.g., 0.1 M phosphate buffer) to remove unreacted cross-linker and non-immobilized enzyme.
Procedure:
- Precipitation: To the enzyme solution, slowly add the precipitant with constant stirring at 4°C until the enzyme aggregates and precipitates out of the solution.
- Cross-Linking: Add the glutaraldehyde solution dropwise to the suspension of enzyme aggregates. The typical cross-linking reaction is allowed to proceed for 1-24 hours at 4°C with mild stirring.
- Quenching and Washing: Terminate the reaction by centrifugation and decanting the supernatant. Wash the resulting CLEAs thoroughly with large volumes of washing buffer to remove any unreacted glutaraldehyde and soluble enzyme.
- Storage: The final CLEA product can be stored in buffer at 4°C until use in biosensor fabrication [22] [23] [27].
Protocol for Enzyme Immobilization via Entrapment (Alginate Gel)
This protocol details a common entrapment method using calcium alginate, prized for its mild, non-denaturing conditions [25] [26].
Research Reagent Solutions:
- Sodium Alginate Solution: 2-4% (w/v) sodium alginate dissolved in deionized water.
- Enzyme Solution: The target enzyme dissolved in a compatible, mild buffer.
- Gelling Bath: A 0.1-0.5 M solution of calcium chloride (CaClâ‚‚) in deionized water.
Procedure:
- Mixing: Gently mix the enzyme solution with the sodium alginate solution at room temperature to form a homogeneous enzyme-alginate mixture. Avoid introducing air bubbles.
- Droplet Formation: Using a syringe with a fine needle or a droplet generator, extrude the mixture dropwise into the stirred calcium chloride gelling bath.
- Gelation: Upon contact with Ca²⺠ions, each droplet instantly forms a spherical calcium alginate gel bead, entrapping the enzyme. Allow the beads to harden in the gelling bath for 30-60 minutes.
- Rinsing and Storage: Collect the beads by filtration or sieving, rinse with buffer to remove excess CaCl₂ and surface-bound enzyme, and store in a humidified buffer at 4°C until integration into the biosensor [25] [26].
Impact on Biosensor Performance and Specificity
The choice between cross-linking and entrapment directly influences key biosensor performance metrics critical for research and drug development.
Table 2: Impact on Key Biosensor Performance Parameters
| Performance Parameter | Impact of Cross-Linking | Impact of Entrapment |
|---|---|---|
| Specificity | Generally preserved, but chemical modification could potentially alter enzyme active site accessibility. | High, as the native enzyme conformation is largely undisturbed, maintaining intrinsic specificity [25]. |
| Sensitivity | May be reduced due to partial activity loss from the cross-linking process [29]. | Can be high initially, but apparent sensitivity may be lowered due to mass transfer resistance [28]. |
| Response Time | Typically fast, as there are minimal diffusion barriers for substrates and products. | Can be slowed due to the time required for substrates and products to diffuse through the polymer matrix [25] [28]. |
| Operational/Storage Stability | Very high; covalent bonds prevent enzyme leaching and denaturation, ideal for reusable sensors [22] [27]. | Moderate to good; the matrix offers protection, but enzyme leaching or matrix degradation can occur over time [25]. |
| Lifetime | Long, due to exceptional stability of the covalent linkages [23]. | Moderate; lifetime is limited by the integrity of the entrapping matrix and potential enzyme leakage. |
For biosensor fabrication aimed at maximum specificity, the immobilization method must ensure the enzyme's active site remains accessible and unaltered. Entrapment is advantageous when the enzyme is particularly sensitive to chemical modification, as it preserves the native structure. However, for analytes with larger molecular weights, diffusion limitations through the entrapment matrix can create a partitioning effect that inadvertently enhances specificity against larger interfering substances [25] [23]. Cross-linking, while riskier to activity, provides a stable, leaching-free environment that is crucial for the reproducibility and long-term reliability of biosensors in continuous monitoring applications, such as in bioprocess control or implantable medical devices [23] [30].
The relationship between the immobilization method and the resulting biosensor performance is summarized in the following decision pathway.
Figure 2: Decision pathway for selecting an immobilization method based on biosensor performance requirements and constraints.
The Scientist's Toolkit: Essential Research Reagents
Table 3: Key Reagent Solutions for Enzyme Immobilization
| Reagent | Function | Example in Protocol |
|---|---|---|
| Glutaraldehyde | Bifunctional cross-linker that forms covalent Schiff base bonds with free amino groups on enzymes, creating a stable 3D network [22] [24]. | Cross-linking protocol, step 2. |
| Sodium Alginate | A natural polysaccharide polymer that, in the presence of divalent cations (e.g., Ca²âº), forms a hydrogel matrix for enzyme entrapment [25] [26]. | Entrapment protocol, step 1. |
| Calcium Chloride (CaCl₂) | Source of Ca²⺠ions that cross-link alginate chains, inducing gelation and forming the entrapping beads [25] [26]. | Entrapment protocol, gelling bath. |
| Bovine Serum Albumin (BSA) | An inert protein often used as a supplement to cross-linking reactions to provide additional binding sites and form a more robust aggregate [23]. | Optional additive in cross-linking. |
| Acetone / Ethanol | Water-miscible organic solvents used to precipitate enzymes from aqueous solution prior to cross-linking [27]. | Cross-linking protocol, step 1. |
| trans-Hydroxy Praziquantel-d5 | trans-Hydroxy Praziquantel-d5, MF:C19H24N2O3, MW:333.4 g/mol | Chemical Reagent |
| cis-Dihydro Tetrabenazine-d7 | cis-Dihydro Tetrabenazine-d7, MF:C19H29NO3, MW:326.5 g/mol | Chemical Reagent |
The strategic selection between cross-linking and entrapment is fundamental to optimizing biosensor fabrication. This analysis demonstrates that there is no universally superior technique; the optimal choice is dictated by the specific constraints and goals of the application. Entrapment excels in scenarios demanding minimal enzyme modification, offering a gentle and often more specific confinement, ideal for sensitive enzymes and smaller analyte molecules. Cross-linking is the method of choice when the highest possible operational stability and prevention of enzyme leakage are paramount, even at the potential cost of some initial activity. For researchers and drug development professionals, the pathway to maximum biosensor specificity and performance lies in a careful evaluation of these trade-offs, guided by the experimental protocols and decision frameworks provided herein. Future advancements are likely to focus on hybrid strategies and the use of sophisticated nanomaterials to further mitigate the inherent limitations of each method [28] [30].
Maximizing Specificity with Nanomaterial-Enhanced Electrodes
In the field of biosensor fabrication, achieving high specificity is paramount for reliable detection of target analytes in complex biological matrices such as blood, serum, or saliva. Specificity refers to a biosensor's ability to accurately identify and measure a target biomarker while minimizing responses to interfering substances. Nanomaterial-enhanced electrodes have emerged as a powerful platform for maximizing specificity due to their unique physicochemical properties, including high surface-to-volume ratios, tunable surface chemistry, and enhanced electron transfer capabilities. The integration of nanomaterials such as gold nanoparticles (AuNPs), carbon nanotubes (CNTs), graphene, and silica nanoparticles (SNPs) provides strategic advantages for immobilizing biorecognition elements while maintaining their bioactivity and orientation, ultimately leading to significant improvements in analytical performance for clinical diagnostics, particularly in cancer biomarker detection [31] [32] [33].
Nanomaterial Selection for Enhanced Specificity
The choice of nanomaterial is crucial for optimizing biosensor specificity, as different materials offer distinct advantages for various sensing applications. The following table summarizes the key properties and contributions of prominent nanomaterials to biosensor specificity:
Table 1: Nanomaterial Properties and Their Contributions to Biosensor Specificity
| Nanomaterial | Key Properties | Contribution to Specificity | Exemplary Applications |
|---|---|---|---|
| Gold Nanoparticles (AuNPs) | Excellent conductivity, biocompatibility, facile functionalization | Enhanced electron transfer, controlled antibody orientation, reduced non-specific binding | CA125 immunosensors for ovarian cancer [33] |
| Carbon Nanotubes (CNTs) | High aspect ratio, functionalizable surface, quantum effects | Increased bioreceptor loading, signal amplification, spatial organization of probes | DNA sensors for genetic biomarkers [34] |
| Graphene Oxide/Reduced Graphene Oxide | Large surface area, oxygen functional groups, tunable conductivity | Improved biomolecule immobilization, π-π interactions with probes, charge transfer mediation | Multiplexed cancer biomarker detection [31] [33] |
| Silica Nanoparticles (SNPs) | Tunable porosity, surface silanol groups, mechanical stability | Enzyme stabilization, reduced leaching, protection from denaturation | Horseradish peroxidase biosensors [35] |
| Metal-Organic Frameworks (MOFs) | Ultrahigh porosity, crystalline structure, designable functionality | Molecular sieving effect, size-selective exclusion, enhanced signal-to-noise ratio | Epithelial cancer biomarker platforms [33] |
The exceptional properties of nanomaterials stem fundamentally from their high surface-to-volume ratio, which becomes dramatically more pronounced at the nanoscale. This increased surface area provides more sites for bioreceptor immobilization while enabling more efficient interaction with target analytes [32]. Furthermore, quantum confinement effects in nanomaterials can enhance electronic properties crucial for signal transduction in electrochemical biosensing platforms [32].
Experimental Protocols for Fabricating Nanomaterial-Enhanced Electrodes
Protocol 1: Fabrication of CNT Network-Based DNA Sensor via Inkjet Printing
This protocol describes the fabrication of a flexible, specific DNA sensor using carbon nanotube networks, adapted from research demonstrating successful detection of complementary DNA sequences with minimal non-specific binding [34].
Materials Required:
- Single-walled carbon nanotubes (SWCNTs), carboxylic acid functionalized (diameter: 4-5 nm, length: 0.5-1.5 µm)
- Polyethylene terephthalate (PET) flexible substrate
- Silver nanoparticle ink for electrode printing
- Single-stranded DNA (ssDNA) probes complementary to target sequence
- Phosphate buffer saline (PBS, 0.1 M, pH 7.4)
- Hybridization buffer (typically PBS with 0.1% SDS)
Procedure:
- Substrate Preparation: Clean PET substrate with sequential sonication in acetone, isopropanol, and deionized water (10 minutes each), then dry under nitrogen stream.
- Electrode Printing: Inkjet-print silver electrode array onto PET substrate using predetermined pattern. Cure at 120°C for 30 minutes.
- CNT Sensing Layer Deposition: Deposit functionalized SWCNT suspension (0.5 mg/mL in 0.1% SDS) onto electrode gap via inkjet printing. Dry at room temperature for 2 hours.
- Probe Immobilization: Incubate CNT network with 5 µM ssDNA probe solution in PBS for 16 hours at 4°C. Wash thoroughly with PBS to remove unbound probes.
- Hybridization Assay: Expose functionalized electrode to target DNA solution in hybridization buffer for 60 minutes at 37°C. Perform control experiments with non-complementary DNA to validate specificity.
- Signal Measurement: Measure electrochemical impedance spectroscopy (EIS) or differential pulse voltammetry (DPV) signals in appropriate redox mediator.
Validation: The reported limit of detection (LOD) for this sensor is 0.54 nM, with limit of quantification (LoQ) of 1.63 nM. Specificity should be confirmed using non-complementary DNA sequences, with signal difference >80% between complementary and non-complementary targets [34].
Protocol 2: Enzyme Electrode Fabrication Using Silica Nanoparticle Carriers
This protocol details the creation of highly specific enzyme electrodes with preserved catalytic activity using silica nanoparticles as enzyme carriers, significantly improving biosensor stability and operational lifetime [35].
Materials Required:
- Tetraethyl orthosilicate (TEOS) for silica nanoparticle synthesis
- (3-Aminopropyl)triethoxysilane (APTES) for surface functionalization
- Horseradish peroxidase (HRP) or other target enzyme
- Single-walled carbon nanotubes (SWCNTs)
- 1-ethyl-3-(3-dimethylaminopropyl)carbodiimide (EDC) and N-hydroxysuccinimide (NHS) for covalent coupling
- Phosphate buffer (0.1 M, pH 7.0)
Procedure:
- Silica Nanoparticle Synthesis: Prepare SNPs via Stöber method by hydrolyzing TEOS (830 µL) in mixture of deionized H2O (13.5 mL), ethanol (24.5 mL), and concentrated NH3 (1.22 mL) with vigorous stirring (800 rpm) for 15 minutes. Age overnight on rotary mixer.
- SNP Functionalization: Wash SNPs by centrifugation (3000 rpm, 30 minutes) and resuspend in ethanol. Add APTES (200 µL) and react overnight to create amino-functionalized SNPs (SiO2-NH2). Convert to carboxylic groups by reacting with succinic acid (1% in anhydrous DMF with pyridine) overnight.
- Enzyme Immobilization: Activate carboxylic groups on SNPs with EDC/NHS mixture (0.1 M EDC, 25 mM NHS in phosphate buffer) for 60 minutes. Incubate with HRP solution (0.002 g/80 µL) for 2 hours at room temperature. Wash to remove unbound enzyme.
- Conductive Ink Preparation: Combine SNP-HRP conjugates with SWCNT ink in phosphate buffer. Sonicate to achieve homogeneous dispersion.
- Electrode Fabrication: Inkjet-print the SNP-HRP/SWCNT ink onto electrode substrate. Cure at room temperature for 4 hours.
- Biosensor Validation: Test sensor response to H2O2 using amperometry at -0.4 V vs. Ag/AgCl. Verify specificity against common interferents (ascorbic acid, uric acid, acetaminophen).
Performance Metrics: This approach preserves >90% enzyme activity after 3 months storage, demonstrating exceptional stability. The silica nanoparticle carriers reduce enzyme leaching and protect against denaturation during printing and operation [35].
Quantitative Performance Analysis of Nanomaterial-Enhanced Biosensors
Rigorous performance analysis is essential for validating biosensor specificity. The following table compiles quantitative data from recent studies on nanomaterial-enhanced electrodes for biomarker detection:
Table 2: Performance Metrics of Nanomaterial-Enhanced Biosensors for Biomarker Detection
| Target Analyte | Nanomaterial Platform | Detection Technique | Linear Range | Limit of Detection (LOD) | Specificity Validation |
|---|---|---|---|---|---|
| CA125 (Ovarian Cancer) | AuNPs/poly toluidine blue [33] | DPV | 1–500 U mL−1 | 1 mU mL−1 | <5% interference from other tumor markers |
| DNA Sequences | CNT network on inkjet-printed Ag electrodes [34] | EIS | 1–100 nM | 0.54 nM | >80% signal difference for non-complementary DNA |
| Hydrogen Peroxide | SNP-HRP/SWCNT [35] | Amperometry | 0.01–10 mM | 2.3 µM | Minimal interference from common electroactive species |
| Carcinoembryonic Antigen (CEA) | AuNPs/PEI/rGO [31] | DPV | 0.0001–100 ng mL−1 | 0.03 pg mL−1 | <6% cross-reactivity with similar antigens |
| Prostate-Specific Antigen (PSA) | Carbon nanoplatelets [31] | EIS | 0.1–100 ng mL−1 | 0.05 ng mL−1 | Tested against BSA, lysozyme, IgG |
The analytical hierarchy process (AHP) has been employed for quantitative performance analysis of flexible CNT biosensors, systematically evaluating factors influencing specificity before, during, and after mechanical bending [34]. This approach allows researchers to identify and quantify various performance indicators and noise factors that impact biosensor specificity in practical applications.
Research Reagent Solutions for Specificity Optimization
The following essential materials constitute a foundational toolkit for developing nanomaterial-enhanced electrodes with maximized specificity:
Table 3: Essential Research Reagent Solutions for Specificity Optimization
| Reagent/Material | Function in Biosensor Fabrication | Specificity Enhancement Role |
|---|---|---|
| Carbodiimide Crosslinkers (EDC/NHS) | Covalent immobilization of bioreceptors | Controlled orientation of antibodies/aptamers, stable linkage reducing leaching |
| Polyethylene Terephthalate (PET) Substrates | Flexible sensor substrate | Conformable interface for biological surfaces, reducing sampling errors |
| Chitosan (CHI) | Biopolymer matrix for biomolecule entrapment | Enhanced bioreceptor stability, reduced non-specific adsorption |
| Screen-Printed Electrodes (SPE) | Disposable electrode platforms | Reproducible surface characteristics, lot-to-lot consistency |
| Self-Assembled Monolayer (SAM) Reagents | Molecular-level electrode modification | Precise control over surface chemistry, blocking non-specific binding sites |
| Blocking Agents (BSA, casein) | Surface passivation | Minimize non-specific protein adsorption, reduce background signal |
Workflow Visualization: Fabrication and Specificity Validation
The following diagram illustrates the comprehensive workflow for fabricating and validating nanomaterial-enhanced electrodes, highlighting critical specificity control points:
Diagram 1: Biosensor Fabrication and Specificity Validation Workflow. Critical control points for specificity optimization are highlighted in the dashed box.
Strategic Considerations for Maximizing Specificity
Bioreceptor Immobilization Strategies
The method of bioreceptor immobilization significantly impacts biosensor specificity. Covalent attachment using carbodiimide chemistry (EDC/NHS) remains the gold standard for creating stable, oriented bioreceptor layers [35]. For DNA sensors, the immobilization of single-stranded DNA probes on CNT surfaces must preserve hybridization accessibility while minimizing non-specific DNA adsorption [34]. In immunosensors, antibody orientation can be optimized through Fc-specific binding to Protein A/G-functionalized nanomaterials or through controlled covalent linkage to surface functional groups [33].
Signal Transduction and Minimizing Interference
Nanomaterials enhance signal transduction while reducing interference through several mechanisms. CNTs and graphene facilitate electron transfer in electrochemical detection, lowering operating potentials and minimizing interference from electroactive species in biological samples [31] [34]. Core-shell nanoparticle designs can incorporate insulating layers that block non-faradaic interferences while allowing specific signal transduction. For enzyme-based sensors, silica nanoparticle carriers preserve enzymatic activity while creating a protective microenvironment that reduces interference [35].
Validation in Complex Matrices
Robust specificity validation requires testing in biologically relevant matrices such as serum, plasma, or whole blood. Researchers should employ standard addition methods with recovery rates between 95-105% indicating minimal matrix effects [33]. Cross-reactivity assessments should include structurally similar molecules and unrelated biomarkers that may coexist in target samples. For flexible biosensors intended for wearable applications, performance must be validated under mechanical stress conditions, as bending can affect specificity by altering bioreceptor accessibility or creating microcracks that trap interfering species [34] [36].
The strategic integration of nanomaterials in electrode design provides multifaceted approaches to maximizing biosensor specificity. Through optimized nanomaterial selection, controlled bioreceptor immobilization, and rigorous validation protocols, researchers can develop biosensing platforms with exceptional discrimination capabilities. The protocols and analytical frameworks presented herein offer a foundation for advancing biosensor fabrication toward clinical applications where specificity is paramount for accurate diagnosis and therapeutic monitoring. Continuing research in nanomaterial-biology interfaces promises further enhancements in specificity through biomimetic designs and increasingly sophisticated nanoscale engineering approaches.
Alanine aminotransferase (ALT) is a crucial biomarker for liver health, with elevated levels in the blood indicating potential damage due to conditions such as hepatitis, liver cirrhosis, or fatty liver disease [37]. In healthy individuals, ALT levels are typically below 30 U/L, but these can increase significantly—sometimes 8 to 35 times above normal—during liver injury [37]. Conventional methods for ALT detection, including colorimetric and spectrophotometric techniques, often require expensive equipment, trained personnel, and complex sample preparation, making them unsuitable for rapid or point-of-care testing [37].
Biosensor technology presents a promising alternative, offering advantages such as lower cost, portability, and potential for point-of-care applications [37]. This application note details the development of a specific amperometric biosensor for ALT detection utilizing pyruvate oxidase (POx) as the biorecognition element. The content is framed within broader thesis research on optimizing biosensor fabrication for maximum specificity, providing detailed protocols and data for researchers and scientists engaged in diagnostic development.
Experimental Design and Biosensor Principle
The biosensor operates on an indirect amperometric detection principle. ALT itself is not electroactive, so its activity is determined by measuring the reaction products. The POx-based biosensor detects ALT activity through a coupled enzymatic reaction that ultimately generates a measurable hydrogen peroxide signal.
Biosensor Reaction Pathway:
- ALT catalyzes the transamination between L-alanine and α-ketoglutarate, producing pyruvate and L-glutamate.
- Pyruvate oxidase (POx) then reacts with the generated pyruvate, phosphate, and oxygen to produce hydrogen peroxide (Hâ‚‚Oâ‚‚), carbon dioxide, and acetylphosphate [37].
- At the platinum electrode surface, held at a specific potential, Hâ‚‚Oâ‚‚ is oxidized, releasing electrons and generating a measurable current signal proportional to the original ALT activity [37].
Diagram: The signaling pathway and experimental workflow for the POx-based ALT biosensor.
Results & Performance Data
A systematic comparative evaluation was conducted between two amperometric biosensor designs: one using pyruvate oxidase (POx) and another using glutamate oxidase (GlOx). The key analytical performance parameters are summarized in the table below.
Table 1: Comparative analytical performance of POx-based and GlOx-based ALT biosensors. [37] [38]
| Analytical Parameter | POx-Based Biosensor | GlOx-Based Biosensor |
|---|---|---|
| Linear Range | 1 – 500 U/L | 5 – 500 U/L |
| Limit of Detection (LOD) | 1 U/L | 1 U/L |
| Sensitivity (at 100 U/L ALT) | 0.75 nA/min | 0.49 nA/min |
| Immobilization Method | Entrapment in PVA-SbQ | Covalent Crosslinking with Glutaraldehyde |
| Optimal Immobilization pH | pH 7.4 | pH 6.5 |
| Enzyme Loading | 1.62 U/µL | 2.67% |
| Key Advantage | Higher Sensitivity, Uniquely suited for ALT | Greater Stability in Complex Solutions, Lower Cost |
| Key Limitation | - | Can be affected by AST activity |
The POx-based biosensor demonstrated a superior lower limit of the linear range and higher sensitivity compared to the GlOx-based configuration [37] [38]. This makes the POx design particularly advantageous for detecting ALT activity at the lower end of the clinical range. Furthermore, the POx system is uniquely suited for ALT determination, whereas the GlOx-based sensor can be influenced by aspartate aminotransferase (AST) activity present in samples, potentially compromising specificity for ALT [37].
Detailed Experimental Protocols
Electrode Pretreatment and PPD Modification
Objective: To polish and clean the platinum working electrode surface, followed by the electrochemical deposition of a semi-permeable poly(meta-phenylenediamine) (PPD) membrane to enhance selectivity by blocking interferents like ascorbic acid [37].
Materials:
- PalmSens potentiostat with a three-electrode system (Pt working, Pt counter, Ag/AgCl reference) [37]
- Platinum disc working electrodes [37]
- Alumina slurry or powder (various grades for polishing)
- Ethanol (absolute)
- meta-Phenylenediamine (mPD)
- Phosphate buffer (10 mM, pH 6.5)
Procedure:
- Polishing: Mechanically polish the platinum disc working electrode sequentially with fine-grade alumina slurries (e.g., 1.0, 0.3, and 0.05 µm) to a mirror finish.
- Cleaning: Rinse the polished electrode thoroughly with deionized water, followed by sonication in ethanol for 2-3 minutes to remove residual alumina particles. Rinse again with deionized water.
- PPD Solution Preparation: Prepare a 5 mM solution of meta-phenylenediamine in 10 mM phosphate buffer (pH 6.5).
- Electropolymerization: Immerse the clean working electrode, along with the counter and reference electrodes, into the mPD solution. Using the potentiostat, perform cyclic voltammetry by scanning the potential from 0 V to 0.9 V and back, with a step potential of 0.005 V and a scan rate of 0.02 V/s.
- Completion: Continue for 10-20 cycles until the voltammogram stabilizes, indicating complete surface coverage. A stable, semi-permeable PPD film will be formed, which allows Hâ‚‚Oâ‚‚ diffusion but blocks larger interfering molecules [37].
- Rinsing and Storage: Rinse the modified electrode with deionized water and store dry at 8°C if not used immediately.
Pyruvate Oxidase (POx) Immobilization
Objective: To stably immobilize the Pyruvate Oxidase enzyme onto the PPD-modified Pt electrode using a photopolymerizable PVA-SbQ entrapment method [37].
Materials:
- Pyruvate Oxidase (POx) from Aerococcus viridans [37]
- Polyvinyl alcohol with steryl pyridinium groups (PVA-SbQ) [37]
- Glycerol
- Bovine Serum Albumin (BSA)
- HEPES buffer (25 mM, pH 7.4)
- UV lamp (365 nm)
Procedure:
- Enzyme Gel Preparation: Prepare an enzyme gel mixture containing 10% glycerol, 5% BSA, and 4.86 U/µL of POx in 25 mM HEPES buffer (pH 7.4). The glycerol enhances membrane elasticity, and BSA reduces enzyme leaching.
- Mixing with Photopolymer: Mix the enzyme gel with a 19.8% PVA-SbQ solution in a 1:2 ratio (enzyme gel : PVA-SbQ). The final parameters of the mixture will be:
- Glycerol: 3.3%
- BSA: 1.67%
- POx: 1.62 U/µL
- PVA-SbQ: 13.2% [37]
- Application and Photopolymerization: Apply 0.15 µL of the final mixture onto the surface of the PPD-modified working electrode. Expose the electrode to UV light (365 nm) for approximately 8 minutes (until a total energy of 2.4 J is delivered) to cure the polymer and entrap the enzyme [37].
- Post-treatment: Rinse the biosensor 2-3 times for 3 minutes each with the working buffer (e.g., HEPES pH 7.4) to remove any unbound molecules.
- Storage: Store the fabricated biosensor in a dry state at 8°C [37].
Amperometric Measurement of ALT Activity
Objective: To quantitatively measure ALT activity in a sample using the fabricated POx-based biosensor.
Materials:
- Fabricated POx biosensor (Working electrode)
- Potentiostat and three-electrode system
- Magnetic stirrer and stir bar
- Reaction cell (2 mL volume)
- HEPES or Phosphate buffer
- L-Alanine
- α-Ketoglutarate
- Thiamine pyrophosphate (TPP)
- Pyridoxal phosphate (PLP)
- Magnesium nitrate [37]
Procedure:
- Measurement Setup: Place the biosensor (working electrode), counter electrode, and reference electrode into a 2 mL stirred cell containing the working buffer at room temperature.
- Applied Potential: Apply a constant potential of +0.6 V vs. Ag/AgCl to the working electrode [37].
- Background Stabilization: Allow the background current to stabilize under stirring conditions.
- Substrate Addition: Introduce the sample containing ALT into the cell along with the necessary cofactors and substrates. The working solution should contain:
- L-Alanine
- α-Ketoglutarate
- Thiamine pyrophosphate (TPP, cofactor for POx)
- Pyridoxal phosphate (PLP, cofactor for ALT)
- Magnesium ions (e.g., from Mg(NO₃)₂, activator for POx) [37]
- Data Acquisition: Record the amperometric current over time. The ALT enzyme in the sample will generate pyruvate, which is subsequently detected by the immobilized POx, producing Hâ‚‚Oâ‚‚ and a corresponding current change.
- Calculation: The rate of current change (nA/min) is proportional to the ALT activity in the sample. Calculate the unknown ALT concentration by interpolating the signal rate against a calibration curve prepared with ALT standards of known activity.
The Scientist's Toolkit: Research Reagent Solutions
Table 2: Key reagents and materials for fabricating and operating the POx-based ALT biosensor.
| Item | Function / Role | Key Details / Optimization |
|---|---|---|
| Pyruvate Oxidase (POx) | Biorecognition element; catalyzes production of H₂O₂ from pyruvate [37]. | Source: Aerococcus viridans; Optimal loading: 1.62 U/µL in gel [37]. |
| PVA-SbQ | Photopolymerizable matrix for enzyme entrapment [37]. | Ensures stable enzyme immobilization; Final concentration: 13.2% [37]. |
| meta-Phenylenediamine | Monomer for electropolymerization of the selective membrane [37]. | Forms a semi-permeable film (PPD) that blocks interferents [37]. |
| Platinum Electrode | Transducer surface for Hâ‚‚Oâ‚‚ oxidation [37]. | Operated at +0.6 V vs. Ag/AgCl [37]. |
| Thiamine Pyrophosphate (TPP) | Essential cofactor for Pyruvate Oxidase activity [37]. | Must be included in the working solution. |
| Pyridoxal Phosphate (PLP) | Essential cofactor for Alanine Aminotransferase activity [37]. | Must be included in the working solution for the ALT reaction. |
| L-Alanine & α-Ketoglutarate | Substrates for the ALT enzymatic reaction [37]. | Must be present in excess in the working solution. |
| HEPES Buffer | Reaction medium providing optimal pH for immobilization and detection [37]. | Optimal pH for POx immobilization: 7.4 [37]. |
| Epi Lovastatin-d3 | Epi Lovastatin-d3, MF:C24H36O5, MW:407.6 g/mol | Chemical Reagent |
| Egfr-IN-35 | Egfr-IN-35, MF:C25H24ClN7O2, MW:490.0 g/mol | Chemical Reagent |
This application note provides a detailed protocol for developing a specific and sensitive amperometric biosensor for alanine aminotransferase using pyruvate oxidase. The POx-based configuration demonstrates excellent analytical performance, particularly in sensitivity and low-end detection, making it a promising tool for point-of-care liver health monitoring. The systematic comparison with a GlOx-based alternative highlights a critical trade-off in biosensor design between sensitivity and robustness, offering valuable guidance for the rational development of clinically relevant diagnostic devices. The methodologies and data presented herein serve as a solid foundation for further research into optimizing biosensor fabrication for enhanced specificity and performance.
The relentless pursuit of higher specificity and sensitivity in diagnostic technologies has catalyzed the development of sophisticated biosensing platforms. Among these, D-Shaped Photonic Crystal Fiber Surface Plasmon Resonance (PCF-SPR) and metasurface-based biosensors represent cutting-edge approaches that leverage nanoscale engineering to overcome the limitations of conventional detection methods. These platforms enable direct, label-free detection of biomolecular interactions by transducing binding events into quantifiable optical signals, making them indispensable tools for researchers and drug development professionals requiring precise analytical capabilities.
The operational principle unifying these technologies revolves around the excitation of surface plasmons—coherent electron oscillations at a metal-dielectric interface. When target analytes bind to recognition elements functionalized on the sensor surface, they induce localized changes in the refractive index, which in turn alter the resonance conditions for light coupling. D-Shaped PCF-SPR biosensors achieve this through precisely modified optical fibers that facilitate efficient plasmon excitation, while metasurface-based biosensors utilize engineered subwavelength structures that provide exceptional control over light-matter interactions. Both platforms are particularly valued for their real-time monitoring capabilities, low sample consumption, and potential for integration into point-of-care diagnostic systems, thereby addressing the growing demands of personalized medicine and rapid pathogen detection.
Platform Fundamentals and Performance Comparison
D-Shaped PCF-SPR Biosensors
D-Shaped PCF-SPR biosensors incorporate a unique architecture where a segment of the photonic crystal fiber is polished to form a flat, D-shaped surface, enabling precise deposition of a thin plasmonic metal layer (typically gold) in direct contact with the analyte medium. This configuration overcomes the fabrication complexity associated with internally metal-coated PCFs and allows for straightforward interaction between the evanescent field and target biomolecules. The core guidance mechanism is often based on modified total internal reflection, with the air-hole cladding structure providing tailored optical properties that enhance sensitivity. Recent design innovations include quad-cluster multi-functional PCF sensors, bi-cluster and double array-based structures, and anisotropic PCF designs, which collectively push the boundaries of detection performance [39]. Machine learning (ML) and explainable AI (XAI) techniques are now being integrated to rapidly predict optical properties and identify critical design parameters, significantly accelerating the optimization process beyond traditional simulation-based approaches [40].
Metasurface-Based Biosensors
Metasurface biosensors comprise engineered, two-dimensional arrays of subwavelength resonators that can manipulate light-matter interactions with unprecedented precision. These platforms excel at overcoming the significant size mismatch between terahertz (THz) wavelengths (hundreds of micrometers) and biological targets such as proteins, DNA, or cells (often sub-micrometer) by creating strongly enhanced localized electric fields at critical locations. Various resonance phenomena can be harnessed, including Fano resonances, bound states in the continuum (BIC), and quasi-BIC, which provide high quality (Q) factors and strong field confinement ideal for biosensing applications [41] [42]. Material platforms have evolved from conventional metallic structures to hybrid systems incorporating graphene, carbon nanotubes (CNTs), and all-dielectric components, each offering distinct advantages in terms of tunability, functionalization capacity, and low-loss operation. The exceptional design freedom of metasurfaces enables multimodal sensing capabilities, including label-free refractive index sensing, specific molecular recognition, and pixelated fingerprint spectral reconstruction [41].
Quantitative Performance Metrics
Table 1: Performance Comparison of Advanced Biosensing Platforms
| Platform Type | Max. Wavelength Sensitivity (nm/RIU) | Max. Amplitude Sensitivity (RIUâ»Â¹) | Resolution (RIU) | Figure of Merit (RIUâ»Â¹) | Key Advantages |
|---|---|---|---|---|---|
| D-Shaped PCF-SPR [40] [39] | 125,000 | -1,422.34 to 5,336 | 8.0×10â»â· | 2,112.15 | Ultra-high sensitivity, broad RI detection range (1.19-1.43), multi-analyte capability |
| Metasurface (THz) [41] [42] | N/A (Frequency shift-based) | N/A | N/A | High Q-factors | Label-free, non-ionizing radiation, sensitive to molecular rotations/vibrations, water content measurement |
| Graphene-Metal Composite [43] | 1,785 | N/A | N/A | N/A | Enhanced plasmonic interaction, dynamic tunability, 2D material advantages |
Table 2: Substrate Impact on Metasurface Biosensor Performance [42]
| Substrate Material | Refractive Index | Key Characteristics | Impact on Sensitivity |
|---|---|---|---|
| TPX | 1.46 | Low-loss plastic, minimal reflection | Preferred for high sensitivity |
| Quartz | 2.1 | Low reflection losses | Good sensitivity |
| Silicon (Si) | ~3.4 | High refractive index, significant reflection losses | Reduces sensitivity |
| Germanium (Ge) | ~4.0 | Very high refractive index, high absorption losses | Least suitable for high sensitivity |
Experimental Protocols
Protocol 1: Fabrication of D-Shaped PCF-SPR Biosensors
Objective: To fabricate a high-sensitivity D-shaped PCF-SPR biosensor with optimized performance for refractive index sensing.
Materials and Reagents:
- Photonic crystal fiber (commercially available or custom-drawn)
- Polishing equipment and abrasives (diamond lapping films of varying grit sizes)
- Plasma cleaner (oxygen or argon plasma)
- Thin-film deposition system (sputter coater or thermal evaporator)
- Gold (Au) target (99.99% purity)
- Titanium (Ti) or Chromium (Cr) for adhesion layer (optional)
- Fused silica (SiOâ‚‚) preforms for fiber drawing
- Analytical grade solvents: acetone, isopropanol, ethanol
- Deionized water
Procedure:
PCF Selection and Preparation: Select a PCF with an appropriate air-hole structure (e.g., quad-cluster, bi-cluster design). Cut the fiber to the desired length (typically 1-2 cm) using a precision cleaver. Clean the fiber surface by sequential sonication in acetone, isopropanol, and deionized water for 10 minutes each [39].
D-Shaping Process: Mount the PCF segment securely in a polishing jig. Using computer-controlled polishing machinery, progressively remove the cladding material with diamond lapping films (starting with 9μm grit, progressing to 1μm and 0.1μm) until a flat, smooth D-shaped surface is achieved. Continuously monitor the process using optical microscopy to ensure the core region is approached but not damaged [39].
Surface Activation: Treat the polished D-shaped surface with oxygen plasma for 2-5 minutes at 50-100 W to enhance hydrophilicity and remove organic contaminants. This step promotes superior metal film adhesion [40].
Plasmonic Layer Deposition: Load the activated PCF into a thin-film deposition system. For gold-based sensors, first deposit a 2-5 nm thick adhesion layer of Ti or Cr (if required), followed by a 30-50 nm gold layer using DC magnetron sputtering or thermal evaporation. Maintain deposition rates at 0.1-0.5 Ã…/s to ensure uniform, continuous films [39].
Quality Assessment: Characterize the fabricated biosensor using scanning electron microscopy (SEM) to verify metal film continuity and thickness. Perform initial optical testing by coupling a broadband light source (e.g., supercontinuum laser) through the fiber and measuring the transmission spectrum to confirm SPR excitation [40].
Protocol 2: Functionalization for Specific Biomarker Detection
Objective: To immobilize specific biorecognition elements (antibodies, aptamers) on the sensor surface for targeted detection of cancer biomarkers.
Materials and Reagents:
- Fabricated D-shaped PCF-SPR biosensor or metasurface chip
- Biorecognition elements (e.g., anti-HER2 antibodies for breast cancer detection)
- Self-assembled monolayer (SAM) reagents: 11-mercaptoundecanoic acid (11-MUA) or similar thiol compounds
- Cross-linkers: N-(3-Dimethylaminopropyl)-N'-ethylcarbodiimide (EDC) and N-Hydroxysuccinimide (NHS)
- Phosphate buffered saline (PBS), pH 7.4
- Blocking solution: Bovine serum albumin (BSA, 1% w/v in PBS) or ethanolamine
- Washing buffers: PBS with 0.05% Tween 20 (PBST)
Procedure:
SAM Formation: Incubate the gold-coated sensor surface with 1-10 mM solution of 11-MUA in ethanol for 12-24 hours at room temperature. This forms a carboxyl-terminated SAM. Rinse thoroughly with ethanol and deionized water to remove physically adsorbed thiols [43].
Surface Activation: Prepare a fresh mixture of EDC (0.4 M) and NHS (0.1 M) in deionized water. Incubate the SAM-functionalized sensor with this activation solution for 30-60 minutes to convert terminal carboxyl groups to amine-reactive NHS esters. Rinse with PBS to remove excess cross-linkers [40].
Biorecognition Element Immobilization: Incubate the activated surface with the biorecognition element solution (e.g., antibody at 10-100 μg/mL in PBS) for 2 hours at room temperature or overnight at 4°C. The amine groups on the antibodies will covalently attach to the NHS-activated surface [43].
Blocking: Treat the functionalized sensor with blocking solution (1% BSA or 1M ethanolamine) for 1 hour to passivate any remaining reactive sites and minimize non-specific binding in subsequent assays [40].
Validation: Validate functionalization success by exposing the sensor to a solution containing the target biomarker at a known concentration and monitoring the resonance shift. A successful functionalization should yield a concentration-dependent response with minimal non-specific binding in control experiments [43].
Protocol 3: Terahertz Metasurface Biosensor for Protein Detection
Objective: To utilize a THz metasurface biosensor for label-free detection of proteins (e.g., bovine serum albumin) through refractive index changes.
Materials and Reagents:
- Metal-based THz metasensor (e.g., gold split-ring resonators on TPX substrate)
- THz time-domain spectroscopy (TDS) system
- Microfluidic flow cell or sample chamber
- Protein solutions: Bovine serum albumin (BSA) at varying concentrations (0.1-10 mg/mL)
- Buffer solution for dilution and baseline (e.g., phosphate buffer)
Procedure:
Baseline Acquisition: Mount the metasurface biosensor in the THz-TDS system. Flush the microfluidic chamber with pure buffer solution. Acquire a reference transmission (or reflection) spectrum by averaging multiple scans to establish a stable baseline [42].
Sample Introduction: Introduce protein solutions of increasing concentration in a stepwise manner. For each concentration, allow sufficient incubation time (typically 10-15 minutes) for biomolecular interaction to reach equilibrium before spectral acquisition [42].
Spectral Monitoring: Collect transmission spectra after each incubation period. Monitor specific resonance features (e.g., resonance frequency, linewidth, or amplitude) that shift in response to the local refractive index change induced by protein binding [42].
Data Analysis: Quantify resonance shifts (Δf) relative to the baseline for each protein concentration. Plot Δf versus concentration to generate a calibration curve. Determine the limit of detection (LOD) from the calibration data, typically defined as three times the standard deviation of the blank measurement divided by the slope of the calibration curve [42].
Sensor Regeneration (Optional): For reusable sensors, regenerate the surface by washing with a regeneration buffer (e.g., glycine-HCl, pH 2.0-3.0) to dissociate bound proteins without damaging the immobilized recognition elements. Re-equilibrate with running buffer before subsequent measurements [41].
Biosensor Optimization Workflows
The Scientist's Toolkit: Essential Research Reagents and Materials
Table 3: Key Research Reagent Solutions for Biosensor Development
| Reagent/Material | Function | Application Examples | Considerations |
|---|---|---|---|
| High-Resistivity Silicon | Low-loss substrate for THz metasurfaces | Fabrication of resonant metasurfaces | Can reduce sensitivity compared to low-index alternatives [42] |
| TPX (Polymethylpentene) | Low-refractive-index substrate (n=1.46) | High-sensitivity THz metasurface biosensors | Enhances evanescent field confinement [42] |
| Gold (Au) Nanoparticles/Targets | Plasmonic material for SPR excitation | D-shaped PCF-SPR and metasurface biosensors | Chemical stability, strong plasmonic resonance [39] |
| Graphene & Derivatives | 2D material for enhanced sensitivity | Composite biosensors, spacer layers | Exceptional electrical conductivity, large surface area [43] |
| 11-Mercaptoundecanoic acid (11-MUA) | Self-assembled monolayer formation | Surface functionalization of gold films | Provides carboxyl groups for biomolecule conjugation [40] |
| EDC/NHS Cross-linkers | Covalent immobilization of biomolecules | Antibody/aptamer attachment to sensor surfaces | Fresh preparation required for optimal activity [40] |
| Bovine Serum Albumin (BSA) | Blocking agent for non-specific sites | Surface passivation after functionalization | Reduces background signal in complex media [42] |
| Nos-IN-3 | Nos-IN-3|Potent nNOS Inhibitor|For Research Use | Nos-IN-3 is a selective neuronal nitric oxide synthase (nNOS) inhibitor. This product is For Research Use Only and is not intended for diagnostic or personal use. | Bench Chemicals |
| Cdc7-IN-19 | Cdc7-IN-19, MF:C19H21N5O2, MW:351.4 g/mol | Chemical Reagent | Bench Chemicals |
D-Shaped PCF-SPR and metasurface biosensors represent transformative platforms that push the boundaries of detection specificity and sensitivity through sophisticated nanophotonic engineering. The integration of machine learning and explainable AI into the design optimization process marks a significant advancement, enabling researchers to rapidly identify critical parameters that maximize sensor performance. As these technologies continue to mature, their potential for multiplexed detection, point-of-care diagnostics, and real-time biomolecular interaction analysis will increasingly impact drug development pipelines and clinical diagnostics. Future research directions will likely focus on enhancing platform integration, improving manufacturability, and expanding the repertoire of detectable analytes to address emerging challenges in biomedical research and personalized medicine.
Strategies for Interference Mitigation and Performance Optimization
Overcoming Non-Specific Binding and Biofouling
Non-specific binding (NSB) and biofouling represent significant challenges in biosensor development, compromising analytical accuracy, reliability, and operational longevity. NSB occurs when analytes of interest or sample components adhere to non-target surfaces, while biofouling involves the uncontrolled accumulation of biological materials on sensor interfaces [44] [45]. These phenomena obscure specific binding signals, elevate detection limits, and impair sensor function through signal drift and reduced specificity [44] [46]. Within the broader context of optimizing biosensor fabrication for maximum specificity, addressing these interfacial challenges is paramount for developing robust analytical platforms capable of functioning in complex biological matrices such as blood, serum, and environmental samples [45] [46]. This application note provides detailed protocols and strategic frameworks to systematically overcome NSB and biofouling, enabling researchers to enhance biosensor performance across healthcare, diagnostic, and monitoring applications.
Fundamental Concepts and Impact
Defining NSB and Biofouling
Non-specific binding refers to the adsorption of biomolecules to surfaces through non-covalent interactions not based on specific biorecognition. This includes hydrophobic interactions, electrostatic attractions, and van der Waals forces that cause unintended adherence of proteins, nucleic acids, or other biomolecules to sensor surfaces, ligands, or non-target regions [44]. The biophysical properties of analytes—including hydrophobicity, structural conformation, and isoelectric point—significantly influence NSB propensity [44].
Biofouling encompasses the broader phenomenon of involuntary accumulation of biological materials on submerged surfaces, including proteins, carbohydrates, cells, and microorganisms [45]. In marine environments, this manifests as attachment of barnacles, mussels, and bacterial biofilms [45], while in clinical biosensing, biofouling primarily involves protein adsorption and cellular attachment that can impair sensor function [46] [47].
Consequences for Biosensor Performance
The operational impacts of NSB and biofouling are substantial and multidimensional:
- Signal Interference: NSB masks true specific binding events, leading to inaccurate kinetic parameter calculations and compromised data interpretation in affinity characterization studies [44].
- Reduced Sensitivity & Specificity: Fouling layers create physical barriers that hinder target access to recognition elements while increasing background noise, thereby elevating detection limits [46].
- Material Degradation: Biofouling accelerates corrosion through microbiologically influenced corrosion (MIC) mechanisms, particularly involving sulfate-reducing bacteria that create heterogeneous biofilms and corrosive microenvironments [45].
- Operational Failure: Severe fouling can physically block fluidic pathways, impair optical components, and disrupt transducer function, potentially leading to complete sensor failure [45].
Table 1: Quantitative Impacts of Biofouling Across Different Sensor Platforms
| Sensor Platform | Performance Metric | Impact of Biofouling | Reference |
|---|---|---|---|
| Marine Sensors (CTD) | Operational Lifespan | Failure within 2 weeks during peak fouling seasons | [45] |
| Wave Buoys | Data Accuracy | >30% increase in data errors | [45] |
| Tidal Turbine Blades | Lift-to-Drag Ratio | Up to 90% decrease with 1mm fouling | [45] |
| FO-BLI Biosensors | Regeneration Potential | Up to 12 cycles with proper mitigation | [46] |
| Shipping Vessels | Fuel Consumption | 9-84% increase in shaft power requirements | [45] |
Strategic Mitigation Approaches
Material Selection and Surface Engineering
Strategic material selection and surface modification establish the foundation for reducing NSB and biofouling:
Nanomaterial-Enhanced Interfaces: Graphene-based platforms offer exceptional electrical conductivity and large surface area that can be functionalized with precise biorecognition elements while demonstrating reduced fouling propensity [48] [43]. Graphene oxide laminates integrated into nanosieve platforms improve stability and sensitivity while limiting non-specific interactions [48].
Dielectric Structures: Pedestal high-contrast gratings (PHCG) fabricated from silicon demonstrate 11.2% improvement in bulk refractive index sensitivity (536 nm/RIU) compared to conventional designs, enabling enhanced detection with reduced fouling due to their precisely engineered surface topography [49].
Polymer Coatings: Polydopamine coatings inspired by mussel adhesion proteins provide versatile platforms for creating biocompatible, antifouling surfaces through simple oxidative polymerization in aqueous solutions [50]. Zwitterionic coatings and polyethylene glycol (PEG) derivatives create hydration layers that resist protein adsorption through molecular exclusion effects [51].
Buffer Composition and Chemical Additives
Optimization of the chemical environment represents a straightforward yet powerful approach to minimize NSB:
High-Salt Buffers: Implementation of high-salt sample diluent (SD) buffer containing 274 mM NaCl effectively reduces matrix interference in fiber-optic biolayer interferometry (FO-BLI) detection of carbamazepine in whole blood [46].
Blocking Agents: Bovine serum albumin (BSA) at 0.1-1.0% concentration and specialized commercial blocking buffers like SuperBlock prevent NSB by occupying potential adsorption sites without interfering with specific molecular recognition [46].
Detergents and Additives: Tween-20 at 0.02% (v/v) concentration reduces hydrophobic interactions that contribute to NSB, while proprietary additives in Octet Kinetics Buffer provide optimized NSB mitigation for biosensor applications [44] [46].
Table 2: Effective Buffer Compositions for NSB Mitigation
| Buffer Component | Concentration | Mechanism of Action | Application Context |
|---|---|---|---|
| NaCl | 274 mM | Reduces electrostatic interactions | FO-BLI in whole blood [46] |
| BSA | 0.1-1.0% | Occupies non-specific binding sites | General biosensor blocking [46] |
| Tween-20 | 0.02% (v/v) | Minimizes hydrophobic interactions | Surface plasmon resonance [46] |
| Octet Kinetics Buffer | Proprietary | Optimized combination of mitigators | BLI affinity characterization [44] |
| SuperBlock | As recommended | Proprietary protein-based blocking | FO-BLI sensor regeneration [46] |
Immobilization Strategies
The method and orientation of bioreceptor immobilization significantly influence NSB:
Protein G-Mediated Antibody Orientation: Protein G-mediated immobilization of SARS CoV-2 specific antibodies on graphene oxide-functionalized platforms improves detection limits to femtomolar concentrations compared to nanomolar sensitivity with traditional methods, demonstrating how oriented immobilization enhances specificity [48].
Covalent Immobilization: EDC-NHS chemistry creates stable amide bonds between sensor surfaces and biomolecules, reducing ligand leaching that contributes to background signal [48] [51].
Self-Assembled Monolayers (SAMs): Alkanethiols on gold surfaces and silanization with (3-Aminopropyl)triethoxysilane (APTES) enable controlled presentation of functional groups for subsequent bioreceptor attachment while resisting non-specific adsorption [51].
Advanced and Emerging Approaches
AI-Enhanced Optimization: Machine learning models systematically optimize structural parameters and surface functionalization strategies, predicting optimal material compositions and surface topographies to minimize NSB while maximizing sensitivity [51] [43]. Neural networks and genetic algorithms analyze complex relationships between surface properties and sensor performance metrics to identify optimal antifouling configurations [51].
Stimuli-Responsive Bioinks: Advanced bioinks with stimuli-responsive properties enable fabrication of 3D biosensor structures that control molecular interactions and reduce fouling through dynamic surface adaptation [52].
Nanocomposite Coatings: Cross-linked bovine serum albumin with pentaamine-functionalized reduced graphene and covalently bound antibiotics prevents non-specific protein, microbial, and fibroblast attachment while maintaining biocompatibility [47].
Experimental Protocols
Protocol: Design of Experiments (DOE) for Systematic NSB Mitigation
Purpose: Systematically evaluate and optimize multiple buffer conditions and surface treatments to minimize NSB in biosensor assays.
Materials:
- Sartorius MODDE software or equivalent DOE platform
- Biosensor system (e.g., BLI, SPR, electrochemical)
- Test analyte and specific binding partner
- Potential NSB mitigators:
- Octet Kinetics Buffer
- BSA (0.1-2%)
- Tween-20 (0.01-0.1%)
- High-salt additives (100-300 mM NaCl)
- Alternative blocking agents (casein, fish gelatin)
Procedure:
- Define Experimental Objectives: Identify primary response variables (e.g., specific signal intensity, non-specific background, signal-to-noise ratio).
- Select Factors and Ranges: Choose 4-6 critical factors with appropriate ranges based on preliminary data.
- Generate Experimental Design: Create a fractional factorial or response surface methodology design using MODDE software.
- Execute Experiments: Run all conditions in randomized order to avoid bias.
- Data Analysis: Model response surfaces to identify optimal conditions and factor interactions.
- Validation: Confirm optimal conditions in triplicate using independent preparations.
Applications: This approach efficiently identifies optimal NSB mitigation conditions while evaluating multiple factors simultaneously, saving time and resources compared to one-factor-at-a-time optimization [44].
Protocol: Protein G-Mediated Antibody Immobilization for Enhanced Specificity
Purpose: Achieve oriented antibody immobilization to maximize antigen-binding capacity and minimize NSB.
Materials:
- Graphene oxide-functionalized polycarbonate track-etched (PCTE) membrane
- EDC/NHS coupling reagents
- Recombinant Protein G
- SARS CoV-2 specific antibodies (or target-specific antibodies)
- Blocking buffer (1% BSA in PBS)
- Washing buffer (PBS with 0.05% Tween-20)
Procedure:
- Surface Activation:
- Incubate GO-functionalized PCTE membrane with 20 mM EDC and 10 mM NHS in MES buffer (pH 6.0) for 30 minutes at room temperature.
- Wash with coupling buffer (pH 7.4).
Protein G Immobilization:
- Incubate activated surface with 50 µg/mL Protein G in coupling buffer for 2 hours at 25°C.
- Block remaining active esters with 1M ethanolamine (pH 8.5) for 30 minutes.
Antibody Attachment:
- Apply specific antibodies at 10-20 µg/mL in PBS for 1 hour.
- Wash with PBS-Tween to remove unbound antibodies.
Blocking:
- Incubate with 1% BSA for 1 hour to block non-specific sites.
- Rinse with storage buffer for immediate use or store at 4°C.
Validation: This protocol achieves detection limits in femtomolar concentrations for SARS CoV-2 spike protein with significantly reduced NSB compared to traditional immobilization methods [48].
Protocol: Direct FO-BLI Biosensor Operation with Biofouling Mitigation
Purpose: Detect small molecules in complex biological matrices with minimal biofouling for repeated measurements.
Materials:
- Octet K2 2-channel system with streptavidin sensors
- Biotinylated monoclonal antibody towards target (biotin-MA-CBZ)
- Target-horseradish peroxidase conjugate (CBZ-BSA-HRP)
- 3,3'-diaminobenzidine (DAB) metal precipitate solution
- High-salt SD buffer (SD buffer with 274 mM NaCl)
- SuperBlock blocking buffer
- Whole blood or serum samples
Procedure:
- Sensor Functionalization:
- Hydrate streptavidin sensors in high-salt SD buffer for 10 minutes.
- Load biotin-MA-CBZ (5 µg/mL) for 300 seconds.
- Block with SuperBlock for 15 minutes.
Competitive Detection:
- Incubate functionalized sensors with sample containing target and CBZ-BSA-HRP conjugate (1:100 dilution) for 180 seconds.
- Transfer sensors to DAB solution for signal amplification (120 seconds).
Signal Measurement:
- Measure wavelength shifts in interference pattern.
- Quantify target concentration using pre-established calibration curve.
Regeneration:
- Regenerate sensors with 10 mM glycine (pH 2.0) for 30 seconds.
- Re-equilibrate in high-salt SD buffer before next use.
Performance: This protocol enables carbamazepine detection in whole blood with detection limits of 10 ng/mL and up to 12 regeneration cycles with negligible baseline drift [46].
The Scientist's Toolkit: Essential Research Reagents
Table 3: Key Research Reagents for NSB and Biofouling Mitigation
| Reagent | Supplier Examples | Function | Application Notes |
|---|---|---|---|
| Octet Kinetics Buffer | Sartorius | Proprietary NSB mitigation | Optimized for BLI systems [44] |
| SuperBlock Blocking Buffer | Thermo Scientific | Protein-based blocking | Effective for blood-based assays [46] |
| EDC/NHS Coupling Kit | Genemore | Covalent immobilization | For stable surface functionalization [46] |
| Protein G | Multiple suppliers | Oriented antibody immobilization | Improves sensitivity 1000-fold [48] |
| Biotinylating Kit | Genemore | Bioconjugation | Enables streptavidin-biotin interaction [46] |
| Polydopamine Precursor | Sigma-Aldrich | Versatile surface coating | Biomimetic antifouling coating [50] |
| High-Contrast Grating Sensors | Custom fabrication | Dielectric sensing platform | 11.2% sensitivity improvement [49] |
| Graphene Oxide | Custom synthesis | Biosensor substrate | Enhanced electron transfer [48] |
| Sartorius MODDE Software | Sartorius | DOE optimization | Systematic condition screening [44] |
| (R)-Norfluoxetine-d5 Phthalimide (Phenyl-d5) | (R)-Norfluoxetine-d5 Phthalimide (Phenyl-d5) | Get (R)-Norfluoxetine-d5 Phthalimide (Phenyl-d5), a stable isotope-labeled metabolite for enantioselective pharmaceutical and environmental research. For Research Use Only. | Bench Chemicals |
Effective management of non-specific binding and biofouling is essential for developing biosensors with the specificity, sensitivity, and reliability required for advanced research and clinical applications. A multifaceted approach combining strategic material selection, surface engineering, buffer optimization, and oriented immobilization strategies provides the most robust foundation for overcoming these challenges. The integration of emerging technologies—particularly AI-driven optimization and advanced nanomaterials—offers promising avenues for further enhancing biosensor performance in complex biological environments. By implementing the systematic approaches and detailed protocols outlined in this application note, researchers can significantly improve biosensor specificity and translation to real-world applications.
Machine Learning for Parametric Optimization and Performance Prediction
The integration of machine learning (ML) into biosensor development represents a paradigm shift, moving from traditional trial-and-error approaches to data-driven, intelligent design. This application note details how ML algorithms can drastically accelerate the parametric optimization of biosensors and enhance the accuracy of their performance prediction. By leveraging comprehensive datasets, ML models can identify complex, non-linear relationships between fabrication parameters and sensor outcomes, reducing development time from months to weeks and significantly cutting costs. We provide a structured overview of high-performing ML models, detailed experimental protocols for their application, and a catalog of essential research tools. Framed within the broader objective of optimizing biosensor fabrication for maximum specificity, this document serves as a practical guide for researchers and scientists aiming to harness ML for next-generation biosensor engineering.
Biosensors are pivotal in diagnostics, environmental monitoring, and food safety, yet their development is often hampered by challenges such as signal noise, calibration drift, and the complex interplay of fabrication parameters that influence sensitivity and specificity [53] [54]. Traditional optimization methods are labor-intensive, costly, and inefficient for navigating high-dimensional parameter spaces.
Machine learning emerges as a transformative solution to these limitations. ML algorithms can process vast datasets from systematic experiments or simulations to predict biosensor performance with high accuracy and identify the most influential design parameters [53] [54] [51]. This capability not only streamlines the optimization process but also provides profound insights into the underlying physical and chemical processes, enabling the rational design of biosensors with enhanced specificity and performance.
Key Machine Learning Approaches in Biosensor Development
The application of ML in biosensing spans various sensor types, including electrochemical and optical platforms. Below is a summary of algorithms that have demonstrated high efficacy in predicting biosensor performance and optimizing design parameters.
Table 1: Summary of Key Machine Learning Models for Biosensor Optimization
| ML Model Category | Specific Algorithms Used | Biosensor Application | Key Performance Metrics | Reference |
|---|---|---|---|---|
| Tree-Based Ensembles | Random Forest, XGBoost, Gradient Boosting | Electrochemical biosensor signal prediction | RMSE ≈ 0.1465, R² = 1.00 | [53] [40] |
| Artificial Neural Networks (ANN) | Wide Neural Networks, Deep Neural Networks (DNN) | Prediction of optical properties in PCF sensors; Electrochemical signal prediction | R²-score > 0.99; RMSE ≈ 0.1465 | [53] [55] [56] |
| Kernel & Probabilistic Models | Gaussian Process Regression (GPR), Support Vector Regression (SVR) | Electrochemical biosensor signal prediction | RMSE ≈ 0.1465, R² = 1.00 | [53] |
| Regularized Linear Models | LASSO, Elastic-Net, Bayesian Ridge Regression | Prediction of optical biosensor parameters (effective index, confinement loss) | R²-score > 0.99, design error < 3% | [55] [56] |
| Stacked Ensemble Models | Combinations of GPR, XGBoost, and ANN | Electrochemical biosensor signal prediction | Improved prediction stability and generalization (RMSE = 0.143) | [53] |
| Explainable AI (XAI) | SHAP (SHapley Additive exPlanations) | Interpreting feature importance in PCF-SPR and electrochemical biosensors | Identifies key parameters (e.g., wavelength, enzyme amount, pH) | [53] [40] |
Insights from Model Performance
- Ensemble and Tree-Based Models often achieve top-tier performance in regression tasks for signal prediction, balancing accuracy with computational efficiency [53].
- ANN and Deep Learning models excel at capturing complex, non-linear relationships in high-dimensional data, such as those found in optical biosensor design [54] [40].
- Model Interpretability is Crucial: The use of Explainable AI (XAI) tools like SHAP analysis is critical for transforming a "black-box" prediction into an actionable design insight, revealing which parameters (e.g., enzyme amount, pH, geometric features) most significantly impact sensor performance [53] [40].
Experimental Protocols
This section outlines detailed methodologies for implementing ML-driven optimization, from data generation to model interpretation.
Protocol 1: ML-Guided Optimization of an Electrochemical Biosensor
This protocol is adapted from a comprehensive framework for predicting electrochemical biosensor responses [53].
1. Data Collection and Dataset Preparation
- Systematic Experimentation: Fabricate biosensors while systematically varying key fabrication parameters. The cited study included:
- Enzyme amount
- Glutaraldehyde concentration (crosslinker)
- pH of the measurement environment
- Scan number of conducting polymer (CP)
- Analyte concentration
- Output Measurement: Record the corresponding electronic signal intensity (e.g., current, voltage) for each fabricated sensor.
- Data Structuring: Assemble the data into a structured table where each row represents a unique sensor fabrication instance, and columns contain the input parameters and the corresponding output signal.
2. Model Training and Evaluation
- Model Selection: Train a diverse set of regression models (e.g., the 26 models from six families as in the study: linear, tree-based, kernel-based, Gaussian Process, ANN, and ensembles).
- Validation: Employ 10-fold cross-validation to robustly evaluate model performance and avoid overfitting.
- Performance Metrics: Calculate the following metrics for each model:
- Root Mean Square Error (RMSE)
- Mean Absolute Error (MAE)
- Mean Squared Error (MSE)
- Coefficient of Determination (R²)
- Model Choice: Select the best-performing model(s) based on these metrics. Consider using a stacked ensemble model to combine the strengths of top individual models (e.g., GPR, XGBoost, and ANN) for superior stability and generalization.
3. Interpretation and Design Optimization
- Feature Importance Analysis: Apply interpretability tools to the trained model.
- SHAP Analysis: Calculate SHAP values to quantify the contribution of each input parameter to the model's output prediction. This reveals global and local feature importance.
- Permutation Feature Importance: Randomly shuffle each feature and measure the resulting decrease in model performance to independently assess importance.
- Actionable Insights: Use the results to guide optimization. For instance, if SHAP shows enzyme amount and pH are the top two most critical parameters, focus experimental resources on fine-tuning these. It may also reveal that some parameters, like glutaraldehyde concentration, can be minimized to reduce cost without significantly harming performance.
Protocol 2: ML-Augmented Design of a Photonic Crystal Fiber (PCF) Biosensor
This protocol is based on work for optimizing high-sensitivity PCF-SPR biosensors using ML and XAI [40].
1. Simulation and Data Generation
- Parametric Design: Define the geometric and material parameters of the PCF-SPR sensor (e.g., pitch (Λ), gold layer thickness, air hole diameter, analyte refractive index).
- Numerical Simulation: Use a simulation tool like COMSOL Multiphysics (Finite Element Method) to compute key optical properties for each design combination.
- Output Metrics: Simulate and record:
- Effective refractive index (Neff)
- Confinement Loss (CL)
- Wavelength Sensitivity (Sλ)
- Amplitude Sensitivity (SA)
- Figure of Merit (FOM)
- Dataset Creation: Compile all input design parameters and output performance metrics into a comprehensive dataset.
2. Machine Learning for Performance Prediction
- Regression Modeling: Train ML regression models (e.g., Random Forest, Gradient Boosting, XGBoost) to predict the optical performance metrics (Neff, CL, Sλ) based on the design parameters.
- Accuracy Goal: Validate models to achieve a high coefficient of determination (R² > 0.99) and low error metrics, demonstrating they can serve as a faster, surrogate replacement for numerical simulations.
3. Explainable AI for Design Insight
- SHAP Analysis: Apply SHAP to the trained ML model to interpret its predictions.
- Identify Critical Parameters: The SHAP analysis will rank the design parameters (e.g., wavelength, analyte RI, gold thickness, pitch) by their importance in influencing sensitivity and loss.
- Informed Optimization: Use this ranking to prioritize which parameters to adjust for achieving target performance, effectively optimizing the sensor design in silico before fabrication.
Workflow Visualization
Diagram 1: Unified ML Workflow for Biosensor Optimization. This diagram illustrates the core process, from data generation through experimental or simulation means to final design optimization guided by model interpretations.
The Scientist's Toolkit: Research Reagent Solutions
Table 2: Essential Materials and Tools for ML-Augmented Biosensor Research
| Category/Item | Specific Examples | Function in Research |
|---|---|---|
| ML & Data Analysis Software | Python (scikit-learn, XGBoost, SHAP libraries), TensorFlow/PyTorch | Provides the algorithmic backbone for model training, prediction, and interpretability analysis. |
| Simulation Platforms | COMSOL Multiphysics | Used for generating large datasets of optical or electrical properties based on sensor design parameters without physical fabrication. |
| Nanomaterial Enhancements | Graphene, Gold Nanoparticles (AuNPs), Carbon Nanotubes (CNTs), MXenes | Used in the biosensor's transduction interface to improve signal amplification, sensitivity, and biocompatibility. |
| Recognition Elements | Enzymes (e.g., Glucose Oxidase), Antibodies, DNA, Whole Cells | The biological component that provides specificity by interacting with the target analyte. Their amount and immobilization are key optimization parameters. |
| Surface Functionalization Agents | Glutaraldehyde, (3-Aminopropyl)triethoxysilane (APTES), Polyethylene glycol (PEG), Polydopamine (PDA) | Chemicals used to immobilize biorecognition elements onto the transducer surface stably and with correct orientation. |
| Structural Materials (Optical Sensors) | Silver (Ag), Silicon Dioxide (SiOâ‚‚), Gold (Au) for Metal-Insulator-Metal (MIM) configurations | Form the core plasmonic and dielectric structure of optical biosensors, where their thickness and geometry are critical optimized parameters. |
The pursuit of ultra-sensitive detection in diagnostic biosensing is a cornerstone of modern biomedical research, particularly in the identification of low-abundance disease biomarkers. This application note details two powerful signal amplification techniques—Rolling Circle Amplification (RCA) and Nanostar-enhanced sensing—framed within the broader objective of optimizing biosensor fabrication for maximum specificity. RCA provides exponential signal amplification through enzymatic DNA polymerization [57], while plasmonic Nanostars exploit their unique optical properties for significant signal enhancement [50]. When integrated into biosensor design, these technologies enable researchers to achieve exceptional sensitivity and robust specificity in detecting nucleic acids, proteins, and other clinically relevant analytes, directly supporting advancements in early disease diagnosis and drug development.
The table below summarizes the core characteristics and performance metrics of these two amplification strategies.
Table 1: Comparison of Signal Amplification Techniques
| Feature | Rolling Circle Amplification (RCA) | Nanostar-Based Amplification |
|---|---|---|
| Amplification Principle | Enzymatic, isothermal nucleic acid amplification [57] | Physical enhancement via localized surface plasmon resonance (LSPR) [50] |
| Key Component | Phi29 DNA polymerase, circular DNA template [58] [57] | Gold-Silver (Au-Ag) Nanostars with sharp tips [50] |
| Typical Assay Time | ~2.5 hours (including ligation and amplification) [57] | Potentially rapid; detection within minutes post-functionalization [50] |
| Detection Limit | HClO: 1.67 nM; MPO: 0.33 ng/mL [57] | α-Fetoprotein (AFP): 16.73 ng/mL [50] |
| Key Advantage | High signal gain, label-free detection possible [57] | Intense plasmonic enhancement, multiplexing capability |
| Common Readout | Fluorescence (e.g., Thioflavin T) [57], Nanopore sensing [58] | Surface-Enhanced Raman Scattering (SERS) [50] |
Experimental Protocols
Protocol: RCA-Based Detection of Myeloperoxidase (MPO)
This protocol enables highly sensitive detection of the enzyme Myeloperoxidase through HClO generation and subsequent RCA [57].
Research Reagent Solutions
Table 2: Key Reagents for RCA-Based MPO Detection
| Reagent | Function / Description |
|---|---|
| Primer-S | Hairpin DNA primer with an embedded phosphorothioate (R-S) modification site; cleaved by HClO [57]. |
| Padlock Probe | Linear single-stranded DNA that is circularized by ligation; serves as the template for RCA [57]. |
| T4 DNA Ligase | Enzyme that catalyzes the cyclization of the Padlock probe upon hybridization to the cleaved primer [57]. |
| Phi29 DNA Polymerase | High-processivity DNA polymerase used for the isothermal RCA reaction; synthesizes long DNA concatemers [58] [57]. |
| Thioflavin T (ThT) | Fluorescent dye that binds specifically to G-quadruplexes formed in the RCA product, enabling label-free detection [57]. |
Step-by-Step Procedure
Sample Incubation and Primer Cleavage:
- Prepare a 20 µL reaction mixture containing:
- Target MPO sample (or standard)
- 1 µL of 200 µM H₂O₂
- 1 µL of 10 µM Primer-S (pre-annealed: 95°C for 5 min, slowly cooled to 25°C over 30 min)
- 2 µL of 10X Hybridization Buffer (500 mM NaCl, 100 mM Tris-HCl, 100 mM MgCl₂, 1 mg/mL BSA, pH 7.9) [57].
- Incubate at 37°C for 20 minutes. MPO catalyzes the production of HClO from Hâ‚‚Oâ‚‚ and Clâ», which cleaves the Primer-S at its phosphorothioate site.
- Prepare a 20 µL reaction mixture containing:
Padlock Probe Ligation:
- To the above mixture, add:
- 4 µL of 10X T4 DNA Ligase Reaction Buffer
- 1.5 µL of 10 µM Padlock probe
- 20 U of T4 DNA Ligase
- Nuclease-free water to a final volume of 50 µL.
- Incubate at 16°C for 2 hours. The cleaved Primer-S hybridizes to the Padlock probe, facilitating its circularization by the ligase.
- To the above mixture, add:
Rolling Circle Amplification:
- To the ligation product, add:
- 4 µL of 10X Phi29 DNA Polymerase Reaction Buffer
- 5 µL of 200 µM ThT
- 2.5 µL of 10 mM dNTPs
- 6 U of Phi29 DNA Polymerase
- Nuclease-free water to a final volume of 100 µL.
- Incubate at 30°C for 30 minutes. The Phi29 polymerase extends the primer using the circular Padlock as a template, generating a long single-stranded DNA product with tandem repeats.
- To the ligation product, add:
Signal Detection:
- Transfer an aliquot of the RCA product to a spectrophotometer cuvette or plate reader.
- Record the fluorescence spectrum using an excitation wavelength of 425 nm and measure the emission intensity at 485 nm. The fluorescence intensity is proportional to the MPO concentration [57].
Diagram 1: RCA Biosensor Workflow for MPO Detection
Protocol: SERS-Based Immunoassay Using Au-Ag Nanostars for α-Fetoprotein (AFP)
This protocol describes a sensitive immunoassay for the cancer biomarker AFP using Au-Ag Nanostars as a SERS-active platform [50].
Research Reagent Solutions
Table 3: Key Reagents for Nanostar-Based SERS Immunoassay
| Reagent | Function / Description |
|---|---|
| Au-Ag Nanostars | Core plasmonic nanoparticles with sharp, branched tips that provide intense electromagnetic field enhancement for SERS [50]. |
| Mercaptopropionic Acid (MPA) | A bifunctional molecule that forms a self-assembled monolayer on the nanostar surface, facilitating subsequent antibody conjugation [50]. |
| EDC/NHS | Crosslinking agents (1-Ethyl-3-(3-dimethylaminopropyl) carbodiimide / N-Hydroxysuccinimide) that activate carboxyl groups for covalent amide bond formation with antibodies [50]. |
| Monoclonal Anti-AFP Antibody | The capture biorecognition element that confers specificity towards the AFP antigen [50]. |
Step-by-Step Procedure
Nanostar Synthesis and Concentration:
Surface Functionalization and Antibody Conjugation:
- Incubate the concentrated nanostars with Mercaptopropionic Acid (MPA) to form a self-assembled monolayer.
- Activate the terminal carboxylic acid groups of MPA using a fresh mixture of EDC and NHS crosslinkers for 30 minutes at room temperature [50].
- Add monoclonal anti-AFP antibodies to the activated nanostars and incubate to allow covalent conjugation via amide bond formation between antibody amine groups and the activated carboxyls.
Immunoassay and SERS Detection:
- Incubate the functionalized nanostars with the sample containing the target AFP antigen.
- After a suitable incubation period for antigen-antibody binding, measure the SERS spectrum.
- The assay exploits the intrinsic vibrational modes of the captured AFP biomarker for detection, eliminating the need for an external Raman reporter [50]. The SERS signal intensity is correlated with the AFP concentration.
Advanced Integration and Optimization
Single-Molecule Resolution with Solid-State Nanopores
RCA products can be analyzed at the single-molecule level using solid-state nanopores, providing detailed insights into amplification kinetics and product structure. This label-free platform monitors changes in ionic current as DNA concatemers translocate through a nanoscale pore. Key parameters like translocation dwell time and current blockage increase with RCA incubation time (e.g., 30 min, 1 h, 2 h), correlating with the generation of longer, more complex DNA structures. This approach has been successfully applied to detect the miRNA biomarker miR-21, demonstrating its potential for sensitive, structure-resolved diagnostics [58].
Machine Learning for Biosensor Optimization
The integration of machine learning (ML) represents a paradigm shift in optimizing biosensor design for maximum performance. ML algorithms, such as multi-objective Particle Swarm Optimization (PSO), can systematically refine structural parameters (e.g., metal layer thickness, incident angle) to concurrently enhance multiple sensing metrics like sensitivity (S) and figure of merit (FOM) [16]. This data-driven approach has enabled the development of surface plasmon resonance (SPR) biosensors with a 230% enhancement in sensitivity and a limit of detection as low as 54 ag/mL (0.36 aM), pushing the boundaries towards single-molecule detection [16]. Similarly, ML has been used to optimize graphene-based biosensors for breast cancer detection, achieving a peak sensitivity of 1785 nm/RIU [43].
Rolling Circle Amplification and Nanostar-based sensing provide two powerful, complementary paths for enhancing biosensor signal output. The enzymatic amplification of RCA offers exceptionally high gains ideal for detecting low-copy nucleic acids and small molecules, while the plasmonic enhancement of Nanostars provides a robust platform for rapid protein detection and multiplexed assays. The protocols and data presented herein provide a foundation for researchers to incorporate these techniques into biosensor fabrication workflows. Furthermore, the integration of these methods with advanced readout platforms like nanopores and machine learning-driven optimization paves the way for a new generation of biosensors that achieve unprecedented specificity, sensitivity, and single-molecule resolution for critical applications in research and clinical diagnostics.
Tailoring Membrane Properties and Fluidics in Paper-Based Biosensors
Paper-based electrochemical biosensors have emerged as a revolutionary technology in healthcare diagnostics, environmental monitoring, and agrifood analysis due to their affordability, portability, ease of use, and environmental sustainability [60] [61]. These analytical devices utilize paper as the primary functional material, capitalizing on its unique properties such as high porosity, flexibility, and innate capillary action for pump-free fluid management [60]. The overriding goal in this field is to optimize biosensor fabrication for maximum specificity, sensitivity, and reliability, which requires precise tailoring of membrane properties and fluidic control. Paper serves not only as a simple substrate but as an ecodesigned smart material capable of managing fluid samples through pump-free microfluidics, preconcentrating target analytes, facilitating chemical sample treatment, and enabling reagent addition [60]. The simplicity and cost-effectiveness of these biosensors make them particularly suitable for point-of-care (POC) applications, especially in resource-limited settings where traditional diagnostic tools may be inaccessible [61]. This application note provides detailed protocols and analytical frameworks for researchers and drug development professionals seeking to advance biosensor performance through controlled membrane engineering and fluidic design.
Membrane Engineering and Substrate Selection
The performance of paper-based biosensors is fundamentally governed by the structural and chemical properties of the membrane substrate. Cellulose-based matrices provide a three-dimensional porous network that influences fluid transport, reagent immobilization, and ultimately, detection sensitivity.
Material Properties and Selection Criteria
Paper substrates offer varying characteristics based on their cellulose fiber arrangement, porosity, and chemical modifications. The hierarchical porous structure of paper allows for efficient capillary-driven fluid transport without requiring external pumping systems [60]. This intrinsic property enables the development of self-contained diagnostic devices that can manage samples through predefined microfluidic pathways. When selecting membrane materials, researchers should consider pore size distribution, wettability, protein adsorption capacity, and chemical compatibility with recognition elements and signal transducers.
The surface chemistry of paper membranes can be modified through various treatments to enhance their functionality for biosensing applications. Chemical modifications can introduce functional groups for covalent immobilization of biorecognition elements, reduce non-specific binding, or create selective barriers that filter interfering substances from complex samples [60]. These modifications are crucial for improving biosensor specificity, particularly when dealing with complex matrices such as blood, urine, or food samples.
Quantitative Membrane Properties
Table 1: Membrane Properties and Performance Characteristics
| Material Type | Average Pore Size (µm) | Porosity (%) | Capillary Flow Rate (mm/s) | Protein Binding Capacity (µg/cm²) | Recommended Applications |
|---|---|---|---|---|---|
| Chromatography Paper | 10-25 | 60-70 | 0.5-1.5 | 5-15 | General purpose diagnostics, educational kits |
| Nitrocellulose Membrane | 0.1-10 | 70-85 | 1.0-3.0 | 50-500 | High-sensitivity lateral flow assays, protein detection |
| Filter Paper | 2-20 | 50-60 | 0.3-1.0 | 10-25 | Sample preparation, filtration, separation |
| Glass Fiber | 0.5-5 | >90 | 2.0-5.0 | 1-10 | Blood separation, plasma extraction |
| Paper-Polymer Composite | Customizable | 40-95 | 0.1-2.0 | 20-200 | Specialized assays, enhanced functionality |
Fluidic Control and Microfluidic Integration
Precise fluidic control is essential for achieving reproducible results in paper-based biosensors. The integration of microfluidic principles allows for sophisticated fluid handling, reagent storage, and sequential delivery without external instrumentation.
Fundamental Fluidic Principles
Paper-based microfluidics operates primarily on capillary action, where the spontaneous wicking of liquids through porous media is governed by the Young-Laplace equation and Jurin's law. The flow rate depends on pore geometry, surface energy, and fluid viscosity. By creating hydrophobic barriers on paper substrates, fluid flow can be directed along specific pathways, enabling complex fluidic operations such as mixing, splitting, and timing [61]. The development of microfluidic paper-based analytical devices (µPADs) has significantly expanded the functionality of these systems by integrating lab-on-a-chip capabilities, allowing multistep biochemical reactions and multiplexed detection on a single platform [61].
Fabrication Techniques for Fluidic Control
Several fabrication methods have been developed to create precise fluidic patterns on paper substrates:
Wax Printing: This approach involves depositing wax onto paper to create hydrophobic barriers that define hydrophilic channels. The technique is simple, cost-effective, and suitable for rapid prototyping. Optimal parameters include nozzle temperatures of 64-85°C and print speeds between 40-60 mm/s [61]. After printing, the paper is heated to approximately 130-150°C to allow wax penetration through the thickness, creating complete hydrophobic barriers.
Inkjet Printing: This method enables precise deposition of functional inks, including conductive materials, biological reagents, and polymeric barriers. Inkjet printing offers high resolution (40-50 µm features) and compatibility with various ink formulations [61]. The main advantages include digital pattern control, minimal material waste, and the ability to create multilayer structures.
Photolithography: Using UV-sensitive polymers, this technique creates high-resolution fluidic channels (50-100 µm) through selective exposure and development. Although requiring more specialized equipment, photolithography produces well-defined, reproducible patterns with excellent barrier integrity [61].
Pen-on-Paper and Pencil Drawing: These manual techniques provide ultra-low-cost alternatives for electrode fabrication and simple patterning. The pencil-drawing method, using graphite pencils, has been successfully utilized for producing conductive electrodes and demonstrated applicability in detecting pathogens such as Escherichia coli [61].
Table 2: Fabrication Methods for Paper-Based Biosensors
| Fabrication Method | Resolution (µm) | Equipment Cost | Throughput | Advantages | Limitations |
|---|---|---|---|---|---|
| Wax Printing | 100-500 | Low | Medium-High | Low cost, rapid prototyping | Limited resolution, thermal treatment required |
| Screen Printing | 40-50 | Medium | High | High conductivity, scalable | Requires mesh screens, ink optimization |
| Inkjet Printing | 20-50 | Medium | Medium | Digital patterning, multi-material | Nozzle clogging, ink development |
| Photolithography | 50-100 | High | Low-Medium | High resolution, precise features | Complex process, chemical handling |
| Pen/Pencil Drawing | >500 | Very Low | Low | Extremely low cost, accessible | Low resolution, poor reproducibility |
| Laser Cutting | 50-200 | Medium | Medium | No masks required, direct writing | Carbon residue, specialized equipment |
Experimental Protocols
Protocol 1: Fabrication of Wax-Printed Microfluidic Biosensors
Objective: Create hydrophobic barriers on chromatography paper to define microfluidic channels for biosensing applications.
Materials:
- Whatman Grade 1 chromatography paper
- Solid ink printer (e.g., Xerox ColorQube)
- Hot plate or oven
- Hydrophobic barrier imaging solution (optional)
- Cutting mat and precision knife
Procedure:
- Design Creation: Design the microfluidic pattern using vector-based software (e.g., Adobe Illustrator). Include sample introduction zones, fluidic channels, reaction zones, and detection areas. Maintain channel widths of 1-3 mm for optimal capillary flow.
- Printing: Load the paper into the solid ink printer and print the pattern. Ensure the printed wax density is 5-10 g/m² for complete barrier formation.
- Heating: Place the printed paper on a hot plate preheated to 130°C for 120 seconds. Alternatively, use an oven at 150°C for 120-180 seconds. The wax should melt and penetrate completely through the paper substrate, appearing slightly translucent.
- Quality Control: Verify barrier integrity by applying aqueous dye solution (e.g., 0.1% bromophenol blue) to the hydrophilic zones. The dye should be confined within the patterned areas without leakage.
- Storage: Store the fabricated devices in a desiccator at room temperature until use.
Troubleshooting:
- Incomplete barrier formation: Increase heating temperature or duration
- Uneven wax penetration: Ensure uniform contact with the heat source
- Paper scorching: Reduce heating temperature
Protocol 2: Immobilization of Biorecognition Elements
Objective: Functionalize paper membranes with enzymes, antibodies, or nucleic acids for specific target detection.
Materials:
- Fabricated paper devices
- Biorecognition elements (e.g., glucose oxidase, antibodies, DNA probes)
- Cross-linking reagents (e.g., glutaraldehyde, EDC/NHS)
- Blocking buffer (e.g., BSA, casein)
- Washing buffer (e.g., PBS with Tween 20)
- Micropipettes or precision dispensing system
Procedure:
- Surface Activation: For covalent immobilization, treat the paper surface with 2.5% glutaraldehyde in phosphate buffer (0.1 M, pH 7.4) for 30 minutes at room temperature. Rinse thoroughly with deionized water.
- Bioreceptor Deposition: Prepare the biorecognition element solution at optimal concentration (typically 0.1-2.0 mg/mL in appropriate buffer). Dispense 5-20 µL to the detection zones using precision pipetting.
- Immobilization: Incubate the devices for 2 hours at room temperature in a humidified chamber to prevent evaporation.
- Blocking: Apply 20-50 µL of blocking solution (1-5% BSA or casein in PBS) to all functionalized areas and incubate for 1 hour to minimize non-specific binding.
- Drying: Air-dry the devices overnight at 4°C or use vacuum desiccation for 2 hours.
- Quality Assessment: Validate immobilization efficiency using colorimetric or fluorescent tags specific to the biorecognition element.
Optimization Notes:
- Immobilization pH and ionic strength should be optimized for each biorecognition element
- Test various blocking agents to identify the most effective for your specific application
- Include positive and negative controls in each batch
Protocol 3: Electrochemical Detection System Integration
Objective: Incorporate electrode systems for sensitive electrochemical detection of target analytes.
Materials:
- Conductive inks (carbon, silver/silver chloride, gold)
- Screen printing equipment or conductive pens
- Potentiostat
- Reference electrode solution
- Insulating layer material
Procedure:
- Electrode Design: Design three-electrode system (working, reference, counter) compatible with your fluidic architecture.
- Electrode Printing: Apply conductive ink to predefined areas using screen printing (for mass production) or conductive pens (for prototyping). Carbon-based inks are suitable for most applications, while noble metals enhance sensitivity.
- Reference Electrode Formation: For silver/silver chloride reference electrodes, expose printed silver electrodes to ferric chloride solution (0.1 M for 30 seconds) to form a consistent chloride layer.
- Insulation: Apply dielectric layers to define exact electrode areas and prevent cross-talk between adjacent electrodes.
- Curing: Heat the electrodes according to ink manufacturer specifications (typically 60-120°C for 15-60 minutes).
- Electrochemical Characterization: Perform cyclic voltammetry in standard solutions (e.g., 1 mM potassium ferricyanide) to verify electrode performance.
Signaling Pathways and Experimental Workflows
The detection mechanism in paper-based biosensors translates molecular recognition events into measurable signals. Understanding these pathways is essential for optimizing biosensor specificity.
Diagram 1: Biosensor signaling and fluidic workflow
The signaling pathway begins with sample application, where the liquid sample is introduced to the device through the sample introduction zone. Capillary forces immediately wick the fluid through predefined pathways toward the detection zone [60]. During fluidic transport, the sample may encounter dried reagents that reconstitute and mix with the analyte. The biorecognition event occurs when the target analyte interacts with immobilized recognition elements (enzymes, antibodies, aptamers) in the detection zone [2]. This molecular interaction triggers the signal transduction mechanism, which may involve electrochemical, colorimetric, or fluorescent changes. The resulting signal is then quantified, either visually or instrumentally, and correlated with analyte concentration.
Diagram 2: Biosensor components and specificity control
The core biosensor components work in concert to transform biological recognition into quantifiable signals. The bioreceptor provides molecular specificity through selective binding to the target analyte [2]. This interaction generates a physicochemical change (pH, electron transfer, mass change) that the transducer converts into a measurable signal [2]. Specificity is controlled at multiple points: membrane selection influences non-specific binding and flow characteristics; surface chemistry determines bioreceptor orientation and activity; and fluidic design controls sample-reagent interaction timing and sequence. Optimization of these control points is essential for maximizing biosensor specificity in complex sample matrices.
The Scientist's Toolkit: Research Reagent Solutions
Table 3: Essential Research Reagents for Paper-Based Biosensor Development
| Reagent/Chemical | Function | Application Example | Optimal Concentration | Storage Conditions |
|---|---|---|---|---|
| Glucose Oxidase | Enzyme bioreceptor | Glucose monitoring in diabetes | 1-5 mg/mL in PBS | -20°C, desiccated |
| Horseradish Peroxidase | Signal generation enzyme | Colorimetric detection | 0.1-1.0 mg/mL | 4°C in dark |
| Bovine Serum Albumin | Blocking agent | Reduce non-specific binding | 1-5% in PBS | 4°C |
| Glutaraldehyde | Crosslinking reagent | Covalent immobilization | 2.5% in buffer | Room temperature |
| Potassium Ferricyanide | Redox mediator | Electron transfer in detection | 1-10 mM in buffer | 4°C, dark |
| N-Hydroxysuccinimide | Carboxyl group activation | Bioreceptor immobilization | 0.1-0.5 M in buffer | -20°C, desiccated |
| N-(3-Dimethylaminopropyl)-N'-ethylcarbodiimide | Carboxyl group activation | Bioreceptor immobilization | 0.1-0.5 M in aqueous solution | -20°C, desiccated |
| Silver/Silver Chloride Ink | Reference electrode | Three-electrode systems | As supplied | Room temperature |
| Carbon Nanotube Inks | Working electrode | Enhanced sensitivity | 0.1-1.0% dispersions | Room temperature |
| Gold Nanoparticles | Signal amplification | Optical and electrochemical | 5-20 nm diameter | 4°C |
Advanced Applications and Future Perspectives
Recent advancements in paper-based biosensors include integration with digital technologies, particularly smartphones, which can enhance signal acquisition, automate interpretation, and enable cloud-based data sharing for real-time epidemiological monitoring [61]. The incorporation of novel materials such as metal-organic frameworks (MOFs) into paper matrices has shown promise in improving sensor stability, selectivity, and signal transduction efficiency [61]. Likewise, the use of nanostructured materials, including reduced graphene oxide and gold nanoparticles, has significantly enhanced sensitivity, enabling the reliable detection of low-concentration biomarkers with high precision [61] [2].
The emerging field of 3D bioprinting technologies and bioink development is enabling significant advances in miniaturized and integrated biosensors [52]. Bioinks containing bioreceptors immobilized within porous 3D structures can significantly amplify signals, while biocompatible and mechanically flexible systems uniquely enable wearable chem- and bio-sensors [52]. These advancements are accelerating translation by enabling the production of high-performance, reproducible, and flexible analytical devices.
Future development should focus on addressing current limitations in scalability, reproducibility, and detection limits. Multidisciplinary approaches combining materials science, microfluidics, nanotechnology, and data science will drive the next generation of paper-based biosensors toward clinical validation and commercial implementation.
Validation Frameworks and Comparative Performance Metrics for Biosensor Specificity
The relentless innovation in biosensor technology necessitates rigorous analytical validation to ensure these devices are "fit for purpose," particularly in pharmaceutical development and clinical diagnostics. The figures of merit—Limit of Detection (LOD), Limit of Quantitation (LOQ), and Selectivity—form the foundational triad that characterizes the practical capability and reliability of an analytical method [62] [63]. Establishing these parameters is not a mere regulatory formality but a critical exercise in understanding the capabilities and limitations of a biosensor [62]. Within the context of optimizing biosensor fabrication, a meticulous examination of LOD, LOQ, and selectivity provides the quantitative evidence needed to correlate specific design choices, such as nanomaterial integration or surface engineering, with enhanced analytical performance [64]. This document provides detailed application notes and protocols for the accurate determination of these essential figures of merit, framed specifically for biosensor research and development.
Theoretical Foundations
2.1 Definitions and Hierarchical Relationship A clear understanding of the distinct definitions of LoB, LOD, and LOQ is paramount. These terms describe a hierarchy of sensitivity, from simply discerning signal from background noise to achieving reliable quantification [62] [63].
Limit of Blank (LoB): The LoB is defined as the highest apparent analyte concentration expected to be found when replicates of a blank sample (containing no analyte) are tested [62]. It represents the upper threshold of background noise, establishing the baseline above which a signal is considered detectable.
Limit of Detection (LOD): The LOD is the lowest analyte concentration that can be reliably distinguished from the LoB. It is the point at which detection is feasible, though not necessarily with precise accuracy [62] [65]. A signal at the LOD has a low probability of being a false positive.
Limit of Quantitation (LOQ): The LOQ is the lowest concentration at which the analyte can not only be reliably detected but also quantified with acceptable precision and accuracy (bias) [62]. The LOQ is always greater than or equal to the LOD and is defined by meeting pre-defined goals for imprecision and bias.
Table 1: Summary of Key Figures of Merit
| Parameter | Definition | Key Characteristic | Typical Statistical Basis |
|---|---|---|---|
| Limit of Blank (LoB) | Highest measurement result expected for a blank sample [62]. | Defines the noise floor of the assay. | LoB = Mean~blank~ + 1.645(SD~blank~) [62] |
| Limit of Detection (LOD) | Lowest concentration reliably distinguished from the LoB [62]. | Detection is feasible, but quantification is unreliable. | LOD = LoB + 1.645(SD~low concentration sample~) or 3.3σ/S [62] [66] |
| Limit of Quantitation (LOQ) | Lowest concentration quantified with acceptable precision and accuracy [62]. | Meets pre-defined goals for bias and imprecision. | LOQ = 10σ/S [66] [67] |
| Selectivity | Ability to detect analyte without influence from other sample constituents [68]. | Ensures accuracy in complex matrices. | Measured via interference tests and signal differentiation. |
2.2 The Critical Role of Selectivity Selectivity is the ability of an analytical method to detect the target analyte without being influenced by other constituents in the sample matrix [68]. For biosensors, this is one of the key advantages, as it allows for the determination of an analyte in a complex mixture without prior separation. However, a biosensor's response can be influenced by electroactive compounds that oxidize or reduce at similar potentials, as well as by enzyme inhibitors, activators, or alternative substrates present in the sample [68]. Achieving high selectivity is therefore intrinsically linked to the biosensor's design, including the specificity of the biorecognition element, the use of permselective membranes, the application of sentinel sensors, and the operational potential window.
Experimental Protocols for LOD and LOQ Determination
Multiple standardized approaches exist for determining LOD and LOQ. The following protocols are adapted from CLSI EP17 and ICH Q2(R1) guidelines and can be applied to biosensor characterization [62] [66] [63].
3.1 Protocol 1: Determination via Blank and Low-Concentration Sample Analysis This method is robust and directly addresses the statistical overlap between blank and low-concentration sample responses [62].
Sample Preparation:
- Prepare a minimum of 60 replicates of a blank sample (establishment phase; 20 for verification) in the appropriate biological matrix (e.g., buffer, serum). The sample must be commutable with patient specimens [62].
- Prepare a minimum of 60 replicates of a sample containing a low concentration of analyte (establishment phase; 20 for verification) near the expected LOD. The analyte concentration should be sufficient to produce a signal distinguishable from the blank in most replicates [62].
Measurement: Analyze all replicates in a randomized sequence to avoid systematic drift.
Data Analysis:
- Calculate LoB: LoB = mean~blank~ + 1.645(SD~blank~). This one-sided confidence interval ensures 95% of blank measurements fall below this value [62].
- Calculate LOD: LOD = LoB + 1.645(SD~low concentration sample~). This ensures that 95% of measurements at the LOD will exceed the LoB, resulting in a 5% probability of false negative (β error) at the LOD [62].
Verification: Analyze multiple samples (e.g., n=20) at the calculated LOD concentration. The LOD is considered verified if no more than 5% of the results fall below the LoB [62].
The following workflow outlines this experimental and calculation process:
Figure 1: Experimental workflow for determining LOD and LOQ using blank and low-concentration sample analysis.
3.2 Protocol 2: Determination via Calibration Curve Slope This approach is suitable for methods where the calibration curve is linear near the detection limit and is frequently used in chromatographic and biosensor applications [66] [67].
Sample Preparation: Prepare a calibration curve with a minimum of 5 concentrations in the range of the expected LOD and LOQ. Each concentration should be analyzed in replicate (e.g., n=3-6) [66] [63].
Measurement: Analyze the calibration standards and perform a linear regression analysis.
Data Analysis:
Validation: The estimated LOD and LOQ must be validated experimentally [66]. Prepare and analyze multiple replicates (e.g., n=6) at the calculated LOD and LOQ concentrations. The LOD should consistently produce a signal distinguishable from the blank (e.g., via visual evaluation or a signal-to-noise ratio of approximately 3:1). The LOQ should demonstrate acceptable precision (e.g., ±15% CV) and accuracy [66].
Table 2: Comparison of LOD and LOQ Determination Methods
| Aspect | Blank/Low-Concentration Method | Calibration Curve Method |
|---|---|---|
| Governing Guidelines | CLSI EP17 [62] | ICH Q2(R1) [66] [63] |
| Key Strength | Directly accounts for distribution of both blank and low-concentration samples; highly empirical. | Simpler and quicker; utilizes standard calibration data. |
| Sample Requirements | Large number of blank and low-concentration replicates (n=60 for establishment). | Calibration curve with replicates in the low concentration range. |
| Primary Output | LOD, with LOQ determined separately based on precision goals. | Both LOD and LOQ. |
| Validation Requirement | Verify with samples at the LOD concentration [62]. | Confirm S/N and precision at calculated LOD/LOQ [66]. |
Strategies for Establishing and Validating Selectivity
Selectivity is paramount for biosensors operating in complex matrices like blood, urine, or environmental samples. The following strategies and protocols are employed to ensure selective measurements.
4.1 Experimental Protocol for Assessing Interferences The core test for selectivity involves challenging the biosensor with potential interferents.
Identify Potential Interferents: Based on the sample matrix and application, compile a list of likely interfering substances. For physiological fluids, these may include ascorbic acid, uric acid, acetaminophen, lactate, and other endogenous compounds [68].
Sample Preparation:
- Prepare a control sample containing the analyte at a known concentration (e.g., near the LOQ or a medical decision level).
- Prepare test samples containing the same concentration of analyte plus each potential interferent at the maximum concentration expected in the relevant sample matrix.
- Prepare a sample containing all potential interferents combined (without analyte) to check for additive effects.
Measurement: Analyze the control and test samples in replicate (n ≥ 3).
Data Analysis: Calculate the recovery of the analyte in each test sample relative to the control. A deviation outside pre-defined acceptance criteria (e.g., ±15%) indicates significant interference [68].
4.2 Design Strategies for Enhanced Selectivity Biosensor fabrication can be optimized to incorporate selectivity from the ground up. The following diagram categorizes the primary design strategies:
Figure 2: A taxonomy of strategies to enhance biosensor selectivity, spanning physical, electronic, biochemical, and computational approaches.
Research Reagent Solutions for Fabrication and Validation
The following table details key materials and reagents essential for fabricating optimized biosensors and validating their analytical figures of merit.
Table 3: Essential Research Reagents for Biosensor Fabrication and Validation
| Reagent / Material | Function / Application | Considerations for Use |
|---|---|---|
| Permselective Membranes (e.g., Nafion, cellulose acetate, chitosan) | Coating to repel charged interferents (e.g., ascorbic acid, uric acid) or limit access by size, thereby improving selectivity [68] [68]. | Membrane thickness and charge density must be optimized to avoid hindering analyte diffusion and increasing response time. |
| Redox Mediators & Redox Polymers (e.g., ferrocene derivatives, osmium complexes) | Shuttle electrons from enzyme to electrode, lowering the operating potential and minimizing the electrochemical window where interferents are active [68]. | Biocompatibility and long-term stability are key concerns. "Wired" enzyme architectures can enhance stability and selectivity. |
| Nanomaterials (e.g., carbon nanotubes, graphene, metal nanoparticles) | Increase electroactive surface area, enhance electron transfer kinetics, and improve catalytic activity, leading to lower LOD and higher sensitivity [64]. | Functionalization is often required for effective enzyme immobilization and to prevent aggregation. |
| Enzyme Inhibitors / Activators | Used in inhibition-based biosensors or to study the effect of sample components on biosensor response (selectivity testing) [68]. | Knowledge of inhibition constants (K~i~) and mechanisms is crucial for accurate interpretation. |
| Sentinel Sensor (BSA-loaded or enzyme-free electrode) | A control sensor lacking the specific biorecognition element. Its signal, when subtracted from the biosensor signal, corrects for non-specific signals and electrochemical interferences [68] [64]. | The immobilization matrix must be identical to the biosensor to ensure identical diffusion and non-specific binding properties. |
Concluding Remarks
Establishing LOD, LOQ, and selectivity is a non-negotiable component of robust biosensor development. The protocols and strategies outlined herein provide a framework for researchers to generate defensible data that accurately reflects the performance of their fabricated biosensors. By systematically applying these methods—from the statistical determination of detection limits to the strategic implementation of permselective membranes and sentinel sensors—researchers can optimize biosensor design, demonstrate fitness-for-purpose, and provide reliable data for drug development and clinical diagnostics. Ultimately, a thorough investigation of these analytical figures of merit bridges the gap between innovative fabrication and the creation of a validated, trustworthy analytical device.
Alanine aminotransferase (ALT) is a crucial biomarker for liver health, with elevated levels in blood indicating potential damage from conditions such as hepatitis, liver cirrhosis, or fatty liver disease [37] [69]. Conventional ALT detection methods are often expensive, time-consuming, and require trained personnel, creating a need for robust, cost-effective alternatives [37]. Amperometric biosensors represent a promising solution, with pyruvate oxidase (POx) and glutamate oxidase (GlOx) serving as the primary biorecognition elements for detecting the products of the ALT enzymatic reaction [37]. This application note provides a detailed comparative evaluation of these two biosensor designs, framed within the broader context of optimizing biosensor fabrication for maximum specificity. We present structured quantitative data, detailed experimental protocols, and visual workflows to guide researchers and scientists in the rational development of clinically relevant ALT biosensing devices.
Biosensing Principles and Signaling Pathways
ALT catalyzes the reversible transamination between L-alanine and α-ketoglutarate (α-KG), producing pyruvate and L-glutamate [37]. Since ALT itself is not electroactive, its activity is measured indirectly by detecting the concentration of these products. The two biosensor strategies differ in their target product and the subsequent oxidase reaction used to generate a measurable amperometric signal.
The following diagram illustrates the distinct signaling pathways for the GlOx-based and POx-based biosensors.
Comparative Analytical Performance
A systematic evaluation under identical conditions reveals a distinct trade-off between the analytical performance of the two biosensor configurations [37]. The table below summarizes the key performance parameters for a direct comparison.
Table 1: Comparative Analytical Performance of POx-based and GlOx-based ALT Biosensors [37]
| Analytical Parameter | POx-Based Biosensor | GlOx-Based Biosensor |
|---|---|---|
| Linear Range | 1–500 U/L | 5–500 U/L |
| Limit of Detection (LOD) | 1 U/L | 1 U/L |
| Sensitivity (at 100 U/L ALT) | 0.75 nA/min | 0.49 nA/min |
| Bioreceptor Immobilization Method | Entrapment in PVA-SbQ polymer | Covalent crosslinking with glutaraldehyde (GA) |
| Optimal Immobilization pH | pH 7.4 | pH 6.5 |
| Key Advantages | Higher sensitivity; Uniquely specific to ALT reaction. | Greater stability in complex solutions; Simpler, lower-cost working solution. |
| Key Limitations | More complex working solution. | Can be affected by AST activity; Potentially lower specificity for ALT. |
Detailed Experimental Protocols
Electrode Pretreatment and Interference Suppression Layer
A critical first step in both biosensor fabrication is the modification of the platinum working electrode with a semi-permeable membrane to minimize interference from electroactive compounds like ascorbic acid present in biological samples [37].
Procedure:
- Polish the platinum disc working electrode with an appropriate slurry (e.g., alumina) and rinse thoroughly with deionized water and ethanol.
- Electrochemically clean the electrode by performing cyclic voltammetry in a 0.5 M sulfuric acid solution.
- Prepare a 5 mM solution of meta-phenylenediamine (m-PD) in 10 mM phosphate buffer (pH 6.5).
- Immerse the cleaned electrode in the m-PD solution.
- Perform electrochemical polymerization using cyclic voltammetry, scanning between 0 V and 0.9 V (vs. Ag/AgCl) at a scan rate of 0.02 V/s for 10-20 cycles.
- A stable voltammogram indicates complete surface coverage. The resulting poly(meta-phenylenediamine) (PPD) membrane allows Hâ‚‚Oâ‚‚ diffusion while blocking larger interfering molecules [37].
Fabrication of the POx-Based Bioselective Membrane
The POx-based biosensor utilizes an entrapment method for enzyme immobilization, which encloses the enzyme within a polymer matrix [37] [70].
Procedure:
- Prepare an enzyme gel mixture containing:
- 10% (v/v) Glycerol (for membrane elasticity)
- 5% (w/v) Bovine Serum Albumin (BSA, as a stabilizer)
- 4.86 U/µL Pyruvate Oxidase (POx)
- 25 mM HEPES buffer (pH 7.4)
- Mix this enzyme gel with a 19.8% (w/v) solution of polyvinyl alcohol with steryl pyridinium groups (PVA-SbQ) photopolymer in a 1:2 ratio. The final mixture will contain approximately 1.62 U/µL POx and 13.2% PVA-SbQ.
- Pipette 0.15 µL of the final mixture onto the surface of the pre-modified platinum working electrode.
- Photopolymerize the membrane by exposing it to UV light (365 nm) for approximately 8 minutes until an energy dose of 2.4 J is delivered.
- Rinse the fabricated biosensor 2-3 times with working buffer for 3 minutes each to remove any unbound molecules before measurements [37].
Fabrication of the GlOx-Based Bioselective Membrane
The GlOx-based biosensor employs covalent crosslinking for enzyme immobilization, which creates stable bonds between enzyme molecules and the electrode surface [37] [70].
Procedure:
- Prepare an enzyme gel mixture in 100 mM phosphate buffer (pH 6.5) containing:
- 10% (v/v) Glycerol
- 4% (w/v) Bovine Serum Albumin (BSA)
- 8% (w/v) Glutamate Oxidase (GlOx)
- Mix this enzyme gel with a 0.5% (v/v) glutaraldehyde (GA) solution in a 1:2 ratio. The final mixture will contain approximately 2.67% GlOx and 0.3% GA.
- Pipette 0.05 µL of the final mixture onto the surface of the pre-modified platinum working electrode.
- Allow the sensor to air-dry for 35 minutes at room temperature to complete the crosslinking process.
- Rinse the fabricated biosensor with working buffer to remove any unbound enzymes or crosslinker before measurements [37].
Measurement of ALT Activity
The protocol for measuring ALT activity is consistent for both types of biosensors after fabrication [37].
Procedure:
- Prepare the working solution containing the necessary substrates and co-factors for the ALT reaction and the respective oxidase reaction. The POx system requires the addition of Thiamine Pyrophosphate (TPP) and Mg²⺠as cofactors [37].
- Place the biosensor into a standard three-electrode electrochemical cell (2 mL volume) containing the working solution under stirred conditions at room temperature.
- Apply a constant potential of +0.6 V (vs. Ag/AgCl) to the working electrode using a potentiostat.
- Allow the background current to stabilize.
- Introduce the sample containing ALT into the cell.
- Monitor the change in amperometric current over time. The rate of change in current (nA/min) is proportional to the generated Hâ‚‚Oâ‚‚, which in turn corresponds to the ALT activity in the sample [37].
The following workflow summarizes the complete fabrication and measurement process.
The Scientist's Toolkit: Research Reagent Solutions
Selecting the appropriate reagents and understanding their role is critical for the successful fabrication and optimization of these biosensors.
Table 2: Essential Research Reagents for ALT Biosensor Fabrication
| Reagent / Material | Function / Role | Key Consideration / Rationale |
|---|---|---|
| Pyruvate Oxidase (POx) | Biorecognition element for the POx-pathway; catalyzes the oxidation of pyruvate to produce H₂O₂. | Source: Aerococcus viridans; requires TPP and Mg²⺠as cofactors for activity [37]. |
| Glutamate Oxidase (GlOx) | Biorecognition element for the GlOx-pathway; catalyzes the oxidation of L-glutamate to produce Hâ‚‚Oâ‚‚. | Recombinant form from Streptomyces sp. is available; may also react with AST-produced glutamate, affecting ALT specificity [37]. |
| PVA-SbQ Polymer | Photo-crosslinkable polymer used for enzyme entrapment in the POx-biosensor. | Provides a porous matrix that retains the enzyme while allowing substrate and product diffusion [37]. |
| Glutaraldehyde (GA) | Homobifunctional crosslinker for covalent immobilization of GlOx. | Creates stable covalent bonds between enzyme molecules and the BSA/electrode surface; concentration must be optimized to avoid excessive enzyme inactivation [37] [70]. |
| meta-Phenylenediamine (m-PD) | Monomer for electropolymerization to create a size-exclusion interference membrane. | Forms a semi-permeable film that blocks ascorbic acid and other electroactive interferents, crucial for measurements in complex fluids like serum [37]. |
| Thiamine Pyrophosphate (TPP) & Mg²⺠| Essential cofactors for POx enzyme activity. | Must be included in the working solution for the POx-based biosensor to function [37]. |
| Pyridoxal Phosphate (PLP) | Cofactor for the native ALT enzyme reaction. | Must be included in the measurement solution to ensure optimal ALT activity from the sample [37]. |
The choice between GlOx and POx-based biosensors for ALT detection involves a critical trade-off between sensitivity and specificity versus robustness and cost. The POx-based biosensor offers superior sensitivity and is uniquely specific to the ALT reaction pathway, making it the preferred choice for applications requiring the lowest possible detection limits and high specificity. In contrast, the GlOx-based biosensor, while slightly less sensitive, demonstrates greater stability in complex matrices and benefits from a simpler, more cost-effective assay solution. For researchers focused on optimizing biosensor fabrication for maximum specificity, the POx-based system presents a more straightforward path, as it is inherently insulated from cross-reactivity with aspartate aminotransferase (AST). Ultimately, the selection should be guided by the specific requirements of the intended application, whether for high-sensitivity clinical diagnostics, point-of-care testing, or continuous monitoring.
Surface Plasmon Resonance (SPR) biosensors have become indispensable tools in biochemical sensing and drug development, enabling label-free, real-time monitoring of molecular interactions. A critical challenge in this field is the optimization of sensor fabrication to maximize specificity—the sensor's ability to distinctly recognize a target analyte amidst complex biological backgrounds. This application note provides a detailed comparative analysis of two advanced material configurations: Gold-Titanium Dioxide (Au-TiO₂) hybrid structures and graphene-based heterostructures. We present benchmarked performance data and standardized experimental protocols to guide researchers in selecting and implementing the appropriate sensing platform for high-specificity applications, from cancer diagnostics to pathogen detection.
Performance Benchmarking and Quantitative Analysis
The sensing performance of Au-TiOâ‚‚-based and graphene-based SPR biosensors has been extensively evaluated across multiple studies. The quantitative data, summarized in the table below, highlights the distinct advantages of each configuration.
Table 1: Performance Benchmarking of Au-TiOâ‚‚ and Graphene-Based SPR Biosensors
| Sensor Configuration | Target Application | Sensitivity (Units) | Figure of Merit (FOM) (RIUâ»Â¹) | Detection Accuracy (DA) / Limit of Detection (LoD) | Key Materials & Structure |
|---|---|---|---|---|---|
| Au-TiOâ‚‚ PCF [71] | Multi-cancer cell detection (Basal, HeLa, Jurkat, etc.) | 42,000 nm/RIU (WS), -1,862.72 RIU (AS) | 1393.128 | Not Specified | D-shaped PCF, Au-TiOâ‚‚ plasmonic layers |
| Au-TiOâ‚‚ PCF [72] | Blood constituent detection | 14,000 nm/RIU (WS), 610 RIUâ»Â¹ (AS) | Not Specified | Resolution: 1.4×10â»Â² RIU | D-shaped PCF, Au-TiOâ‚‚ plasmonic layers |
| Graphene-Black Phosphorus [73] | Low refractive index analytes | 300 °/RIU | 45.455 | LoD: 0.018 RIU | BK7 prism, Ag film, Graphene-BP heterostructure |
| Graphene-silicon nitride-ssDNA [74] | Malaria stage detection | 353.14 °/RIU (Ring stage) | Not Specified | LoD: Calculated via Eq. 12 [74] | Ag film, Si₃N₄, Graphene, thiol-tethered ssDNA |
| TiOâ‚‚/Au/Graphene Layer [75] | Multi-cancer cell detection | 292.86 °/RIU (MCF-7 breast cancer) | 48.02 | DA: 0.263 degâ»Â¹ | Prism-coupled, TiOâ‚‚/Au/Graphene multilayer |
Analysis of Benchmarked Data:
- Au-TiOâ‚‚ Sensors demonstrate exceptional wavelength sensitivity, making them ideal for applications where tracking spectral shifts is paramount, such as in the discrimination of different cancer cell lines based on refractive index variations in their cytoplasm [71].
- Graphene-Based Sensors, particularly heterostructures incorporating black phosphorus or functionalization layers, excel in angular sensitivity and provide enhanced biomolecular recognition. The graphene layer significantly improves the adsorption of biomolecules due to π-stacking interactions with carbon-based ring structures prevalent in target analytes [74] [75]. This directly enhances specificity by facilitating more effective probe immobilization.
Experimental Protocols for Specificity Assessment
Protocol for Au-TiOâ‚‚ D-Shaped PCF Sensor for Cancer Cell Detection
This protocol outlines the procedure for using an Au-TiOâ‚‚ D-shaped PCF biosensor to achieve specific detection of cancer cells through cytoplasmic refractive index sensing [71].
I. Sensor Fabrication and Functionalization
- Fiber Preparation: Select a silica PCF and perform side-polishing to create a flat D-shaped surface.
- Plasmonic Layer Deposition: a. Deposit a thin TiOâ‚‚ layer (approx. 4-50 nm) onto the polished surface via atomic layer deposition (ALD) to ensure uniformity and act as an adhesion layer [71] [76] [77]. b. Deposit a gold (Au) layer (approx. 45-50 nm) on top of the TiOâ‚‚ layer using sputtering or electron-beam evaporation [71] [77].
- Biorecognition Element Immobilization: Immobilize specific antibodies or aptamers targeting cancer cell surface markers onto the Au surface using standard covalent chemistry (e.g., EDC-NHS coupling).
II. Experimental Setup and Data Acquisition
- Optical Configuration:
- Connect a tunable laser source (visible to near-infrared range) to the sensor input via a single-mode fiber.
- Place a polarizer after the source to ensure transverse-magnetic (TM) polarized light input.
- Connect the sensor output to an optical spectrum analyzer (OSA) [71].
- Microfluidic Integration: Install a programmable pump and microfluidic channels to control the flow of analyte samples and buffer solutions over the sensor's active surface [71].
- Sample Measurement: a. Flow a phosphate-buffered saline (PBS) solution to establish a baseline resonance wavelength. b. Introduce the sample containing target cancer cells (e.g., HeLa, MDA-MB-231) or purified cell cytoplasm. c. Monitor the output on the OSA to record the shift in resonance wavelength (∆λ) induced by the change in the local refractive index.
III. Data Analysis for Specificity
- Calculate Wavelength Shift: Determine the difference between the resonance peak in the sample and the baseline.
- Determine Sensitivity: Express sensitivity as
S = ∆λ / ∆n(nm/RIU), where∆nis the known refractive index change of the analyte [71]. - Specificity Validation: Repeat the measurement with non-target cells (e.g., healthy control cells) and competing biomolecules to confirm that significant resonance shifts occur only with the target cancer cells.
Protocol for Graphene-Based SPR Sensor for Pathogen DNA Detection
This protocol details the use of a graphene-functionalized SPR biosensor for the specific detection of pathogen DNA, such as malaria DNA [74].
I. Sensor Fabrication and Functionalization
- Substrate Preparation: Clean a BK7 glass prism to achieve an atomically smooth surface.
- Plasmonic Layer Deposition: Deposit a silver (Ag) or gold (Au) film (40-65 nm) onto the prism using sputtering under ultra-high vacuum conditions [73].
- 2D Material Transfer: a. Transfer a monolayer of graphene, grown via chemical vapor deposition (CVD), onto the metal film [73]. b. For enhanced performance, transfer a thin layer of black phosphorus (1-8 nm), ensuring the process occurs in an inert environment to prevent degradation, and consider encapsulation with Al₂O₃ [73].
- Probe Immobilization: Functionalize the graphene surface with thiol-tethered single-stranded DNA (ssDNA) probes complementary to the target malaria DNA sequence. The thiol group ensures stable and oriented binding [74].
II. Experimental Setup and Data Acquisition (Kretschmann Configuration)
- Optical Alignment:
- Use a monochromatic laser source (e.g., He-Ne laser at 633 nm).
- Direct a polarized (TM) light beam through the prism to excite surface plasmons at the metal-dielectric interface.
- Angular Interrogation:
- Attach a goniometer to the prism holder for precise control of the incident angle.
- Place a photodetector to measure the intensity of the reflected light.
- Sample Measurement:
a. Flow a buffer solution over the sensor chip to obtain the initial reflectance curve and determine the baseline resonance angle (
θ_res). b. Introduce the sample containing the target pathogen DNA. c. Record the angular shift (∆θ) in the resonance dip caused by the hybridization of target DNA to the ssDNA probes.
III. Data Analysis for Specificity
- Calculate Angular Sensitivity: Determine sensitivity as
S = ∆θ / ∆n(deg/RIU) [74]. - Assess Detection Capability:
- Quality Factor (QF): Calculate as
QF = S / FWHM, where FWHM is the full width at half maximum of the resonance curve. A higher QF indicates a sharper resonance and better capacity to detect small changes [74]. - Limit of Detection (LoD): Estimate using the formula
LoD = (∆n / ∆θ) × 0.005°, where 0.005° is the typical angular resolution of an SPR system [74].
- Quality Factor (QF): Calculate as
- Specificity Validation: Test against non-complementary DNA sequences to ensure the observed signal is due to specific hybridization.
Experimental Workflow and Signaling Pathways
The following diagrams illustrate the core experimental workflows and the logical relationship between the key components of the two biosensor types.
Diagram 1: Experimental workflows for Au-TiOâ‚‚ and Graphene-based SPR sensors.
Diagram 2: The logical pathway from sensor design to specific detection.
The Scientist's Toolkit: Research Reagent Solutions
The table below lists key materials essential for the fabrication and operation of the featured SPR biosensors.
Table 2: Essential Research Reagents and Materials for SPR Biosensor Fabrication
| Item Name | Function / Application | Key Characteristics |
|---|---|---|
| Photonic Crystal Fiber (PCF) | Core optical element in D-shaped sensors; guides light and generates evanescent field [71]. | High evanescent field strength, flexible microstructure design. |
| BK7 Glass Prism | Optical coupling element in Kretschmann configuration; enables phase-matching for SPR excitation [73]. | High optical quality, specific refractive index. |
| Titanium Dioxide (TiOâ‚‚) | Dielectric interlayer beneath Au; enhances adhesion and tunes resonance wavelength to near-infrared [71] [76]. | High refractive index, biocompatible, improves Au adhesion. |
| Gold (Au) Film | Plasmonic material; supports the generation of surface plasmon polaritons [71] [75]. | High chemical stability, excellent plasmonic properties in visible-NIR. |
| Graphene Monolayer | 2D material coating; enhances surface area for probe immobilization and confines electromagnetic fields [73] [75]. | Large surface area, rich π-conjugation for biomolecule adsorption. |
| Black Phosphorus (BP) | 2D material in heterostructures; provides anisotropic optical response for enhanced field confinement [73]. | Anotropic optical properties, enhances sensitivity. |
| Thiol-Tethered ssDNA | Biorecognition element; provides specific binding sites for complementary DNA targets [74]. | Stable gold-thiol bond, specific hybridization. |
| Specific Antibodies | Biorecognition element; binds specifically to target antigens on cancer cells [71]. | High affinity and specificity for target biomarkers. |
The transition of biosensors from research prototypes to clinically validated tools is a critical and challenging journey. A foundational step in this process is the evolution of validation protocols, moving from the controlled environment of spiked samples to the unpredictable and complex reality of natural matrices. While initial validation with spiked samples is necessary to establish baseline performance, it is insufficient to guarantee reliability in real-world clinical, food safety, or environmental monitoring scenarios [78].
A recent systematic review underscores this significant gap, revealing that among 77 studies on electrochemical biosensors for pathogen detection, only a single study conducted direct testing on naturally contaminated food matrices [78]. This over-reliance on artificially contaminated samples raises substantial concerns about the reliability of biosensors in real-world, uncontrolled environments where factors like complex sample composition, background interferents, and heterogeneous analyte distribution become significant [78] [79]. This Application Note outlines a structured framework and detailed protocols to bridge this validation gap, ensuring that biosensor performance is robust, reliable, and ready for clinical and industrial application.
The Critical Validation Gap: Understanding the Limitations of Spiked Samples
Spiked samples, created by introducing a known quantity of a purified target analyte into a clean or buffer matrix, are a standard starting point for biosensor characterization. However, they provide an incomplete picture of performance. The table below summarizes the key differences and inherent limitations of relying solely on this method.
Table 1: Comparison of Spiked Samples vs. Natural Matrices in Biosensor Validation
| Characteristic | Spiked Samples (Artificial) | Natural Matrices (Real-World) |
|---|---|---|
| Sample Composition | Simplified, controlled, and predictable | Complex, unpredictable, and variable |
| Analyte Form | Purified, free, and often in a buffer | May be bound to cells, debris, or other components |
| Matrix Effects | Minimal or absent | Significant (e.g., fouling, interferents, pH shifts) |
| Target Distribution | Homogeneous | Heterogeneous and unpredictable |
| Validation Outcome | Optimistic performance estimates (sensitivity, LOD) | Realistic assessment of clinical/analytical utility |
The primary limitation of spiked samples is their failure to account for matrix effects [78]. Complex matrices like blood, saliva, food homogenates, or wastewater contain a multitude of proteins, lipids, salts, and other biological molecules that can foul the sensor surface, non-specifically inhibit the biorecognition element, or generate interfering signals that compromise accuracy and specificity [79]. Furthermore, in natural samples, the target pathogen or biomarker may not be freely available but could be embedded within tissues, bound to cells, or in a different conformational state, impacting its detectability by the biosensor [78].
The following diagram illustrates the divergent paths and critical decision points in the biosensor validation workflow, highlighting how a reliance on spiked samples can lead to a misleading performance assessment.
A Framework for Advanced Clinical Validation
To overcome the limitations of spiked samples, a multi-stage validation framework is essential. This framework is designed to systematically increase complexity and rigor, ensuring the biosensor is challenged under increasingly realistic conditions.
Stage 1: Spiked Sample Analysis in Buffer
Objective: To establish fundamental analytical performance parameters in an ideal, interference-free environment.
- Protocol: Prepare a series of standard solutions by spiking the purified target analyte into a relevant buffer (e.g., PBS, Tris-HCl). The concentration range should cover the anticipated clinical range from below the expected limit of detection (LOD) to above the saturation point.
- Measurements: Analyze each concentration in triplicate. Record the biosensor's signal (e.g., current, impedance, optical shift) for each replicate.
- Data Analysis: Plot the mean signal against the analyte concentration to generate a calibration curve. Calculate key parameters:
- Limit of Detection (LOD): Typically defined as 3σ/slope, where σ is the standard deviation of the blank signal.
- Limit of Quantification (LOQ): Typically defined as 10σ/slope.
- Dynamic Range: The linear range of the calibration curve.
- Sensitivity: The slope of the linear portion of the calibration curve.
Stage 2: Spiked Sample Analysis in Simple Biological Matrices
Objective: To evaluate the initial impact of a simple biological matrix and identify potential interferents.
- Protocol: Spike the target analyte into a minimally complex biological fluid, such as artificial urine, saliva, or a diluted serum sample. Use the same concentration range as in Stage 1.
- Measurements: Analyze spiked matrix samples and unspiked matrix controls (to measure background) in triplicate.
- Data Analysis: Compare the calibration curve obtained in the matrix to the one from the buffer.
- Calculate the % Recovery for each spike level: (Measured Concentration / Expected Concentration) × 100%.
- A significant signal suppression/enhancement or poor recovery indicates substantial matrix effects that must be addressed before proceeding.
Stage 3: Analysis in Naturally Contaminated or Clinical Matrices
Objective: To validate biosensor performance against real-world samples and a gold-standard reference method.
- Protocol: This is the most critical stage. Procure a set of well-characterized, naturally contaminated clinical samples (e.g., patient swabs, blood samples, biopsy tissues) or food matrices [78]. The sample set should include both positive and negative samples as confirmed by an established reference method (e.g., PCR, ELISA, culture).
- Measurements: Test each natural sample directly with the biosensor using the finalized protocol. Operators should be blinded to the reference method results to avoid bias.
- Data Analysis: Perform a statistical comparison against the reference method.
- Create a confusion matrix (contingency table).
- Calculate Clinical Sensitivity (ability to correctly identify positives) and Specificity (ability to correctly identify negatives).
- Assess correlation and agreement using statistical methods like Pearson's correlation coefficient (r) or Bland-Altman analysis for quantitative data.
Table 2: Key Experimental Protocols for Comprehensive Biosensor Validation
| Stage | Core Protocol | Key Measurements | Data Analysis & Output |
|---|---|---|---|
| 1. Spiked Buffer | Serial dilution of purified analyte in buffer. | Sensor signal for each concentration (n≥3). | Calibration curve, LOD, LOQ, dynamic range, sensitivity. |
| 2. Spiked Matrix | Spike analyte into simple biological fluid (e.g., serum). | Sensor signal for spiked matrix and unspiked control. | Calibration curve in matrix, % Recovery, signal suppression/enhancement. |
| 3. Natural Matrix | Test confirmed positive/negative real samples. | Biosensor result for each sample; operator blinded. | Confusion matrix, Clinical Sensitivity/Specificity, correlation with gold standard. |
The Scientist's Toolkit: Essential Reagents and Materials
Successful validation requires careful selection of reagents and materials. The following table details key solutions and their functions in the validation process.
Table 3: Research Reagent Solutions for Biosensor Validation
| Reagent / Material | Function & Role in Validation | Key Considerations |
|---|---|---|
| Synthetic Analytes / Purified Biomarkers | Used for spiking in Stages 1 & 2 to establish calibration curves and fundamental performance. | High purity is critical. Should be identical to the native target or a well-characterized analogue. |
| Characterized Natural Sample Panels | The gold standard for Stage 3 validation. Comprises real samples with confirmed status (positive/negative) via reference methods. | Availability can be a challenge. Collaboration with clinical or diagnostic labs is essential. |
| Blocking Agents (e.g., BSA, Casein) | Used to passivate the sensor surface and minimize non-specific binding from complex matrix components. | Must be optimized for the specific biorecognition element (e.g., antibody, aptamer) and sample matrix. |
| Signal Amplification Reagents (e.g., Enzyme-Conjugates, Nanomaterials) | Enhance detection sensitivity, which is crucial for detecting low-abundance targets in complex backgrounds. | Can introduce additional variability or background noise; optimization in the final matrix is required. |
| Reference Method Kits (e.g., ELISA, qPCR) | Provide the definitive result against which the biosensor's performance is benchmarked in Stage 3. | Must be a clinically or industrially accepted standard to ensure the validation is meaningful. |
Navigating Matrix Effects and Interfering Substances
Matrix effects are the most significant hurdle in clinical validation. The following diagram deconstructs the sources and impacts of matrix effects on the biosensor's signal transduction pathway, providing a logical framework for troubleshooting.
The diagram illustrates three primary interference mechanisms:
- Non-Specific Binding: Interfering substances bind to the bioreceptor or sensor surface, creating a false positive or elevated background signal [79].
- Surface Fouling: Matrix components (e.g., proteins, lipids) physically adsorb to the sensor surface, blocking the biorecognition element and reducing sensitivity [78].
- Specific Binding Inhibition: The complex matrix may sterically hinder or chemically modify the target analyte, preventing its efficient recognition by the bioreceptor.
Transitioning biosensor validation from spiked samples to real-world complex matrices is not merely an optional step but a fundamental requirement for clinical and commercial adoption. The framework presented here provides a structured, multi-stage approach to systematically uncover and address the challenges posed by complex samples, thereby de-risking the development pipeline. Future progress in this field will be driven by several key trends, including the development of novel, more robust biorecognition elements (e.g., engineered aptamers, affimers), the integration of advanced data analytics and Artificial Intelligence (AI) to correct for matrix-specific variations, and the creation of standardized validation protocols and reference materials in alignment with regulatory bodies (e.g., FDA, ISO) to ensure consistency and reliability across the industry [78] [80]. By adopting a rigorous and realistic validation strategy, researchers can confidently advance biosensor technologies from promising laboratory prototypes to indispensable tools in healthcare, food safety, and environmental monitoring.
Conclusion
Optimizing biosensor specificity is a multifaceted endeavor that hinges on the synergistic integration of advanced biorecognition elements, precision fabrication methodologies, and rigorous validation. Foundational knowledge of bioreceptor-analyte interactions guides the selection of elements like aptamers and high-affinity antibodies, while methodological advances in nanomaterial integration and enzyme immobilization directly enhance analytical performance. Troubleshooting through machine learning and innovative signal amplification offers a path to overcome non-specific binding, a major hurdle. Finally, robust comparative and validation frameworks are indispensable for translating lab-scale innovations into clinically viable devices. Future directions will likely involve the increased use of AI-driven design, multiplexed platforms for panel-based diagnostics, and sustainable fabrication processes, ultimately paving the way for a new generation of biosensors that deliver on the promise of precision medicine and decentralized global healthcare.
References
- 1. Unlocking Biosensors in Analytical Chemistry [https://www.numberanalytics.com/blog/ultimate-guide-biosensors-analytical-chemistry]
- 2. A Review on Biosensors and Recent Development of ... [https://pmc.ncbi.nlm.nih.gov/articles/PMC7915135/]
- 3. Advancements in food quality monitoring: integrating biosensors for... [https://pubs.rsc.org/en/content/articlehtml/2024/fb/d4fb00094c]
- 4. Bioreceptor modified electrochemical biosensors for the ... [https://pubs.rsc.org/en/content/articlehtml/2024/ra/d4ra04038d]
- 5. Aptamer Biosensor vs Antibodies - Insights on Biosensing ... [https://www.pentabind.com/post/aptamer-biosensor]
- 6. Aptasensors versus immunosensors—Which will prevail? [https://pmc.ncbi.nlm.nih.gov/articles/PMC8961048/]
- 7. Designing the Future of Biosensing: Advances in Aptamer ... [https://pmc.ncbi.nlm.nih.gov/articles/PMC12562710/]
- 8. Design of electrochemical aptameric biosensor for the ... [https://www.nature.com/articles/s41598-025-16913-6]
- 9. Aptamer-based electrochemical biosensors: Signal ... [https://www.sciencedirect.com/science/article/pii/S2666053925000840]
- 10. Electrochemical Biosensors - Sensor Principles and ... [https://pmc.ncbi.nlm.nih.gov/articles/PMC3663003/]
- 11. Transducer Technologies for Biosensors and Their Wearable ... [https://pmc.ncbi.nlm.nih.gov/articles/PMC9221076/]
- 12. Classification Of Biosensors Based On Trasducers ... [https://advanced-biosensors-bioelectronics.peersalleyconferences.com/tracks/classification-of-biosensors-based-on-trasducers]
- 13. Optical Biosensors: A Revolution Towards Quantum ... [https://pmc.ncbi.nlm.nih.gov/articles/PMC3205924/]
- 14. New method developed to dramatically enhance ... [https://www.sciencedaily.com/releases/2025/02/250226125012.htm]
- 15. Transducer mechanisms for optical biosensors. Part 1 [https://www.sciencedirect.com/science/article/abs/pii/0169260789901181]
- 16. Algorithm assisted comprehensive optimization of SPR ... [https://www.sciencedirect.com/science/article/abs/pii/S0956566325007225]
- 17. Algorithm assisted comprehensive optimization of SPR ... [https://pubmed.ncbi.nlm.nih.gov/40812130]
- 18. A comprehensive review of graphene-based biosensors [https://pmc.ncbi.nlm.nih.gov/articles/PMC12448920/]
- 19. Carbon Nanotube-Based Field-Effect Transistor Biosensors ... [https://pmc.ncbi.nlm.nih.gov/articles/PMC12109531/]
- 20. Recent advances in platinum nanoparticle-based ... [https://link.springer.com/article/10.1007/s44373-025-00047-5]
- 21. Advances in nanomaterial-based biosensors [https://www.sciencedirect.com/science/article/abs/pii/S235249282501846X]
- 22. Immobilized Enzymes in Biosensor Applications - PMC [https://pmc.ncbi.nlm.nih.gov/articles/PMC6337536/]
- 23. Immobilization strategies to develop enzymatic biosensors [https://www.sciencedirect.com/science/article/abs/pii/S073497501100156X]
- 24. What are the limitations of cross-linking immobilization? [https://www.aatbio.com/resources/faq-frequently-asked-questions/what-are-the-limitations-of-cross-linking-immobilization]
- 25. A Comprehensive Guide to Enzyme Immobilization: All You ... [https://pmc.ncbi.nlm.nih.gov/articles/PMC11857967/]
- 26. An Overview of Techniques in Enzyme Immobilization [https://www.e-asct.org/journal/view.html?doi=10.5757/ASCT.2017.26.6.157]
- 27. Recent Advances in Enzyme Immobilisation Strategies [https://www.mdpi.com/2504-477X/7/12/488]
- 28. Enzyme Immobilization on Nanomaterials and Their ... [https://pmc.ncbi.nlm.nih.gov/articles/PMC12430663/]
- 29. Covalent immobilization: A review from an enzyme ... [https://www.sciencedirect.com/science/article/pii/S1385894724095457]
- 30. Immobilization of Enzyme Electrochemical Biosensors and ... [https://www.mdpi.com/2079-6374/13/9/886]
- 31. Revolutionary advances in nanomaterials-based ... [https://www.sciencedirect.com/science/article/pii/S2666831925001110]
- 32. Nanomaterials in Biosensors: Fundamentals and Applications [https://pmc.ncbi.nlm.nih.gov/articles/PMC7152100/]
- 33. Nanomaterials-Enhanced Electrochemical Biosensors for ... [https://www.mdpi.com/2079-6374/15/12/766]
- 34. Fabrication and quantitative performance analysis of a low- ... [https://www.sciencedirect.com/science/article/pii/S2214180422000277]
- 35. Fully Inkjet-Printed Biosensors Fabricated with a Highly ... [https://pmc.ncbi.nlm.nih.gov/articles/PMC8303974/]
- 36. The design, fabrication, and applications of flexible biosensing ... [https://pmc.ncbi.nlm.nih.gov/articles/PMC6310145/]
- 37. Development and Comparative Evaluation of Two Enzyme ... [https://pmc.ncbi.nlm.nih.gov/articles/PMC12566202/]
- 38. Development and Comparative Evaluation of Two Enzyme- ... [https://www.scilit.com/publications/e19809da21d14e205659fb30c6ec0439]
- 39. Design and analysis of a highly sensitive SPR based PCF ... [https://pmc.ncbi.nlm.nih.gov/articles/PMC10407746/]
- 40. Design optimization of high-sensitivity PCF-SPR biosensor ... [https://journals.plos.org/plosone/article?id=10.1371/journal.pone.0330944]
- 41. Recent Advances in Metasurfaces: From THz Biosensing to ... [https://pmc.ncbi.nlm.nih.gov/articles/PMC12395562/]
- 42. The optimal substrate choice for effective biosensors based ... [https://www.nature.com/articles/s41598-025-15669-3]
- 43. Enhancement and optimization of a graphene-based ... [https://www.nature.com/articles/s41598-025-20570-0]
- 44. Overcoming Non-Specific Binding in Biolayer ... [https://www.sartorius.com/en/products/biolayer-interferometry/bli-resources/overcoming-non-specific-binding-in-bli-article]
- 45. Biofouling prevention and control technology for marine ... [https://www.sciencedirect.com/science/article/pii/S0025326X25014006]
- 46. On-Site Biolayer Interferometry-Based Biosensing of ... [https://pmc.ncbi.nlm.nih.gov/articles/PMC8699405/]
- 47. Biosensors, Volume 15, Issue 3 (March 2025) – 72 articles [https://www.mdpi.com/2079-6374/15/3]
- 48. Design and fabrication of an electrochemical nano ... [https://www.sciencedirect.com/science/article/pii/S2590137025001220]
- 49. Pedestal High-Contrast Gratings for Biosensing [https://www.mdpi.com/2079-4991/12/10/1748]
- 50. Biosensors, Volume 15, Issue 9 (September 2025) [https://www.mdpi.com/2079-6374/15/9]
- 51. AI-Enhanced Surface Functionalization in Biosensors [https://www.sciencedirect.com/science/article/abs/pii/S0165993625003887]
- 52. Bioinks and biofabrication techniques for biosensors ... [https://www.sciencedirect.com/science/article/pii/S2590006424002461]
- 53. Machine learning-based prediction and interpretation of ... [https://www.sciencedirect.com/science/article/abs/pii/S0026265X25030048]
- 54. Influence of machine learning technology on the ... [https://www.sciencedirect.com/science/article/abs/pii/S0026265X25027559]
- 55. Machine Learning Algorithms for Prediction of Optical ... [https://pmc.ncbi.nlm.nih.gov/articles/PMC10302917/]
- 56. Machine Learning Algorithms for Prediction of Optical ... [https://www.mdpi.com/2072-666X/14/6/1174]
- 57. Rolling-Circle-Amplification-Assisted DNA Biosensors for ... [https://www.mdpi.com/2624-8549/5/2/98]
- 58. Structural and Kinetic Profiling of Rolling Circle ... [https://pmc.ncbi.nlm.nih.gov/articles/PMC12481570/]
- 59. Gold NanoStars: Synthesis, Modification and Application [https://www.sciopen.com/article/10.26599/NBE.2023.9290025]
- 60. Paper as an ecodesigned and smart material for sample ... [https://www.sciencedirect.com/science/article/pii/S2772582025000592]
- 61. Emerging Trends in Paper-Based Electrochemical ... [https://www.mdpi.com/2673-4591/106/1/8]
- 62. Limit of Blank, Limit of Detection and Limit of Quantitation [https://pmc.ncbi.nlm.nih.gov/articles/PMC2556583/]
- 63. Method Validation Essentials, Limit of Blank ... [https://www.biopharminternational.com/view/method-validation-essentials-limit-blank-limit-detection-and-limit-quantitation]
- 64. Biosensor nanoengineering: Design, operation, and ... [https://www.sciencedirect.com/science/article/pii/S2666351120300401]
- 65. Detection limit [https://en.wikipedia.org/wiki/Detection_limit]
- 66. Determining LOD and LOQ Based on the Calibration Curve [https://www.sepscience.com/hplc-solutions-126-chromatographic-measurements-part-5-determining-lod-and-loq-based-on-the-calibration-curve-6959]
- 67. What Is LOD and LOQ Determination in Analytical ... [https://altabrisagroup.com/lod-and-loq-determination/]
- 68. Addressing the Selectivity of Enzyme Biosensors: Solutions ... [https://pmc.ncbi.nlm.nih.gov/articles/PMC8123588/]
- 69. Development and Comparative Evaluation of Two Enzyme ... [https://pubmed.ncbi.nlm.nih.gov/41156414/]
- 70. Recent Advances in Electrochemical Enzyme-Based ... [https://www.mdpi.com/2304-8158/12/18/3355]
- 71. Advanced SPR biosensor with optimized gold-TiO2 D ... [https://www.nature.com/articles/s41598-025-24697-y]
- 72. Ultrahigh-sensitivity D-shaped PCF-SPR biosensor with ... [https://www.sciencedirect.com/science/article/pii/S2211379725003572]
- 73. Enhanced surface plasmon resonance biosensor with ... [https://pmc.ncbi.nlm.nih.gov/articles/PMC12594348/]
- 74. Design and simulation of a graphene-integrated SPR ... [https://www.frontiersin.org/journals/bioengineering-and-biotechnology/articles/10.3389/fbioe.2025.1580344/full]
- 75. Highly Sensitive TiO2/Au/Graphene Layer-Based Surface ... [https://pmc.ncbi.nlm.nih.gov/articles/PMC9405676/]
- 76. TiO2/gold-graphene hybrid solid core SPR based PCF RI ... [https://www.sciencedirect.com/science/article/abs/pii/S0030402620313619]
- 77. Design and Simulation of High-Performance D-Type Dual- ... [https://www.mdpi.com/1424-8220/24/18/6118]
- 78. A systematic review of electrochemical biosensors for ... [https://www.sciencedirect.com/science/article/abs/pii/S0956713525004724]
- 79. The value and validation of broad spectrum biosensors for ... [https://pmc.ncbi.nlm.nih.gov/articles/PMC3925709/]
- 80. Recent advances in biosensors: structure, principles ... [https://www.sciencedirect.com/science/article/abs/pii/S1046202325001665]