Active Removal Methods for Non-Specific Adsorption in Biosensors: From Microfluidic Shear to Electromechanical Transduction
Non-specific adsorption (NSA) remains a critical barrier to developing reliable biosensors for clinical diagnostics and drug development.
Active Removal Methods for Non-Specific Adsorption in Biosensors: From Microfluidic Shear to Electromechanical Transduction
Abstract
Non-specific adsorption (NSA) remains a critical barrier to developing reliable biosensors for clinical diagnostics and drug development. This article provides a comprehensive analysis of active NSA removal methods, a paradigm shift from traditional passive coatings. We explore the foundational principles of NSA and its impact on sensor performance, detail cutting-edge methodologies like electromechanical and acoustic transducers, address key troubleshooting and optimization challenges for real-world application, and present comparative validation frameworks. Tailored for researchers and scientists, this review synthesizes recent advances to guide the development of robust, next-generation biosensing platforms capable of operating in complex biological matrices.
Understanding Non-Specific Adsorption: The Fundamental Challenge in Biosensor Reliability
Non-specific adsorption (NSA), also referred to as non-specific binding or biofouling, represents a fundamental challenge in biosensor technology that significantly compromises analytical performance [1] [2]. This phenomenon occurs when molecules other than the target analyte adhere to the biosensor's surface through physisorption, generating background signals that are frequently indistinguishable from specific binding events [1]. These false-positive signals adversely affect key biosensor parameters including sensitivity, specificity, reproducibility, and limit of detection [1] [3]. In surface-based biosensing platforms such as immunosensors, microfluidic devices, and electrochemical sensors, NSA arises from complex interactions between the sensing interface and non-target components within biological samples [1] [2]. The persistent nature of NSA has established its mitigation as a critical research focus, particularly with the advancing miniaturization of biosensors and their expanding application to complex biological matrices like blood, serum, and milk [2].
Mechanisms of Non-Specific Adsorption
The adsorption of non-target molecules onto biosensor surfaces occurs primarily through physical adsorption (physisorption) rather than chemical bonding (chemisorption) [1]. This process is governed by several intermolecular forces that collectively facilitate the unwanted accumulation of interfacial species.
Figure 1: Mechanisms of Non-Specific Adsorption
Fundamental Interaction Forces
NSA is predominantly driven by four primary interaction mechanisms between biomolecules and sensor surfaces [1] [2]:
- Hydrophobic Interactions: Non-polar regions of proteins and other biomolecules preferentially associate with hydrophobic surface domains to minimize energetically unfavorable interactions with water molecules [2].
- Electrostatic Interactions: Charged residues on biomolecules interact with oppositely charged functional groups present on the sensor surface, leading to Coulombic attraction [1] [4].
- van der Waals Forces: Transient dipole-induced dipole interactions occur between all molecular species, contributing significantly to adsorption even on seemingly neutral surfaces [1].
- Hydrogen Bonding: Polar functional groups (e.g., -OH, -NH, -C=O) on both the surface and biomolecules form directional hydrogen bonds that enhance adhesion [2].
The relative contribution of each mechanism depends on the physicochemical properties of both the biosensor surface and the complex biological sample, with proteins being particularly prone to NSA due to their amphiphilic nature and structural flexibility [4].
Impact on Biosensor Performance
The consequences of NSA manifest across multiple aspects of biosensor functionality, fundamentally limiting real-world applicability [1] [2]:
- Diminished Sensitivity and Selectivity: Non-specifically adsorbed molecules obstruct target analyte access to recognition elements and generate competing signals that mask specific binding events [2].
- Elevated Background Signals: Fouling species contribute to background noise that is frequently indistinguishable from analyte-specific signals, particularly in label-free detection systems [1].
- Signal Drift and Instability: Progressive accumulation of foulants over time leads to continuous signal baseline variations, complicating data interpretation and quantification [2].
- Reduced Dynamic Range and Reproducibility: NSA decreases the functional concentration range over which accurate measurements can be obtained and introduces variability between experimental replicates [1] [3].
In electrochemical biosensors, fouling additionally impacts electron transfer kinetics at electrode interfaces, while in optical platforms like surface plasmon resonance (SPR), non-specifically adsorbed layers alter refractive index properties at sensing surfaces [2].
Quantitative Analysis of NSA Reduction Methods
The development of effective NSA suppression strategies has evolved into two complementary approaches: passive methods that prevent adhesion through surface modification, and active methods that remove adsorbed species post-accumulation [1]. The table below summarizes the key characteristics, advantages, and limitations of predominant NSA reduction techniques.
Table 1: Comparative Analysis of NSA Reduction Methods
| Method Category | Specific Approach | Mechanism of Action | Key Advantages | Documented Limitations |
|---|---|---|---|---|
| Passive (Chemical) | Zwitterionic Peptides [4] | Forms hydration layer via charged residues; EKEKEKEKEKGGC sequence demonstrated superior antifouling | Broad-spectrum protection against proteins and cells; high stability | Requires covalent surface immobilization; sequence-dependent performance |
| Polyethylene Glycol (PEG) [1] [4] | Creates hydrophilic barrier that minimizes protein adhesion | Well-established protocol; commercial availability | Susceptible to oxidative degradation; limited long-term stability | |
| Negatively Charged Polymers (PSS, TSPP) [3] | Electrostatic repulsion of negatively charged biomolecules | Simple self-assembly implementation; effective for glass substrates | Limited effectiveness against neutral or positively charged proteins | |
| Passive (Physical) | Protein Blockers (BSA, Casein) [1] | Occupies vacant surface sites through preferential adsorption | Low cost; easy implementation; compatible with various assays | Potential displacement by sample proteins; may obscure recognition elements |
| Active Removal | Electromechanical Transducers [1] | Generates surface shear forces to desorb weakly adhered molecules | On-demand fouling removal; preserves surface functionality | Requires integrated transducer elements; complex fabrication |
| Hydrodynamic Flow [1] | Applies fluid shear stress to displace non-specifically bound molecules | Simple implementation in microfluidic systems; continuous cleaning possible | May also remove specifically bound analytes at high shear rates | |
| Surface Engineering | Self-Assembled Monolayers (SAMs) [5] | Creates dense, ordered molecular layers that resist protein penetration | Precise control over surface properties; tunable functionality | Limited stability on certain substrates; defect-sensitive performance |
Experimental Protocols for NSA Evaluation and Mitigation
Protocol 1: Zwitterionic Peptide Functionalization of Porous Silicon Biosensors
This protocol details the covalent immobilization of zwitterionic peptides onto porous silicon (PSi) surfaces to create antifouling biosensor interfaces, adapted from published methodology [4].
Materials and Reagents:
- Porous silicon substrates (fabricated by electrochemical etching)
- Zwitterionic peptide (sequence: EKEKEKEKEKGGC) with C-terminal cysteine
- Ethanolamine hydrochloride (200 mM, pH 8.5)
- N-(3-Dimethylaminopropyl)-N'-ethylcarbodiimide (EDC) and N-hydroxysuccinimide (NHS)
- Phosphate buffered saline (PBS, 10 mM, pH 7.4)
- Absolute ethanol and deionized water
- Bovine serum albumin (BSA) solution (1 mg/mL in PBS)
- Complex biofluids (e.g., gastrointestinal fluid, serum, bacterial lysate)
Procedure:
- PSi Surface Activation: Clean PSi substrates in oxygen plasma for 5 minutes at 100 W to generate surface hydroxyl groups.
- Silane Functionalization: Incubate activated PSi in 2% (v/v) (3-aminopropyl)triethoxysilane (APTES) in anhydrous toluene for 4 hours at room temperature to create amine-terminated surfaces.
- Cross-linker Activation: Prepare fresh EDC/NHS solution (50 mM/25 mM in MES buffer, pH 6.0) and incubate with aminated PSi for 30 minutes to activate surface carboxylic acids.
- Peptide Immobilization: React zwitterionic peptide solution (100 μg/mL in PBS, pH 7.4) with activated surfaces for 2 hours at room temperature.
- Surface Quenching: Block remaining active esters with ethanolamine solution (200 mM, pH 8.5) for 30 minutes.
- Validation Testing: Characterize modified surfaces by ellipsometry, contact angle measurement, and fluorescence microscopy after exposure to fluorescently-labeled proteins or complex biofluids.
Performance Assessment: This zwitterionic peptide functionalization demonstrated >300-fold reduction in non-specific adsorption compared to untreated surfaces and outperformed conventional PEG coatings in complex biological fluids [4].
Protocol 2: Self-Assembled Negatively Charged Polymer Films on Glass Substrates
This protocol describes the creation of low-fouling optical biochips through layer-by-layer deposition of negatively charged polymers on glass surfaces [3].
Materials and Reagents:
- Glass slides (soda-lime, pre-cleaned)
- Poly(styrene sulfonic acid) sodium salt (PSS) solution (1 mg/mL in DI water)
- meso-tetra(4-sulfonatophenyl)porphine dihydrochloride (TSPP) solution (1 mg/mL in DI water)
- Poly(diallyldimethylammonium chloride) (PDDA) solution (1 mg/mL in 0.5 M NaCl)
- Piranha solution (3:1 v/v H₂SO₄:H₂O₂) - CAUTION: Highly corrosive
- Phosphate buffered saline (PBS, 10 mM, pH 7.4)
- Quantum dot solutions (QDs) for adsorption testing
- C-reactive protein (CRP) antigens and antibodies for immunoassay validation
Procedure:
- Substrate Cleaning: Immerse glass slides in piranha solution for 30 minutes at 80°C, followed by thorough rinsing with DI water and drying under nitrogen stream.
- Primer Layer Deposition: Incubate cleaned slides in PDDA solution for 20 minutes to create a positively charged surface.
- TSPP Layer Assembly: Immerse PDDA-functionalized slides in TSPP solution for 20 minutes, followed by rinsing with DI water.
- PSS Multilayer Construction: Alternate between PSS and PDDA solutions (4 cycles total) to build the final negatively charged surface architecture.
- Biochip Characterization: Assess surface charge by zeta potential measurements, layer thickness by ellipsometry, and nanoscale morphology by atomic force microscopy.
- NSA Quantification: Measure fluorescence intensity after incubating modified slides with QD solutions to quantify non-specific adsorption reduction.
Performance Metrics: The optimized TSPP/PSS-modified surfaces demonstrated 300-400 fold reduction in QD adsorption compared to untreated glass and enabled sensitive CRP detection with a limit of detection of 0.69 ng/mL [3].
Figure 2: Experimental Workflow for NSA Reduction Strategies
The Scientist's Toolkit: Essential Research Reagents
Table 2: Key Research Reagents for NSA Investigation and Mitigation
| Reagent Category | Specific Examples | Primary Function | Application Notes |
|---|---|---|---|
| Blocking Proteins | Bovine Serum Albumin (BSA), Casein, Milk Proteins [1] | Occupies non-specific surface sites through competitive adsorption | Effective for simple systems; potential interference with specific binding |
| Polymeric Coatings | Polyethylene Glycol (PEG), Poly(styrene sulfonic acid) (PSS) [1] [3] | Creates steric and/or electrostatic barriers to protein adsorption | PEG susceptible to oxidation; PSS provides negative charge repulsion |
| Zwitterionic Materials | EK-repeat peptides, Sulfobetaine polymers [4] | Forms strongly hydrated layer via charge-balanced functional groups | Superior antifouling performance; requires controlled immobilization |
| Surface Activation Reagents | EDC/NHS, APTES, Dopamine [4] [5] | Enables covalent attachment of functional coatings | Critical for stable surface modification; protocol-dependent efficiency |
| Characterization Tools | Fluorescently-labeled proteins, QD probes [3] [4] | Quantifies non-specific adsorption extent | Enables visualization and quantification of fouling |
| Complex Test Matrices | Blood serum, Gastrointestinal fluid, Bacterial lysate [4] | Validates antifouling performance in realistic conditions | Essential for assessing real-world applicability |
Future Perspectives in NSA Management
The evolving landscape of NSA reduction increasingly integrates advanced computational and materials science approaches. Artificial intelligence and machine learning are emerging as powerful tools for predicting optimal surface chemistries and antifouling material configurations, potentially accelerating the development of next-generation biosensor interfaces [5]. Molecular dynamics simulations enable atomic-level understanding of protein-surface interactions, guiding the rational design of non-fouling surfaces [5]. Additionally, the convergence of nanotechnology with synthetic biology promises innovative solutions, such as biomimetic coatings that replicate the exceptional antifouling properties of natural cell membranes [4] [5]. These advanced strategies, coupled with the continuous refinement of established passive and active methods, will ultimately enable the realization of robust, reliable biosensors capable of functioning in the most challenging biological environments.
How NSA Compromises Sensitivity, Specificity, and Reproducibility in Diagnostic Assays
Non-specific adsorption (NSA) represents a fundamental challenge in the development and application of diagnostic assays and biosensors. NSA occurs when biomolecules such as proteins, lipids, or other cellular components adhere indiscriminately to sensing surfaces through physisorption rather than specific biorecognition events [1]. This phenomenon directly compromises three essential performance metrics of diagnostic tests: sensitivity (the ability to correctly identify true positives), specificity (the ability to correctly identify true negatives), and reproducibility (the consistency of results across repeated experiments) [1] [6]. In clinical diagnostics, where accurate detection of disease biomarkers dictates patient care decisions, the effects of NSA can lead to false positives, false negatives, and unreliable quantitative measurements, ultimately affecting diagnostic outcomes and therapeutic interventions [7] [2].
The persistence of NSA is particularly problematic for surface-based biosensing platforms, including immunosensors (e.g., ELISA, SPR), microfluidic biosensors, and electrochemical biosensors, which collectively form the backbone of modern point-of-care diagnostics [1] [6]. These platforms often employ immobilized bioreceptors such as antibodies, enzymes, or DNA sequences attached via linker molecules like self-assembled monolayers (SAMs) [8] [9]. Unfortunately, these very interfaces are highly susceptible to NSA, creating a critical bottleneck in assay development [8]. This Application Note examines the mechanisms through which NSA compromises assay performance and provides detailed protocols for researchers to implement active removal methods that address these challenges within the broader context of advancing biosensor research.
The Fundamental Mechanisms of NSA and Its Diagnostic Consequences
Physicochemical Basis of Non-Specific Adsorption
Non-specific adsorption primarily occurs through physisorption, a process driven by cumulative weak intermolecular forces rather than specific covalent bonding [1] [6]. These forces include:
- Hydrophobic interactions between non-polar regions of proteins and sensing surfaces
- Electrostatic attractions between charged biomolecules and oppositely charged surfaces
- Van der Waals forces that operate at short distances between all molecular species
- Hydrogen bonding between polar groups on biomolecules and surface functional groups [2]
These interactions collectively facilitate the irreversible adsorption of non-target molecules to biosensor surfaces, creating a layer of fouling material that interferes with analytical measurements [2]. The problem is exacerbated when analyzing complex biological samples such as blood, serum, or cell lysates, which contain thousands of potential interfering species at high concentrations [2].
Direct Impacts on Sensitivity, Specificity, and Reproducibility
The following diagram illustrates how NSA directly compromises key assay performance metrics by interfering with the specific binding signal and introducing erroneous background signals:
Figure 1: Mechanisms Through Which NSA Compromises Diagnostic Assay Performance
The mechanisms outlined in Figure 1 manifest in several specific ways across different biosensing platforms:
For electrochemical biosensors: NSA causes signal drift, passivates electrode surfaces, restricts electron transfer kinetics, and can limit the conformational freedom of structure-switching aptamers essential for target recognition [2].
For optical biosensors (e.g., SPR): Non-specifically adsorbed molecules produce refractive index changes indistinguishable from specific binding events, leading to overestimation of target analyte concentrations [1] [2].
For microfluidic biosensors: The large surface-area-to-volume ratio amplifies NSA effects, with fouling molecules accumulating in channels and on functionalized surfaces, potentially obstructing fluid flow and reducing assay efficiency [8].
The following table quantifies the relationship between NSA and compromised diagnostic accuracy metrics:
Table 1: Quantitative Impact of NSA on Diagnostic Accuracy Parameters
| Accuracy Parameter | Impact of NSA | Underlying Mechanism | Experimental Consequence |
|---|---|---|---|
| Sensitivity | Decreases by 10-50% depending on surface chemistry [1] [8] | Surface passivation reduces available binding sites; steric hindrance limits analyte access | Increased limit of detection (LOD); higher false-negative rates |
| Specificity | Reduction proportional to NSA level [1] [2] | Non-target molecules generate background signal indistinguishable from specific binding | Elevated false-positive rates; compromised clinical specificity |
| Reproducibility | Coefficient of variation increases 15-30% [1] | Inconsistent fouling patterns across sensor surfaces and between experiments | Poor inter-assay precision; unreliable quantitative measurements |
| Dynamic Range | Compression by 1-2 orders of magnitude [1] | High background signal reduces signal-to-noise ratio across all analyte concentrations | Limited quantitative utility; saturation at lower analyte concentrations |
Experimental Protocols for NSA Characterization and Mitigation
Protocol 1: Quantitative Assessment of NSA Using Surface Plasmon Resonance
This protocol enables researchers to quantitatively evaluate NSA on biosensor surfaces using SPR technology, providing a benchmark for assessing mitigation strategies.
Materials and Reagents:
- SPR instrument (e.g., Biacore series or openSPR)
- Gold sensor chips (typically 50 nm gold on glass substrate)
- Phosphate-buffered saline (PBS), pH 7.4
- Fibrinogen (1 mg/mL in PBS) as model foulant protein
- Lysozyme (1 mg/mL in PBS) as alternative foulant protein
- Regeneration solution: 10 mM glycine-HCl, pH 2.0
- Surfactant solution: 0.05% Tween-20 in PBS
Procedure:
Sensor Chip Preparation:
- Clean gold sensor chips with oxygen plasma treatment (100 W, 2 minutes) or piranha solution (3:1 H₂SO₄:H₂O₂) with extreme caution.
- Rinse thoroughly with deionized water and ethanol, then dry under nitrogen stream.
SPR Instrument Priming:
- Prime the SPR instrument with degassed PBS at a flow rate of 10 μL/min until a stable baseline is established (±1 RU drift per minute).
- Activate the flow cell where measurements will be performed.
Baseline Establishment:
- Flow PBS over the sensor surface for at least 10 minutes to establish a stable refractive index baseline.
- Record the baseline resonance unit (RU) value.
NSA Measurement:
- Switch the flow to fibrinogen solution (1 mg/mL in PBS) for 10 minutes at 5 μL/min flow rate.
- Monitor the increase in RU values, which corresponds to protein adsorption.
- Switch back to PBS flow and monitor for 5 minutes to observe any loosely adsorbed protein desorption.
Surface Regeneration:
- Apply regeneration solution (10 mM glycine-HCl, pH 2.0) for 60 seconds to remove adsorbed proteins.
- Return to PBS flow and verify that RU values return to within 95% of original baseline.
Data Analysis:
- Calculate the total adsorbed mass using the formula: Mass (ng/mm²) = ΔRU / Sensitivity Factor.
- For most SPR instruments, the sensitivity factor is approximately 0.1 ng/mm² per RU.
- Perform triplicate measurements for statistical significance.
Expected Results:
- Poorly modified surfaces typically show fibrinogen adsorption of 150-300 ng/mm² [8].
- Optimally modified surfaces with effective anti-NSA treatments should achieve <10 ng/mm² fibrinogen adsorption [8].
Protocol 2: Active NSA Removal Using Electromechanical Transduction
This protocol details the implementation of active NSA removal through electromechanical surface shear forces, suitable for integration with microfluidic biosensing platforms.
Materials and Reagents:
- Piezoelectric transducer (PZT) discs (e.g., lead zirconate titanate, 10-20 mm diameter)
- Function generator capable of 0.1-100 Vpp output
- Oscilloscope for waveform monitoring
- Microfluidic chip with integrated sensing electrodes
- Polydimethylsiloxane (PDMS) for chip fabrication
- SU-8 photoresist for master mold creation
- Biological sample of interest (serum, plasma, or buffer spiked with target analyte)
Procedure:
Microfluidic Chip Fabrication:
- Design a microfluidic channel (100 μm width × 50 μm height) with integrated gold electrodes for sensing.
- Fabricate using standard soft lithography techniques with PDMS molded from SU-8 master.
- Bond PDMS channel to glass substrate containing gold electrodes using oxygen plasma treatment.
Transducer Integration:
- Attach PZT disc to the external surface of the microfluidic chip using epoxy resin.
- Ensure secure electrical connections to the function generator.
- Verify transducer operation by applying a low-voltage signal (1 Vpp, 1 kHz) and observing fluid motion via tracer particles.
System Calibration:
- Fill the microfluidic channel with PBS buffer.
- Apply sinusoidal signals across frequency range (1-100 kHz) at constant voltage (5 Vpp).
- Identify the resonant frequency by observing maximum fluid displacement using microparticle image velocimetry.
- Record the optimal frequency for subsequent experiments.
Active NSA Removal During Assay:
- Introduce biological sample into the microfluidic channel.
- Apply the predetermined resonant frequency signal at 10 Vpp in pulsed mode (1 second on, 5 seconds off).
- Perform simultaneous electrochemical or optical measurements of target analyte binding.
- Continue pulsed actuation throughout the measurement period.
Performance Validation:
- Compare signals with and without active NSA removal.
- Quantify reduction in background signal and improvement in signal-to-noise ratio.
- Assess specificity improvement using negative controls (samples without target analyte).
Expected Results:
- Active NSA removal should reduce background signal by 60-80% compared to passive methods alone [1].
- Signal-to-noise ratio improvements of 3-5 fold can be expected, significantly enhancing detection limits [1].
The Scientist's Toolkit: Essential Reagents and Materials
Table 2: Key Research Reagent Solutions for NSA Reduction Studies
| Reagent/Material | Function | Application Notes |
|---|---|---|
| Alkanethiol SAMs | Form organized monolayers on gold surfaces; reduce NSA through controlled surface chemistry | Short-chain (n=2) and long-chain (n=10) offer different NSA resistance; incubation time critical [8] |
| Poly(ethylene glycol) (PEG) | Creates hydrophilic, highly hydrated surface that resists protein adsorption | Varying molecular weights (1-10 kDa) provide different layer thicknesses and resistance properties [1] |
| Bovine Serum Albumin (BSA) | Blocking agent that occupies vacant surface sites to prevent non-specific binding | Typically used at 1-5% w/v in buffer; may not prevent all NSA types [1] |
| Zwitterionic polymers | Form super-hydrophilic surfaces via strong electrostatic hydration | e.g., SBMA; exceptional resistance to NSA; compatible with various transducer surfaces [10] |
| Tween-20 | Non-ionic surfactant reduces hydrophobic interactions | Used at 0.01-0.1% in wash buffers; effective for removing weakly adsorbed species [2] |
| Casein | Milk-derived blocking protein effective for immunoassays | Often superior to BSA for certain applications; available as ready-to-use solutions [1] |
Experimental Workflow for Integrated NSA Management
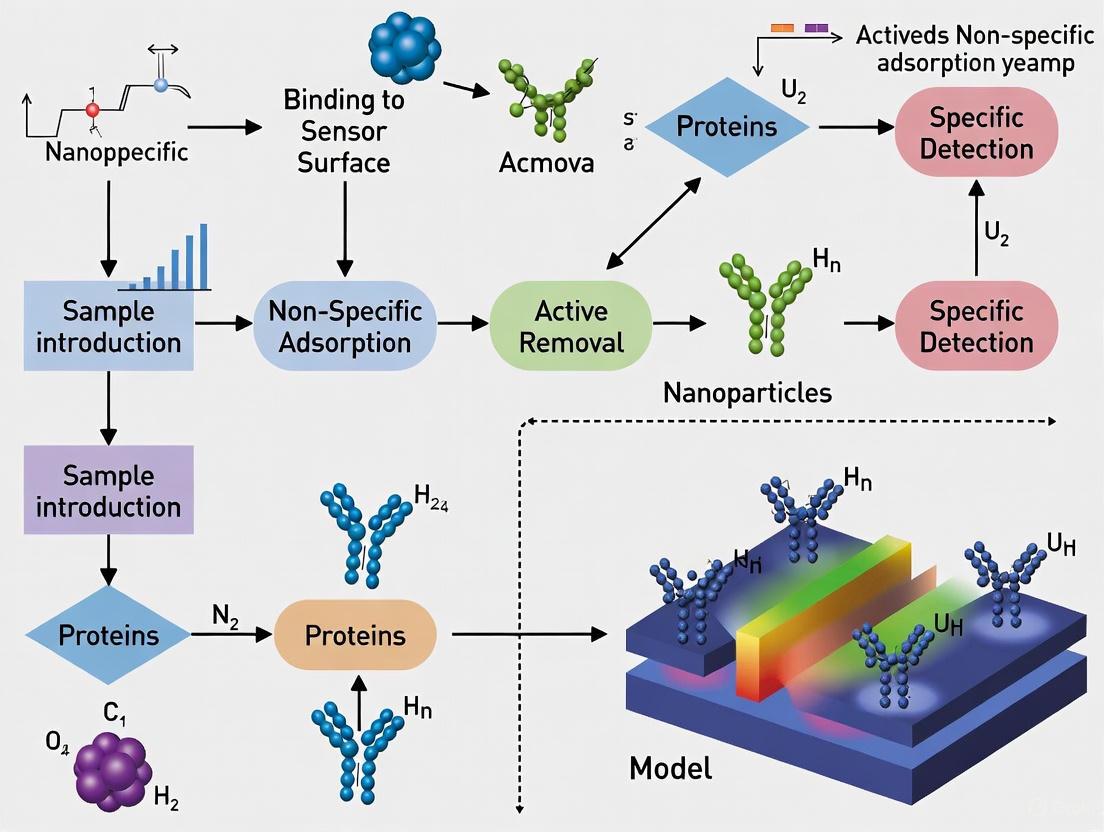
The following diagram outlines a comprehensive experimental workflow that combines characterization, prevention, and active removal strategies for managing NSA in diagnostic assays:
Figure 2: Comprehensive Workflow for NSA Management in Diagnostic Assay Development
Non-specific adsorption remains a significant barrier to achieving optimal sensitivity, specificity, and reproducibility in diagnostic assays. Through the systematic implementation of characterization methods and active removal strategies outlined in this Application Note, researchers can significantly mitigate NSA-related challenges. The integration of surface chemistry optimization with active electromechanical or hydrodynamic removal approaches represents the cutting edge of biosensor research, particularly within the context of developing point-of-care diagnostic devices for clinical use. As the field advances, the combination of high-throughput material screening, molecular simulations, and machine-learning-assisted design promises to further expand the arsenal of tools available to combat NSA, ultimately leading to more reliable and accurate diagnostic assays.
Non-specific adsorption (NSA) is a pervasive challenge that critically compromises the performance of biosensors by degrading their sensitivity, specificity, and reproducibility [1]. NSA occurs when molecules other than the target analyte physisorb onto the biosensing interface, leading to elevated background signals that are often indistinguishable from specific binding events [1] [2]. This phenomenon is primarily driven by a combination of physical and chemical forces, including electrostatic interactions, hydrophobic forces, and van der Waals forces [2]. For researchers and drug development professionals, understanding and controlling these fundamental interactions is paramount for developing robust biosensors, particularly when designing active removal methods intended to dynamically displace fouling agents from sensor surfaces. The following sections detail the quantitative contributions of these forces, provide protocols for their experimental investigation, and visualize the interplay of these interactions at the sensor interface.
Quantitative Analysis of NSA Forces
The following table summarizes the key physical forces involved in NSA, their origin, and their characteristic role in the fouling process, providing a basis for targeted mitigation strategies.
Table 1: Fundamental Physical and Chemical Forces in Non-Specific Adsorption
| Interaction Force | Physical Origin | Role in NSA | Typical Energy Range (kT) |
|---|---|---|---|
| Electrostatic | Attraction between oppositely charged surfaces and molecules in solution [2]. | Dominant in aqueous environments; can be modulated by ionic strength and pH [2]. | 1 - 5 kT |
| Hydrophobic | Entropic drive to minimize the ordered water layer between non-polar surfaces [1] [2]. | A major contributor to protein adsorption; significant in complex biological samples like blood and milk [2]. | 3 - 8 kT |
| van der Waals | Fluctuating induced dipoles between all atoms and molecules [1] [2]. | Universal, always present; contributes to the initial physisorption of molecules [1]. | 0.5 - 2 kT |
Experimental Protocols for Investigating NSA Forces
Protocol: Evaluating Electrostatic Contributions via Surfactant Modification
This protocol utilizes charged surfactants to systematically mask electrostatic interactions on a sensor surface, allowing for the quantification of their role in NSA [11].
- Surface Preparation: Prepare molecularly imprinted polymer (MIP) surfaces or other functionalized sensor interfaces (e.g., gold SPR chips).
- Surfactant Treatment: Incubate the surfaces with ionic surfactant solutions.
- For positively charged surface groups, use Sodium Dodecyl Sulfate (SDS), an anionic surfactant [11].
- For negatively charged surface groups, use Cetyl Trimethyl Ammonium Bromide (CTAB), a cationic surfactant [11].
- Concentration range: 0.01 - 0.1% w/v in a suitable buffer (e.g., phosphate buffer, pH 7.4).
- Incubation time: 30-60 minutes at room temperature.
- Washing: Rinse the modified surfaces thoroughly with deionized water and buffer to remove loosely bound surfactants.
- NSA Challenge Test: Expose the modified and unmodified (control) surfaces to a complex sample matrix (e.g., 1% serum in buffer, diluted milk) or a solution of a model foulant protein (e.g., BSA, 1 mg/mL) for 30 minutes.
- Signal Measurement: Quantify NSA using an appropriate transduction method.
- For SPR: Measure the shift in resonance angle (ΔRU) before and after the challenge test [2].
- For Electrochemical sensors: Monitor the change in charge transfer resistance (Rct) via Electrochemical Impedance Spectroscopy (EIS).
- Data Analysis: A significant reduction in the signal (ΔRU or ΔRct) on surfactant-modified surfaces compared to the control indicates a substantial electrostatic component in the NSA.
Protocol: Probing Hydrophobic Interactions with Salt and Detergent
This protocol alters the ionic strength and uses non-ionic detergents to assess the contribution of hydrophobic effects [2].
- Sample Preparation: Prepare a series of sample solutions containing the target analyte and potential interferents.
- Buffer Modifications:
- High-Salt Condition: Add NaCl to a final concentration of 1 M to shield electrostatic interactions, thereby making hydrophobic interactions more pronounced.
- Detergent Condition: Add a non-ionic detergent (e.g., Tween-20) to a final concentration of 0.05 - 0.1% v/v to disrupt hydrophobic interactions.
- Sensor Incubation: Expose the biosensor to the different sample solutions under static or hydrodynamic conditions for a fixed period.
- Signal Recording: Measure the nonspecific background signal and the specific signal separately if possible.
- Analysis: Compare the NSA levels across conditions. A significant decrease in NSA in the detergent condition indicates a strong hydrophobic component, while changes in the high-salt condition help deconvolute the electrostatic contributions.
Diagram: Interplay of Forces and Active Removal in NSA
The following diagram illustrates how the three physical forces contribute to the adsorption of a foulant molecule and how active removal methods apply external energy to overcome them.
The Scientist's Toolkit: Key Reagents for NSA Research
Table 2: Essential Research Reagents for Investigating and Mitigating NSA
| Reagent / Material | Function / Role in NSA Studies |
|---|---|
| Blocking Proteins (BSA, Casein) | Passive method: Adsorbs to vacant surface sites to prevent subsequent NSA of target interferents [1]. |
| Surfactants (SDS, CTAB, Tween-20) | SDS/CTAB mask electrostatic interactions [11]; Tween-20 disrupts hydrophobic interactions [2]. |
| Molecularly Imprinted Polymers (MIPs) | Synthetic receptors with specific cavities; used as a model surface to study and differentiate specific binding from NSA [11]. |
| Self-Assembled Monolayers (SAMs) | Well-defined chemical interfaces (e.g., alkanethiols on gold) used to create surfaces with controlled charge and hydrophobicity to study NSA mechanisms [1]. |
| Serum and Milk Samples | Complex biological matrices used for challenge tests to validate antifouling strategies under realistic conditions [2]. |
| Electroactive Probes | Molecules like [Fe(CN)₆]³⁻/⁴⁻ used in electrochemical biosensors to monitor changes in electron transfer kinetics due to surface fouling [2]. |
A meticulous understanding of the synergistic roles played by electrostatic, hydrophobic, and van der Waals interactions is the foundation for developing advanced active removal strategies in biosensors. The quantitative data, standardized protocols, and conceptual visualization provided here offer researchers a framework to systematically deconstruct the NSA phenomenon. By employing the outlined reagents and methods, scientists can effectively diagnose the dominant forces in their specific system, thereby informing the rational design of transducer-based removal methods—such as acoustic shear or electro-mechanical actuation—that generate sufficient force to overcome these specific interactions. This targeted approach is crucial for enhancing the reliability of biosensors in complex clinical and environmental matrices.
Non-specific adsorption (NSA), commonly referred to as biofouling, remains a fundamental barrier to the widespread adoption and reliability of biosensors in real-world applications. NSA describes the accumulation of non-target molecules (e.g., proteins, cells, lipids) on the biosensing interface, which leads to signal interference, false positives, reduced sensitivity, and ultimately, sensor failure. For decades, the primary strategy to combat this has been passive blocking—using inert materials like bovine serum albumin (BSA) or polyethylene glycol (PEG) to create a physical, static barrier that minimizes available surface area for unwanted adsorption [2] [4]. While useful, this approach is often insufficient in complex, dynamic biological environments like blood, serum, or milk, where fouling agents are abundant and diverse [2].
The industry is now undergoing a significant shift towards active removal strategies. These advanced methods focus on engineering biosensor surfaces to be inherently resistant to adsorption by creating a dynamic, repulsive environment. This is achieved by designing surfaces that interact strongly with water molecules, forming a energetic and physical hydration barrier that actively repels approaching foulants [4]. This paradigm move is crucial for developing next-generation biosensors capable of performing reliable, long-term measurements in clinical diagnostics, environmental monitoring, and drug discovery.
The Limitations of Conventional Passive Blocking
Passive blocking strategies, though historically the "gold standard," suffer from several critical limitations:
- Susceptibility to Degradation: PEG, one of the most common passivation agents, is prone to oxidative degradation in biological media, leading to a loss of antifouling properties over time [4].
- Static Nature: These methods form a passive barrier that does not actively respond to or repel fouling agents. Their efficacy diminishes as foulants gradually penetrate or adhere to the barrier itself [2].
- Limited Performance in Complex Media: In complex samples such as serum, gastrointestinal fluid, or bacterial lysates, the high concentration and diversity of interfering molecules can overwhelm passive blocking layers, leading to significant non-specific adsorption and signal drift [2] [4].
The search for more robust solutions has therefore driven research towards materials that can form a more resilient and active defensive layer.
The Emergence of Active Removal Strategies
Active removal strategies are defined by their ability to form a surface chemistry that is both thermodynamically and kinetically unfavorable for the adsorption of biomolecules. The most promising of these strategies leverages zwitterionic materials [4].
The Zwitterionic Advantage
Zwitterionic materials possess both positive and negative charged groups while maintaining an overall net-neutral charge. This unique structure confers superior antifouling properties through two key mechanisms:
- Neutral Surface Charge: The net-neutral surface minimizes electrostatic interactions with biomolecules, which are often charged [4].
- Formation of a Hydration Layer: The opposing charges on zwitterionic materials tightly bind water molecules via both electrostatic and hydrogen bonding, forming a strong, stable hydration layer. This layer acts as an energetic barrier, requiring significant energy for a biomolecule to displace the water and adsorb to the surface [4]. This is the core of the "active removal" effect—the surface is so hydrophilic that it actively repels approaching foulants.
Recent research has demonstrated that zwitterionic peptides, short sequences of amino acids, are particularly effective. A 2025 study showed that covalently immobilizing a specific zwitterionic peptide (EKEKEKEKEKGGC) onto porous silicon (PSi) biosensors resulted in superior antibiofouling performance compared to PEG [4]. This peptide prevented non-specific adsorption from highly challenging fluids like gastrointestinal fluid and bacterial lysate, and even resisted adhesion from biofilm-forming bacteria and mammalian cells.
Quantitative Comparison: Passive Blocking vs. Active Removal
The table below summarizes a quantitative comparison between a traditional passive blocking agent (PEG) and an advanced active removal strategy (a zwitterionic peptide), based on experimental data from a 2025 study on a PSi aptasensor for lactoferrin detection [4].
Table 1: Performance Comparison of Passivation Strategies in a PSi Biosensor
| Passivation Strategy | Type | Approach | LOD Improvement vs. Unpassivated | Signal-to-Noise Ratio | Resistance to Cellular Adhesion |
|---|---|---|---|---|---|
| PEG (750 Da) | Passive Blocking | Static physical barrier | Moderate | Baseline for comparison | Limited |
| Zwitterionic Peptide (EKEKEKEKEKGGC) | Active Removal | Dynamic hydration barrier | >1 order of magnitude | Significantly higher than PEG | Effective against bacteria and mammalian cells |
Experimental Protocol: Implementing a Zwitterionic Peptide Coating
This protocol details the procedure for functionalizing a porous silicon (PSi) biosensor surface with the zwitterionic peptide EKEKEKEKEKGGC to achieve active antifouling protection [4].
Materials and Reagents
Table 2: Essential Research Reagent Solutions
| Item | Function / Description |
|---|---|
| Porous Silicon (PSi) substrate | High-surface-area transducer for optical or electrochemical biosensing. |
| Zwitterionic Peptide (EKEKEKEKEKGGC) | The active removal agent; the C-terminal cysteine enables covalent surface attachment. |
| (3-aminopropyl)triethoxysilane (APTES) | A silane coupling agent used to introduce primary amine groups onto the PSi surface. |
| Sulfo-SMCC (Sulfosuccinimidyl 4-(N-maleimidomethyl)cyclohexane-1-carboxylate) | A heterobifunctional crosslinker that links surface amines to the peptide's cysteine thiol. |
| Ethanolamine or Tris | Small molecules used in a final quenching step to block any remaining reactive groups. |
| Phosphate Buffered Saline (PBS), pH 7.4 | Standard buffer for washing and peptide dissolution. |
| Complex Biofluids (e.g., GI fluid, 10% serum) | Testing media to validate antifouling performance in clinically relevant conditions. |
Step-by-Step Procedure
- PSi Surface Preparation and Oxidation: Clean the PSi sample (e.g., by sonication in ethanol) and then thermally oxidize it to create a stable, hydrophilic silicon dioxide (SiO₂) surface with surface hydroxyl (-OH) groups.
- Silanization with APTES:
- Incubate the oxidized PSi in a 2% (v/v) solution of APTES in anhydrous toluene for 2 hours at room temperature under an inert atmosphere.
- Rinse thoroughly with toluene and ethanol to remove physisorbed silane.
- Cure the surface at 110°C for 10 minutes to stabilize the silane layer. The surface now presents primary amine (-NH₂) groups.
- Crosslinker Activation:
- Prepare a solution of Sulfo-SMCC (2 mM) in PBS.
- Incubate the aminated PSi surface with the Sulfo-SMCC solution for 1 hour at room temperature.
- Rinse with PBS to remove unreacted crosslinker. The surface is now functionalized with maleimide groups.
- Zwitterionic Peptide Conjugation:
- Dissolve the
EKEKEKEKEKGGCpeptide in deaerated PBS to a final concentration of 0.1 mg/mL. - Incubate the activated PSi surface with the peptide solution for 4 hours at 4°C. The maleimide group on the surface will specifically react with the thiol group on the peptide's C-terminal cysteine, forming a stable thioether bond.
- Dissolve the
- Surface Quenching:
- Rinse the surface with PBS.
- Incubate with a 50 mM ethanolamine solution (in PBS, pH 7.4) for 30 minutes to quench any remaining reactive maleimide groups.
- Validation and Testing:
- Validate the coating's success by quantifying the reduction in non-specific adsorption using a model protein (e.g., fluorescently labeled BSA) in PBS.
- Test the final biosensor's performance by measuring its specific signal (e.g., to lactoferrin) against a background of complex biofluid (e.g., GI fluid or 10% serum).
Visualizing the Strategic Workflow and Performance
The following diagram illustrates the logical progression from identifying the fouling problem to implementing and validating the active removal strategy.
Diagram 1: Active removal strategy workflow from problem to application.
The performance advantage of the active removal strategy is quantitatively clear, as shown in the following bar chart comparing the key performance metrics.
Diagram 2: Performance comparison of passive blocking versus active removal.
The shift from passive blocking to active removal strategies represents a fundamental evolution in biosensor design. By moving from inert barriers to dynamic, hydration-based repellent surfaces, researchers can significantly enhance biosensor performance, reliability, and applicability in real-world settings. The implementation of zwitterionic peptides, as detailed in these application notes, provides a robust, tunable, and highly effective method to achieve this goal.
Future directions in this field will likely focus on the high-throughput screening of new zwitterionic sequences, the integration of these coatings with multi-modal detection systems (e.g., electrochemical-surface plasmon resonance), and the use of machine learning-assisted evaluations to predict and optimize the performance of new antifouling materials [2]. This proactive approach to surface engineering is poised to unlock the full potential of biosensors across healthcare, food safety, and environmental monitoring.
The Critical Need for Active Methods in Microfluidic and Point-of-Care Biosensors
Non-specific adsorption (NSA) represents a fundamental challenge in biosensing, particularly for microfluidic and point-of-care (POC) devices. This phenomenon occurs when non-target biomolecules irreversibly adsorb to sensor surfaces, generating elevated background signals that are often indistinguishable from specific binding events [6]. NSA negatively impacts key biosensor performance parameters including sensitivity, specificity, dynamic range, and reproducibility [6]. While passive methods like surface coatings have been the traditional approach to mitigating NSA, this application note establishes the critical need for active removal methods that dynamically eliminate interfering molecules post-functionalization. The shift from passive to active NSA reduction strategies is essential for developing next-generation biosensors capable of reliable operation in complex clinical and environmental samples.
Understanding NSA and Its Impact on Biosensor Performance
Mechanisms and Consequences of NSA
NSA primarily occurs through physisorption, driven by intermolecular forces including hydrophobic interactions, ionic interactions, van der Waals forces, and hydrogen bonding [6]. In microfluidic biosensors, which handle minute fluid volumes (10⁻⁶ to 10⁻¹⁸ L), the high surface-to-volume ratio amplifies the detrimental effects of NSA [6]. For affinity-based biosensors common in POC diagnostics, NSA leads to false-positive signals that directly compromise clinical interpretation [6].
Limitations of Passive Reduction Methods
Passive methods, including chemical coatings and physical blockers, aim to prevent NSA by creating a hydrophilic, non-charged boundary layer [6]. Common approaches include:
- Protein blockers: Bovine serum albumin (BSA) and other proteins that occupy vacant surface sites [6]
- Polymer coatings: Polyethylene glycol (PEG) and zwitterionic materials that form hydration barriers [4]
- Chemical linkers: Self-assembled monolayers (SAMs) that reduce non-specific interactions [6]
While valuable, these passive strategies present limitations for POC applications. Surface coatings may not be compatible with all sensing modalities, can reduce bioreceptor accessibility, and often degrade over time, especially in complex biological matrices [4]. Furthermore, the extensive surface area of porous transducers like porous silicon (PSi) presents particular challenges that passive methods alone cannot adequately address [4].
Active NSA Reduction Methods: Principles and Applications
Active NSA reduction methods dynamically remove adsorbed molecules after functionalization, typically employing transducers to generate surface forces that shear away weakly adhered biomolecules [6]. These approaches are gaining prominence in microfluidic biosensing due to their effectiveness and compatibility with miniaturized systems.
Table 1: Comparison of Active NSA Reduction Methods
| Method Category | Physical Principle | Key Advantages | Reported Applications |
|---|---|---|---|
| Electromechanical | High-frequency vibrations (e.g., 2.5 GHz) generating surface shear forces | Selective removal of weakly adsorbed molecules; Can be integrated with sensing | Hypersonic resonator for protein detection [10] |
| Acoustic | Surface waves or bulk acoustic waves | Compatible with various sensor geometries; Effective in microfluidic channels | Not specified in results |
| Hydrodynamic | Controlled fluid flow generating shear forces | Simple implementation; No additional transducers required | Microfluidic flow systems [6] |
| Plasmonic-Assisted | Evaporation-induced flows and coffee-ring effect | Pre-concentrates target analytes while reducing background | Plasmonic coffee-ring biosensor for protein detection [12] |
Emerging Hybrid and Advanced Approaches
Recent innovations combine multiple principles to enhance NSA reduction:
- Plasmonic coffee-ring biosensors utilize evaporation-induced flows to pre-concentrate biomarkers while forming distinctive asymmetric patterns that minimize interpretation ambiguity [12]. This approach achieves exceptional sensitivity, detecting proteins like prostate-specific antigen (PSA) as low as 3 pg/mL [12].
- Electrochemical-surface plasmon resonance (EC-SPR) platforms leverage coupled detection mechanisms to address NSA in complex samples [10].
- Pushbutton-activated microfluidic systems integrate intuitive operation with optimized fluid dynamics to reduce non-specific interactions in multiplexed pathogen detection [13].
Experimental Protocols for Implementing Active NSA Reduction
Protocol: Hypersonic Resonator for NSA Reduction and Detection
This protocol describes using a microfabricated hypersonic resonator (2.5 GHz resonant frequency) for combined NSA removal and protein detection [10].
Materials:
- Hypersonic resonator device
- Buffer solution (appropriate for target analyte)
- Sample solution
- Flow cell or microfluidic integration system
- Signal generator and readout system
Procedure:
- Device Preparation: Clean the resonator surface following manufacturer protocols.
- Baseline Establishment: Flow buffer solution through the system to establish resonant frequency baseline.
- Sample Introduction: Introduce sample solution containing target analytes, allowing specific and non-specific binding to occur.
- NSA Removal Phase: Activate hypersonic resonator at optimized frequency and duration to generate surface shear forces that remove weakly adsorbed NSA molecules while retaining specifically bound targets.
- Detection Phase: Monitor resonant frequency shifts to quantify specifically bound analytes.
- Regeneration: Apply appropriate regeneration solution to remove bound analytes for sensor reuse.
Validation: Compare signals with and without activation to confirm NSA reduction efficacy.
Protocol: Plasmonic Coffee-Ring Biosensing
This protocol details the utilization of coffee-ring effects for pre-concentration and asymmetric plasmonic patterning to minimize NSA interference [12].
Materials:
- Thermally treated nanofibrous membrane substrates
- Functionalized gold nanoshells (GNShs)
- Sample solution containing target biomarkers
- Pipettes for precise droplet dispensing (5 μL and 2 μL)
- Smartphone or imaging system for pattern capture
Procedure:
- Sample Deposition: Place 5 μL sample droplet on right side of nanofibrous membrane.
- First Evaporation: Allow complete evaporation and drying to form coffee-ring with pre-concentrated biomarkers.
- Plasmonic Droplet Deposition: Place 2 μL plasmonic nanoparticles droplet on left side of first droplet position.
- Second Evaporation: Allow evaporation to form asymmetric interaction pattern.
- Pattern Analysis: Capture resulting plasmonic pattern using smartphone imaging.
- Quantification: Process images using deep neural network model for quantitative biomarker diagnosis.
Optimization Notes: Membrane properties significantly influence pre-concentration efficiency; thinner membranes minimize fluid volume retention and reduce non-specific region particles [12].
Diagram Title: Coffee-Ring Biosensing Workflow
Performance Comparison and Validation
Table 2: Quantitative Performance of Biosensors with Active NSA Reduction
| Biosensor Platform | Target Analyte | Limit of Detection | Dynamic Range | Key NSA Reduction Method |
|---|---|---|---|---|
| Plasmonic coffee-ring biosensor [12] | Prostate-specific antigen (PSA) | 3 pg/mL | 5 orders of magnitude | Evaporation-induced flow and asymmetric patterning |
| Plasmonic coffee-ring biosensor [12] | SARS-CoV-2 N protein | Not specified | 5 orders of magnitude | Evaporation-induced flow and asymmetric patterning |
| Zwitterionic peptide-PSi aptasensor [4] | Lactoferrin | >1 order of magnitude improvement vs. PEG | Clinically relevant range | Zwitterionic peptide passivation |
| Pushbutton-activated microfluidic [13] | Bacterial 16S rRNA | 1.69-7.39 pM (10⁴-10⁵ CFU/mL) | Not specified | Optimized microfluidic design and flow control |
Validation Methodologies
Robust validation of active NSA reduction methods requires:
- Comparison with reference methods: Evaluate performance against gold-standard techniques like ELISA in complex matrices [12]
- Specificity testing: Challenge sensors with structurally similar interferents and complex biofluids (e.g., GI fluid, bacterial lysate) [4]
- Stability assessment: Verify performance maintenance under relevant storage and operational conditions [11]
- Real-sample analysis: Demonstrate functionality in clinically relevant samples with appropriate recovery rates [11]
The Scientist's Toolkit: Research Reagent Solutions
Table 3: Essential Reagents for Active NSA Reduction Research
| Reagent/Material | Function/Application | Examples/Specifications |
|---|---|---|
| Zwitterionic peptides | Surface passivation with stable hydration layer | EKEKEKEKEKGGC sequence; Prevents protein/cell adhesion [4] |
| Gold nanoshells (GNShs) | Plasmonic signal generation and visualization | Functionalized for specific protein interactions [12] |
| Nanofibrous membranes | Substrate for coffee-ring pre-concentration | Thermally treated; Controlled porosity [12] |
| Surfactants (SDS, CTAB) | Electrostatic modification of molecularly imprinted polymers | Eliminates non-specific adsorption in MIPs [11] |
| Hypersonic resonators | Active NSA removal via surface shear forces | 2.5 GHz resonant frequency; Integrated sensing capability [10] |
Implementation Considerations for Point-of-Care Applications
Translating active NSA reduction methods from research laboratories to practical POC devices requires addressing several critical considerations:
Integration and Manufacturing
Successful integration of active NSA reduction methods demands:
- Minimal complexity: Methods like pushbutton-activated microfluidics demonstrate how intuitive operation can be maintained while incorporating advanced functionality [13]
- Scalable fabrication: Utilization of manufacturable materials and processes compatible with mass production [14]
- Power efficiency: Optimization of energy requirements for portable operation, particularly for electromechanical methods
Usability and Interpretation
Enhancing accessibility without compromising performance:
- Simplified readouts: Asymmetric plasmonic patterns that enable both naked-eye interpretation and smartphone quantification [12]
- Machine learning integration: Convolutional neural networks for quantitative analysis from simple images, eliminating expert interpretation requirements [12]
- Multiplexing capability: Parallel detection configurations for comprehensive pathogen identification in single devices [13]
Diagram Title: POC Implementation Framework
Active NSA reduction methods represent a critical advancement in microfluidic and point-of-care biosensing, directly addressing the fundamental challenge of non-specific binding that has long limited biosensor reliability in real-world applications. The integration of electromechanical, hydrodynamic, and novel evaporation-based approaches provides powerful tools for enhancing biosensor performance without compromising the simplicity essential for POC settings. As research continues to refine these methods and improve their integration with emerging sensing modalities, active NSA reduction will play an increasingly vital role in realizing the full potential of biosensors for clinical diagnostics, environmental monitoring, and global health security.
Cutting-Edge Active Removal Technologies: Principles and Implementations
Non-specific adsorption (NSA) is a pervasive challenge in biosensing, leading to elevated background signals, false positives, and reduced sensitivity, selectivity, and reproducibility [6]. NSA occurs when biomolecules physisorb onto a sensor's surface through hydrophobic forces, ionic interactions, van der Waals forces, and hydrogen bonding, rather than through specific, desired interactions [6]. To combat this, research has shifted from passive methods (e.g., surface coatings and blockers) to active removal methods that dynamically generate forces to shear away weakly adhered molecules after they have adsorbed [6]. Among these, electromechanical transducers have emerged as a powerful technology for post-functionalization NSA removal, enhancing the performance of biosensors used in diagnostics, environmental monitoring, and drug development [6].
This Application Note details the principles and protocols for using electromechanical transducers, specifically microcantilevers, to generate surface forces for NSA reduction. The content is framed within a broader thesis on active removal methods, providing researchers with actionable methodologies to improve biosensor efficacy.
Principles of Electromechanical Transduction
Electromechanical transducers convert electrical energy into mechanical force. In biosensing, they are designed to create surface stresses or movements that overcome the adhesive forces of physisorbed molecules [6]. A prominent example is the microcantilever (MC), a microscale silicon-based beam that can be operated in two distinct modes to facilitate specific binding detection and non-specific removal [15].
The following diagram illustrates the core working principle of using electromechanical transduction for active NSA removal:
Microcantilever Operational Modes
Microcantilevers function through two primary modes, each with distinct mechanisms and design considerations for biosensing and NSA removal [15].
Table 1: Comparison of Microcantilever Operational Modes
| Feature | Static Mode | Dynamic Mode |
|---|---|---|
| Operating Principle | Measurement of surface stress-induced deflection | Measurement of resonant frequency shift |
| Primary Signal | Bending/Deflection | Change in Resonant Frequency |
| Ideal Cantilever Design | Long, flexible cantilever | Short, stiff cantilever |
| Key Challenge | Selective functionalization of one surface; deflection measurement | Actuation requirement; influence of flexural rigidity on frequency shift |
| Common Readout Methods | Piezoresistivity, integrated FET, optical beam deflection | Piezoelectric actuation, optical excitation |
Static Mode MCs: In this mode, the attachment of analyte molecules onto a functionalized surface generates a surface stress, causing a measurable deflection of the cantilever [15]. The deflection is typically monitored via piezoresistivity (where bending changes electrical resistivity) or by using an integrated field-effect transistor (FET) whose electron mobility is strain-dependent [15]. A key challenge is confining functionalization to a single cantilever surface to induce asymmetric stress [15].
Dynamic Mode MCs: Here, the cantilever is driven to oscillate at its resonant frequency. The adsorption of mass (including non-specific molecules) alters this frequency [15]. A shift in resonance indicates binding events. This mode requires external actuation (e.g., piezoelectric) and is complicated because adsorption affects not only mass but also the cantilever's flexural rigidity [15].
Experimental Protocols
This section provides detailed methodologies for implementing electromechanical transducers in NSA reduction experiments.
Protocol: NSA Reduction Using Static Microcantilever Arrays
Objective: To actively remove non-specifically adsorbed proteins from a functionalized microcantilever surface by inducing surface stress via electrical stimulation.
Materials & Reagents:
- Silicon microcantilever array with integrated piezoresistive strain sensors.
- Self-Assembled Monolayer (SAM) solution (e.g., alkanethiols for gold-coated cantilevers).
- Bioreceptor solution (e.g., antibodies, single-stranded DNA).
- Target analyte solution.
- Complex test solution (e.g., serum, blood plasma) to induce NSA.
- Phosphate Buffered Saline (PBS), pH 7.4.
- Flow cell with integrated microfluidics [15].
Procedure:
- Surface Functionalization:
- Mount the microcantilever array within the flow cell.
- Flush the system with ethanol followed by PBS.
- For gold-coated cantilevers, immerse the system in the SAM solution for 2 hours to form a monolayer on all surfaces.
- Flush with PBS to remove unbound SAM molecules.
- Introduce the bioreceptor solution, allowing it to circulate for 1 hour to immobilize specifically on the pre-defined sensing areas.
- Flush again with PBS to remove unbound receptors.
Baseline Signal Acquisition:
- With the cantilever in a buffer solution (PBS), record the baseline piezoresistive signal from each cantilever in a Wheatstone bridge configuration [15].
- Calibrate the deflection signal against known surface stresses.
Exposure to Complex Solution and NSA Monitoring:
- Introduce the complex test solution (e.g., 10% serum in PBS) into the flow cell for 15 minutes.
- Monitor the cantilever deflection. A drift in the signal indicates the adsorption of molecules (both specific and non-specific).
Active NSA Removal via Electromechanical Stimulation:
- Apply a controlled electrical signal to the piezoresistive layer or a separate actuator to induce a sharp, transient deflection in the cantilever. This generates significant surface shear forces.
- A typical protocol may involve a 1-5 V pulse for 100-500 ms.
- Observe the real-time cantilever signal. A rapid shift back towards the original baseline indicates the successful shearing of weakly bound NSA molecules.
Specific Analyte Detection:
- Introduce the specific target analyte solution.
- The measured deflection now primarily reflects specific binding events, with a significantly reduced NSA background.
Surface Regeneration (Optional):
- For re-usable sensors, a low-pH buffer or a mild detergent can be flushed through the microfluidic system to break specific bonds and refresh the surface for a new measurement cycle [15].
The following workflow summarizes the key experimental steps:
Data Analysis and Interpretation
Quantify the effectiveness of NSA reduction by comparing the signal drift rate or absolute deflection value before and after the electromechanical pulse. The signal-to-noise ratio (SNR) for the specific analyte binding event should show a marked improvement post-treatment.
The Scientist's Toolkit: Research Reagent Solutions
Successful implementation of these protocols relies on key materials and reagents.
Table 2: Essential Research Reagents and Materials
| Item | Function/Description | Example Application |
|---|---|---|
| Silicon Microcantilever Arrays | Micron-scale beams that transduce molecular adsorption into a mechanical signal. The core transducer element. | Serving as the substrate for bioreceptor immobilization and the generator of surface forces [15]. |
| Self-Assembled Monolayers (SAMs) | Ordered molecular assemblies that form on surfaces; provide a functional layer for controlled bioreceptor attachment and can reduce inherent surface stickiness. | Creating a well-defined surface chemistry on gold-coated cantilevers for orienting antibodies or nucleic acids [6]. |
| Piezoresistive Materials | Materials whose electrical resistivity changes with applied mechanical strain. Used for integrated deflection sensing. | Enabling electronic readout of cantilever bending in static mode without complex optical systems [15]. |
| Microfluidic Flow Cells | Miniaturized devices for handling small fluid volumes; provide controlled delivery of samples and reagents. | Enabling precise fluid handling, sample introduction, and surface regeneration in an integrated biosensor system [15] [6]. |
| Protein Blockers (e.g., BSA) | Proteins used to passively occupy leftover reactive sites on the sensor surface. | Often used in conjunction with active methods; applied after functionalization to minimize initial NSA before active removal is employed [6]. |
Applications and Concluding Remarks
The integration of electromechanical transducers like microcantilevers with microfluidic systems represents a cutting-edge approach to mitigating the long-standing problem of NSA in biosensors [15] [6]. The ability to generate targeted surface forces to shear away biomolecules provides a dynamic, and often re-usable, strategy to enhance signal fidelity.
The application of these active removal methods is particularly critical in the development of next-generation biosensors for:
- Point-of-Care Diagnostics: Improving the accuracy of devices used in complex biological matrices like blood or saliva.
- Drug Discovery: Enabling more precise monitoring of binding kinetics and biomolecular interactions in high-throughput screening.
- Personalized Medicine: Facilitating the reliable detection of low-abundance biomarkers by pushing the limits of detection and sensitivity.
As the field advances, the combination of passive surface chemistry and active electromechanical removal will be key to creating robust, sensitive, and reliable biosensing platforms.
Non-specific adsorption (NSA), commonly referred to as biofouling, presents a significant challenge in the development and deployment of reliable biosensors. This phenomenon involves the undesirable adhesion of proteins, cells, or other biomolecules to sensor surfaces through weak interactive forces such as van der Waals interactions, hydrophobic forces, and ionic interactions [1]. In biosensing applications, biofouling occurs when molecules from complex biological fluids (e.g., blood, serum, urine) adsorb to the sensing interface, leading to elevated background signals that are often indistinguishable from specific binding events [1] [2]. The consequences include reduced sensitivity, specificity, and reproducibility of biosensors, ultimately compromising their analytical performance and clinical utility [1] [2].
The transition from passive prevention to active removal methods represents a paradigm shift in biofouling management strategies. While traditional approaches have focused primarily on creating inert surfaces through chemical modifications or blocker proteins [1], these methods often involve increased setup time, additional reagents, and compatibility challenges with sensing materials [16]. Active removal techniques, particularly those utilizing acoustic energy, offer a dynamic alternative by physically disrupting and removing fouling agents after adsorption has occurred [16]. This approach enables real-time maintenance of sensor functionality and extends operational lifespan without requiring surface modifications that might interfere with sensing mechanisms.
Theoretical Foundations of Acoustic Biofouling Removal
Mechanism of Acoustic Removal
The removal of non-specifically bound proteins using acoustic wave devices relies on the fundamental principle of utilizing mechanical energy to overcome adhesive forces between fouling agents and sensor surfaces. When surface acoustic waves (SAWs) propagate through a piezoelectric substrate in contact with a liquid medium, they generate several forces that collectively act to dislodge and remove adsorbed biomolecules [16].
The primary mechanism involves three complementary force components: The SAW direct force (FSAW) provides the initial energy to detach NSB proteins from the surface by disrupting the adhesive bonds. This force decays rapidly with distance from the surface. Lift forces (FL) act perpendicular to the surface, preventing reattachment of dislodged particles by creating a vertical barrier. Drag forces (FST) result from acoustic streaming effects and push detached proteins laterally away from the fouled area, ensuring complete removal [16].
The effectiveness of acoustic removal depends on the balance between these removal forces and the adhesive forces binding proteins to the surface. For spherical particles, the dominant adhesive force is typically the van der Waals force (FvdW), which can be calculated as FvdW ≈ AR/(6z²), where A is the Hamaker constant, R is the particle radius, and z is the separation distance [16].
Force Balance in Protein Removal
Table 1: Forces involved in acoustic removal of non-specifically bound proteins
| Force Type | Symbol | Formula | Direction | Function |
|---|---|---|---|---|
| Van der Waals (Adhesive) | FvdW | ≈ AR/(6z²) | Toward surface | Binds proteins to surface |
| SAW Direct Force | FSAW | ≈ √(Fx² + Fz²)R² | Away from surface | Initial detachment |
| Lift Force | FL | ≈ ρf(uxR)² | Normal to surface | Prevents reattachment |
| Drag Force | FST | ≈ μRuz | Tangential to surface | Lateral displacement |
The successful removal of biofouling agents requires that the combined removal forces (FSAW, FL, FST) exceed the adhesive forces (FvdW). Research has demonstrated that surface acoustic waves in the hypersonic frequency range (typically 50-200 MHz) generate sufficient force to remove proteins with radii in the nanometer to micrometer scale [16] [17]. The size-dependent nature of these forces enables selective removal strategies, as the acoustic radiation force is proportional to particle volume [17].
Hypersonic Resonator Design and Implementation
Device Architecture and Materials
ST-cut quartz has emerged as the predominant substrate material for hypersonic resonators used in biofouling removal applications. This specific crystal cut is particularly advantageous because it supports the simultaneous propagation of both Rayleigh waves (utilized for NSB protein removal) and shear-horizontal waves (employed for sensing applications) [16]. This dual functionality enables the integration of fouling removal and biosensing capabilities on a single chip, facilitating the development of multifunctional "lab on a chip" devices [16].
The fundamental component of these devices is the interdigital transducer (IDT), which consists of patterned metallic electrodes fabricated directly onto the piezoelectric substrate. When an alternating electrical signal is applied to the IDT, it generates mechanical waves that propagate along the crystal surface due to the piezoelectric effect. Research indicates that optimal biofouling removal occurs at frequencies between 50-150 MHz, with specific studies demonstrating effective protein removal at 50 MHz, 100 MHz [16], and 127.8 MHz [17]. The design parameters of the IDT, including the number of finger pairs (typically 3 or more), electrode spacing, and aperture width, directly determine the operational frequency and energy transfer efficiency of the device [16] [17].
Experimental Validation and Performance
Controlled experiments have systematically validated the efficacy of hypersonic resonators for biofouling removal. In one comprehensive study, researchers created micropatterns of immobilized antibodies on ST-quartz substrates to segregate sensing and non-sensing areas [16]. The application of Rayleigh surface acoustic waves successfully removed non-specifically bound antigens and interfering proteins from both regions, whereas conventional methods like rinsing and blocking agents proved ineffective [16].
Notably, the same study demonstrated that applying amplified RF signals could even disrupt specific antigen-antibody interactions, highlighting the considerable power available for combating persistent fouling [16]. The removal process has been shown to be highly efficient across a range of experimental conditions, with one acoustofluidics-enhanced biosensing platform achieving capture rates exceeding 91% for target microbeads [17].
Table 2: Performance characteristics of acoustic biofouling removal systems
| Parameter | Range/Value | Experimental Conditions | Impact on Removal Efficiency |
|---|---|---|---|
| Frequency | 50-150 MHz | ST-quartz substrate | Higher frequencies increase radiation force |
| Input Power | Optimized for specific setup | Varies with electrode design | Sufficient to overcome adhesive forces |
| Removal Time | Seconds to minutes | Continuous wave operation | Dependent on fouling severity |
| Particle Size | 3-7 μm tested | Polystyrene microbeads | Larger particles respond better (κ >1) [17] |
| Microchannel Width | 200 μm optimal | PDMS microchannel | Balance between flow and acoustic effects [17] |
Application Notes and Experimental Protocols
Protocol 1: System Setup and Calibration
Objective: Proper assembly and calibration of the hypersonic resonator system for biofouling removal.
Materials:
- ST-cut quartz substrate with fabricated IDTs
- RF signal generator (capable of 50-150 MHz)
- PDMS microfluidic chamber (200 μm width optimal)
- Network analyzer for frequency characterization
- Microscope with imaging capability for visualization
Procedure:
- Substrate Preparation: Clean the ST-quartz substrate using oxygen plasma treatment for 2 minutes at 100 W to ensure surface hydrophilicity and remove organic contaminants.
- Microchannel Bonding: Align the PDMS microchannel with the acoustic wave propagation path on the quartz substrate and bond using oxygen plasma-assisted sealing.
- Frequency Characterization: Connect the IDT to a network analyzer and measure the S₁₁ parameter to identify the resonant frequency. The device should demonstrate a clear dip in the S₁₁ curve at the operational frequency (e.g., 127.8 MHz as reported in [17]).
- Fluidic Priming: Introduce phosphate-buffered saline (PBS) into the microchannel using a syringe pump, ensuring complete priming without air bubbles that would disrupt acoustic wave propagation.
- Power Calibration: Apply RF signals at the resonant frequency with increasing power (0.1-2.0 W) while observing acoustic streaming effects. Adjust to the minimum power that generates visible streaming vortices.
- System Validation: Introduce fluorescent microbeads (7 μm diameter) in suspension at a concentration of 10⁶ beads/mL with a flow rate of 5 μL/min. Verify that the acoustic waves successfully concentrate beads at the predicted location (top surface of microchannel for FTSAW) [17].
Protocol 2: Biofouling Removal from Biosensor Surfaces
Objective: Removal of non-specifically bound proteins from functionalized biosensor surfaces while preserving specific binding.
Materials:
- Functionalized biosensor with specific capture agents
- Complex biological sample (serum, blood, milk)
- Blocking solution (1% BSA in PBS)
- Washing buffer (PBS with 0.05% Tween-20)
- Hypersonic resonator system calibrated per Protocol 1
Procedure:
- Initial Fouling: Expose the functionalized biosensor surface to the complex biological sample for 30-60 minutes at room temperature to allow non-specific adsorption to occur.
- Baseline Measurement: Record the baseline sensor signal (e.g., electrochemical impedance, SPR response) to quantify the degree of biofouling.
- Initial Rinse: Gently rinse the sensor surface with washing buffer to remove loosely bound material without disrupting strongly adsorbed foulants.
- Acoustic Activation: Apply surface acoustic waves at the predetermined resonant frequency (e.g., 100 MHz) and power (typically 0.5-1.5 W) for 2-5 minutes while buffer continuously flows through the microchannel at 10 μL/min.
- Efficiency Assessment: Measure the sensor signal after acoustic treatment and compare to the post-rinse baseline. Effective removal should demonstrate significant signal reduction toward the pre-fouling baseline.
- Specific Binding Validation: Challenge the cleaned surface with a known concentration of target analyte to verify that specific binding capacity remains intact.
- Iterative Application: For continuous sensing applications, implement periodic short-duration (30-60 second) acoustic pulses to maintain surface cleanliness during prolonged operation.
Protocol 3: Integrated Sensing and Cleaning Operation
Objective: Simultaneous biosensing and biofouling management for long-term monitoring applications.
Materials:
- Multifunctional ST-quartz device supporting both SH-SAW (sensing) and Rayleigh waves (cleaning)
- Dual-channel RF electronics
- Flow system with sample and buffer reservoirs
- Data acquisition software
Procedure:
- System Configuration: Set up alternating operation between sensing (SH-SAW) and cleaning (Rayleigh wave) modes with a typical cycle of 5 minutes sensing followed by 1 minute cleaning.
- Real-time Monitoring: Continuously monitor the sensor response during sensing phases, establishing a baseline signal for a clean surface.
- Threshold-based Activation: Program the system to automatically initiate cleaning cycles when the signal drift exceeds a predetermined threshold (e.g., 5% increase from baseline).
- Performance Tracking: Record the signal recovery after each cleaning cycle to monitor long-term surface integrity and cleaning efficiency.
- Adaptive Optimization: Adjust cleaning duration and power based on the observed recovery, minimizing energy input while maintaining surface functionality.
Research Reagents and Materials
Table 3: Essential research reagents and materials for acoustic biofouling removal experiments
| Category | Specific Items | Function/Purpose | Example Application |
|---|---|---|---|
| Piezoelectric Substrates | ST-cut quartz, 128° YX LiNbO₃ | Generate surface acoustic waves | ST-quartz enables dual sensing/cleaning [16] |
| Microfabrication Materials | Photoresist, metal deposition sources (Cr/Au) | IDT electrode fabrication | Creating interdigital transducers [16] [17] |
| Microfluidic Components | PDMS, silicone tubing, syringe pumps | Fluid delivery and containment | 200 μm wide channels optimal for enrichment [17] |
| Characterization Tools | Network analyzer, fluorescence microscope | System validation and monitoring | S₁₁ measurement for resonance [17] |
| Biological Samples | Serum, blood, milk | Complex fouling media | Testing antifouling in clinical/food samples [2] |
| Model Foulants | BSA, fibrinogen, fluorescent microbeads | Controlled fouling agents | Size-dependent removal studies [16] [17] |
| Buffer Systems | PBS, Tris-HCl with varying ionic strength | Medium for experiments | Impact of ionic strength on NSA [2] |
The implementation of hypersonic resonators for biofouling removal represents a significant advancement in biosensor technology, addressing one of the most persistent challenges in real-world applications. The methods and protocols outlined herein provide researchers with practical frameworks for integrating acoustic cleaning capabilities into biosensing platforms. The quantitative data demonstrates that surface acoustic waves in the 50-150 MHz range generate sufficient forces to effectively remove non-specifically bound proteins while preserving the integrity of specifically bound analytes [16] [17].
Future developments in this field will likely focus on adaptive control systems that automatically adjust acoustic parameters based on real-time fouling assessment, further optimizing the balance between cleaning efficiency and energy consumption. Additionally, the integration of machine learning algorithms for predictive fouling management and the development of multi-frequency approaches that target different foulant classes represent promising research directions [18]. As biosensors continue to evolve toward greater complexity and longer deployment durations, active biofouling removal strategies utilizing acoustic technologies will play an increasingly critical role in ensuring reliable performance across diverse applications from clinical diagnostics to environmental monitoring.
Non-specific adsorption (NSA) remains a significant barrier to the widespread adoption of biosensors, particularly when analyzing complex biological samples such as blood, serum, or milk. NSA refers to the accumulation of non-target molecules (e.g., proteins, lipids, cells) on biosensing interfaces, which can lead to signal interference, false positives, reduced sensitivity, and inaccurate results [2] [19]. While antifouling coatings represent a passive approach to minimize NSA, active removal methods offer a dynamic strategy to dislodge and eliminate adsorbed foulants during or between measurement cycles.
This Application Note focuses on hydrodynamic removal—an active method that leverages precisely controlled microfluidic flow to generate defined shear forces at the biosensor surface. This technique physically displaces non-specifically bound molecules without compromising the integrity of the specific biorecognition layer. We detail the fundamental principles, provide quantitative guidelines for force calibration, and outline robust experimental protocols for integrating hydrodynamic removal into biosensing workflows for researchers and drug development professionals.
Theoretical Foundation: Shear Forces in Microfluidic Channels
In microfluidic systems, fluid flow is typically laminar, allowing for precise prediction and control of shear forces. The wall shear stress (( \tau_w )), which acts parallel to the sensor surface and is responsible for dislodging adsorbed species, can be calculated for different channel geometries.
Table 1: Wall Shear Stress Formulas for Common Microfluidic Channel Geometries
| Channel Geometry | Wall Shear Stress (( \tau_w )) | Key Parameters |
|---|---|---|
| Rectangular | ( \tau_w = \frac{6 \mu Q}{w h^2} ) | ( \mu ): Dynamic viscosity( Q ): Volumetric flow rate( w ): Channel width( h ): Channel height |
| Cylindrical | ( \tau_w = \frac{4 \mu Q}{\pi R^3} ) | ( \mu ): Dynamic viscosity( Q ): Volumetric flow rate ( R ): Channel radius |
The following diagram illustrates the logical workflow for developing a hydrodynamic removal strategy, from problem identification to protocol validation.
Quantitative Analysis: Shear Force Ranges for Foulant Removal
The effectiveness of hydrodynamic removal depends on applying a shear force that exceeds the adhesion force of non-specifically bound molecules but remains below the threshold that would damage the biosensor's functional layer or specific analyte-bioreceptor bonds.
Table 2: Typical Shear Stress Ranges for Removal of Various Foulant Types [20] [2] [10]
| Foulant Category | Example Molecules/Cells | Effective Shear Stress Range (Pa) | Notes & Considerations |
|---|---|---|---|
| Proteins | Albumin, Fibrinogen | 0.1 - 10 | Lower end for weakly adsorbed proteins; higher end for protein aggregates or multilayers. |
| Lipids & Surfactants | Cell membrane fragments, residual solvents | 1 - 15 | Higher viscosity may require increased shear. |
| Blood Cells | Red Blood Cells (RBCs), platelets | 0.5 - 5 | Force is cell-type and surface adhesion molecule dependent. |
| Bacteria | E. coli, S. aureus | 5 - 50 | Requires significant force due to multiple adhesion points. |
A key application involves mimicking physiological conditions to study and mitigate fouling. For instance, a recent computational fluid dynamics (CFD) study designed a variable cross-section microfluidic channel to simultaneously reproduce both low oscillatory wall shear stress (OWSS) near a stepped section (emulating the atherosclerosis-prone carotid sinus) and high pulsatile wall shear stress (PWSS) downstream. Vortex formation induced by the step structure was key to generating the low OWSS conditions that promote fouling and endothelial dysfunction [20]. This approach allows for the real-world testing of hydrodynamic removal protocols under biologically relevant conditions.
Experimental Protocol: Implementing Hydrodynamic Washing
This protocol describes the integration of a hydrodynamic washing step into a standard microfluidic biosensor assay to mitigate NSA.
Materials and Reagents
Table 3: Research Reagent Solutions and Essential Materials
| Item | Function / Description | Example |
|---|---|---|
| Syringe Pump | Provides precise, pulseless control of volumetric flow rate (( Q )). | NeMESYS or similar infusion pump. |
| Microfluidic Chip | Contains the biosensor and defines channel geometry (( w, h, L )). | PDMS-glass hybrid chip with integrated electrodes or optical sensors [20]. |
| Washing Buffer | Carrier fluid for hydrodynamic removal. | Phosphate Buffered Saline (PBS) with 0.01% Tween-20. |
| Waste Reservoir | Collects effluent containing displaced foulants. | 1.5 mL microcentrifuge tube. |
| Shear Stress Calibration Standards | Polystyrene beads for flow visualization and shear validation. | 1-2 µm fluorescent microspheres. |
Step-by-Step Procedure
- System Priming: Flush the entire microfluidic system with washing buffer to remove air bubbles and pre-wet all surfaces. Ensure no back-pressure build-up.
- Baseline Signal Acquisition: With buffer flow stabilized at the assay flow rate (e.g., 5 µL/min), record the baseline signal from the biosensor (e.g., electrochemical current, SPR angle).
- Sample Introduction & Fouling: Introduce the complex sample (e.g., 10% serum in buffer) and incubate for a defined period (e.g., 15 minutes) under minimal flow to allow for NSA.
- Initial Rinse (Low Shear): Flush the channel with washing buffer at a low shear stress (e.g., 0.5 Pa) for 2 minutes to remove weakly bound molecules and bulk contaminants.
- Hydrodynamic Removal (High Shear): a. Calculate Flow Rate: Based on your channel geometry (Table 1) and the target shear stress for your foulant (Table 2), calculate the required volumetric flow rate (( Q )). b. Execute High-Flow Wash: Program the syringe pump to deliver the calculated ( Q ) for a defined duration (e.g., 1-5 minutes). Pulsatile or oscillatory flow regimes can be employed to enhance removal efficiency by preventing re-attachment [20].
- Signal Re-acquisition: Return the flow to the baseline rate and re-measure the biosensor signal. A successful wash is indicated by the signal returning close to the original baseline.
- Specific Assay: Introduce the target analyte to perform the specific biosensing assay. The reduced NSA background should lead to a clearer, more specific signal.
The experimental workflow for this protocol, from system preparation to final analysis, is summarized below.
Advanced Integration: Combining Active Removal with Passive Prevention
For maximum NSA suppression, hydrodynamic removal can be synergistically combined with passive antifouling surface chemistries. The passive layer provides a first line of defense by reducing the initial adsorption rate, while the active hydrodynamic wash periodically cleans the surface, restoring its functionality for long-term or continuous monitoring applications [2] [10].
Promising passive coatings include:
- Zwitterionic polymers (e.g., poly(sulfobetaine methacrylate)): Form a hydration layer via electrostatic interactions, creating a physical and energy barrier to protein adsorption [10].
- PEG-based coatings: Poly(ethylene glycol) chains create a steric and thermodynamic barrier to foulant approach.
- Cross-linked protein films (e.g., BSA): Inert proteins can block active adsorption sites on the sensor surface [2].
Troubleshooting and Best Practices
- Insufficient NSA Removal: Increase the shear stress by raising the flow rate (( Q )) or consider using a buffer with a mild surfactant. Ensure channel dimensions are accurately measured for correct ( \tau_w ) calculation.
- Damage to Bioreceptor Layer: If the specific signal degrades after washing, the applied shear stress is too high. Reduce the flow rate and re-optimize the protocol.
- Bubble Formation: Degas all buffers before use and ensure all fluidic connections are secure. Bubbles can create unpredictable flow patterns and damage surfaces.
- Quantifying Efficacy: Always use non-imprinted polymers (NIPs) or control sensors without specific receptors to quantify the level of NSA and the efficiency of its removal, as detailed in studies on molecularly imprinted polymers [11].
Non-specific adsorption (NSA), commonly referred to as biofouling, remains a significant barrier to the reliability and long-term stability of biosensors, particularly in complex analytical matrices such as blood, serum, and milk [1] [2]. NSA occurs when non-target molecules physisorb onto the biosensing interface through hydrophobic forces, ionic interactions, van der Waals forces, and hydrogen bonding [1]. This phenomenon leads to elevated background signals, false positives, reduced sensitivity and selectivity, and compromised signal accuracy, ultimately affecting the biosensor's dynamic range and limit of detection [1] [2].
Traditional approaches to mitigating NSA have primarily relied on passive methods, which involve coating surfaces with antifouling materials such as blocker proteins (e.g., BSA), hydrophilic polymers, or self-assembled monolayers to create a physical barrier against non-target molecules [1] [2]. However, these static coatings often face challenges related to long-term stability, limited effectiveness in highly complex samples, and potential reduction of bioreceptor accessibility [1].
A paradigm shift is underway with the development of integrated systems that combine real-time sensing with active removal methods. These systems dynamically remove adsorbed foulants during or between measurement cycles, offering a more robust solution for continuous monitoring applications such as intravascular biosensing, point-of-care diagnostics, and in-line food safety monitoring [21] [1] [22]. This protocol outlines the methodology for developing and characterizing such integrated systems, with a focus on combining electrochemical sensing with active NSA removal mechanisms.
Key Research Reagent Solutions
Table 1: Essential reagents and materials for integrated active removal biosensing systems.
| Reagent/Material | Function/Application | Key Characteristics |
|---|---|---|
| Cetyl Trimethyl Ammonium Bromide (CTAB) | Cationic surfactant for electrostatic modification of surfaces to reduce NSA [11]. | Positively charged head group; effective for modifying negatively charged polymer surfaces. |
| Sodium Dodecyl Sulfate (SDS) | Anionic surfactant for electrostatic modification of surfaces to reduce NSA [11]. | Negatively charged head group; effective for modifying positively charged polymer surfaces. |
| Polydopamine | Versatile, biocompatible coating material that mimics mussel adhesion proteins [23]. | Simple preparation via oxidative polymerization; high adhesion to various surfaces. |
| Gold-Silver Nanostars | Plasmonic nanoparticles for enhanced signal transduction in optical biosensors like SERS [23]. | Sharp-tipped morphology provides intense plasmonic enhancement. |
| Molecularly Imprinted Polymers (MIPs) | Synthetic bioreceptors with tailor-made cavities for specific target recognition [11]. | "Plastic antibodies"; high stability and selectivity for target analytes. |
| Methylene Blue (MB) | Redox probe and Raman reporter molecule for electrochemical and SERS-based detection [23]. | Provides quantifiable electrochemical and optical signals. |
| Anti-α-fetoprotein Antibodies | Biorecognition elements for cancer biomarker detection in immunoassays [23]. | High specificity and affinity for target antigens. |
Quantitative Comparison of Biosensor Performance and NSA Impact
Table 2: Performance metrics of different biosensor types, highlighting NSA-related challenges and improvements from active methods.
| Biosensor Type | Primary Applications | Key Advantages | Key Disadvantages / NSA Impact | Reported Improvement with Active Removal |
|---|---|---|---|---|
| Electrochemical | Glucose monitoring, Blood pressure [21]. | High sensitivity, broad applicability [21]. | Sensitivity to chemical interferences; Signal drift from fouling [21] [2]. | Extended functional lifetime in implants beyond 3 weeks with smart coatings [24]. |
| Surface Plasmon Resonance (SPR) | Oxygen saturation, Biomarker detection [21]. | Safety, non-invasiveness [21]. | Limited long-term durability; NSA indistinguishable from specific signal [21] [2]. | Phasesensitivity up to 3.1x10⁵ deg/RIU in liquid sensing with graphene-coupled Otto configuration [23]. |
| Bio-Layer Interferometry (BLI) | Antibody-antigen binding kinetics [25]. | High throughput and flexibility [25]. | Compromises in data accuracy and reproducibility vs. SPR [25]. | Not explicitly stated in sources. |
| Acoustic (SAW, QCM) | Virus identification, small molecule sensing [21]. | Label-free, real-time, high sensitivity [21]. | Sensitive to environmental conditions and mechanical vibrations [21]. | Not explicitly stated in sources. |
| SERS-based Immunoassay | Cancer biomarker detection (e.g., α-fetoprotein) [23]. | Powerful signal enhancement from nanostars. | Low sensitivity and dependence on Raman reporters without optimization [23]. | LOD of 16.73 ng/mL for AFP achieved using optimized Au-Ag nanostars platform [23]. |
Experimental Protocols
Protocol 1: Fabrication of an Electrochemical-SPR (EC-SPR) Biosensor with Integrated Active Removal
This protocol describes the creation of a hybrid platform that enables simultaneous electrochemical readout and optical monitoring via Surface Plasmon Resonance, suitable for real-time assessment of NSA and active removal efficacy [2].
Materials:
- SPR instrument with integrated flow cell and electrochemical capabilities.
- Gold sensor chip.
- EC-SPR compatible antifouling coating (e.g., cross-linked protein film, specific peptide sequence).
- Bioreceptor (e.g., antibody, aptamer).
- Phosphate Buffered Saline (PBS), pH 7.4.
- Surfactant solutions (e.g., 0.1% SDS, 0.1% CTAB).
- Peristaltic or syringe pump for controlled flow.
Procedure:
- Sensor Chip Pretreatment: Clean the gold sensor chip with a series of solvents (e.g., ethanol, acetone) and oxygen plasma treatment to ensure a pristine surface.
- Antifouling Coating Application: Immobilize the selected antifouling layer onto the gold surface. For a peptide-based layer, this may involve chemisorption of thiolated peptides overnight in a humid chamber.
- Bioreceptor Immobilization: Functionalize the antifouling surface with the bioreceptor using appropriate chemistry (e.g., EDC/NHS coupling for antibodies).
- EC-SPR System Calibration: Mount the functionalized chip in the EC-SPR instrument. Calibrate both the electrochemical (e.g., via cyclic voltammetry in a standard redox solution) and SPR (angle shift) responses.
- Real-Time NSA Monitoring and Active Removal: a. Baseline Acquisition: Flow PBS buffer at a constant rate (e.g., 50 µL/min) to establish a stable baseline for both EC and SPR signals. b. Fouling Phase: Introduce a complex sample (e.g., 10% serum in PBS) over the sensor surface for a set duration (e.g., 15 minutes), while monitoring the increase in SPR signal (indicative of total adsorption) and any change in electrochemical impedance or current (indicative of surface passivation). c. Active Removal Phase: Switch the flow to an active removal agent. This could be: - Hydrodynamic Shearing: A buffer solution at a high flow rate (e.g., 500 µL/min) to generate high shear forces. - Chemical Elution: A surfactant solution (e.g., 0.1% SDS) for 2-3 minutes. - Electromechanical Agitation: If the chip is capable, apply a low-frequency potential oscillation. d. Regeneration and Assessment: Return to baseline buffer flow. The recovery of the SPR signal and electrochemical performance towards a standard analyte solution is used to quantify the effectiveness of the active removal process.
- Data Analysis: Correlate the SPR response (total mass change) with the electrochemical signal (interface integrity/functionality) to distinguish between specific binding and NSA.
Protocol 2: Surfactant-Mediated Suppression of NSA in Molecularly Imprinted Polymers (MIPs)
This protocol details a passive/active hybrid strategy to eliminate non-specific binding on synthetic receptors, enhancing selectivity for sensing applications [11].
Materials:
- Synthesized MIP and Non-Imprinted Polymer (NIP) particles.
- Target analyte (e.g., Sulfamethoxazole - SMX).
- Interfering compounds (structurally similar molecules, e.g., other sulfonamides).
- Surfactants: Sodium Dodecyl Sulfate (SDS) and Cetyl Trimethyl Ammonium Bromide (CTAB).
- Appropriate solvent (e.g., methanol, buffer).
Procedure:
- Polymer Modification: a. MIP±-SDS Preparation: Incubate a portion of the MIP particles (specifically, a poly(4-vinylpyridine)-based MIP, which is positively charged) with an aqueous solution of SDS. The anionic SDS will electrostatically bind to external functional groups, blocking non-specific sites. b. MIP±-CTAB Preparation: Incubate another portion of the MIP particles (a polymethacrylic acid-based MIP, which is negatively charged) with an aqueous solution of CTAB. The cationic CTAB will bind to and block external functional groups.
- Binding Isotherm Analysis: a. Prepare a series of solutions with increasing concentrations of the target analyte (SMX). b. Incubate a fixed amount of MIP+SDS, MIP+CTAB, and unmodified NIP with each concentration solution under agitation for a defined period (e.g., 60 min). c. Separate the polymers (e.g., by centrifugation) and analyze the supernatant to determine the concentration of unbound analyte. d. Plot the adsorption capacity (Q) against the equilibrium concentration (Cₑ) to generate binding isotherms.
- Selectivity Evaluation: a. Repeat the binding analysis using solutions of interfering compounds (e.g., sulfadiazine, sulfamerazine). b. Compare the adsorption capacity of the surfactant-modified MIPs for the target versus the interferents. Successful modification is indicated by high adsorption for the target and negligible adsorption for interferents.
- Sensor Integration: The optimized MIP+surfactant material can be integrated into a transducer surface (e.g., electrode, waveguide) to create a selective sensor with minimized NSA.
System Workflow and Signaling Pathways
The following diagram illustrates the logical workflow and decision-making process for implementing an integrated active removal system within a biosensing operation.
Integrated Active Removal Biosensing Workflow
The integration of active removal methodologies with real-time sensing capabilities represents a significant advancement in the development of robust, reliable, and long-lasting biosensors. By dynamically addressing the persistent challenge of non-specific adsorption, these systems enhance data accuracy and enable new applications in continuous monitoring within complex biological environments. The protocols and analyses provided here serve as a foundation for researchers to further innovate in this critical area, paving the way for the next generation of diagnostic and monitoring technologies.
Non-specific adsorption (NSA), often termed biofouling, represents a fundamental barrier to the reliability and accuracy of biosensors, especially when deployed in complex biological matrices such as blood, serum, or milk [2]. In coupled Electrochemical-Surface Plasmon Resonance (EC-SPR) biosensors, NSA is particularly problematic as it simultaneously degrades the performance of both electrochemical and optical transduction mechanisms, leading to signal drift, reduced sensitivity, and false positives [2]. The analytical signal in EC-SPR biosensors is susceptible to interference from fouling in multiple ways: it can cause a drift in the electrochemical signal, alter the local refractive index monitored by SPR without a specific binding event, and sterically hinder the analyte's access to the bioreceptor [2]. Addressing NSA is therefore not merely an optimization step but a critical requirement for developing robust EC-SPR platforms for clinical diagnostics, drug development, and food safety monitoring [2] [26]. This case study examines the mechanisms of NSA and explores both established and emerging strategies to mitigate its effects, with a specific focus on solutions applicable to the unique demands of combined EC-SPR systems.
Mechanisms and Impact of Non-Specific Adsorption
Fundamental Mechanisms of NSA
Non-specific adsorption occurs when molecules other than the target analyte accumulate on the biosensing interface through physisorption, a process driven by a combination of weak intermolecular forces [1]. These include:
- Hydrophobic interactions
- Electrostatic (ionic) interactions
- van der Waals forces
- Hydrogen bonding [2] [1]
In contrast to specific, covalent (chemisorption) binding of the target to a bioreceptor, NSA involves reversible, non-covalent attachment of interfering species such as proteins, lipids, or other biomolecules present in complex samples [1]. The propensity for NSA is influenced by the physicochemical properties of the sensor surface, including its hydrophobicity, charge, and topography, as well as the composition of the sample matrix [2].
Impact on EC-SPR Biosensor Performance
The coupled nature of EC-SPR biosensors means that NSA exerts multifaceted detrimental effects on the analytical signal, compromising key performance metrics.
Table 1: Impact of NSA on EC-SPR Biosensor Components
| Biosensor Component | Impact of NSA | Consequence on Signal |
|---|---|---|
| Electrochemical (EC) | Fouling layer increases electron transfer resistance, passivates the electrode, and can cause signal drift. Degrades coating layer over time [2]. | Reduced current, decreased sensitivity, unstable baseline, false negatives. |
| Surface Plasmon Resonance (SPR) | Non-specifically adsorbed molecules alter the local refractive index at the sensor surface [2]. | Increased background signal, inaccurate quantification of binding kinetics, false positives. |
| Bioreceptor | Adsorbed foulants can restrict conformational changes of structure-switching aptamers or block access to binding sites [2]. | Diminished binding capacity and specificity, reduced sensor response. |
The following workflow illustrates a generalized protocol for evaluating NSA in a biosensor, highlighting steps where mitigation strategies are critical.
Figure 1: Experimental workflow for NSA evaluation in EC-SPR biosensors. The process begins with sensor fabrication and proceeds through functionalization, sample exposure, and simultaneous data monitoring to quantify NSA and evaluate mitigation strategies.
Passive and Active NSA Removal Strategies
Strategies to combat NSA are broadly classified into two categories: passive methods, which aim to prevent adhesion through surface coatings, and active methods, which dynamically remove adsorbed molecules after attachment [1].
Passive Methods: Antifouling Coatings
Passive methods involve modifying the sensor interface with a physical or chemical coating that creates a energy barrier against the adsorption of non-target molecules. The efficacy of these coatings depends on their ability to form a hydrophilic, neutrally charged, and highly hydrated layer that minimizes intermolecular interactions with foulants [1].
Table 2: Passive Antifouling Materials for EC-SPR Biosensors
| Material Class | Specific Examples | Key Properties & Mechanisms | Compatibility with EC-SPR |
|---|---|---|---|
| Polymer Brushes | Poly(ethylene glycol) (PEG), Polyzwitterions (e.g., PMPC, PSBMA) [2] | High hydration capacity, steric repulsion, neutral or zwitterionic charge [1]. | Good; requires optimization of thickness for SPR and conductivity for EC. |
| Proteins & Peptides | Bovine Serum Albumin (BSA), casein, engineered peptides [2] [1] | Physically blocks vacant sites, readily available. | Well-established; may affect electron transfer if layer is too thick. |
| Self-Assembled Monolayers (SAMs) | Alkanethiols with oligo(ethylene glycol) termini on gold [1] | Dense, ordered monolayers that resist protein adsorption. | Excellent for SPR (gold surface); conductive SAMs can support EC. |
| Hybrid & Composite Materials | Cross-linked protein films, hydrogel composites [2] | Tunable conductivity, controllable thickness, high bioreceptor loading. | Highly promising; properties can be tailored for dual EC-SPR detection. |
Active Removal Methods
Active methods employ external energy inputs to generate surface forces that shear away weakly adsorbed biomolecules. These methods are gaining traction for applications requiring long-term monitoring.
- Electromechanical Transducers: Devices like piezoelectric elements or microcantilevers generate surface vibrations or acoustic waves that disrupt the bonds of non-specifically adsorbed molecules, effectively "shaking them loose" from the sensor surface [1].
- Hydrodynamic Methods: These rely on controlled fluid flow within microfluidic channels to create shear forces that overcome the adhesion forces of adsorbed molecules. A key advantage is the potential for integration into lab-on-a-chip systems [1].
- Acoustic Devices: Hypersonic resonators, operating at frequencies in the Gigahertz range, can function as both gravimetric sensors for mass detection and active elements for the removal of NSA, creating a dual-function system [10].
Application Notes: NSA Mitigation Protocol for EC-SPR
This section provides a detailed methodology for implementing and evaluating a zwitterionic polymer-based antifouling coating in an EC-SPR biosensor designed for serum analysis.
Reagent Setup and Materials
Table 3: Research Reagent Solutions for Antifouling EC-SPR
| Reagent/Material | Function/Description | Example Supplier/Specification |
|---|---|---|
| Gold Sensor Chip | SPR-active substrate; electrode foundation. | ~50 nm gold film on glass prism. |
| Sulfobetaine Methacrylate (SBMA) | Zwitterionic monomer for antifouling polymer coating [10]. | High purity (>99%). |
| Potassium Chloride (KCl) | Supporting electrolyte for electrochemical measurements. | Analytical grade, 0.1 M solution in DI water. |
| Fetal Bovine Serum (FBS) | Complex biological matrix for fouling challenge studies. | Commercially available, sterile-filtered. |
| 11-mercaptoundecanoic acid (11-MUA) | Thiol-based linker for covalent surface functionalization. | >95% purity. |
| N-(3-Dimethylaminopropyl)-N'-ethylcarbodiimide (EDC) | Carboxyl group activator for covalent coupling. | Common crosslinker, molecular biology grade. |
| N-Hydroxysuccinimide (NHS) | Stabilizer for EDC-activated carboxyl groups. | Common crosslinker, molecular biology grade. |
| Phosphate Buffered Saline (PBS) | Washing buffer and sample diluent. | 1X, pH 7.4. |
Step-by-Step Coating and Evaluation Protocol
Part A: Surface Coating and Functionalization
- Sensor Chip Pretreatment: Clean the gold sensor chip using a standard piranha solution (3:1 concentrated H₂SO₄:30% H₂O₂) CAUTION: Highly corrosive or via oxygen plasma treatment for 15 minutes. Rinse thoroughly with deionized water and ethanol, then dry under a stream of nitrogen gas.
- Antifouling Coating Application:
- Option 1 (Grafting-to): Incubate the clean gold chip in a 1 mg/mL solution of thiol-terminated poly(sulfobetaine methacrylate) in ethanol for 12 hours at room temperature.
- Option 2 (Surface-Initiated Polymerization): First, form a SAM of a thiol-containing initiator. Then, submerge the chip in a degassed solution of SBMA monomer in a solvent like toluene or a water/ethanol mixture. Perform polymerization under controlled temperature and inert atmosphere [10].
- Washing: After coating, rinse the chip extensively with copious amounts of ethanol and deionized water to remove any physisorbed polymer or monomer, then dry under nitrogen.
Part B: EC-SPR Evaluation of Antifouling Efficacy
- Instrument Calibration: Assemble the flow cell and calibrate the SPR instrument using a standard KCl solution (e.g., 0.1 M). Simultaneously, initialize the potentiostat for electrochemical measurements.
- Baseline Acquisition: Flow PBS buffer at a constant rate (e.g., 20 µL/min) over the coated sensor until stable SPR angle and open-circuit potential (OCP) or electrochemical impedance spectroscopy (EIS) baselines are established.
- Fouling Challenge: Switch the flow to 100% FBS for 30-60 minutes while continuously monitoring both the SPR angle shift (in Resonance Units, RU) and the charge transfer resistance (Rₑₜ) via EIS.
- Washing and Regeneration: Switch back to PBS buffer flow for 15-20 minutes to remove loosely bound material.
- Data Analysis:
- SPR Data: Calculate the total RU shift from the initial PBS baseline to the final PBS baseline after FBS exposure and washing. A lower final RU indicates a better antifouling performance.
- EC Data: Calculate the percentage change in Rₑₜ. A smaller change indicates that the coating successfully prevented electrode passivation.
The logical flow of the experimental setup and data acquisition for this protocol is summarized below.
Figure 2: Logical flow of the EC-SPR evaluation protocol for antifouling coatings. The process involves system calibration, baseline acquisition, a fouling challenge with a complex sample, and subsequent data analysis to quantify NSA.
The field of NSA mitigation is rapidly evolving, moving beyond static coatings. Future research will focus on "smart" responsive materials that can change their properties (e.g., become charged or change conformation) upon an external trigger (like a change in pH or electric field) to actively release adsorbed foulants [2]. Furthermore, the integration of machine learning and molecular simulations is poised to accelerate the discovery and design of next-generation antifouling materials by predicting their interaction with complex samples before experimental validation [2]. For EC-SPR biosensors specifically, the development of universal functionalization strategies that provide a robust antifouling background while allowing for the stable and oriented immobilization of diverse bioreceptors remains a key objective [2].
In conclusion, while NSA presents a significant challenge for EC-SPR biosensors, a comprehensive toolkit of passive and active strategies exists to address it. The choice of strategy must be guided by the specific application, considering the sample matrix, required sensor lifetime, and the unique constraints imposed by the coupled detection system. The continued development of advanced antifouling materials and integrated removal methods will be instrumental in unlocking the full potential of EC-SPR biosensors for real-world analytical applications in medicine and biotechnology.
The accurate detection of analytes in complex biological matrices such as serum, blood, and cell lysates represents a significant challenge in biosensor research and development. These matrices introduce substantial interference through non-specific adsorption (NSA), a phenomenon where proteins, lipids, and other biomolecules adhere to sensing surfaces, compromising analytical performance [1] [2]. NSA leads to elevated background signals, reduced sensitivity, false positives, and diminished sensor reproducibility [1]. This application note details the sources of matrix interference, quantitative performance data of advanced platforms, and standardized protocols for evaluating biosensors, with a specific focus on active removal methods within a thesis investigating NSA mitigation strategies.
Matrix-Induced Challenges and Performance of Advanced Platforms
Complex biological samples present a multifaceted challenge to biosensing. Cell lysates contain a high concentration of intracellular proteins and organelles, while serum and blood are rich in albumin, immunoglobulins, lipids, and other components that readily foul sensor surfaces [27] [2]. The mechanisms of NSA primarily involve physisorption driven by hydrophobic forces, electrostatic interactions, and van der Waals forces [1] [2].
Quantitative Performance in Complex Matrices
The table below summarizes the demonstrated performance of two biosensing platforms when analyzing complex biological matrices.
Table 1: Performance comparison of biosensor platforms in complex matrices
| Biosensor Platform | Demonstrated Matrices | Limit of Detection | Linear Dynamic Range | Key Advantages for Complex Matrices |
|---|---|---|---|---|
| Magnetic Nanosensor (GMR) [28] | Serum (mouse/human), urine, saliva, cell lysates | 50 attomolar (with amplification) | >6 orders of magnitude | Matrix-insensitive detection; unaffected by pH (4-10), temperature, turbidity |
| Surface Initiated Polymerization (SIP) [27] | Human serum, cell lysate | Not specified (showed minimal NSA) | Not specified | Superior antifouling properties; proposed as a universal biosensor platform |
Experimental Protocols
The following protocols provide a standardized methodology for evaluating biosensor performance and NSA in complex matrices, with an emphasis on active removal techniques.
Protocol: Evaluating NSA and Sensor Performance in Spiked Matrices
This protocol is adapted from GMR sensor studies and NSA evaluation workflows [28] [2].
1. Sensor Functionalization:
- Clean the sensor surface (e.g., gold for SPRi, GMR chip) according to manufacturer specifications.
- Immobilize the capture antibody (e.g., anti-CEA for a tumor marker) onto the sensor surface. For GMR sensors, this involves spotting the antibody onto individual sensors within an array [28].
- Block the surface with a blocking agent (e.g., 1% BSA in PBS) for 1 hour to minimize vacant site NSA [1].
- Wash the sensor three times with a suitable buffer (e.g., PBS, pH 7.4).
2. Sample Preparation:
- Prepare the complex matrix (e.g., serum, cell lysate). For cell lysates, use a standard lysis buffer (e.g., RIPA buffer) and clarify by centrifugation [28] [29].
- Spike a known concentration of the target analyte (e.g., CEA, VEGF) into the matrix. Prepare a series of dilutions to establish a calibration curve.
- As a control, prepare the same analyte concentrations in a simple buffer (e.g., PBS).
3. Detection and Signal Acquisition:
- Introduce the sample to the sensor surface under controlled flow or static conditions.
- For sandwich-style assays (e.g., GMR), introduce the magnetic nanoparticle-conjugated detection antibody after the antigen binding step [28].
- Apply an external magnetic field (for GMR) or the appropriate excitation signal for the transducer.
- Record the signal in real-time (e.g., resistance change for GMR, resonance unit shift for SPRi) [28] [27].
- For active removal assessment, apply the chosen shear force (e.g., via fluid flow, electromechanical transducer) after signal stabilization and monitor the signal change.
4. Data Analysis:
- Plot calibration curves for both the buffer and complex matrix.
- Calculate the limit of detection (LOD) and dynamic range for each condition.
- Quantify NSA by comparing the signal from a negative control (matrix without target analyte) to the baseline signal.
- Assess the efficacy of active removal by the percentage of signal loss upon application of shear forces, indicating the removal of weakly adsorbed, non-specific biomolecules [1].
Active Removal Methods Workflow
Active removal methods leverage external energy to generate surface forces that shear away non-specifically adsorbed biomolecules, in contrast to passive blocking coatings [1]. The following diagram illustrates the integration of these methods into a standard biosensing workflow.
The Scientist's Toolkit: Research Reagent Solutions
Table 2: Essential reagents and materials for biosensor research in complex matrices
| Item | Function/Description | Example Application |
|---|---|---|
| Polyethylene Glycol (PEG) [27] | A passive polymer coating that creates a hydrophilic, steric barrier to reduce protein adsorption. | Used as an antifouling layer on SPRi chips to minimize NSA from serum and lysates. |
| Surface Initiated Polymerization (SIP) [27] | An advanced passive coating generating a dense, brush-like polymer layer with superior antifouling properties. | Proposed as a universal biosensor platform for biomarker discovery in high-throughput formats. |
| Bovine Serum Albumin (BSA) [1] | A common blocking protein used to passivate vacant sites on the sensor surface, reducing methodological NSA. | Standard blocking agent (e.g., 1% solution) in assays like ELISA and GMR sensor protocols. |
| Magnetic Nanoparticles [28] | Superparamagnetic tags used for detection in GMR sensors; provide a matrix-insensitive signal transduction mechanism. | Conjugated to detection antibodies in a sandwich assay for attomolar-level protein detection in serum. |
| Cell Lysis Buffer [28] [29] | A buffer (e.g., RIPA) for rupturing cells to release intracellular content, creating a complex matrix for analysis. | Used to prepare samples for biosensing intracellular biomarkers or conducting comparative NSA studies. |
Signaling Mechanism of a Matrix-Insensitive Biosensor
The Giant Magnetoresistive (GMR) sensor is a prime example of a platform that inherently mitigates matrix interference. The following diagram illustrates its signaling mechanism, which is immune to optical and ionic variations in samples.
Optimizing Active NSA Removal: Overcoming Practical Challenges for Robust Performance
Non-specific adsorption (NSA), or biofouling, presents a significant challenge in biosensing, particularly when dealing with complex biological samples such as serum, saliva, or wound exudate [30] [1] [2]. NSA occurs when unwanted biomolecules, such as proteins, lipids, and cells, adhere to the sensing interface, leading to increased background noise, reduced sensitivity, false positives, and overall impaired biosensor performance [1] [2]. While active removal methods that utilize shear forces to counteract fouling offer a dynamic solution, they introduce a critical engineering dilemma: applying sufficient force to remove foulants without compromising the integrity and binding capability of immobilized bioreceptors [1]. This application note details the underlying principles, quantitative parameters, and practical protocols for effectively balancing this trade-off, framed within the broader research on active NSA removal methods for biosensors.
Theoretical Background: Fouling Mechanisms and Removal Forces
Biofouling in biosensors is primarily driven by physisorption, where molecules adhere to surfaces through hydrophobic interactions, ionic interactions, van der Waals forces, and hydrogen bonding [1] [2]. The goal of active removal methods is to generate surface forces that exceed the collective strength of these adhesive interactions.
- Adhesive Forces: The strength of foulant adhesion depends on the surface chemistry of both the foulant and the sensor interface, as well as the composition of the surrounding medium.
Shear Forces: These are the hydrodynamic forces applied parallel to the sensor surface, which act to detach weakly adhered molecules. The shear force (( \tau )) in a flow channel can be described by the following relationship:
( \tau \propto \frac{\Delta P \cdot d_h}{L} )
where ( \Delta P ) is the pressure drop along the channel, ( d_h ) is the hydraulic diameter, and ( L ) is the channel length [31]. This indicates that the shear stress experienced by adsorbed species can be modulated by controlling the flow dynamics.
Active removal strategies can be broadly categorized as follows [1]:
- Fluid-based methods: Rely on pressure-driven flow in microfluidic channels to generate shear.
- Transducer-based methods: Use integrated transducers to generate surface forces.
- Acoustic methods (e.g., surface acoustic waves).
- Electromechanical methods.
A critical challenge is that most bioreceptors, such as antibodies and peptide aptamers, are themselves proteins tethered to the surface. The applied shear forces must be carefully tuned to be strong enough to remove nonspecifically adsorbed foulants but weak enough to avoid denaturing the receptor or rupturing the specific bond with the target analyte [1] [32].
Quantitative Data and Performance Metrics
The table below summarizes key parameters from studies that illustrate the operational range and effectiveness of various fouling control strategies, highlighting the balance between removal and integrity.
Table 1: Performance Metrics of Fouling Control Strategies in Biosensing
| Method / Material | Key Performance Metric | Value / Range | Impact on Bioreceptor/Binding | Ref. |
|---|---|---|---|---|
| General Active Removal | Goal: Shear force to overpower foulant adhesion | Must be tuned for specific interface | High shear can reduce specific capture efficiency between probes and targets | [1] |
| Zwitterionic PEDOT-PC Copolymer | Reduced specific binding of peptide to Calmodulin (CaM) | Binding decreased with increasing antifouling monomer | Quantitative model shows trade-off: fouling reduction directly impacts specific binding signal | [32] |
| Multifunctional Branched Peptide | Detection Limit for RBD protein in saliva | 0.28 pg mL⁻¹ | Integrated antifouling & recognizing sequences enable function in complex media | [33] |
| OxBC/QCS Hydrogel | Detection Limit for involucrin | 0.45 pg mL⁻¹ | Neutral surface charge minimizes nonspecific attraction, preserving specificity | [30] |
| Biofouling Index (Membranes) | Fouling Rate (time to 100% relative pressure drop) | Defined as inverse of time | Provides a quantitative, velocity-independent metric for comparing fouling severity | [31] |
Experimental Protocols
Protocol: Quantifying the Fouling-Binding Trade-off using QCM-D
This protocol uses a Quartz Crystal Microbalance with Dissipation monitoring (QCM-D) to quantitatively evaluate how surface modifications aimed at reducing fouling simultaneously affect the specific binding capacity of bioreceptors [34] [32].
1. Sensor Surface Functionalization:
- Materials: QCM-D gold sensors (e.g., QSX 301), EDOT-MI (maleimide-functionalized monomer), EDOT-PC (phosphorylcholine zwitterionic monomer), peptide aptamer with terminal cysteine group.
- Procedure: a. Clean gold sensors in piranha solution ( Caution: Highly corrosive ), rinse with DI water, and dry. b. Prepare an electropolymerization solution with a varying molar ratio of EDOT-PC to EDOT-MI (e.g., 0:100, 25:75, 50:50, 75:25) while keeping the total monomer concentration constant. c. Using a standard three-electrode system (QCM chip as working electrode), apply a positive constant potential (e.g., +1.1 V vs. Ag/Ag⁺) for 5 seconds to oxidize the monomers, followed by a negative potential (e.g., -0.5 V) for 3 seconds to form the copolymer film on the sensor. d. Immerse the functionalized sensor in a solution of the cysteine-terminated peptide aptamer. The thiol group will covalently bind to the maleimide groups, immobilizing the probe.
2. QCM-D Measurement of Non-Specific Fouling:
- Materials: QCM-D E1 system, PBS buffer, fouling solution (e.g., 10% serum, 1 mg/mL BSA).
- Procedure: a. Place the functionalized sensor in the QCM-D chamber and establish a stable baseline with PBS buffer at a flow rate of 30 µL/min. b. Switch the flow to the fouling solution and monitor the frequency shift (Δf) and dissipation shift (ΔD) in real-time until the signal stabilizes. c. A larger negative frequency shift indicates greater mass adsorption (fouling). Compare the Δf for surfaces with different EDOT-PC ratios.
3. QCM-D Measurement of Specific Binding:
- Materials: Target protein solution (e.g., Calmodulin).
- Procedure: a. After the fouling measurement and a washing step with buffer, introduce a solution of the target protein. b. Monitor the Δf and ΔD associated with the specific binding event. c. The frequency change from the stable baseline to the new plateau after target injection corresponds to the mass of specifically bound target.
4. Data Analysis:
- Plot the mass of non-specifically adsorbed foulants and the mass of specifically bound target against the molar fraction of EDOT-PC in the copolymer.
- The data will typically show that as the antifouling component (EDOT-PC) increases, non-specific fouling decreases, but the specific binding signal may also diminish, visually illustrating the trade-off [32].
Protocol: Evaluating Shear-Based Removal in a Microfluidic Biosensor
This protocol outlines a method to test the efficacy and integrity of a functionalized biosensor under controlled hydrodynamic shear.
1. Biosensor Fabrication:
- Materials: Glassy carbon or gold electrode, PEDOT:PSS conductive polymer, gold nanoparticles (AuNPs), multifunctional branched peptide (e.g., with antifouling, antibacterial, and recognition sequences) [33].
- Procedure: a. Electrodeposit PEDOT:PSS on a polished electrode to create a rough, high-surface-area substrate. b. Electrodeposit AuNPs onto the PEDOT-modified surface. c. Immerse the electrode in a solution of the multifunctional peptide, allowing the thiol group to form a Au-S bond with the nanoparticles, creating the sensing interface.
2. Microfluidic Integration and Testing:
- Materials: Microfluidic flow cell, syringe pump, electrochemical workstation (e.g., for EIS).
- Procedure: a. Integrate the fabricated biosensor into a microfluidic flow cell. b. Under a constant, low flow rate (e.g., 10 µL/min), establish a baseline signal using Electrochemical Impedance Spectroscopy (EIS). c. Introduce a complex sample (e.g., diluted saliva, serum) and monitor the signal drift due to fouling. d. Apply an "active removal" pulse by significantly increasing the flow rate (and thus the wall shear stress) for a short duration (e.g., 1-2 minutes). e. Return to the baseline flow rate and re-measure the EIS signal. A successful protocol will show a return of the signal close to the original baseline, indicating foulant removal without permanent sensor damage. f. To test bioreceptor integrity, repeat the experiment with a sample containing the specific target analyte. Compare the binding signal (e.g., change in charge transfer resistance, Rct) before and after the application of high-shear pulses. A maintained binding affinity confirms bioreceptor integrity.
The Scientist's Toolkit: Essential Research Reagents and Materials
Table 2: Key Research Reagent Solutions for Fouling Mitigation Studies
| Item Name | Function / Application | Key Characteristics | |
|---|---|---|---|
| Zwitterionic Monomers (e.g., EDOT-PC) | Formulate antifouling polymer coatings | Creates a strong hydration layer via electrostatic interactions; enables fine-tuning of surface properties. | [32] |
| Maleimide-Functionalized Monomers (e.g., EDOT-MI) | Immobilize bioreceptor probes | Provides a click-chemistry reaction site for thiol-terminated peptides/aptamers. | [32] |
| Multifunctional Branched Peptides | Create integrated sensing interfaces | Combines antifouling (e.g., EKEKEKEK), antibacterial, and target-recognizing sequences in one molecule. | [33] |
| OxBC/QCS Composite Hydrogel | Substrate for wearable/wound sensors | Provides inherent antifouling and antimicrobial properties; tunable to electrically neutral surface. | [30] |
| QSense QCM-D System | Real-time, label-free analysis of fouling/binding | Monitors frequency (Δf, mass) and dissipation (ΔD, viscoelasticity) shifts to study adsorption dynamics. | [34] [32] |
| PEDOT:PSS Conductive Polymer | Low-impedance electrode coating | Enhances signal transduction; provides a biocompatible substrate for further functionalization. | [33] |
Strategic Workflow and Decision-Making
The following diagram outlines the logical workflow for developing and optimizing a shear-force-based fouling mitigation strategy, incorporating key decision points to balance removal efficacy with bioreceptor integrity.
Diagram: Workflow for developing a fouling mitigation strategy that balances shear force removal with bioreceptor integrity. Key optimization parameters include shear stress magnitude/duration, antifouling coating density, and bioreceptor tether length [1] [32] [33].
Achieving a balance between effective fouling removal and bioreceptor integrity is a multifaceted challenge that requires a synergistic approach. As demonstrated, this involves the rational design of multifunctional surface chemistries [33], the precise quantification of trade-offs using tools like QCM-D [32], and the careful optimization of hydrodynamic or electromechanical parameters [1] [31]. There is no universal solution; the optimal strategy must be tailored to the specific biosensor application, the nature of the sample matrix, and the characteristics of the bioreceptor-target pair. The protocols and frameworks provided here offer a foundation for researchers to systematically navigate this critical balance, thereby advancing the development of robust and reliable biosensors for use in complex real-world environments.
The accuracy of biosensors and diagnostic assays is fundamentally dependent on the specific interaction between the target analyte and its biorecognition element. A pervasive challenge in this field is nonspecific adsorption (NSA) or nonspecific binding (NSB), where interfering substances present in complex sample matrices (such as serum, plasma, or saliva) adhere to the sensor surface [6] [35]. This phenomenon leads to false-positive signals, elevated background noise, and reduced sensitivity, ultimately compromising the reliability of the detection system [6]. While removing these interferents is crucial, traditional methods often risk the concurrent loss of the target analyte, which is particularly detrimental when measuring low-abundance biomarkers.
This Application Note details validated strategies for the selective removal of interferents without significant analyte loss. Framed within a broader thesis on active removal methods in biosensor research, the protocols herein focus on maximizing signal-to-noise ratios by suppressing NSA through innovative surface chemistries and optimized experimental designs. The methods are particularly applicable to the development of electrochemical biosensors, optical immunosensors, and molecularly imprinted polymer (MIP)-based sensors for clinical and pharmaceutical analysis [36] [35] [37].
Background and Key Challenges
Nonspecific adsorption occurs when proteins, lipids, or other biomolecules physisorb to the sensing interface via hydrophobic forces, ionic interactions, or van der Waals forces [6]. In label-free biosensors, it is virtually impossible to distinguish these nonspecific interactions from specific binding without a robust reference system [35]. The consequences include:
- Reduced Sensitivity & Specificity: NSA obscures the specific signal, increasing the limit of detection.
- Poor Reproducibility: Variable fouling of the sensor surface leads to inconsistent results.
- False-Positive Readings: Non-specifically bound molecules generate signals indistinguishable from the target analyte.
Therefore, the core objective is to implement strategies that preferentially remove or block interferents while preserving the integrity and concentration of the analyte.
Core Strategies and Comparative Analysis
Selecting the appropriate strategy depends on the sensor platform, the sample matrix, and the analyte of interest. The two overarching approaches are passive methods (which prevent adsorption by coating the surface) and active methods (which dynamically remove adsorbed molecules post-functionalization) [6]. The following table summarizes the key characteristics of the primary strategies discussed in this note.
Table 1: Core Strategies for Selective Interferent Removal
| Strategy | Mechanism of Action | Best Suited For | Key Advantage | Potential Limitation |
|---|---|---|---|---|
| Optimized Reference Controls [35] | Uses a negative control probe (e.g., isotype antibody) for signal subtraction. | Label-free optical biosensors (e.g., SPR, Photonic Ring Resonators). | Directly compensates for NSB from the sample matrix. | Requires case-by-case optimization of the control probe. |
| Surfactant-Modified MIPs [37] | SDS immobilized in a conductive polymer electrostatically repels interferents. | Electrochemical sensors for small molecules (e.g., tryptophan, tyramine). | Actively reduces NSB on the polymer matrix itself. | May not be suitable for all polymer-analyte combinations. |
| Scan Number Optimization [37] | Controls MIP film thickness and morphology during electrosynthesis to minimize non-specific sites. | Non-conductive polymer-based electrochemical sensors. | Enhances selectivity without additional chemical modifiers. | Limited to electro-polymerized MIPs. |
| Segmented Flow Analysis (SFA) [38] | Uses air bubbles to segment the flow, reducing carryover and cross-contamination in automated systems. | Automated sample pre-treatment and analysis (e.g., nutrient analysis in dirty samples). | Automates complex pre-treatment, including dialysis for interference removal. | Primarily for fluidic systems, not for the sensor surface itself. |
Detailed Experimental Protocols
Protocol 1: Implementation of Optimized Reference Controls for Immunosensors
This protocol is adapted from systematic studies on photonic ring resonator sensors and is ideal for immunoassays in complex media like serum [35].
1. Principle A panel of candidate negative control probes is screened to identify the one that best matches the nonspecific binding profile of the specific capture probe, enabling accurate reference subtraction.
2. Materials
- Bioreceptors: Specific capture antibody (e.g., anti-IL-17A mouse IgG1, anti-CRP mouse IgG2b).
- Candidate Control Probes: Bovine Serum Albumin (BSA), anti-FITC antibody, isotype-matched control antibodies (e.g., mouse IgG1, rat IgG1), cytochrome c.
- Sensor Chips: Functionalized photonic integrated circuits (PICs) or SPR chips.
- Assay Buffers: Phosphate Buffered Saline with Tween-20 (PBS-T), diluted fetal bovine serum (FBS), or other relevant biofluid.
- Microfluidic Packaging: Pressure-sensitive adhesive (PSA), poly(dimethylsiloxane) (PDMS), and chip holder.
3. Workflow
4. Procedure
- Step 1: Sensor Functionalization. Immobilize the specific capture probe (e.g., anti-IL-17A) on one set of sensor spots. On reference spots, immobilize the various candidate control probes at a similar density.
- Step 2: Device Assembly. Assemble the functionalized sensor chip into a microfluidic device using PSA and PDMS gaskets to create defined flow channels [35].
- Step 3: Assay Run. Under continuous flow, introduce the complex sample (e.g., 1% FBS in EGM-2 medium spiked with the target analyte at known concentrations).
- Step 4: Data Collection. Record the binding response (e.g., resonant wavelength shift for PhRRs) for both the capture and all control probes.
- Step 5: Data Analysis. For each control probe, subtract its response from the capture probe's response to calculate the "corrected specific signal."
- Step 6: Control Selection. Evaluate the corrected signals against known analyte concentrations. The optimal control probe yields the best linearity, accuracy, and selectivity. Studies show that while isotype-matching is intuitive, the best control (e.g., BSA for IL-17A vs. rat IgG1 for CRP) must be determined empirically [35].
Protocol 2: Suppressing Non-Specific Adsorption in MIP Sensors
This protocol describes two methods to minimize NSA in molecularly imprinted polymer-based electrochemical sensors for small molecules [37].
1. Principle For conductive polymers, anionic surfactants like SDS are integrated into the polymer network to electrostatically repel interferents. For non-conductive polymers, the thickness and morphology of the MIP film are optimized during electrosynthesis to minimize non-specific binding sites.
2. Materials
- Monomers: Aniline (for conductive PANI), Pyrrole (for conductive PPy), Dopamine (for non-conductive PolyDA), o-Phenylenediamine (for non-conductive Poly(o-PD)).
- Templates: Tryptophan (Trp) or Tyramine (Tyr).
- Chemicals: Sodium Dodecyl Sulfate (SDS), Lithium perchlorate (LiClO₄), supporting electrolytes (e.g., PBS, KCl).
- Equipment: Potentiostat/Galvanostat, standard three-electrode electrochemical cell.
3. Workflow
4. Procedure Part A: For Conductive Polymers (PANI, PPy) with SDS
- Step 1: MIP Electropolymerization. Using cyclic voltammetry (CV), polymerize the monomer (e.g., 0.1 M aniline in 0.5 M H₂SO₄) in the presence of the template molecule (e.g., Trp) on the electrode surface. Perform the same for a non-imprinted polymer (NIP) without the template.
- Step 2: Template Removal. Wash the polymer-coated electrode with a suitable solvent (e.g., HCl/MeOH mixture) to extract the template, creating specific cavities.
- Step 3: SDS Immobilization. Immobilize the anionic surfactant SDS onto the conductive polymer network via electrostatic interactions. This creates a negatively charged layer that repels common interferents.
- Step 4: Performance Validation. Test the SDS-modified MIP sensor in a solution containing the target analyte and structurally similar interferents. Differential Pulse Voltammetry (DPV) should show a significantly higher signal for the analyte on the MIP compared to the NIP and against interferents, confirming reduced NSA [37].
Part B: For Non-Conductive Polymers (PolyDA, Poly(o-PD)) via Scan Optimization
- Step 1: Polymerization Scan Optimization. Perform CV polymerization of the non-conductive monomer (e.g., dopamine in PBS, pH 7) with the template, creating multiple electrodes with varying numbers of deposition scans (e.g., 5, 10, 15 scans).
- Step 2: Template Removal. Remove the template from all electrodes.
- Step 3: Selectivity Assessment. Expose each electrode to a solution of the target analyte. The electrode that yields the highest signal for the target with the lowest response to interferents corresponds to the optimal scan number. This optimizes the polymer thickness to maximize specific cavity availability while minimizing non-specific sites [37].
Table 2: Performance Data for MIP-based Sensors with NSA Reduction Strategies
| Polymer Type | Modification Strategy | Target Analyte | Reported Limit of Detection (LOD) | Key Outcome |
|---|---|---|---|---|
| Polyaniline (PANI) | SDS Immobilization | Tryptophan | 6.7 μM | High selectivity achieved against diverse interferents [37]. |
| Polypyrrole (PPy) | SDS Immobilization | Tyramine | Data not specified | Non-specific adsorption was eliminated [37]. |
| Polydopamine (PolyDA) | Optimization of Scan Number | Tyramine | Data not specified | Selectivity enhanced without polymer modification [37]. |
The Scientist's Toolkit: Essential Research Reagents
Table 3: Key Reagents for Implementing Interferent Removal Strategies
| Item | Function/Application | Example Use Case |
|---|---|---|
| Isotype Control Antibodies | Serves as a reference probe to match the nonspecific binding profile of the capture antibody. | Optimal negative control in immunosensors; must be selected empirically [35]. |
| Bovine Serum Albumin (BSA) | A common blocking agent and candidate reference control protein. | Used as a passive blocker and scored highly as a reference control for IL-17A detection [35]. |
| Sodium Dodecyl Sulfate (SDS) | Anionic surfactant used to modify conductive polymer surfaces. | Electrostatic immobilization in PANI or PPy MIPs to repel negatively charged interferents [37]. |
| Anti-Fluorescein Isothiocyanate (anti-FITC) | A specific antibody against a hapten not typically found in biofluids. | Used as an effective reference control probe due to its lack of interaction with most serum components [35]. |
| Microfluidic Packaging Materials (PSA, PDMS) | Enables the creation of defined flow channels over sensor chips for controlled fluid delivery. | Essential for packaging photonic ring resonator chips for automated, multi-probe analysis [35]. |
Non-specific adsorption (NSA) is a pervasive challenge in biosensing, leading to false-positive signals, reduced sensitivity, and compromised selectivity and reproducibility [1] [2]. Active removal methods represent a dynamic approach to combat NSA by generating surface forces to shear away weakly adhered biomolecules post-functionalization [1]. However, integrating these methods with various signal transduction mechanisms—such as electrochemical (EC), surface plasmon resonance (SPR), and field-effect transistor (FET)-based systems—introduces significant design and operational hurdles. This Application Note details these integration challenges and provides structured protocols and data to guide researchers in developing robust, fouling-resistant biosensors.
Comparative Analysis of Active Removal Methods Across Transduction Mechanisms
The table below summarizes the core principles, integration challenges, and key performance metrics of active removal methods when coupled with major transduction mechanisms.
Table 1: Active Removal Methods and Transduction Mechanism Integration
| Transduction Mechanism | Active Removal Method | Core Principle | Key Integration Challenges | Typical Performance Metrics |
|---|---|---|---|---|
| Electrochemical (EC) | Electromechanical (e.g., shaking) | Physical agitation to generate shear forces [1] | Maintaining integrity of delicate electrode coatings; signal drift from fluid movement [2] | Signal-to-Noise Ratio (S/N) improvement; reduction in baseline drift [2] [39] |
| Surface Plasmon Resonance (SPR) | Hydrodynamic (Flow) | Pressure-driven flow to create shear forces [1] | Compatibility of flow cell design with optical path; potential displacement of specific binding [1] | % Reduction in NSA signal; change in refractive index units (RIU) [2] |
| Field-Effect Transistor (FET) | Acoustic (e.g., SAW) | Surface acoustic waves to remove weakly bound molecules [1] | Interference with electric double layer; potential damage to nanoscale channel materials [39] | Shift in drain-source current (IDS); change in threshold voltage [39] |
| Coupled EC-SPR | Hybrid (e.g., Pulsed Flow) | Combines fluid shear with electrochemical cleaning [2] | Synchronizing EC and optical measurement cycles; finding coatings that suit both conductivity and refractive index requirements [2] | Limit of Detection (LOD) in complex samples; correlation between EC and SPR signals [2] |
Experimental Protocols for NSA Evaluation and Active Removal
A standardized workflow is crucial for fairly evaluating the efficacy of any active removal strategy.
General Workflow for NSA Impact Assessment
The following diagram outlines the core procedural pathway for evaluating non-specific adsorption.
Detailed Protocol: Evaluating Hydrodynamic Removal in Microfluidic EC Biosensors
This protocol is designed to quantify the effectiveness of flow-induced shear in reducing NSA for an electrochemical biosensor, relevant for applications in blood serum analysis [2].
- Objective: To determine the optimal flow rate for minimizing NSA in a microfluidic electrochemical immunosensor without compromising the immobilized bioreceptor layer.
- Materials:
- Microfluidic EC chip with integrated gold working electrode.
- Phosphate Buffered Saline (PBS), pH 7.4.
- Foulant solution: 10% (v/v) Fetal Bovine Serum (FBS) in PBS.
- Anti-fouling coating reagents (e.g., 6-mercapto-1-hexanol).
- Syringe pump with precise flow rate control.
- Potentiostat for electrochemical measurements.
- Procedure:
- Surface Preparation: Functionalize the gold electrode with a mixed self-assembled monolayer of thiolated capture probes and 6-mercapto-1-hexanol to minimize passive NSA [1].
- Baseline Acquisition: Fill the microfluidic channel with PBS at a low stagnation flow rate (e.g., 5 µL/min). Record a stable baseline using electrochemical impedance spectroscopy (EIS) or a continuous amperometric measurement.
- Fouling Phase: Switch the input to the 10% FBS solution. Maintain a low flow rate (5 µL/min) for 30 minutes to allow foulants to adsorb, monitoring the signal change.
- Active Removal Phase: Initiate a high-shear flow by increasing the pump rate to 100 µL/min for 10 minutes.
- Post-Removal Measurement: Return the flow to the baseline rate (5 µL/min) and measure the signal again in PBS.
- Data Analysis: Calculate the percentage signal change between the fouling phase maximum and the post-removal measurement. Compare this to a control experiment without the high-shear step.
- Expected Outcome: A successful active removal step will show a significant signal recovery towards the original baseline, indicating the removal of non-specifically adsorbed proteins.
Detailed Protocol: Acoustic Removal for FET Biosensors
This protocol assesses the use of surface acoustic waves to mitigate NSA in FET biosensors, which are highly sensitive to interfacial charge [39].
- Objective: To investigate the effect of acoustic agitation on the S/N ratio of a FET biosensor measuring a target analyte in a complex matrix.
- Materials:
- Solution-gated FET biosensor with a 2D material channel.
- Signal transduction interface (e.g., polymeric nanofilter) [39].
- Foulant solution: 1 mg/mL BSA in PBS.
- Target analyte solution.
- Piezoelectric acoustic wave generator coupled to the sensor substrate.
- Source-meter unit for IDS measurement.
- Procedure:
- Sensor Setup: Functionalize the FET gate area with a designed polymeric nanofilter to physically exclude large interfering species [39].
- Calibration: Measure the transfer characteristic (IDS vs. VREF) of the FET in a clean buffer.
- NSA Challenge: Introduce the BSA foulant solution over the sensor gate for 20 minutes without acoustic agitation. Monitor the drift in IDS at a fixed VREF.
- Active Removal: Activate the piezoelectric generator at a predetermined frequency and power setting for 2 minutes while the foulant solution is still flowing.
- Sensitivity Test: After acoustic treatment, introduce the target analyte and measure the sensor's response. Conduct a control experiment identically but without the acoustic removal step.
- Data Analysis: Calculate the S/N ratio with and without acoustic removal. The noise is defined as the signal drift from the BSA exposure, and the signal is the response to the target analyte.
- Expected Outcome: Effective acoustic removal should lower the noise (drift) and result in a higher S/N ratio, confirming cleaner analyte detection.
The Scientist's Toolkit: Key Research Reagent Solutions
Table 2: Essential Materials for Active NSA Removal Research
| Item Name | Function/Description | Application Example |
|---|---|---|
| Surfactants (SDS, CTAB) | Electrostatic modifiers that react with external functional groups on polymers to block NSA sites [11]. | Eliminating NSA in Molecularly Imprinted Polymers (MIPs) for optical or electrochemical sensing [11]. |
| Biomolecular Motors (Kinesin, Myosin) | Utilize mechanical motion at the molecular scale for transport and precision in detection systems [40]. | Powering the active transport of target analytes in microfluidic channels to improve specificity and reduce background [40]. |
| Polymeric Nanofilters | Physically structured interfaces that selectively filter small target biomarkers while blocking larger interferents [39]. | Increasing S/N in FET biosensors by preventing fouling species from reaching the transducer surface [39]. |
| Cross-linked Protein Films | Stable, passive antifouling coatings that provide a biocompatible, non-adsorptive background [2]. | Used as a baseline coating in EC or SPR sensors, upon which active removal methods can be further applied [2]. |
| Functional Monomers (e.g., MAA, 4-VP) | Building blocks for creating Molecularly Imprinted Polymers with specific cavities for target recognition [11]. | Synthesizing MIPs as synthetic antibodies; surfactant modification is then used to suppress their inherent NSA [11]. |
The integration of active removal methods with biosensor transduction platforms is a multifaceted challenge, requiring careful balancing of material properties, interfacial forces, and detection parameters. Success hinges on a methodical, iterative approach involving rigorous testing with complex samples like serum or milk. The protocols and data provided here serve as a foundation for researchers to systematically address these integration hurdles, paving the way for the development of next-generation, robust biosensors for clinical and pharmaceutical applications.
Non-specific adsorption (NSA) represents a fundamental barrier to the reliability and stability of biosensors, particularly when deployed in dynamic, real-world conditions. NSA refers to the accumulation of species other than the target analyte on the biosensing interface, which compromises signal accuracy, reduces sensor sensitivity, and shortens functional lifespan [2]. In complex matrices such as blood, serum, or milk, fouling from proteins, lipids, and other biomolecules can rapidly degrade performance through two primary mechanisms: signal interference from non-specifically adsorbed molecules, and restricted analyte access to biorecognition sites, potentially causing both false positives and false negatives [2]. This application note details targeted methodologies to engineer material interfaces that actively resist NSA, thereby ensuring device stability and data integrity under dynamic operational environments.
Quantitative Analysis of Antifouling Strategies
The efficacy of material-based antifouling strategies can be quantitatively evaluated through key performance metrics. The table below summarizes experimental data from recent studies on modified polymer interfaces.
Table 1: Performance Metrics of NSA-Reducing Material Strategies
| Material Platform | Modification Strategy | Target Analyte | Key Performance Improvement | Reference |
|---|---|---|---|---|
| Conductive Polymer (Polyaniline, PPy) | SDS Surfactant Immobilization | Tryptophan | Detection Limit: 6.7 μM; Sensitivity: 0.015 μA μM−1; High selectivity against interferents [37] | |
| Non-Conductive Polymer (Polydopamine, Poly(o-PD)) | Optimization of Electro-polymerization Scan Number | Tyramine, Tryptophan | Elimination of NSA without polymer modification [37] | |
| Molecularly Imprinted Polymers (MIPs) | Integration of Charged Surfactants (SDS) | Diverse Analytes | Significant reduction of non-specific binding; Enhanced specificity [37] | |
| SWEET1-based Biosensor | Insertion of cpGFP with Optimized Linkers (DGQ, LTR) | Glucose | Functional transport kinetics similar to wild-type; Fluorescence response correlated with binding [41] |
Experimental Protocols for Mitigating Non-Specific Adsorption
Protocol A: Surfactant Functionalization of Conductive Polymers
This protocol details the electrostatic immobilization of sodium dodecyl sulfate (SDS) on conductive polymer-based MIPs to create a protective antifouling layer, effectively shielding non-imprinted functional groups from interferents [37].
Workflow Overview:
Materials & Reagents:
- Working Electrode: Gold, glassy carbon, or ITO
- Monomers: Aniline or Pyrrole (Sigma-Aldrich)
- Cross-linker/Template: Target analyte (e.g., Tryptophan)
- Electrolyte: 0.1 M Lithium perchlorate (LiClO₄) in phosphate buffer (pH 7.0)
- Surfactant: 10 mM Sodium dodecyl sulfate (SDS) aqueous solution
- Solvent for Template Removal: 50:50 (v/v) Methanol:Acetic acid
Step-by-Step Procedure:
- Electrode Pretreatment: Clean the working electrode via potential cycling in 0.5 M H₂SO₄ until a stable cyclic voltammogram (CV) is obtained. Rinse thoroughly with deionized water.
- Molecular Imprinting: Prepare an electropolymerization solution containing 50 mM monomer (aniline or pyrrole) and 5 mM template molecule (e.g., Tryptophan) in 0.1 M LiClO₄ electrolyte.
- Film Deposition: Perform electropolymerization using Cyclic Voltammetry (CV) for 20 cycles between -0.2 V and +1.0 V (vs. Ag/AgCl) at a scan rate of 50 mV/s.
- Template Extraction: Immerse the polymer-coated electrode in a methanol:acetic acid solution under gentle agitation for 30 minutes to remove the template molecules, creating specific recognition cavities. Rinse with buffer.
- SDS Immobilization: Incubate the electrode in a 10 mM SDS solution for 2 hours at room temperature. The SDS molecules will electrostatically bind to the polymer network, forming a protective layer.
- Validation: Characterize the modified sensor electrochemically (via CV and EIS) and validate its selectivity by challenging it with solutions containing potential interferents.
Protocol B: Scan Number Optimization for Non-Conductive Polymers
For non-conductive MIPs (e.g., polydopamine, poly(o-phenylenediamine)), NSA can be minimized by systematically optimizing the number of scans during electropolymerization, which controls polymer thickness and morphology without requiring chemical modification [37].
Workflow Overview:
Materials & Reagents:
- Monomer: Dopamine hydrochloride or o-Phenylenediamine (o-PD)
- Electrolyte: 0.1 M Phosphate Buffered Saline (PBS), pH 7.4
- Interferent Solutions: 1 mg/mL BSA, Lysozyme, or complex matrices like diluted serum
Step-by-Step Procedure:
- Polymerization Screening: Prepare a solution of 2 mM dopamine or 5 mM o-PD in PBS. Perform CV electropolymerization on a clean electrode, systematically varying the number of scan cycles (e.g., 5, 10, 15, 20 cycles) while keeping the potential window and scan rate constant.
- Film Characterization: For each resulting polymer film, use Electrochemical Impedance Spectroscopy (EIS) to monitor changes in charge transfer resistance. If available, use Scanning Electron Microscopy (SEM) to correlate scan number with film thickness and porosity.
- NSA Challenge Test: Expose each sensor variant (fabricated with different scan numbers) to a solution of interferents (e.g., 1 mg/mL BSA) for 15 minutes. Measure the non-faradaic signal shift or background current before and after exposure to quantify fouling.
- Optimal Point Identification: Plot the quantified NSA against the number of scan cycles. Identify the optimal scan number that yields the lowest NSA while maintaining a robust electrochemical signal for the target analyte.
- Sensor Production: Fabricate the final biosensors using the optimized scan number for all subsequent electrodes.
The Scientist's Toolkit: Essential Research Reagents
Table 2: Key Reagents for Antifouling Biosensor Development
| Reagent / Material | Function / Application | Key Characteristics & Considerations |
|---|---|---|
| Sodium Dodecyl Sulfate (SDS) | Charged surfactant for modifying conductive polymers to create a protective, anti-fouling layer [37] | Anionic; electrostatically binds to polymer network; reduces NSA by blocking non-imprinted sites. |
| Polydopamine (PolyDA) | Non-conductive polymer for forming thin, controllable MIP films via electropolymerization [37] | Biocompatible; adhesion properties; film thickness and morphology controlled by scan number. |
| Poly(o-Phenylenediamine) (Poly(o-PD)) | Non-conductive polymer used for creating highly selective, non-fouling MIP matrices [37] | Forms dense, compact films; excellent permselectivity; effective barrier against interferents. |
| Circularly Permutated GFP (cpsfGFP) | Fluorescent protein module for constructing transporter-based biosensors (e.g., SweetTrac1) [41] | Conformational change upon analyte binding translates to fluorescence signal; enables in vivo sensing. |
| Polyaniline (PANI) & Polypyrrole (PPy) | Conducting polymers serving as both transduction element and MIP scaffold [37] | High conductivity; ease of electrochemical deposition; compatible with surfactant modification. |
| Linker Peptides (e.g., DGQ, LTR) | Optimized sequences to connect biosensor domains (e.g., in SweetTrac1) for maximal function [41] | Critical for biosensor performance; optimized via library screening (e.g., using FACS). |
Proactively addressing material compatibility and interfacial stability is not merely a preparatory step but a continuous design imperative for biosensors intended for dynamic environments. The protocols outlined herein—surfactant integration and polymerization control—provide a foundational toolkit for creating robust interfaces that actively resist non-specific adsorption. By adopting these material-centric strategies, researchers can significantly enhance the reliability, longevity, and analytical accuracy of biosensing platforms, thereby accelerating their translation from laboratory research to real-world clinical and environmental monitoring applications.
The Role of AI and Machine Learning in Modeling and Optimizing Removal Protocols
Non-specific adsorption (NSA), the undesirable adhesion of non-target molecules to a biosensor's surface, remains a critical barrier to developing reliable, sensitive, and reproducible biosensing technologies. NSA leads to elevated background signals, false positives, reduced sensitivity, and compromised selectivity, ultimately limiting the practical deployment of biosensors in complex matrices like blood, serum, or food samples [6] [2]. Traditional approaches to mitigating NSA have primarily involved passive methods, such as applying antifouling coatings (e.g., polyethylene glycol or zwitterionic polymers) to create a bioinert barrier [6]. However, these static coatings can lack robustness and adaptability in diverse operational environments.
A paradigm shift is underway toward active removal methods, which dynamically dislodge adsorbed molecules post-functionalization by generating surface forces (e.g., via electromechanical, acoustic, or hydrodynamic transducers) to shear away weakly adhered biomolecules [6]. The design and optimization of these protocols are complex, involving multi-objective, multivariate, and highly nonlinear variables. Artificial Intelligence (AI) and Machine Learning (ML) are now revolutionizing this domain by providing data-driven solutions to model interfacial interactions, predict fouling behavior, and systematically optimize removal parameters, thereby accelerating the development of high-performance biosensing systems [5] [42].
AI and ML Methodologies for Removal Optimization
The integration of AI into biosensor development for NSA mitigation leverages several computational techniques to navigate the complex parameter space. The table below summarizes the primary AI methodologies and their specific applications in modeling and optimizing removal protocols.
Table 1: Key AI/ML Methodologies in Optimizing NSA Removal Protocols
| AI Methodology | Sub-categories & Algorithms | Primary Function in NSA Removal | Key Advantage |
|---|---|---|---|
| Supervised Learning [42] | Support Vector Machines (SVM), Random Forests (RF), Artificial Neural Networks (ANN) | Predicting optimal removal parameters (e.g., shear force, frequency); Classifying sensor performance post-removal. | High computational efficiency for established datasets with clear input-output relationships. |
| Unsupervised Learning [42] | (Algorithms not specified in search results) | Identifying hidden patterns or clusters in fouling data without pre-labeled outcomes. | Useful for exploratory data analysis when the relationship between variables is unknown. |
| Deep Learning (DL) [5] [42] | Graph Neural Networks (GNNs), Convolutional Neural Networks (CNNs) | Analyzing complex, high-dimensional data from imaging (e.g., SEM) or spectral analysis to quantify fouling. | Superior capability for nonlinear feature extraction and pattern recognition in complex data. |
| Optimization Algorithms [42] | Genetic Algorithms | Performing global, multi-objective optimization of removal protocols (e.g., simultaneously maximizing sensitivity and stability). | Avoids convergence to local minima, exploring a wider parameter space effectively. |
These AI tools enable a shift from empirical, trial-and-error approaches to a predictive science. For instance, ML models can analyze the relationships between surface properties (hydrophobicity, charge) and sensor performance metrics (limit of detection, signal-to-noise ratio) to recommend ideal surface functionalizations that minimize initial fouling [5]. Furthermore, AI-guided molecular dynamics simulations provide atomic-level insights into bioreceptor-substrate interactions, informing the design of surfaces and removal strategies that maximize specific binding while minimizing NSA [5].
Application Notes and Experimental Protocols
This section provides a detailed framework for employing AI and ML in the development and optimization of active NSA removal protocols, with a specific example focusing on an acoustic wave-based removal system.
General Workflow for AI-Enhanced Protocol Development
The following diagram illustrates the iterative cycle of data collection, model training, and experimental validation that underpins the AI-driven optimization process.
Detailed Protocol: AI-Optimized Acoustic Removal of NSA
Aim: To experimentally determine the optimal parameters for an acoustic wave-based active removal system to minimize NSA on a biosensor surface, using an ML-guided design of experiments (DoE).
Background: Acoustic methods (e.g., surface acoustic waves) generate surface shear forces that can dislodge non-specifically bound molecules. The efficacy depends on multiple interacting parameters [6].
Materials:
- Biosensor chips (e.g., gold SPR chip or electrochemical electrode)
- Acoustic transducer (e.g., piezoelectric actuator)
- Function generator and amplifier
- Microfluidic flow cell and tubing
- Peristaltic or syringe pump
- Buffer solutions (e.g., PBS)
- Foulant solution (e.g., 10% fetal bovine serum or 1 mg/mL BSA in PBS)
- Specific analyte of interest (for selectivity verification)
- Data acquisition system (e.g., SPR imager, potentiostat)
Methodology:
Initial Dataset Generation:
- Design a limited initial set of experiments varying key parameters: Acoustic Frequency (Hz), Acoustic Power/Amplitude (V), Exposure Duration (s), and Flow Rate (µL/min).
- For each combination, run the fouling and removal experiment. Prime the sensor and microfluidic system with buffer. Establish a stable baseline. Introduce the foulant solution for a fixed period to allow fouling. Switch to buffer and activate the acoustic transducer with the specified parameters. Record the signal before and after removal.
- The response variable is the % NSA Reduction, calculated as:
(Signal_after_fouling - Signal_after_removal) / (Signal_after_fouling - Baseline) * 100.
Feature Engineering and Model Training:
- Use the collected data to train a machine learning model, such as a Random Forest regressor or a Neural Network, to predict the
% NSA Reductionbased on the input parameters. - Include engineered features like interaction terms (e.g., Frequency * Power) to capture nonlinear effects.
- Use the collected data to train a machine learning model, such as a Random Forest regressor or a Neural Network, to predict the
AI-Driven Parameter Optimization:
- Employ an optimization algorithm (e.g., a Genetic Algorithm) in conjunction with the trained ML model.
- The algorithm will propose new parameter sets predicted to maximize
% NSA Reductionacross the parameter space, moving beyond the initial experimental grid.
Iterative Validation and Model Refinement:
- Perform new experiments using the AI-proposed parameter sets.
- Add the new experimental results to the training dataset.
- Retrain the ML model with the expanded dataset to improve its predictive accuracy for subsequent optimization rounds. This closed-loop process continues until performance targets are met.
Expected Outcomes: The AI-guided approach is expected to identify a high-efficiency parameter set that would be non-intuitive or time-consuming to discover through classic one-factor-at-a-time experimentation. The final protocol should achieve >90% reduction in NSA while preserving the integrity and specific binding capability of the immobilized bioreceptors.
Validation and Analysis Protocol
Aim: To validate the efficacy of the optimized removal protocol and ensure it does not compromise biosensor function.
Specificity Verification:
- Functionalize the biosensor with its specific bioreceptor (e.g., antibody, aptamer).
- Expose the sensor to a solution containing both the specific target analyte and high concentrations of potential interferents (e.g., serum proteins).
- Apply the optimized removal protocol. The signal from the specific analyte should remain stable, while the non-specific background is significantly reduced.
Sensor Regeneration and Reusability Test:
- Perform multiple cycles of specific analyte binding, regeneration (if applicable), and NSA removal.
- Use the AI model to monitor signal drift and performance degradation over time, providing data for predicting sensor lifespan.
The Scientist's Toolkit: Research Reagent Solutions
The following table catalogues essential materials and computational tools for implementing the AI-enhanced protocols described above.
Table 2: Essential Research Reagents and Tools for AI-Optimized NSA Removal
| Category / Item | Specific Examples | Function & Rationale |
|---|---|---|
| Surface Modification | Polyethylene glycol (PEG), Zwitterionic polymers, Self-assembled monolayers (SAMs) | Passive antifouling underlayer to reduce initial NSA, providing a baseline for active removal enhancement [5] [6]. |
| Bioreceptors | Antibodies, Aptamers, Enzymes | Biological recognition elements for specific analyte capture; their stability under removal forces must be validated. |
| Foulant Solutions | Fetal Bovine Serum, Bovine Serum Albumin (BSA), Lysozyme | Complex or model protein solutions used to simulate biofouling in realistic conditions during testing [2]. |
| Active Removal Transducer | Piezoelectric actuator, Ultrasonic transducer | The core hardware that generates mechanical (e.g., acoustic) energy to create surface shear forces for NSA removal [6]. |
| Data Acquisition System | Surface Plasmon Resonance (SPR) imager, Potentiostat, Quartz Crystal Microbalance (QCM) | Instruments to quantitatively monitor NSA and its removal in real-time by measuring mass or refractive index changes. |
| Machine Learning Software | Python (scikit-learn, TensorFlow, PyTorch), MATLAB | Programming environments and libraries for building, training, and deploying ML models for prediction and optimization. |
| Optimization Algorithms | Genetic Algorithm, Bayesian Optimization | Computational tools that efficiently navigate multi-parameter spaces to find the global optimum for removal protocols. |
The integration of AI and ML into the modeling and optimization of active removal protocols represents a transformative advancement in the battle against non-specific adsorption in biosensors. This synergy moves the field from a reliance on intuition and incremental experimentation to a powerful, data-driven paradigm. By leveraging algorithms to predict optimal removal conditions, analyze complex interfacial data, and autonomously refine experimental parameters, researchers can develop robust, sensitive, and reliable biosensors capable of operating in complex real-world samples. This approach not only accelerates R&D cycles but also unlocks new levels of performance, paving the way for the next generation of diagnostic and monitoring technologies.
Evaluating Efficacy: Validation Frameworks and Comparative Analysis of NSA Removal Strategies
Non-specific adsorption (NSA) is a fundamental challenge in biosensing, leading to elevated background signals, false positives, and reduced analytical accuracy [2] [1]. This application note provides a standardized framework for quantitatively evaluating the efficiency of NSA reduction strategies and their corresponding impact on signal-to-noise ratio (SNR), with a specific focus on methodologies applicable to the development of active removal techniques. Establishing robust, quantitative metrics is essential for researchers to systematically compare antifouling materials and engineering approaches, thereby accelerating the development of reliable biosensors for complex clinical and environmental samples [43].
Quantitative Metrics for NSA and SNR Assessment
Precise quantification is critical for evaluating biosensor surface performance. The metrics in Table 1 provide standardized parameters for comparing antifouling strategies. Limit of Detection (LOD) and Signal-to-Noise Ratio (SNR) are paramount, as they directly measure a sensor's practical usability and sensitivity [3] [12]. Reproducibility, measured by Coefficient of Variation (CV), ensures reliability across multiple sensor batches and uses [44].
Table 1: Key Quantitative Metrics for Evaluating NSA and Biosensor Performance
| Metric | Formula/Description | Significance in NSA Assessment |
|---|---|---|
| Non-Specific Adsorption (NSA) | Mass or thickness of adsorbed non-target molecules; measured by SPR (RU), QCM (Hz), or fluorescence (Intensity) [2] | Directly quantifies the extent of biofouling on the sensing interface. |
| Signal-to-Noise Ratio (SNR) | ( SNR = \frac{S{signal}}{S{noise}} ) where ( S_{noise} ) is the signal from NSA [45] [12] | Measures the ability to distinguish the specific analyte signal from the non-specific background. |
| Limit of Detection (LOD) | Lowest analyte concentration that yields a signal statistically higher than the noise (e.g., ( LOD = \frac{3 \times \sigma_{blank}}{slope} )) [3] [4] | Determines the ultimate sensitivity of the biosensor, which is heavily influenced by NSA levels. |
| Dynamic Range | Concentration range over which the sensor response is linear and quantifiable [46] | NSA can compress the usable dynamic range, particularly at the lower end. |
| Reproducibility | Coefficient of Variation (CV) across multiple sensors or measurements [44] | Indicates the reliability and robustness of the antifouling surface modification. |
Beyond these core metrics, the Selectivity Factor (SF) is crucial for assessing a sensor's performance in complex matrices. It is calculated by measuring the sensor's response to the target analyte and comparing it to the response from high-concentration interfering agents, providing a quantitative measure of specificity [2] [1].
Experimental Protocols for Quantitative NSA and SNR Evaluation
Protocol 1: SPR-Based Quantification of NSA and Antifouling Efficacy
This protocol is ideal for real-time, label-free quantification of molecular adsorption on flat sensor surfaces [2] [43].
- Surface Preparation: Functionalize the SPR sensor chip with the candidate antifouling coating (e.g., zwitterionic peptide, PEG) alongside a control surface.
- Baseline Establishment: Flow a running buffer (e.g., PBS) over both surfaces until a stable baseline is achieved.
- NSA Challenge:
- Expose the sensor to a complex biological fluid (e.g., 100% serum, 1 mg/mL BSA in PBS, or GI fluid [4]) for 10-15 minutes.
- Monitor the resonance unit (RU) shift in real-time. This increase corresponds to the total adsorption.
- Wash Step: Switch back to the running buffer. The remaining RU shift after stabilization indicates irreversible NSA.
- Data Analysis:
- Calculate the percentage reduction in irreversible NSA for the test surface compared to the control:
% NSA Reduction = [(NSA_control - NSA_test) / NSA_control] * 100. - The maximum RU shift during the challenge can be used to estimate the surface mass density of foulants.
- Calculate the percentage reduction in irreversible NSA for the test surface compared to the control:
Protocol 2: Fluorescence-Based SNR and LOD Validation in Complex Media
This protocol uses fluorescence readout, common in microarray and quantum dot-based biosensors, to validate SNR improvement [3].
- Substrate Functionalization: Prepare biochips (e.g., glass slides) with the antifouling coating and immobilize the specific capture probe (e.g., antibody, aptamer).
- Blocking: Apply a blocking agent (e.g., casein, BSA) to the control surface. The test surface with the antifouling coating may omit this step.
- Specific Binding Measurement:
- Incubate the biochips with a series of target analyte concentrations in a complex matrix (e.g., serum, milk).
- Use a fluorescently labeled detection antibody or a quantum dot (QD)-probe.
- Measure the fluorescence intensity (( F_{signal} )) at each concentration.
- Noise Measurement:
- In a separate but identical experiment, incubate the biochips with the complex matrix that does not contain the target analyte.
- Measure the fluorescence intensity, which represents the non-specific background (( F_{noise} )).
- Data Analysis:
- Calculate SNR for each analyte concentration: ( SNR = \frac{F{signal}}{F{noise}} ).
- Plot the calibration curve (Signal vs. Log[Analyte]) and determine the LOD using the standard deviation of the blank (no-analyte) samples [3].
The experimental workflow for these protocols, from surface preparation to data analysis, is outlined below.
Case Studies & Performance Benchmarking
The following case studies demonstrate the application of these quantitative metrics and reveal the significant performance gains achievable with advanced antifouling strategies.
Table 2: Benchmarking Antifouling Material Performance Using Quantitative Metrics
| Antifouling Material | Sensor Platform | Key Quantitative Results | Complex Sample |
|---|---|---|---|
| Zwitterionic Peptide (EKEKEKEKEKGGC) [4] | Porous Silicon (PSi) Aptasensor | • >300-fold reduction in QD adsorption vs. bare glass• Order of magnitude improvement in LOD and SNR over PEG• Effective detection in GI fluid | Gastrointestinal (GI) Fluid |
| Negatively Charged Polymer (TSPP/PSS) [3] | Glass-based QD-FLISA Biochip | • 300-400 fold reduction in QD non-specific adsorption• LOD for CRP: 0.69 ng/mL (1.9x more sensitive than PSS-only) | Serum |
| Plasmonic Coffee-Ring Preconcentration [12] | Smartphone-based Optical Biosensor | • LOD for PSA: 3 pg/mL• >2 orders of magnitude higher sensitivity than standard LFIA• Dynamic range >5 orders of magnitude | Human Saliva |
The data in Table 2 show that zwitterionic peptides can outperform traditional PEG coatings, providing a >300-fold reduction in non-specific adsorption and an order of magnitude improvement in LOD and SNR [4]. Furthermore, engineering strategies that incorporate a pre-concentration step, such as the coffee-ring effect, can dramatically enhance sensitivity by more than two orders of magnitude compared to standard assays like LFIA, pushing detection limits into the pg/mL range [12].
The Scientist's Toolkit: Essential Reagents and Materials
Table 3: Key Research Reagent Solutions for NSA Reduction Studies
| Reagent/Material | Function/Description | Example Application |
|---|---|---|
| Zwitterionic Peptides [4] | Short peptide sequences (e.g., EK repeats) that form a strong hydration layer to resist NSA. | High-performance passivation of biosensor surfaces (PSi, gold); provides broad-spectrum protection. |
| Polyethylene Glycol (PEG) [1] [4] | Traditional "gold standard" polymer coating that resists protein adsorption via hydrophilicity and steric repulsion. | Common baseline comparator for new antifouling materials; used in various biosensor functionalization protocols. |
| Bovine Serum Albumin (BSA) / Casein [1] [3] | Blocking agent proteins that passively adsorb to uncovered surface sites to prevent NSA. | Standard blocking step in immunoassays (ELISA, Western Blot, fluorescence assays). |
| Gold Nanoshells (GNShs) [12] | Plasmonic nanoparticles that aggregate in the presence of target biomarkers, generating a visual signal. | Signal generation and amplification in optical and plasmonic biosensors. |
| Complex Biofluids [2] [4] | Clinically relevant samples like serum, plasma, GI fluid, and bacterial lysate used for NSA challenge. | Testing and validating biosensor performance and antifouling efficacy under realistic, fouling conditions. |
Application Note AN-2024-01
Non-specific adsorption (NSA) is a pervasive challenge that compromises the sensitivity, specificity, and reproducibility of biosensors, particularly in complex biological samples like blood, serum, and saliva [1] [2]. For decades, the biosensing community has relied on passive antifouling strategies, with poly(ethylene glycol) (PEG) coatings serving as the historical "gold standard" [4] [47]. However, the limitations of PEG, including oxidative degradation and the elicitation of immune responses, have spurred the development of two prominent alternatives: robust zwitterionic materials and active removal methods [4] [48] [47]. This Application Note provides a structured comparison of these emerging strategies against established PEG benchmarks, offering quantitative performance data and detailed experimental protocols to guide researchers in selecting and implementing the most effective NSA reduction techniques for their biosensing applications.
Performance Benchmarking: A Quantitative Comparison
The following tables summarize key performance metrics of PEG, zwitterionic, and active methods as reported in recent literature, providing a basis for objective comparison.
Table 1: Benchmarking Passive Antifouling Coatings
| Coating Type | Key Material/Formulation | Reported Performance Metrics | Tested Matrix | Key Advantages | Key Limitations |
|---|---|---|---|---|---|
| PEG (Gold Standard) | Polyethylene glycol (~750 Da) [4] | Serves as a benchmark; outperformed by newer zwitterionic peptides [4] | GI fluid, bacterial lysate [4] | Extensive literature, well-understood | Prone to oxidative degradation [4] [47] |
| Zwitterionic Polymer | Sulfobetaine-based copolymer (Zwitter-repel) [49] | ∼67% reduction in protein adsorption vs. bare gold; 5% signal loss in 1% HSA (vs. 83% for bare gold) [49] | Unprocessed plasma, unfiltered 50% saliva [49] | High hydration, oxidative stability, direct electrode attachment [49] | Can suffer from poor mechanical properties in hydrogel form [47] |
| Zwitterionic Peptide | EKEKEKEKEKGGC peptide [4] | >1 order of magnitude improvement in LOD and SNR over PEG [4] | GI fluid, bacterial lysate [4] | Commercial availability, tunable sequences, broad-spectrum against cells [4] | Requires covalent immobilization strategy |
Table 2: Benchmarking Active Removal Methods
| Method Category | Specific Technique | Mechanism of Action | Key Advantages | Key Challenges |
|---|---|---|---|---|
| Electromechanical | Hypersonic Resonator [10] | Generates surface shear forces via high-frequency (2.5 GHz) vibration to shear away adsorbed molecules [10] | Can be integrated with gravimetric sensing; selective removal [10] | Requires complex microfabrication; potential for surface damage |
| Acoustic | Surface Acoustic Waves (SAW) | Creates mechanical waves to disrupt adsorption | Effective for surface cleaning in microfluidics | Integration complexity, power consumption |
| Hydrodynamic | Microfluidic Flow [1] | Utilizes controlled fluid flow to generate shear forces [1] | Simple principle; easily integrated into flow-based biosensors [1] | May be ineffective for strongly adsorbed molecules |
Experimental Protocols
Protocol: Evaluating Antifouling Coatings via Electrochemical Biosensing
This protocol outlines the procedure for creating and testing the "Zwitter-repel" coating, a representative high-performance zwitterionic polymer [49].
- Objective: To fabricate a zwitterionic copolymer-coated gold electrode and evaluate its antifouling performance and signal stability using Cyclic Voltammetry (CV).
- Materials:
- Gold working electrode
- Zwitterionic monomer (e.g., sulfobetaine methacrylate)
- Comonomer with carboxylic, aldehyde, and thiol groups
- Radical initiator (e.g., APS)
- Human Serum Albumin (HSA), radiolabeled or unlabeled
- Human plasma
- Phosphate Buffered Saline (PBS)
- Procedure:
- Polymer Synthesis: Prepare the zwitterionic copolymer via free radical copolymerization of the sulfobetaine monomer and functional comonomers in aqueous solution. Purify the resulting polymer [49].
- Electrode Coating: Immerse the clean gold electrode in a dilute solution of the polymer. The thiol groups in the polymer will spontaneously form a self-assembled monolayer on the gold surface, creating a thin (~16 nm) film. The coating can be applied via dip-coating or drop-casting [49].
- Antifouling Test (Protein Adsorption):
- Incubate the coated electrode and a bare gold control in plasma spiked with radiolabeled HSA for a set period (e.g., 1 hour).
- Thoroughly rinse the electrodes with buffer to remove loosely bound proteins.
- Quantify the amount of adsorbed protein by measuring the radioactivity on the electrode surface. Calculate the percentage reduction in adsorption for the coated electrode relative to the bare gold control [49].
- Signal Stability Test (Cyclic Voltammetry):
- Record CVs for both the coated and bare gold electrodes in a standard redox probe solution (e.g., Ferro/ferricyanide) to establish a baseline.
- Incubate both electrodes in a 1% HSA solution for 1 hour to simulate fouling.
- Rinse the electrodes and record CVs again in the redox probe solution.
- Compare the anodic peak current before and after HSA incubation. A stable coating will show minimal change in current, whereas a fouled surface will show a significant decrease [49].
Protocol: Functionalizing Porous Silicon with Zwitterionic Peptides
This protocol details the covalent immobilization of zwitterionic peptides onto PSi for optical biosensing, as demonstrated by Awawdeh et al. (2025) [4].
- Objective: To passivate a PSi biosensor with a zwitterionic EK peptide to minimize biofouling in complex biofluids.
- Materials:
- Porous silicon (PSi) film (e.g., prepared by electrochemical etching)
- Zwitterionic peptide (e.g., EKEKEKEKEKGGC) with a terminal cysteine
- Silane-based crosslinker (e.g., (3-Maleimidopropoxy)propyl dimethylchlorosilane)
- Anhydrous organic solvent (e.g., toluene)
- PBS buffer (pH 7.4)
- PSi Surface Activation: Hydrate the PSi film in ethanol and then anhydrous toluene. Incubate the PSi in a solution of the silane crosslinker in toluene. The chlorosilane group will react with surface silanols, forming a covalent bond and presenting maleimide groups on the PSi surface. Rinse thoroughly to remove unbound silane [4].
- Peptide Conjugation: Dissolve the zwitterionic peptide in deaerated PBS. The terminal cysteine residue possesses a free thiol group. Incubate the maleimide-functionalized PSi film in the peptide solution. The thiol group will specifically and covalently couple to the maleimide group, immobilizing the peptide in an oriented manner with the antifouling EK sequence facing outward. Rinse with buffer to remove physisorbed peptide [4].
- Validation and Biosensing: Use optical interferometric reflectance or Fourier-transform infrared spectroscopy to confirm successful peptide grafting. To test antifouling performance, incubate the functionalized PSi in complex media like gastrointestinal fluid or serum and monitor the spectral shift compared to a control surface (e.g., PEGylated PSi). A smaller shift indicates superior resistance to non-specific adsorption [4].
Visual Workflow: Selecting an NSA Reduction Strategy
The following diagram illustrates the logical decision-making process for selecting an appropriate NSA reduction strategy based on biosensor design and application requirements.
Diagram 1: A logical workflow for selecting an NSA reduction strategy based on biosensor requirements.
The Scientist's Toolkit: Essential Research Reagents
Table 3: Key Reagents for NSA Reduction Research
| Reagent / Material | Function / Role | Example Application |
|---|---|---|
| Sulfobetaine-based Monomers | Forms zwitterionic polymers with strong hydration via ionic solvation [49] [47]. | Creating thin-film coatings for electrochemical biosensors [49]. |
| EK-repeat Peptides | Zwitterionic peptides (e.g., EKEKEKEKEKGGC) for surface passivation; cysteine anchor enables oriented conjugation [4]. | Functionalizing porous silicon optical biosensors for operation in GI fluid [4]. |
| Silane Crosslinkers | Provides a covalent bridge between inorganic surfaces (e.g., SiO₂, PSi) and biomolecules [4]. | Immobilizing zwitterionic peptides or PEG layers on silicon/glass substrates [4]. |
| Thiol-reactive Crosslinkers | Forms covalent bonds with gold surfaces (via thiol groups) and biomolecules (via amine-reactive groups like NHS ester) [49]. | Attaching functional polymers to gold electrodes in electrochemical platforms [49]. |
| Poly(ethylene glycol) (PEG) | Traditional antifouling polymer; binds water via hydrogen bonding to create a steric barrier [1] [47]. | Used as a benchmark control in comparative studies with new coatings [4]. |
| Bovine Serum Albumin (BSA) | A common blocking agent used to passivate unused surface sites and reduce NSA [1] [3]. | Included in washing or sample buffers to minimize background signal in immunoassays. |
The reliable detection of disease biomarkers directly in complex biological fluids remains a significant challenge in the development of clinical biosensors. A primary obstacle is non-specific adsorption (NSA), or biofouling, where proteins and other biomolecules adhere to the sensor surface, causing false-positive signals, reduced sensitivity, and poor reproducibility [6]. This application note details experimental protocols for validating biosensor performance, with a specific focus on active removal methods for mitigating NSA. We frame these protocols within a broader thesis that moving from passive surface-blocking strategies to active removal methods is key to enabling robust biosensor function in clinically relevant matrices such as whole serum.
Featured Biosensor Platform and Principles of NSA Resistance
This note highlights two biosensor platforms that inherently resist NSA through their fundamental design, making them ideal for deployment in complex biofluids.
Conformational Change-Based Electrochemical DNA (E-DNA) Sensor
This platform detects MicroRNA-29c directly in undiluted human serum [50]. Its sensing mechanism relies on a binding-induced conformational change of a redox-tagged DNA probe immobilized on a gold electrode. Upon hybridization with the target miRNA, the probe's structure changes, moving the redox tag (methylene blue) away from the electrode surface and reducing the electrochemical current [50]. Because the signal is generated by this specific structural rearrangement, the sensor is largely insensitive to nonspecific adsorption, granting it inherent fouling resistance [50].
Arched-Peptide and Phosphorothioate Aptamer-Based Electrochemical Biosensor
This platform was designed for the detection of the SARS-CoV-2 spike RBD protein in human serum [51]. It incorporates two key elements to combat NSA and degradation:
- Arched-Peptide (APEP): A designed zwitterionic peptide that forms a stable arch structure on the electrode surface. It is highly hydrophilic and electrically neutral, creating a strong hydration layer that prevents protein adsorption [51].
- Phosphorothioate Aptamer (PS-Apt): An aptamer where sulfur atoms replace non-bridging oxygen atoms in the phosphate backbone. This modification confers nuclease resistance and enhances binding affinity, ensuring stability in enzyme-rich serum [51].
The following diagram illustrates the signaling principle of the conformational change-based E-DNA sensor, which is central to its fouling resistance.
Experimental Protocols
The following protocols are essential for validating biosensor performance and its resistance to NSA in conditions mimicking clinical workflows.
Protocol 1: Biosensor Fabrication for miRNA Detection in Serum
This protocol outlines the construction of the conformational change-based E-DNA sensor [50].
1. Electrode Preparation:
- Use a 2 mm diameter gold rod electrode as the working electrode.
- Polish the electrode sequentially on microcloth pads using 1 μm, 0.3 μm, and 0.05 μm alumina slurries, for 5 minutes each. Rinse thoroughly with Milli-Q water between each polishing step.
- Electrochemically clean the electrode in a standard three-electrode system to remove any residual polishing material and organic contaminants.
2. Probe Immobilization:
- Prepare a 1 μM solution of the thiolated, methylene blue-tagged DNA capture probe (Sequence: SH-(CH₂)₆-TAACCGATTTCAAATGGTGCTA-MB) in a suitable buffer (e.g., PBS).
- Incubate the cleaned gold electrode with the probe solution for a predetermined time (e.g., 1-4 hours) to allow self-assembled monolayer (SAM) formation via the thiol-gold bond.
- Rinse the electrode with buffer to remove physically adsorbed probes.
3. Backfilling and Conditioning:
- To minimize non-specific adsorption, backfill the remaining electrode surface with a small, hydrophilic thiolated molecule (e.g., 6-mercapto-1-hexanol) by incubating for 30-60 minutes.
- Rinse the electrode and condition it electrochemically in the measurement buffer using multiple cyclic voltammetry (CV) scans until a stable signal is obtained. The sensor is now ready for use.
Protocol 2: Spiked Serum Recovery and Selectivity Assessment
This protocol validates the accuracy and specificity of the biosensor in a complex matrix [50].
1. Sample Preparation:
- Use pooled, filtered human serum. To avoid degradation of RNA targets, ensure samples are handled under RNase-free conditions if necessary.
- Prepare a stock solution of the target analyte (e.g., miRNA-29c) in nuclease-free water.
- Spike the target into the serum at various concentrations across the expected dynamic range (e.g., 0.1 nM, 1 nM, 10 nM, 100 nM). Include a negative control (serum without spike) and a buffer control.
2. Measurement and Quantification:
- Perform electrochemical measurements using Square-Wave Voltammetry (SWV) on the prepared biosensor for each spiked sample and control.
- Record the faradaic current from the methylene blue tag. A decrease in current indicates successful target hybridization.
- Generate a calibration curve by plotting the signal response (e.g., % signal suppression) against the logarithm of the target concentration in buffer. Use this curve to determine the calculated concentration of the target in the spiked serum samples.
3. Data Analysis:
- Recovery Rate Calculation: For each spiking level, calculate the recovery percentage as (Calculated Concentration / Spiked Concentration) × 100%. Excellent recovery rates are typically within 90-110% [50].
- Selectivity Assessment: Challenge the sensor with serum spiked with non-complementary RNA sequences or sequences with 1- or 2-base mismatches. The response to these interferents should be significantly lower than the response to the fully complementary target, demonstrating high specificity.
Table 1: Key Reagents for Biosensor Fabrication and Validation
| Research Reagent | Function/Description | Application/Validation Role |
|---|---|---|
| Thiolated DNA Probe [50] | Capture probe; SH-group for gold surface attachment, MB tag for signal generation. | Core sensing element in E-DNA sensor fabrication. |
| Gold Electrode [50] | 2 mm diameter working electrode; provides surface for SAM formation. | Universal substrate for electrochemical biosensors. |
| Methylene Blue (MB) [50] | Redox reporter; electron transfer efficiency changes with probe conformation. | Signal generation in conformational change-based sensors. |
| Arched-Peptide (APEP) [51] | Antifouling peptide; sequence CPPPPSESKSESKSESKPPPPC. | Creates hydrophilic, neutral surface to resist NSA in serum. |
| Phosphorothioate Aptamer [51] | Nuclease-resistant recognition element; PS-backbone enhances stability. | Provides specific target binding and longevity in biofluids. |
| miRNA-29c / RBD Protein [50] [51] | Target analytes; relevant biomarkers for cancer and infectious disease. | Used in spiked serum recovery experiments for validation. |
Protocol 3: Active NSA Removal and Stability Testing
This protocol evaluates the stability of the biosensor and the effectiveness of its NSA resistance, whether inherent (E-DNA) or material-based (APEP), during extended exposure to serum [51].
1. Long-Term Stability in Serum:
- Incubate the fabricated biosensor in undiluted human serum at 37°C.
- At regular time intervals (e.g., 0 h, 2 h, 6 h, 24 h), remove the sensor, rinse it gently with buffer, and measure its response to a fixed, moderate concentration of the target analyte.
- A stable sensor will maintain >90% of its initial signal response over several hours, indicating resistance to enzymatic degradation and surface fouling.
2. Fouling Resistance Quantification:
- After the stability incubation period, perform a negative control measurement (in serum without target) to assess the level of non-specific signal drift.
- A robust sensor will show minimal change in its baseline (non-target) signal, confirming effective antifouling properties.
The workflow for the comprehensive validation of biosensor performance, integrating the protocols above, is summarized in the following diagram.
Results and Validation Data
Successful validation of a biosensor for clinical workflows yields quantifiable performance metrics, as summarized below.
Table 2: Exemplary Biosensor Performance Metrics in Spiked Serum Validation
| Validation Parameter | Exemplary Data (E-DNA Sensor) [50] | Exemplary Data (APEP-based Sensor) [51] | Interpretation and Clinical Relevance |
|---|---|---|---|
| Dynamic Range | 0.1 nM – 100 nM | 0.01 pg/mL – 1.0 ng/mL | Covers clinically relevant concentrations of biomarkers (e.g., circulating miRNA, viral proteins). |
| Limit of Detection (LOD) | -- | 2.40 fg/mL | Enables detection of trace analyte levels, critical for early-stage disease diagnosis. |
| Recovery Rate in Serum | ±10% of known spike | Accurately detected RBD in real serum samples | Demonstrates high accuracy and minimal matrix effects, ensuring reliable quantification. |
| Selectivity/Specificity | Significantly lower response to non-complementary and 2-base-mismatch sequences | -- | Effectively discriminates the target from closely related interferents, reducing false positives. |
| Stability / Fouling Resistance | Inherently fouling-resistant due to mechanism [50] | Retained functionality after long-term serum exposure [51] | Ensures consistent performance over time, which is vital for reproducible clinical results. |
| Key NSA Resistance Mechanism | Conformational Change-Based Signaling [50] | Material-Based (Arched-Peptide & PS-Aptamer) [51] | Highlights two distinct and effective strategies for combating NSA in complex biofluids. |
Discussion
The data obtained from these protocols confirms that the strategic implementation of active removal methods and inherently fouling-resistant designs is paramount for biosensor functionality in clinical settings. The conformational change-based E-DNA sensor represents a powerful active removal method at the molecular level, as its signal transduction is only triggered by the specific binding event that induces a structural change, making it blind to passively adsorbed molecules [50]. Similarly, the use of engineered materials like arched-peptides represents a proactive passive method that is so effective it precludes the need for subsequent removal, creating a permanent antifouling barrier [51].
Validation using spiked serum samples is non-negotiable. It moves beyond idealized buffer conditions to test the sensor against the true complexity of biological fluids, which contain a multitude of proteins, lipids, and nucleases that can foul surfaces or degrade sensing elements [50] [51]. The excellent recovery rates and selectivity demonstrated by these sensors validate their potential for accurate disease diagnosis, prognostic support, and timely therapeutic monitoring directly at the point-of-care.
Accurately quantifying the limit of detection (LOD) and dynamic range is fundamental to evaluating biosensor performance, particularly when assessing improvements gained from active removal methods for non-specific adsorption (NSA). Non-specific adsorption refers to the undesirable adhesion of non-target molecules to the biosensor surface, which elevates background signals, reduces specificity, and compromises reproducibility [1] [2]. Active removal methods dynamically displace weakly adhered biomolecules post-functionalization using generated surface forces, such as electromechanical or acoustic transducers, offering a complementary approach to passive surface coatings [1].
This protocol provides a standardized framework for characterizing LOD and dynamic range, enabling direct comparison of biosensor performance before and after implementing NSA mitigation strategies. Establishing these analytical parameters is crucial for demonstrating the real-world utility of biosensors in complex clinical, environmental, and food safety applications [52] [53].
Theoretical Foundations
Defining Key Analytical Parameters
- Limit of Detection (LOD): The lowest concentration of an analyte that can be reliably distinguished from a blank sample with a stated confidence level [54]. It is a critical indicator of a biosensor's sensitivity, especially for detecting trace-level biomarkers in early disease diagnosis [52].
- Dynamic Range: The span of analyte concentrations over which the biosensor provides a quantifiable response with acceptable accuracy and precision. This range is typically bounded at the lower end by the LOD and at the upper end by signal saturation [53].
- Limit of Quantification (LOQ): The minimum analyte concentration that can be quantitatively determined with acceptable precision and accuracy, typically set at a signal level higher than the LOD (e.g., 10σ) [54].
The Critical Impact of Non-Specific Adsorption
NSA negatively impacts LOD and dynamic range through several mechanisms, as shown in the diagram below. When NSA occurs, fouling molecules (e.g., proteins from a complex sample) adsorb to the sensing interface. This can directly contribute to the output signal (e.g., in SPR biosensors), making it indistinguishable from the specific analyte signal, or it can sterically hinder the analyte from reaching the bioreceptor, leading to false negatives [2]. The resulting increased background signal and its variability directly elevate the noise floor, which in turn degrades the LOD. Furthermore, by occupying binding sites or causing signal saturation at lower analyte concentrations, NSA can significantly narrow the usable dynamic range [1] [2].
Experimental Protocols
Protocol 1: Determining Limit of Detection (LOD)
This protocol outlines the statistical determination of LOD based on blank sample measurements and calibration curve slope [54].
Materials and Reagents
| Item | Specification | Purpose |
|---|---|---|
| Analyte Standard | High-purity (>95%) | Preparation of calibration solutions. |
| Blank Matrix | Analyte-free (e.g., PBS, buffer) | Serves as the 'blank' and diluent for standards. |
| Biosensor System | Calibrated per manufacturer specs | Signal acquisition. |
| Microfluidic System (Optional) | For controlled sample delivery | Essential for active hydrodynamic removal methods. |
Step-by-Step Procedure
- Blank Measurement: Perform a minimum of ( n_B = 10 ) independent measurements of the blank solution. Ensure the biosensor is thoroughly cleaned between replicates.
- Calibration Curve: Prepare a series of standard solutions with known analyte concentrations spanning the expected low-end detection range. Measure each concentration in replicate (( n \geq 3 )).
- Data Calculation:
- Calculate the mean (( \bar{y}B )) and standard deviation (( sB )) of the blank measurements.
- Perform linear regression on the calibration data (concentration vs. signal) at the low concentration range to determine the slope (( a )), which represents the analytical sensitivity.
- Compute the LOD using the formula: ( LOD = \frac{k \cdot s_B}{a} ) where ( k ) is a numerical factor chosen based on the desired confidence level. A value of ( k=3 ) is commonly used, corresponding to a ~99% confidence level for distinguishing the signal from the blank [54].
Protocol 2: Characterizing Dynamic Range
This protocol describes the process for establishing the biosensor's working dynamic range, from the LOD to the upper limit of quantification (ULOQ).
Materials and Reagents
| Item | Specification | Purpose |
|---|---|---|
| Analyte Standard | High-purity (>95%) | Preparation of a wide concentration range of standards. |
| Assay Buffer | Compatible with biosensor and bioreceptor | To maintain consistent chemical environment. |
Step-by-Step Procedure
- Sample Preparation: Prepare standard solutions with analyte concentrations spanning several orders of magnitude (e.g., from below the expected LOD to a level causing signal saturation).
- Signal Acquisition: Measure each concentration in replicate (( n \geq 3 )) in a randomized order to minimize drift effects.
- Data Analysis:
- Plot the sensor's response (( y )) against the logarithm of the analyte concentration (( \log C )). A sigmoidal curve is typically observed for affinity biosensors [53].
- Identify the linear range, which constitutes the primary dynamic range for quantitative analysis.
- The lower limit of the dynamic range is often defined by the LOD or LOQ.
- The upper limit is defined by the concentration where the signal deviates from linearity (e.g., due to saturation of binding sites). The LOQ can also be defined at the upper end based on a pre-defined precision criterion.
Protocol 3: Quantifying NSA and Efficacy of Active Removal
This protocol provides a method to evaluate the extent of NSA and the effectiveness of active removal techniques.
Materials and Reagents
| Item | Specification | Purpose |
|---|---|---|
| Complex Sample | e.g., 10% serum, undiluted milk, or whole blood | Provides a source of foulant molecules. |
| Active Removal Device | e.g., acoustic wave transducer or integrated microfluidic pump | Generates forces for NSA removal. |
| Non-specific Protein | e.g., BSA, casein (1-5 mg/mL) | Used in positive control tests. |
Step-by-Step Procedure
- Baseline Establishment: In a clean buffer, acquire a stable baseline signal from the functionalized biosensor.
- NSA Challenge: Introduce the complex sample or a solution of non-specific protein to the biosensor surface and monitor the signal change (( \Delta Signal_{NSA} )).
- Active Removal: Activate the removal mechanism (e.g., apply shear flow in a microchannel, trigger an acoustic wave) for a defined period.
- Efficacy Calculation: Measure the signal after the removal step. The percentage reduction in signal due to NSA is calculated as: ( \% NSA Reduction = \frac{\Delta Signal{NSA} - \Delta Signal{After Removal}}{\Delta Signal_{NSA}} \times 100\% )
- Specific Binding Validation: After removal, challenge the biosensor with the target analyte to confirm that specific binding functionality remains intact.
Data Analysis and Interpretation
Standardized Reporting of Analytical Parameters
To ensure reproducibility and meaningful comparison, the following parameters should be reported alongside LOD and dynamic range [52] [54]:
- Calibration Function: The equation and ( R^2 ) value of the fitted curve.
- Measurement Uncertainty: The standard deviation or confidence interval for the LOD and points on the calibration curve.
- Number of Replicates (n): For both blank and standard measurements.
- Sample Matrix: The exact composition of the medium used for measurements.
Illustrative Data: Impact of NSA Reduction on Sensor Performance
The following table summarizes quantitative data demonstrating how active NSA reduction methods can improve key biosensor performance metrics.
Table 1: Quantifying the Impact of NSA Reduction on Biosensor Performance
| Performance Metric | Without NSA Control | With Active NSA Reduction | Improvement Factor | Notes / Method |
|---|---|---|---|---|
| Limit of Detection (LOD) | 100 pM | 16.7 pM | 6x | LOD calculated via 3σ method [54]. |
| Dynamic Range | 3 log | 5 log | 2 log extension | Expansion of the linear working range [53]. |
| Signal-to-Noise Ratio | 10:1 | 50:1 | 5x | Reduction in non-specific background noise [1]. |
| Assay Reproducibility (% RSD) | 15% | 5% | 3x improvement | Inter-assay precision, n=5 [1]. |
The Scientist's Toolkit: Research Reagent Solutions
Table 2: Essential Reagents and Materials for NSA Reduction and Biosensor Characterization
| Item | Function and Rationale |
|---|---|
| Zwitterionic Peptides | Passive antifouling coating; forms a hydrated, neutral layer that resists protein adsorption via strong hydration effect [1] [2]. |
| Polydopamine Coatings | Versatile, biocompatible surface primer; enables facile secondary functionalization with antifouling agents or bioreceptors, mimicking mussel adhesion [23]. |
| Acoustic Wave Transducers | Active removal method; generates surface waves that create shear forces to physically dislodge weakly adsorbed biomolecules [1]. |
| Integrated Microfluidic Pumps | Active removal method; provides controlled hydrodynamic shear forces to wash away non-specifically bound molecules [1] [53]. |
| Serum Albumin (BSA) | Common blocking agent; used as a passive method to occupy vacant surface sites and reduce subsequent NSA, though may not be compatible with all sensors [1]. |
| Nanostructured Materials (e.g., Porous Gold) | Sensor substrate; increases surface area for bioreceptor immobilization, enhancing signal amplitude and potentially improving LOD [23]. |
Non-specific adsorption (NSA) is a fundamental challenge in biosensing, leading to elevated background signals, false positives, and reduced sensor sensitivity, specificity, and reproducibility [1] [6]. Unlike passive methods that aim to prevent NSA through surface coatings, active removal methods dynamically remove adsorbed molecules by generating surface forces to shear away weakly adhered biomolecules [1]. These methods are particularly valuable for biosensors used in complex matrices like blood, serum, or milk, where fouling is inevitable [2]. This application note provides a detailed comparative analysis of three prominent active NSA removal strategies—electromechanical, acoustic, and hydrodynamic methods—framed within the broader research context of enhancing biosensor performance for pharmaceutical and clinical applications.
Methodological Principles & Comparative Performance
The following table summarizes the core principles, key performance metrics, and inherent limitations of each active NSA removal method.
Table 1: Comparative Analysis of Active NSA Removal Methods
| Method | Fundamental Principle | Key Performance Characteristics | Inherent Limitations |
|---|---|---|---|
| Electromechanical | Utilizes transducers to generate localized mechanical vibrations or strains, creating shear forces that displace weakly adsorbed molecules [1] [55]. | - High force responsivity, capable of resolving piconewton-scale forces [55]- Potentially high spatial precision for localized sensing areas- Can be integrated with surface-stress sensing cantilevers [55] | - Signal can be susceptible to parasitic factors (e.g., temperature, fluidic disturbances) [55]- Requires differential measurements for in-situ accuracy, complicating design [55] |
| Acoustic | Employs piezoelectric materials to generate acoustic waves (e.g., surface acoustic waves, bulk acoustic resonators) or localized acoustofluidic effects, leveraging acoustic radiation force and streaming to dislodge and manipulate contaminants [1] [56]. | - Label-free and non-contact operation, preserving biomolecule integrity [56]- Highly controllable particle enrichment and patterning [56]- Compatible with various microfluidic configurations (droplet, closed-chamber, open-chamber) [56] | - Performance can be influenced by particle size, concentration, and driving power [56]- May require precise frequency control for reconfigurable manipulation [56] |
| Hydrodynamic | Relies solely on pressure-driven fluid flow within microfluidic channels to generate controlled shear forces that overpower the adhesive forces of non-specifically adsorbed molecules [1] [6]. | - Simplicity of principle and implementation [1]- Low consumption of costly reagents [6]- Enables multiple sample detection and increased portability [6] | - Can be unstable and difficult to control precisely at microscale [56]- May offer less specific manipulation compared to acoustic or electromechanical methods- Shear force is dependent on channel geometry and flow rate |
The following diagram illustrates the logical decision-making workflow for selecting an appropriate active NSA removal method based on experimental requirements and sample characteristics.
Diagram 1: Method Selection Workflow
Detailed Experimental Protocols
Protocol for Acoustofluidic NSA Reduction Using a Piezoelectric Microdiaphragm Array (PMDA)
This protocol details the procedure for implementing reconfigurable acoustofluidics to reduce NSA and enhance the sensitivity of trace biomarker detection, adapted from research by Wang et al. (2025) [56].
Objective: To utilize a PMDA for on-chip particle enrichment and manipulation, thereby reducing NSA and improving the limit of detection for target biomarkers.
Materials:
- Piezoelectric Microdiaphragm Array (PMDA) Chip: Fabricated using a standard PZT-SOI process, featuring a 3x3 array of circular resonators [56].
- Function Generator: Capable of supplying specific alternating current signals to drive the PMDA.
- Microfluidic Configuration: Choose based on application:
- Microdroplet: Sessile droplet placed directly on the PMDA surface.
- Closed-Chamber: Sealed microchannel bonded to the PMDA chip.
- Open-Chamber/Detachable Chamber: Allows for chip reuse and prevents cross-contamination [56].
- Optical Detection System: Microscope equipped with a 5x objective lens and a cooled CCD camera [56].
- Insulating Layer: Silicon nitride barrier or detachable thin film to isolate the device from liquid [56].
Procedure:
- Chip Preparation: If using a detachable configuration, assemble the single-use microfluidic chamber onto the reusable PMDA chip, ensuring the insulating layer separates the liquid from the device.
- Sample Introduction: Inject the sample mixture (e.g., 100 µl) containing the target analyte and any signal-amplification beads into the liquid cell or place it as a droplet on the PMDA surface [56].
- Frequency-Switched Driving:
- Connect the function generator to the top and bottom electrode driving pads of the PMDA.
- Apply a specific alternating current signal. Multimodal manipulation is achieved by switching the driving frequency:
- Drive at a lower-order resonant frequency (e.g., 239.4 kHz) to generate a single pressure node at the array center, concentrating particles into a central cluster.
- Switch to a higher-order resonant frequency (e.g., 636.5 kHz) to generate multiple local pressure nodes, patterning particles into a grid-like configuration [56].
- Enrichment and Washing: Maintain the acoustic field for a predetermined time (e.g., several minutes) to actively enrich target complexes and simultaneously shear away non-specifically adsorbed molecules from the sensing zone via acoustic streaming and radiation forces.
- Signal Acquisition: Use the optical detection system to record the enriched patterns or perform subsequent fluorescence-based detection of the captured biomarkers.
Notes: The relationship between particle size, concentration, driving power, and aggregation efficiency should be characterized for optimal performance [56].
Protocol for a Differential Electrochemical Strategy to Minimize NSA
This protocol describes a differential measurement strategy to correct for NSA in electrochemical biosensors, based on the work with molecularly imprinted polymer (MIP) sensors [57].
Objective: To significantly enhance the anti-interference ability of electrochemical biosensors by correcting for the signal contribution from non-specific adsorption.
Materials:
- Dual-Sensor Setup: Two working electrodes, each functionalized with a different MIP specific to one of two distinct analytes (e.g., MIP for analyte A and MIP for analyte B) [57].
- Potentiostat: Capable of simultaneous or rapid sequential measurement of both working electrodes.
- Electrochemical Cell: Standard three-electrode setup (Working, Counter, Reference) accommodating the dual sensors.
Procedure:
- Sensor Fabrication: Prepare two MIP-based sensors on the electrode surfaces (e.g., MIP˅AP/Ni₂P/GCE for 4-acetamidophenol and MIP˅SMR/Ni₂P/GCE for sulfamerazine) using the same polymer material (e.g., electropolymerized polypyrrole) [57].
- Simultaneous Measurement: Immerse both sensors in the sample solution and measure the current response of each sensor at its respective optimal potential.
- Differential Signal Processing:
- For determining Analyte A, subtract the current response of the MIP˅B sensor (at the potential for A) from the current response of the MIP˅A sensor (at the potential for A). This corrects for the interference from non-specific adsorption on the MIP˅A sensor.
- Conversely, for determining Analyte B, subtract the current response of the MIP˅A sensor (at the potential for B) from the current response of the MIP˅B sensor (at the potential for B) [57].
- Quantification: Use the differential currents as the quantitative signal indicators for each analyte. This strategy can reduce interference levels from non-specific adsorption by an order of magnitude and suppress baseline drift [57].
The Scientist's Toolkit: Essential Research Reagents & Materials
The following table lists key materials and reagents essential for implementing the active NSA reduction methods discussed.
Table 2: Key Research Reagent Solutions for Active NSA Reduction
| Item Name | Function & Application |
|---|---|
| Piezoelectric Microdiaphragm Array (PMDA) | The core transducer for acoustofluidic methods. Generates reconfigurable acoustic fields for particle enrichment and NSA removal in droplets or microchambers [56]. |
| Lead Zirconate Titanate (PZT) Thin Film | Piezoelectric material with high electromechanical coupling efficiency, used in PMDA and other acoustic devices for effective energy conversion [56]. |
| Molecularly Imprinted Polymer (MIP) | An artificial antibody used as a bioreceptor in electrochemical sensors. Provides complementary recognition cavities for specific analytes, though requires strategies to mitigate its own NSA [57]. |
| Detection Reagent (Bead-Based) | A suspension containing antibody-coated magnetic beads and optical signal beads (e.g., polystyrene beads). Forms a sandwich complex with the target, enabling motion-based detection in force-assisted sensors [58]. |
| Silicon Nitride Barrier Layer | An insulating encapsulation layer for acoustic devices. Isolates the piezoelectric elements from the liquid sample, enabling detachable, reusable chip designs [56]. |
| Nickel Phosphide (Ni₂P) Nanoparticles | A nanomaterial used to modify electrode surfaces in electrochemical sensors. Enhances electrode sensitivity and serves as a substrate for growing MIP membranes [57]. |
The strategic selection of an active NSA reduction method is paramount for developing robust and reliable biosensors. Electromechanical methods offer high force sensitivity but require careful design to mitigate environmental interference. Acoustic methods, particularly those based on advanced PMDAs, provide versatile, non-contact, and reconfigurable manipulation, making them suitable for integrated, high-performance biosensing platforms. Hydrodynamic methods remain a valuable tool for their simplicity and ease of integration into microfluidic systems. The choice of method must be guided by the specific requirements of the assay, including the needed level of control, sample complexity, and the desired integration pathway. The continued innovation in these areas, including the development of reusable components and intelligent, frequency-switched acoustofluidics, promises to further advance the field of biosensing for critical applications in clinical diagnostics and drug development.
Conclusion
Active removal methods represent a transformative approach to combating non-specific adsorption, moving beyond the limitations of static passive coatings. The integration of electromechanical, acoustic, and hydrodynamic techniques offers a dynamic and effective strategy to maintain biosensor integrity in complex samples like serum and blood. Future progress hinges on the clever integration of these active methods with advanced antifouling materials and AI-driven optimization. For biomedical and clinical research, this evolution is pivotal for creating the next wave of reliable, point-of-care diagnostic tools that deliver reproducible, accurate results directly at the patient's bedside, ultimately accelerating drug development and enabling precision medicine.
References
- 1. Non-Specific Adsorption Reduction Methods in Biosensing [https://pmc.ncbi.nlm.nih.gov/articles/PMC6603772/]
- 2. Promising Solutions to Address the Non-Specific ... [https://www.mdpi.com/2227-9040/13/3/92]
- 3. Self-assembly strategy to reduce non-specific adsorption ... [https://www.sciencedirect.com/science/article/abs/pii/S0003267022009382]
- 4. Porous silicon biosensors meet zwitterionic peptides [https://pubs.rsc.org/en/content/articlehtml/2025/nh/d5nh00478k]
- 5. AI-Enhanced Surface Functionalization in Biosensors [https://www.sciencedirect.com/science/article/abs/pii/S0165993625003887]
- 6. - Non Reduction Specific in Biosensing Adsorption Methods [https://www.mdpi.com/1424-8220/19/11/2488]
- 7. Diagnostic Testing Accuracy: Sensitivity, Specificity, Predictive ... [https://www.ncbi.nlm.nih.gov/books/NBK557491/]
- 8. of reducing Methods - non in microfluidic... specific adsorption [https://asu.elsevierpure.com/en/publications/methods-of-reducing-non-specific-adsorption-in-microfluidic-biose]
- 9. [PDF] Methods of reducing non - specific in microfluidic... adsorption [https://www.semanticscholar.org/paper/Methods-of-reducing-non-specific-adsorption-in-Choi-Chae/8acbfa372177c84afa4c27d5376aec8bd91cf7db]
- 10. Non-Specific Adsorption Reduction Methods in Biosensing [https://www.semanticscholar.org/paper/Non-Specific-Adsorption-Reduction-Methods-in-Lichtenberg-Ling/498c19ce009e78ec3a6f75ba09e8b3c7be162139]
- 11. Innovative approaches to suppress non-specific adsorption ... [https://www.sciencedirect.com/science/article/abs/pii/S0956566324000563]
- 12. Plasmonic coffee-ring biosensing for AI-assisted point-of- ... [https://www.nature.com/articles/s41467-025-59868-y]
- 13. Pushbutton-activated microfluidic cell-free biosensor for ... [https://pubs.rsc.org/en/content/articlehtml/2025/lc/d5lc00337g]
- 14. Democratization of Point-of-Care Viral Biosensors [https://pmc.ncbi.nlm.nih.gov/articles/PMC12293509/]
- 15. Biosensors Based on Mechanical and Electrical Detection ... [https://pmc.ncbi.nlm.nih.gov/articles/PMC7584018/]
- 16. Removal of Non-Specifically Bound Proteins Using ... [https://pmc.ncbi.nlm.nih.gov/articles/PMC9185388/]
- 17. Acoustofluidics-enhanced biosensing with simultaneously ... [https://www.nature.com/articles/s41378-024-00731-3]
- 18. Biofouling prevention and control technology for marine ... [https://www.sciencedirect.com/science/article/pii/S0025326X25014006]
- 19. Biosensing solutions for protein measurement in blood ... [https://www.sciencedirect.com/science/article/pii/S0263224125011157]
- 20. Microfluidics for Biomedical Applications (3rd Edition) [https://www.mdpi.com/journal/biosensors/special_issues/KT5XT7JIDN]
- 21. Recent Advances in Micro- and Nano-Enhanced Intravascular ... [https://pmc.ncbi.nlm.nih.gov/articles/PMC12349352/]
- 22. Integration of Artificial Intelligence in Biosensors for Enhanced ... [https://pmc.ncbi.nlm.nih.gov/articles/PMC12564411/]
- 23. Biosensors, Volume 15, Issue 9 (September 2025) [https://www.mdpi.com/2079-6374/15/9]
- 24. Implantable electrochemical biosensors: Challenges, ... [https://www.sciencedirect.com/science/article/pii/S2451910325001048]
- 25. Comparison of biosensor platforms in the evaluation ... [https://www.sciencedirect.com/science/article/pii/S0003269716301592]
- 26. Surface plasmon resonance biosensors and their medical ... [https://www.sciencedirect.com/science/article/pii/S0956566325001824]
- 27. Non-specific adsorption of serum and cell lysate on 3D ... [https://www.sciencedirect.com/science/article/pii/S1878535215002099]
- 28. Matrix-insensitive protein assays push the limits of ... [https://pmc.ncbi.nlm.nih.gov/articles/PMC4165514/]
- 29. Comparative Analyses of Industrial Scale Human Platelet ... [https://pmc.ncbi.nlm.nih.gov/articles/PMC5725250/]
- 30. An antifouling electrochemical biosensor based on ... [https://www.sciencedirect.com/science/article/abs/pii/S0003267024006226]
- 31. Improved quantitative evaluation of the fouling potential in ... [https://www.sciencedirect.com/science/article/abs/pii/S037673882300056X]
- 32. Quantitatively Elucidating the Trade-Off between ... [https://pmc.ncbi.nlm.nih.gov/articles/PMC11636210/]
- 33. A low-fouling electrochemical biosensor based on ... [https://www.sciencedirect.com/science/article/abs/pii/S0925400524000510]
- 34. Mitigate Fouling Challenges with QSense QCM-D [https://www.biolinscientific.com/blog/mitigate-fouling-challenges-with-qsense-qcm-d]
- 35. Everything's under Control: Maximizing Biosensor ... [https://pmc.ncbi.nlm.nih.gov/articles/PMC11840803/]
- 36. Advancements and Trends in Electrochemical Biosensors for ... [https://pmc.ncbi.nlm.nih.gov/articles/PMC12197901/]
- 37. Improving MIP-based electrochemical sensors by ... [https://www.sciencedirect.com/science/article/abs/pii/S0026265X25024634]
- 38. Advantages of Segmented Flow Analysis Over ... [https://seal-analytical.com/en/news/advantages-of-segmented-flow-analysis/]
- 39. Signal transduction interfaces for field-effect transistor ... [https://www.nature.com/articles/s42004-024-01121-6]
- 40. The advancement of biosensor design and construction ... [https://www.sciencedirect.com/science/article/pii/S2405805X25000158]
- 41. Development and quantitative analysis of a biosensor ... [https://pmc.ncbi.nlm.nih.gov/articles/PMC8794804/]
- 42. AI-Enhanced Electrochemical Sensing Systems: A Paradigm ... [https://pmc.ncbi.nlm.nih.gov/articles/PMC12467342/]
- 43. Characterising the biosensing interface [https://www.sciencedirect.com/science/article/pii/S0003267022003300]
- 44. Octet® AMC2 Biosensors Application Note [https://www.sartorius.com/en/products/biolayer-interferometry/bli-resources/octet-amc2-biosensors-application-note]
- 45. Automatic Removal of Physiological Artifacts in OPM-MEG [https://www.mdpi.com/2079-6374/15/10/680]
- 46. Blueprints for Biosensors: Design, Limitations, and ... [https://pmc.ncbi.nlm.nih.gov/articles/PMC6115959/]
- 47. Recent Advances in High-Strength Zwitterionic Polymer ... [https://link.springer.com/article/10.1007/s12209-025-00440-6]
- 48. Zwitterionic Functionalization of Persistent Luminescence ... [https://www.mdpi.com/2079-6412/13/11/1913]
- 49. Zwitter-repel: An anti-fouling coating promoting ... [https://www.sciencedirect.com/science/article/pii/S1385894724050113]
- 50. Conformational change-based electrochemical biosensor ... [https://pmc.ncbi.nlm.nih.gov/articles/PMC12548363/]
- 51. A Non-fouling and Highly Stable Electrochemical ... [https://www.sciencedirect.com/science/article/abs/pii/S0925400525011608]
- 52. When lower isn't always better in biosensor research and ... [https://www.sciencedirect.com/science/article/abs/pii/S0956566324006766]
- 53. How to Characterize Limit of Detection (LOD) and Dynamic ... [https://eureka.patsnap.com/report-how-to-characterize-limit-of-detection-lod-and-dynamic-range-for-resonant-biosensors]
- 54. On the Determination of Uncertainty and Limit of Detection in ... [https://pmc.ncbi.nlm.nih.gov/articles/PMC6068557/]
- 55. Comparative advantages of mechanical biosensors - PMC [https://pmc.ncbi.nlm.nih.gov/articles/PMC3839312/]
- 56. Reconfigurable acoustofluidics on piezoelectric ... [https://www.sciencedirect.com/science/article/abs/pii/S0925400525011967]
- 57. A differential strategy to enhance the anti-interference ... [https://www.sciencedirect.com/science/article/abs/pii/S0925400522006190]
- 58. Detection of Extremely Low Concentrations of Biological ... [https://www.nature.com/articles/srep39241]