Advanced Biosensors for Pesticide Detection in Agriculture: Principles, Applications, and Future Frontiers
This article provides a comprehensive review of advanced biosensing technologies for pesticide detection, tailored for researchers, scientists, and drug development professionals.
Advanced Biosensors for Pesticide Detection in Agriculture: Principles, Applications, and Future Frontiers
Abstract
This article provides a comprehensive review of advanced biosensing technologies for pesticide detection, tailored for researchers, scientists, and drug development professionals. It explores the foundational principles of biosensors, detailing the various biorecognition elements—such as enzymes, antibodies, aptamers, and whole cells—and their integration with nanomaterial-based transducers. The scope covers recent methodological innovations, including electrochemical, optical, and microbial whole-cell biosensors, highlighting their application in real-world agricultural matrices. The article also addresses critical challenges in sensor stability, selectivity, and commercialization, offering optimization strategies and a comparative analysis against traditional chromatographic methods. Finally, it examines the validation frameworks and future trajectories, including the integration of AI and IoT for smart agriculture, providing a holistic resource for developing next-generation monitoring tools.
The Urgent Need and Fundamental Principles of Biosensors in Agricultural Monitoring
The extensive use of pesticides in modern agriculture represents a critical paradox: while essential for protecting crops and ensuring global food security, their persistence in the environment creates significant ecological and public health challenges [1]. The total amount of pesticides used in 2015 reached approximately 3.42 million tonnes worldwide, with Europe accounting for 0.36 million tonnes [2] [3]. This dependency on chemical pest control has resulted in pesticide residues contaminating soil, water, and food systems, leading to ecosystem disruption and health risks ranging from acute poisoning to chronic diseases [4].
The environmental and health impacts are particularly concerning due to the persistent nature of many pesticide compounds. Studies indicate that only a minor amount of applied pesticides reaches the target pests, while the remainder represents environmental contaminants that can persist for decades [2]. This contamination has far-reaching consequences, including disruption of soil microbial ecosystems, water pollution, biodiversity loss, and human health effects such as neurotoxicity, carcinogenicity, and endocrine disruption [1] [4]. Addressing these challenges requires innovative approaches to monitor and control pesticide residues, with biosensor technology emerging as a powerful tool for rapid, sensitive detection in environmental and food samples.
Environmental and Public Health Impacts of Pesticide Residues
Ecological Consequences
Pesticide residues trigger cascading effects throughout ecosystems, with soil contamination representing a primary concern. These chemical residues significantly disrupt soil microbiota, reducing microbial diversity and functionality essential for nutrient cycling and maintaining soil fertility [1]. Research demonstrates that pesticide exposure diminishes beneficial microorganisms, impairing vital processes like organic matter decomposition and nutrient cycling [1]. This degradation of soil health creates long-term agricultural sustainability challenges, as contaminated soils become less productive and more vulnerable to erosion.
Water contamination through runoff and leaching poses another critical environmental threat. Pesticide residues accumulate in aquatic ecosystems, where they negatively affect marine organisms and disrupt entire food webs [1]. These contaminants interfere with endocrine systems in aquatic wildlife, causing reproductive and developmental abnormalities [1]. The biodiversity impact extends to pollinators, with pesticides like neonicotinoids shown to impair cognitive functions in bees, affecting their foraging behavior and memory, ultimately reducing pollination efficiency essential for ecosystem health [1].
Public Health Implications
Human exposure to pesticide residues occurs through multiple pathways, including direct contact, consumption of contaminated food and water, and environmental exposure. The health consequences range from acute to chronic effects, with an estimated 26 million cases of pesticide poisoning occurring annually worldwide, resulting in approximately 220,000 deaths [5]. The toxicity mechanisms vary by pesticide class, with organophosphate and carbamate insecticides inhibiting acetylcholinesterase, a vital enzyme in the nervous system, leading to acetylcholine accumulation and potential respiratory and myocardial malfunctions [6].
Chronic health implications present equally serious concerns, including:
- Neurotoxicity: Impaired neurological development and function [4]
- Carcinogenicity: Increased cancer risk [4]
- Endocrine disruption: Interference with hormonal systems [1] [4]
- Reproductive effects: Infertility and developmental abnormalities [5] [4]
Vulnerable populations such as farmworkers, children, and pregnant women face heightened risks [1]. Children are particularly susceptible to developmental disruptions, while pregnant women may experience complications affecting fetal development. These public health concerns underscore the critical need for effective monitoring systems to detect pesticide residues at levels below regulatory limits, enabling timely interventions to protect human health.
Table 1: Health Effects Associated with Major Pesticide Classes
| Pesticide Class | Primary Mechanism of Action | Acute Health Effects | Chronic Health Effects |
|---|---|---|---|
| Organophosphates | Acetylcholinesterase inhibition [6] | Headache, dizziness, nausea, respiratory depression [4] | Neurotoxicity, developmental disorders [4] |
| Carbamates | Acetylcholinesterase inhibition [6] | Salivation, sweating, tearing, muscle twitching [4] | Neurological impairments, metabolic disorders [5] |
| Organochlorines | Nervous system stimulation [6] | Dermal irritation, headache, convulsions [6] | Hormone disruption, cancer, Parkinson's disease [6] |
| Pyrethroids | Neuronal hyperexcitation [6] | Tingling, redness, itching | Nerve and bone marrow disorders [5] |
Analytical Framework: Biosensors as Monitoring Tools
Fundamental Biosensor Principles
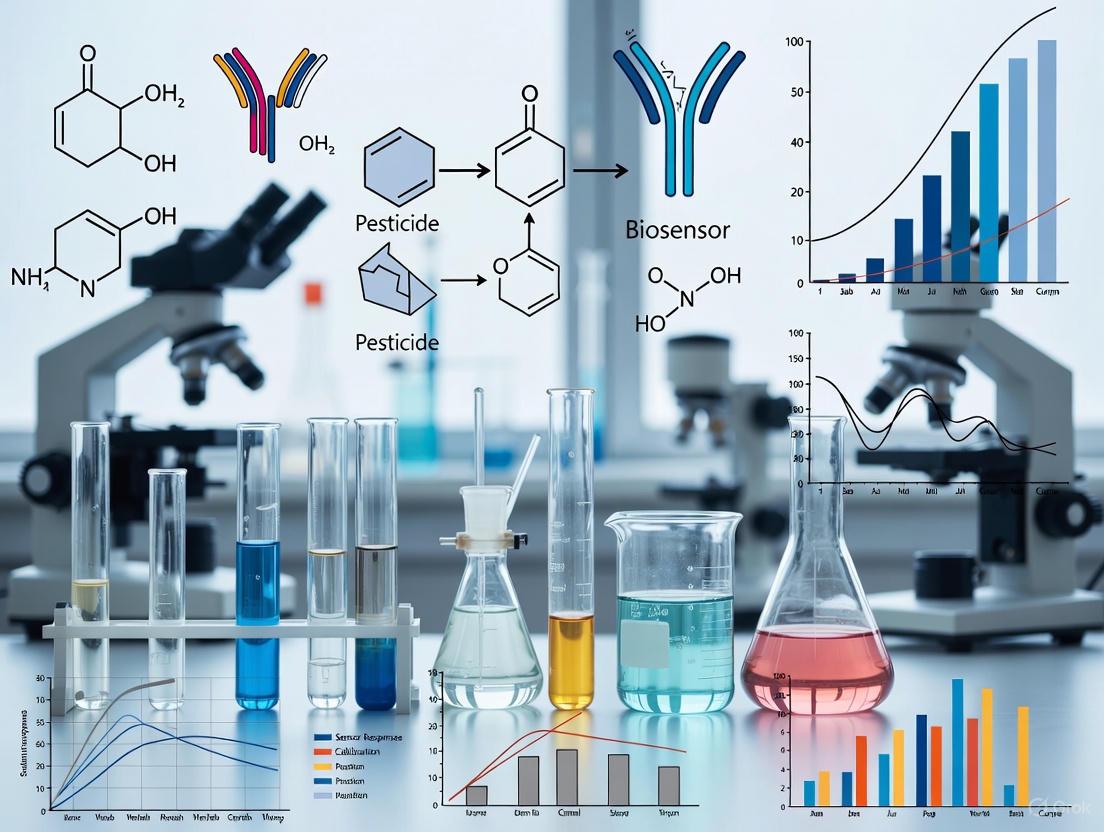
Biosensors represent analytical devices that integrate biological recognition elements with physicochemical transducers to detect target analytes [7]. These systems operate through a fundamental mechanism: a biological recognition event generates a signal that is converted by a transducer into a measurable output proportional to the analyte concentration [5]. For pesticide detection, biosensors offer significant advantages over conventional chromatographic methods, including rapid response, portability for field use, cost-effectiveness, and minimal requirement for sample preparation [7] [8].
A typical biosensor comprises three essential components:
- Biorecognition element: Biological entity (enzyme, antibody, aptamer, cell) that specifically interacts with the target pesticide [5] [7]
- Transducer: Converts the biological recognition event into a quantifiable signal (electrochemical, optical, piezoelectric) [5]
- Signal processing system: Amplifies, processes, and displays the results in user-friendly format [5]
The integration of nanomaterials has revolutionized biosensor technology, enhancing sensitivity, selectivity, and stability through unique optical and electrical properties, high surface-to-volume ratio, and tunable surface chemistry [5] [8].
Biosensor Classification Systems
Biosensors can be categorized based on either their biorecognition elements or their transduction mechanisms, each offering distinct advantages for specific application scenarios:
Table 2: Biosensor Classification by Biorecognition Elements and Performance Characteristics
| Biosensor Type | Biorecognition Element | Detection Principle | Key Pesticide Targets | Advantages | Limitations |
|---|---|---|---|---|---|
| Enzyme-based | Acetylcholinesterase, tyrosinase, alkaline phosphatase [2] [3] | Enzyme inhibition [2] [3] | Organophosphates, carbamates, triazines [2] [3] | Broad detection spectrum, biologically relevant [2] | Limited specificity, enzyme stability issues [2] |
| Immunosensor | Pesticide-specific antibodies [7] | Antigen-antibody binding [7] | Specific pesticide compounds [7] | High specificity and sensitivity [7] | Complex antibody production, cross-reactivity [7] |
| Aptasensor | Single-stranded DNA or RNA aptamers [7] | Conformational change upon binding [7] | Various pesticides [7] | High stability, tunable affinity [7] | SELEX process for aptamer selection required [7] |
| Whole-cell | Microorganisms, plant or animal cells [7] | Cellular response (e.g., luminescence inhibition) [7] | Broad-spectrum toxicity assessment [7] | Provides toxicity information, low cost [7] | Less specific, longer response time [7] |
Application Notes: Experimental Protocols for Pesticide Detection
Protocol 1: Enzyme-Based Electrochemical Biosensor for Organophosphate Detection
Principle: This protocol utilizes acetylcholinesterase (AChE) inhibition by organophosphate pesticides, with electrochemical detection of enzymatic activity [2] [3]. The degree of enzyme inhibition correlates with pesticide concentration, enabling quantitative detection.
Materials and Reagents:
- Acetylcholinesterase enzyme (electric eel or genetically modified Drosophila melanogaster variants) [3]
- Acetylthiocholine iodide (substrate) [2]
- Phosphate buffer saline (PBS, 0.1 M, pH 7.4)
- Gold nanoparticles (20 nm diameter) [8]
- Screen-printed carbon electrodes (SPCE)
- Glutaraldehyde (2.5% solution for cross-linking)
- Nafion perfluorinated resin solution (5 wt%)
Procedure:
- Electrode modification: Deposit 10 μL of gold nanoparticle suspension on SPCE surface, dry at room temperature [8].
- Enzyme immobilization: Mix 10 μL AChE solution (0.5 U/μL) with 5 μL Nafion solution, deposit 5 μL of mixture on modified electrode, cross-link with 2.5% glutaraldehyde vapor for 15 minutes [2].
- Baseline measurement: Incubate biosensor in PBS containing 0.5 mM acetylthiocholine, record amperometric current at +0.45 V versus Ag/AgCl for 5 minutes [2].
- Inhibition phase: Incubate biosensor in sample solution for 15 minutes, rinse with PBS.
- Post-inhibition measurement: Record amperometric current again under identical conditions as step 3.
- Quantification: Calculate inhibition percentage using formula: [ Inhibition\% = \frac{I0 - I1}{I0} \times 100 ] where (I0) is baseline current and (I_1) is post-inhibition current.
Validation: Calibrate with standard paraoxon solutions (0.1-100 μg/L). The detection limit should reach 0.1 μg/L with 8.2% RSD for reproducibility [3].
Protocol 2: Nanomaterial-Enhanced Optical Aptasensor for Chlorpyrifos Detection
Principle: This protocol employs a chlorpyrifos-specific aptamer immobilized on gold nanoparticles, with colorimetric detection based on surface plasmon resonance changes during pesticide binding [8].
Materials and Reagents:
- DNA aptamer sequence: 5'-CCT GAC GCT AAT GGT ACG GTA CGT TGA CGT ATG CGT GCT ACC GTG AA-3' [8]
- Gold nanoparticles (15 nm diameter, OD₅₂₀ = 5) [8]
- Sodium chloride (1 M and 100 mM solutions)
- Acetate buffer (10 mM, pH 5.2)
- Phosphate buffer saline (PBS, 0.1 M, pH 7.4)
Procedure:
- Aptamer functionalization: Incubate 1 nmol aptamer with 1 mL gold nanoparticle solution in acetate buffer for 16 hours at 25°C with gentle shaking [8].
- Salt aging: Add NaCl solution gradually to achieve final concentration of 50 mM over 8 hours.
- Sensor preparation: Centrifuge functionalized nanoparticles at 12,000 × g for 15 minutes, resuspend in PBS containing 50 mM NaCl.
- Detection assay: Mix 50 μL sample with 50 μL aptamer-nanoparticle solution, incubate 10 minutes at room temperature.
- Colorimetric measurement: Record absorbance spectrum from 450-650 nm or visually assess color change.
- Quantification: Calculate ratio of absorbance at 520 nm to 620 nm, correlate with chlorpyrifos concentration (0.05-500 μg/L).
Performance: This assay achieves detection limit of 36 ng/L for chlorpyrifos in apple and pak choi samples, with recovery rates of 92.5-106.3% [8].
Protocol 3: Surface-Enhanced Raman Spectroscopy (SERS) for Multi-Pesticide Residue Analysis
Principle: This protocol utilizes SERS for sensitive detection of multiple pesticide residues based on their unique Raman vibrational fingerprints, enhanced by nanostructured metal substrates [7].
Materials and Reagents:
- Silver nanoparticles (50 nm diameter, citrate-stabilized)
- Silicon wafer substrates
- Methanol (HPLC grade)
- Acetonitrile (HPLC grade)
- Standard pesticide solutions (malathion, chlorpyrifos, paraoxon)
Procedure:
- SERS substrate preparation: Deposit silver nanoparticle suspension on silicon wafer using spin-coating method (3000 rpm, 60 seconds), anneal at 150°C for 30 minutes [7].
- Sample preparation: Extract pesticide residues from food matrices using QuEChERS method, reconstitute in methanol.
- SERS measurement: Deposit 2 μL sample extract on SERS substrate, allow to dry, acquire Raman spectra with 785 nm excitation laser, 10-second integration time.
- Spectral analysis: Identify characteristic pesticide peaks:
- Malathion: 665 cm⁻¹ (P-S stretching)
- Chlorpyrifos: 620 cm⁻¹ (C-Cl stretching)
- Paraoxon: 1105 cm⁻¹ (P=O stretching)
- Quantification: Measure peak intensity, generate calibration curves (0.1-100 μg/kg).
Validation: The method achieves detection limits of 0.05-0.2 μg/kg for various pesticides in fruit and vegetable samples, with recovery rates of 82.5-108.7% [7].
Data Presentation: Analytical Performance of Biosensing Platforms
The analytical performance of biosensors is critically evaluated based on parameters including detection limit, linear range, reproducibility, and applicability to real samples. Recent advances in nanotechnology have significantly enhanced these performance metrics, enabling detection at concentrations well below regulatory limits [8].
Table 3: Performance Comparison of Nanomaterial-Enhanced Biosensors for Pesticide Detection
| Biosensor Platform | Nanomaterial | Detection Method | Target Pesticide | Limit of Detection | Linear Range | Sample Matrix |
|---|---|---|---|---|---|---|
| AChE-based biosensor [8] | Gold nanoparticles | Electrochemical | Organophosphates | 19-77 ng/L | 0.05-50 μg/L | Apple, cabbage |
| Aptasensor [8] | Gold nanoparticles | Colorimetric | Chlorpyrifos | 36 ng/L | 0.05-500 μg/L | Apple, pak choi |
| Immunosensor [8] | Gold nanoparticles | Electrochemical | Chlorpyrifos | 0.07 ng/L | 0.001-100 μg/L | Chinese cabbage, lettuce |
| Fluorescent biosensor [7] | Carbon quantum dots | Fluorescence | Carbamate | 82 ng/L | 0.2-250 μg/L | Fruit, vegetables |
| SERS-based sensor [7] | Silver nanoparticles | Raman spectroscopy | Multiple pesticides | 0.1-0.5 μg/kg | 0.5-1000 μg/kg | Fruit surfaces |
Visualization: Biosensor Mechanisms and Workflows
Biosensor Architecture and Signaling Pathways
Biosensor Development Workflow
The Scientist's Toolkit: Essential Research Reagents and Materials
Successful development and implementation of biosensors for pesticide detection requires carefully selected reagents and materials that ensure analytical reliability and performance. The following toolkit summarizes critical components used in advanced biosensing platforms.
Table 4: Essential Research Reagent Solutions for Pesticide Biosensor Development
| Reagent/Material | Function/Purpose | Examples/Specifications | Application Notes |
|---|---|---|---|
| Acetylcholinesterase [2] [3] | Biorecognition element for organophosphate and carbamate detection | Electric eel (0.5-1.0 U/μL), genetically modified Drosophila variants | Select mutants for enhanced sensitivity to specific insecticides [3] |
| Gold Nanoparticles [8] | Signal amplification, electrode modification, colorimetric detection | 15-20 nm diameter, citrate-stabilized, OD₅₂₀ = 2-5 | Functionalize with thiolated aptamers or antibodies for enhanced specificity [8] |
| Screen-Printed Electrodes [2] | Disposable electrochemical sensing platform | Carbon, gold, or platinum working electrodes | Enable field-deployable analysis, modify with nanomaterials [2] |
| Specific Aptamers [7] | Synthetic biorecognition elements for various pesticides | DNA/RNA sequences from SELEX process | Chlorpyrifos-specific aptamer: 45-50 nucleotides [7] |
| Quantum Dots [7] | Fluorescent labels for optical detection | CdSe/ZnS core-shell, graphene quantum dots | High quantum yield (>0.7), tunable emission spectra [7] |
| Nafion Perfluorinated Resin [2] | Polymer for enzyme immobilization | 5 wt% solution in alcohol/water mixture | Provides stable microenvironment for enzymes, reduces interference [2] |
| Metal-Organic Frameworks [7] | Porous materials for enhanced adsorption and sensing | ZIF-8, UiO-66, MIL-101 | High surface area (>1000 m²/g), tunable pore size [7] |
Biosensor technology represents a transformative approach to addressing the global challenge of pesticide pollution by providing rapid, sensitive, and field-deployable detection tools. The integration of advanced nanomaterials, novel biorecognition elements, and innovative transduction mechanisms has enabled detection limits that meet or exceed regulatory requirements for pesticide monitoring in food and environmental samples [8]. The experimental protocols and application notes presented herein provide researchers with robust methodologies for developing and implementing these analytical tools in diverse settings.
Future developments in biosensor technology will likely focus on several key areas: multi-analyte detection platforms for simultaneous screening of multiple pesticide residues [7]; enhanced portability and connectivity for real-time data sharing through smartphone integration [6]; improved stability and longevity of biorecognition elements for extended field use; and the incorporation of artificial intelligence for data analysis and pattern recognition [2] [3]. As regulatory frameworks evolve to address the complex challenges of pesticide residues in the environment, advanced biosensing platforms will play an increasingly critical role in protecting ecosystem and human health while supporting sustainable agricultural practices.
Conventional chromatographic methods, primarily High-Performance Liquid Chromatography (HPLC) and Gas Chromatography-Mass Spectrometry (GC-MS), are established as the gold standard for pesticide detection in agricultural research. These techniques provide excellent accuracy, sensitivity, and the ability to perform multi-residue analysis. However, their applicability is constrained by significant limitations, including high operational costs, prolonged analysis time, and a fundamental lack of portability for on-site use. This document delineates these constraints within the context of agricultural research, framing the necessity for alternative detection strategies such as biosensors.
Quantitative Analysis of Limitations
The limitations of GC-MS and HPLC can be quantitatively summarized across several key operational parameters, as detailed in the tables below.
Table 1: Direct and Indirect Cost Analysis of GC-MS and HPLC
| Cost Factor | GC-MS [9] | HPLC [10] [11] |
|---|---|---|
| Initial Instrument Cost | $40,000 - $300,000+ | Significantly more expensive than GC (even used systems) [10] |
| Annual Service Contract | $8,000 - $15,000 | Not Specified |
| Consumables | GC columns, vials, solvents, carrier gases (He, H₂) [9] | HPLC-grade solvents (e.g., methanol, ACN) are expensive [10] |
| Solvent Disposal | Minimal [11] | Non-negligible cost, approximately equal to solvent purchase price [10] |
| Cost per Analysis | Lower (minimal solvent use) [11] | Higher (high solvent use and complex preparation) [11] |
Table 2: Operational and Practical Constraints of GC-MS and HPLC
| Operational Parameter | GC-MS [11] [12] [9] | HPLC [10] [11] [12] |
|---|---|---|
| Analysis Time | Fast separations; runs can be 30-40 min [10] [11] | Generally slower than GC; moderate run times [11] |
| Sample Preparation | Can be time-consuming; often requires derivatization for polar compounds [11] | May be more involved [11] |
| Portability | Not portable; requires dedicated lab space [12] | Not portable; requires dedicated lab space [12] |
| Operator Skill Required | Highly skilled operators [12] | Complex systems to operate [10] |
| Analyte Suitability | Limited to volatile, thermally stable compounds [11] | Ideal for non-volatile, polar, thermally unstable compounds [11] |
Detailed Experimental Protocols
The following protocols exemplify standard procedures in pesticide residue analysis, highlighting the steps that contribute to their time-intensive and resource-heavy nature.
Protocol: Multi-Residue Pesticide Analysis in Produce using GC-MS
This protocol is adapted from procedures used to detect pesticide traces in fruits and vegetables like apples, grapes, and cucumbers [12].
I. Research Reagent Solutions and Materials
| Item | Function/Brief Explanation |
|---|---|
| GC-MS System | A mid-range single quadrupole system equipped with an autosampler. |
| Chromatography Column | A fused-silica capillary GC column (e.g., 30 m x 0.25 mm ID, 0.25 µm film). |
| High-Purity Solvents | Pesticide-residue grade acetone, ethyl acetate, and n-hexane for extraction and dilution. |
| Anhydrous Sodium Sulfate | For removal of residual water from the organic extract. |
| Solid Phase Extraction (SPE) Cartridges | e.g., C18 or Florisil for sample clean-up to remove co-extractives. |
| Internal Standards | Deuterated or other pesticide analogues for quantification accuracy. |
II. Methodology
Sample Preparation (1-2 hours):
- Homogenize 15 g of the representative produce sample.
- Extract pesticides using 30 mL of ethyl acetate in a shaking apparatus for 1 hour.
- Add anhydrous sodium sulfate to the extract to remove water.
Sample Clean-up (1 hour):
- Pre-condition an SPE cartridge with 5 mL of n-hexane.
- Load the concentrated extract onto the cartridge.
- Elute the pesticides with 10 mL of an acetone:n-hexane (20:80 v/v) mixture.
- Evaporate the eluent to near dryness under a gentle stream of nitrogen.
Instrumental Analysis (30-40 minutes per sample):
- Reconstitute the dried extract in 1 mL of n-hexane.
- Inject 1 µL into the GC-MS system.
- GC Conditions: Inlet temperature: 250°C; Carrier gas: Helium, constant flow 1.0 mL/min; Oven program: 60°C (hold 1 min), ramp to 300°C at 15°C/min (hold 5 min).
- MS Conditions: Ion source temperature: 230°C; Transfer line: 280°C; Acquisition mode: Selected Ion Monitoring (SIM).
Data Processing (30+ minutes):
- Integrate chromatographic peaks.
- Compare analyte retention times and mass spectra with certified standards for identification.
- Use a calibration curve with internal standards for quantification.
Protocol: Detection of Non-Volatile Pesticides via HPLC-UV
This protocol is typical for analyzing polar, thermally labile pesticides like glyphosate or certain herbicides [11] [12].
I. Research Reagent Solutions and Materials
| Item | Function/Brief Explanation |
|---|---|
| HPLC System | System comprising a high-pressure pump, degasser, autosampler, and UV/Vis or DAD detector. |
| HPLC Column | A reverse-phase C18 column (e.g., 150 mm x 4.6 mm, 5 µm particle size). |
| HPLC-Grade Solvents | Acetonitrile and methanol. High-purity water (e.g., 18.2 MΩ·cm). |
| Buffers/Salts | e.g., Ammonium acetate or formic acid for preparing the mobile phase. |
| Syringe Filters | 0.45 µm or 0.22 µm nylon or PTFE membranes for filtering samples prior to injection. |
II. Methodology
Extraction (1-1.5 hours):
- Weigh 10 g of a soil or ground plant sample.
- Add 20 mL of a 50:50 (v/v) water:acetonitrile mixture and shake vigorously for 45 minutes.
- Centrifuge the mixture at 4000 rpm for 10 minutes and collect the supernatant.
Filtration and Derivatization (if needed, +1 hour):
- Pass the supernatant through a 0.45 µm syringe filter. For some pesticides (e.g., glyphosate), a derivatization step may be required to enable UV detection, adding significant time and complexity.
Instrumental Analysis (Variable, often >10 min/sample):
- Inject 10-20 µL of the filtered extract into the HPLC system.
- Mobile Phase: A gradient of solvent A (0.1% formic acid in water) and solvent B (0.1% formic acid in acetonitrile).
- Flow Rate: 1.0 mL/min.
- Detection: UV-Vis detector set at a wavelength specific to the target pesticide (e.g., 230 nm).
Data Analysis (30+ minutes):
- Process the chromatogram to identify pesticides based on retention time.
- Quantify concentrations by comparing peak areas against a external calibration curve.
Workflow and Logical Diagrams
The following diagram illustrates the complex, multi-step workflow of a conventional HPLC or GC-MS method for pesticide detection, directly contributing to its lengthy timeline and high resource demand.
Diagram 1: Workflow of conventional pesticide analysis, highlighting time-intensive stages.
As detailed in these application notes, conventional methods like GC-MS and HPLC, while highly accurate, present significant barriers for modern agricultural research. The prohibitive costs of acquisition, operation, and maintenance, coupled with lengthy, multi-step protocols and a complete lack of field portability, render them impractical for rapid, on-site decision-making. These limitations create a compelling case for the adoption of alternative technologies, such as biosensors, which offer the potential for low-cost, rapid, and portable pesticide detection to better serve the needs of researchers and the agricultural industry.
According to the International Union of Pure and Applied Chemistry (IUPAC), a biosensor is defined as a self-contained integrated device capable of providing specific quantitative or semi-quantitative analytical information using a biological recognition element (biochemical receptor) retained in direct spatial contact with a physicochemical transduction element [13] [14]. This definition distinguishes biosensors from bioanalytical systems that require additional processing steps such as reagent addition. The core function of any biosensor is to convert a biological response into an electrical signal through a coordinated process involving biorecognition, signal transduction, and processing [15] [16]. In the context of modern agriculture, biosensors have emerged as powerful tools for detecting pesticide residues, offering significant advantages over traditional methods like chromatography through their portability, rapid response, and suitability for on-site testing [17] [12].
Core Components of a Biosensor
A biosensor comprises three fundamental components that work in sequence to detect and quantify target analytes. These components form the foundation of all biosensing platforms, regardless of their specific application or technological implementation.
Bioreceptor
The bioreceptor is the biological recognition element that specifically interacts with the target analyte (e.g., pesticide molecules) [18] [15]. This interaction produces a biochemical signal that serves as the initial detection event. The specificity of the bioreceptor determines the biosensor's ability to distinguish target molecules from other substances in the sample matrix [16]. Bioreceptors can be categorized as either catalytic (e.g., enzymes) or affinity-based (e.g., antibodies, aptamers) [16] [19].
Table 1: Common Bioreceptors Used in Pesticide Biosensors
| Bioreceptor Type | Recognition Mechanism | Target Example | Stability | Key Advantage |
|---|---|---|---|---|
| Enzymes (e.g., Acetylcholinesterase - AChE) | Catalytic inhibition | Organophosphorus pesticides (malathion, chlorpyrifos) | Moderate | Natural specificity to substrate analogs [12] |
| Antibodies | Affinity binding | Glyphosate, 2,4-D, atrazine | Good | High specificity to single compound [12] [18] |
| Aptamers | Affinity binding | Various pesticides through SELEX | Excellent | Thermal stability, synthetic production [18] [19] |
| Whole Cells | Metabolic response | Broad-spectrum toxicity | Variable | Can detect bioactive forms [18] |
| Artificial Binding Proteins | Affinity binding | Custom targets | Excellent | Small size, no disulfide bonds [18] |
Transducer
The transducer converts the biochemical signal resulting from the bioreceptor-analyte interaction into a measurable electrical signal [15] [16]. The transducer type defines the primary classification of biosensors and determines key performance parameters including sensitivity, detection limit, and response time [16].
Table 2: Transducer Types in Biosensors for Pesticide Detection
| Transducer Type | Detection Principle | Measurable Parameter | Detection Limit Example | Advantages |
|---|---|---|---|---|
| Electrochemical | Electron transfer | Current, potential, impedance | 0.18 ng/mL for OPs [12] | High sensitivity, portability, low cost [19] |
| Optical | Light interaction | Absorption, fluorescence, SPR | 15.03 pg/mL for chlorpyrifos [12] | High sensitivity, remote sensing [19] |
| Mass-Based (Piezoelectric) | Mass change | Frequency, resonance | N/A | Label-free detection [19] |
| Calorimetric | Heat change | Temperature | N/A | Universal detection [20] |
Signal Processor
The signal processor comprises the electronic systems that amplify, process, and display the transduced signal in a user-interpretable format [18] [15]. This component includes amplifiers, analog-to-digital converters, microprocessors, and display units that transform raw electrical signals into meaningful analytical information such as pesticide concentration values [15] [16]. Advanced signal processing often incorporates machine learning algorithms to interpret complex data patterns, particularly in multi-analyte detection systems like electronic tongues (e-tongues) and electronic noses (e-noses) [12].
IUPAC Classification and Definitions
The IUPAC has established formal definitions and classification criteria for biosensors to standardize terminology across scientific disciplines [13] [14].
Key IUPAC Recommendations
- Distinction from Bioanalytical Systems: A biosensor should be clearly distinguished from a bioanalytical system that requires additional processing steps (e.g., reagent addition) [13].
- Single-Use Biosensors: Devices that are disposable after one measurement and unable to monitor analyte concentration continuously or after rapid regeneration should be designated as single-use biosensors [13].
- Classification Basis: Biosensors may be classified according to (1) the biological specificity-conferring mechanism (bioreceptor type) or (2) the mode of physicochemical signal transduction (transducer type) [13].
- Analyte Monitoring: Biosensors may directly monitor analyte concentration or reactions producing/consuming analytes, or indirectly monitor inhibitors or activators of the biological recognition element [13].
Performance Criteria
IUPAC recommends standardized performance criteria for evaluating biosensors, including [13]:
- Calibration characteristics: Sensitivity, operational and linear concentration range, detection and quantitative determination limits
- Selectivity: Ability to distinguish target analyte from interferents
- Response time: Steady-state and transient response times
- Reproducibility: Consistency between measurements
- Stability and lifetime: Operational stability over time
Biosensor Architecture and Signaling Pathways
The following diagram illustrates the fundamental architecture and signal transduction pathways of a typical biosensor system for pesticide detection.
Experimental Protocols for Pesticide Detection
Protocol 1: Enzyme-Based Electrochemical Biosensor for Organophosphorus Pesticides
This protocol details the methodology for detecting organophosphorus (OP) pesticides using an acetylcholinesterase (AChE)-based electrochemical biosensor [12].
Principle: OP pesticides inhibit AChE activity, reducing enzymatic conversion of acetylcholine and consequently decreasing electrochemical signal (current) proportional to pesticide concentration.
Materials and Reagents:
- Acetylcholinesterase (AChE) from electrophorus electricus
- Acetylcholine chloride substrate
- Phosphate buffer saline (PBS, 0.1 M, pH 7.4)
- Screen-printed carbon electrodes (SPCEs)
- Glutaraldehyde (2.5%) for cross-linking
- Bovine serum albumin (BSA) for stabilization
Procedure:
- Electrode Modification: Clean SPCEs electrochemically in 0.1 M PBS (pH 7.4) by cyclic voltammetry between -0.5V and +0.8V until stable baseline.
- Enzyme Immobilization: Mix AChE (100 U/mL) with 2% BSA and 0.25% glutaraldehyde. Deposit 5 μL mixture on SPCE working electrode. Dry at 4°C for 12 hours.
- Measurement:
- Incubate modified electrode with sample (or standard) for 10 minutes.
- Transfer to electrochemical cell containing 10 mM acetylcholine in PBS.
- Apply amperometry at +0.7V vs. Ag/AgCl reference electrode.
- Measure steady-state current (I) after 60 seconds.
- Calibration: Perform with standard OP solutions (0.5-100 ng/mL). Calculate inhibition percentage: % Inhibition = [(I₀ - I)/I₀] × 100, where I₀ = current without inhibitor.
Validation: Test real samples (vegetable extracts) with standard addition method. Recovery should be 85-115% for validation.
Protocol 2: Aptamer-Based Optical Biosensor for Glyphosate Detection
This protocol describes glyphosate detection using a fluorescent aptamer-based biosensor [19] [12].
Principle: Specific aptamer binds glyphosate, inducing conformational change that alters fluorescence intensity proportional to glyphosate concentration.
Materials and Reagents:
- Glyphosate-specific aptamer (5'-GGT AGG GCG CGT CGA CGG GAC TGG CGC AGC CCA CCA CGC AGC GCC ATC GCC GCT CCG CCA CGA ATC CGC ATC ATC GAT GGC GCT GGG CAC CGC AAA CCG TGC ACC GCT TCG ATC AGA CGA TCG CGG GCT ACG TCG AAG AAG CTA TCG CAA AAG CGA CGA GCA CCC GGA TAA-3')
- Carboxyfluorescein (FAM)-labeled complementary strand
- Tris buffer (20 mM, pH 7.4, containing 5 mM MgCl₂)
- Glyphosate standards (0.1-100 ng/mL)
- Microcentrifuge tubes (1.5 mL, amber)
- Fluorescence spectrophotometer
Procedure:
- Aptamer Preparation: Dilute aptamer to 1 μM in Tris buffer. Heat to 95°C for 5 minutes, slowly cool to room temperature for proper folding.
- Hybridization: Mix 50 μL folded aptamer with 50 μL FAM-labeled complementary strand (1 μM). Incubate 30 minutes at 25°C.
- Detection:
- Add 100 μL sample/standard to 100 μL aptamer-complement mixture.
- Incubate 15 minutes at 25°C.
- Measure fluorescence at λex/λem = 492/518 nm.
- Quantification: Plot fluorescence intensity vs. glyphosate concentration (log scale). Linear range typically 0.1-50 ng/mL.
Specificity Testing: Validate with structurally similar compounds (aminomethylphosphonic acid, glufosinate) to confirm minimal cross-reactivity.
The Scientist's Toolkit: Research Reagent Solutions
Table 3: Essential Research Reagents for Biosensor Development
| Reagent/Material | Function | Application Examples | Key Considerations |
|---|---|---|---|
| Gold Nanoparticles (AuNPs) | Signal amplification, quencher, immobilization support | Colorimetric detection, electrode modification | Tunable optical properties, high surface area [21] [20] |
| Carbon Nanotubes (CNTs) | Electrode modification, signal enhancement | Electrochemical transducers | High conductivity, large surface area [15] [20] |
| Quantum Dots (QDs) | Fluorescent labels | FRET-based sensors, optical detection | Size-tunable emission, high quantum yield [21] [15] |
| Screen-Printed Electrodes (SPEs) | Disposable transducer platform | Electrochemical biosensors | Mass production, portability [12] |
| Glutaraldehyde | Cross-linking agent | Enzyme/antibody immobilization | Stability vs. activity trade-off [12] |
| Magnetic Nanoparticles | Separation, concentration | Sample preparation, signal enhancement | External field control, surface functionalization [20] |
Biosensors represent a convergence of biological recognition and physicochemical transduction that provides powerful analytical capabilities for pesticide detection in agricultural research. The rigorous definitions and classifications established by IUPAC provide a critical framework for standardized development and evaluation of these devices. As biosensor technology continues to evolve through nanotechnology advancements and improved signal processing methodologies, these analytical tools are poised to play an increasingly vital role in ensuring food safety and environmental monitoring through rapid, sensitive, and field-deployable pesticide detection systems.
The accurate and sensitive detection of pesticide residues in agricultural products is paramount for ensuring global food safety. Biosensors, which combine a biological recognition element with a physicochemical transducer, have emerged as powerful analytical tools that address the limitations of conventional chromatographic methods, which are often time-consuming, expensive, and require skilled personnel and sophisticated instrumentation [7] [5]. The core of a biosensor's specificity and performance lies in its biorecognition element. This application note provides a detailed overview of five key biorecognition elements—enzymes, antibodies, aptamers, whole cells, and molecularly imprinted polymers (MIPs)—within the context of developing biosensors for pesticide detection. It includes structured comparative data, detailed experimental protocols, and visualization of their working principles to aid researchers in selecting and applying the most appropriate technology for their specific agricultural research needs.
Biorecognition Elements: Principles and Applications
The following section delineates the fundamental characteristics, advantages, and limitations of each biorecognition element, with a specific focus on their application in pesticide detection.
Enzymes
Principle: Enzyme-based biosensors primarily operate on the principle of enzyme inhibition. Pesticides, particularly organophosphates and carbamates, inhibit the activity of specific enzymes such as acetylcholinesterase (AChE) or organophosphate hydrolase (OPH). The degree of inhibition is quantitatively correlated with the concentration of the pesticide present [7] [22]. Alternatively, some sensors utilize enzymes like OPH that directly hydrolyze pesticides, generating a detectable product [22].
Applications: These biosensors are widely used for the detection of neurotoxic insecticides. AChE-based sensors are among the most historically prevalent biosensors for organophosphates and carbamates [22].
Antibodies
Principle: Immunosensors rely on the highly specific affinity between an antibody (the biorecognition element) and a pesticide molecule (the antigen, or a hapten). This binding event is then transduced into a measurable signal, often electrochemical or optical [23] [7].
Applications: Immunosensors can be designed for highly specific detection of a single pesticide or a class of pesticides. They have been developed for compounds like malathion, offering high specificity where a specific antibody is available [7] [24].
Aptamers
Principle: Aptamers are short, single-stranded DNA or RNA oligonucleotides that bind to target molecules (e.g., pesticides) with high affinity and specificity by folding into unique three-dimensional structures. Biosensors using aptamers are known as aptasensors [24]. The binding mechanism involves hydrogen bonds, electrostatic interactions, van der Waals forces, and aromatic ring stacking [24].
Applications: Aptasensors represent a promising alternative to antibody-based sensors due to their superior stability, reusability, and in vitro production. They have been successfully developed for pesticides such as carbendazim and thiamethoxam, often achieving ultra-trace detection limits [24].
Whole Cells
Principle: Whole-cell biosensors utilize living microorganisms (e.g., bacteria, yeast) or plant cells as the sensing element. The detection can be based on the inhibition of cellular activity (e.g., using luminescent bacteria where pesticide presence quenches light emission) or on the detection of specific degradation products generated by cellular enzymes [7].
Applications: These sensors are useful for generic toxicity screening and for detecting pesticides that certain bacteria are known to degrade. They provide a holistic view of toxicity but are less specific for individual pesticide compounds [7].
Molecularly Imprinted Polymers (MIPs)
Principle: MIPs are synthetic polymers with tailor-made recognition sites complementary to the target pesticide molecule in shape, size, and functional groups. They are created by polymerizing functional monomers around a template molecule (the target pesticide), which is subsequently removed, leaving behind artificial antibody-like cavities [23].
Applications: MIPs are robust, stable, and cost-effective alternatives to biological receptors. They are highly resistant to harsh environmental conditions (pH, temperature), making them suitable for on-field deployment. They have been used in sensors for various pesticides, including artemisinin and other small molecules [23].
Table 1: Comparative Analysis of Biorecognition Elements for Pesticide Detection
| Biorecognition Element | Key Principle | Key Advantages | Key Limitations | Example Pesticides Detected |
|---|---|---|---|---|
| Enzymes | Enzyme inhibition or catalysis | High catalytic activity; well-established protocols | Limited stability; susceptible to environmental conditions | Organophosphates (e.g., chlorpyrifos), Carbamates [7] [22] |
| Antibodies | Specific antigen-antibody binding | Very high specificity and affinity | Production is complex/expensive; batch-to-batch variation; limited stability [23] [7] | Malathion [24] |
| Aptamers | Folding-induced 3D structure binding | High stability, reusability, small size; in vitro selection | In vitro selection (SELEX) can be complex; sensitivity to nucleases [23] [24] | Carbendazim, Thiamethoxam [24] |
| Whole Cells | Cellular activity inhibition/degradation | Provides toxicity assessment; can detect bioavailable fraction | Low specificity; long response time; complex maintenance [7] | General toxicity screening, specific degradable pesticides [7] |
| MIPs | Complementary cavity in synthetic polymer | High chemical/thermal stability; cost-effective; reusable | Sometimes lower selectivity than biological receptors; template leaching risk [23] | Artemisinin, various small molecules [23] |
Table 2: Performance Metrics of Selected Biosensors for Pesticide Detection
| Biorecognition Element | Transduction Method | Target Pesticide | Limit of Detection (LOD) | Linear Range | Reference (Context) |
|---|---|---|---|---|---|
| AChE Enzyme | Electrochemical | Chlorpyrifos, Carbaryl | Varies with sensor design | Varies with sensor design | [24] |
| Antibody | Electrochemical / Amperometric | Malathion | Varies with sensor design | Varies with sensor design | [24] |
| Aptamer | Voltammetric | Carbendazim | 0.2 femtomolar (fM) | 0.8 fM - 100 pM | [24] |
| Aptamer | Electrochemical | Thiamethoxam | Low detection limits achieved | Varies with sensor design | [24] |
| MIP | Electrochemical | Artemisinin | Demonstrated high sensitivity | Wide dynamic range | [23] |
| MIP | Electrochemical | Glucose (as model) | High sensitivity for non-pesticide model | Wide linear range | [23] |
Experimental Protocols
Protocol: Fabrication of an Acetylcholinesterase (AChE) Inhibition-Based Electrochemical Biosensor
This protocol details the construction of a standard electrochemical biosensor for detecting organophosphate and carbamate pesticides based on AChE inhibition [7] [22].
1. Reagents and Materials:
- Acetylcholinesterase (AChE) enzyme from electric eel or recombinant source.
- Acetylthiocholine (ATCh) or acetylcholine as substrate.
- Phosphate buffer saline (PBS, 0.1 M, pH 7.4) for preparation of enzyme and substrate solutions.
- Working electrode (e.g., Glassy Carbon Electrode, Screen-Printed Carbon Electrode).
- Nanomaterials for electrode modification (e.g., Gold Nanoparticles (AuNPs), Graphene Oxide).
- Cross-linking agents (e.g., Glutaraldehyde, BS³) for enzyme immobilization.
2. Electrode Modification and Enzyme Immobilization:
- Step 1: Surface Pretreatment. Clean the working electrode according to standard procedures (e.g., polish with alumina slurry on a microcloth for GCE, then rinse with distilled water).
- Step 2: Nanomaterial Modification (Optional for Signal Amplification). Deposit a suspension of the selected nanomaterial (e.g., drop-cast AuNPs or graphene solution) onto the electrode surface and allow it to dry. This step increases the electroactive surface area and enhances electron transfer.
- Step 3: Enzyme Immobilization. Prepare a solution of AChE in PBS. Apply a precise volume (e.g., 5-10 µL) of the enzyme solution onto the modified electrode surface.
- Step 4: Cross-linking. To stabilize the enzyme layer, expose the electrode to vapor or a solution of a cross-linker like glutaraldehyde for a fixed time. Wash the electrode thoroughly with PBS to remove any unbound enzyme or cross-linker.
3. Measurement and Inhibition Procedure:
- Step 1: Baseline Activity Measurement. Place the modified electrode in an electrochemical cell containing PBS and a known concentration of the substrate (e.g., ATCh). Measure the amperometric current generated by the enzymatic production of thiocholine over time. This current (I₀) represents the baseline enzyme activity.
- Step 2: Incubation with Sample. Incubate the biosensor in a solution containing the target pesticide (sample) for a fixed period (e.g., 10-15 minutes). Pesticides will inhibit the AChE enzyme.
- Step 3: Inhibited Activity Measurement. After incubation, wash the electrode and measure the amperometric current (Iᵢ) again under the same conditions as in Step 1.
- Step 4: Data Analysis. Calculate the percentage of enzyme inhibition using the formula: % Inhibition = [(I₀ - Iᵢ) / I₀] × 100. The % inhibition is proportional to the pesticide concentration in the sample, which can be quantified using a pre-established calibration curve.
Protocol: Development of an Electrochemical Aptasensor for Carbendazim Detection
This protocol outlines the steps for creating a highly sensitive aptasensor for the fungicide carbendazim (CBZ), based on a signal-on strategy using a dual-aptamer approach and nanomaterials [24].
1. Reagents and Materials:
- Carbendazim-specific aptamer (CBZA) sequence.
- Thiol-modified complementary DNA sequence (SH-cCBZA).
- Gold Nanoparticles (Au NPs), Graphene Nanoribbons.
- Zirconium-based Metal-Organic Framework (MOF-808).
- Methylene blue (MB) or another suitable redox probe.
- Tris-EDTA buffer or PBS for preparing DNA solutions.
2. Sensor Fabrication:
- Step 1: Electrode Modification with Nanomaterials. Prepare a composite of graphene nanoribbons and MOF-808. Deposit this composite onto the surface of a clean glassy carbon electrode. Subsequently, electrodeposit Au NPs onto this modified surface to create a platform with high conductivity and surface area.
- Step 2: Immobilization of Complementary DNA. The SH-cCBZA is immobilized onto the Au NP-modified electrode via the strong Au–S bond formation. Incubate the electrode with the SH-cCBZA solution overnight.
- Step 3: Hybridization with Aptamer. Incubate the electrode with the CBZA, which is labeled with a methylene blue (MB) redox tag. The CBZA will hybridize with the surface-bound SH-cCBZA, forming a rigid double-stranded DNA (dsDNA) structure. This brings the MB label close to the electrode surface, but may result in a specific initial current signal.
3. Detection of Carbendazim:
- Step 1: Signal-on Detection. Expose the fabricated aptasensor to a sample solution containing CBZ. The CBZ has a higher affinity for the CBZA than the complementary DNA. It will bind to the aptamer, causing the dehybridization and release of the CBZA-MB complex from the electrode surface.
- Step 2: Signal Measurement. This displacement leads to a measurable change in the electrochemical signal (e.g., an increase in the voltammetric current of MB). The change in signal intensity is directly proportional to the concentration of CBZ in the sample.
- Step 3: Quantification. Record the differential pulse voltammetry (DPV) signals before and after exposure to CBZ. Plot the change in peak current against the logarithm of CBZ concentration to generate a calibration curve for quantitative analysis.
Signaling Pathways and Workflows
Figure 1. Generalized workflow of a biosensor for pesticide detection, illustrating the sequence from sample introduction to quantitative readout.
Figure 2. Comparative operational mechanisms of enzyme-based, aptamer-based, and antibody-based biosensors for pesticide detection.
The Scientist's Toolkit: Research Reagent Solutions
Table 3: Essential Materials and Reagents for Biosensor Development
| Item Name | Function/Application | Brief Description |
|---|---|---|
| Acetylcholinesterase (AChE) | Enzyme Inhibition Biosensors | Key enzyme whose inhibition is measured for detecting organophosphate and carbamate pesticides [22]. |
| Gold Nanoparticles (Au NPs) | Electrode Nanomodification | Enhance conductivity, provide high surface area for bioreceptor immobilization (e.g., via Au-S bonds), and improve sensitivity [25] [24]. |
| Screen-Printed Electrodes (SPEs) | Disposable Sensor Platform | Low-cost, mass-producible electrodes ideal for single-use, on-field biosensing devices [22]. |
| Specific Aptamer Sequences | Aptasensor Biorecognition | Synthetic oligonucleotides selected for high-affinity binding to specific pesticide targets like carbendazim [24]. |
| Molecularly Imprinted Polymers (MIPs) | Synthetic Receptors | Robust, polymer-based artificial receptors with tailored cavities for specific pesticide molecules [23]. |
| Carbendazim (CBZ) Standard | Analytical Standard & Calibration | Pure analyte used for method development, validation, and creating calibration curves [24]. |
| Glutaraldehyde | Cross-linking Agent | Used to create stable covalent bonds for immobilizing biological elements (e.g., enzymes) onto sensor surfaces [22]. |
Application Notes: Nanomaterials for Enhanced Biosensing in Pesticide Detection
The integration of nanomaterials into biosensing platforms has revolutionized the detection of pesticides, offering significant improvements in sensitivity, specificity, and operational efficiency. These enhancements are critical for monitoring environmental and food safety in agricultural contexts.
Quantum Dots (QDs)
Quantum dots are semiconductor nanocrystals (typically 1-10 nm) with size-tunable fluorescence properties, making them powerful signal transducers in biosensors.
- Key Applications: QDs serve as the fluorescent sensing element in probes for pesticides and other analytes. Their broad excitation spectra and narrow, confined emission spectra enable highly sensitive detection.
- Performance in Pesticide Detection: A fluorescence sensor utilizing Molybdenum Disulfide Quantum Dots (MoS₂ QDs) and CdTe QDs was developed for detecting tetracycline, demonstrating the principle of using QDs for contaminant sensing [26]. Furthermore, Pd-doped CdTe QDs have been specifically applied for the detection of the pesticide diazinon in environmental water samples, with a reported linear detection range of 2.3–100 μM [26].
- Advantages: Their high quantum yield and resistance to photobleaching provide a stable and intense signal, which is crucial for detecting low pesticide concentrations [26].
Metal Nanoparticles (e.g., Gold and Silver)
Metal nanoparticles, particularly gold (Au) and silver (Ag), are widely used due to their exceptional optical and electrical properties, which are leveraged in various sensing modalities.
- Key Applications:
- Colorimetric Sensors: Their unique surface plasmon resonance (SPR) signals in the visible spectrum cause visible color changes upon binding with target molecules [27].
- Impedimetric Sensors: They increase the electrode surface area and facilitate electron transfer, improving sensitivity [28].
- SERS Substrates: They significantly enhance Raman signals for trace-level detection. A sandwich-like substrate (MXene@AuNP@MXene@TC) enabled the direct, in-situ detection of the pesticide thiram on curved fruit surfaces at a concentration of 0.02 μg/cm² [29].
- Advantages: Gold nanoparticles, in particular, are valued for their biocompatibility, ease of functionalization with biomolecules (e.g., antibodies, enzymes), and high stability [28].
Carbon-Based Nanomaterials (Carbon Nanotubes and Graphene Oxide)
Carbon-based nanomaterials, including carbon nanotubes (CNTs) and graphene oxide (GO), offer high electrical conductivity and a large surface area, making them ideal for electrochemical biosensors.
- Key Applications:
- Electrochemical Biosensors: These materials are used to modify working electrodes, enhancing the electron transfer kinetics and providing a large platform for immobilizing biorecognition elements [28] [27].
- Specific Pesticide Detection: GO-based biosensors have been extensively developed for pesticide analysis using techniques such as electrochemical, SPR, and FRET-based platforms [27]. A graphene-modified screen-printed immunosensor demonstrated highly sensitive detection of parathion [30].
- Advantages: Their high mechanical strength and excellent electrical conductivity, combined with the possibility of easy functionalization, make them far more desirable than conventional materials for electrochemical biosensors [28].
Table 1: Performance Comparison of Nanomaterial-Based Biosensors in Pesticide Detection
| Nanomaterial | Target Pesticide/Analyte | Detection Technique | Linear Range / LOD | Real Sample Matrix |
|---|---|---|---|---|
| Pd-doped CdTe QDs [26] | Diazinon | Fluorescence | 2.3–100 μM | Environmental Water |
| MXene@AuNP substrate [29] | Thiram | SERS | 0.02 μg/cm² | Fruit Surfaces |
| Graphene-based sensor [30] | Parathion | Electrochemical (Impedimetric) | Highly Sensitive | - |
Table 2: Core Properties and Suitability for Biosensing of Different Nanomaterials
| Nanomaterial | Key Properties | Primary Role in Biosensor | Advantages for Pesticide Detection |
|---|---|---|---|
| Quantum Dots (QDs) | Tunable fluorescence, high quantum yield, broad excitation | Fluorescent transducer / Label | High sensitivity, multiplexing capability, signal brightness |
| Metal Nanoparticles (Au, Ag) | Surface Plasmon Resonance (SPR), high conductivity, biocompatibility | Colorimetric transducer, SERS substrate, electrode modifier | Visual detection, high enhancement factors, versatile functionalization |
| Carbon Nanotubes (CNTs) | High aspect ratio, excellent electrical conductivity, large surface area | Electrode modifier, signal amplifier | Enhanced electron transfer, high biomolecule loading |
| Graphene Oxide (GO) | Large 2D surface area, tunable oxygen moieties, good dispersibility | Electrode modifier, quencher in FRET assays | Improves sensitivity and limits of detection, versatile platform |
Experimental Protocols
Protocol: Impedimetric Biosensor for Pesticide Detection Using Nanomaterial-Modified Electrodes
This protocol details the development of an electrochemical impedimetric biosensor, functionalized with nanomaterials, for the specific detection of organophosphate pesticides.
1. Reagents and Materials
- Working Electrode: Glassy carbon electrode (GCE) or gold electrode.
- Nanomaterials: Graphene oxide (GO) dispersion or multi-walled carbon nanotubes (MWCNTs).
- Biorecognition Element: Acetylcholinesterase (AChE) enzyme.
- Crosslinker: Glutaraldehyde or 1-Ethyl-3-(3-dimethylaminopropyl)carbodiimide (EDC) with N-Hydroxysuccinimide (NHS).
- Electrochemical Probe: 5mM Potassium ferricyanide/ferrocyanide, [Fe(CN)₆]³⁻/⁴⁻ in PBS.
- Pesticide Standard: Chlorpyrifos or parathion for analysis.
2. Equipment
- Electrochemical Workstation with EIS capability.
- Scanning Electron Microscope (SEM) or Atomic Force Microscope (AFM) for surface characterization.
3. Step-by-Step Procedure Step 1: Electrode Pretreatment
- Polish the bare GCE with alumina slurry (0.3 and 0.05 μm) on a microcloth to create a uniform surface.
- Rinse thoroughly with deionized water and dry under a nitrogen stream.
Step 2: Electrode Modification with Nanomaterials
- Prepare a homogeneous dispersion of GO (1 mg/mL) in distilled water via ultrasonication for 30 minutes.
- Deposit 5-10 μL of the GO dispersion onto the polished surface of the GCE and allow it to dry at room temperature, forming a GO-modified electrode (GO/GCE).
Step 3: Immobilization of Acetylcholinesterase (AChE)
- Activate the GO/GCE surface by applying a mixture of EDC and NHS (40mM/10mM) for 30 minutes to form amine-reactive esters.
- Rinse the electrode gently with PBS (pH 7.4).
- Incubate the activated electrode with 10 μL of AChE solution (50 mU/μL) for 2 hours at 4°C, allowing covalent bonding between the enzyme and the functionalized surface.
- Rinse with PBS to remove any unbound enzyme. The biosensor (AChE/GO/GCE) is now ready for use.
Step 4: Electrochemical Impedance Spectroscopy (EIS) Measurements
- Prepare a solution of 5mM [Fe(CN)₆]³⁻/⁴⁻ in 0.1M PBS.
- Assemble the three-electrode system: AChE/GO/GCE as the working electrode, Ag/AgCl as reference, and a platinum wire as counter electrode.
- Immerse the electrodes in the electrochemical probe solution.
- Run EIS with a sinusoidal signal of 10 mV amplitude over a frequency range of 0.1 Hz to 100 kHz.
- Record the Nyquist plot. The diameter of the semicircle corresponds to the charge transfer resistance (Rₑₜ).
Step 5: Inhibition Assay for Pesticide Detection
- Incubate the AChE/GO/GCE biosensor in a sample solution containing the target pesticide (e.g., chlorpyrifos) for 10-15 minutes.
- Wash the electrode with PBS to stop the inhibition reaction.
- Perform EIS measurement again as in Step 4.
- The pesticide, by inhibiting AChE, hinders the enzymatic activity and increases the Rₑₜ. The percentage increase in Rₑₜ is proportional to the pesticide concentration.
4. Data Analysis
- Fit the EIS data to a Randles equivalent circuit to extract the Rₑₜ value.
- Plot the Rₑₜ or the normalized signal (Rₑₜ/Rₑₜ₀) against the logarithm of pesticide concentration to generate a calibration curve.
- The limit of detection (LOD) can be calculated based on the signal from blank samples plus three times the standard deviation.
Protocol: Fluorescent Biosensor for Pesticide Detection using Doped Quantum Dots
This protocol describes a fluorescence-based sensing strategy for pesticides using doped quantum dots.
1. Reagents and Materials
- Quantum Dots: Palladium-doped CdTe QDs (Pd-CdTe QDs).
- Target Pesticide: Diazinon standard.
- Buffer: Phosphate Buffered Saline (PBS), pH 7.4.
2. Equipment
- Fluorescence Spectrophotometer.
- Ultrasonic bath.
3. Step-by-Step Procedure Step 1: Synthesis of Pd-CdTe QDs (Modified from Literature)
- Synthesize TGA-capped CdTe QDs using a hydrothermal method.
- Dope the CdTe QDs with Palladium ions by adding a Pd salt precursor to the synthesis mixture and heating.
Step 2: Fluorescence Quenching Assay
- Prepare a stable dispersion of Pd-CdTe QDs in PBS.
- In a series of cuvettes, add a fixed volume of the QD dispersion.
- Spike the cuvettes with increasing concentrations of diazinon (standard solutions).
- Bring all samples to the same final volume with PBS and mix thoroughly.
- Allow the interaction between the QDs and diazinon to proceed for a fixed time (e.g., 10 minutes) at room temperature.
Step 3: Fluorescence Measurement
- Set the fluorescence spectrophotometer excitation wavelength to the optimal point for the QDs (e.g., 350 nm).
- Record the fluorescence emission spectrum for each sample, noting the intensity at the characteristic emission peak (e.g., ~560 nm).
4. Data Analysis
- Plot the fluorescence intensity (F) or the quenching efficiency ((F₀-F)/F₀) against the concentration of diazinon.
- F₀ is the fluorescence intensity in the absence of diazinon.
- The linear range of the sensor can be determined from this plot, which for Pd-CdTe QDs and diazinon has been reported as 2.3–100 μM [26].
Experimental Workflow for an Impedimetric Biosensor
The Scientist's Toolkit: Essential Research Reagents and Materials
Table 3: Key Research Reagent Solutions for Nanomaterial-Based Biosensor Development
| Item Name | Function/Application | Brief Explanation |
|---|---|---|
| Acetylcholinesterase (AChE) | Biorecognition Element | Enzyme whose inhibition by organophosphate pesticides is the basis for detection in many biosensors [27] [30]. |
| EDC/NHS Crosslinker Kit | Surface Chemistry | Activates carboxyl groups on nanomaterials (e.g., GO, QDs) for covalent immobilization of biomolecules like enzymes or antibodies [26]. |
| Potassium Ferricyanide/Ferrocyanide | Electrochemical Probe | A standard redox couple used in EIS to characterize the electron transfer resistance at the electrode interface [28]. |
| Polyethylene Glycol (PEG) | Surface Passivation | Coats nanomaterials like QDs to prevent aggregation, improve stability, and reduce non-specific binding in complex media [26]. |
| Silane Coupling Agents | Surface Modification | Used to functionalize surfaces with specific reactive groups (amine, thiol) for anchoring nanomaterials or bioreceptors [26]. |
| HaloTag System | Chemogenetic FRET Pair | A self-labeling protein tag that can be covalently labeled with synthetic fluorophores, enabling the design of highly tunable FRET biosensors [31]. |
Functionalization of a Biosensor Nanoprobe
Cutting-Edge Biosensing Platforms and Their Practical Applications
Acetylcholinesterase (AChE) inhibition-based biosensors represent a significant technological advancement in the rapid detection of neurotoxic pesticides, addressing critical needs for environmental monitoring and food safety in agricultural research. These biosensors leverage the well-established mechanism whereby organophosphate (OP) and carbamate pesticides specifically inhibit AChE activity, providing a sensitive and rapid analytical platform that complements traditional chromatographic methods such as high-performance liquid chromatography and mass spectrometry [32] [33]. The fundamental advantage of these biosensor systems lies in their ability to provide real-time or rapid qualitative and quantitative information about pesticide residues with minimal sample preparation, making them particularly suitable for field-testing and on-site analysis [32] [33] [34].
The growing concern over pesticide residues in food and environmental samples has driven substantial research interest in developing cost-effective, practical diagnostic tools amenable to rapid screening [35]. While conventional laboratory-based methods provide high sensitivity and reliability, they involve time-consuming steps, require sophisticated instrumentation and trained personnel, and are not suitable for continuous monitoring or field applications [33] [35]. AChE-based biosensors have emerged as viable alternatives or complementary tools, offering simplicity, portability, and significant reduction in cost per analysis [32] [33].
This Application Note explores the mechanistic principles underlying AChE inhibition biosensors, details practical protocols for their implementation, and discusses recent advancements in the field, all within the context of a broader thesis on biosensors for pesticide detection in agricultural research.
Mechanism of AChE Inhibition by Pesticides
Fundamental Biochemical Principles
Acetylcholinesterase is a crucial enzyme in the nervous system of both insects and humans, responsible for hydrolyzing the neurotransmitter acetylcholine into choline and acetic acid, thereby terminating nerve impulse transmission at synaptic junctions [33] [36]. Organophosphate and carbamate pesticides exert their toxicity through covalent modification of the serine residue within the active site of AChE, leading to enzyme inhibition and subsequent accumulation of acetylcholine in the synaptic cleft [33] [37]. This biochemical disruption causes continuous nerve excitation, ultimately resulting in respiratory failure and death in target pests, but also poses potential risks to human health through exposure to contaminated food and environmental sources [33].
The inhibition mechanisms differ between these two pesticide classes. Organophosphates, typically esters, amides, or thiol derivatives of phosphoric, phosphonic, or phosphinic acids, undergo phosphorylation of the catalytic serine residue in the AChE active site, forming a stable, covalently phosphorylated enzyme that is generally hydrolyzed very slowly [33] [37]. Carbamates, featuring the carbamate ester functional group derived from carbamic acid, proceed through carbamylation of the same serine residue, resulting in a carbamylated enzyme that experiences relatively slower spontaneous reactivation compared to the phosphorylated complex [33]. The varying toxicity of these compounds depends significantly on their chemical structure and the stability of the inhibited enzyme complex [33].
Biosensing Principle
AChE-based biosensors exploit this inhibition mechanism for detection purposes. The general approach involves immobilizing AChE on a transducer surface and measuring its enzymatic activity before and after exposure to potential inhibitors [32] [36]. In the absence of pesticides, AChE hydrolyzes its substrate, producing electroactive or chromogenic products that generate a measurable signal. When pesticides are present, they inhibit AChE, reducing the rate of substrate hydrolysis and consequently decreasing the output signal in a concentration-dependent manner [32] [35] [38]. The degree of inhibition thus serves as an indicator of pesticide concentration in the sample.
Table 1: Comparison of Inhibition Mechanisms for Organophosphate and Carbamate Pesticides
| Characteristic | Organophosphate Pesticides | Carbamate Pesticides |
|---|---|---|
| Chemical Structure | Esters, amides, or thiol derivatives of phosphoric, phosphonic, or phosphinic acids | Esters of carbamic acid |
| Inhibition Mechanism | Phosphorylation of serine hydroxyl group in AChE active site | Carbamylation of serine hydroxyl group in AChE active site |
| Stability of Inhibited Complex | Highly stable, slow hydrolysis | Moderately stable, relatively slower spontaneous reactivation |
| Example Compounds | Parathion, malathion, chlorpyrifos, diazinon | Aldicarb, carbofuran, carbaryl, methomyl |
| Detection Limits Reported | 1.0×10^(-11) to 42.19 μM [32] | 1.0×10^(-11) to 1.0×10^(-2) μM [32] |
Figure 1: AChE Inhibition Biosensor Mechanism. Organophosphate (OP) and carbamate pesticides inhibit AChE, preventing substrate hydrolysis and reducing signal generation.
Performance Comparison of AChE-Based Biosensors
The analytical performance of AChE-based biosensors varies significantly depending on the transducer principle, enzyme source, immobilization method, and matrix effects. Recent developments have focused on enhancing sensitivity, stability, and selectivity while reducing analysis time and cost.
Table 2: Analytical Performance of Different AChE-Based Biosensor Platforms
| Transducer Type | Detection Principle | Linear Range | Detection Limit | Stability | References |
|---|---|---|---|---|---|
| Colorimetric | Ellman's assay: Thiocholine production measured at 412 nm | 1.0×10^(-11) - 1.0×10^(-2) μM | Varies by pesticide: 0.001-4 μg/mL | 2-120 days | [32] [34] [35] |
| Piezoelectric (QCM) | Mass change on crystal surface affecting resonance frequency | Not specified | 1×10^(-10) M (diisopropylfluorophosphate) | Not specified | [33] |
| Amperometric | Current from electrochemical oxidation of enzymatic products | Not specified | 0.6551 nM (chlorpyrifos) | Not specified | [38] |
| Photothermal | Thermal lens spectrometry detection of enzyme activity | Not specified | 0.2 ng/mL (paraoxon) | Not specified | [34] |
| Bioactive Paper | Color change on paper-based platform | Not specified | 6.16×10^(-4) mM (methomyl) | Not specified | [35] |
The sensitivity of these biosensors has been enhanced through various strategies, including the use of genetically modified AChE enzymes with increased sensitivity to specific inhibitors [37], incorporation of nanomaterials to improve electron transfer and enzyme immobilization [39] [38], and implementation of novel immobilization protocols to maintain enzyme stability and activity [35] [36]. These advancements have enabled detection limits approaching attomolar concentrations for some pesticides, rivaling traditional analytical methods in sensitivity while offering superior practicality for field applications [32].
Detection Methodologies and Signaling Principles
AChE-based biosensors employ diverse detection methodologies, each with distinct advantages and limitations for pesticide monitoring in agricultural research.
Colorimetric Detection
Colorimetric biosensors typically utilize the Ellman assay principle, where AChE hydrolyzes acetylthiocholine to produce thiocholine, which subsequently reacts with 5,5'-dithiobis(2-nitrobenzoic acid) (DTNB) to yield the yellow-colored 5-thio-2-nitrobenzoate anion, measurable at 412 nm [35]. In the presence of inhibitors, this color development is diminished proportionally to pesticide concentration. Recent advancements incorporate nanomaterials, including noble metal nanoparticles and nanozymes, to enhance sensitivity through phenomena such as localized surface plasmon resonance (LSPR) [39]. Nanoparticle-based systems often exploit aggregation-induced color changes – for instance, gold nanoparticles transitioning from red to purple upon aggregation – providing visual detection without instrumentation [39]. Paper-based colorimetric sensors offer particular advantages for field use, featuring low cost, portability, and disposability [35].
Electrochemical Detection
Electrochemical biosensors measure the current (amperometric) or potential (potentiometric) changes resulting from electrochemical reactions of products generated by AChE-catalyzed hydrolysis [36] [38]. A common approach involves monitoring the oxidation current of thiocholine produced from acetylthiocholine hydrolysis [38]. Recent developments employ novel electrode materials such as oxidative boron-doped diamond (OBDD), which provides exceptional sensitivity and stability, with demonstrated detection of chlorpyrifos at concentrations as low as 0.6551 nM [38]. Nanomaterial integration, including carbon nanotubes, graphene, and metal nanoparticles, further enhances electron transfer efficiency and enzyme immobilization capacity, significantly improving sensor performance [36] [38].
Piezoelectric Detection
Piezoelectric biosensors, typically based on quartz crystal microbalance (QCM) technology, detect mass changes on the sensor surface resulting from AChE inhibition [33]. The resonance frequency of the piezoelectric crystal decreases proportionally to mass increase according to the Sauerbrey equation, allowing quantification of bound inhibitor molecules [33]. These label-free systems offer real-time monitoring capabilities and have demonstrated detection limits as low as 1×10^(-10) M for organophosphates like diisopropylfluorophosphate [33].
Emerging Detection Modalities
Recent innovations include photothermal biosensors that employ thermal lens spectrometry to detect enzymatic activity with high sensitivity, achieving detection of paraoxon at 0.2 ng/mL in less than 15 minutes [34]. Acoustic biosensors utilizing gas vesicle nanostructures that "light up" in ultrasound imaging in response to protease activity represent another emerging technology with potential for in vivo applications [40]. Additionally, nanozyme-based systems employing functional nanomaterials with enzyme-mimicking properties offer advantages including enhanced stability, adjustable catalytic activities, and simple synthesis protocols [39] [41].
Figure 2: AChE Biosensor Detection Methodologies. Different transducer principles convert AChE inhibition into measurable signals for pesticide detection.
Experimental Protocols
Protocol 1: Colorimetric Paper-Based Biosensor for Pesticide Screening
This protocol describes the fabrication and application of a bioactive paper-based sensor for rapid detection of organophosphate and carbamate pesticides, adapted from the method described in [35].
5.1.1 Reagents and Materials
- Acetylcholinesterase (AChE) from electric eel or recombinant source
- Chitosan (low molecular weight, 89% deacetylation)
- Glutaraldehyde (25% in H₂O)
- Acetylthiocholine iodide (ATChI)
- 5,5'-dithiobis(2-nitrobenzoic acid) (DTNB)
- Phosphate buffer (0.1 M, pH 7.0 and 8.0)
- Whatman No. 1 filter paper or chromatography paper
- Pesticide standards (e.g., methomyl, profenofos)
- Deionized water
5.1.2 Sensor Fabrication
- Prepare chitosan solution (2% w/v) by dissolving chitosan flakes in 0.5% aqueous acetic acid with stirring. Adjust pH to approximately 6.0 using NaOH.
- Prepare enzyme-gel mixture by combining 1 mL chitosan solution, 20 μL AChE (specific activity ~500 nmoles ATChI hydrolyzed/mg protein/min), 50 μL DTNB (10 mM in pH 8.0 phosphate buffer), and 10 μL glutaraldehyde (0.25%).
- Cut paper into 1 × 10 cm strips and autoclave at 120°C for 25 minutes for sterilization.
- Apply enzyme-gel mixture onto paper strips using a micropipette or painting brush, creating a uniform 1 × 1 cm sensing zone.
- Dry the modified paper strips at 35°C for 15 minutes.
- Store prepared sensors at 4°C in sealed containers with desiccant until use.
5.1.3 Assay Procedure
- Prepare standard solutions of target pesticides in appropriate solvents (e.g., ethanol) followed by dilution with distilled water.
- Dip the sensing zone of the paper strip into the sample solution for 5 minutes to allow inhibitor-enzyme interaction.
- Remove the strip from sample solution and briefly dip into distilled water to remove unbound compounds.
- Immerse the strip into ATChI solution (75 mM in distilled water) for 2 minutes to initiate enzymatic reaction.
- Observe color development: yellow color indicates AChE activity, while reduced color intensity indicates inhibition.
- Quantify color intensity using a desktop scanner or smartphone camera with image analysis software measuring RGB values.
5.1.4 Data Analysis
- Capture images of sensing zones under standardized lighting conditions.
- Extract RGB values using ImageJ or similar software.
- Calculate inhibition percentage using the formula: % Inhibition = [(Acontrol - Asample) / Acontrol] × 100 where Acontrol and A_sample represent absorbance or color intensity values for control and sample, respectively.
- Generate calibration curves by plotting % inhibition versus pesticide concentration.
Protocol 2: Amperometric Biosensor for Chlorpyrifos Detection
This protocol details the construction of an amperometric biosensor for sensitive detection of chlorpyrifos using an oxidative boron-doped diamond (OBDD) electrode, based on the method described in [38].
5.2.1 Reagents and Materials
- Oxidative boron-doped diamond (OBDD) electrode
- Acetylcholinesterase (AChE)
- Magnetic beads (streptavidin-functionalized)
- Biotinylation kit
- Acetylthiocholine chloride (ATCl)
- Chlorpyrifos standard
- Phosphate buffer (50 mM, pH 7.6)
- Ethanol and deionized water
5.2.2 Electrode Modification and Enzyme Immobilization
- Clean OBDD electrode sequentially in acetone, ethanol, and deionized water using ultrasonic bath for 5 minutes each.
- Biotinylate AChE according to manufacturer's protocol.
- Immobilize biotinylated AChE onto streptavidin-functionalized magnetic beads by incubating 250 mU AChE with 1 mg magnetic beads in 1 mL phosphate buffer (50 mM, pH 7.6) for 1 hour at room temperature with gentle mixing.
- Separate AChE-modified magnetic beads using a magnet and wash twice with phosphate buffer to remove unbound enzyme.
- Apply 10 μL of AChE-modified magnetic bead suspension to OBDD electrode surface and allow to dry at room temperature for 30 minutes.
5.2.3 Electrochemical Measurement
- Assemble electrochemical cell with modified OBDD electrode as working electrode, Ag/AgCl reference electrode, and platinum counter electrode.
- Connect to potentiostat and set parameters for cyclic voltammetry (scan range: 0 to +1.0 V vs. Ag/AgCl, scan rate: 50 mV/s).
- Incubate modified electrode in sample solution containing potential chlorpyrifos for 30 minutes inhibition time.
- Transfer electrode to electrochemical cell containing 50 mM phosphate buffer (pH 7.6) and 1 mM ATCl.
- Record cyclic voltammograms and measure oxidation peak current of thiocholine at approximately +0.804 V vs. Ag/AgCl.
- For quantification, measure current decrease relative to control (uninhibited enzyme).
5.2.4 Data Analysis
- Measure oxidation peak current for thiocholine.
- Calculate percentage inhibition: % Inhibition = [(Icontrol - Isample) / Icontrol] × 100 where Icontrol and I_sample represent peak currents for control and sample, respectively.
- Plot calibration curve of % inhibition versus chlorpyrifos concentration (0.001-10 nM range).
- Determine unknown concentrations from calibration curve using regression equation.
The Scientist's Toolkit: Essential Research Reagents and Materials
Table 3: Key Research Reagent Solutions for AChE Inhibition Biosensors
| Reagent/Material | Function/Application | Examples/Specifications |
|---|---|---|
| Acetylcholinesterase (AChE) | Biological recognition element; catalyzes substrate hydrolysis | Commercial sources (electric eel, bovine); recombinant enzymes; genetically modified variants for enhanced sensitivity |
| Enzyme Substrates | Generate measurable products upon enzymatic hydrolysis | Acetylthiocholine iodide/chloride (for electrochemical); acetylthiocholine iodide with DTNB (for colorimetric) |
| Chromogenic Reagents | Produce color signal for visual or spectrophotometric detection | DTNB (Ellman's reagent); produces yellow 5-thio-2-nitrobenzoate (412 nm) |
| Immobilization Matrices | Provide support for enzyme stabilization and retention | Chitosan; alginate; carboxymethyl cellulose; sol-gel composites; nanoporous carbon |
| Transducer Materials | Convert biological event to measurable signal | Screen-printed electrodes; boron-doped diamond; gold nanoparticles; quartz crystals; paper substrates |
| Nanomaterials | Enhance sensitivity and signal amplification | Carbon nanotubes; graphene; metal nanoparticles; magnetic beads |
| Crosslinking Agents | Stabilize immobilized enzymes | Glutaraldehyde; bis(sulfosuccinimidyl) suberate |
| Buffer Systems | Maintain optimal pH for enzymatic activity | Phosphate buffer (pH 7.0-8.0); Tris-HCl |
Acetylcholinesterase inhibition-based biosensors represent powerful analytical tools that effectively address the need for rapid, sensitive, and cost-effective detection of organophosphate and carbamate pesticides in agricultural research. These biosensing platforms leverage well-established biochemical principles while incorporating advancements in materials science, nanotechnology, and transducer design to achieve performance characteristics that complement or surpass traditional analytical methods in specific applications. The protocols and methodologies detailed in this Application Note provide researchers with practical frameworks for implementing these biosensors in various contexts, from laboratory analysis to field-based screening.
Future developments in AChE-based biosensing will likely focus on enhancing multiplexing capabilities for simultaneous detection of multiple pesticides, improving stability and reproducibility for commercial applications, and integrating digital technologies such as smartphone-based readout and artificial intelligence for data interpretation [39] [37]. Additionally, the exploration of novel enzyme sources, including genetically engineered AChE variants with tailored sensitivity and selectivity profiles, promises to further expand the applications and performance of these biosensing platforms in agricultural safety monitoring and environmental protection.
The extensive use of pesticides in modern agriculture is crucial for protecting crops and ensuring global food security. However, the improper or excessive application of these chemicals leads to persistent residues in food products and the environment, posing significant risks to human health and ecosystems [17] [42]. Conventional methods for pesticide detection, such as gas chromatography (GC) and high-performance liquid chromatography (HPLC), offer high accuracy but are expensive, time-consuming, and require specialized equipment and trained personnel, making them unsuitable for rapid, on-site screening [43] [12] [17].
In response to these limitations, biosensor technology has emerged as a powerful alternative. Immunosensors and aptasensors represent two prominent classes of biosensors that utilize high-affinity recognition elements—antibodies and aptamers, respectively—for specific pesticide targeting [43] [12]. These devices integrate biological recognition with transducers that convert binding events into measurable signals, enabling rapid, sensitive, and selective detection of pesticide residues [44] [12]. This article details the fundamental principles, experimental protocols, and key applications of these sensors within the broader context of advancing agricultural biosensing research.
Fundamental Principles and Recognition Elements
Immunosensors: Antibody-Based Recognition
Immunosensors are affinity-based biosensors that rely on the specific immunochemical reaction between an antibody (Ab) and its target antigen (Ag), which in this context is the pesticide molecule or a derivative thereof [44] [45]. The formation of a stable antigen-antibody complex on a transducer surface generates a detectable signal. Immunosensors can be broadly classified into two categories based on their detection format: label-free and labeled systems [44] [45].
- Label-free immunosensors directly measure the physical changes (e.g., mass, refractive index) induced by the immunocomplex formation. While they reduce preparation time and cost, they can be susceptible to non-specific adsorption, which may affect sensitivity [45].
- Labeled immunosensors utilize detectable labels (e.g., enzymes, fluorophores, electroactive molecules, nanomaterials) to generate the signal. Although more complex, they often provide higher sensitivity and versatility and are less affected by non-specific binding [44] [45].
Furthermore, the assay format is determined by the molecular size of the analyte. For small molecules like most pesticides, which have a low molecular weight and a single epitope, a competitive assay format is typically employed. In this format, the pesticide in the sample competes with a labeled pesticide analog for a limited number of antibody binding sites. The resulting signal is inversely proportional to the pesticide concentration in the sample [45].
Aptasensors: Aptamer-Based Recognition
Aptasensors utilize aptamers as biorecognition elements. Aptamers are short, single-stranded DNA or RNA oligonucleotides that are selected in vitro through a process called Systematic Evolution of Ligands by EXponential enrichment (SELEX) to bind specific targets with high affinity and specificity [46]. They are often termed "chemical antibodies" but offer several advantages, including superior stability, ease of chemical modification and synthesis, and the ability to target molecules for which antibodies are difficult to produce [43] [46] [47]. Upon binding to their target pesticide, aptamers often undergo a conformational change, which can be directly transduced into a measurable signal.
The following diagram illustrates the SELEX process for selecting pesticide-specific aptamers.
Transduction Mechanisms
Both immunosensors and aptasensors can be coupled with various transduction methods to convert the binding event into a quantifiable output. The most common types include:
- Electrochemical Transducers: Measure electrical changes (current, potential, impedance) due to the immunoreaction or aptamer-target binding. They are highly sensitive, low-cost, and easily miniaturized for portability [44] [12] [48].
- Optical Transducers: Measure changes in light properties (e.g., absorbance, fluorescence, refractive index). Surface Plasmon Resonance (SPR) and evanescent wave sensors are examples used for label-free detection, though sensitivity for small molecules can be a challenge [44] [49].
- Piezoelectric Transducers: Measure changes in the frequency of a quartz crystal resonator due to the mass load from the binding of target molecules [44] [45].
Research Reagent Solutions: A Toolkit for Sensor Development
The following table summarizes key reagents and materials essential for fabricating and operating pesticide-targeting immunosensors and aptasensors.
Table 1: Essential Research Reagents and Materials for Immunosensor and Aptasensor Development
| Category | Specific Example | Function in Sensor Design |
|---|---|---|
| Recognition Elements | Monoclonal Antibodies (e.g., anti-OPs-McAb, Glyphosate antibody) [12] | High-specificity capture probes for immunoassays; often used in competitive formats for pesticides. |
| DNA/RNA Aptamers (e.g., against acetamiprid) [12] [42] | Synthetic bioreceptors; binding induces conformational change for signal generation. | |
| Molecularly Imprinted Polymers (MIPs) (e.g., for 2,4-D) [43] [42] | Biomimetic artificial receptors with tailor-made binding cavities for pesticides. | |
| Enzymatic Labels | Acetylcholinesterase (AChE) [12] | Enzyme used for indirect detection of organophosphate and carbamate pesticides via enzyme inhibition assays. |
| Horseradish Peroxidase (HRP), Glucose Oxidase [44] | Common enzyme labels for signal amplification in labeled immunosensors and aptasensors. | |
| Nanomaterials | Gold Nanoparticles (AuNPs) [45] | Used for signal amplification, electrode modification, and as carriers for labels. |
| Graphene Oxide, Carbon Nanotubes (CNTs) [12] [42] | Enhance electrical conductivity in electrochemical sensors and provide large surface area for bioreceptor immobilization. | |
| Metal-Oxide Nanoparticles (e.g., Fe3O4) [47] [42] | Used for magnetic separation and as nanozymes (possessing enzyme-like activity) for signal catalysis. | |
| Blocking Agents | Bovine Serum Albumin (BSA), Casein [45] | Used to passivate unused sensor surface areas to minimize non-specific adsorption. |
Representative Experimental Protocols
Protocol: Fabrication of an Electrochemical Competitive Immunosensor for Glyphosate
This protocol outlines the steps for developing a competitive immunosensor using an antibody-functionalized electrode for the detection of the herbicide glyphosate [12] [45].
Principle: Glyphosate in the sample competes with a glyphosate-enzyme conjugate (e.g., glyphosate-HRP) for binding sites on an immobilized anti-glyphosate antibody. The enzyme activity, measured electrochemically, is inversely proportional to the glyphosate concentration.
Materials:
- Electrochemical workstation and screen-printed or glassy carbon electrodes.
- Glyphosate-specific monoclonal antibody.
- Glyphosate-HRP conjugate.
- Blocking buffer: 1% BSA in phosphate-buffered saline (PBS).
- Washing buffer: PBS with 0.05% Tween 20 (PBST).
- Electrochemical substrate: e.g., TMB/H2O2.
Procedure:
- Electrode Modification: Clean the working electrode surface. Modify it with a conductive nanomaterial (e.g., graphene oxide or AuNPs) to increase surface area and conductivity.
- Antibody Immobilization: Covalently immobilize the anti-glyphosate antibody onto the modified electrode surface. This can be achieved via EDC/NHS chemistry or through affinity-based binding to a pre-formed layer (e.g., Protein A).
- Blocking: Incubate the electrode with 1% BSA solution for 1 hour at room temperature to block any non-specific binding sites. Rinse thoroughly with washing buffer.
- Competitive Incubation: Co-incubate the antibody-modified electrode with a mixture containing the sample (or glyphosate standard) and a fixed concentration of the glyphosate-HRP conjugate for 30 minutes. The glyphosate and the conjugate compete for the limited antibody binding sites.
- Washing: Wash the electrode rigorously with PBST to remove unbound molecules.
- Electrochemical Measurement: Transfer the electrode to an electrochemical cell containing the substrate. Apply a suitable potential and measure the amperometric current generated by the enzymatic reaction (e.g., HRP reducing H2O2). The current signal decreases with increasing glyphosate concentration.
- Calibration: Plot the measured current against the logarithm of glyphosate concentration to generate a calibration curve.
The following workflow visualizes the key steps of this competitive immunosensor protocol.
Protocol: Development of a Label-free Electrochemical Aptasensor for Acetamiprid
This protocol describes the creation of a label-free aptasensor that exploits the conformational change of an aptamer upon binding the neonicotinoid insecticide acetamiprid [12] [42].
Principle: A acetamiprid-specific aptamer is immobilized on a gold electrode. Before binding, the aptamer may have a flexible, single-stranded structure that allows a redox probe ([Fe(CN)6]3−/4−) to access the electrode surface. Upon target binding, the aptamer folds into a rigid structure, hindering electron transfer of the redox probe and increasing the electrochemical impedance.
Materials:
- Gold disk electrode or screen-printed gold electrode.
- Acetamiprid-specific DNA aptamer (thiol-modified at 5' or 3' end).
- Acetamiprid standards.
- Electrochemical impedance spectroscopy (EIS) setup.
- Redox probe: 5 mM [Fe(CN)6]3−/4− in PBS.
- MCH (6-mercapto-1-hexanol) for blocking.
Procedure:
- Electrode Pretreatment: Clean the gold electrode by polishing and electrochemical cycling in sulfuric acid.
- Aptamer Immobilization: Incubate the clean gold electrode with the thiol-modified aptamer solution overnight at 4°C. The thiol group forms a self-assembled monolayer on the gold surface.
- Surface Blocking: Treat the electrode with MCH solution for 1 hour to displace non-specifically adsorbed aptamers and create a well-aligned monolayer, minimizing non-specific binding.
- Baseline EIS Measurement: Record the EIS spectrum of the aptasensor in the redox probe solution. This gives the baseline charge transfer resistance (Rct).
- Target Binding and Measurement: Incubate the aptasensor with the sample/standard containing acetamiprid for a defined period. Wash gently. Record a new EIS spectrum under the same conditions.
- Data Analysis: The change in Rct (ΔRct) before and after incubation is correlated with the concentration of acetamiprid. A calibration curve is constructed by plotting ΔRct against the logarithm of acetamiprid concentration.
Performance Comparison and Analytical Data
The performance of recently reported biosensors for pesticide detection is summarized in the table below. The data highlights the sensitivity and applicability of different sensor designs.
Table 2: Analytical Performance of Selected Immunosensors and Aptasensors for Pesticide Detection
| Target Pesticide | Sensor Type / Bioreceptor | Transduction Method | Linear Range | Limit of Detection (LoD) | Ref. |
|---|---|---|---|---|---|
| Glyphosate | Immunosensor / Antibody | Electrochemical | 10 ng/mL – 50 µg/mL | 10 ng/mL | [12] |
| Glyphosate (in urine) | Immunosensor / Antibody | Electrochemical | 0.1 – 72 ng/mL | 0.1 ng/mL | [12] |
| Chlorpyrifos | Enzymatic Biosensor / AChE | Fluorescence | 20 pg/mL – 1000 ng/mL | 15.03 pg/mL | [12] |
| Methyl parathion | Enzymatic Biosensor / AChE | Electrochemical | 1 – 2 ppm | 0.48 ppb | [12] |
| Organophosphorus Pesticides | Enzymatic Biosensor / AChE | Electrochemical | 0.5 – 100 ng/mL | 0.18 ng/mL | [12] |
| Atrazine | Immunosensor / Antibody | Electrochemical | 10 fg/mL – 1 ng/mL | 1 fg/mL | [12] |
| 2,4-D | MIP-based Sensor | Electrochemical | 0.04 – 24 nM | 16 pM | [12] |
Immunosensors and aptasensors represent a paradigm shift in pesticide detection technology. Their core strength lies in the deployment of high-affinity, specific recognition elements—antibodies and aptamers—coupled with versatile transduction mechanisms that enable the rapid, sensitive, and selective quantification of pesticide residues. The experimental protocols and performance data outlined in this application note demonstrate the feasibility of these platforms for environmental and food safety monitoring. The ongoing integration of novel nanomaterials, such as nanozymes, and advanced data processing techniques like machine learning, is poised to further enhance the multiplexing capabilities, robustness, and field-deployability of these devices [12] [47] [42]. As research progresses, these biosensing strategies are expected to play an increasingly vital role in ensuring sustainable agricultural practices and protecting public health.
Microbial Whole-Cell Biosensors (MWCBs) represent a convergence of microbiology, synthetic biology, and analytical chemistry, creating living analytical devices for detecting food contaminants. These biosensors utilize engineered microorganisms as integrated sensing elements that generate a quantifiable signal in response to specific target analytes [50]. Their application in food safety has advanced significantly due to superior cost-effectiveness, environmental robustness, and the ability to report on bioavailable contaminant fractions compared to conventional analytical methods [51] [52].
The fundamental architecture of an MWCB consists of two core components: a sensing element and a reporting element, connected via a genetic circuit [51]. The sensing element, typically a transcription factor or riboswitch, recognizes the target contaminant. This interaction triggers a signal transduction pathway that modulates the expression of the reporting element, a reporter protein that generates a measurable optical, electrochemical, or other signal [51] [50]. This basic framework allows researchers to design bespoke biosensors for various pesticides and heavy metals threatening food safety.
A significant advantage of MWCBs is their self-replicating nature, which allows for inexpensive mass production and amplification of all sensing components through simple cell culture, bypassing the need for expensive purification of biological recognition elements like enzymes or antibodies [51]. Furthermore, their ability to maintain homeostasis provides a stable internal environment for recognition and signal transformation, granting them strong resistance to environmental interference and making them particularly suitable for analyzing complex food matrices [51].
Genetic Circuit Design and Signaling Pathways
The operational core of an MWCB is its genetically encoded circuit, which dictates its specificity, sensitivity, and performance characteristics.
Sensing Elements: Transcription Factors and Riboswitches
Sensing elements are the primary determinants of biosensor specificity. Transcription Factors (TFs) are proteins that bind to specific promoter sequences upstream of genes, regulating transcription. In biosensor design, a TF that undergoes a conformational change upon binding a target contaminant is employed. This change either activates or represses the transcription of a downstream reporter gene [51] [50]. For example, the MerR transcription factor is used for Hg²⁺ detection, while the MphR transcription factor can be engineered for macrolide detection [51].
Riboswitches are untranslated regions of mRNA that can adopt specific conformations to bind small molecules. Upon binding the target analyte, the riboswitch's structure changes, exposing or hiding the ribosome binding site, thereby activating or inhibiting the translation of the reporter protein mRNA [51]. This provides a post-transcriptional mechanism for sensing.
Signal Transduction and Reporting Elements
The signal generated by the sensing element is transduced into a measurable output via the reporting element. Common reporter systems include fluorescent proteins (e.g., GFP, RFP), luminescent proteins (e.g., bacterial Lux), and enzymes that produce colorimetric changes (e.g., LacZ β-galactosidase) [53] [51] [50]. The choice of reporter depends on the application: luminescence and fluorescence offer high sensitivity, while colorimetric changes can be visually inspected for field use [53].
The genetic circuit can be configured for either inducible or constitutive expression. For contaminant detection, inducible systems are most common. These can be based on positive regulation, where the analyte-TF complex binds a promoter to initiate reporter transcription, or negative regulation, where the analyte binding causes a repressor TF to dissociate from the promoter, allowing transcription to proceed [50].
Advanced Circuit Engineering
To enhance performance, basic genetic circuits can be refined using synthetic biology principles. Protein engineering techniques, such as truncation, chimerism, and site-directed mutagenesis, can modify the specificity and sensitivity of native transcription factors [51]. For instance, truncating the CadR transcription factor improved its specificity for cadmium and mercury over zinc [51].
Promoter engineering is used to tune the sensitivity and dynamic range of the biosensor response [54]. Furthermore, incorporating amplifier modules and logic gates (e.g., AND, OR) into the genetic circuit can amplify weak signals and create biosensors that respond only to specific combinations of contaminants, thereby improving selectivity and reducing false positives [53] [54]. An AND gate, for example, could require the simultaneous presence of two distinct contaminants to trigger a signal, which is useful for monitoring complex pollution patterns.
Experimental Protocol: Development and Deployment
This section provides a detailed protocol for constructing, calibrating, and applying a whole-cell biosensor for the detection of organophosphorus pesticides (OPs) in food samples.
Biosensor Construction and Cultivation
Materials:
- Chassis Organism: Escherichia coli MG1655 (non-pathogenic, well-characterized lab strain).
- Plasmid Vector: A standard synthetic biology plasmid (e.g., pSB1C3 from the BioBrick foundation) containing an origin of replication and a chloramphenicol resistance marker.
- Genetic Parts: The organophosphorus hydrolase (OPH) promoter or a promoter regulated by a transcription factor responsive to OPs [22]. The coding sequence for a reporter protein (e.g., Green Fluorescent Protein, GFP).
- Culture Media: Lysogeny Broth (LB) and LB agar plates supplemented with chloramphenicol (25 µg/mL).
Method:
- Circuit Assembly: Using standard molecular biology techniques (e.g., restriction digestion/ligation or Gibson assembly), clone the OPH-responsive promoter upstream of the GFP reporter gene in the plasmid vector.
- Transformation: Introduce the constructed plasmid into competent E. coli MG1655 cells via heat shock or electroporation.
- Selection and Cultivation: Spread the transformation mixture onto LB agar plates with chloramphenicol and incubate at 37°C for 16-24 hours. Select single colonies to inoculate liquid LB media with antibiotic and culture overnight at 37°C with shaking (200 rpm).
Sample Preparation and Detection Assay
Materials:
- Test Samples: Homogenized fruit or vegetable extracts.
- Positive Control: Standard solution of a target OP (e.g., parathion, methyl parathion).
- Negative Control: Sample extract from certified organic produce or pure buffer.
- Equipment: Microplate reader (capable of measuring fluorescence: excitation ~485 nm, emission ~510 nm), 96-well microtiter plates.
Method:
- Sensor Cell Preparation: Harvest the overnight sensor culture by centrifugation (4,000 x g, 5 min). Wash the cell pellet twice and resuspend in a suitable assay buffer (e.g., phosphate-buffered saline, PBS) to an optical density (OD₆₀₀) of 0.5.
- Sample Exposure:
- In a 96-well plate, add 180 µL of the sensor cell suspension to each well.
- Add 20 µL of the prepared sample extract, positive control, or negative control to the respective wells. Each sample should be tested in at least triplicate.
- Include a "buffer blank" well containing only sensor cells and buffer.
- Incubation and Measurement:
- Incubate the plate at 30°C with mild shaking for a defined period (e.g., 2 hours).
- Measure the fluorescence and OD₆₀₀ of each well using the microplate reader.
- Data Analysis:
- Normalize the fluorescence signal of each well by its OD₆₀₀ to account for cell density differences.
- Subtract the normalized signal of the buffer blank from all samples.
- Plot the normalized fluorescence against the log concentration of the positive control to generate a standard calibration curve.
- Interpolate the contaminant concentration in unknown samples from the standard curve.
Workflow Visualization
Applications and Performance Data in Food Safety
MWCBs have been successfully developed for a wide spectrum of food contaminants. Their performance is characterized by key metrics such as Limit of Detection (LOD), dynamic range, and response time, which vary based on the genetic design and target analyte.
Table 1: Performance of Representative Microbial Whole-Cell Biosensors for Food Contaminants
| Target Contaminant | Sensing Element / Mechanism | Reporter | Limit of Detection (LOD) | Dynamic Range | Response Time | Application Example |
|---|---|---|---|---|---|---|
| Hg²⁺, Cd²⁺ | MerR, CadR transcription factors [51] [54] | GFP / Lux | ~nM concentrations [54] | nM - µM [54] | 30 min - 2 hours [50] | Water & soil screening |
| Organophosphorus Pesticides (e.g., Parathion) | Acetylcholinesterase (AChE) inhibition or OPH promoter [22] | Electrochemical signal | As low as 1x10⁻¹¹ μM for some designs [22] | pM - nM [22] | Minutes to hours [22] | Fruit/vegetable extract analysis |
| Tetracyclines | TetR-TetA regulatory system [53] | RFP / Colorimetric | Not Specified | Not Specified | Not Specified | Milk & meat screening |
| Macrolides | Engineered MphR transcription factor [51] | Fluorescence | High sensitivity achieved [51] | Not Specified | Not Specified | Food quality control |
Recent advancements focus on multiplexing and miniaturization. Microfluidic-based whole-cell biosensors (MWCBs) are being developed to simultaneously monitor multiple contaminants by spatially segregating different sensor strains within a single chip [53]. The output can be a pattern of colored dots, with each row representing a different contaminant and the number of "ON" signals indicating the concentration [53]. Furthermore, the integration of MWCBs with portable devices like smartphones and hand-held electrochemical readers is a key step towards practical, on-site deployment for food safety monitoring [51] [20].
The Scientist's Toolkit: Essential Research Reagents
The development and application of MWCBs rely on a standardized toolkit of biological and analytical components.
Table 2: Essential Reagents and Materials for MWCB Research
| Item | Function/Description | Example Specifics |
|---|---|---|
| Chassis Cells | Robust, non-pathogenic host for genetic circuits. | E. coli MG1655, Bacillus subtilis, Pseudomonas putida [51] [50]. |
| Plasmid Vectors | Carriers for the genetic biosensor circuit. | Standard BioBrick vectors (e.g., pSB1C3) with antibiotic resistance markers [51]. |
| Reporter Genes | Generate measurable signal upon contaminant detection. | GFP (fluorescence), Lux (bioluminescence), LacZ (colorimetric) [53] [51] [50]. |
| Transcription Factors | Provide specificity by binding target analytes. | MerR (Hg²⁺), ZntR (Zn²⁺, Cd²⁺), TetR (tetracycline) [51] [54]. |
| Culture Media | Support growth and maintenance of sensor cells. | Lysogeny Broth (LB), M9 Minimal Media, with appropriate antibiotics [50]. |
| Microplate Reader | Instrument for high-throughput signal measurement. | Capable of detecting absorbance, fluorescence, and luminescence from 96- or 384-well plates. |
| Microfluidic Chips | Platform for multiplexed assays and sensor miniaturization. | PDMS-based devices with multiple reaction units [53]. |
Electrochemical biosensors have emerged as powerful analytical tools for the detection of pesticides in agricultural research, offering the high sensitivity required for trace-level analysis and the portability necessary for field-deployable devices. These sensors integrate a biological recognition element with an electrochemical transducer, converting a biological interaction into a quantifiable electrical signal. For pesticide detection, researchers primarily leverage enzymes, antibodies, and aptamers as biorecognition elements, which are coupled with amperometric, potentiometric, or impedimetric transducers. The escalating need for monitoring pesticide residues in crops, soil, and water to ensure food safety and environmental health has accelerated the development of these biosensors, providing a cost-effective and rapid alternative to conventional chromatographic methods like HPLC and GC-MS [12] [55]. This document outlines specific application notes and detailed experimental protocols for each major class of electrochemical biosensors, framed within a thesis investigating biosensors for pesticide detection.
Application Notes & Performance Data
The performance of electrochemical biosensors is quantified through key metrics such as Limit of Detection (LOD) and linear range, which are crucial for evaluating their suitability for specific applications. The following tables summarize recent advancements in this field.
Table 1: Performance Metrics of Electrochemical Biosensors for Pesticide Detection
| Transduction Method | Biorecognition Element | Target Pesticide(s) | Linear Range | Limit of Detection (LOD) | Reference |
|---|---|---|---|---|---|
| Potentiometric | Chlorella sp. / Alkaline Phosphatase (ALP) on ISFET | Acephate, Triazophos | 10⁻¹⁰ to 10⁻² M | 10⁻¹⁰ M | [56] |
| Amperometric | Acetylcholinesterase (AChE) | Organophosphorus (OP) pesticides | 0.5–100 ng/mL | 0.18 ng/mL | [12] |
| Impedimetric | Aptamer (on Pt NP microwires) | Acetamiprid | 10 pM to 100 nM | 1 pM | [57] |
| Impedimetric | Aptamer (on Pt NP microwires) | Atrazine | 100 pM to 1 μM | 10 pM | [57] |
| Amperometric | Acetylcholinesterase (AChE) | Methyl parathion | 1–2 ppm | 0.48 ppb | [12] |
Table 2: Key Research Reagent Solutions for Electrochemical Biosensor Development
| Reagent / Material | Function in Biosensor Assembly | Example Use Case |
|---|---|---|
| Ta₂O₅ ISFET | Ion-Sensitive Field-Effect Transducer; potentiometric sensing platform | Base transducer for Chlorella sp./ALP biosensor [56] |
| Gold Nanoparticles (Au NPs) | Enhances electrode conductivity; provides surface for aptamer immobilization (via Au-S bonds) | Used in voltammetric aptasensor for Carbendazim detection [24] |
| Platinum Nanoparticle (Pt NP) Microwires | Facilitates charge transfer; forms conductive bridges between electrodes | Core structure in impedimetric aptasensor for acetamiprid and atrazine [57] |
| Acetylcholinesterase (AChE) | Enzyme biorecognition element; inhibition by OPs and carbamates is measured | Amperometric biosensor for organophosphorus pesticides [12] |
| Specific Aptamer (e.g., for Acetamiprid) | Synthetic biorecognition element; binds target with high specificity and affinity | Immobilized on Pt NP microwires for selective impedimetric detection [57] |
| Methylene Blue | Redox label for signal generation in voltammetric/amperometric sensors | Label on aptamer in a carbendazim sensor; current change indicates binding [24] |
| Nafion | Ion-exchange polymer membrane; used to immobilize enzymes and reduce fouling | Used in AChE-based biosensors for pesticide detection in vegetable oils [58] |
Experimental Protocols
Protocol 1: Potentiometric ISFET-based Microalgal Biosensor for Organophosphorus Pesticides
This protocol details the fabrication and use of a portable biosensor using Chlorella sp. immobilized on a Ta₂O₅ Ion-Sensitive Field-Effect Transistor (ISFET) for detecting organophosphorus pesticides (OPPs) like acephate and triazophos. The detection mechanism is based on the pesticide-induced inhibition of alkaline phosphatase (ALP) enzyme activity, which is reflected by a change in the potentiometric signal [56].
Workflow Overview: The following diagram illustrates the key steps in the biosensor's operation, from sample introduction to signal measurement.
Materials:
- Biorecognition Element: Chlorella sp. (20 µL optimal volume) [56]
- Transducer: Ta₂O₅ ISFET
- Substrate Solution: 0.4 mL of Phenylphosphoric acid (PAA) analogue [56]
- Buffer: Appropriate physiological buffer (e.g., phosphate buffer saline, PBS)
- Reference Electrode: Ag/AgCl
Step-by-Step Procedure:
- Biosensor Preparation: Immobilize 20 µL of Chlorella sp. suspension onto the sensitive gate area of the Ta₂O₅ ISFET. The algae contain the alkaline phosphatase enzyme [56].
- Baseline Measurement: Immerse the biosensor in buffer and record the stable potentiometric baseline signal.
- Substrate Addition: Add 0.4 mL of the PAA substrate solution. The enzyme converts the substrate, producing ascorbic acid, which induces a measurable potential shift. Record this signal as the initial enzyme activity [56].
- Inhibition (Assay):
- For calibration: Incubate the biosensor with a standard solution of the target OPP (e.g., acephate) for a defined response time (optimized to 4 minutes) [56].
- For sample analysis: Incubate the biosensor with the prepared, filtered real sample (e.g., soil extract).
- Signal Measurement Post-Inhibition: After incubation, add the same amount of PAA substrate (0.4 mL) and measure the resulting potentiometric signal again.
- Quantification: The degree of signal reduction (compared to the initial activity) is inversely proportional to the OPP concentration in the sample. Quantify the pesticide concentration using a pre-established calibration curve.
Protocol 2: Impedimetric Aptasensor for Neonicotinoid Detection
This protocol describes the steps to develop a highly sensitive impedimetric biosensor using aptamers immobilized on platinum nanoparticle (Pt NP) microwires for the detection of pesticides like acetamiprid [57].
Workflow Overview: The diagram below outlines the fabrication of the sensing interface and the mechanism of impedimetric detection.
Materials:
- Transducer: Interdigitated Electrodes (IDEs) with bridged Pt NP microwires (fabricated via sputtering and e-beam lithography) [57].
- Biorecognition Element: Acetamiprid-specific aptamer (thiol-modified for covalent immobilization).
- Instrument: Potentiostat capable of Electrochemical Impedance Spectroscopy (EIS).
- Measurement Solution: A standard redox probe solution such as 5 mM [Fe(CN)₆]³⁻/⁴⁻ in PBS.
Step-by-Step Procedure:
- Sensor Fabrication:
- Microwire Formation: Deposit Pt NPs in a bridge-like arrangement between the fingers of the IDEs using sputtering and e-beam lithography techniques [57].
- Surface Functionalization: Chemically functionalize the surface of the Pt NP microwires to introduce reactive groups (e.g., carboxyl or amine groups).
- Aptamer Immobilization: Covalently attach the thiol-modified aptamers to the functionalized microwire surface.
- Baseline EIS Measurement: Record the EIS spectrum of the modified aptasensor in the redox probe solution over a frequency range (e.g., 0.1 Hz to 100 kHz) at a set DC potential. The charge transfer resistance (Rct) value obtained is the baseline.
- Incubation with Analyte: Expose the aptasensor to the sample solution containing the target pesticide (e.g., acetamiprid) for a specific incubation time (e.g., 10-30 minutes).
- EIS Measurement Post-Incubation: Wash the sensor gently with buffer to remove unbound molecules. Record the EIS spectrum again under the same conditions as step 2.
- Quantification: The binding of the target pesticide to the aptamer induces steric hindrance, increasing the Rct value. The change in Rct (ΔRct) is proportional to the pesticide concentration. Use a calibration curve of ΔRct vs. log(concentration) for quantification [57].
Protocol 3: Amperometric AChE-based Biosensor for Multi-Pesticide Screening
This protocol covers the construction and operation of a standard amperometric biosensor using Acetylcholinesterase (AChE) immobilized on a carbon-based working electrode. The detection is based on the inhibition of AChE by organophosphorus and carbamate pesticides [58] [12].
Workflow Overview: The diagram visualizes the enzymatic reaction and its inhibition, which is the core principle of this biosensor.
Materials:
- Biorecognition Element: Acetylcholinesterase (AChE from electric eel).
- Transducer: Three-electrode system: AChE-modified working electrode (e.g., Glassy Carbon or Screen-Printed Electrode), Ag/AgCl reference electrode, and Platinum counter electrode.
- Substrate: Acetylthiocholine iodide (ATChI).
- Electrochemical Cell: Potentiostat for amperometric measurements.
Step-by-Step Procedure:
- Electrode Modification: Immobilize AChE onto the surface of the working electrode. This can be achieved via cross-linking with glutaraldehyde, entrapment within a polymer matrix (e.g., Nafion/chitosan), or adsorption on nanomaterials [58].
- Baseline Activity Measurement:
- Place the modified electrode in a stirred electrochemical cell containing buffer.
- Apply a constant potential (e.g., +0.5 V vs. Ag/AgCl).
- Upon a stable current baseline, add ATChI substrate to a final concentration (e.g., 0.5 mM).
- The enzyme hydrolyzes ATChI to produce thiocholine, which is oxidized at the electrode, generating a steady-state amperometric current. Record this as the initial enzyme activity (I₀).
- Inhibition Phase:
- Incubate the AChE-modified electrode in the sample solution (e.g., pretreated vegetable oil extract or water sample) suspected to contain pesticides for a fixed time (e.g., 10 minutes) [58].
- Activity Measurement Post-Inhibition:
- Rinse the electrode gently with buffer.
- Repeat step 2 (measure the steady-state current in fresh substrate solution). Record this current (Iᵢ).
- Quantification & Analysis:
- The percentage of enzyme inhibition is calculated as: % Inhibition = [(I₀ - Iᵢ) / I₀] × 100.
- The % inhibition is proportional to the concentration of the inhibiting pesticide in the sample. Quantify the result using a calibration curve generated with standard pesticide solutions.
- Critical Note: Account for matrix effects. Calibration should be performed in the presence of the pre-extracted sample matrix (e.g., from oil) to correct for non-target inhibition and synergistic effects, ensuring accurate quantification in real samples [58].
Optical biosensors have emerged as powerful analytical tools that convert biological recognition events into measurable optical signals, offering rapid, sensitive, and selective detection of pesticide residues in agricultural research. These devices typically incorporate a biological recognition element (such as an enzyme, antibody, or aptamer) that specifically interacts with the target pesticide, coupled with an optical transducer that generates a quantifiable signal through various mechanisms including fluorescence, colorimetry, or surface plasmon resonance [59] [60]. The integration of nanomaterials has revolutionized this field by significantly enhancing detection performance through their unique physicochemical properties, including high surface-to-volume ratio, exceptional electrical conductivity, and tunable optical characteristics [8] [5].
The pressing need for such advanced detection platforms stems from the limitations of conventional pesticide monitoring techniques. While chromatographic methods like GC-MS and LC-MS/MS provide excellent sensitivity and accuracy, they are time-consuming, expensive, and require sophisticated laboratory infrastructure and skilled personnel [61] [60] [5]. Optical biosensors address these challenges by offering rapid analysis, cost-effectiveness, and potential for on-site deployment, enabling real-time monitoring of pesticide residues in food and environmental samples [8] [59]. This application note details the working principles, experimental protocols, and practical implementation of fluorescence, FRET, and colorimetric biosensing strategies enhanced with nanomaterials for pesticide detection in agricultural research.
Technical Principles and Signaling Mechanisms
Fluorescence-Based Biosensors
Fluorescence-based biosensors operate on the principle of detecting changes in fluorescence intensity, lifetime, or spectral distribution resulting from the interaction between a target pesticide and a biorecognition element. A prominent approach involves enzyme inhibition, where pesticides such as organophosphates (OPs) and carbamates (CMs) irreversibly inhibit enzymes like acetylcholinesterase (AChE) or specific esterases [61] [62]. The operational principle can be summarized as follows: the enzyme catalyzes the hydrolysis of a substrate, producing a fluorescent product; when the enzyme is inhibited by the target pesticide, this reaction is suppressed, leading to a measurable decrease in fluorescence signal [59].
Recent advancements have focused on developing more stable enzymatic bioreceptors. For instance, a mutant of the thermostable esterase-2 (EST2) from Alicyclobacillus acidocaldarius (EST2-S35C) has been employed as a bioreceptor for OP pesticides, demonstrating superior stability across varying temperatures and pH conditions compared to conventional AChE [61]. This EST2-S35C mutant was labeled with the fluorescent probe IAEDANS, and fluorescence quenching was observed upon paraoxon binding, reaching a plateau at 100 pmol paraoxon. The decrease in enzymatic activity correlated with fluorescence reduction, confirming the inhibition mechanism [61].
FRET-Based Biosensors
Förster Resonance Energy Transfer (FRET) biosensors rely on the non-radiative transfer of energy from an excited donor fluorophore to a nearby acceptor molecule through dipole-dipole interactions [63] [64]. The efficiency of this energy transfer is inversely proportional to the sixth power of the distance between the donor and acceptor (typically effective within 1-10 nm), making FRET exceptionally sensitive to molecular proximity and conformational changes [63] [64].
A representative FRET-based biosensor for pesticide detection was developed using carbon dots (CDs) as donors and graphene oxide (GO) as acceptors, with AChE as the biological recognition element [62]. In this configuration, CDs conjugated to AChE (CD-AChE) initially exhibit quenched fluorescence due to the close proximity with GO. In the presence of organophosphate pesticides like chlorpyrifos, AChE inhibition occurs, preventing the enzymatic reaction that would normally facilitate the CD-AChE/GO interaction. Consequently, the FRET efficiency decreases, leading to fluorescence recovery of the CDs proportional to the pesticide concentration [62]. This biosensor demonstrated remarkable sensitivity, achieving a limit of detection (LOD) as low as 0.14 ppb for chlorpyrifos, well below the maximum residue limits (MRLs) established by regulatory bodies [62].
Colorimetric Biosensors
Colorimetric biosensors translate molecular recognition events into visible color changes detectable by the naked eye or simple spectrophotometric instruments. These platforms often employ enzyme-mimicking nanomaterials (nanozymes) that catalyze chromogenic reactions [8] [59]. For instance, copper oxide nanoparticles (CuONPs) exhibit peroxidase-like activity, catalyzing the oxidation of colorless substrates like o-dianisidine into colored products in the presence of hydrogen peroxide (H₂O₂) [59].
In a typical pesticide detection scheme, AChE hydrolyzes acetylthiocholine (ATCh) to produce thiocholine and acetic acid. Thiocholine then reduces H₂O₂, diminishing the substrate available for the nanozyme-catalyzed color reaction. When AChE is inhibited by OPs, thiocholine production decreases, allowing more H₂O₂ to participate in the nanozyme-catalyzed reaction and resulting in intensified color development proportional to pesticide concentration [59]. This approach has been successfully integrated into paper-based analytical devices, enabling rapid detection of malathion with an LOD of 0.08 mg/L within approximately 10 minutes, demonstrating applicability for on-site screening of fruits and vegetables [59].
Table 1: Performance Comparison of Nano-Enhanced Optical Biosensors for Pesticide Detection
| Transduction Method | Nanomaterial | Biorecognition Element | Target Pesticide | Limit of Detection (LOD) | Linear Range | Food Matrix Application | Reference |
|---|---|---|---|---|---|---|---|
| Fluorescence Quenching | IAEDANS-labeled EST2 | EST2-S35C mutant enzyme | Paraoxon (Organophosphate) | Not specified (plateau at 100 pmol) | Not specified | Surface water samples | [61] |
| FRET | Carbon Dots (CDs) - Graphene Oxide (GO) | Acetylcholinesterase (AChE) | Chlorpyrifos (Organophosphate) | 0.14 ppb | Not specified | Tap water | [62] |
| FRET | Carbon Dots (CDs) - Graphene Oxide (GO) | Acetylcholinesterase (AChE) | Lorsban (Commercial formulation) | 2.05 ppb | Not specified | Tap water | [62] |
| Colorimetric | Copper Oxide Nanoparticles (CuONPs) | Acetylcholinesterase (AChE) | Malathion (Organophosphate) | 0.08 mg/L | 0.1–5 mg/L | Fruits and vegetables | [59] |
| Electrochemical | Gold Nanoparticles (AuNPs) | Acetylcholinesterase (AChE) | Organophosphorus pesticides | 19–77 ng L⁻¹ | Not specified | Apple and cabbage | [8] |
| Electrochemical | Gold Nanoparticles (AuNPs) | Acetylcholinesterase (AChE) | Methomyl (Carbamate) | 81 ng L⁻¹ | Not specified | Apple and cabbage | [8] |
Experimental Protocols
Protocol 1: FRET-Based Biosensor for Organophosphate Detection
Principle: This protocol describes the development of a FRET-based biosensor using carbon dots (CDs) and graphene oxide (GO) for detecting organophosphate pesticides (OPs) through AChE inhibition [62].
Materials:
- Acetylcholinesterase (AChE) from Electrophorus electricus
- African oil palm biochar-derived carbon dots (CDs)
- Graphene oxide (GO) single layers
- Organophosphate standards (chlorpyrifos, paraoxon)
- EDC (1-ethyl-3-[3-dimethylaminopropyl]carbodiimide)
- NHS (N-hydroxysuccinimide)
- 2-mercaptoethanol (ME)
- Acetylthiocholine (ATCh)
- DTNB [5,5′-dithio-bis-(2-nitrobenzoic acid)]
- Sodium bicarbonate buffer (pH 7.45)
- Dialysis membrane (3.5 kDa MWCO)
Procedure:
CD-AChE Conjugation:
- Activate 500 ppm CD solution with 0.05 M EDC and 0.1 M NHS for 15 minutes
- Add 0.5 M 2-mercaptoethanol to stop carboxylic group activation
- Perform dialysis (3.5 kDa) with four water changes over 2 hours
- Adjust pH to 7.45 with sodium bicarbonate buffer
- Add AChE to final concentration of 5 U/mL and incubate for 2 hours
Biosensor Optimization:
- Titrate GO concentration to achieve maximum fluorescence quenching of CD-AChE
- Optimize incubation time (typically 10-30 minutes) for pesticide-enzyme interaction
- Validate AChE activity using Ellman's assay with ATCh and DTNB
Detection and Quantification:
- Incalate CD-AChE conjugate with sample containing potential OPs for 15 minutes
- Add optimized GO concentration and measure fluorescence recovery
- Excite at 340 nm and record emission at 400-550 nm
- Generate calibration curve using pesticide standards (0.1-100 ppb)
Validation:
- Assess specificity against other pesticide classes (carbamates, pyrethroids)
- Test interference from common matrix components (proteins, sugars)
- Evaluate recovery in spiked real samples (water, food extracts)
Protocol 2: Fluorescence-Based Biosensor Using Thermostable EST2
Principle: This protocol utilizes a mutant thermostable esterase-2 (EST2-S35C) for OP detection through fluorescence quenching, offering enhanced stability over conventional AChE-based systems [61].
Materials:
- EST2-S35C mutant enzyme
- Fluorescent probe IAEDANS
- E. coli BL21(DE3) expression system
- Bradford reagent
- Paraoxon and other OP standards
- Gel filtration columns
- Dialysis membranes
- Fluorescence spectrometer
Procedure:
Protein Expression and Purification:
- Express EST2-S35C in E. coli BL21(DE3) host
- Recover biomass by centrifugation
- Extract protein using sonication
- Purify through thermoprecipitation steps followed by gel filtration
- Assess purity (>95%) and concentration via Bradford method
Enzyme Labeling:
- Incubate purified EST2-S35C with IAEDANS at 1:100 protein:probe ratio
- Maintain incubation overnight at 4°C
- Remove excess probe through dialysis
- Determine protein-probe concentration using Bio-Rad dye reagent
Biosensor Validation:
- Measure fluorescence quenching with increasing OP concentrations
- Determine linearity, LOD, and LOQ using paraoxon as model OP
- Assess precision and accuracy with known/unknown concentrations
- Evaluate storage stability at different time intervals
Real Sample Application:
- Collect surface water samples from agricultural areas
- Centrifuge to remove suspended particles
- Analyze 50 mL aliquots in polypropylene centrifuge tubes
- Compare results with standard chromatographic methods
Protocol 3: Colorimetric Paper-Based Biosensor
Principle: This protocol describes a paper-based analytical device utilizing copper oxide nanoparticles (CuONPs) as nanozymes for colorimetric OP detection [59].
Materials:
- Copper oxide nanoparticles (CuONPs)
- Acetylcholinesterase (AChE)
- Acetylthiocholine (ATCh)
- o-Dianisidine
- Hydrogen peroxide (H₂O₂)
- Filter paper or nitrocellulose membranes
- Wax printing or plotting
- Smartphone with camera
Procedure:
Device Fabrication:
- Design microfluidic patterns using drafting software
- Print patterns on filter paper using wax printer
- Heat to melt wax and create hydrophobic barriers
- Deposit CuONPs in detection zones
Biosensor Assembly:
- Immobilize AChE in reaction zones
- Dry at room temperature under vacuum
- Store with desiccant at 4°C until use
Detection Protocol:
- Apply sample (100-200 μL) to device inlet
- Wait for capillary flow to detection zone (5-10 minutes)
- Add chromogenic substrate (o-dianisidine/H₂O₂)
- Capture color development using smartphone camera
- Analyze intensity using image processing software
Quantification:
- Generate calibration curve with standard solutions
- Measure color intensity in RGB channels
- Calculate pesticide concentration from standard curve
Table 2: Research Reagent Solutions for Optical Biosensors
| Reagent Category | Specific Examples | Function in Biosensor | Key Characteristics | Application Examples |
|---|---|---|---|---|
| Enzymes | Acetylcholinesterase (AChE) | Biorecognition element for OPs/CMs | Inhibited by OPs/CMs, catalytic activity | OP detection in water, food [61] [62] |
| Enzymes | EST2-S35C mutant | Thermostable bioreceptor for OPs | High stability, specific OP affinity | Paraoxon detection [61] |
| Fluorescent Probes | IAEDANS | Fluorescent label | Cysteine-specific binding | EST2-S35C labeling [61] |
| Nanomaterials | Carbon Dots (CDs) | FRET donor | Fluorescent, biocompatible | CD-GO FRET biosensor [62] |
| Nanomaterials | Graphene Oxide (GO) | FRET acceptor | Excellent quenching properties | CD-GO FRET biosensor [62] |
| Nanomaterials | Gold Nanoparticles (AuNPs) | Signal amplification | Plasmonic properties, high surface area | Electrochemical biosensors [8] |
| Nanomaterials | Copper Oxide Nanoparticles (CuONPs) | Nanozyme | Peroxidase-like activity | Colorimetric biosensors [59] |
| Crosslinkers | EDC/NHS chemistry | Bioconjugation | Carboxyl-amine coupling | CD-AChE conjugation [62] |
| Substrates | Acetylthiocholine (ATCh) | Enzyme substrate | Thiocholine production | AChE activity assay [62] |
| Chromogens | o-Dianisidine | Colorimetric substrate | Oxidized to colored product | Paper-based biosensors [59] |
The Scientist's Toolkit: Research Reagent Solutions
Successful implementation of optical biosensors for pesticide detection relies on carefully selected research reagents and materials. The biorecognition elements form the foundation of biosensor specificity, with enzymes like acetylcholinesterase (AChE) and engineered variants such as EST2-S35C serving as primary biological components for organophosphate and carbamate detection [61] [62]. These enzymes provide specific inhibition-based detection mechanisms, with thermostable mutants offering enhanced operational stability under varying field conditions.
Nanomaterials play crucial roles in signal enhancement and transduction. Carbon-based nanomaterials including carbon dots (CDs) and graphene oxide (GO) enable efficient FRET detection due to their exceptional optical properties and biocompatibility [62]. Metal nanoparticles such as gold nanoparticles (AuNPs) and copper oxide nanoparticles (CuONPs) provide versatile platforms for both electrochemical and colorimetric sensing, with CuONPs exhibiting valuable peroxidase-mimicking nanozyme activity for catalytic signal amplification [8] [59].
The conjugation chemistry, particularly EDC/NHS crosslinking, enables stable immobilization of biological recognition elements onto nanomaterial surfaces, preserving biological activity while facilitating robust biosensor assembly [62]. Chromogenic and fluorogenic substrates complete the toolkit by generating measurable signals corresponding to pesticide concentration, enabling quantitative detection across various transduction modalities.
Optical biosensors incorporating fluorescence, FRET, and colorimetric strategies with nano-enhancement represent powerful analytical platforms for pesticide detection in agricultural research. These technologies offer significant advantages over conventional methods, including rapid analysis, high sensitivity, portability, and potential for real-time monitoring of pesticide residues [61] [8] [59]. The integration of nanomaterials has been particularly transformative, enabling detection limits that meet or exceed regulatory requirements while facilitating miniaturized device designs.
Future developments in this field will likely focus on several key areas. Multiplex detection capabilities will be essential for simultaneously monitoring multiple pesticide residues in complex matrices. Improved stability of biological recognition elements through protein engineering or biomimetic receptors will enhance field-deployability and shelf-life. Integration with digital technologies such as smartphone-based readout and data transmission will facilitate widespread implementation and data sharing. Additionally, automated sample preparation systems addressing complex food matrices will be crucial for transforming these biosensors from laboratory prototypes to practical analytical tools [59] [60] [5].
As these technologies continue to mature, optical biosensors are poised to play an increasingly important role in ensuring food safety, protecting environmental health, and supporting sustainable agricultural practices through efficient monitoring of pesticide residues.
The development of robust biosensors for pesticide detection is critically important for environmental and food safety. It is estimated that pesticide poisoning causes approximately 220,000 deaths annually worldwide [5]. Traditional detection methods, particularly those relying on natural enzymes such as acetylcholinesterase (AChE), have been widely used but possess significant limitations that restrict their practical application in field conditions. Natural enzymes are prone to instability under extreme temperature, pressure, and pH conditions, leading to activity loss [65]. Their extraction and purification processes are complex and costly, resulting in batch-to-batch variability that affects measurement reproducibility [65]. Furthermore, natural enzymes suffer from in vivo and environmental degradation, which significantly reduces their functional lifespan [65].
The emergence of nanozymes has addressed these limitations by offering superior catalytic performance, advantageous properties, and customizability [65]. These nanomaterial-based enzyme mimics provide effective alternatives to natural enzymes, with research progressively shifting from nanoparticles to quantum dots and atomic clusters [65]. However, conventional nanozymes still face challenges related to low activity density and relatively large size, which restrict their catalytic efficiency [65]. The advent of single-atom nanozymes (SAzymes) represents a groundbreaking advancement, combining the benefits of nanozymes—including high stability, customizable catalytic activity, straightforward large-scale production, and convenient storage—with atomic-level dispersion that achieves nearly 100% metal utilization and dramatically higher catalytic efficiency [65].
Nanozyme to Single-Atom Nanozyme: An Evolutionary Leap
Fundamental Advantages of SAzymes
Single-atom nanozymes constitute a paradigm shift in biomimetic catalysis by dispersing transition metal elements at the atomic level on a support matrix, ensuring complete exposure of metal atoms to the reaction medium and maximizing the utilization of active sites [65]. This architectural innovation provides SAzymes with distinct advantages over both natural enzymes and conventional nanozymes, as systematically compared in Table 1.
Table 1: Performance Comparison of Natural Enzymes, Conventional Nanozymes, and Single-Atom Nanozymes
| Characteristic | Natural Enzymes | Conventional Nanozymes | Single-Atom Nanozymes |
|---|---|---|---|
| Catalytic Activity | High but variable | Moderate to high | Exceptional, often superior to natural enzymes |
| Stability | Low (sensitive to temperature, pH) | High | Extremely high |
| Production Cost | High (complex purification) | Moderate | Low to moderate (scalable synthesis) |
| Structural Definition | Well-defined but complex | Heterogeneous active sites | Uniform, well-defined active sites |
| Metal Utilization | Not applicable | Low | ~100% |
| Storage Requirements | Stringent (often refrigeration) | Routine | Routine |
| Batch-to-Batch Variability | High | Moderate | Low |
SAzymes combine the advantages of nanozymes—including high stability, customizable catalytic activity, straightforward large-scale production, and convenient storage—with reduced material size to a single atom level, achieving 100% metal utilization and low metal consumption compared to traditional nanozymes, thereby leading to higher catalytic efficiency [65]. The performance of SAzymes strongly depends on the selection of carrier types and modification methods, highlighting the controllability advantage of their performance [65].
Structural Characteristics and Support Materials
The exceptional performance of SAzymes derives from their precisely engineered structures. A SAzyme typically consists of isolated metal atoms stabilized on various support materials through coordination interactions. The strong interaction between metal atoms and the carrier prevents aggregation and ensures highly durable catalytic activity, benefiting the reliability, stability, and reproducibility of SAzyme-based methods under different environmental conditions [66].
Table 2: Common Support Materials for Single-Atom Nanozymes and Their Properties
| Support Material Category | Examples | Key Properties | Representative Applications |
|---|---|---|---|
| Carbon-Based Materials | Graphene oxide, Carbon nanotubes, Nitrogen-doped carbon | Ultra-high electrical conductivity, large specific surface area, excellent chemical stability | Peroxidase-mimicking activity, electrochemical sensing [67] |
| Metal-Organic Frameworks (MOFs) | ZIF-8, UiO-67, MIL-101 | Tunable pore structures, large specific surface areas, uniform active sites | Signal amplification, immunoassays for pesticides [67] |
| Metal Oxides | CeO₂, TiO₂, FeOₓ | Exceptional thermal stability, mechanical robustness, abundant surface defects | Multi-enzyme mimetic activity, viral detection [67] |
| Metal Sulfides | MoS₂, CdS | Expansive specific surface areas, numerous surface-active sites | Enhanced electron transfer, sulfite activation [67] |
SAzyme-Enhanced Biosensors for Pesticide Detection: Mechanisms and Applications
Sensing Mechanisms for Pesticide Detection
SAzymes can be engineered to mimic various enzyme activities crucial for pesticide detection, including peroxidase (POD), oxidase (OXD), superoxide dismutase (SOD), and catalase (CAT)-like activities [65]. The mechanism of SAzyme-based pesticide detection typically follows one of two approaches: (1) Inhibition-based sensing, where pesticides directly inhibit the enzyme-mimetic activity of SAzymes, and (2) Aptamer-based sensing, where pesticide binding to specific aptamers generates measurable signals through various transduction mechanisms.
The following diagram illustrates the operational principle of a representative dual-mode SAzyme-based biosensor for organophosphorus pesticide detection:
Diagram 1: Dual-mode SAzyme Biosensor Mechanism
In this dual-mode detection platform, the presence of organophosphorus pesticides (OPs) leads to the formation of complexes with specific aptamers. These complexes exhibit toxic effects that inhibit the catalytic activity of the single-atom iron nanozyme (SA-Fe-NZ), preventing colorimetric substrates from being catalyzed while simultaneously causing changes in electrochemical signals due to the conformational changes of aptamers labeled with electrochemical signal molecules [68].
Performance Comparison of SAzyme-Based Pesticide Detection Platforms
Research has demonstrated exceptional sensitivity and specificity of SAzyme-based biosensors for various classes of pesticides. The following table summarizes the performance characteristics of different SAzyme platforms for pesticide detection:
Table 3: Performance of SAzyme-Based Biosensors for Pesticide Detection
| Target Pesticide | SAzyme Platform | Detection Mechanism | Linear Range | Limit of Detection | Reference |
|---|---|---|---|---|---|
| Organophosphorus Pesticides (Broad-spectrum) | Single-atom Fe nanozyme (SA-Fe-NZ) | Dual-mode (colorimetric/electrochemical) | 10⁻¹³ - 10⁻² M | 3.55 fM | [68] |
| Chlorpyrifos | Monoiron sites on UiO-67 MOF | Electrochemical immunoassay | Not specified | 0.21 ng/mL | [67] |
| Carbendazim (CBZ) | Dual aptamer with MOF-808 and Au NPs | Voltammetric | 0.8 fM - 100 pM | 0.2 fM | [24] |
| Carbaryl, Phoxim | Multiple AChE variants with ANN | Spectrometric with chemometrics | 0-20 μg/L | 0.9-1.4 μg/L | [3] |
The extraordinary sensitivity of these platforms, particularly the femtomolar (fM) detection limits achieved by SAzyme-based sensors, enables monitoring of pesticide residues at ultra-trace levels, significantly below the maximum residue limits established by regulatory agencies [68] [24].
Experimental Protocols
Protocol 1: Fabrication of a Dual-Mode Single-Atom Fe Nanozyme Biosensor
Principle: This protocol describes the construction of a smartphone-assisted dual-mode biosensor utilizing single-atom iron nanozyme (SA-Fe-NZ) for multi-pesticide detection in vegetables [68]. The sensor operates on the principle that complexes formed between organophosphorus pesticides (OPs) and specific aptamers inhibit the catalytic activity of SA-Fe-NZ, generating simultaneous colorimetric and electrochemical signals.
Materials:
- Single-atom iron nanozyme (SA-Fe-NZ) suspension
- Organophosphorus pesticide (OP) aptamer solution
- Colorimetric substrate (e.g., TMB)
- Electrochemical signal molecules (methylene blue label)
- Screen-printed carbon electrode or gold electrode
- Phosphate buffer saline (PBS, 0.1 M, pH 7.4)
- Vegetable sample extracts
- Smartphone with camera for colorimetric analysis
- Potentiostat for electrochemical measurements
Procedure:
Electrode Modification:
- Prepare the working electrode by polishing with alumina slurry and rinsing thoroughly with deionized water.
- Deposit 5-10 μL of SA-Fe-NZ suspension onto the electrode surface and allow to dry at room temperature.
- Immerse the SA-Fe-NZ modified electrode in aptamer solution (1.0 μM in PBS) for 12-16 hours at 4°C to facilitate aptamer immobilization through covalent bonding.
Sample Preparation:
- Homogenize vegetable samples (e.g., lettuce, cabbage) using a blender.
- Extract pesticides by mixing 5 g of homogenized sample with 10 mL of acetonitrile, vortex for 2 minutes, and centrifuge at 5000 rpm for 10 minutes.
- Collect the supernatant and evaporate under nitrogen stream; reconstitute the residue in 2 mL PBS for analysis.
Detection Procedure:
- Incubate the aptamer/SA-Fe-NZ modified electrode with 100 μL of standard or sample solution for 30 minutes at room temperature.
- For colorimetric detection: Add 50 μL of TMB substrate solution, incubate for 10 minutes, and capture the color development using a smartphone camera. Quantify the color intensity using image processing software.
- For electrochemical detection: Perform differential pulse voltammetry (DPV) from -0.2 to 0.6 V with amplitude of 50 mV and pulse width of 50 ms in PBS containing electrochemical mediators.
- Measure the decrease in both colorimetric and electrochemical signals proportional to pesticide concentration.
Data Analysis:
- Generate a calibration curve by plotting signal intensity versus logarithm of pesticide concentration.
- Calculate pesticide concentration in unknown samples using the calibration curve equation.
Troubleshooting Tips:
- If signal reproducibility is poor, ensure consistent SA-Fe-NZ deposition and aptamer immobilization times.
- If sensitivity is lower than expected, check the activity of SA-Fe-NZ with positive controls.
- For complex vegetable matrices, implement additional purification steps such as solid-phase extraction.
Protocol 2: SAzyme-Based Electrochemical Sensing Platform
Principle: This protocol outlines the development of an electrochemical sensor using SAzymes for direct detection of pesticides based on their inhibition of enzyme-mimetic activity [69]. The approach leverages the exceptional electrocatalytic properties of SAzymes, particularly those with M-Nx active sites that structurally resemble natural enzyme active centers [65].
Materials:
- Single-atom nanozyme (e.g., Fe-N/C, Co-N/C)
- Cholinesterase enzyme (AChE or BChE)
- Acetylthiocholine or butyrylthiocholine as substrate
- Phosphate buffer (0.1 M, pH 7.4)
- Electrochemical cell with three-electrode system
- Electrodeposition apparatus
- Ultrasound bath
Procedure:
SAzyme Synthesis (Fe-N/C Example):
- Prepare precursor solution containing iron salt (e.g., FeCl₃) and nitrogen-rich ligand (e.g., 1,10-phenanthroline) in ethanol.
- Impregnate porous carbon support with the precursor solution using incipient wetness method.
- Pyrolyze the material under inert atmosphere at 800-900°C for 2 hours.
- Characterize the resulting SAzyme using AC-TEM and XAS to confirm atomic dispersion.
Sensor Fabrication:
- Prepare SAzyme ink by dispersing 2 mg of SAzyme in 1 mL of water:isopropanol (1:1) mixture with 20 μL of Nafion solution.
- Deposit 5-10 μL of the ink onto glassy carbon electrode and dry under infrared lamp.
- Immobilize cholinesterase enzyme by cross-linking with glutaraldehyde vapor for 1 hour.
Electrochemical Measurement:
- Incubate the modified electrode with pesticide standard or sample solution for 15 minutes.
- Transfer to electrochemical cell containing PBS (0.1 M, pH 7.4) with substrate.
- Record amperometric response at constant potential of +0.7 V vs. Ag/AgCl.
- Measure the inhibition percentage as (I₀ - I)/I₀ × 100%, where I₀ and I are currents before and after pesticide exposure.
Analysis of Real Samples:
- Prepare food or environmental samples by appropriate extraction procedures.
- Filter and dilute extracts to fit within the linear range of the calibration curve.
- Apply standard addition method for quantification to account for matrix effects.
The Scientist's Toolkit: Essential Research Reagents and Materials
Table 4: Essential Research Reagents and Materials for SAzyme-Based Pesticide Detection
| Reagent/Material | Function/Application | Examples/Specifications |
|---|---|---|
| Single-Atom Nanozymes | Core sensing element with enzyme-mimetic activity | Fe-N/C, Co-N/C, Cu-N/C with M-Nₓ active sites [65] |
| Aptamers | Biorecognition elements for specific pesticide binding | ssDNA/RNA aptamers selected via SELEX process [24] |
| Electrode Materials | Signal transduction platform | Screen-printed carbon, gold, glassy carbon electrodes [3] |
| Electrochemical Mediators | Facilitate electron transfer in redox reactions | Ferricyanide, methylene blue, ruthenium hexamine [24] |
| Colorimetric Substrates | Generate visual signals for detection | TMB (3,3',5,5'-tetramethylbenzidine), ABTS (2,2'-azino-bis(3-ethylbenzothiazoline-6-sulfonic acid)) [68] |
| Support Materials | Stabilize single metal atoms | MOFs (ZIF-8, UiO-67), carbon nanotubes, graphene oxide [67] |
| Cross-linking Agents | Immobilize biorecognition elements | Glutaraldehyde, EDC/NHS chemistry [3] |
| Blocking Agents | Reduce non-specific binding | BSA, casein, synthetic blocking peptides [24] |
The following diagram illustrates the strategic integration of these components into a complete SAzyme-based biosensing system:
Diagram 2: SAzyme Biosensor Component Integration
Single-atom nanozyme platforms represent a transformative advancement in biosensing technology that effectively addresses the limitations of natural enzymes for pesticide detection applications. The exceptional catalytic efficiency, structural stability, and customizability of SAzymes enable the development of highly sensitive, robust, and practical biosensors capable of detecting pesticide residues at biologically relevant concentrations in complex matrices.
Future research directions should focus on several key areas: (1) expanding the library of SAzymes with diverse enzyme-mimetic activities to cover broader classes of pesticides; (2) developing multiplexed detection platforms for simultaneous monitoring of multiple pesticide residues; (3) integrating SAzyme-based sensors with portable readout devices for field-deployable applications; and (4) advancing our fundamental understanding of structure-activity relationships in SAzymes to enable rational design of next-generation biosensing platforms [65] [66].
The implementation of SAzyme technology in environmental monitoring and food safety systems holds significant promise for protecting ecosystem and human health through early detection and quantification of hazardous pesticide residues, ultimately contributing to more sustainable agricultural practices and enhanced public health protection.
Overcoming Practical Challenges: Stability, Selectivity, and Real-World Implementation
The accurate detection of pesticides using biosensors in real-world agricultural samples is significantly challenged by matrix effects. These effects are defined as the influence of components present in the sample other than the target analyte on the final quantitative result [70]. In agricultural research, complex matrices from soil, water, and food products contain various interferents—such as organic matter, humic acids, salts, lipids, and proteins—that can co-elute with analytes or interact non-specifically during analysis [70] [58]. These interactions can alter the analytical signal, leading to either suppression or enhancement, thereby compromising the reliability, sensitivity, and accuracy of biosensor measurements [70] [58].
Understanding and mitigating these effects is paramount for developing robust biosensing platforms for pesticide detection. Matrix effects can impact both the extraction efficiency of the analyte and the ionization efficiency in mass spectrometric detection, but they are also a critical concern for electrochemical and optical biosensors commonly used in agricultural settings [70]. For instance, in enzyme-based electrochemical sensors, components from vegetable oils can exhibit synergistic effects with pesticides, leading to significant deviations from calibration curves established in clean buffer solutions [58]. This application note provides a detailed examination of matrix effects across different sample types and offers standardized protocols for their assessment and mitigation, specifically framed within biosensor research for agricultural pesticide detection.
Quantifying Matrix Effects: Data from Complex Matrices
The following tables summarize experimental data on matrix effects from recent studies, highlighting the variability of these effects across different sample types and their impact on biosensor performance.
Table 1: Matrix Effects in Groundwater Samples for Multi-Class Analytics (LC-MS/MS Analysis) [70]
| Analyte Class | Example Compounds | Observed Matrix Effect (Direction) | Key Influencing Factors |
|---|---|---|---|
| Pharmaceuticals | Sulfamethoxazole, Sulfadiazine, Caffeine | Strong Negative | Sampling location, inorganic ion composition |
| Pesticides | Metamitron, Chloridazon | Strong Negative | Geochemical composition of aquifer |
| Herbicides | Atrazine, Metolachlor | Weak Negative / Positive | Dissolved organic carbon content |
| Fungicides | Tebuconazole, Carbendazim | Weak to Moderate | Not specified |
| Perfluoroalkyl Substances (PFAS) | Various PFAS | Varied (Negative to Positive) | Co-eluting organic matter |
Table 2: Matrix Effects in Food Products (Vegetable Oils) for Enzyme-Based Electrochemical Biosensors [58]
| Sample Matrix | Target Pesticide | Biosensor Type | Observed Matrix Effect | Impact on Performance |
|---|---|---|---|---|
| Olive Oil | Carbofuran (carbamate) | Acetylcholinesterase (AChE)-modified electrochemical sensor | Synergistic inhibition | Significant deviation from buffer-based calibration |
| Other Vegetable Oils | Carbofuran (carbamate) | Acetylcholinesterase (AChE)-modified electrochemical sensor | Varies with fatty acid content | Inhibitory potential correlates with oil composition |
| Pretreated Oil Extracts | Carbofuran (carbamate) | Acetylcholinesterase (AChE)-modified electrochemical sensor | Signal suppression | Necessity for matrix-matched calibration |
Standardized Protocols for Assessing Matrix Effects
Protocol 1: Slope Ratio Analysis for Quantitative Matrix Effect Assessment
This method is recommended for quantifying the absolute matrix effect (ME) during the development and validation of a biosensor.
- Principle: The slopes of calibration curves prepared in the sample matrix and in a clean solvent are compared. A slope ratio (Matrix/Solvent) of 1 indicates no matrix effect, <1 indicates suppression, and >1 indicates enhancement [70].
- Materials:
- Standard solutions of target pesticides at a minimum of five concentration levels.
- Blank matrix samples (e.g., groundwater, soil extract, oil extract) confirmed to be free of the target analytes.
- Appropriate pure solvent (e.g., acetonitrile, mobile phase).
- Biosensor platform ready for measurement.
- Procedure:
- Prepare Matrix-Matched Standards: Spike the blank matrix with the standard solutions to create a calibration series covering the expected working range.
- Prepare Solvent-Based Standards: Spike the pure solvent with the same standard solutions to create an identical calibration series.
- Analysis: Analyze all calibration standards using the biosensor under identical conditions. Record the analytical response (e.g., peak area, current, fluorescence intensity).
- Calculation: Plot the response against the concentration for both the matrix-matched and solvent-based standards. Perform linear regression to obtain the slopes.
- Calculate Matrix Effect (ME):
ME (%) = [(Slope_matrix / Slope_solvent) - 1] × 100[70].
- Interpretation: An ME value of 0% signifies no effect. Negative values indicate signal suppression, and positive values indicate signal enhancement. Values exceeding ±15-20% are generally considered indicative of a significant matrix effect requiring mitigation.
Protocol 2: Post-Extraction Spike Method for Biosensor Susceptibility
This protocol is ideal for evaluating the relative matrix effect and the susceptibility of a specific biosensor configuration.
- Principle: The response of a biosensor to an analyte spiked into a processed blank sample extract is compared to its response to the same analyte in a pure solvent [70] [58].
- Materials:
- Blank sample matrix.
- Standard solution of the target pesticide at a single, relevant concentration.
- All reagents and equipment for standard sample preparation/extraction.
- Biosensor platform.
- Procedure:
- Extract Blank Matrix: Process the blank sample using the standard extraction and preparation protocol.
- Spike the Extract: Divide the processed blank extract into two aliquots. Spike one aliquot with a known concentration of the pesticide standard. The other aliquot remains unspiked as a control.
- Prepare Solvent Standard: Prepare a standard in pure solvent at the same concentration as the spiked extract.
- Measurement: Analyze the spiked extract, the unspiked extract, and the solvent standard using the biosensor.
- Calculation:
ME (%) = [(Response_spiked extract - Response_unspiked extract) / Response_solvent standard] × 100.
- Interpretation: This method directly shows how the extracted matrix influences the biosensor's signal for the analyte, accounting for both the cleanup efficiency and the sensor's inherent vulnerability to the remaining matrix components.
The following workflow diagram illustrates the key decision points in assessing and mitigating matrix effects.
The Scientist's Toolkit: Research Reagent Solutions
Table 3: Essential Reagents and Materials for Matrix Effect Studies in Biosensor Research
| Reagent/Material | Function/Description | Application Note |
|---|---|---|
| Blank Matrix Samples | Source material free of target analytes for preparing matrix-matched standards. | Crucial for creating accurate calibration curves. Must be verified as analyte-free [58]. |
| Isotopically Labelled Internal Standards (IS) | Compounds chemically identical to analytes but with different mass. | Added to all samples and standards to correct for losses during preparation and signal variation; the gold standard for compensating matrix effects in quantitative MS [70]. |
| Molecularly Imprinted Polymers (MIPs) | Synthetic polymers with cavities tailored for specific analytes. | Used as a clean-up sorbent in Solid-Phase Extraction (SPE) to selectively bind target pesticides, removing matrix interferents [71]. |
| Aptamers | Single-stranded DNA or RNA oligonucleotides that bind specific targets. | Serve as highly specific biorecognition elements in biosensors, reducing interference from non-target matrix components [72]. |
| Nanomaterials (e.g., CNTs, Graphene Oxide) | Materials used to modify transducer surfaces. | Enhance electron transfer in electrochemical biosensors, can increase sensitivity and reduce fouling from matrix components [71]. |
| Chromatography Sorbents (e.g., C18, PSA) | Materials used in dispersive-SPE (d-SPE) clean-up. | Remove common interferents like fatty acids, organic acids, and pigments from sample extracts (e.g., QuEChERS method) [58]. |
Mitigation Strategies for Robust Biosensor Performance
Effectively addressing matrix effects requires a multi-faceted approach. The following strategies can be implemented to minimize their impact:
Sample Preparation and Clean-up: Implementing robust extraction and clean-up procedures is the first line of defense. Techniques like Solid-Phase Extraction (SPE) using sorbents such as C18 or Molecularly Imprinted Polymers (MIPs) can selectively remove interfering compounds from soil, water, or food extracts [58] [71]. For oily matrices, a freeze-out step (cryoprecipitation) can be effective in removing lipids.
Matrix-Matched Calibration: This is a fundamental and highly effective strategy. Calibration standards are prepared in a blank matrix that is representative of the sample being analyzed. This ensures that the matrix effect is consistent between the standards and the samples, thereby canceling out its influence on the quantitative result [58]. This protocol is essential for achieving accurate data with biosensors in complex agricultural samples.
Standard Addition Method: In this technique, the sample is split into several aliquots, and each is spiked with increasing known amounts of the analyte. The measured response is plotted against the added concentration, and the original concentration in the sample is determined by extrapolation. This method accounts for the matrix effect on the specific sample being analyzed and is particularly useful when a blank matrix is unavailable [70].
Utilization of Internal Standards: The use of internal standards, especially isotopically labelled analogues of the target analytes, is highly recommended. The IS is added to all samples and standards at a constant concentration. Any suppression or enhancement of the analyte signal will be mirrored by the IS signal, allowing for precise correction [70]. For biosensors where isotopic standards are not feasible, a structural analogue can be used.
Biosensor Design and Optimization: The strategic design of the biosensor itself can mitigate matrix effects. This includes:
- Bioreceptor Choice: Employing highly specific biorecognition elements like aptamers or engineered antibodies can reduce cross-reactivity with matrix components [72].
- Surface Modification: Using nanostructured materials (e.g., carbon nanotubes, graphene) on the sensor surface can improve electron transfer and reduce non-specific binding (fouling) [71].
- Sample Dilution: A simple but effective approach. Diluting the sample with a buffer can reduce the concentration of interferents below a critical level, though this may also reduce sensitivity [70].
The deployment of biosensors for pesticide detection in agricultural research is often hampered by limitations in operational stability and shelf-life, which directly impact their field applicability and commercial viability [73]. These analytical devices, which combine a biological sensing element with a physicochemical transducer, are increasingly crucial for monitoring pesticide residues in complex food matrices and environmental samples [74] [73]. A primary challenge in biosensor development involves maintaining the structural integrity and functionality of the biological recognition element—such as enzymes, antibodies, or nucleic acids—under various storage and operational conditions [73] [75]. This application note details advanced immobilization techniques and robust bioreceptor development strategies specifically framed within a thesis context focused on biosensors for pesticide detection in agriculture, providing detailed protocols for researchers and scientists working in this field.
Table 1: Key Challenges in Biosensor Development for Pesticide Detection
| Challenge | Impact on Biosensor Performance | Potential Solution |
|---|---|---|
| Enzyme Denaturation | Loss of catalytic activity and sensitivity [73] | Defect-engineered immobilization supports [74] |
| Bioreceptor Leaching | Signal drift and reduced reproducibility [75] | Covalent binding and cross-linking [73] |
| Matrix Interference | Reduced specificity in complex food samples [75] | Nanocomposite-based selective barriers [76] |
| Short Shelf-Life | Limited commercial applicability [73] | Optimized storage conditions and stabilizers |
Advanced Immobilization Techniques
The immobilization of biological recognition elements onto transducer surfaces is a critical determinant of biosensor performance, stability, and shelf-life. Effective immobilization not only retains biological activity but also enhances stability against environmental stressors such as temperature, pH variations, and organic solvents encountered in pesticide detection [73] [75].
Defect-Engineered Amorphous Metal-Organic Frameworks (AMOFs)
Recent research demonstrates that defective acetylcholinesterase@amorphous metal-organic frameworks (AChE@AMOF-74) can be tailored via a defect-engineered strategy to provide a suitable microenvironment for enzyme encapsulation [74]. This approach significantly enhances the catalytic activity and target recognition ability of immobilized enzymes—reportedly 3.4-fold and 5.6-fold higher than architectures with regular crystalline structures [74]. The highly porous architecture of AMOFs facilitates enhanced mass transfer while protecting the enzyme structure, making it particularly suitable for organophosphate pesticide detection where enzyme inhibition is the primary detection mechanism [74] [73].
Protocol 1: Enzyme Immobilization in Defect-Engineered AMOFs
- Materials: Acetylcholinesterase (AChE) enzyme, Metal salt (e.g., Zn²⁺), Organic ligand (e.g., 2,5-dihydroxyterephthalic acid for MOF-74), Modulator (e.g., acetic acid or benzoic acid for defect creation), Buffer solution (e.g., phosphate buffer, pH 7.4).
- Procedure:
- Prepare AMOF precursor solution: Dissolve metal salt (5 mM) and organic ligand (5 mM) in a suitable solvent (e.g., DMF).
- Introduce modulation agent: Add modulator (e.g., benzoic acid, 10-50 mM) to the precursor solution to create controlled defects during crystallization.
- Incorporate enzyme: Add AChE enzyme (0.1-1.0 mg/mL) to the modulated precursor solution under gentle stirring.
- Carry out crystallization: Incubate the mixture at 60-80°C for 2-4 hours to facilitate the formation of enzyme-embedded AMOFs.
- Collect and wash: Centrifuge the resulting AChE@AMOF-74 composite (10,000 × g, 10 minutes) and wash multiple times with buffer to remove unencapsulated enzyme.
- Characterize: Validate immobilization efficiency using FT-IR, SEM, and enzyme activity assays.
Nanocomposite-Based Entrapment
Nanocomposites integrating materials such as gold nanoparticles (AuNPs), carbon nanotubes (CNTs), and chitosan nanoparticles offer exceptional immobilization platforms due to their high surface-to-volume ratio, tunable surface chemistry, and enhanced electron transfer capabilities [20] [76]. These materials can be functionalized with various chemical groups to facilitate strong interactions with bioreceptors while preserving their biological activity.
Protocol 2: Entrapment in Nanocomposite Hydrogels
- Materials: Chitosan nanoparticles (or other polymeric nanomaterials), Cross-linker (e.g., glutaraldehyde), Bioreceptor (enzyme, antibody), Buffer solutions.
- Procedure:
- Prepare nanoparticle suspension: Disperse chitosan nanoparticles (1% w/v) in dilute acetic acid solution (1% v/v).
- Mix with bioreceptor: Combine the nanoparticle suspension with the bioreceptor solution (e.g., AChE in phosphate buffer, pH 7.4) at a 1:1 volume ratio.
- Cross-linking: Add glutaraldehyde (0.1% v/v) as a cross-linking agent and mix thoroughly.
- Deposit on transducer: Apply the mixture to the electrode surface and allow to dry at room temperature for 2 hours.
- Rinse: Wash the modified electrode with buffer to remove excess cross-linker and unimmobilized bioreceptor.
Covalent Binding and Cross-Linking
Covalent immobilization provides stable, irreversible binding between bioreceptors and functionalized transducer surfaces, significantly reducing bioreceptor leaching [73] [75]. This method often employs cross-linking agents such as glutaraldehyde or EDC-NHS chemistry to form stable covalent bonds between functional groups on the bioreceptor and the support matrix.
Table 2: Comparison of Immobilization Techniques for Biosensors
| Technique | Mechanism | Advantages | Limitations | Impact on Stability |
|---|---|---|---|---|
| AMOF Encapsulation [74] | Physical confinement in porous matrix | High enzyme loading, enhanced activity & recognition | Complex synthesis | High (3.4-fold activity increase reported) |
| Covalent Binding [73] [75] | Covalent bonds with functionalized surface | Strong attachment, minimal leaching | Possible activity loss | High |
| Nanocomposite Entrapment [20] [76] | Physical entrapment in polymer matrix | Mild conditions, high stability | Diffusion limitations | Medium to High |
| Adsorption [73] | Physical adsorption onto surface | Simple procedure, no modifiers | Variable surface attachment, leaching | Low |
Robust Bioreceptor Engineering
The development of robust bioreceptors with inherent stability is equally crucial as advanced immobilization strategies. Engineering bioreceptors at the molecular level can significantly enhance their resilience to environmental stressors encountered in agricultural pesticide detection.
Recombinant Enzyme Engineering
Production of recombinant acetylcholinesterase (AChE) enables the design of enzymes with improved sensitivity and selectivity for pesticide detection [73]. Site-directed mutagenesis can be employed to modify amino acid residues around the active site, enhancing stability against inhibition or denaturation while maintaining catalytic efficiency.
Synthetic Bioreceptors
Aptamers—single-stranded DNA or RNA molecules—offer advantages over traditional antibodies, including superior stability, reusability, and resistance to denaturation [75]. Their synthetic nature allows for precise modification to enhance stability and facilitate site-specific immobilization.
Protocol 3: Selection of DNA Aptamers for Pesticide Detection
- Materials: Random ssDNA library, Target pesticide molecule (e.g., paraoxon), Immobilization support (e.g., sepharose beads), PCR reagents, Buffer solutions.
- Procedure (SELEX):
- Incubation: Incubate the ssDNA library with the immobilized target pesticide.
- Partition: Separate bound sequences from unbound sequences.
- Elution: Elute specifically bound sequences.
- Amplification: Amplify eluted sequences using PCR.
- Conditioning: Purify ssDNA from amplified sequences for the next round.
- Repeat: Repeat steps 1-5 for 8-15 rounds to enrich high-affinity aptamers.
- Clone and Sequence: Clone the final pool and sequence individual clones to identify aptamer sequences.
Experimental Protocols for Stability and Shelf-Life Assessment
Rigorous evaluation of biosensor stability is essential for validating immobilization techniques and bioreceptor engineering strategies.
Protocol 4: Operational and Storage Stability Testing
- Materials: Fabricated biosensor, Substrate solution (e.g., acetylcholine for AChE-based sensors), Pesticide standards, Buffer solutions, Controlled temperature storage.
- Procedure:
- Operational Stability:
- Operate the biosensor continuously over 4-8 hours, measuring the signal response at fixed intervals (e.g., every 30 minutes).
- Calculate the residual activity as a percentage of the initial response.
- Perform at least 10-20 assay cycles to assess reusability.
- Storage Stability:
- Store the biosensor under controlled conditions (e.g., 4°C in dry state or in buffer).
- At regular intervals (e.g., daily, weekly), measure the biosensor response to a standard analyte concentration.
- Plot residual activity versus storage time to determine the degradation rate and half-life.
- Operational Stability:
Table 3: Quantitative Stability Benchmarks from Recent Research
| Biosensor Architecture | Target Analyte | Operational Stability | Shelf-Life | Reference Technique |
|---|---|---|---|---|
| AChE@AMOF-74 [74] | Paraoxon | >80% activity after 50 cycles | >30 days at 4°C | Defect-engineered AMOF |
| Electrochemical Aptasensor [75] | Various Pesticides | >90% activity after 20 uses | >60 days at 4°C | Aptamer-based |
| Nanocomposite Chitosan/AChE [20] | Chlorpyrifos | ~70% activity after 10 cycles | ~21 days at 4°C | Nanocomposite Entrapment |
The Scientist's Toolkit: Research Reagent Solutions
Table 4: Essential Materials for Biosensor Development for Pesticide Detection
| Reagent/Material | Function | Application Example |
|---|---|---|
| Acetylcholinesterase (AChE) [73] | Recognition element; catalyzes acetylcholine hydrolysis | Inhibition-based detection of OPPs and carbamates |
| Gold Nanoparticles (AuNPs) [20] [76] | Signal amplification; enhance electron transfer | Electrochemical biosensor modification |
| Chitosan Nanoparticles [20] | Biocompatible polymer for enzyme entrapment | Forming stable hydrogel matrices on transducers |
| Metal-Organic Framework (MOF-74) [74] | Porous encapsulation material | Creating defect-engineered amorphous supports for enzymes |
| Screen-Printed Electrodes (SPEs) [75] | Disposable transducer platform | Creating low-cost, portable biosensors for field use |
| Glutaraldehyde [73] | Cross-linking agent | Covalent immobilization of enzymes to surfaces |
Workflow and Signaling Pathways
The following diagram illustrates the strategic workflow for developing stable biosensors, from bioreceptor selection to performance validation, specifically for pesticide detection applications.
Diagram 1: Biosensor Development Workflow
The signaling pathway for enzyme inhibition-based pesticide detection, central to many biosensors in this field, is depicted below.
Diagram 2: Enzyme Inhibition Pathway for Pesticide Detection
The accurate detection of specific pesticides in complex agricultural samples remains a significant challenge in analytical science. Selectivity and cross-reactivity are central to this challenge, as they determine a sensor's ability to correctly identify and quantify target analytes amidst interfering substances commonly found in food and environmental samples [12]. Traditional biosensing approaches often struggle to distinguish between structurally similar compounds, leading to false positives and inaccurate quantification.
This Application Note addresses these limitations through three interconnected technological frameworks: the rational design of engineered biorecognition elements, the implementation of multisensor array systems, and the application of advanced chemometric methods for data processing. By integrating these approaches, researchers can develop detection systems with significantly enhanced specificity for pesticide monitoring in agricultural research.
Table 1: Analytical Performance of Advanced Biosensing Platforms for Pesticide Detection
| Detection Platform | Target Pesticide | Linear Range | Limit of Detection (LOD) | Key Feature |
|---|---|---|---|---|
| Dual-Signal Electrochemical Aptasensor [24] | Carbendazim (CBZ) | 0.8 fM – 100 pM | 0.2 fM | Dual aptamer design |
| Voltammetric Aptasensor [24] | Carbendazim (CBZ) | 520 pM – 0.52 mM | - | Au NP-modified electrode |
| Acetylcholinesterase-based Biosensor [12] | Organophosphorus (OP) pesticides | 0.5–100 ng/mL (1.73–345.7 nM) | 0.18 ng/mL (0.62 nM) | Enzyme inhibition |
| AChE-Based Sensor [12] | Malathion | 0.01–1 ng/mL | 2.6 pg/mL | High sensitivity to specific OP |
| Glyphosate Antibody-based Sensor [12] | Glyphosate | 10 ng/mL – 50 µg/mL | 10 ng/mL | Immunological recognition |
| Fluorescent Aptasensor [24] | Thiamethoxam (TMX) | (Not specified) | (Not specified) | Nanomaterial-enhanced |
Engineered Receptors for Enhanced Molecular Recognition
Aptamer Engineering and Selection
Nucleic acid aptamers, generated through the Systematic Evolution of Ligands by EXponential enrichment (SELEX) process, provide a versatile platform for molecular recognition. These single-stranded DNA or RNA oligonucleotides (typically 25-90 bases) fold into specific three-dimensional structures that bind targets with high affinity and selectivity [24]. Their advantages over traditional antibodies include:
- Superior stability under harsh conditions (e.g., organic solvents, elevated temperatures)
- Reusability after denaturation/renaturation cycles
- Small size (1-2 nm) enabling higher receptor density on sensor surfaces
- Ease of modification with functional groups (e.g., thiol, amine, biotin) for controlled immobilization [24]
Recent developments in advanced SELEX techniques incorporate counter-selection against structurally similar compounds to minimize cross-reactivity during the selection process. Post-selection, aptamer sequences can be further optimized through rational truncation and mutagenesis to isolate minimal binding domains with enhanced specificity [24].
Recombinant Antibody Engineering
Genetic engineering enables the development of recombinant antibody fragments with tailored specificity profiles. For pesticide targets, chain shuffling of heavy and light chains from immune libraries generates optimized binders with reduced cross-reactivity [77]. In one representative application, this approach yielded recombinant antibody fragments against s-triazine herbicides with an ELISA achieving an IC₅₀ of 0.9 µg/L and a detection limit of 0.2 µg/L for atrazine [77].
Receptor Engineering for Small Molecule Recognition
For difficult-to-target small molecule pesticides, competitive binding assays often provide superior specificity. In these formats, the biorecognition element (aptamer, antibody, or recombinant receptor) is immobilized on the sensor surface alongside a labeled analog of the target pesticide. Sample introduction displaces the labeled analog, generating a quantifiable signal inversely proportional to pesticide concentration [24] [77]. This approach significantly reduces interference from complex sample matrices.
Sensor Arrays and Multivariate Detection Systems
Electronic Tongue and Nose Platforms
Sensor arrays, often called electronic tongues (e-tongues) or electronic noses (e-noses), mimic mammalian sensory systems by combining multiple sensors with partial specificity patterns. Unlike conventional biosensors targeting single analytes, these systems respond to multiple analytes simultaneously, generating distinctive response fingerprints for complex mixtures [12]. The fundamental principle involves:
- Multiple sensing elements with varied selectivity patterns
- Cross-reactive sensor responses to multiple analytes
- Multivariate data analysis to deconvolute complex signals [12]
Table 2: Biomaterials Used in Biosensor Arrays for Pesticide Detection
| Biomaterial Type | Example Targets | Transduction Method | Advantages | Limitations |
|---|---|---|---|---|
| Acetylcholinesterase (AChE) [12] | Organophosphates, Carbamates | Electrochemical, Optical | Broad sensitivity to neurotoxic pesticides | Limited specificity among same class |
| Organophosphorus Hydrolase (OPH) [12] | Paraoxon, Methyl parathion | Colorimetric, Fluorometric | Direct catalytic activity on targets | Narrow target range |
| Alkaline Phosphatase (ALP) [12] | Methyl paraoxon | Fluorescence, Electrochemical | High sensitivity | Susceptible to inhibition by various compounds |
| Antibodies [12] [77] | Glyphosate, Atrazine, 2,4-D | Electrochemical, Optical (LSPR) | High specificity | Difficult preparation for small molecules |
| Aptamers [24] | Carbendazim, Thiamethoxam | Electrochemical, Fluorescent | Tunable specificity, high stability | Requires optimization for complex matrices |
Multi-Scheme Ionization in Mass Spectrometry
Beyond biological recognition elements, multischeme chemical ionization in mass spectrometry provides a powerful approach for comprehensive pesticide screening. The Multischeme chemical IONization inlet (MION) coupled with high-resolution Orbitrap mass spectrometry enables seamless switching between multiple reagent ions (e.g., Br⁻, O₂⁻ in negative polarity; H₃O⁺, C₃H₆OH⁺ in positive polarity) [78]. This approach significantly expands detectable compound range compared to single-ionization schemes, successfully detecting 136 compounds at 10 ng/mL and 447 compounds at 100 ng/mL from standard solutions containing 651 pesticides [78].
Figure 1: Sensor Array Workflow for Multivariate Pesticide Detection
Chemometrics and Advanced Data Processing
Machine Learning for Pattern Recognition
Machine learning (ML) algorithms transform raw sensor data into meaningful analytical information by identifying complex patterns in multidimensional data. For pesticide detection, both supervised and unsupervised learning approaches prove valuable [12]:
- Principal Component Analysis (PCA) reduces data dimensionality while preserving variance, enabling visualization of sample clustering and outlier detection
- Linear Discriminant Analysis (LDA) maximizes separability between predefined pesticide classes
- Artificial Neural Networks (ANNs) model nonlinear relationships between sensor responses and pesticide concentrations
- Support Vector Machines (SVMs) create optimal decision boundaries between different pesticide classes in high-dimensional space [12]
These algorithms enable detection systems to recognize specific pesticides based on response patterns rather than single, highly specific recognition events, effectively transforming cross-reactivity from a limitation into an asset.
Data Fusion from Multi-Modal Systems
Data fusion strategies combine information from multiple analytical techniques to enhance overall certainty in identification and quantification. For instance, integrating responses from electrochemical aptasensors with optical transduction systems provides complementary data streams that, when combined through appropriate algorithms, significantly reduce false positives compared to either method alone [24] [12].
Experimental Protocols
Protocol: Development of a Cross-Reactive Sensor Array
Objective: Create a six-element sensor array for discrimination of organophosphorus pesticides in fruit extracts.
Materials:
- Acetylcholinesterase (AChE) from electrophorus electricus
- Organophosphorus hydrolase (OPH)
- Engineered aptamer sequences (thiol-modified)
- Gold screen-printed electrodes
- N-Hydroxysuccinimide (NHS) / N-(3-Dimethylaminopropyl)-N'-ethylcarbodiimide (EDC) coupling reagents
- Pesticide standards: chlorpyrifos, malathion, parathion, diazinon
- Fruit extract samples (apple, grape)
Procedure:
- Electrode Modification:
- Clean gold electrodes via potential cycling in 0.5 M H₂SO₄
- Immerse in thiolated aptamer solution (1 µM in PBS) for 16 hours at 4°C
- Block with 6-mercapto-1-hexanol (1 mM) for 1 hour
Enzyme Immobilization (separate electrodes):
- Activate carbon electrode surfaces with NHS/EDC (100 mM/400 mM) for 1 hour
- Apply AChE or OPH solution (2 mg/mL in PBS) for 2 hours at 4°C
- Wash with PBS to remove unbound enzyme
Measurement Procedure:
- Acquire baseline signal in buffer for all six sensor elements
- Expose array to pesticide standards (0.1-100 ng/mL) or fruit extracts
- Record electrochemical responses (chronoamperometry at +0.4V vs Ag/AgCl)
- Collect data from all six sensors for each sample
Data Analysis:
- Normalize responses to baseline signals
- Apply PCA to visualize clustering of different pesticides
- Train LDA model with known samples for classification
- Validate with blinded samples [12]
Protocol: Specific Aptasensor for Carbendazim Detection
Objective: Implement a dual-signal electrochemical aptasensor for ultra-trace carbendazim detection with minimal cross-reactivity.
Materials:
- Carbendazim-specific aptamer (CBZA)
- SH-complementary CBZ aptamer (SH-cCBZA)
- Zirconium-based MOF-808
- Graphene nanoribbons
- Gold nanoparticles (Au NPs, 20 nm)
- Methylene blue redox marker
- Buffer components: PBS, Tris-EDTA
Procedure:
- Electrode Preparation:
- Mix graphene nanoribbons (1 mg/mL) with MOF-808 (0.5 mg/mL)
- Deposit 5 µL mixture on glassy carbon electrode, dry at room temperature
- Electrodeposit Au NPs by cycling in HAuCl₄ solution (-0.8V to +0.8V, 10 cycles)
Aptamer Immobilization:
- Incubate electrode with SH-cCBZA (1 µM) for 12 hours at 4°C
- Hybridize with methylene blue-labeled CBZA (1 µM) for 2 hours at 37°C
- Wash with Tris-EDTA buffer to remove unbound aptamers
Measurement and Detection:
- Record square wave voltammetry scans from -0.6V to 0V in PBS
- Measure oxidation current of methylene blue at -0.35V
- Expose sensor to carbendazim standards (0.8 fM - 100 pM) or samples
- Incubate for 30 minutes at room temperature
- Record signal change proportional to carbendazim concentration [24]
Figure 2: Integrated Workflow for Enhanced Pesticide Detection
The Scientist's Toolkit: Research Reagent Solutions
Table 3: Essential Research Reagents for Advanced Pesticide Biosensing
| Reagent / Material | Function/Application | Key Characteristics | Example Use Cases |
|---|---|---|---|
| Thiol-modified Aptamers [24] | Biorecognition element | Forms self-assembled monolayers via Au-S bonds | Electrochemical aptasensors |
| Gold Nanoparticles (Au NPs) [24] | Signal amplification & immobilization platform | High surface area, excellent conductivity | Electrode modification for enhanced sensitivity |
| Graphene Nanoribbons [24] | Electrode nanomaterial | High electrical conductivity, large surface area | Composite electrode materials |
| Metal-Organic Frameworks (MOFs) [24] | Porous nanomaterial | Ultra-high surface area, tunable porosity | Signal enhancement, selective preconcentration |
| Acetylcholinesterase (AChE) [12] [79] | Enzyme inhibition-based detection | Inhibited by organophosphates & carbamates | Broad-screening biosensors |
| Organophosphorus Hydrolase (OPH) [12] | Enzymatic recognition | Directly hydrolyzes organophosphates | Specific OP pesticide detection |
| NHS/EDC Coupling Reagents [12] | Covalent immobilization chemistry | Activates carboxyl groups for amide bonding | Enzyme antibody immobilization |
| Methylene Blue [24] | Electrochemical redox reporter | Reversible electrochemistry, intercalates with DNA | Signal generation in aptasensors |
| Recombinant Antibody Fragments [77] | Engineered molecular recognition | Tailorable specificity, genetic production | Immunosensors with reduced cross-reactivity |
The integration of engineered receptors, sensor array technology, and advanced chemometrics represents a paradigm shift in pesticide detection, effectively addressing longstanding challenges of selectivity and cross-reactivity. These approaches transform the traditional "one sensor-one target" model into sophisticated detection systems capable of accurately identifying and quantifying multiple pesticides in complex agricultural samples. As these technologies mature, they promise to deliver robust, field-deployable solutions for comprehensive pesticide monitoring, ultimately supporting enhanced food safety and environmental protection.
The extensive use of pesticides in modern agriculture has created an urgent need for analytical methods that can detect multiple residue compounds simultaneously. Traditional chromatographic techniques, while highly accurate, are often ill-suited for rapid screening because they are time-consuming, expensive, and require sophisticated laboratory infrastructure [12] [7]. Multiplex detection strategies address these limitations by enabling the parallel analysis of numerous pesticide residues in a single assay, providing significant advantages in throughput, cost-effectiveness, and speed for monitoring food safety and environmental health [12] [80]. This Application Note examines the principal biosensor-based strategies for multiplex pesticide detection, with a specific focus on technical mechanisms, experimental protocols, and performance characteristics relevant to researchers and agricultural scientists.
Core Strategies for Multiplex Detection
The evolution of multiplex detection platforms has been driven by advances in biorecognition elements, transducer technologies, and signal amplification methods. The following sections detail the predominant technical approaches.
Biosensor Arrays and Electronic Noses
Sensor arrays, often termed electronic noses (e-noses) or electronic tongues (e-tongues), represent a powerful approach for multiplexed analysis. These systems utilize multiple sensing units, each with partial specificity toward different analytes or analyte classes [12]. The collective response pattern from the array generates a unique "fingerprint" for complex samples containing multiple pesticides. Advanced machine learning algorithms and data-processing techniques are then employed to deconvolute these signals, enabling the identification and quantification of individual components within the mixture [12]. This approach is particularly valuable for distinguishing between different pesticide classes in complex matrices like food extracts and environmental samples.
Immunological Multiplex Assays
Immunosensors exploit the high specificity of antibody-antigen interactions. For multiplexing, this typically involves a competitive immunoassay format due to the small molecular size of most pesticides [80]. In this configuration, pesticide molecules in a sample compete with enzyme-labeled or nanoparticle-tagged haptens for a limited number of antibody-binding sites immobilized in distinct spatial zones on a test strip or within a microfluidic device [81]. Recent innovations have focused on developing multiplex immunochromatographic electrochemical biosensors (IEB) that use nanoparticle-tagged antibodies for signal amplification, allowing for the simultaneous detection of up to six different pesticides [81].
Table 1: Key Characteristics of Multiplex Immunosensors
| Feature | Competitive Format | Signal Generation | Multiplexing Capacity |
|---|---|---|---|
| Principle | Sample pesticides compete with labeled haptens for antibody sites | Enzymatic reaction or direct nanoparticle signal | Spatial separation of capture zones on a strip or chip |
| Typical Transducers | Electrochemical, colorimetric, chemiluminescent | Horseradish peroxidase (HRP), alkaline phosphatase (ALP), metal nanoparticles | Electrode arrays, test lines on lateral flow strips |
| Example Application | Simultaneous detection of methyl parathion and imidacloprid using bifunctional antibodies [80] | Pt-based bimetallic nanoparticles with peroxidase-like activity [81] | Detection of three organophosphate insecticides and three herbicides [81] |
Aptamer-Based Recognition Systems
Aptamers are single-stranded DNA or RNA oligonucleotides selected for their high affinity and specificity toward target molecules, including small-molecule pesticides [80]. Their ease of chemical modification and stability makes them ideal for constructing multiplex biosensors. Aptasensors can be designed to produce signals through various mechanisms, including colorimetric, fluorescent, and electrochemical readouts [7] [80]. A notable example is a colorimetric aptasensor utilizing gold nanoparticles (AuNPs) and a cationic polymer for the detection of carbendazim, where the presence of the target pesticide prevents nanoparticle aggregation, resulting in a visible color change from blue to red [80].
Nanomaterial-Enhanced Detection
Nanomaterials are integral to enhancing the sensitivity and multiplexing capabilities of biosensors. Their high surface area-to-volume ratio allows for greater loading of biorecognition elements, while their unique electronic, catalytic, and optical properties enable robust signal amplification [20] [80]. For instance, bimetallic nanoparticles (e.g., Pt-Au, Pt-Pd) exhibit excellent peroxidase-like catalytic activities, making them highly effective enzyme mimics in electrochemical immunosensors [81]. Similarly, gold nanoparticles (AuNPs) are widely used in colorimetric assays due to their surface plasmon resonance properties, which induce a distinct color shift upon aggregation [80].
Experimental Protocols
This section provides a detailed methodology for implementing two primary multiplex detection workflows: a nanomaterial-enhanced electrochemical immunosensor and a sample preparation protocol for complex matrices.
Protocol 1: Multiplex Immunochromatographic Electrochemical Biosensor (IEB)
This protocol outlines the procedure for simultaneous detection of multiple pesticides using a disposable IEB device [81].
1. Synthesis of Nanoparticle-Antibody Conjugates
- Materials: Chloroplatinic acid, gold (III) chloride trihydrate, palladium (II) chloride, cobalt (II) chloride, sodium borohydride (reducing agent), citrate buffer, specific monoclonal antibodies for target pesticides (e.g., chlorpyrifos, atrazine).
- Procedure:
- Synthesize Pt-based bimetallic nanoparticles (e.g., Pt-Au, Pt-Pd) via a co-reduction method in an aqueous solution.
- Characterize the nanoparticles using transmission electron microscopy (TEM) and UV-Vis spectroscopy.
- Conjugate the nanoparticles to pesticide-specific antibodies using carbodiimide cross-linking chemistry. Purify the conjugates via centrifugation.
2. Fabrication of the Multiplex IEB Device
- Materials: Nitrocellulose membrane, carbon or screen-printed electrode arrays, capture antigens (pesticide hapten-protein conjugates).
- Procedure:
- Design a microfluidic chip with distinct test zones for each target pesticide.
- Spot the capture antigens (hapten-OVA conjugates) onto specific test zones corresponding to each electrode on the array.
- Integrate the patterned nitrocellulose membrane with the electrode chip and a sample absorption pad.
3. Assay Execution and Detection
- Materials: Phosphate-buffered saline (PBS), washing buffer (PBST), electrochemical substrate (e.g., H₂O₂/3,3',5,5'-Tetramethylbenzidine (TMB)).
- Procedure:
- Apply the liquid sample (extracted from food) to the sample pad.
- As the sample migrates, pesticides compete with the immobilized capture antigens for binding to the nanoparticle-antibody conjugates.
- Wash the device to remove unbound conjugates.
- Add an electrochemical substrate. The nanoparticle label catalyzes the substrate reaction.
- Measure the electrochemical current (e.g., amperometry) at each electrode. The signal intensity is inversely proportional to the pesticide concentration in the sample.
Diagram 1: IEB Assay Workflow
Protocol 2: Sample Preparation Using a Modified QuEChERS Method
Robust sample preparation is critical for analyzing pesticides in complex plant matrices. The QuEChERS method is widely adopted for this purpose [82] [83].
1. Sample Extraction
- Materials: Acetonitrile (ACN), ethyl acetate (EA), formic acid, anhydrous MgSO₄, NaCl, citrate salts (Na₃Citrate, Na₂HCitrate).
- Procedure:
- Homogenize 5-10 g of the plant material (e.g., fruit, vegetable, herb).
- Place the sample in a 50 mL centrifuge tube. Add 5-10 mL of water for saturation and 10 mL of extraction solvent (e.g., 0.1% formic acid in ACN/EA, 7:3 v/v) [83].
- Shake vigorously for 1 minute.
- Add the salt mixture (e.g., 1 g Na₃Citrate, 0.5 g Na₂HCitrate, 1 g NaCl, 4 g MgSO₄) to induce partitioning. Shake immediately and vigorously for 1 minute.
- Centrifuge at 8700 RCF for 15 minutes.
2. Extract Cleanup
- Materials: Primary Secondary Amine (PSA), graphitized carbon black (GCB), alumina, florisil, anhydrous MgSO₄.
- Procedure:
- Transfer 6 mL of the supernatant (organic layer) to a 15 mL tube containing a d-SPE sorbent mixture.
- A typical mixture may include 150 mg PSA, 10-15 mg GCB, and 900 mg MgSO₄ [84]. Alternatively, for certain root/rhizome-based herbs, using florisil or alumina can improve recovery of compounds with flat molecular structures [82] [83].
- Shake for 2 minutes and centrifuge for 5 minutes at 5000 RCF.
- The purified extract can be evaporated to dryness under a gentle nitrogen stream, reconstituted in a compatible solvent (e.g., hexane or ACN), and analyzed.
Table 2: Performance of Analytical Methods for Multi-Residue Pesticide Detection
| Method | Target Analytes | Matrix | Limit of Quantification (LOQ) | Recovery (%) | Reference |
|---|---|---|---|---|---|
| GC-MS/MS with Modified QuEChERS | 296 Pesticides | Root/rhizome herbs | 0.002 - 0.05 mg/kg | 70.1 - 119.3 (for most) | [83] |
| GC-SIM-MS with QuEChERS | Pesticides & PAHs | Fresh herbs | < 12 μg/kg | 71.6 - 116.9 | [84] |
| Immunochromatographic Electrochemical Biosensor | 6 Pesticides | Fruits, Vegetables | >1000x lower than conventional strips | Validated vs. HPLC | [81] |
The Scientist's Toolkit: Key Research Reagents and Materials
Successful implementation of multiplex detection strategies relies on a suite of specialized reagents and materials.
Table 3: Essential Research Reagents for Multiplex Pesticide Detection
| Reagent/Material | Function | Example Use Case |
|---|---|---|
| Bimetallic Nanoparticles (Pt-Au, Pt-Pd) | Signal amplification labels with peroxidase-like catalytic activity. | Conjugated to antibodies for enhanced electrochemical detection in immunosensors [81]. |
| Nucleic Acid Aptamers | Synthetic biorecognition elements for specific pesticide binding. | Used in optical and electrochemical aptasensors; can be modified with fluorescent tags or immobilized on electrodes [80]. |
| Primary Secondary Amine (PSA) | d-SPE sorbent for removing fatty acids and sugars during sample cleanup. | QuEChERS method for cleaning up fruit and vegetable extracts [83] [84]. |
| Gold Nanoparticles (AuNPs) | Colorimetric reporting agents based on aggregation-induced color shift. | Core element in colorimetric aptasensors for pesticides like carbendazim [80]. |
| Specific Monoclonal Antibodies | Biological recognition elements for immunoassays, providing high specificity. | Immobilized on test strips or sensors for targeted pesticide capture in multiplex formats [80] [81]. |
| Graphitized Carbon Black (GCB) | d-SPE sorbent for removing pigments (e.g., chlorophyll) from extracts. | Sample cleanup for green leafy vegetables and herbs [84]. |
| Enzymes (AChE, ALP, GOx) | Biocatalysts for signal generation in enzyme-inhibition or enzyme-label assays. | Acetylcholinesterase (AChE) used in biosensors for organophosphate and carbamate detection [12] [80]. |
Multiplex detection strategies represent a paradigm shift from single-analyte testing to comprehensive multi-residue screening. The integration of sophisticated biorecognition elements (antibodies, aptamers), advanced nanomaterials for signal enhancement, and innovative sensor designs (e-noses, immunochromatographic electrochemical devices) provides powerful tools for agricultural and food safety research. While challenges remain in standardization and ensuring sensor stability in complex environments, the ongoing convergence of biosensor technology with machine learning and material science promises to deliver even more robust, field-deployable solutions for the simultaneous monitoring of multiple pesticide residues [12] [20]. These advancements will significantly contribute to the broader thesis of developing effective biosensor networks for sustainable and safe agricultural practices.
The accurate detection of pesticides is critical for ensuring food safety, protecting environmental health, and safeguarding public health. Conventional laboratory-based methods for pesticide detection, particularly chromatography and mass spectrometry, provide excellent sensitivity and reliability but are fundamentally ill-suited for widespread field deployment [85] [86]. These techniques require sophisticated, expensive instrumentation, controlled laboratory environments, and highly trained personnel, resulting in a significant gap between analytical capability and practical application in agricultural settings [79].
Biosensor technology presents a promising avenue for bridging this lab-to-field gap. The ongoing evolution in this field is characterized by three interconnected trends: portability, miniaturization, and the integration with smartphone readouts [87]. These developments aim to create analytical tools that retain the sensitivity of traditional methods while gaining the advantages of rapid, on-site analysis, user-friendly operation, and cost-effectiveness [88]. This shift is essential for enabling real-time monitoring of pesticide residues directly in the field, at food processing facilities, or in resource-limited environments, thereby facilitating quicker decision-making and more effective food safety controls.
Emerging Biosensing Platforms and Their Performance
Recent research has yielded significant advancements in biosensor design, particularly through the use of novel materials and transduction mechanisms. The table below summarizes the key performance metrics of several state-of-the-art biosensing platforms developed for pesticide detection.
Table 1: Performance Comparison of Advanced Biosensing Platforms for Pesticide Detection
| Detection Platform | Target Pesticide(s) | Principle of Operation | Linear Detection Range | Limit of Detection (LOD) | Reference |
|---|---|---|---|---|---|
| AChE@AMOF-74 Biosensor | Paraoxon (Organophosphate) | Enzyme inhibition in defect-engineered amorphous Metal-Organic Framework | Not Specified | 0.05 ng·mL⁻¹ | [74] |
| Electrochemical Aptasensor | Carbendazim (Carbamate) | Dual-signal aptasensor with MOF-808 & graphene nanoribbons | 0.8 fM – 100 pM | 0.2 fM | [24] |
| Enzyme Inhibition-Mediated Distance-Based Paper (EIDP) Biosensor | Malathion (Organophosphate) | AChE inhibition measured via water flow distance on paper | 18 – 105 ng/mL | 18 ng/mL | [89] |
| Voltammetric Aptasensor | Carbendazim (Carbamate) | Aptamer binding-induced current change using Au NPs | 520 pM – 0.52 mM | 520 pM | [24] |
The data demonstrates a clear drive towards extreme sensitivity, with some platforms achieving detection limits in the femtomolar (fM) range [24]. The use of advanced nanomaterials like metal-organic frameworks (MOFs) and gold nanoparticles is a common strategy to enhance sensor performance by providing a high surface area for enzyme or aptamer immobilization, improving stability, and amplifying the detection signal [74] [24].
Detailed Experimental Protocols
To bridge the lab-to-field gap effectively, protocols must be robust, reproducible, and designed with practical implementation in mind. The following are detailed methodologies for two prominent types of biosensors.
Protocol 1: Enzyme Inhibition-Mediated Distance-Based Paper (EIDP) Biosensor for Organophosphates
This protocol outlines the construction and use of an instrument-free biosensor for the visual detection of organophosphate pesticides (OPs), using malathion as a model compound [89].
Principle: The sensor exploits the inhibition of acetylcholinesterase (AChE). In a normal reaction, AChE hydrolyzes acetylthiocholine (ATCh) to produce thiocholine. Thiocholine interacts with Cu²⁺ ions in a synthesized copper alginate (Cu-Alg) hydrogel, disrupting its structure and releasing trapped water, which then flows a certain distance on pH paper. When AChE is inhibited by OPs, less thiocholine is produced, the hydrogel remains more intact, and the water flow distance is reduced. The concentration of OPs is quantified by measuring this reduction in flow distance.
Materials:
- Biochemicals: Acetylthiocholine (ATCh), Acetylcholinesterase (AChE) from Electrophorus electricus, Sodium alginate, Cupric chloride (CuCl₂), Tris-HCl buffer, Malathion standard.
- Consumables: pH paper strips (60 mm x 5 mm), Polyvinyl chloride (PVC) board (100 mm x 75 mm x 2 mm), Nitrogen gas.
- Equipment: Micropipettes, analytical balance, scanning electron microscope (for gel characterization, optional).
Procedure:
- Biosensor Assembly: Cut the pH paper to 60 mm x 5 mm. Clean the paper with ethanol and dry under a gentle stream of nitrogen gas. Affix the dried pH paper strip securely onto the PVC board.
- Hydrogel Preparation: Synthesize the Cu-Alg hydrogel by mixing a 0.2% (w/v) sodium alginate solution with a 1.5 mM CuCl₂ solution at room temperature. The optimal Cu²⁺ concentration should be determined experimentally to ensure proper gel formation and reactivity.
- Enzyme-Inhibitor Incubation: Incubate the AChE solution (0.06 U/mL) with the sample (containing OPs) or a buffer blank for 15 minutes at room temperature.
- Enzymatic Reaction: After incubation, add ATCh (3 mM final concentration) to the AChE-sample mixture and allow it to react for 10 minutes.
- Detection and Measurement:
- Place a small aliquot of the Cu-Alg hydrogel onto the starting point of the pH paper strip.
- Immediately add the reacted mixture from Step 4 onto the hydrogel droplet.
- Allow the solution to migrate along the paper strip for a fixed time (e.g., 10 minutes).
- Measure the final flow distance (in mm) from the origin to the leading edge of the liquid front.
- Quantification: Construct a calibration curve by plotting the flow distance against the logarithm of known concentrations of malathion standard. The concentration of OPs in an unknown sample can be determined by comparing its flow distance to the calibration curve.
Protocol 2: Smartphone-based Electrochemical Aptasensor for Carbendazim
This protocol describes the key steps for fabricating a highly sensitive, nanomaterial-enhanced aptasensor for carbendazim detection, with a smartphone serving as the potentiostat and data readout interface [88] [24].
Principle: The sensor uses a specific DNA aptamer as the biorecognition element. The aptamer is immobilized on a gold nanoparticle (Au NP)-modified electrode. Upon binding to carbendazim, the conformation of the aptamer changes, altering the electrochemical properties at the electrode interface. This change is measured as a current signal. The integration with a smartphone allows for portable, user-friendly operation and data processing.
Materials:
- Biochemicals: Carbendazim-specific aptamer (CBZA), Thiol-modified complementary DNA (SH-cCBZA), Graphene nanoribbons, MOF-808, Chloroauric acid (for Au NP synthesis).
- Consumables: Screen-printed carbon electrode (SPCE), Phosphate Buffered Saline (PBS).
- Equipment: Smartphone with custom app and potentiostat accessory (e.g., connected via audio jack or USB-C), electrochemical cell.
Procedure:
- Electrode Modification: a. Synthesis of Nanocomposite: Prepare a composite material of graphene nanoribbons and MOF-808. b. Electrode Coating: Drop-cast the nanocomposite onto the surface of the SPCE and allow it to dry. c. Electrodeposition of Au NPs: Perform electrodeposition using chloroauric acid solution to form a layer of Au NPs on the modified SPCE.
- Aptamer Immobilization: a. Thiol-Au Bonding: Incubate the electrode with the thiol-modified complementary DNA (SH-cCBZA) to form a self-assembled monolayer via Au-S bonds. b. Hybridization: Hybridize the CBZ aptamer (CBZA) with the immobilized complementary strand to form a double-stranded DNA structure on the electrode surface.
- Measurement with Smartphone System: a. Connection: Connect the modified SPCE to the smartphone via the potentiostat accessory. b. Sample Incubation: Apply the sample solution (containing carbendazim) to the sensor and incubate for a fixed period (e.g., 10-15 minutes). c. Signal Acquisition: Initiate the electrochemical measurement (e.g., differential pulse voltammetry) through the smartphone application. The binding of carbendazim to the aptamer causes the release of the aptamer strand, leading to a measurable increase in the current signal from a redox mediator.
- Data Analysis: The smartphone application automatically calculates the analyte concentration based on the calibrated current response, displaying the result directly on the screen. Data can be stored locally or transmitted to cloud servers for further analysis.
Visualizing Workflows and System Integration
Visual diagrams are essential for understanding the logical flow of experiments and the integration of system components in portable biosensing.
EIDP Biosensor Operational Workflow
The following diagram illustrates the step-by-step operational principle of the distance-based paper biosensor.
Diagram 1: EIDP Biosensor Operational Workflow
Smartphone-Based Biosensing System Architecture
This diagram outlines the architecture of a typical smartphone-based biosensing system, highlighting the integration of biological, electrical, and software components.
Diagram 2: Smartphone-Based Biosensing System Architecture
The Scientist's Toolkit: Essential Research Reagent Solutions
The development and operation of advanced biosensors rely on a suite of specialized reagents and materials. The table below details key components and their functions.
Table 2: Essential Research Reagents and Materials for Biosensor Development
| Reagent/Material | Function in Biosensor | Example Application |
|---|---|---|
| Acetylcholinesterase (AChE) | Catalytic bioreceptor; its inhibition by OPs or carbamates is the basis for detection. | Enzyme inhibition-based sensors (EIDP, AChE@AMOF-74) [74] [89]. |
| DNA Aptamers | Synthetic bioreceptors with high affinity and specificity for target molecules (e.g., pesticides). | Electrochemical and optical aptasensors for carbendazim, etc. [24]. |
| Metal-Organic Frameworks (MOFs) | Nanomaterials providing ultra-high surface area for enhanced enzyme/aptamer loading and stability. | AChE@AMOF-74 for paraoxon; MOF-808 in carbendazim aptasensor [74] [24]. |
| Gold Nanoparticles (Au NPs) | Enhance electrical conductivity; provide platform for thiol-based bioreceptor immobilization. | Electrode modification in voltammetric/amperometric aptasensors [24]. |
| Graphene Nanoribbons | Nanomaterial with excellent conductivity and large surface area for signal amplification. | Used in nanocomposite for electrode modification in electrochemical sensors [24]. |
| Microfluidic Paper | Low-cost, portable substrate that wicks fluids via capillary action, enabling assay automation. | Platform for distance-based detection and lateral flow assays [89]. |
The concerted focus on portability, miniaturization, and smartphone integration is decisively addressing the historical challenge of translating pesticide detection from the laboratory to the field. Platforms such as paper-based sensors and smartphone-coupled aptasensors exemplify this transition, offering a powerful combination of high sensitivity, speed, and ease of use. As these technologies continue to mature, supported by advancements in nanomaterials and wireless communication, they hold the promise of revolutionizing agricultural monitoring and food safety protocols, enabling decentralized, real-time analytical capabilities that were previously inaccessible.
Cost-Effectiveness and Scalability in Biosensor Manufacturing
The adoption of biosensor technology in modern agriculture, particularly for pesticide detection, is critically dependent on the cost-effectiveness and scalability of their manufacturing processes. The need for robust, simple, and portable detection systems to monitor pesticide residues in crop samples and soil has driven research into fabrication technologies that balance high performance with low production costs [12]. This application note details the scalable manufacturing technologies and experimental protocols that enable the production of practical biosensor devices for agricultural research, with a specific focus on detecting organophosphates, carbamates, and other pesticide classes.
Scalable Manufacturing Technologies for Biosensors
Scalable lithographic and printing techniques are fundamental to mass-producing biosensors with the reproducibility required for field deployment. The table below compares the key manufacturing methods applicable to pesticide biosensor fabrication.
Table 1: Comparison of Scalable Manufacturing Technologies for Biosensors
| Manufacturing Method | Minimum Feature Size | Throughput | Key Advantages | Key Limitations | Relevance to Pesticide Biosensors |
|---|---|---|---|---|---|
| Photolithography [90] | ~50 nm | High (>100 cm²/h) | Well-controlled large-area patterning; suitable for mass production | High system cost for nanoscale resolution; requires photomasks | Fabrication of high-density microelectrode arrays for electrochemical transducers |
| Soft Lithography [90] [91] | ~30 nm | Medium to High | No clean-room needed; suitable for flexible surfaces | Stamp deformation can cause defects; requires a master mold | Rapid prototyping of microfluidic channels for lab-on-a-chip pesticide sensors |
| Nanoimprint Lithography (NIL) [90] | ~5 nm | High | High resolution with hard, durable materials | New mold needed for design changes | Creating plasmonic nanostructures for enhanced optical sensing |
| Extrusion-Based 3D Printing [91] | ~100 µm | Low to Medium | Rapid design iteration; facile integration of multiple materials | Lower resolution; limited material choices for bio-inks | Manufacturing custom microfluidic cartridges and sensor housings |
| Vat Photopolymerization [91] | ~10-50 µm | Medium | Creates complex 3D structures with good surface quality | Limited to photopolymerizable resins | Fabrication of intricate fluidic valves and mixers for sample preparation |
Experimental Protocols for Pesticide Biosensor Fabrication and Testing
Protocol: Fabrication of a Microfluidic Biosensor via Stereolithography
This protocol outlines the steps for creating a microfluidic device that can be integrated with a biosensing element for pesticide detection [91].
1. Objectives and Applications:
- To fabricate a custom, monolithic microfluidic chip for the electrochemical detection of pesticides like chlorpyrifos.
- Primary Application: Serve as a sample handling and detection chamber in a portable pesticide biosensor.
2. Materials and Reagents:
- Substrate Material: Biocompatible photopolymer resin (e.g., PEGDA).
- Surface Modification Reagent: (3-Aminopropyl)triethoxysilane (APTES).
- Immobilization Reagent: Glutaraldehyde solution.
- Biological Element: Acetylcholinesterase (AChE) enzyme.
3. Step-by-Step Methodology: 1. CAD Design: Design the 3D model of the microfluidic chip, including inlet/outlet ports and a detection chamber, using computer-aided design (CAD) software. 2. File Conversion: Convert the CAD file into STL format and slice it into 2D layers using the printer's software. 3. 3D Printing: Print the device using a constrained-surface stereolithography (SLA) printer. The build platform is lowered into the resin vat, and a UV laser cures each layer sequentially. 4. Post-Processing: After printing, rinse the device in isopropanol to remove uncured resin and post-cure under UV light to ensure complete polymerization. 5. Surface Functionalization: - Activate the surface of the detection chamber with an oxygen plasma treatment. - Immerse the device in a 2% (v/v) APTES solution in ethanol for 1 hour to create an amine-terminated surface. - Rinse with ethanol and dry. - Flush the chamber with a 2.5% (v/v) glutaraldehyde solution in PBS for 30 minutes. - Rinse thoroughly with PBS to remove excess glutaraldehyde. 6. Bioreceptor Immobilization: Flush the functionalized detection chamber with a solution of AChE enzyme (1 mg/mL in PBS) and incubate for 2 hours at 4°C. Rinse with PBS to remove unbound enzyme. The biosensor is now ready for testing.
4. Critical Points for Quality Control:
- Ensure the photopolymer resin is well-agitated and free of bubbles before printing.
- Optimize UV exposure time to prevent over-curing (which can block channels) or under-curing (which reduces structural integrity).
- Confirm the success of surface functionalization by measuring the contact angle before (hydrophobic) and after (hydrophilic) plasma and APTES treatment.
Protocol: Electrochemical Detection of Organophosphate Pesticides using an Acetylcholinesterase (AChE) Biosensor
This protocol describes the use of an enzyme-based biosensor for the detection of organophosphate (OP) pesticides, which act as enzyme inhibitors [92] [12].
1. Principle:
- The activity of the immobilized AChE enzyme is measured electrochemically.
- OPs inhibit AChE, and the degree of inhibition is proportional to the pesticide concentration, leading to a reduced signal.
2. Materials and Reagents:
- Buffer: 0.1 M Phosphate Buffered Saline (PBS), pH 7.4.
- Enzyme Substrate: Acetylthiocholine (ATCh).
- Electrochemical Probe: Potassium ferricyanide, K₃[Fe(CN)₆].
- Standard Pesticide Solutions: Chlorpyrifos or malathion in a suitable solvent.
3. Step-by-Step Methodology: 1. Baseline Measurement: - Place the AChE-functionalized biosensor in an electrochemical cell containing 0.1 M PBS with 5 mM K₃[Fe(CN)₆]. - Perform a cyclic voltammetry (CV) scan from -0.2 V to +0.6 V (vs. Ag/AgCl) at a scan rate of 50 mV/s. This provides the baseline redox current. - Alternatively, for amperometry, add 1 mM ATCh and apply a fixed potential of +0.5 V, and record the steady-state current generated from the enzymatic hydrolysis of ATCh. 2. Inhibition (Assay): - Incubate the biosensor with a sample containing the target OP pesticide for 10-15 minutes. - Rinse the biosensor gently with PBS to remove unbound pesticide. 3. Post-Inhibition Measurement: - Record the CV or amperometric signal again under the same conditions as the baseline measurement. - The decrease in the redox current (in CV) or the enzymatic current (in amperometry) is correlated to the level of AChE inhibition.
4. Data Analysis:
- Calculate the percentage of inhibition (% Inhibition) using the formula:
% Inhibition = [(I₀ - I₁) / I₀] × 100where I₀ is the initial current and I₁ is the current after inhibition. - Generate a calibration curve by plotting % Inhibition against the logarithm of pesticide concentration. The limit of detection (LoD) for such sensors can be as low as 0.18 ng/mL for certain OPs [12].
The Scientist's Toolkit: Key Research Reagent Solutions
The table below lists essential materials and their functions for developing and manufacturing pesticide biosensors.
Table 2: Essential Research Reagents for Pesticide Biosensor Development
| Reagent / Material | Function / Role in Biosensing | Example Use Case |
|---|---|---|
| Acetylcholinesterase (AChE) [92] [12] | Catalytic bioreceptor; inhibition by OPs and carbamates provides the sensing mechanism. | Immobilized on electrodes for electrochemical detection of chlorpyrifos [12]. |
| Organophosphorus Hydrolase (OPH) [12] | Catalytic bioreceptor; directly hydrolyzes OPs, often producing a detectable proton. | Used in fluorometric or pH-based sensors for paraoxon detection [12]. |
| Anti-Glyphosate Antibody [12] | Affinity bioreceptor; specific binding to glyphosate herbicide. | Used in electrochemical immunosensors for detection in human urine [12]. |
| Aptamers [12] | Synthetic affinity bioreceptors; bind to specific pesticide targets with high specificity. | Can be used in optical or electrochemical aptasensors as a stable alternative to antibodies. |
| Glutaraldehyde [91] | Crosslinking agent; creates covalent bonds between amine groups on surfaces and enzymes. | Used to immobilize AChE onto APTES-functionalized surfaces in sensor fabrication. |
| (3-Aminopropyl)triethoxysilane (APTES) [91] | Silanizing agent; introduces amine (-NH₂) functional groups onto oxide surfaces (e.g., glass, ITO). | Provides a surface for subsequent crosslinking of bioreceptors. |
| Gold Nanoparticles | Signal amplification; enhance electron transfer in electrochemical sensors and enable plasmonic optical sensing. | Used in LSPR-based immunosensors for OPs [12] and for modifying fiber optic probes [93]. |
| Photopolymer Resin [91] | "Ink" for vat polymerization 3D printing; forms the structural components of the microfluidic device. | Used in SLA printing to create custom microfluidic chips for sample processing. |
Workflow and Signaling Visualizations
Pesticide Biosensor Workflow
Enzyme Inhibition Signaling
Performance Validation, Benchmarking, and Future Readiness
The accurate detection of pesticide residues in agricultural products and environmental samples is paramount for ensuring food safety and environmental health. Biosensors have emerged as powerful analytical tools for this purpose, offering rapid, sensitive, and often field-deployable solutions. The analytical performance of these biosensors is quantitatively described by several key metrics: Limit of Detection (LOD), Sensitivity, Specificity, and Linear Range [94]. These parameters are critical for researchers and developers to validate sensor performance, compare different sensing platforms, and ensure the reliability of data for regulatory and diagnostic decisions. A rigorous understanding of these metrics is indispensable for advancing biosensor technology from proof-of-concept to practical application in agricultural settings [94]. This document details the definitions, calculation methods, and experimental protocols for these core performance metrics within the context of pesticide detection biosensors.
Core Analytical Performance Metrics
Definitions and Theoretical Foundations
Limit of Detection (LOD): The LOD is the lowest concentration of an analyte that can be reliably distinguished from a blank sample (one containing no analyte). It is a measure of the ultimate sensitivity of the biosensor. The International Union of Pure and Applied Chemistry (IUPAC) defines LOD as the smallest solute concentration that an analytical system can distinguish with reasonable reliability from a blank [94]. It is strongly related to the probabilities of false positives (α) and false negatives (β). Commonly, LOD is calculated using the formula ( \text{LOD} = yB + k sB ), where ( yB ) is the mean blank signal, ( sB ) is the standard deviation of the blank signal, and ( k ) is a numerical factor (often 3) chosen according to the desired confidence level [94].
Sensitivity: In the context of calibration, sensitivity refers to the analytical sensitivity, which is the slope ((a)) of the calibration curve. It represents the change in the biosensor's response signal for a unit change in analyte concentration [94]. A steeper slope indicates a more sensitive biosensor, as small changes in concentration produce large changes in the output signal.
Specificity: Specificity refers to the biosensor's ability to respond exclusively to the target analyte and not to other interfering substances that may be present in the sample matrix. For pesticide biosensors, this ensures that the signal generated is due to the target pesticide and not from other co-existing pesticides, metabolites, or soil components [95] [24]. High specificity is often engineered through the choice of biorecognition element, such as highly selective aptamers or antibodies [24].
Linear Range: The linear range is the interval of analyte concentrations over which the biosensor's response changes linearly with concentration. Within this range, the analytical sensitivity is approximately constant, allowing for straightforward and accurate quantification of the analyte [94]. The lower end of the linear range is often bounded by the LOD, while the upper end is marked by the onset of signal saturation.
Performance Comparison of Pesticide Biosensors
The following table summarizes the analytical performance of various biosensing platforms reported in recent literature for the detection of specific pesticides, illustrating the practical application of these metrics.
Table 1: Analytical Performance of Selected Pesticide Biosensors
| Target Pesticide | Biosensor Type | Biorecognition Element | LOD | Linear Range | Specificity Notes | Ref. |
|---|---|---|---|---|---|---|
| Carbendazim (CBZ) | Colorimetric Aptasensor | DNA Aptamer | 2.2 nmol L⁻¹ | 2.2 – 500 nmol L⁻¹ | High specificity for CBZ over other fungicides | [95] |
| Carbendazim (CBZ) | Electrochemical Aptasensor | Dual DNA Aptamer | 0.2 femtomolar (fM) | 0.8 fM – 100 pM | Improved selectivity from dual aptamer design | [24] |
| Acetamiprid | Chemiluminescent Aptasensor | DNA Aptamer | 62 pmol L⁻¹ | Information not specified in source | High affinity of aptamer to target | [95] |
| Malathion | Fluorescent Aptasensor | DNA Aptamer | 4 pmol L⁻¹ | Information not specified in source | Specific aptamer conformation change | [95] |
| Streptavidin (Model System) | Optical Cavity Biosensor (OCB) | Biotin | 27 ng/mL (Optimized) | Information not specified in source | High specificity of biotin-streptavidin interaction | [96] |
Experimental Protocols for Metric Determination
This section provides a generalized, step-by-step protocol for determining the LOD, sensitivity, and linear range of a biosensor, using examples from pesticide detection.
Protocol: Establishing a Calibration Curve and Determining LOD
Principle: The protocol involves measuring the biosensor's response to a series of standard solutions with known concentrations of the target pesticide. A calibration curve is constructed, from which the sensitivity and linear range are derived. The LOD is calculated statistically from the blank and low-concentration measurements [94].
Materials:
- Biosensor platform (e.g., electrochemical cell, optical setup).
- Target pesticide standard (e.g., Carbendazim, Acetamiprid).
- Appropriate buffer for preparing standard solutions and sample dilution.
- Data acquisition system (e.g., potentiostat, spectrometer, CCD/CMOS camera).
Procedure:
- Preparation of Standard Solutions: Prepare a blank sample (pure buffer) and at least five standard solutions of the pesticide spanning a concentration range that covers the expected LOD to the point of sensor saturation. A minimum of five calibration points is recommended [94].
- Sensor Preparation: Functionalize the sensor surface with the appropriate biorecognition element (e.g., aptamer, antibody). For example, immobilize a thiolated aptamer on a gold nanoparticle-modified electrode via Au-S bonds [24].
- Signal Measurement:
- For each standard solution (including the blank), introduce the solution to the sensor and record the steady-state output signal (e.g., current, voltage, fluorescence intensity, wavelength shift).
- Repeat each measurement a minimum of
ntimes (e.g., n=3 or more) to assess repeatability. It is critical that these are independent measurements, not just replicates from the same sample aliquot [94]. - Rinse and regenerate the sensor surface between measurements if possible, to ensure consistent baseline performance.
- Data Analysis:
- Calculation of Mean and Standard Deviation: For each concentration, ( Ci ), calculate the mean signal ( \bar{y}i ) and standard deviation ( si ) using Equations 3 and 4 from the search results [94]: ( \bar{y}i = \frac{\sum{j=1}^{ni} y{ij}}{ni} ) ( si = \sqrt{\frac{\sum{j=1}^{ni} (y{ij} - \bar{y}i)^2}{ni - 1}} )
- Construction of Calibration Curve: Plot the mean signal (( \bar{y} )) against the analyte concentration (( C )). Perform a linear regression analysis on the data points within the linear range to obtain the calibration function: ( y = aC + b ), where
ais the sensitivity (slope) andbis the y-intercept. - Determination of LOD:
- Calculate the mean (( \bar{y}B )) and standard deviation (( sB )) of the blank measurements.
- Select a
kvalue based on the acceptable error probability. For k=3, the probability of a false positive is approximately 0.15% if the blank signal is perfectly Gaussian [94]. - Apply the formula: ( \text{LOD} = \frac{k \cdot s_B}{a} ).
Troubleshooting Tips:
- Non-linear Calibration: If the data is non-linear, a non-linear regression (e.g., sigmoidal fit) may be more appropriate. The linear range should then be reported as the concentration interval where the R² value of the linear fit exceeds a threshold (e.g., 0.98).
- High LOD: If the LOD is too high, consider signal amplification strategies, optimizing surface functionalization [96], or applying advanced signal processing techniques to reduce noise [97].
Workflow for Biosensor Development and Validation
The following diagram illustrates the logical workflow from sensor preparation to performance validation, integrating the protocols described above.
Diagram 1: Workflow for biosensor performance validation.
Advanced Techniques for Performance Enhancement
Signal Processing to Improve LOD
The ultimate LOD of optical biosensors is often limited by various noise sources. A simpler and cost-effective approach to lower the LOD is the application of advanced signal processing techniques. For instance, applying complex Morlet wavelet convolution to Fabry-Pérot interference fringes can effectively filter out white noise and low-frequency variations. Subsequent calculation of the average phase difference between filtered analyte and reference signals has been shown to reduce the LOD of porous silicon optical biosensors by almost an order of magnitude compared to traditional methods like reflective interferometric Fourier transform spectroscopy (RIFTS) or Interferogram Average over Wavelength (IAW) [97]. This method improves robustness against noise originating from the measurement system and light scattering.
Surface Functionalization for Improved Sensitivity and Specificity
The quality of the bioreceptor immobilization on the sensor surface directly impacts sensitivity and specificity. A critical step is the functionalization of the sensor surface to create a stable linker layer. A systematic comparison of 3-aminopropyltriethoxysilane (APTES) functionalization methods (ethanol-based, methanol-based, and vapor-phase) on an optical cavity-based biosensor revealed that the choice of protocol significantly affects performance. The methanol-based protocol (0.095% APTES) yielded a more uniform APTES layer, leading to enhanced streptavidin immobilization and a threefold improvement in LOD compared to previous results [96]. This underscores the importance of optimizing deposition conditions, such as solvent choice and concentration, to form a high-quality functional monolayer that maximizes receptor density and binding efficiency.
The Scientist's Toolkit: Research Reagent Solutions
Table 2: Essential Materials and Reagents for Biosensor Development
| Item | Function / Application | Example Use Case |
|---|---|---|
| Nucleic Acid Aptamers | Synthetic biorecognition elements; bind targets with high affinity and specificity. | Selective detection of pesticides like carbendazim and malathion in colorimetric or electrochemical aptasensors [95] [24]. |
| Gold Nanoparticles (AuNPs) | Signal transduction; color changes upon aggregation/dispersion. Used in electrochemical sensors to enhance conductivity and provide immobilization platforms. | Core element in colorimetric sensors; signal amplification in electrochemical electrodes [95] [24]. |
| Acetylcholinesterase (AChE) Enzyme | Biorecognition element for organophosphorus and carbamate pesticides, which inhibit its activity. | Enzyme-based biosensors where pesticide concentration correlates with inhibition of enzymatic activity [95]. |
| 3-Aminopropyltriethoxysilane (APTES) | Silane coupling agent for functionalizing glass/silica surfaces; provides amino groups for subsequent bioreceptor immobilization. | Creating a uniform linker layer on optical biosensors for attaching antibodies or other receptors [96]. |
| Methylene Blue | Electroactive redox mediator used in electrochemical biosensors. | Label for DNA aptamers; change in its oxidation current signals target binding [24]. |
| Metal-Organic Frameworks (MOFs) | Nanomaterials used to enhance electrode surface area and improve biosensor loading capacity and stability. | Signal amplification in electrochemical aptasensors for ultra-trace detection [24]. |
The validation of novel analytical biosensors against established gold-standard methods is a critical step in transitioning from innovative research to practical application. Within the field of pesticide detection for agricultural and food safety, liquid chromatography-tandem mass spectrometry (LC-MS/MS) and gas chromatography-tandem mass spectrometry (GC-MS/MS) represent the benchmark techniques for multi-residue analysis [98] [6]. These methods provide the sensitive, confirmatory data against which the performance of faster, cheaper biosensors must be rigorously correlated. This application note details the protocols and frameworks for conducting these essential correlation studies, providing researchers with a clear pathway to validate new biosensing technologies intended for use in sustainable agriculture and food safety monitoring.
Performance Benchmark: Gold-Standard Chromatographic Methods
Capabilities of LC-MS/MS and GC-MS/MS
Chromatographic methods coupled with tandem mass spectrometry are the cornerstone of modern pesticide residue analysis due to their exceptional sensitivity, specificity, and ability to screen hundreds of compounds simultaneously.
Table 1: Performance Characteristics of Gold-Standard Methods for Pesticide Analysis
| Method Characteristic | LC-MS/MS Performance | GC-MS/MS Performance | Key Applications & Notes |
|---|---|---|---|
| Typical Scope | Thermally labile, polar, or high molecular weight pesticides [99] | Volatile and semi-volatile pesticides [100] | Methods are often complementary; some labs use both |
| Sample Preparation | QuEChERS, μSPE [100] [101] | QuEChERS, Derivatization often needed [99] | QuEChERS is the modern standard for multi-residue analysis |
| Limit of Detection (LOD) | Low µg/kg (ppb) to sub-ppb levels [6] | Low µg/kg (ppb) to sub-ppb levels [100] | Enables compliance with stringent MRLs |
| Key Instrumental Features | Triple quadrupole (QqQ) with SRM [6] | Advanced Electron Ionization (AEI) source [100] | High-resolution MS (HRMS) is an emerging alternative [6] |
| Validation Compliance | CODEX, SANTE/12682/2019 [98] [6] | CODEX, SANTE/12682/2019 [98] [6] | Guidelines require monitoring of ion ratios etc. |
The selection between LC- and GC-based methods often depends on the physicochemical properties of the target pesticides. GC-MS/MS is particularly well-suited for volatile and semi-volatile compounds, while LC-MS/MS excels for those that are thermally labile, polar, or have high molecular mass [99] [100]. For comprehensive screening, methods utilizing both techniques are developed to cover a wide range of pesticides, as demonstrated in a study that validated a single method for 513 pesticides across various agricultural matrices [98].
The Role of Sample Preparation
Effective sample preparation is a prerequisite for accurate analysis. The QuEChERS (Quick, Easy, Cheap, Effective, Rugged, and Safe) method, introduced in 2003, has become the de facto standard for multi-residue pesticide analysis [100]. Its workflow involves acetonitrile extraction, partitioning via salting out, and a clean-up step using dispersive Solid-Phase Extraction (d-SPE). More recently, micro-Solid Phase Extraction (μSPE) has emerged as a miniaturized evolution, offering higher selectivity and improved removal of matrix interferences, which is crucial for complex samples like cereals or high-fat commodities [100].
Correlation Studies: Biosensors vs. Gold Standards
The core of validating a novel biosensor is a direct, experimental correlation study comparing its results with those obtained from the reference chromatographic method.
Experimental Design and Protocol
Protocol 1: Parallel Analysis for Biosensor Validation
- Objective: To establish the correlation between the biosensor's response and the gold-standard quantitative result for specific pesticides in relevant food matrices.
- Materials:
- Test Samples: A statistically significant number (n ≥ 20) of homogenized food samples (e.g., fruits, vegetables) are recommended. These should include both blank samples and samples fortified with target pesticides at concentrations spanning the expected range (e.g., from below the Maximum Residue Limit (MRL) to several times the MRL).
- Reference Method Instrumentation: LC-MS/MS or GC-MS/MS system. For example, a Thermo Scientific TSQ 9610 GC-MS/MS system equipped with an Advanced Electron Ionization (AEI) source can be used [100].
- Biosensor: The biosensor platform under validation (e.g., electrochemical, optical).
- Sample Preparation Equipment: Centrifuge, vortex mixer, appropriate buffers, and supplies for QuEChERS or μSPE.
- Procedure:
- Sample Preparation: Split each homogenized test sample into two representative aliquots.
- Reference Analysis: Prepare one aliquot according to the validated chromatographic method (e.g., QuEChERS followed by LC-MS/MS analysis) [101].
- Biosensor Analysis: Prepare the second aliquot according to the protocol optimized for the biosensor. This protocol may be simpler, potentially involving only dilution or minimal clean-up.
- Blind Measurement: Analyze the biosensor samples in a blinded fashion to avoid bias.
- Data Collection: Record the quantitative result from the reference method (in µg/kg) and the corresponding signal (e.g., current, fluorescence intensity, colorimetric shift) from the biosensor for each sample.
- Data Analysis:
- Perform a regression analysis (e.g., Deming regression) of the biosensor signal against the reference method concentration.
- Calculate key statistical parameters: coefficient of determination (R²), slope, intercept, and standard error of the estimate.
- A strong correlation is typically indicated by an R² value > 0.95, though this can vary based on the analyte and matrix.
Performance Metrics for Comparison
When correlating biosensor performance with gold-standard methods, the following metrics should be calculated and reported.
Table 2: Key Analytical Figures of Merit for Method Correlation
| Analytical Figure of Merit | Definition & Importance in Correlation | Target for a Validated Biosensor |
|---|---|---|
| Limit of Detection (LOD) | The lowest concentration that can be reliably distinguished from a blank. Must be below the relevant MRL. | Below the Codex Alimentarius MRL; often in the low µg/kg range [8] [6] |
| Accuracy (Recovery %) | Measure of how close the biosensor result is to the reference method value. | Typically 70-120% recovery in the matrix of interest [98] |
| Precision (% CV) | The repeatability of the measurement, expressed as the coefficient of variation. | Average CV < 10% is generally acceptable [99] |
| Linear Dynamic Range | The concentration interval over which the biosensor response is linear. | Should cover from the LOD to at least the MRL |
| Matrix Effect | The influence of co-extracted sample components on the analytical signal. | Should be minimal or corrected for (e.g., with internal standards) [99] |
Visualizing the Validation Workflow
The following diagram illustrates the logical workflow for validating a biosensor against gold-standard methods, from experimental setup to data interpretation.
The Scientist's Toolkit: Essential Research Reagents & Materials
The development and validation of biosensors for pesticide detection rely on a specific set of reagents, materials, and instrumentation.
Table 3: Key Research Reagent Solutions for Biosensor Validation
| Category | Item | Function & Application | Example/Note |
|---|---|---|---|
| Sample Prep | QuEChERS Kits | Standardized extraction & clean-up for multi-residue analysis [100] | Available from various suppliers (e.g., Thermo Fisher) |
| μSPE Cartridges | Miniaturized SPE for selective matrix removal [100] | Improved clean-up for complex matrices | |
| Biosensor Components | Biorecognition Elements | Provides specificity to the target analyte [8] [102] | Antibodies, aptamers, enzymes (e.g., AChE) |
| Nanomaterials | Enhances signal transduction and sensitivity [103] [8] | Gold nanoparticles (AuNPs), carbon nanotubes (CNTs) | |
| Transducers | Converts biological interaction into measurable signal [103] [8] | Electrochemical, optical (colorimetric, fluorescent) | |
| Reference Analysis | GC-MS/MS System | Gold-standard quantification for volatile pesticides [100] | e.g., Thermo Scientific TSQ 9610 |
| LC-MS/MS System | Gold-standard quantification for non-volatile pesticides [98] [101] | Triple quadrupole (QqQ) common | |
| Critical Reagents | Pesticide Standards | For calibration of both reference method and biosensor [99] | Certified reference materials (CRMs) required |
| Internal Standards | Corrects for matrix effects and variability [99] | Deuterated or isotope-labeled analogs |
Rigorous correlation studies with established chromatographic methods are non-negotiable for affirming the reliability and applicability of novel biosensors. By adhering to structured experimental protocols, focusing on key analytical performance metrics, and understanding the complementary nature of GC-MS/MS and LC-MS/MS, researchers can robustly validate their biosensor technologies. This process is fundamental for gaining regulatory and end-user acceptance, ultimately paving the way for the deployment of these innovative tools in ensuring sustainable agricultural practices and global food safety.
Biosensors have emerged as powerful analytical tools for pesticide detection, offering rapid, cost-effective, and on-site monitoring capabilities that complement traditional laboratory-based methods [104]. These devices integrate a biological recognition element with a transducer that converts a biological response into a quantifiable signal [105]. Within the specific context of agricultural research and pesticide detection, three principal biosensor platforms have gained significant prominence: electrochemical, optical, and whole-cell systems. Each platform exhibits distinct operational mechanisms, advantages, and limitations, making them uniquely suited for particular applications and experimental requirements. This analysis provides a comprehensive comparison of these three biosensor architectures, focusing on their implementation for monitoring pesticide residues in environmental and food matrices. By synthesizing current research trends and performance data, this review aims to equip researchers and scientists with the necessary information to select appropriate biosensing strategies for their specific pesticide detection challenges.
Biosensor Platform Fundamentals and Operational Principles
Electrochemical Biosensors
Electrochemical biosensors function by detecting changes in electrical properties—such as current, potential, or impedance—resulting from biochemical reactions at the transducer surface [105] [106]. The core configuration involves a biological recognition element (e.g., enzyme, antibody, aptamer) immobilized on an electrode surface. When the target analyte interacts with this biorecognition layer, it triggers an electrochemical reaction that generates or consumes electroactive species, producing a measurable electrical signal [106].
These biosensors are categorized based on their transduction method:
- Amperometric sensors measure current generated by redox reactions at a constant applied potential [106].
- Potentiometric sensors detect potential differences across an electrode interface [106].
- Impedimetric sensors monitor changes in electrical impedance resulting from binding events [106].
For pesticide detection, enzymatic platforms utilizing acetylcholinesterase (AChE) represent a predominant strategy, where organophosphorus and carbamate pesticides are detected through their inhibitory effect on AChE activity [59]. The resulting reduction in enzymatic conversion of substrates to electroactive products (e.g., thiocholine from acetylthiocholine) provides a quantifiable signal correlating with pesticide concentration [106].
Optical Biosensors
Optical biosensors transduce biorecognition events into measurable optical signals through various mechanisms including absorbance, fluorescence, chemiluminescence, surface plasmon resonance (SPR), and surface-enhanced Raman spectroscopy (SERS) [107] [6]. These sensors operate by monitoring changes in light properties—such as intensity, wavelength, polarization, or phase—induced by the interaction between the target analyte and an immobilized biorecognition element on an optically active surface [108] [107].
Common optical configurations for pesticide detection include:
- Fluorescence-based sensors utilizing quantum dots, carbon dots, or fluorescent dyes, where pesticide presence quenches or enhances emission intensity [59] [107].
- Colorimetric sensors detecting visible color changes observable by naked eye or spectrophotometry [59] [6].
- SPR sensors monitoring refractive index changes near a metal surface upon pesticide binding [107].
- SERS platforms leveraging nanoparticle-enhanced Raman scattering for ultrasensitive detection [107] [6].
These systems frequently employ enzymes, antibodies, or aptamers as recognition elements, with nanomaterials often incorporated to enhance signal transduction and overall sensitivity [59] [107].
Whole-Cell Biosensors
Whole-cell biosensors utilize living microorganisms (e.g., bacteria, microalgae), cellular components (e.g., chloroplasts, thylakoids), or tissues as biological recognition elements [109]. These systems detect pesticides through physiological responses of the biological entity, most commonly by monitoring inhibitory effects on photosynthetic activity in algal or plant-based systems [109].
The primary detection mechanisms include:
- Photosynthetic inhibition assays measuring changes in chlorophyll fluorescence or electron transport efficiency in photosystem II (PSII) [109].
- Metabolic activity monitoring through oxygen consumption/production or impedance changes [109].
- Bioluminescence reporting using genetically engineered microorganisms with pesticide-responsive promoters [109].
These biosensors are particularly valuable for detecting herbicides that specifically target photosynthetic pathways, such as atrazine and diuron, providing functional information about pesticide activity rather than mere presence [109].
Table 1: Comparative Performance Metrics for Biosensor Platforms in Pesticide Detection
| Performance Parameter | Electrochemical | Optical | Whole-Cell |
|---|---|---|---|
| Detection Limit | ng/L to μg/L [104] | ng/L to μg/L [107] [6] | μg/L range [109] |
| Response Time | Seconds to minutes [110] | Minutes [110] | Minutes to hours [109] |
| Assay Multiplexing | Limited [110] | High capability [108] [110] | Moderate |
| Sample Throughput | High [104] | Moderate to High [6] | Low to Moderate |
| Portability | Excellent [104] [108] | Moderate (varies by technique) [108] | Low to Moderate |
| Lifetime/Stability | Minutes to months (varies by design) [110] | Up to several years [110] | Days to weeks (requires biological activity) [109] |
Comparative Analysis of Biosensor Platforms
Strengths and Advantages
Electrochemical Biosensors offer several compelling advantages for pesticide detection. Their exceptional sensitivity enables detection of pesticides at trace concentrations (ng/L to μg/L) relevant to regulatory limits [104]. These systems provide rapid response times (seconds to minutes), facilitating real-time monitoring capabilities [110]. Additionally, electrochemical platforms feature compact designs that enable miniaturization and portability for field-deployable analysis [104] [108]. They demonstrate robustness in complex sample matrices like turbid biological fluids or environmental samples with minimal pretreatment requirements [105]. From an economic perspective, these sensors benefit from low-cost production using established electrode fabrication technologies and simple instrumentation [108] [110].
Optical Biosensors excel in specific performance characteristics. They provide superior sensitivity with extremely low detection limits, particularly in fluorescence- and SPR-based configurations [108] [107]. These platforms support high multiplexing capabilities, allowing simultaneous detection of multiple pesticide residues through different optical signatures or spatial addressing [108] [110]. Many optical formats enable non-invasive, real-time monitoring without consumable reagents [108]. They also facilitate direct, label-free detection of binding events through techniques like SPR [107]. Furthermore, the visual output of colorimetric sensors permits rudimentary analysis without sophisticated instrumentation [59] [6].
Whole-Cell Biosensors offer unique benefits derived from their biological nature. They provide functional assessment of pesticide activity rather than mere presence, delivering biologically relevant information about toxicity [109]. These systems can detect unknown compounds through their physiological effects on living systems [109]. They are particularly well-suited for detecting photosynthetic inhibitors like herbicides through direct measurement of PSII inhibition [109]. Whole-cell platforms also represent a cost-effective approach, as biological components can be readily produced through culture without complex purification [109].
Limitations and Challenges
Electrochemical Biosensors face several technical constraints. Electrode fouling from non-specific adsorption in complex matrices can degrade sensor performance over time [106] [110]. These systems may experience interference from redox-active compounds present in environmental samples [106]. Limited multiplexing capability restricts simultaneous detection of multiple pesticides compared to optical platforms [110]. Additionally, electrochemical systems often require regular calibration and reference electrodes to maintain measurement accuracy [110].
Optical Biosensors confront distinct implementation challenges. Sophisticated optical components (e.g., lasers, detectors, optical alignment systems) can increase instrument cost and complexity [108] [110]. Performance may be compromised by background interference from light scattering or autofluorescence in complex samples [110]. Sample turbidity or color can interfere with signal detection in certain configurations [107]. Environmental factors like temperature fluctuations and pH variations can affect signal stability [110]. Additionally, many optical systems lack portability, confining them to laboratory settings [108].
Whole-Cell Biosensors present unique biological limitations. Limited long-term stability due to the viability requirements of biological components restricts shelf life and usage duration [109]. Extended response times compared to other platforms result from the need for physiological responses to develop [109]. These systems demonstrate relatively low specificity, as multiple stressors can induce similar physiological responses [109]. Complex storage and handling requirements are necessary to maintain cell viability and function [109]. Additionally, quantitative accuracy may be limited by variability in biological responses [109].
Table 2: Application Suitability Across Biosensor Platforms
| Application Context | Recommended Platform | Rationale |
|---|---|---|
| Routine Field Screening | Electrochemical | Portability, rapid results, cost-effectiveness [104] [108] |
| High-Sensitivity Laboratory Analysis | Optical | Superior detection limits, multiplexing capability [108] [107] |
| Toxicity Assessment | Whole-Cell | Functional activity measurement, biologically relevant data [109] |
| Herbicide Specific Detection | Whole-Cell (photosynthetic) | Direct targeting of photosynthetic apparatus [109] |
| Multi-Residue Analysis | Optical (especially fluorescence) | Parallel detection capabilities [107] [6] |
| Continuous Monitoring | Electrochemical | Real-time capability, robust operation [104] [106] |
Research Reagent Solutions and Essential Materials
Table 3: Key Research Reagents for Biosensor Development
| Reagent/Material | Function | Example Applications |
|---|---|---|
| Acetylcholinesterase (AChE) | Enzyme inhibition-based detection of organophosphates and carbamates [59] | Electrochemical, optical (colorimetric, fluorescent) biosensors [59] [106] |
| Antibodies | Molecular recognition for specific pesticide antigens [106] | Immunosensors (electrochemical, optical) [106] |
| Aptamers | Synthetic nucleic acid recognition elements [104] [59] | Aptasensors (electrochemical, optical) [104] [59] |
| Quantum Dots/Nanoparticles | Signal amplification, fluorescence labeling [59] [107] | Fluorescence-based optical sensors [59] [107] |
| Algae/Photosynthetic Cells | Photosynthetic activity inhibition detection [109] | Whole-cell biosensors for herbicides [109] |
| Thylakoids/Chloroplasts | Isolated photosynthetic components [109] | Subcellular biosensors for herbicide detection [109] |
| Molecularly Imprinted Polymers (MIPs) | Synthetic biomimetic recognition materials [59] | Enzyme-free sensors (electrochemical, optical) [59] |
| Screen-Printed Electrodes | Disposable, miniaturized electrochemical platforms [59] | Portable electrochemical biosensors [59] |
Experimental Protocols
Protocol 1: Electrochemical Acetylcholinesterase Inhibition Biosensor
Principle: Organophosphorus and carbamate pesticides inhibit AChE activity, reducing enzymatic conversion of acetylthiocholine to thiocholine, which is electrochemically detected [106].
Materials:
- Acetylcholinesterase enzyme
- Acetylthiocholine chloride substrate
- Phosphate buffer (0.1 M, pH 7.4)
- Screen-printed carbon electrodes
- Potentiostat instrument
- Pesticide standard solutions
Procedure:
- Electrode Modification: Immobilize AChE on working electrode surface using cross-linking (glutaraldehyde) or entrapment (polymeric matrix) methods [106].
- Baseline Measurement: Record amperometric current response at +0.7 V vs. Ag/AgCl in buffer containing 0.5 mM acetylthiocholine substrate [106].
- Inhibition Phase: Incubate modified electrode in sample containing potential AChE inhibitors (pesticides) for 10-15 minutes [106].
- Post-Inhibition Measurement: Measure current response again under identical conditions as step 2 [106].
- Quantification: Calculate percentage inhibition from current decrease: % Inhibition = [(I₀ - I)/I₀] × 100, where I₀ and I are currents before and after inhibition [106].
- Data Analysis: Determine pesticide concentration from calibration curve of % inhibition versus standard concentrations [106].
Protocol 2: Fluorescence-Based Microfluidic Sensor
Principle: Quantum dot fluorescence is quenched by thiocholine produced from AChE-catalyzed hydrolysis. Pesticide inhibition preserves fluorescence intensity [59].
Materials:
- CdTe quantum dots (QDs)
- Acetylcholinesterase enzyme
- Acetylthiocholine iodide
- Microfluidic chip
- Fluorescence spectrophotometer or imager
- Smartphone-based detection platform (optional)
Procedure:
- Sensor Fabrication: Integrate 3D CdTe QD aerogel into microfluidic detection zone [59].
- Enzyme Introduction: Immobilize AChE in upstream chamber or mix with substrate prior to detection zone [59].
- Baseline Measurement: Record fluorescence intensity (excitation 365 nm) with substrate-only flow (no pesticide) [59].
- Sample Analysis: Introduce sample potentially containing pesticides, followed by enzyme-substrate mixture [59].
- Signal Detection: Monitor fluorescence recovery proportional to pesticide concentration due to AChE inhibition [59].
- Quantification: Use smartphone camera with color analysis application to quantify intensity changes for field deployment [59] [6].
Protocol 3: Whole-Cell Photosynthetic Inhibition Biosensor
Principle: Herbicides inhibit photosynthetic electron transport in PSII, reducing chlorophyll fluorescence yield and electron transport rate [109].
Materials:
- Freshwater microalgae (e.g., Chlorella, Scenedesmus)
- OR thylakoid membranes isolated from spinach
- Chlorophyll fluorescence measuring system (PAM fluorometer)
- Incubation chamber with controlled illumination
- Oxygen electrode (optional)
Procedure:
- Biological Preparation: Culture algae to logarithmic growth phase or isolate fresh thylakoid membranes [109].
- Sample Exposure: Incurate algal cells or thylakoids with water samples containing potential herbicides for 10-30 minutes [109].
- Fluorescence Measurement: Apply saturating light pulse to determine maximum quantum yield of PSII: Fv/Fm = (Fm - F₀)/Fm, where F₀ is minimal and Fm is maximal fluorescence [109].
- Electron Transport Assay: Monitor oxygen evolution rate (for algae) or artificial electron acceptor reduction (for thylakoids) [109].
- Inhibition Calculation: Percentage inhibition = [1 - (Fv/Fm)sample/(Fv/Fm)control] × 100 [109].
- Herbicide Quantification: Compare inhibition values to calibration curve from herbicide standards [109].
Signaling Pathways and Detection Mechanisms
Diagram 1: Signaling pathways for the three main biosensor platforms showing detection mechanisms from pesticide interaction to measurable signal output.
The comparative analysis of electrochemical, optical, and whole-cell biosensor platforms reveals distinct operational profiles that position each technology for specific applications in pesticide detection research. Electrochemical biosensors offer compelling advantages in field deployment scenarios requiring portability, rapid analysis, and cost-effectiveness. Optical platforms provide superior sensitivity and multiplexing capabilities for laboratory-based screening requiring low detection limits. Whole-cell systems deliver unique functional assessment of pesticide activity, particularly for herbicides targeting photosynthetic pathways.
The optimal selection of biosensor platform depends fundamentally on the specific research requirements, including target pesticides, required detection limits, sample matrix complexity, available resources, and desired information (presence versus activity). Future development trajectories point toward hybrid approaches that combine strengths from multiple platforms, integration of nanomaterials for enhanced performance, and increased automation for high-throughput screening. As research advances, these biosensor technologies will play an increasingly vital role in comprehensive pesticide monitoring strategies, complementing conventional analytical methods while providing unprecedented capabilities for on-site analysis and real-time decision-making in agricultural and environmental contexts.
Analysis of Commercialization Trends and AgTech Investment in Diagnostic Platforms
The agricultural technology (AgTech) sector is undergoing a significant transformation, driven by the urgent need to address global food security, climate change resilience, and environmental sustainability. Within this broad landscape, diagnostic platforms—particularly advanced biosensors for pesticide detection—have emerged as a critical growth area. These platforms are transitioning from laboratory curiosities to commercially viable solutions that offer rapid, sensitive, and on-site analysis of critical food safety parameters. The global AgTech ecosystem market, valued at $26.36 billion in 2025, is projected to grow at a compound annual growth rate (CAGR) of 10.56% to reach $65.04 billion by 2034 [111]. Concurrently, the specific market for pesticide detection is expected to rise from $1.50 billion in 2025 to $2.43 billion by 2035, reflecting a CAGR of 4.9% [112]. This growth is fueled by stringent regulatory standards for pesticide residues, rising consumer awareness about food safety, and the pressing need to reduce agriculture's environmental footprint. Investment trends in 2025 reveal a strategic shift towards technologies that demonstrate not only innovation but also proven field deployment and a clear path to profitability. While venture capital remains active, there is a heightened focus on startups that leverage artificial intelligence (AI), robotics, and nanotechnology to solve tangible problems for farmers. These diagnostic platforms are increasingly integrated into a broader precision agriculture framework, enabling data-driven decision-making that optimizes crop protection, minimizes input waste, and ensures compliance with food safety regulations across the global supply chain.
Market Analysis and Commercialization Trends
The commercialization landscape for AgTech diagnostic platforms is characterized by rapid digital adoption, a focus on sustainability, and the convergence of multiple advanced technologies.
The AgTech market as a whole provides the context for the growth of diagnostic platforms. The market's robust expansion is underpinned by the widespread integration of digital technologies.
Table: AgTech Ecosystem Market Key Metrics (2024-2025)
| Metric | 2024/2025 Value | Significance |
|---|---|---|
| Global AgTech Ecosystem Market Size | $26,363.03 million (2025) [111] | Baseline market value |
| Projected Market Size (2034) | $65,040.82 million [111] | Indicates strong growth trajectory |
| CAGR (2025-2034) | 10.56% [111] | Sustained expansion rate |
| Farms Adopting at Least One AgTech Solution | >65% globally (2024) [111] | High penetration of technology |
| Active AgTech Startups | >4,500 [111] | Vibrant and competitive innovation landscape |
Trends in Diagnostic and Detection Technologies
Within the AgTech ecosystem, diagnostic platforms for pesticide detection are evolving to meet demands for speed, accuracy, and field-deployability.
- Shift from Conventional to Rapid Methods: Traditional methods like gas chromatography (GC) and high-performance liquid chromatography (HPLC) are considered the "gold standard" for accuracy and sensitivity, dominating the market with a 54% share [112]. However, they are labor-intensive, require sophisticated laboratory setups and skilled personnel, and are not suited for on-site analysis [7]. This has accelerated the development and commercialization of rapid biosensing techniques.
- Rise of Multi-Residue Methods (MRMs): MRMs are gaining significant market traction, projected to capture over 54% of the pesticide detection market in 2025 [112]. Their appeal lies in the ability to detect multiple pesticide residues in a single test, drastically reducing analysis time and cost while improving efficiency for regulatory compliance and supply chain monitoring.
- Adoption of Biosensors and Nano-biosensors: Biosensors are emerging as a viable alternative to supplement traditional methods. Their advantages include high sensitivity, rapid response, cost-effectiveness, and potential for miniaturization for on-site use [86] [8]. The integration of nanomaterials (e.g., gold nanoparticles, carbon nanotubes, nanohybrids) has been a key commercial innovation, enhancing sensitivity and specificity by providing a high surface-to-volume ratio for biorecognition element immobilization and improved signal transduction [8].
- Integration with Broader Digital Systems: Commercial diagnostic platforms are no longer standalone devices. They are increasingly part of integrated systems that combine sensing with data analytics, farm management software, and automated decision-support tools. This trend is reflected in the finding that 61% of farm management platforms now include predictive analytics for yield optimization [111].
Table: Comparison of Pesticide Detection Technology Platforms
| Technology Platform | Key Principles | Commercial Advantages | Inherent Limitations |
|---|---|---|---|
| Chromatography (GC, HPLC) | Separation of chemical mixtures for identification and quantification [112]. | High accuracy, sensitivity, and reliability; regulatory gold standard [112]. | High equipment cost, requires skilled operators, time-consuming, lab-bound [7]. |
| Immunosensors | Measurement of signal from specific antigen-antibody binding [7]. | High specificity, potential for portability, rapid analysis [7]. | Complex and costly antibody development; can be susceptible to cross-reactivity [7]. |
| Enzyme Biosensors | Detection based on enzyme inhibition by pesticides [7] [8]. | Broad detection for inhibitor classes (e.g., organophosphates), simple design [8]. | Cannot identify specific pesticides; can yield false positives/negatives [7]. |
| Aptamer Sensors | Use of synthetic single-stranded DNA/RNA as recognition elements [7]. | High specificity and affinity; more stable and cheaper to produce than antibodies [7]. | Selection of optimal aptamers (SELEX process) can be complex [7]. |
| Microbial/Cell Sensors | Use of living cells to detect toxicity or specific degradation products [7]. | Can measure functional toxicological effects (e.g., cytotoxicity) [112]. | Longer response times; maintaining cell viability can be challenging [7]. |
AgTech Investment Landscape
The investment climate for AgTech in 2025 is marked by a strategic refinement. After a period of high growth, investors are now prioritizing capital efficiency, proven technologies with real-world farmer adoption, and a clear path to profitability.
Key Investment Trends and Drivers
- Market Correction and Refined Focus: AgTech funding saw a slight decline in early 2025, with a 2% drop in funding and a 14% decline in deals from Q4 2024 [113]. This has reset expectations, shifting the focus from pure growth to scalable business models with demonstrated efficacy and customer buy-in.
- Dominance of AI and Automation: A significant portion of investment is directed towards AI-driven solutions. In 2024, over 63% of AgTech investments were allocated to AI-driven analytics and automation [111]. Investors seek startups that use AI to solve core problems, such as interpreting sensor data for precise pesticide application or predicting yield outcomes, rather than those merely using "AI" as a label.
- Addressing Structural Drivers: Long-term investment remains strong due to undeniable global challenges: feeding a population projected to reach 9.7 billion by 2050, adapting to climate change-induced volatility, and addressing persistent labor shortages in agriculture [114] [111]. These drivers create enduring opportunities for diagnostic technologies that enhance resilience and productivity.
- Regional Hotspots: North America continues to lead in AgTech investment, holding 38% of the global market share, followed by Europe at 27% [111]. However, markets like India and Latin America are seeing growing interest due to their vast agricultural bases and potential for impact, particularly for solutions tailored to smallholder farmers [113].
Leading AgTech Investors and Strategic Interests
The investor landscape is a mix of specialized venture capital firms, corporate venture arms, and impact investors.
Table: Select AgTech Investors and Their Focus in 2025
| Investor | Investment Focus & Thesis | Notable Investments / Interests |
|---|---|---|
| AgFunder | Food & agriculture tech across the value chain; focus on AI and robotics [113]. | Inari, Plenty, Bear Flag Robotics [113]. |
| S2G Investments | Multi-stage investor in sustainable food systems, alternative proteins, farm tech [113]. | Apeel Sciences, Atomo Coffee, Arable [113]. |
| Omnivore | Indian AgTech, smallholder farmer solutions, climate-resilient agriculture [113]. | DeHaat, Arya, AgNext [113]. |
| Syngenta Ventures | Corporate venture arm; focuses on digital ag, biotech, sustainable farming [113]. | Strategic investments aligned with Syngenta's R&D pipeline [113]. |
| Leaps by Bayer | Corporate venture; breakthrough innovations in life sciences for agriculture [113]. | Exploring epigenetics for climate variability resilience [113]. |
| FMC Ventures | Sustainable agriculture solutions, biologicals, digital tools [113]. | Seeking disruption in crop protection [113]. |
Corporate venture arms like Syngenta Ventures and Leaps by Bayer are particularly significant for diagnostic platform startups, as they offer not only capital but also access to global R&D expertise, distribution networks, and direct pathways to commercialization within established agricultural supply chains [113].
Experimental Protocols for Biosensor Development
For researchers developing the next generation of biosensors for pesticide detection, standardized protocols are essential for validation and comparison. Below are detailed methodologies for two primary types of biosensors.
Protocol 1: Electrochemical Aptasensor for Organophosphate Pesticides
This protocol details the development of a high-sensitivity biosensor using an aptamer as the biorecognition element and an electrochemical transducer [7] [8].
1. Sensor Fabrication and Functionalization: - Working Electrode Preparation: Polish a gold (Au) or glassy carbon electrode (GCE) sequentially with alumina slurry (1.0, 0.3, and 0.05 µm) on a microcloth. Rinse thoroughly with deionized water and dry under nitrogen stream [8]. - Nanomaterial Modification: Deposit a suspension of functionalized nanomaterials (e.g., multi-walled carbon nanotubes (MWCNTs) or gold nanoparticles (AuNPs)) onto the clean electrode surface. Allow to dry, enhancing the active surface area and electron transfer kinetics [8]. - Aptamer Immobilization: Incubate the modified electrode with a solution of the thiolated or amino-modified aptamer specific to the target pesticide (e.g., chlorpyrifos). This forms a self-assembled monolayer on gold surfaces or can be coupled via cross-linkers on other surfaces. Rinse to remove unbound aptamers [8].
2. Measurement and Detection Procedure: - Apparatus Setup: Use a potentiostat connected to a three-electrode system: the functionalized working electrode, a platinum wire counter electrode, and an Ag/AgCl reference electrode. - Sample Incubation: Incubate the functionalized electrode with the sample solution (e.g., fruit/vegetable extract) containing the target pesticide for a fixed period (e.g., 10-30 minutes) to allow binding. - Electrochemical Measurement: Perform electrochemical impedance spectroscopy (EIS) in a solution containing 5mM (\text{[Fe(CN)6]^{3-/4-}}) and 0.1M KCl. The charge transfer resistance ((R{ct})) will increase proportionally with pesticide concentration, as the binding event hinders electron transfer. - Data Analysis: Calculate the pesticide concentration from the change in (R_{ct}) using a pre-established calibration curve.
3. Validation: - Validate the sensor's performance against standard methods like GC-MS or HPLC-MS for the same sample set to determine accuracy and reliability [86] [112].
Protocol 2: Optical Enzyme Biosensor for Carbamate Pesticides
This protocol utilizes the principle of enzyme inhibition for the detection of pesticide classes like carbamates and organophosphates [7] [8].
1. Biosensor Assembly: - Enzyme Immobilization: Immobilize the enzyme acetylcholinesterase (AChE) onto a solid support, such as a cellulose membrane or a spectrometric cuvette. This can be done via physical adsorption or covalent cross-linking with glutaraldehyde. - Optical Transducer Setup: Use a spectrophotometer or fluorometer for measurement. For a colorimetric assay, the transducer can be as simple as a smartphone camera with controlled lighting.
2. Inhibition Assay Procedure: - Baseline Activity Measurement: Introduce the substrate acetylthiocholine (ATCH) and the colorimetric agent 5,5'-dithio-bis-(2-nitrobenzoic acid) (DTNB) to the immobilized AChE. Measure the initial rate of yellow-colored 2-nitro-5-thiobenzoate anion (TNB) production at 412 nm. This is the uninhibited reaction rate ((v0)). - Inhibition Step: Incubate the AChE with the sample solution containing the pesticide for a set time (e.g., 10 minutes). - Inhibited Activity Measurement: Re-introduce the substrate (ATCH) and DTNB. Measure the new, lower rate of TNB production ((vi)). - Data Analysis: The percentage of enzyme inhibition is calculated as: (\% Inhibition = [(v0 - vi) / v_0] \times 100). The pesticide concentration is determined by interpolating this value onto a calibration curve of inhibition (%) vs. log (pesticide concentration).
3. Regeneration (Optional): - The sensor can sometimes be regenerated for reuse by washing with a solution of pyridine-2-aldoxime methochloride (2-PAM), which reactivates the inhibited enzyme.
Visualization of Experimental Workflows
The following diagrams illustrate the logical flow and components of the key biosensor protocols described above.
Electrochemical Aptasensor Workflow
Optical Enzyme Inhibition Assay
The Scientist's Toolkit: Key Research Reagent Solutions
The development and deployment of advanced biosensors rely on a suite of specialized reagents and materials. The following table details essential components for constructing and optimizing pesticide detection platforms.
Table: Essential Research Reagents for Biosensor Development
| Reagent/Material | Function & Application | Examples & Notes |
|---|---|---|
| Biorecognition Elements | Provides specificity by binding to the target pesticide analyte. The choice defines the sensor's core mechanism [7]. | Aptamers (synthetic DNA/RNA; highly specific, stable) [7].Enzymes (e.g., AChE; for inhibition-based detection of organophosphates/carbamates) [8].Antibodies (for immunosensors; high specificity but costly) [7]. |
| Nanomaterials | Enhances sensor signal, improves immobilization of bioreceptors, and increases sensitivity and stability [8]. | Gold Nanoparticles (AuNPs): Excellent conductivity and biocompatibility [8].Carbon Nanotubes (CNTs): High surface area, promote electron transfer [8].Nanohybrids (e.g., Graphene-Gold): Combine properties of multiple materials for superior performance [8]. |
| Electrochemical Redox Probes | Generates a measurable current or impedance change in electrochemical biosensors [115]. | (\text{[Fe(CN)₆]^{3-/4-}}) is a standard probe for EIS and cyclic voltammetry. The change in its electron transfer efficiency upon pesticide binding is the key signal [115]. |
| Enzyme Substrates & Chromogens | Enables optical detection in enzyme-based biosensors by producing a measurable color or fluorescence change [8]. | Acetylthiocholine (ATCH): Substrate for AChE.DTNB: Chromogen that reacts with thiocholine (from ATCH hydrolysis) to produce a yellow color (TNB) measurable at 412 nm [8]. |
| Immobilization Matrices | Provides a stable solid support for attaching biorecognition elements to the transducer surface. | Polymer hydrogels, sol-gels, Nafion, or chitosan membranes. They must preserve the biological activity of the immobilized element [7]. |
| Signal Amplification Labels | Used in sandwich-type assays to significantly lower the detection limit by augmenting the output signal. | Enzyme-linked labels (e.g., Horseradish Peroxidase - HRP) or catalytic nanomaterials that generate many reporter molecules per binding event [115]. |
The Role of AI and Machine Learning in Data Interpretation and Sensor Calibration
The integration of Artificial Intelligence (AI) and Machine Learning (ML) is fundamentally advancing the capabilities of biosensors for pesticide detection in agricultural research. Traditional methods for detecting pesticide residues, such as gas chromatography-mass spectrometry, are highly accurate but often expensive, time-consuming, and impractical for field use [12]. Biosensors offer a promising alternative by providing rapid, on-site analysis. However, their performance and reliability are heavily dependent on two critical processes: data interpretation and sensor calibration. AI and ML are revolutionizing these areas by enabling the analysis of complex, multi-dimensional data from sensor arrays, improving detection accuracy for multiple pesticides simultaneously, and facilitating robust in-situ calibration that compensates for environmental variables [116] [117] [12]. This document details specific application notes and experimental protocols for leveraging AI/ML to enhance biosensor systems for agricultural pesticide monitoring.
AI and ML for Data Interpretation in Pesticide Detection
Biosensors for pesticides generate complex data that often contains hidden patterns difficult to interpret with conventional methods. ML algorithms excel at extracting meaningful information from this data, improving both the sensitivity and specificity of detection.
Key Machine Learning Applications
Table 1: Machine Learning Approaches for Pesticide Biosensor Data Interpretation
| ML Approach | Application in Pesticide Detection | Reported Performance/Outcome | Reference |
|---|---|---|---|
| Support Vector Machines (SVM) | Classification of Raman spectra for detection of foodborne pathogenic bacteria; Calibration of soil moisture sensors. | High classification accuracy; 84.83% of sensors showed improved measurement accuracy. [116] [117] | |
| Deep Learning (e.g., CNNs) | Analysis of hyperspectral fluorescence images for early detection of Botrytis cinerea on strawberries; Processing data from sensor arrays (e-noses, e-tongues). | Effective identification of infected fruits; Enables multiplexed pesticide detection from complex data. [116] [12] | |
| Multivariate Calibration | Monitoring aflatoxin B1 contamination degree in edible oil using Raman spectra-based models. | Feasible and accurate detection of mycotoxin contamination. [116] | |
| Adversarial Networks | Combined with SVM for Raman spectroscopy-based detection of foodborne pathogens. | Enhanced detection capabilities for biological contaminants. [116] |
Experimental Protocol: Developing an ML Model for a Multi-Pesticide Biosensor Array
This protocol outlines the steps for creating an ML model to interpret data from an electrochemical or optical biosensor array designed to detect multiple pesticide classes (e.g., organophosphates, carbamates, and glyphosate) [12].
1. Sensor Array Fabrication and Data Collection:
- Bioreceptor Immobilization: Immobilize diverse bioreceptors (e.g., enzyme acetylcholinesterase (AChE) for organophosphates and carbamates [12], antibodies for glyphosate and atrazine [12], and specific aptamers) onto individual electrodes or optical sensing spots to create an array.
- Sample Preparation: Prepare a standard solution for each target pesticide at various known concentrations (e.g., from 0.01 ng/mL to 1000 ng/mL, reflecting the ranges in Table 1) in a buffer matrix. Also, create mixtures of multiple pesticides to simulate real-world residue profiles.
- Data Acquisition: For each sample, expose the sensor array and record the raw transducer signal (e.g., electrochemical impedance, current, or fluorescence intensity). Repeat each measurement multiple times to ensure statistical robustness. This generates a multi-dimensional dataset where each sample is a data point with features from each sensor in the array.
2. Data Preprocessing and Feature Engineering:
- Data Labeling: Assign each sample data point a label indicating the pesticide identity and/or concentration.
- Signal Processing: Apply filters (e.g., Savitzky-Golay) to smooth the raw signals and reduce high-frequency noise.
- Feature Extraction: For each sensor's response, extract relevant features. These could include:
- The absolute signal value at a fixed time.
- The maximum rate of signal change.
- The area under the response curve.
- The signal value normalized to a baseline measurement.
3. Machine Learning Model Training and Validation:
- Dataset Splitting: Randomly split the preprocessed and labeled dataset into a training set (e.g., 70-80%) and a testing set (e.g., 20-30%).
- Model Selection: Train different ML models on the training set. Common choices include:
- Support Vector Machine (SVM): For classifying the type of pesticide present.
- Random Forest: For both classification and regression (concentration estimation) tasks; provides insights into feature importance.
- Convolutional Neural Network (CNN): For complex patterns, especially if the data can be structured as an image or a sequential time series.
- Model Validation: Use the held-out testing set to evaluate the model's performance. Key metrics include:
- Accuracy, Precision, and Recall for classification tasks.
- Mean Absolute Error (MAE) and R² for concentration prediction (regression).
- Cross-validation should be performed to ensure the model is not overfitting.
AI-Driven Sensor Calibration and Self-Correction
Calibration is vital for maintaining biosensor accuracy over time, especially in variable field conditions. AI enables advanced calibration strategies that move beyond static, lab-based models.
Advanced Calibration Strategies
Table 2: AI-Enabled Calibration Methods for Biosensors
| Calibration Method | Principle | Benefits in Agricultural Context |
|---|---|---|
| Deep Learning-based Self-Calibration | Uses a deep learning model to map raw, potentially erroneous sensor readings to calibrated values, requiring minimal reference data (e.g., only saturation and field capacity points). [117] | Drastically reduces need for extensive lab-based recalibration; improves measurement agility and cost-effectiveness. [117] |
| Blind Drift Calibration | ML algorithms correct for sensor drift without requiring frequent manual recalibration with standard solutions. [117] | Maintains sensor accuracy over long-term deployment in fields, compensating for biofouling or bioreceptor degradation. |
| Correction for Environmental Variables | Data-driven models (e.g., regression, neural networks) are trained to account for the impact of temperature and other interfering factors on the sensor signal. [117] | Enhances reliability of field measurements taken under fluctuating environmental conditions. |
Experimental Protocol: Deep Learning for In-Situ Biosensor Self-Calibration
This protocol describes a method for implementing a self-calibrating biosensor system, inspired by advancements in soil moisture sensing [117].
1. Generation of a Calibration Dataset:
- Controlled Environmental Testing: Place the pesticide biosensor in a controlled chamber. Systematically vary:
- The concentration of the target pesticide (the primary analyte).
- Key interfering environmental factors, such as temperature (e.g., 5°C to 40°C) and pH.
- The concentration of common interferents in soil/water samples (e.g., humic acids, specific ions).
- Reference Measurements: For each condition, record the biosensor's raw signal (e.g., uncalibrated current in nA or impedance in Ohms). Simultaneously, use a gold-standard method (e.g., HPLC) to determine the actual pesticide concentration in the sample. This creates a dataset of triples:
(raw_sensor_reading, temperature, actual_concentration).
2. Development of the Calibration Model:
- Network Architecture: Design a deep neural network (DNN). The input layer should have nodes for the raw sensor signal and all recorded environmental variables (temperature, pH, etc.). The output layer is the predicted, calibrated pesticide concentration.
- Model Training: Train the DNN on the dataset generated in the previous step. The model will learn the complex, non-linear relationship between the raw sensor output and the true concentration under various conditions. The mean squared error (MSE) between the predicted and actual concentrations is a suitable loss function to minimize.
3. System Integration and Validation:
- Deployment: Integrate the trained DNN model onto the embedded system or a connected device (e.g., smartphone, edge computing module) that operates the biosensor.
- Field Validation: Deploy the self-calibrating biosensor in a real agricultural setting (e.g., a water stream or soil extract). Collect measurements and simultaneously take samples for validation using standard lab techniques. Compare the biosensor's self-calibrated output with the lab results to confirm the model's performance and accuracy in real-world conditions.
The Scientist's Toolkit: Essential Research Reagents and Materials
Table 3: Key Research Reagent Solutions for AI-Enhanced Pesticide Biosensors
| Reagent/Material | Function | Specific Example in Protocol |
|---|---|---|
| Bioreceptors | The biological recognition element that selectively binds to the target pesticide, initiating the detection signal. | Acetylcholinesterase (AChE) for organophosphates & carbamates; Anti-glyphosate antibody; Specific DNA aptamers. [12] |
| Transducer Materials | The platform that converts the biorecognition event into a measurable electrical or optical signal. | Screen-printed carbon electrodes (SPCEs) for electrochemical detection; Gold nanoparticles for colorimetric or localized surface plasmon resonance (LSPR) sensors. [116] [12] |
| Immobilization Matrices | A chemical layer used to securely attach bioreceptors to the transducer surface. | Chitosan hydrogels; Nafion films; Self-assembled monolayers (SAMs). |
| Standard Pesticide Analytes | Highly pure pesticide compounds used to prepare standard solutions for sensor calibration and training ML models. | Analytical standards of Chlorpyrifos, Atrazine, Glyphosate, Carbofuran, etc., dissolved in appropriate buffers. [12] |
| Buffer Solutions | Maintain a consistent pH and ionic strength, which is critical for stabilizing bioreceptors and ensuring reproducible binding kinetics. | Phosphate buffered saline (PBS) at various pH levels. |
| Data Processing Software | The computational environment for developing, training, and testing AI/ML models. | Python with libraries (scikit-learn, TensorFlow/PyTorch, Pandas). |
Regulatory Pathways and Standardization for Biosensor Approval in Food Safety
The integration of biosensors into food safety represents a paradigm shift from traditional, reactive detection methods towards proactive, real-time monitoring of hazards, including pesticide residues. These analytical devices, which combine a biological recognition element with a transducer, offer the potential for rapid, on-site detection of contaminants, directly within the food supply chain [118]. However, their journey from a research prototype to an approved tool in the food industry is governed by a complex framework of regulatory pathways and standardization requirements. For researchers and scientists developing biosensors for pesticide detection, navigating this landscape is as critical as the innovation itself. This document outlines the current regulatory environment, essential standardization protocols, and the experimental validation required for the successful approval and commercialization of pesticide biosensors in food safety applications.
Regulatory Framework and Key Organizations
The regulatory approval of biosensors is a multi-faceted process, involving adherence to general food safety regulations, specific standards for analytical methods, and, often, requirements for the sensor hardware itself.
Global Regulatory Trends and Legislation
Globally, food safety regulations are increasingly emphasizing preventive controls, digital traceability, and supply chain transparency. Key regulatory bodies are strengthening their frameworks, which directly impacts the deployment of novel detection technologies like biosensors [119].
- The U.S. Food Safety Modernization Act (FSMA): The FSMA, with its ongoing enhancements, places greater responsibility on food businesses to validate their preventive controls and verify that their suppliers are upholding food safety standards [119]. For a biosensor developer, this means that any pesticide detection method must be rigorously validated to provide reliable data for these control plans.
- European Union "Farm to Fork" Strategy: The EU is strongly promoting digital traceability and sustainable food systems [119]. Biosensors that can integrate with digital platforms to provide real-time data on pesticide residues align perfectly with this strategic direction, though they must comply with EU regulations on maximum residue levels (MRLs) for pesticides.
- Codex Alimentarius: This international food standards body works to harmonize food safety regulations globally [119]. Codex standards for pesticide MRLs and methods of analysis provide a crucial benchmark. Aligning a biosensor's performance with Codex guidelines can facilitate its acceptance in multiple international markets.
Standardization and Certification Bodies
Beyond government regulations, standards set by international organizations are critical for establishing credibility and ensuring reliability.
- Global Food Safety Initiative (GFSI): GFSI-recognized certification programs (e.g., BRC, SQF) are increasingly important for market access. GFSI now mandates requirements for proactive food fraud vulnerability assessments and strengthened food defense measures, which could include the use of biosensors for monitoring and authenticity testing [119].
- International Organization for Standardization (ISO): The ISO 22000 series on food safety management is essential. Recent enhancements to ISO 22000 incorporate more detailed hazard analysis methodologies and an increased focus on a strong food safety culture within an organization [119]. Furthermore, ISO 17025 for laboratory competence is often a prerequisite for any testing method, including biosensors, used for official control purposes.
Experimental Protocols for Biosensor Validation
For a pesticide biosensor to gain regulatory acceptance, its performance must be validated through a series of rigorous and standardized experiments. The following protocols detail the critical steps for evaluating a biosensor based on enzyme inhibition, a common mechanism for organophosphate and carbamate pesticide detection.
Protocol: Biosensor Assembly and Fabrication
Objective: To construct an electrochemical biosensor for the detection of organophosphate pesticides using acetylcholinesterase (AChE) immobilized on a transducer surface.
Materials:
- Receptor: Acetylcholinesterase (AChE) enzyme.
- Transducer: Screen-printed carbon electrode (SPE).
- Immobilization Matrix: Defect-engineered amorphous metal-organic framework (AMOF-74) [74] or Chitosan hydrogel [120].
- Chemical Reagents: Acetylthiocholine chloride (ATCh) substrate, Phosphate Buffered Saline (PBS, 0.1 M, pH 7.4).
- Equipment: Potentiostat for electrochemical measurements (e.g., Cyclic Voltammetry, Amperometry).
Methodology:
- Electrode Pretreatment: Clean the working surface of the SPE by cycling the potential in a suitable electrolyte solution to ensure a reproducible electroactive surface area.
- Enzyme Immobilization: a. Prepare a suspension of the AMOF-74 material in deionized water. b. Mix 5 μL of the AChE enzyme solution (1 U/μL) with 5 μL of the AMOF-74 suspension. c. Drop-cast 10 μL of the AChE-AMOF mixture onto the working electrode surface. d. Allow the modified electrode to dry at 4°C for 12 hours to form the AChE@AMOF-74 biosensor [74].
- Storage: Store the fabricated biosensor at 4°C in a dry environment when not in use.
Protocol: Analytical Performance Evaluation
Objective: To determine the sensitivity, detection limit, and linear range of the biosensor for a target pesticide, such as paraoxon.
Materials:
- Fabricated AChE@AMOF-74 biosensor.
- Standard solutions of paraoxon in PBS at known concentrations (e.g., 0.01 to 100 ng/mL).
- ATCh substrate solution in PBS.
- Potentiostat.
Methodology:
- Baseline Activity Measurement: a. Immerse the biosensor in a cell containing 10 mL of PBS with 1 mM ATCh. b. Apply a constant potential and record the amperometric current generated by the enzymatic hydrolysis of ATCh. This is the initial current (I₀).
- Inhibition Assay: a. Incubate the biosensor in a standard paraoxon solution for a fixed time (e.g., 10 minutes). b. Wash the biosensor gently with PBS to remove unbound pesticide. c. Re-immerse the biosensor in the PBS/ATCh solution and record the new steady-state current (Iᵢ).
- Data Analysis: a. Calculate the percentage of enzyme inhibition for each concentration: Inhibition (%) = [(I₀ - Iᵢ) / I₀] × 100. b. Plot the inhibition percentage against the logarithm of the paraoxon concentration to generate a calibration curve. c. The limit of detection (LoD) can be calculated as the concentration corresponding to the signal from the blank plus three times the standard deviation of the blank.
The workflow for the development and validation of a pesticide biosensor is systematic and iterative, as shown in the diagram below.
Key Performance Metrics for Pesticide Biosensors
Table 1: Summary of reported performance metrics for various pesticide biosensors, demonstrating the range of achievable sensitivity.
| Biomaterial | Target Pesticide | Transduction Method | Linear Range | Limit of Detection (LoD) | Reference |
|---|---|---|---|---|---|
| Acetylcholinesterase (AChE) | Organophosphates (Malathion) | Electrochemical | 0.01 – 1 ng/mL | 2.6 pg/mL | [12] |
| AChE@AMOF-74 | Paraoxon | Electrochemical | Not Specified | 0.05 ng/mL | [74] |
| Alkaline Phosphatase | Methyl paraoxon | Fluorescence & Electrochemical | Not Specified | ≈ 0.65 nM | [12] |
| Antibody | Glyphosate | Electrochemical | 10 ng/mL – 50 μg/mL | 10 ng/mL | [12] |
The Scientist's Toolkit: Essential Research Reagents and Materials
The development and validation of pesticide biosensors rely on a specific set of biological and material components. The table below details key research reagents and their functions.
Table 2: Essential materials and their roles in the construction and operation of a typical pesticide biosensor.
| Research Reagent / Material | Function in the Biosensor System |
|---|---|
| Acetylcholinesterase (AChE) | Receptor: The biological recognition element that specifically interacts with and is inhibited by organophosphate and carbamate pesticides. |
| Amorphous Metal-Organic Frameworks (AMOF-74) | Immobilization Matrix: Provides a high-porosity, defect-engineered microenvironment for enzyme encapsulation, enhancing stability and catalytic activity [74]. |
| Screen-Printed Electrode (SPE) | Transducer: Converts the biochemical signal (enzyme inhibition) into a measurable electrical signal (current). Offers portability and disposability. |
| Acetylthiocholine (ATCh) | Enzyme Substrate: Hydrolyzed by AChE to produce a measurable product (thiocholine), the rate of which is modulated by pesticide presence. |
| Phosphate Buffered Saline (PBS) | Buffer System: Maintains a stable pH (typically 7.4) to ensure optimal enzyme activity and assay reproducibility. |
Standardization and Data Integrity
Protocol: Validation in Complex Food Matrices
Objective: To assess the accuracy and reliability (trueness and precision) of the biosensor when analyzing real food samples.
Materials:
- Homogenized food samples (e.g., lettuce, apple pulp).
- Standard pesticide solutions for spiking.
- Reference method data (e.g., from GC-MS/LS-MS analysis).
Methodology:
- Sample Preparation: Homogenize the food sample. For recovery studies, spike known concentrations of the target pesticide into the sample.
- Extraction: Extract the pesticide using a validated method (e.g., modified QuEChERS) [120].
- Analysis: Analyze both spiked and unspiked samples using the biosensor protocol. Compare the results with those obtained from a reference method like GC-MS.
- Calculation: Calculate key validation parameters:
- Recovery (%) = (Measured Concentration in Spiked Sample / Theoretical Spiked Concentration) × 100. Acceptable range is typically 70-120%.
- Precision: Expressed as Relative Standard Deviation (RSD%) of repeated measurements.
The Role of Advanced Data Processing
Modern biosensor development increasingly leverages machine learning (ML) and advanced data processing to overcome challenges like detecting multiple pesticides simultaneously. Sensor arrays, or electronic tongues, generate complex data patterns for different pesticides. ML algorithms can be trained to deconvolute these signals, enabling the development of multi-analyte biosensors that move beyond single-target detection [12]. This is a critical advancement for meeting regulatory screening needs, which require monitoring for a broad spectrum of pesticide residues.
The pathway to regulatory approval for biosensors in food safety is structured around demonstrating reliability, accuracy, and robustness through standardized validation protocols. For researchers focusing on pesticide detection, success hinges on a deep understanding of both the technological aspects—such as selecting sensitive biorecognition elements and stable immobilization matrices—and the regulatory landscape defined by FSMA, EU policies, and GFSI standards. By rigorously applying the experimental protocols outlined here for performance evaluation and real-sample testing, and by embracing emerging trends like machine learning for data analysis, scientists can effectively bridge the gap between laboratory innovation and a commercially viable, regulatory-compliant biosensor tool that enhances the safety of the global food supply.
Conclusion
Biosensor technology represents a paradigm shift in agricultural pesticide monitoring, moving from centralized, complex laboratories to decentralized, rapid, and intelligent field analysis. The synthesis of advanced nanomaterials with diverse biorecognition elements has yielded platforms with exceptional sensitivity, specificity, and potential for on-site deployment. Despite significant progress, the journey toward widespread adoption requires overcoming hurdles related to long-term stability in real environments, multiplexing capabilities, and cost-effective mass production. Future directions will be shaped by the convergence of biosensors with emerging technologies, including artificial intelligence for predictive analytics, the Internet of Things (IoT) for networked farm-level monitoring, and the development of robust, multi-analyte systems. For researchers and drug development professionals, these advancements open new frontiers not only for ensuring food safety and environmental health but also for pioneering novel diagnostic and therapeutic monitoring applications in biomedical and clinical research, leveraging the core principles of selective biological recognition.
References
- 1. and Environmental Implications of Public Residues... Health Pesticide [https://www.gjournals.org/2025/01/13/120424187-onwudiegwu-et-al/]
- 2. Advances in Enzyme-Based Biosensors for Pesticide Detection | MDPI [https://www.mdpi.com/2079-6374/8/2/27]
- 3. Advances in Enzyme-Based Biosensors for Pesticide Detection - PMC [https://pmc.ncbi.nlm.nih.gov/articles/PMC6022933/]
- 4. on human Pesticides and the impacts with their... health environment [https://pubmed.ncbi.nlm.nih.gov/38623208/]
- 5. A Review on Biosensors and Nanosensors Application in Agroecosystems - PMC [https://pmc.ncbi.nlm.nih.gov/articles/PMC8405745/]
- 6. Optical Screening Methods for Pesticide Residue Detection in Food Matrices: Advances and Emerging Analytical Trends - PMC [https://pmc.ncbi.nlm.nih.gov/articles/PMC7824741/]
- 7. Recent advances in rapid detection techniques for pesticide residue: A review - PMC [https://pmc.ncbi.nlm.nih.gov/articles/PMC10584040/]
- 8. Recent Advances in Nanomaterial-Based Biosensors for Pesticide Detection in Foods - PMC [https://pmc.ncbi.nlm.nih.gov/articles/PMC9405907/]
- 9. How Much Does a GC - MS System Cost ? [https://www.excedr.com/blog/how-much-does-a-gc-ms-system-cost]
- 10. Complexity/ Cost of ownership - LC vs GC ? - Chromatography Forum [https://www.chromforum.org/viewtopic.php?t=27829]
- 11. vs HPLC : Choosing the Right GC ... | Lab Manager Chromatography [https://www.labmanager.com/hplc-vs-gc-choosing-the-right-chromatography-technique-33689]
- 12. Pesticide Biosensors for Multiple Target Detection: Improvement Potential with Advanced Data-processing Methods [https://www.jstage.jst.go.jp/article/ras/12/0/12_128/_html/-char/en]
- 13. Electrochemical biosensors : recommended definitions and... [https://pubmed.ncbi.nlm.nih.gov/11261847/]
- 14. (PDF) Electrochemical Biosensors : Recommended Definitions and... [https://scispace.com/papers/electrochemical-biosensors-recommended-definitions-and-4vxw3epa53]
- 15. A Review on Biosensors and Recent Development of Nanostructured Materials-Enabled Biosensors - PMC [https://pmc.ncbi.nlm.nih.gov/articles/PMC7915135/]
- 16. Biosensors: Design, Development and Applications | IntechOpen [https://www.intechopen.com/chapters/76543]
- 17. Advances in Detection Technologies for Pesticide Residues and Heavy Metals in Rice: A Comprehensive Review of Spectroscopy, Chromatography, and Biosensors [https://www.mdpi.com/2304-8158/14/6/1070]
- 18. Biosensor - Wikipedia [https://en.wikipedia.org/wiki/Biosensor]
- 19. Recent Advances in Biosensors for Nucleic Acid and Exosome Detection - PMC [https://pmc.ncbi.nlm.nih.gov/articles/PMC6536430/]
- 20. Frontiers | Nano-enabled biosensors in early detection of plant diseases [https://www.frontiersin.org/journals/nanotechnology/articles/10.3389/fnano.2025.1545792/full]
- 21. Frontiers | Nanomaterial-based biosensors: a new frontier in plant pathogen detection and plant disease management [https://www.frontiersin.org/journals/bioengineering-and-biotechnology/articles/10.3389/fbioe.2025.1570318/full]
- 22. Title: “Advances in Nanomaterial-Enhanced Biosensors for... [https://www.linkedin.com/pulse/title-advances-nanomaterial-enhanced-biosensors-pesticide-sreelatha-g-5pewc]
- 23. Comparison of MIP -, Antibody - and Aptamer -Based Biosensors for... [https://link.springer.com/chapter/10.1007/978-3-031-67368-9_3]
- 24. Current Advances in Aptasensors for Pesticide Detection - PMC [https://pmc.ncbi.nlm.nih.gov/articles/PMC11930883/]
- 25. Recent Advances in Nanomaterial-Based Biosensors for Pesticide ... [https://pubmed.ncbi.nlm.nih.gov/36004968/]
- 26. Recent Advances in Quantum -Based Dots | IntechOpen Biosensors [https://www.intechopen.com/chapters/84229]
- 27. Recent Developments in the Applications of GO/rGO-Based... [https://pmc.ncbi.nlm.nih.gov/articles/PMC10136809/]
- 28. Nanomaterials and Their Recent Applications in Impedimetric... [https://pmc.ncbi.nlm.nih.gov/articles/PMC10605062/]
- 29. Highly sensitive thin SERS substrate by sandwich nanoarchitecture... [https://yonsei.elsevierpure.com/en/publications/highly-sensitive-thin-sers-substrate-by-sandwich-nanoarchitecture]
- 30. Nano-biosensors for Precision Pesticide Management | SpringerLink [https://link.springer.com/chapter/10.1007/978-981-96-8335-2_12]
- 31. A general method for the development of multicolor biosensors with large dynamic ranges | Nature Chemical Biology [https://www.nature.com/articles/s41589-023-01350-1]
- 32. -based Acetylcholinesterase for inhibition ... biosensors pesticide [https://pubmed.ncbi.nlm.nih.gov/22759777/]
- 33. Piezoelectric Biosensors for Organophosphate and Carbamate Pesticides: A Review - PMC [https://pmc.ncbi.nlm.nih.gov/articles/PMC4264360/]
- 34. Determination of organophosphate and carbamate pesticides in spiked samples of tap water and fruit juices by a biosensor with photothermal detection - PubMed [https://pubmed.ncbi.nlm.nih.gov/11459102/]
- 35. Bioactive Paper Sensor Based on the Acetylcholinesterase for the... [https://pmc.ncbi.nlm.nih.gov/articles/PMC4251802/]
- 36. for Biosensors of Anticholinesterase Agents | SpringerLink Detection [https://link.springer.com/chapter/10.1007/978-3-319-28926-7_17]
- 37. and Detoxification of Detection ... | SpringerLink Organophosphate [https://link.springer.com/chapter/10.1007/978-94-007-2872-1_13]
- 38. Construction of an enzymatic biosensor for chlorpyrifos pesticide ... [https://journal-iasssf.com/index.php/EAM/article/view/890]
- 39. Colorimetric Biosensors: Advancements in Nanomaterials and Cutting-Edge Detection Strategies - PMC [https://pmc.ncbi.nlm.nih.gov/articles/PMC12190540/]
- 40. Acoustic biosensors for ultrasound imaging of enzyme activity - PubMed [https://pubmed.ncbi.nlm.nih.gov/32661379/]
- 41. Nanozyme-based colorimetric biosensor with a systemic quantification algorithm for noninvasive glucose monitoring [https://www.thno.org/v12p6308.htm]
- 42. Microbial, nanotechnological and biosensor-based innovations for... [https://link.springer.com/article/10.1007/s44274-025-00335-2]
- 43. Progress on Electrochemical Biomimetic Nanosensors for the... [https://pmc.ncbi.nlm.nih.gov/articles/PMC11209398/]
- 44. sciencedirect.com/topics/nursing-and-health-professions/ immunosensor [https://www.sciencedirect.com/topics/nursing-and-health-professions/immunosensor]
- 45. —The Future of Pathogen Real-Time Detection - PMC Immunosensors [https://pmc.ncbi.nlm.nih.gov/articles/PMC9785510/]
- 46. Aptasensors for the detection of infectious pathogens: design strategies and point-of-care testing - PMC [https://pmc.ncbi.nlm.nih.gov/articles/PMC9643942/]
- 47. Nanozyme-based aptasensors for the detection of tumor biomarkers - PMC [https://pmc.ncbi.nlm.nih.gov/articles/PMC11806818/]
- 48. Advances in electrochemical aptasensors and immunosensors for detection of bacterial pathogens in food - ScienceDirect [https://www.sciencedirect.com/science/article/abs/pii/S0013468621010148]
- 49. Feasibility of optical waveguide immunosensors for pesticide ... [https://research.utwente.nl/en/publications/feasibility-of-optical-waveguide-immunosensors-for-pesticide-dete/]
- 50. Microbial whole-cell biosensors: Current applications, challenges, and future perspectives - ScienceDirect [https://www.sciencedirect.com/science/article/abs/pii/S0956566321003961]
- 51. Advances in Synthetic-Biology-Based Whole - Cell ... Biosensors [https://pmc.ncbi.nlm.nih.gov/articles/PMC10178329/]
- 52. Microbial whole-cell biosensors: Current applications, challenges, and future perspectives - PubMed [https://pubmed.ncbi.nlm.nih.gov/34098470/]
- 53. Microfluidic Based Whole-Cell Biosensors for Simultaneously On-Site Monitoring of Multiple Environmental Contaminants - PMC [https://pmc.ncbi.nlm.nih.gov/articles/PMC8006271/]
- 54. Engineering whole - cell : microbial ... | CoLab biosensors Design [https://colab.ws/articles/10.1016/j.biotechadv.2022.108019]
- 55. Harnessing the power of biosensors for environmental monitoring of... [https://pmc.ncbi.nlm.nih.gov/articles/PMC11991957/]
- 56. Design and development of ISFET-based portable microalgal... [https://pubmed.ncbi.nlm.nih.gov/40414044/]
- 57. A highly sensitive impedimetric aptasensor for the selective detection ... [https://pubmed.ncbi.nlm.nih.gov/29096365/]
- 58. AChE-based electrochemical biosensor for pesticide detection in vegetable oils: matrix effects and synergistic inhibition of the immobilized enzyme | Analytical and Bioanalytical Chemistry [https://link.springer.com/article/10.1007/s00216-022-04448-y]
- 59. Research Advances in Nanosensor for Pesticide Detection in Agricultural Products | MDPI [https://www.mdpi.com/2079-4991/15/14/1132]
- 60. Optical Screening Methods for Pesticide Residue Detection in Food Matrices: Advances and Emerging Analytical Trends [https://www.mdpi.com/2304-8158/10/1/88]
- 61. Monitoring of pesticide amount in water and drinkable food by... [https://pmc.ncbi.nlm.nih.gov/articles/PMC9131604/]
- 62. Frontiers | Highly Sensitive Fluorescent Based on... Biosensor [https://www.frontiersin.org/journals/environmental-science/articles/10.3389/fenvs.2022.825112/full]
- 63. FRET Based Biosensor: Principle Applications Recent Advances and Challenges - PubMed [https://pubmed.ncbi.nlm.nih.gov/37189476/]
- 64. Developments in FRET- and BRET-Based Biosensors - PMC [https://pmc.ncbi.nlm.nih.gov/articles/PMC9610962/]
- 65. Single-atom nanozymes for enhanced electrochemical biosensing: A review - ScienceDirect [https://www.sciencedirect.com/science/article/abs/pii/S0039914025006691]
- 66. Exploring Single - Atom Toward Environmental Pollutants... Nanozymes [https://link.springer.com/article/10.1007/s40820-025-01734-z]
- 67. Advancements and Applications of Single-Atom Nanozymes in Sensing Analysis [https://www.mdpi.com/2227-9040/12/10/209]
- 68. A dual-mode biosensor featuring single - atom Fe nanozyme for... [https://pubmed.ncbi.nlm.nih.gov/37948799/]
- 69. Single-atom nanozyme-based electrochemical sensors for health and food safety monitoring - ScienceDirect [https://www.sciencedirect.com/science/article/abs/pii/S0308814623011366]
- 70. Occurrence and Consequences of Matrix Effects in Simultaneous Multi-class LC-MS/MS Determination of Pesticides, Pharmaceuticals and Perfluoroalkylsubstances in Different Types of Groundwater | Water, Air, & Soil Pollution [https://link.springer.com/article/10.1007/s11270-024-07221-2]
- 71. Nanostructured (Bio)sensors for smart agriculture - ScienceDirect [https://www.sciencedirect.com/science/article/abs/pii/S016599361730273X]
- 72. A review of biosensor for environmental monitoring: principle, application, and corresponding achievement of sustainable development goals - PMC [https://pmc.ncbi.nlm.nih.gov/articles/PMC10308875/]
- 73. Recent Developments on Colorimetric and Dual Colorimetric/Fluorimetric Enzymatic Biosensors for the Detection of Pesticides in Food[v1] | Preprints.org [https://www.preprints.org/manuscript/202307.0526/v1]
- 74. Enhanced Recognition via Defect Engineered Amorphous... [https://pubmed.ncbi.nlm.nih.gov/41250970/]
- 75. Food Safety Analysis Using Electrochemical Biosensors - PMC [https://pmc.ncbi.nlm.nih.gov/articles/PMC6164425/]
- 76. Nanocomposite biosensors for point-of-care—evaluation of food quality and safety - PMC [https://pmc.ncbi.nlm.nih.gov/articles/PMC7149521/]
- 77. and antibodies for Engineering receptors biosensors [https://pubmed.ncbi.nlm.nih.gov/11839478/]
- 78. Ambient-Pressure Multischeme Chemical for Ionization ... Pesticide [https://researchportal.helsinki.fi/en/publications/ambient-pressure-multischeme-chemical-ionization-for-pesticide-de]
- 79. Evolution and Expectations of Enzymatic for Biosensors Pesticides [https://www.intechopen.com/chapters/37959]
- 80. Multiple Recognition-Based Sensor for Pesticide - PMC Residues [https://pmc.ncbi.nlm.nih.gov/articles/PMC8979164/]
- 81. Nanomaterials-Enhanced Multiplex Immunosensing Device for Rapid... [https://portal.nifa.usda.gov/web/crisprojectpages/1015285-nanomaterials-enhanced-multiplex-immunosensing-device-for-rapid-and-sensitive-detection-of-pesticide-residues.html]
- 82. Determination of Multi-Class Simultaneous and... Pesticide Residues [https://pubmed.ncbi.nlm.nih.gov/35408539/]
- 83. for 296 Simultaneous ... | PLOS One analytical method pesticide [https://journals.plos.org/plosone/article?id=10.1371/journal.pone.0288198]
- 84. Application of QuEChERS Method for Simultaneous Determination of... [https://link.springer.com/article/10.1007/s00128-012-0951-x]
- 85. A review of recent advances in plant-pathogen detection systems - PMC [https://pmc.ncbi.nlm.nih.gov/articles/PMC9712134/]
- 86. Advances in Detection Technologies for Pesticide Residues and Heavy Metals in Rice: A Comprehensive Review of Spectroscopy, Chromatography, and Biosensors - PMC [https://pmc.ncbi.nlm.nih.gov/articles/PMC11941943/]
- 87. Smartphone-Based Biosensor Devices for Healthcare: Technologies, Trends, and Adoption by End-Users - PMC [https://pmc.ncbi.nlm.nih.gov/articles/PMC8945789/]
- 88. Smartphone-Based Multiplexed Biosensing Tools for Health Monitoring - PMC [https://pmc.ncbi.nlm.nih.gov/articles/PMC9406027/]
- 89. Enzyme Inhibition-Mediated Distance-Based Paper Biosensor for Organophosphate Pesticide Detection in Food Samples [https://www.mdpi.com/2227-9040/13/4/147]
- 90. Lithographic Processes for the Scalable Fabrication of Micro- and... [https://pmc.ncbi.nlm.nih.gov/articles/PMC8240091/]
- 91. Additive Manufacturing Applications in Biosensors Technologies - PMC [https://pmc.ncbi.nlm.nih.gov/articles/PMC10887193/]
- 92. Advances in Enzyme-Based Biosensors for Pesticide Detection [https://pubmed.ncbi.nlm.nih.gov/29565810/]
- 93. (PDF) Cost - Effective Fiber Optic Solutions for Biosensing [https://www.academia.edu/108684161/Cost_Effective_Fiber_Optic_Solutions_for_Biosensing]
- 94. On the Determination of Uncertainty and Limit of Detection in Label-Free Biosensors - PMC [https://pmc.ncbi.nlm.nih.gov/articles/PMC6068557/]
- 95. Frontiers | Multiple Recognition-Based Sensor for Pesticide Residues [https://www.frontiersin.org/journals/chemistry/articles/10.3389/fchem.2022.856698/full]
- 96. Improvement of the optical cavity-based biosensor ’s limit ... of [https://www.nature.com/articles/s41598-025-92151-0?error=cookies_not_supported]
- 97. Morlet Wavelet Filtering and Phase Analysis to Reduce the Limit ... of [https://pmc.ncbi.nlm.nih.gov/articles/PMC8403169/]
- 98. Development and validation of a method for simultaneous analysis of... [https://pubmed.ncbi.nlm.nih.gov/41114751/]
- 99. of Comparison – LC -MS and MS – GC of Benzodiazepine... MS Analysis [https://pmc.ncbi.nlm.nih.gov/articles/PMC4885916/]
- 100. Residue Analysis in the 21st Century: Innovations in Sample... Pesticide [https://www.thermofisher.com/blog/analyteguru/pesticide-residue-analysis-in-the-21st-century-innovations-in-sample-preparation-and-detection-using-the-thermo-scientific-tsq-9610-gc-ms-ms/]
- 101. Determination of 301 pesticide residues in tropical fruits... | CoLab [https://colab.ws/articles/10.1016/j.foodcont.2022.109576]
- 102. Biosensors to support sustainable agriculture and food safety - ScienceDirect [https://www.sciencedirect.com/science/article/abs/pii/S0165993620301357]
- 103. Potential of nanobiosensor in sustainable agriculture: the state-of-art - PMC [https://pmc.ncbi.nlm.nih.gov/articles/PMC9791828/]
- 104. Harnessing the power of biosensors for environmental monitoring of pesticides in water | Applied Microbiology and Biotechnology [https://link.springer.com/article/10.1007/s00253-025-13461-x]
- 105. - Sensor Principles and Architectures... Electrochemical Biosensors [https://pmc.ncbi.nlm.nih.gov/articles/PMC3663003/]
- 106. in Food Safety: Electrochemical and... Biosensors Challenges [https://pmc.ncbi.nlm.nih.gov/articles/PMC8156954/]
- 107. Review of optical sensors for pesticides - ScienceDirect [https://www.sciencedirect.com/science/article/abs/pii/S0165993617304260]
- 108. of Comparative Market Technologies: Analysis ... Biosensor Optical [https://www.linkedin.com/pulse/comparative-analysis-biosensor-market-9tkcc]
- 109. Herbicide detection: A review of enzyme- and cell-based biosensors - ScienceDirect [https://www.sciencedirect.com/science/article/abs/pii/S0013935124002342]
- 110. vs. Optical : Key... | RF Wireless World Electrochemical Biosensors [https://www.rfwireless-world.com/terminology/optical-vs-electrochemical-biosensors]
- 111. Ecosystem AgTech Size & Growth [2034] Market [https://www.marketgrowthreports.com/market-reports/agtech-ecosystem-market-115441]
- 112. Market Size & Pesticide -2035 Detection Trends 2025 [https://www.futuremarketinsights.com/reports/pesticide-detection-market]
- 113. Top AgTech Investors & Venture Capital Firms in 2025 [https://www.ellty.com/blog/agtech-investors]
- 114. Top 5 Agricultural Technologies : Shaping the Future… | Robovision [https://robovision.ai/blog/top-5-agtech-trends-in-2025]
- 115. Recent advances in biosensing approaches for point-of-care breast cancer diagnostics: challenges and future prospects - PMC [https://pmc.ncbi.nlm.nih.gov/articles/PMC9417675/]
- 116. Emerging Technologies in Food Safety: AI -Powered, Nano-enabled... [https://link.springer.com/article/10.1007/s12161-025-02844-5]
- 117. A self- calibration for soil moisture algorithm using deep... sensors [https://link.springer.com/article/10.1007/s10489-024-05921-0]
- 118. Application in Biosensors Packaging for Enhanced Food ... Food Safety [https://www.linkedin.com/pulse/biosensors-application-food-packaging-enhanced-safety-rajan-jaiswar-uh7uc]
- 119. A Quick Guide to Food in Safety Standards 2025 [https://foodready.ai/blog/food-safety-standards-guide/]
- 120. : trends and progresses | Analytical and... Pesticide biosensors [https://link.springer.com/article/10.1007/s00216-023-04911-4]