Bioreceptors and Transducers: The Core Components of Biosensors for Biomedical Research
This article provides a comprehensive analysis of the fundamental roles and synergistic functions of bioreceptors and transducers in biosensing technology.
Bioreceptors and Transducers: The Core Components of Biosensors for Biomedical Research
Abstract
This article provides a comprehensive analysis of the fundamental roles and synergistic functions of bioreceptors and transducers in biosensing technology. Tailored for researchers, scientists, and drug development professionals, it explores the core principles of bio-recognition and signal transduction, details current methodologies and real-world applications in diagnostics and bioprocessing, addresses critical challenges in sensor optimization and reproducibility, and evaluates emerging technologies and validation frameworks. By integrating foundational knowledge with advanced applications and future trends, this review serves as a strategic resource for innovating and implementing biosensor technology in biomedical research and clinical translation.
The Essential Duo: Understanding Bioreceptors and Transducers in Biosensing Systems
A biosensor is an integrated analytical device that converts a biological response into a quantifiable electrical signal [1]. The core function of any biosensor hinges on two fundamental components: the bioreceptor, which provides the molecular recognition mechanism, and the transducer, which converts the biological interaction into a measurable output [2] [3]. This specific and synergistic partnership is what distinguishes biosensors from other chemical sensors. The bioreceptor is responsible for the selectivity of the device, as it specifically recognizes the target analyte, while the transducer determines the sensitivity and the nature of the final readout [4]. The operational principle involves the bioreceptor interacting with the analyte (the substance of interest), which triggers a biorecognition event. This event produces a physicochemical change (such as a change in pH, electron transfer, light emission, or mass) that the transducer subsequently detects and converts into an electrical signal [2] [1]. This signal is then processed by associated electronics and presented in a user-readable format on a display.
The evolution of biosensors, since Leland C. Clark Jr.'s pioneering work on the oxygen electrode in 1956 and the first enzyme-based glucose sensor in 1962, has been characterized by the refinement of these two core components [1] [5]. Modern research, particularly the integration of nanomaterials and synthetic biology, has focused on enhancing the performance of both bioreceptors and transducers to achieve lower detection limits, faster response times, and greater robustness [2] [6]. The following sections provide a technical deep-dive into the characteristics, types, and operational principles of bioreceptors and transducers, framing them within the context of contemporary biosensing research for drug development and scientific discovery.
The Bioreceptor: Engine of Molecular Specificity
The bioreceptor is a biological or biomimetic element that is responsible for the selective recognition of a specific target analyte [1] [3]. It is the cornerstone of a biosensor's specificity. The bioreception process involves the binding or interaction between the bioreceptor and the analyte, which generates a physiological or chemical change [2]. This change, often referred to as the biorecognition event, is the initial signal that the transducer will later convert. The choice of bioreceptor is paramount and depends on the target analyte and the intended application.
Classification and Mechanisms of Bioreceptors
Bioreceptors are classified based on the biological element used for recognition. The most common types are enzymes, antibodies, nucleic acids, and whole cells, each with distinct recognition mechanisms and applications.
- Enzyme-Based Bioreceptors: Enzymes are biocatalysts that recognize specific substrates and catalyze their conversion into products. The first and most famous example is Glucose Oxidase (GOD), used in commercial glucose monitors for diabetes management [1] [3]. The recognition mechanism can involve the detection of a product (e.g., hydrogen peroxide), the consumption of a co-reactant (e.g., oxygen), or the inhibition of enzyme activity by the analyte (e.g., heavy metals, pesticides) [3].
- Antibody-Based Bioreceptors (Immunosensors): Antibodies are immune system proteins that bind to a specific antigen with high affinity. Biosensors using antibodies, known as immunosensors, leverage the formation of an antigen-antibody complex [4] [3]. This interaction is highly specific and does not involve a catalytic conversion. The binding event itself is detected, often using optical transducers like Surface Plasmon Resonance (SPR) [6] [3]. Immunosensors are widely used for detecting pathogens, biomarkers, and toxins [7].
- Nucleic Acid-Based Bioreceptors: These use strands of DNA or RNA as the recognition element. The primary mechanism is hybridization, where a single-stranded DNA probe binds to its complementary sequence [4] [3]. A significant advancement in this category is the use of aptamers, which are short, single-stranded oligonucleotides that can bind to a wide variety of targets (e.g., proteins, small molecules, cells) with high specificity and affinity, similar to antibodies [3].
- Whole-Cell and Tissue-Based Bioreceptors: Instead of isolated biomolecules, entire living microbial, animal, or plant cells can serve as bioreceptors [8]. These are particularly valuable for providing functional information about the effect of a stimulus on a living system, such as in toxicity screening [4] [8]. They can also be genetically engineered to produce a detectable signal (e.g., fluorescence, luminescence) in the presence of a target analyte, as seen in arsenic-detecting bioreporters [8].
Table 1: Comparison of Major Bioreceptor Types
| Bioreceptor Type | Recognition Mechanism | Key Advantage | Common Transducer Pairings | Exemplary Application |
|---|---|---|---|---|
| Enzyme | Catalytic conversion of substrate | High catalytic turnover; well-characterized | Amperometric, Potentiometric, Thermal | Blood glucose monitoring [3] |
| Antibody | Affinity-based antigen binding | Extremely high specificity and affinity | Optical (SPR, Fluorescence), Piezoelectric | Pathogen detection, Clinical immunoassays [7] |
| Nucleic Acid | Hybridization to complementary sequence | Ability to design probes for any sequence; stable | Electrochemical, Optical | Genetic disease diagnosis, Virus detection [3] |
| Aptamer | 3D structure-based affinity binding | Chemical stability, in vitro selection | Electrochemical, Optical | Cancer biomarker detection [3] |
| Whole Cell | Metabolic or transcriptional response | Provides functional toxicity data; can detect bioavailable fraction | Optical (Luminescence, Fluorescence) | Environmental toxicity monitoring, BOD sensing [8] |
Experimental Protocol: Bioreceptor Immobilization
A critical step in biosensor fabrication is the immobilization of the bioreceptor onto the transducer surface. The method of immobilization must preserve the bioreceptor's activity and orientation while ensuring stability and proximity to the transducer [4].
Detailed Methodology: Covalent Immobilization on a Gold Transducer Surface
This protocol is commonly used for antibodies, enzymes, and aptamers on SPR or electrochemical platforms.
- Surface Cleaning: The gold transducer surface is first cleaned with a piranha solution (a 3:1 mixture of concentrated sulfuric acid and hydrogen peroxide) for 15 minutes, followed by thorough rinsing with deionized water and ethanol. (Caution: Piranha solution is highly corrosive and must be handled with extreme care.)
- Self-Assembled Monolayer (SAM) Formation: The clean, dry gold surface is immersed in a 1 mM solution of 11-mercaptoundecanoic acid in absolute ethanol for 12-18 hours. This forms a SAM with exposed carboxylic acid terminals.
- Activation of Carboxyl Groups: The SAM-functionalized surface is rinsed with ethanol and dried under nitrogen. It is then incubated in a aqueous solution containing 400 mM 1-ethyl-3-(3-dimethylaminopropyl)carbodiimide (EDC) and 100 mM N-hydroxysuccinimide (NHS) for 30 minutes. This activation step converts the carboxyl groups to amine-reactive NHS esters.
- Bioreceptor Coupling: The surface is rinsed with a suitable buffer (e.g., 10 mM phosphate buffer, pH 7.4) to remove excess EDC/NHS. It is then immediately incubated with a solution of the bioreceptor (e.g., 50-100 µg/mL of antibody or enzyme in phosphate buffer) for 2-4 hours. The primary amines (e.g., lysine residues) on the bioreceptor form stable amide bonds with the activated surface.
- Quenching and Washing: After coupling, unreacted NHS esters are quenched by incubating with 1 M ethanolamine hydrochloride (pH 8.5) for 15 minutes. The final biosensor surface is rinsed thoroughly with buffer to remove any physisorbed bioreceptor and stored appropriately.
The Transducer: Gateway for Signal Conversion
The transducer is the component that converts the (bio)chemical signal resulting from the biorecognition event into a useful, quantifiable analytical signal, typically electrical or optical [2] [1]. It is the primary determinant of a biosensor's sensitivity, dynamic range, and operational simplicity. The transducer must be in intimate contact with the bioreceptor to efficiently capture the signal generated by the analyte-bioreceptor interaction, a process known as signalization [2].
Classification and Operating Principles of Transducers
Transducers are categorized based on the fundamental physicochemical principle they exploit for signal conversion.
- Electrochemical Transducers: These are the most prevalent class, measuring electrical properties arising from biochemical reactions [4] [3]. They are prized for their high sensitivity, potential for miniaturization, and low cost.
- Amperometric: Measures the current generated by the oxidation or reduction of an electroactive species at a constant applied potential. The current is proportional to the analyte concentration. (e.g., Glucose biosensors measuring the production of H₂O₂) [2] [4].
- Potentiometric: Measures the change in potential (voltage) at an electrode surface between a reference electrode and an ion-selective electrode (e.g., pH meter, NH₄⁺ ion-selective electrode). The potential follows the Nernst equation and is logarithmic to the ion concentration [3].
- Conductometric: Measures the change in the electrical conductivity of the solution between two electrodes due to the biochemical reaction [3].
- Optical Transducers: These transducers detect changes in the properties of light [4].
- Surface Plasmon Resonance (SPR): Detects changes in the refractive index on a thin gold film surface, which occurs when biomolecules (e.g., antigens) bind to immobilized receptors (e.g., antibodies). This allows for real-time, label-free monitoring of binding kinetics [6] [3].
- Fluorescence: Measures the intensity, wavelength, or lifetime of emitted light from a fluorophore. Techniques like FRET (Förster Resonance Energy Transfer) can be used to detect proximity changes between molecules [3].
- Piezoelectric Transducers: These are mass-sensitive devices. They measure the change in the resonance frequency of a crystal (commonly quartz) when mass is deposited on its surface due to the binding of the analyte. They are highly sensitive and can detect very small molecular weight analytes [4].
- Thermal Transducers (Calorimetric): These measure the enthalpy change (heat generated or absorbed) from a biochemical reaction, typically an enzyme-catalyzed one. All enzymatic reactions are exothermic or endothermic, making this a general detection method [2] [4].
Table 2: Comparison of Major Transducer Types
| Transducer Type | Measured Quantity | Key Advantage | Limit of Detection | Exemplary Bioreceptor Pairing |
|---|---|---|---|---|
| Amperometric | Current | High sensitivity, fast response | ~µM-nM [2] | Enzyme (Glucose Oxidase) |
| Potentiometric | Potential (Voltage) | Wide dynamic range, simple instrumentation | ~mM-µM [3] | Ion-selective enzymes, Whole cells |
| Optical (SPR) | Refractive Index | Label-free, real-time kinetics | ~nM-pM [6] | Antibody, DNA |
| Optical (Fluorescence) | Light Intensity/Wavelength | Ultra-high sensitivity, multiplexing | ~pM-fM [3] | Antibody, Aptamer |
| Piezoelectric (QCM) | Mass/Frequency | Label-free, sensitive to mass changes | ~ng/cm² [4] | Antibody, Whole cells |
| Thermal | Temperature/Heat | Label-free, universal for enzymatic reactions | ~µM [4] | Enzyme |
Experimental Protocol: Calibration of an Amperometric Biosensor
Calibration is essential to correlate the transducer's output signal with the concentration of the target analyte.
Detailed Methodology: Calibration Curve for a Glucose Biosensor
- Apparatus Setup: Use a standard three-electrode electrochemical cell: a working electrode (e.g., platinum or screen-printed carbon with immobilized Glucose Oxidase), a reference electrode (e.g., Ag/AgCl), and a counter electrode (e.g., platinum wire). Connect the cell to a potentiostat.
- Buffer Preparation: Prepare a 0.1 M phosphate buffer saline (PBS, pH 7.4) as the supporting electrolyte.
- Standard Solution Preparation: Prepare a series of glucose standard solutions in the PBS buffer with concentrations spanning the expected working range (e.g., 0.1 µM, 1 µM, 10 µM, 100 µM, 1 mM, 10 mM).
- Applied Potential: Set the potentiostat to apply a constant potential of +0.7 V vs. Ag/AgCl to the working electrode. This potential is sufficient to oxidize the hydrogen peroxide (H₂O₂) produced by the GOD-catalyzed reaction of glucose and oxygen.
- Measurement:
- Place a fixed volume (e.g., 10 mL) of PBS buffer in the electrochemical cell and allow the background current to stabilize.
- Add a known volume of the lowest concentration glucose standard to the cell and stir gently.
- Record the steady-state current response. The difference from the background current is the analytical signal.
- Rinse the electrodes thoroughly with PBS buffer between measurements.
- Repeat the process for each standard solution in increasing order of concentration.
- Data Analysis: Plot the steady-state current (µA) on the y-axis against the corresponding glucose concentration (mM) on the x-axis. Perform linear regression analysis to obtain the calibration equation (y = mx + c) and the correlation coefficient (R²). The slope (m) represents the sensitivity of the biosensor.
Visualization of Biosensor Architecture and Signaling Pathways
The following diagrams, generated using DOT language, illustrate the core architecture of a biosensor and the signaling pathways for different transducer types.
Biosensor Core Architecture and Signal Flow
Transducer Signaling Pathways
The Scientist's Toolkit: Essential Research Reagent Solutions
The development and implementation of biosensors rely on a suite of specialized reagents and materials. The following table details key solutions used in the fabrication and operation of biosensors, as featured in the experimental protocols and research contexts above.
Table 3: Key Research Reagent Solutions for Biosensor Development
| Reagent / Material | Function / Explanation | Exemplary Use Case |
|---|---|---|
| Glucose Oxidase (GOD) | Model enzyme bioreceptor; catalyzes glucose oxidation while consuming O₂ and producing H₂O₂. | The foundational enzyme for amperometric glucose biosensors [3]. |
| Screen-Printed Electrodes (SPEs) | Disposable, miniaturized electrochemical cells (working, reference, counter electrodes) on a planar substrate. | Enable low-cost, portable, and mass-producible biosensors for point-of-care testing [5] [3]. |
| 11-Mercaptoundecanoic Acid | A thiol-containing molecule that forms a self-assembled monolayer (SAM) on gold surfaces, presenting carboxyl groups for further functionalization. | Used in covalent immobilization protocols to create a stable, ordered surface for bioreceptor attachment [6]. |
| EDC / NHS Crosslinkers | 1-Ethyl-3-(3-dimethylaminopropyl)carbodiimide (EDC) and N-Hydroxysuccinimide (NHS) are used to activate carboxyl groups, forming amine-reactive esters for stable amide bond formation. | Standard chemistry for covalently immobilizing proteins (antibodies, enzymes) onto transducer surfaces [6]. |
| Gold Sensor Chips | Thin gold film substrates on glass slides. The gold surface is ideal for SAM formation and is an excellent conductor for electron transfer in electrochemistry and for exciting surface plasmons. | The standard platform for Surface Plasmon Resonance (SPR) biosensors and many electrochemical sensors [6] [3]. |
| Firefly Luciferase / GFP | Luciferase produces bioluminescence (light) in the presence of its substrate (luciferin). Green Fluorescent Protein (GFP) is a protein that fluoresces green when exposed to blue light. | Common reporter genes in whole-cell biosensors (bioreporters) to generate an optical signal upon analyte detection [8]. |
| Aptamers | Short, single-stranded DNA or RNA oligonucleotides selected for high-affinity binding to specific non-nucleic acid targets (e.g., proteins, ions). | Synthetic bioreceptors offering high stability and versatility; used for detecting targets from cancer biomarkers to small molecules [3]. |
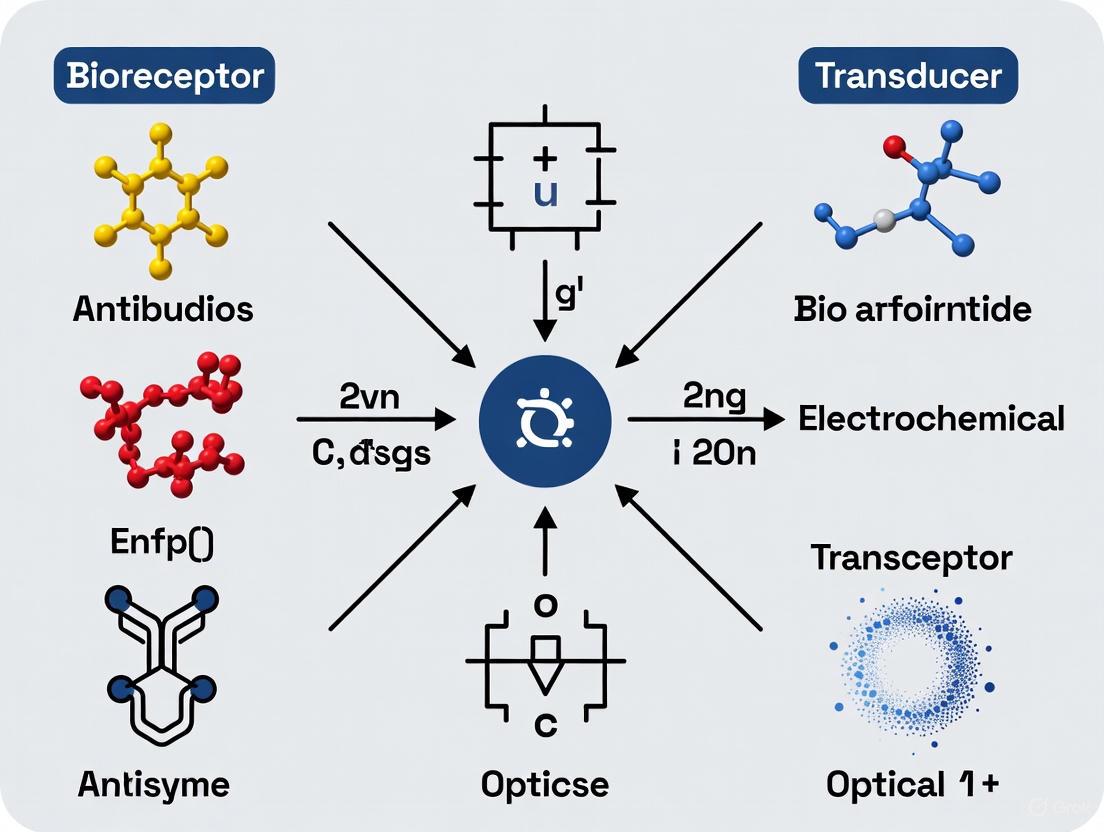
A biosensor is an analytical device that integrates a biological recognition element with a physicochemical transducer to produce a measurable signal proportional to the concentration of a target analyte [9] [2]. This sophisticated synergy between biological components and electronic systems enables the detection and quantification of substances in applications ranging from medical diagnostics and environmental monitoring to food safety and bioprocessing [10] [11]. The core of any biosensing system rests on two fundamental components: the bioreceptor, which provides molecular recognition specificity, and the transducer, which converts the biological interaction into a quantifiable electronic signal [9] [12].
Bioreceptors serve as the molecular recognition elements capable of identifying specific target molecules (analytes) through biochemical mechanisms [13]. These biological elements—including enzymes, antibodies, aptamers, and nucleic acids—leverage the exquisite specificity inherent in biological interactions to distinguish target molecules even within complex sample matrices like blood, urine, or food products [9] [11]. The selectivity of a biosensor is predominantly determined by the bioreceptor's inherent binding affinity for its target analyte [10].
The transducer component functions as a signal converter, transforming the biochemical response resulting from the bioreceptor-analyte interaction into a measurable electronic signal [14]. This signal conversion, known as signalization, can occur through various mechanisms including electrochemical, optical, thermal, or gravimetric methods [10] [2]. The resulting electrical signals are subsequently processed, amplified, and converted into digital format for display and interpretation by the end user [10] [2].
Table 1: Fundamental Components of a Biosensor
| Component | Function | Examples |
|---|---|---|
| Analyte | Substance to be detected | Glucose, pathogens, toxins, proteins, nucleic acids |
| Bioreceptor | Molecular recognition element | Enzymes, antibodies, aptamers, nucleic acids, cells |
| Transducer | Signal conversion device | Electrode, optical detector, piezoelectric crystal |
| Electronics | Signal processing unit | Amplifier, analog-to-digital converter, processor |
| Display | User interface | Screen, printer, wireless transmission unit |
The evolution of biosensor technology has progressed through multiple generations, from early mediator-less systems to contemporary approaches incorporating nanomaterials and artificial binding proteins to enhance analytical performance [2]. This technological advancement has enabled the development of increasingly sophisticated, sensitive, and miniaturized biosensing platforms, including wearable devices for continuous health monitoring [14]. The following sections provide a comprehensive examination of the major bioreceptor types, their operational mechanisms, and their integration within modern biosensing architectures.
Bioreceptor Fundamentals and Classification
Bioreceptors constitute the critical recognition component in biosensors, enabling specific interaction with target analytes through biological binding mechanisms [9]. These molecules or molecular assemblies demonstrate selective affinity for particular chemical structures or epitopes, allowing them to distinguish target molecules from other components in a complex sample matrix [11]. The binding event between bioreceptor and analyte generates a physicochemical change—such as heat, light, pH variation, charge distribution, or mass alteration—that the transducer subsequently converts into a measurable signal [10].
Bioreceptors are broadly classified into two primary categories: catalytic bioreceptors and affinity-based bioreceptors [9]. Catalytic bioreceptors, predominantly enzymes, facilitate biochemical reactions with their target substrates, generating products that the transducer can detect [9] [10]. In contrast, affinity-based bioreceptors—including antibodies, aptamers, and nucleic acids—bind to their targets without catalyzing chemical reactions, forming stable complexes through molecular complementarity [9] [13].
The immobilization of bioreceptors onto transducer surfaces represents a critical step in biosensor fabrication, significantly impacting sensor performance, stability, and reproducibility [12]. Both physical and chemical immobilization techniques are employed, with chemical methods utilizing covalent bonding between bioreceptors and functionalized transducer surfaces [10]. Physical immobilization approaches include entrapment within polymer matrices, microencapsulation, electropolymerization, and adsorption [10]. Strategic immobilization preserves bioreceptor activity while ensuring optimal orientation and accessibility for target analytes [12].
Table 2: Major Bioreceptor Classification and Characteristics
| Bioreceptor Type | Recognition Mechanism | Key Characteristics | Primary Applications |
|---|---|---|---|
| Enzymes | Catalytic substrate conversion | High turnover number, reusable, susceptible to environmental conditions | Metabolic markers (glucose, lactate, urea), environmental toxins |
| Antibodies | Antigen-antibody binding | High specificity (≥10⁸ L/mol), Y-shaped structure, production requires animals | Pathogen detection, disease diagnosis, therapeutic drug monitoring |
| Aptamers | 3D structure complementarity | Synthetic selection (SELEX), DNA/RNA-based, thermal stability, reversible denaturation | Small molecule detection, cancer biomarkers, infectious agents |
| Nucleic Acids | Complementary base pairing | DNA/RNA probes, genosensors, high specificity for complementary sequences | Genetic disease markers, pathogen identification, mutation analysis |
The performance of bioreceptors is evaluated against several critical parameters including sensitivity (lowest detectable analyte concentration), selectivity (ability to distinguish target from interferents), stability (operational lifespan), and reproducibility (consistent performance across multiple assays) [10]. Different bioreceptor classes exhibit distinct advantages and limitations across these parameters, necessitating careful selection based on the specific application requirements and operational environment [15] [16].
Enzyme-Based Bioreceptors
Mechanism and Recognition Principles
Enzymes represent the most established class of catalytic bioreceptors, functioning as biological catalysts that accelerate the conversion of specific substrate molecules into detectable products [9]. The recognition mechanism in enzymatic biosensors relies on the enzyme's specific binding affinity for its target substrate, which serves as the analyte of interest [10]. This interaction occurs at the enzyme's active site, a three-dimensional pocket with complementary structure and chemical properties to the target molecule [9]. The catalytic activity of enzymes enables signal amplification through continuous turnover of substrate molecules, potentially enhancing detection sensitivity [9].
Enzymatic biosensors operate through three primary mechanistic principles: (1) the enzyme converts the target analyte into an electrochemically or optically detectable product; (2) the analyte directly inhibits or activates enzyme activity, producing a measurable change in catalytic function; or (3) the interaction between enzyme and analyte modifies intrinsic enzyme properties detectable by the transducer [9]. Since enzymes are not consumed during the recognition process, enzymatic biosensors can theoretically function continuously, though practical limitations include enzyme stability and gradual inactivation [9].
Key Applications and Experimental Protocols
The most prominent application of enzymatic biosensors is the glucose monitor, which utilizes the enzyme glucose oxidase (GOx) to catalyze the oxidation of β-D-glucose to D-glucono-1,5-lactone and hydrogen peroxide [2]. The electrochemical transducer then detects the generated hydrogen peroxide through its oxidation, producing an amperometric signal proportional to glucose concentration [2]. Similarly, urease-based biosensors detect urea through enzymatic hydrolysis to ammonium and bicarbonate ions, detectable through potentiometric or conductometric transducers [2].
A representative experimental protocol for fabricating an enzymatic glucose biosensor involves the following steps:
- Electrode Preparation: Clean and polish the working electrode (typically gold or carbon) to create a uniform surface [10].
- Enzyme Immobilization: Apply glucose oxidase enzyme to the electrode surface using entrapment within a polymer matrix (e.g., Nafion or polypyrrole) or cross-linking with glutaraldehyde [10] [2].
- Membrane Application: Coat with a semi-permeable membrane (e.g., polyurethane) to limit glucose diffusion, extending linear detection range and preventing fouling [2].
- Calibration: Immerse in standard glucose solutions of known concentration and measure amperometric response at +0.6V to 0.7V (vs. Ag/AgCl) to establish calibration curve [2].
- Sample Measurement: Apply sample and measure current response, calculating glucose concentration from calibration curve [2].
Performance Characteristics and Limitations
Enzymatic biosensors demonstrate excellent sensitivity with detection limits frequently reaching nanomolar or even picomolar concentrations for certain analytes [9]. The linear dynamic range typically spans 2-3 orders of magnitude, suitable for most clinical and environmental applications [10]. However, enzyme-based systems face limitations including sensitivity to environmental conditions (pH, temperature, ionic strength), limited operational stability due to enzyme denaturation, and potential inhibition by competing substrates or contaminants [9] [12]. These constraints have motivated the development of advanced immobilization techniques and engineered enzymes with enhanced stability for extended biosensor lifetime [2].
Antibody-Based Bioreceptors
Mechanism and Recognition Principles
Antibodies, or immunoglobulins, constitute the primary recognition elements in immunosensors, leveraging the exquisite specificity of the vertebrate immune response for target detection [9] [16]. These Y-shaped proteins generated in response to foreign antigens contain paratopes (antigen-binding sites) located at the tips of their variable regions that specifically recognize and bind to corresponding epitopes on target antigens [12]. The antibody-antigen interaction follows a "lock-and-key" fit model where structural and chemical complementarity enables highly specific molecular recognition [9].
The binding affinity of antibodies for their targets typically exceeds 10⁸ L/mol, representing nearly irreversible association once the antibody-antigen complex forms [9]. This high binding constant enables exceptional detection specificity but can complicate sensor regeneration for reusable applications [16]. Antibody-based biosensors predominantly function through direct binding mechanisms, where antigen capture produces physicochemical changes measurable by transducers, though competitive and displacement formats are also employed for smaller analytes [12].
Key Applications and Experimental Protocols
Immunosensors have found widespread application in clinical diagnostics for detecting disease biomarkers, pathogens, and therapeutic drugs [16] [13]. For instance, Kaushik et al. developed an immunosensing chip for Zika virus detection by immobilizing ZIKV-envelope protein antibodies onto a self-assembled monolayer-functionalized transducer surface [12]. The specific capture of intact Zika virions generated detectable signals proportional to viral concentration, enabling rapid diagnosis with potential for point-of-care applications [12].
A standard protocol for developing a sandwich ELISA-based optical immunosensor includes:
- Surface Functionalization: Covalently immobilize capture antibodies on gold sensor surface using self-assembled monolayers (SAMs) of alkanethiols [16] [12].
- Blocking: Treat surface with inert protein (e.g., BSA) to minimize non-specific binding [12].
- Antigen Incubation: Introduce sample containing target antigen, allowing formation of antibody-antigen complexes [13].
- Detection Antibody Application: Introduce enzyme-conjugated detection antibody that binds to captured antigen at a different epitope [13].
- Signal Generation: Add enzyme substrate (e.g., TMB for horseradish peroxidase) producing colorimetric, fluorescent, or chemiluminescent signal proportional to antigen concentration [13].
- Signal Measurement: Quantify signal intensity using optical transducer (absorbance, fluorescence, or SPR) [16] [12].
Performance Characteristics and Limitations
Antibody-based biosensors provide exceptional specificity and sensitivity, with detection limits extending to picomolar concentrations for certain targets [16]. However, they face limitations including production complexity requiring animal hosts, batch-to-batch variability, sensitivity to denaturation under suboptimal pH or temperature conditions, and limited shelf life due to irreversible denaturation [15] [16]. These constraints have motivated the development of alternative recognition elements, particularly aptamers, which offer comparable specificity with enhanced stability and production consistency [15] [16].
Aptamer-Based Bioreceptors
Mechanism and Recognition Principles
Aptamers represent a class of synthetic affinity bioreceptors consisting of short single-stranded DNA or RNA oligonucleotides (typically 15-80 bases) engineered to bind specific target molecules with high affinity and specificity [15] [12]. These nucleic acid-based recognition elements fold into defined three-dimensional structures—including stems, loops, bulges, and G-quadruplexes—that create complementary binding surfaces for their target analytes through electrostatic interactions, hydrogen bonding, van der Waals forces, and shape complementarity [15] [16].
Aptamers are developed through an iterative selection process called Systematic Evolution of Ligands by Exponential Enrichment (SELEX) [15]. This methodology involves repeated cycles of selection, amplification, and enrichment from a vast random-sequence oligonucleotide library (up to 10¹⁴ different sequences) to isolate molecules with optimal binding characteristics for the target analyte [15]. The SELEX process enables aptamer development against diverse targets including proteins, small molecules, cells, and even entire pathogens [15].
Key Applications and Experimental Protocols
Aptasensors (aptamer-based biosensors) have demonstrated remarkable versatility across diverse applications including clinical diagnostics, environmental monitoring, and food safety [15]. For infectious disease diagnosis, aptamers have been developed against pathogenic microorganisms including Escherichia coli O157:H7, Salmonella typhimurium, Mycobacterium tuberculosis, and SARS-CoV-2 [15]. In cancer diagnostics, aptamers targeting specific biomarkers such as nucleolin, tenascin, prostate-specific antigen (PSA), and mucin 1 (MUC1) enable early disease detection and monitoring [15].
The experimental protocol for developing an electrochemical aptasensor for cortisol detection involves:
- Aptamer Functionalization: Modify thiolated cortisol-specific aptamer with methylene blue redox tag [12].
- Electrode Modification: Immobilize functionalized aptamers on gold electrode surface via gold-thiol self-assembled monolayers [12].
- Folding Induction: Incubate in appropriate buffer to facilitate aptamer folding into correct 3D conformation [15].
- Sample Exposure: Introduce sample containing cortisol, inducing conformational change in aptamer upon target binding [12].
- Signal Measurement: Monitor current change via square wave voltammetry as binding alters electron transfer efficiency [12].
- Quantification: Calculate cortisol concentration from calibration curve of current response versus concentration [12].
Performance Characteristics and Limitations
Aptamers offer significant advantages over antibodies including smaller size (5-15 kDa), thermal stability, reversible denaturation, chemical synthesis scalability, minimal batch-to-batch variation, and lack of animal requirement for production [15]. These properties contribute to longer shelf life, lower production costs, and enhanced reproducibility [15] [16]. However, aptamers face limitations including susceptibility to nuclease degradation (particularly RNA aptamers) in biological fluids, necessitating chemical modifications to enhance stability, and potential limitations in library diversity coverage during selection [15].
Table 3: Comparative Analysis: Aptamers versus Antibodies as Bioreceptors
| Characteristic | Aptamers | Antibodies |
|---|---|---|
| Molecular Weight | 5-15 kDa | 150-170 kDa |
| Production Process | SELEX (in vitro) | Animal immunization (in vivo) |
| Generation Time | Weeks to months | Several months |
| Production Scalability | Highly scalable (chemical synthesis) | Limited scalability |
| Batch-to-Batch Variation | Low | High |
| Stability | Thermally stable, reversible denaturation | Sensitive to temperature, irreversible denaturation |
| Modification Flexibility | Easily modified with functional groups | Limited modification options |
| Cost | Lower production cost | Higher production cost |
| Ethical Concerns | None | Animal use required |
| Target Range | Broad (ions, small molecules, cells) | Limited to immunogenic targets |
Nucleic Acid-Based Bioreceptors
Mechanism and Recognition Principles
Nucleic acid-based bioreceptors utilize the specific complementary base pairing of DNA or RNA sequences for target recognition [9]. These bioreceptors function through two primary mechanisms: genosensors employ complementary nucleic acid probes to detect specific DNA or RNA sequences through hybridization, while aptasensors utilize engineered nucleic acids (aptamers) that bind non-nucleic acid targets through structural recognition, as detailed in Section 5 [9] [15]. The fundamental recognition principle in genosensors involves Watson-Crick base pairing (adenine-thymine/uracil, cytosine-guanine), where single-stranded probe sequences immobilized on the transducer surface hybridize with complementary target sequences in the sample [9].
Nucleic acid bioreceptors can be constructed from natural DNA/RNA or synthetic analogues including peptide nucleic acids (PNAs) and locked nucleic acids (LNAs) that offer enhanced binding affinity and stability [10]. PNA replaces the sugar-phosphate backbone with a peptide-like structure, conferring resistance to nuclease degradation and enabling stronger binding due to lack of electrostatic repulsion [10]. LNA "locks" the ribose ring in the 3'-endo conformation, reducing conformational flexibility and increasing hybridization affinity and specificity [10].
Key Applications and Experimental Protocols
Nucleic acid-based biosensors have found significant application in genetic disease diagnosis, pathogen detection, and genetic polymorphism analysis [12]. For example, biosensors have been developed for detecting Mycobacterium tuberculosis DNA sequences in clinical samples, enabling rapid tuberculosis diagnosis [15]. Similarly, genosensors can identify single-nucleotide polymorphisms associated with inherited disorders, cancer predisposition, or drug metabolism variations [12].
A standard protocol for developing a fluorescent genosensor for bacterial detection includes:
- Probe Design: Select unique 18-25 base pair sequence specific to target bacterial DNA and label with fluorophore (e.g., FAM) [9] [12].
- Surface Functionalization: Immobilize complementary capture probes on activated sensor surface (e.g., aldehyde-modified glass) [12].
- Sample Processing: Extract and amplify target bacterial DNA from sample using PCR with biotinylated primers [9].
- Hybridization: Incubate biotinylated amplicon with capture probes, allowing specific hybridization [9].
- Signal Detection: Apply streptavidin-conjugated quantum dots for signal amplification, measure fluorescence emission [12].
- Data Analysis: Quantify target concentration from fluorescence intensity using established calibration curves [12].
Performance Characteristics and Limitations
Nucleic acid-based biosensors offer exceptional sequence specificity, capable of distinguishing single-base mismatches under optimized conditions [10]. The stability of DNA makes these bioreceptors suitable for long-term storage and field applications [9]. However, they face limitations including susceptibility to degradation by nucleases (unless modified), dependence on sample amplification techniques (e.g., PCR) for low-concentration targets, and relatively narrow application scope primarily limited to nucleic acid targets for genosensors [12]. These limitations have motivated the development of advanced nucleic acid analogues and integration with pre-concentration methodologies to enhance detection capabilities.
Transducer Technologies and Bioreceptor Integration
Transducer Operating Principles
Transducers serve as the signal conversion component in biosensors, transforming the biorecognition event into a quantifiable electronic signal through various physicochemical mechanisms [2] [14]. The major transducer classifications include electrochemical, optical, piezoelectric, and thermal systems, each with distinct operating principles and implementation considerations [2] [12].
Electrochemical transducers measure electrical changes resulting from biorecognition events, including current (amperometric), potential (potentiometric), impedance (impedimetric), or conductance (conductometric) variations [13] [12]. These systems dominate the commercial biosensor market, particularly for glucose monitoring, due to their sensitivity, simplicity, and miniaturization potential [13]. Optical transducers monitor changes in light properties including absorbance, fluorescence, luminescence, reflectance, or refractive index induced by analyte binding [16] [11]. Surface plasmon resonance (SPR) and localized surface plasmon resonance (LSPR) platforms represent prominent label-free optical biosensing technologies that detect refractive index changes near functionalized metal surfaces [16] [12].
Bioreceptor-Transducer Integration Strategies
The integration of bioreceptors with transducers represents a critical fabrication step significantly influencing biosensor performance, stability, and reproducibility [12]. Immobilization strategies must preserve bioreceptor activity while ensuring optimal orientation and accessibility for target analytes [12]. Covalent attachment through chemical linkers provides stable, oriented immobilization, particularly for antibodies and enzymes [12]. Physical adsorption offers simplicity but may result in random orientation and gradual leakage [10]. Entrapment within polymer matrices or membrane systems preserves biological activity while containing the recognition element [10] [2].
Affinity-based immobilization utilizing molecular partnerships such as biotin-streptavidin, His-tag-NTA, or protein A/G-antibody Fc regions provides controlled orientation and enhanced binding capacity [12]. For nucleic acid-based bioreceptors, direct thiol-gold or silane chemistry enables stable attachment to transducer surfaces [12]. Spacer molecules are frequently incorporated to extend bioreceptors from the transducer surface, reducing steric hindrance and improving recognition efficiency [12].
Table 4: Transducer Technologies in Biosensing
| Transducer Type | Measurement Principle | Detection Limit | Advantages | Limitations |
|---|---|---|---|---|
| Electrochemical | Current/Potential/Impedance change | nM-fM | High sensitivity, portable, low cost | Temperature sensitive, electrode fouling |
| Optical (SPR) | Refractive index change | pM-nM | Label-free, real-time monitoring, high sensitivity | Bulky equipment, temperature sensitive |
| Optical (Fluorescence) | Light emission intensity | fM-pM | Ultra-sensitive, multiplexing | Photobleaching, requires labeling |
| Piezoelectric (QCM) | Mass change | ng-cm⁻² | Label-free, real-time, versatile | Non-specific binding, viscous damping |
| Thermal (Calorimetric) | Heat change | μM-mM | Universal detection, does not require optical transparency | Temperature control critical, slow response |
Emerging Trends: Nanomaterials and Wearable Integration
The integration of nanomaterials represents a significant advancement in biosensor technology, enhancing sensitivity, response time, and detection limits [2] [17]. Nanoparticles, nanowires, carbon nanotubes, and quantum dots provide high surface-to-volume ratios for increased bioreceptor loading, enhanced catalytic activity, and unique electronic, optical, and magnetic properties that amplify detection signals [2] [17]. Gold nanoparticles, for instance, enable signal amplification in optical biosensors through localized surface plasmon resonance (LSPR) and in electrochemical biosensors through enhanced electron transfer [2].
The convergence of biosensing technology with wearable platforms represents another transformative trend, enabling continuous health monitoring through sweat, tears, or interstitial fluid analysis [14]. These systems integrate flexible substrates, microfluidics for sample handling, and wireless connectivity for real-time data transmission [14]. Successful wearable biosensors have been developed for monitoring biomarkers including glucose, lactate, pH, chloride, cortisol, and uric acid in sweat, providing non-invasive alternatives to blood-based measurements [14].
The Scientist's Toolkit: Research Reagent Solutions
Table 5: Essential Research Reagents for Bioreceptor Development and Biosensing
| Reagent Category | Specific Examples | Function and Application |
|---|---|---|
| Immobilization Matrices | Alkanethiols, silanes, polypyrrole, Nafion, chitosan | Create functionalized surfaces for bioreceptor attachment, provide suitable chemical environment |
| Cross-linking Agents | Glutaraldehyde, EDC/NHS, GMBS, sulfo-SMCC | Covalently conjugate bioreceptors to transducer surfaces with controlled orientation |
| Blocking Agents | BSA, casein, salmon sperm DNA, SuperBlock | Minimize non-specific binding to improve signal-to-noise ratio |
| Signal Generators | Horseradish peroxidase, alkaline phosphatase, quantum dots, methylene blue | Generate detectable signals (colorimetric, fluorescent, electrochemical) from biorecognition events |
| Nanomaterial Enhancers | Gold nanoparticles, graphene oxide, carbon nanotubes, magnetic beads | Amplify detection signals, increase surface area, enhance bioreceptor stability |
| Buffer Systems | PBS, HEPES, Tris-EDTA, MOPS | Maintain optimal pH and ionic strength for bioreceptor activity and stability |
Bioreceptors constitute the molecular recognition core of biosensing systems, with enzymes, antibodies, aptamers, and nucleic acids each offering distinct advantages and limitations for specific applications. The selection of an appropriate bioreceptor-transducer combination depends fundamentally on the target analyte, required sensitivity and specificity, sample matrix, and operational environment. Future directions in bioreceptor development include the engineering of artificial binding proteins with enhanced stability, the refinement of nucleic acid analogues with superior binding properties, and the integration of machine learning approaches to accelerate bioreceptor discovery and optimization. The continuing convergence of bioreceptor engineering with nanomaterials science and microfluidics will further advance the capabilities of biosensing platforms toward multiplexed, point-of-care diagnostic systems with enhanced sensitivity, specificity, and operational convenience.
In biosensing research, the core function of a device hinges on the synergistic partnership between two key components: the bioreceptor and the transducer. The bioreceptor is a biological element, such as an enzyme, antibody, aptamer, or nucleic acid, responsible for the selective recognition of the target analyte [2] [18]. This interaction, known as biorecognition, produces a physicochemical change. The transducer is the device that converts this change into a quantifiable electrical signal, which is then processed and displayed [2] [18]. The transducer is, therefore, the critical interface that translates a biological event into actionable data, and its operating principle largely defines the capabilities and classification of the biosensor. This guide provides an in-depth examination of the four principal transducer methods—electrochemical, optical, gravimetric, and thermal—that form the foundation of modern biosensing research and drug development.
Core Transducer Operating Principles and Methodologies
Electrochemical Transducers
Electrochemical transducers are among the most established and widely used in biosensing. They operate by detecting electrical changes arising from biorecognition events on an electrode surface [2] [18]. These changes can be in electrical potential, current, or impedance. The high sensitivity and compatibility with miniaturized, portable systems make them particularly attractive for point-of-care diagnostics [18].
- Experimental Protocol: Amperometric Glucose Biosensor
- Objective: To detect glucose concentration by measuring the current generated from the enzymatic oxidation of glucose.
- Bioreceptor: Glucose Oxidase (GOx) enzyme.
- Methodology:
- Electrode Preparation: A working electrode (e.g., Platinum or Gold) is cleaned and polished.
- Enzyme Immobilization: GOx is immobilized onto the electrode surface using a method such as cross-linking with glutaraldehyde or entrapment within a polymer matrix like Nafion.
- Baseline Measurement: The electrode is placed in a buffer solution, and a constant potential (e.g., +0.7 V vs. Ag/AgCl reference electrode) is applied. The background current is recorded.
- Analyte Introduction: A sample containing glucose is introduced into the cell.
- Signal Measurement: GOx catalyzes the reaction: Glucose + O₂ → Gluconolactone + H₂O₂. The subsequent oxidation of H₂O₂ at the electrode surface (H₂O₂ → O₂ + 2H⁺ + 2e⁻) generates an electrical current that is directly proportional to the glucose concentration [2].
- Calibration: The current response is calibrated against standard glucose solutions of known concentration.
The following diagram illustrates the signaling pathway and electron transfer in a third-generation electrochemical biosensor, which facilitates direct electron transfer.
Optical Transducers
Optical transducers measure changes in the properties of light resulting from the interaction between the analyte and bioreceptor [2]. These changes can include intensity, phase, polarization, or wavelength. A prominent example is Surface Plasmon Resonance (SPR), which was identified for real-time dependency reactions in 1983 [18].
- Experimental Protocol: Surface Plasmon Resonance (SPR) Immunosensor
- Objective: To monitor the binding kinetics between an antigen and an antibody in real-time without labels.
- Bioreceptor: Immobilized antibody.
- Methodology:
- Sensor Chip Functionalization: A gold-coated glass chip is modified with a self-assembled monolayer (e.g., carboxymethyl dextran) to enable biomolecule attachment.
- Ligand Immobilization: The antibody (ligand) is covalently immobilized onto the dextran matrix via amine coupling chemistry.
- Baseline Establishment: A buffer solution is flowed over the chip to establish a stable baseline for the SPR angle.
- Association Phase: The sample containing the antigen (analyte) is injected and flowed over the chip. Binding events cause an increase in the mass on the sensor surface, leading to a shift in the SPR angle, which is recorded in real-time as resonance units (RU).
- Dissociation Phase: Buffer flow is resumed, and the decrease in signal due to the dissociation of the antigen-antibody complex is monitored.
- Regeneration: The sensor surface is regenerated by injecting a mild acidic or basic solution to break the antigen-antibody bonds without denaturing the immobilized antibody, making the chip ready for a new cycle.
- Data Analysis: The association and dissociation rate constants (kₐ and kḍ) and the equilibrium binding constant (Kᴅ) are calculated from the sensorgram data.
Gravimetric Transducers
Gravimetric, or mass-based, transducers detect a mass change at the sensor surface upon binding of the analyte to the bioreceptor. The most common implementation is the Quartz Crystal Microbalance (QCM), which utilizes the piezoelectric effect [2] [18].
- Experimental Protocol: Quartz Crystal Microbalance (QCM) DNA Sensor
- Objective: To detect the hybridization of target DNA strands to probe DNA immobilized on a crystal surface.
- Bioreceptor: Single-stranded DNA (ssDNA) probes.
- Methodology:
- Crystal Preparation: An AT-cut quartz crystal with gold electrodes is cleaned in piranha solution and dried.
- Probe Immobilization: Thiol-modified ssDNA probes are chemisorbed onto the gold electrode surface via gold-thiol self-assembly, forming a monolayer.
- Blocking: The surface is exposed to a passivating molecule like 6-mercapto-1-hexanol to block non-specific binding sites.
- Baseline Frequency Measurement: The crystal is placed in a flow cell, and the fundamental resonant frequency (f₀) is stabilized in a buffer solution.
- Analyte Introduction & Measurement: A solution containing the complementary target DNA sequence is introduced. DNA hybridization increases the mass on the crystal surface, causing a decrease in the resonant frequency (Δf) as described by the Sauerbrey equation (Δf = -Cf • Δm), where Cf is the mass sensitivity constant.
- Specificity Control: A non-complementary DNA sequence is used to verify the specificity of the frequency shift.
Thermal Transducers
Thermal transducers, or calorimetric biosensors, measure the enthalpy change (heat) produced by biochemical reactions [2] [18]. All chemical and biological reactions are accompanied by a heat change, which is a universal property.
- Experimental Protocol: Enzyme Thermistor
- Objective: To determine the concentration of urea by measuring the heat generated from its enzymatic hydrolysis.
- Bioreceptor: Urease enzyme immobilized on a solid support.
- Methodology:
- Immobilization: Urease is immobilized onto a controlled-pore glass or polymer beads and packed into a small, insulated column (the enzyme reactor).
- Temperature Sensing: A highly sensitive thermistor (a device whose electrical resistance changes with temperature) is placed at the outlet of the column to measure the temperature of the effluent.
- Reference Column: A second, identical column without the enzyme is used as a reference to account for non-specific heating or cooling effects.
- Flow System: The sample and buffer are pumped through the enzyme column and the reference column at a constant flow rate.
- Signal Measurement: When a urea sample passes through the enzyme column, urease catalyzes the reaction: Urea + H₂O → 2NH₃ + CO₂. This exothermic reaction releases heat, causing a temperature increase (ΔT) in the column that is detected by the thermistor.
- Calibration: The temperature change is proportional to the substrate concentration and is calibrated using standard urea solutions.
Comparative Analysis of Transducer Principles
The following table provides a consolidated comparison of the four transducer methods, highlighting their key characteristics, advantages, and limitations for easy reference.
Table 1: Comparative Analysis of Biosensor Transducer Operating Principles
| Transducer Principle | Measured Quantity | Key Characteristics | Advantages | Limitations |
|---|---|---|---|---|
| Electrochemical [2] [18] | Current, Potential, or Impedance | - High sensitivity- Low detection limits- Easily miniaturized | - Low cost- Suitable for portable devices- Wide linear range | - Can be susceptible to interfering compounds- Requires stable reference electrode |
| Optical [2] [18] | Light Properties (e.g., intensity, wavelength) | - High specificity and sensitivity- Real-time monitoring capability | - Immunity to electromagnetic interference- Enables multiplexing | - Sensor fabrication can be complex and expensive- Bulky instrumentation for some methods |
| Gravimetric [2] [18] | Mass Change | - Label-free detection- Truly quantitative for surface mass | - Can be very sensitive to surface interactions- Provides kinetic information | - Susceptible to non-specific binding- Viscosity of the sample solution can interfere |
| Thermal [2] [18] | Enthalpy Change (Heat) | - Universal detection principle- Does not require optical transparency | - Applicable to any reaction that produces heat- Robust and relatively simple | - Low sensitivity compared to other methods- Requires excellent thermal insulation |
The workflow for developing and utilizing a biosensor, integrating both the bioreceptor and transducer, is summarized below.
The Scientist's Toolkit: Essential Research Reagent Solutions
The advancement of transducer technologies is heavily reliant on specialized reagents and materials. The following table details key components used in the fabrication and enhancement of modern biosensors.
Table 2: Key Research Reagents and Materials in Biosensing
| Item | Function in Biosensing Research | Example Use Case |
|---|---|---|
| Gold Nanoparticles (AuNPs) [2] | Signal amplification; enhance electron transfer; colorimetric labels. | Used in electrochemical and optical biosensors to lower the detection limit. |
| Carbon Nanotubes (CNTs) [2] | Increase electrode surface area; improve electrical conductivity; facilitate biomolecule immobilization. | Integrated into electrochemical transducer surfaces to enhance sensitivity. |
| Quantum Dots (QDs) [2] | Fluorescent labels with size-tunable emission colors and high photostability. | Employed as fluorophores in optical transduction for multiplexed detection. |
| Enzymes (e.g., Glucose Oxidase) [2] [18] | Act as biorecognition elements that catalyze specific reactions with the analyte. | The core bioreceptor in amperometric glucose biosensors. |
| Antibodies [2] [18] | Provide high-specificity binding to target antigens. | Immobilized on SPR chips or QCM electrodes for immunosensor applications. |
| Aptamers [18] | Synthetic single-stranded DNA or RNA molecules that bind targets with high affinity and specificity. | Used as stable, synthetic alternatives to antibodies in various transducer platforms. |
| Self-Assembled Monolayers (SAMs) | Provide a well-defined, functionalized surface for controlled immobilization of bioreceptors. | Used to attach thiol-modified DNA or antibodies onto gold transducer surfaces in QCM and SPR. |
The field of biosensing represents a cornerstone of modern analytical science, enabling the specific and quantitative detection of biological and chemical substances across healthcare, environmental monitoring, and food safety. At its core, every biosensor functions through the synergistic integration of two fundamental components: a bioreceptor, responsible for selective target recognition, and a transducer, which converts the biological interaction into a measurable signal [2] [1]. The evolution of these components—from the pioneering Clark oxygen electrode to the sophisticated nanomaterial-based sensors of today—charts a course of remarkable scientific innovation. This progression has been driven by the continuous pursuit of greater sensitivity, selectivity, and miniaturization, fundamentally transforming the capabilities of analytical devices [19] [2]. This review traces this technological journey, examining the key breakthroughs in bioreceptor and transducer design that have shaped the landscape of modern biosensing.
The Foundation: The Clark Oxygen Electrode
The origin of modern biosensors can be traced to the groundbreaking work of Leland C. Clark Jr., whose development of the oxygen electrode in the 1950s earned him the title "father of biosensors" [1] [20]. Clark's electrode was designed to measure oxygen partial pressure in liquids, solving a critical problem in cardiac surgery where the oxygen tension of blood coming out of an oxygenator needed verification [21].
Mechanism and Design Innovation
The Clark electrode operated on the principle of electrochemical reduction of oxygen. The core reaction at the platinum cathode is:
O₂ + 4e⁻ + 4H⁺ → 2H₂O [21]
Clark's pivotal innovation was the introduction of a semipermeable membrane (initially cellophane, later polyethylene) that covered both the platinum cathode and a silver anode [22] [20]. This membrane served multiple critical functions:
- Selective Permeability: It allowed oxygen to diffuse through while preventing other blood components from reaching the electrode surface.
- Fouling Prevention: It protected the platinum surface from "poisoning" by proteins and other contaminants in blood.
- Sample Depletion Control: Its limited oxygen permeability reduced oxygen depletion from the sample, enabling quantitative measurements [22] [20].
This membrane-covered design established the fundamental architecture for subsequent biosensors, creating a physical separation between the biological sample and the transducer while maintaining analytical communication.
The First Biosensor: Enzyme-Integrated Electrode
In 1962, Clark and Lyons made the conceptual leap that created the first true biosensor. They modified the oxygen electrode by incorporating the enzyme glucose oxidase (GOx) within the membrane [21] [1]. In this configuration, the enzyme served as the bioreceptor, specifically recognizing and catalyzing the oxidation of glucose, consuming oxygen in the process. The transducer (the oxygen electrode) then measured the decrease in oxygen tension, which was proportional to the glucose concentration [21]. This seminal work established the paradigm of coupling a biological recognition element with a physicochemical transducer.
Table 1: Key Historical Milestones in Early Biosensor Development
| Year | Developer | Innovation | Significance |
|---|---|---|---|
| 1956 | Leland Clark | Clark Oxygen Electrode [1] | First device for continuous monitoring of blood oxygen tension |
| 1962 | Clark & Lyons | Enzyme Electrode (Glucose Oxidase) [21] [1] | First true biosensor; introduced bioreceptor-transducer integration |
| 1969 | Guilbault & Montalvo | Potentiometric Urea Sensor [2] [1] | Expanded biosensing to new analytes and transducer types |
| 1975 | Yellow Spring Instruments (YSI) | First Commercial Glucose Biosensor [1] | Brought biosensor technology to practical application |
Core Biosensor Principles: Bioreceptors and Transducers
The functionality of any biosensor, from Clark's first device to modern nanosystems, rests upon the interplay between its two core components: the bioreceptor and the transducer.
Bioreceptors: The Recognition Element
The bioreceptor is a biological or biomimetic element that provides the sensor with its specificity by interacting selectively with the target analyte (Figure 1) [9] [23]. The interaction between the bioreceptor and analyte, termed biorecognition, generates a physicochemical change that initiates the sensing process [2].
Table 2: Common Types of Bioreceptors and Their Characteristics
| Bioreceptor | Mechanism of Action | Example Analytes | Advantages | Limitations |
|---|---|---|---|---|
| Enzymes [9] | Catalytic conversion of analyte | Glucose, Urea, Lactate | Signal amplification, reusability | Stability affected by environment |
| Antibodies [9] [13] | Specific binding to antigen | Pathogens, Proteins, Hormones | Very high specificity and affinity | Binding can be irreversible; expensive production |
| Nucleic Acids (DNA/RNA) [9] | Complementary base pairing | Genetic markers, Pathogens | High specificity, stable molecules | Requires complex sample processing |
| Aptamers [9] | Folding into 3D structure for binding | Ions, Small molecules, Proteins | Chemical stability, synthetic production | Selection process can be complex |
| Whole Cells [9] | Metabolic response | Toxins, Stress conditions | Functional metabolic information | Longer response time, less specific |
| Tissues [9] | Contain multiple natural enzymes | Environmental pollutants | Low cost, natural enzyme environment | Lack of specificity, transport barriers |
Transducers: The Signal Conversion Element
The transducer converts the biochemical signal resulting from the biorecognition event into a quantifiable electrical output, a process known as signalization [2] [1]. The main transducer types are categorized based on their operating principle:
- Electrochemical Transducers: Measure electrical properties changes due to biochemical reactions. These are further divided into:
- Optical Transducers: Detect changes in light properties (absorption, fluorescence, SPR) [2] [1]
- Thermal Transducers: Measure heat changes from biochemical reactions [2]
- Piezoelectric Transducers: Detect mass changes through frequency variations [24]
The following diagram illustrates the fundamental architecture and workflow of a generic biosensor, showing the relationship between the analyte, bioreceptor, transducer, and output.
The Evolution of Biosensor Generations
Biosensor technology has evolved through distinct generations, characterized by increasing integration and sophistication of the bioreceptor and transducer components [2].
First Generation: The Mediator-Less Era
First-generation biosensors directly applied Clark's original model. The products (e.g., H₂O₂) or reactants (e.g., O₂) of the enzymatic reaction diffused to the transducer surface to produce an electrical signal [2]. The glucose sensor based on glucose oxidase and oxygen consumption is the classic example. While revolutionary, these sensors were limited by their dependence on dissolved oxygen and susceptibility to interfering compounds.
To overcome the limitations of first-generation systems, second-generation biosensors incorporated artificial redox mediators [2]. These mediators, such as ferrocene, shuttled electrons between the bioreceptor (e.g., the redox center of an enzyme) and the transducer surface, making the signal independent of oxygen concentration and enabling operation at lower potentials with less interference [1]. This represented a significant advancement in transducer efficiency.
Third Generation: Direct Integration and Nanomaterials
Third-generation biosensors achieve direct electron transfer between the bioreceptor and transducer without mediators [2]. This has been facilitated by the integration of nanomaterials, which provide a conducive interface and nanoenvironment for biomolecules to communicate directly with the electronic components. This generation represents the current state-of-the-art, leveraging the unique properties of nanomaterials to create highly sensitive, reagentless biosensing platforms.
The Nanomaterial Revolution in Biosensing
The integration of nanotechnology has been the most transformative development in biosensing since Clark's initial invention. Nanomaterials, with their high surface-to-volume ratio, unique optical and electrical properties, and dimensional compatibility with biomolecules, have profoundly enhanced both bioreceptor immobilization and transducer signal generation [19] [2].
Key Nanomaterials and Their Functions
- Carbon Nanotubes (CNTs): Excellent electrical conductivity and large surface area make them ideal for electrochemical transducers, enhancing electron transfer and biomolecule loading [19] [2].
- Quantum Dots (QDs): Semiconductor nanoparticles with size-tunable fluorescence, serving as robust labels for optical transducers in place of traditional dyes [19] [2].
- Metal Nanoparticles (e.g., Gold, Silver): Used for their plasmonic properties in optical sensing and as conductive bridges in electrochemical sensors [19] [13].
- Nanowires and Nanorods: Their one-dimensional structure provides high sensitivity to surface binding events, enabling detection of single molecules [19] [2].
- Graphene and 2D Materials: Exceptional electrical conductivity, mechanical strength, and large surface area have enabled the development of highly sensitive and flexible sensor platforms [24].
Table 3: Nanomaterial Applications in Enhanced Biosensing
| Nanomaterial | Key Properties | Impact on Bioreceptor | Impact on Transducer |
|---|---|---|---|
| Carbon Nanotubes | High conductivity, large surface area [2] | Increased immobilization density and stability [19] | Enhanced electron transfer kinetics [2] |
| Quantum Dots | Size-tunable fluorescence, photostability [2] | Effective fluorescent tags for antibodies/aptamers [2] | Enable highly sensitive optical detection [19] |
| Metal Nanoparticles | Plasmonic effects, high conductivity [19] | Improved antibody orientation and loading [13] | Signal amplification in electrochemical & optical sensors [19] |
| Graphene | High surface area, excellent conductivity [24] | Superior platform for biomolecule attachment [24] | High sensitivity in field-effect transistors [24] |
Advanced Applications: Self-Powered and Wearable Sensors
The convergence of nanomaterials with novel transducer principles has enabled groundbreaking sensor architectures, particularly self-powered sensors that harvest energy from their environment (e.g., light, mechanical motion, or thermal gradients) [24]. These systems integrate energy harvesters like piezoelectric nanogenerators (PENG) or triboelectric nanogenerators (TENG) with sensing components, often based on 2D nanomaterials like transition metal dichalcogenides (TMDs) [24]. This innovation is crucial for wearable, implantable, and remote monitoring applications where battery replacement is impractical.
The Scientist's Toolkit: Essential Research Reagents and Materials
The development and implementation of modern biosensors rely on a suite of specialized reagents and materials. The following table details key components essential for research in this field.
Table 4: Essential Research Reagents and Materials for Biosensor Development
| Reagent/Material | Function | Example Applications |
|---|---|---|
| Glucose Oxidase | Model enzyme bioreceptor | Fundamental research on enzyme-based biosensors [2] [1] |
| Monoclonal Antibodies | High-specificity bioreceptor | Immunosensors for pathogens and biomarkers [9] [13] |
| Aptamers | Synthetic nucleic acid-based bioreceptor | Detection of ions, small molecules, and proteins [9] |
| Gold Nanoparticles | Signal amplification, immobilization platform | Colorimetric assays, electrochemical signal enhancement [19] [13] |
| Carbon Nanotubes | Electrode modification, electron transfer enhancement | High-sensitivity electrochemical transducer platforms [19] [2] |
| Quantum Dots (e.g., CdSe/ZnS) | Fluorescent labels for optical transduction | Multiplexed detection and bioimaging [2] |
| Transition Metal Dichalcogenides (e.g., MoS₂) | 2D semiconductor for transducers | Self-powered photodetectors, flexible electronics [24] |
| N-Hydroxysuccinimide (NHS)/Ethyldimethylaminopropyl Carbodiimide (EDC) | Crosslinkers for biomolecule immobilization | Covalent attachment of bioreceptors to transducer surfaces [13] |
Experimental Protocols: Key Methodological Approaches
Fabrication of a Nanomaterial-Modified Electrochemical Biosensor
A common protocol for constructing a modern biosensor involves modifying a transducer surface with nanomaterials and bioreceptors [13]:
- Electrode Pretreatment: Clean the working electrode (e.g., glassy carbon) with alumina slurry and sonicate in water and ethanol.
- Nanomaterial Modification: Deposit a suspension of nanomaterials (e.g., CNTs, graphene oxide) onto the electrode surface and allow to dry, forming a thin film.
- Bioreceptor Immobilization:
- Physical Adsorption: Incubate the modified electrode with a solution of the bioreceptor (antibody, aptamer, enzyme).
- Covalent Binding: Activate the nanomaterial surface with a crosslinker like EDC/NHS, then incubate with the bioreceptor.
- Blocking: Treat the surface with Bovine Serum Albumin (BSA) or ethanolamine to block non-specific binding sites.
- Characterization: Use cyclic voltammetry (CV) and electrochemical impedance spectroscopy (EIS) to verify each modification step.
- Detection: Measure the sensor's response (current, impedance) upon exposure to the target analyte using techniques like differential pulse voltammetry (DPV) or EIS.
Detection of Pathogenic Bacteria Using a Bioreceptor-Modified Sensor
The following diagram outlines a typical workflow for detecting pathogenic bacteria using an electrochemical biosensor with a modified bioreceptor, a key application in modern healthcare and food safety [13].
The journey from the Clark oxygen electrode to modern nanomaterial-based sensors demonstrates a remarkable trajectory of innovation in biosensing technology. This evolution has been fundamentally guided by advances in our understanding and engineering of the two core components: the bioreceptor, which has expanded from a single enzyme to a diverse toolkit of antibodies, nucleic acids, and aptamers; and the transducer, which has progressed from a simple amperometric electrode to include sophisticated optical, thermal, and piezoelectric systems enhanced by nanomaterials. The integration of nanotechnology has been particularly transformative, enabling unprecedented sensitivity and miniaturization, and paving the way for future advancements such as self-powered and wearable sensors. As this field continues to evolve, the fundamental principle established by Clark—the powerful synergy between biological recognition and physical transduction—remains the enduring foundation upon which next-generation biosensing platforms will be built.
A biosensor is an integrated analytical device that converts a biological response into a quantifiable electrical signal [2] [9]. This sophisticated process centers on a pivotal molecular interaction known as the bio-recognition event—the specific binding or interaction between a target molecule (analyte) and a biological recognition element (bioreceptor) [3] [23]. The exquisite specificity of this event enables biosensors to detect a singular target of interest within complex sample matrices such as blood, urine, or environmental samples [4].
The bio-recognition event serves as the critical trigger for the entire sensing process. It initiates a physicochemical change—such as electron transfer, heat generation, mass change, or light emission—that is subsequently transformed into a measurable output by a transducer [2] [23]. Within the broader context of biosensing research, understanding this core interaction is fundamental to designing effective biosensors. The bioreceptor represents the biological or biomimetic component that provides specificity, while the transducer constitutes the physicochemical component that provides the measurable signal [9] [3] [23]. This whitepaper examines the mechanisms of analyte-bioreceptor interactions, the subsequent signal transduction pathways, and the experimental methodologies driving innovation in this field.
Core Principles of the Bio-Recognition Event
The Biosensor Architecture
A typical biosensor comprises three fundamental components arranged in a specific workflow to detect and report the bio-recognition event [2] [3]:
- Bioreceptor: A biological or biomimetic element (e.g., enzyme, antibody, nucleic acid, cell) that selectively interacts with the target analyte.
- Transducer: A physicochemical device that converts the biological interaction into a measurable signal (e.g., electrical, optical, thermal).
- Signal Processor: An electronic system that amplifies, processes, and displays the results in a user-friendly format [2].
The sequential operation of these components is illustrated below.
Key Characteristics of an Effective Bio-Recognition Event
The performance of a biosensor is governed by several key characteristics rooted in the efficiency of the bio-recognition event [4] [23]:
- Sensitivity: The ability to generate a measurable signal in response to small fluctuations in analyte concentration. This is often defined by the limit of detection (LOD)—the lowest analyte concentration that can be reliably detected [23].
- Selectivity: The ability of the bioreceptor to bind exclusively to the target analyte while ignoring other similar substances in the sample matrix, thereby minimizing false positives [23].
- Response Time: The time required for the biosensor to generate a stable signal following exposure to the analyte, which is governed by the kinetics of the biorecognition event [23].
- Stability: The ability of the biosensor to resist performance degradation over time and under varying environmental conditions (e.g., temperature, pH), which is heavily influenced by the stability of the bioreceptor [23].
Bioreceptor Types and Their Recognition Mechanisms
Bioreceptors are categorized based on their biological origin and mechanism of interaction with the analyte. The choice of bioreceptor determines the fundamental recognition strategy of the biosensing platform.
Table 1: Major Bioreceptor Types and Their Recognition Mechanisms
| Bioreceptor Type | Recognition Mechanism | Common Analytes | Key Advantages | Inherent Limitations |
|---|---|---|---|---|
| Enzymes [9] [3] | Catalytic conversion of substrate to product; or analyte-dependent inhibition/activation. | Glucose, Lactose, Urea, Toxins [2] [3] | High catalytic activity; signal amplification; reusability [9]. | Stability limited by enzyme denaturation; consumption of analyte in reaction [9]. |
| Antibodies/Antigens [9] [25] | High-affinity, lock-and-key binding between antibody and specific antigen. | Pathogens, Proteins, Hormones, Toxins [3] [25] | Exceptional specificity and high binding affinity [9] [25]. | Binding can be irreversible; sensitivity to assay conditions (pH, temperature) [9]. |
| Nucleic Acids (DNA/RNA) [9] [3] | Complementary base-pairing (hybridization) for genosensors; specific 3D folding for aptamers. | Complementary DNA/RNA sequences, Proteins, Small molecules, Cells [9] [26] | High stability; aptamers can be selected for diverse targets via SELEX [9] [26]. | Stringent hybridization conditions required; complex sample preparation for some targets. |
| Whole Cells & Microorganisms [3] [27] | Response to stimuli via intrinsic metabolic pathways, gene expression, or stress responses. | Toxins, Heavy metals, Bioavailable compounds [3] [27] | Provides functional/toxicity information; can detect bioavailable fractions [27]. | Longer response time; less specific than molecular receptors; maintenance required [3]. |
| Aptamers (Artificial) [9] [26] | Induced-fit or conformational selection upon binding to a specific target molecule. | Proteins, Ions, Whole cells, Small molecules [9] [26] | Thermal stability; chemical synthesis; can be engineered for structure-switching [9] [26]. | In-vitro selection (SELEX) can be time-consuming; potential for nonspecific binding. |
Transduction Mechanisms: Converting Biological Events into Measurable Signals
Following the bio-recognition event, the transducer converts the resulting physicochemical change into an analytically useful signal. The choice of transducer depends on the nature of the change produced during biorecognition.
Electrochemical Transduction
Electrochemical transducers measure electrical changes resulting from the bio-recognition event and are among the most common transducers due to their high sensitivity, miniaturization potential, and cost-effectiveness [3] [4]. They are further classified based on the specific electrical parameter measured:
- Amperometric: Measures current generated from the oxidation or reduction of an electroactive species involved in the recognition event (e.g., H₂O₂ from an enzyme reaction) at a constant applied potential [3] [28]. The Clark oxygen electrode for glucose is a classic example [2] [28].
- Potentiometric: Measures the change in potential (voltage) at an electrode surface between a reference electrode and the working electrode, typically resulting from ion accumulation or depletion [3]. The pH meter is a common potentiometric device.
- Impedimetric: Measures the change in electrical impedance (resistance and capacitance) of the electrode-solution interface, often due to the binding of insulating molecules (e.g., proteins, cells) that hinder electron transfer [25].
Optical Transduction
Optical transducers detect changes in the properties of light [3] [4]:
- Surface Plasmon Resonance (SPR): Detects changes in the refractive index on a thin gold film surface, which occurs when biomolecules bind, altering the resonance angle of reflected light. This allows for real-time, label-free monitoring of binding kinetics [3].
- Fluorescence: Measures the intensity, wavelength, or polarization of emitted light from fluorophores. Techniques like Fluorescence Resonance Energy Transfer (FRET) are used where the binding event brings a fluorophore and quencher closer together or farther apart, changing the fluorescence signal [3].
- Chemiluminescence/Bioluminescence: Detects light emitted as a result of a chemical or biological reaction, often using engineered bacteria (e.g., luciferase) as bioreporters [27].
Other Transduction Modalities
- Piezoelectric Transduction: Measures the change in the resonant oscillation frequency of a crystal (e.g., quartz) when mass is added to its surface from the binding of the analyte. This is the principle behind the Quartz Crystal Microbalance (QCM) [4].
- Thermal Transduction: Measures the heat absorbed or released during the bio-recognition event using thermistors (enzyme thermistors). The heat output is proportional to the analyte concentration [2] [4].
The relationship between bioreceptors and their corresponding transducers is summarized in the following diagram.
Experimental Protocols and Methodologies
Immobilization of Bioreceptors
A critical step in biosensor fabrication is the stable and functional immobilization of the bioreceptor onto the transducer surface. The chosen method profoundly impacts the biosensor's sensitivity, stability, and reproducibility [4].
Table 2: Common Bioreceptor Immobilization Techniques
| Immobilization Method | Principle | Protocol Overview | Impact on Performance |
|---|---|---|---|
| Physical Adsorption [4] | Weak physical forces (van der Waals, hydrophobic, ionic). | Incubate transducer surface with bioreceptor solution; wash to remove unbound material. | Simple and fast. May result in random orientation and leakage of bioreceptor, reducing stability and activity. |
| Covalent Binding [4] | Formation of strong covalent bonds between functional groups on surface and bioreceptor. | Activate transducer surface (e.g., with EDC/NHS for -COOH groups); incubate with bioreceptor; wash and block remaining active sites. | Stable, irreversible attachment. Allows for controlled orientation. Risk of denaturing bioreceptor or blocking active site during chemistry. |
| Entrapment/Encapsulation [4] [28] | Bioreceptor physically confined within a porous polymer matrix or membrane. | Mix bioreceptor with polymer precursor (e.g., sol-gel, hydrogel); polymerize on transducer surface. | Protects bioreceptor. Good for microenvironments. Can limit mass transfer of analyte, leading to longer response times. |
| Cross-linking [4] | Bioreceptors linked together via bifunctional reagents (e.g., glutaraldehyde). | Mix bioreceptor with cross-linker; deposit mixture on surface; allow network to form. | High stability; high loading density. Can reduce activity due to rigidification or non-specific cross-linking. |
In Vitro Selection of DNA Aptamers (SELEX)
The Systematic Evolution of Ligands by EXponential enrichment (SELEX) protocol is a powerful method for generating synthetic DNA or RNA aptamers as bioreceptors for virtually any target [26]. The general workflow is as follows:
- Library Preparation: Start with a synthetic library of ~10^14–10^15 random single-stranded DNA (ssDNA) sequences.
- Incubation: The library is incubated with the immobilized target (e.g., a protein immobilized on magnetic beads).
- Partitioning: Unbound sequences are washed away, and target-bound sequences are eluted.
- Amplification: The eluted sequences are amplified using Polymerase Chain Reaction (PCR). For RNA aptamers, Reverse Transcription-PCR (RT-PCR) is used.
- Purification: The amplified DNA is purified to yield an enriched pool of ssDNA for the next selection round.
- Iteration: Steps 2–5 are repeated for typically 8–15 rounds to progressively enrich high-affinity binders.
- Cloning and Sequencing: The final pool is cloned, sequenced, and individual aptamer candidates are characterized for binding affinity and specificity [26].
Characterization of the Bio-Recognition Event
Validating and characterizing the bio-recognition event is crucial for biosensor development. Key experimental assessments include:
- Determining Binding Affinity (Kd): Performed by measuring the sensor's response (e.g., SPR angle shift, electrochemical current) at varying analyte concentrations. The data is fit to a binding isotherm (e.g., Langmuir) to calculate the equilibrium dissociation constant (Kd), where a lower Kd indicates higher affinity [4] [23].
- Assessing Specificity/Selectivity: The biosensor is challenged with potential interfering substances structurally or functionally similar to the target analyte. The signal response from these interferents is compared to the target signal to calculate the degree of selectivity [25].
- Evaluating Kinetics: Real-time monitoring platforms like SPR can be used to determine the association (kon) and dissociation (koff) rate constants of the bioreceptor-analyte interaction, which define the sensor's response time and reusability [3].
The Scientist's Toolkit: Essential Research Reagents and Materials
The development and implementation of biosensors rely on a suite of specialized reagents and materials. The following table details key components for building and experimenting with biosensing platforms.
Table 3: Essential Research Reagents and Materials for Biosensor Development
| Reagent/Material | Function/Purpose | Common Examples & Notes |
|---|---|---|
| Glucose Oxidase (GOx) [2] [28] | Model enzyme bioreceptor for catalytic detection of glucose. | Used in first-generation biosensors; consumes O₂ and produces H₂O₂. Source: Aspergillus niger. |
| Nucleic Acid Aptamers [9] [26] | Synthetic single-stranded DNA/RNA bioreceptors selected via SELEX. | Can target proteins, small molecules, cells. Require chemical synthesis and stability optimization (e.g., chemical modifications). |
| Monoclonal/Polyclonal Antibodies [9] [25] | High-specificity protein bioreceptors for immunosensors. | Require careful immobilization to ensure proper antigen-binding orientation. Critical for ELISA and lateral flow assays. |
| EDC/NHS Chemistry [4] | Crosslinkers for covalent immobilization of bioreceptors (e.g., proteins) on surfaces. | EDC activates carboxyl groups; NHS stabilizes the intermediate. Standard for carbodiimide chemistry. |
| Gold Surfaces & Chips [3] | Standard substrate for Surface Plasmon Resonance (SPR) and electrode fabrication. | Provides a stable, biocompatible, and easily functionalizable surface for bioreceptor attachment. |
| Screen-Printed Electrodes (SPEs) [3] [25] | Disposable, low-cost electrochemical transducer platforms. | Enable mass production and point-of-care testing. Typically feature carbon, gold, or platinum working electrodes. |
| Magnetic Beads [26] | Solid support for SELEX protocols and for separating bound/unbound analytes in assays. | Often coated with streptavidin for binding biotinylated targets or nucleic acids. |
| Fluorescent Reporters (e.g., GFP) [27] | Optical output module for cell-based and optical biosensors. | Engineered into bacterial or mammalian cells to report on specific stimuli via gene expression. |
| Redox Mediators (e.g., Ferrocene) [28] | Small molecules that shuttle electrons in second-generation electrochemical biosensors. | Replace oxygen as an electron acceptor, reducing dependence on O₂ concentration and enabling operation at lower potentials. |
| Carbon Nanomaterials [2] [28] | Nanostructures used to enhance electrode performance. | Carbon Nanotubes (CNTs) and graphene increase surface area and electrical conductivity, boosting sensitivity. |
The bio-recognition event is the cornerstone of biosensing technology, initiating a cascade that transforms a specific molecular interaction into actionable data. The continuous refinement of bioreceptors—from enzymes and antibodies to engineered aptamers and whole cells—coupled with advances in transduction methodologies, is pushing the boundaries of sensitivity, specificity, and practicality. Current research is focused on overcoming challenges such as biofouling, sensor stability in complex matrices, and the need for multiplexed detection [29] [4] [25].
The future of the field lies in the intelligent integration of materials science, nanotechnology, and synthetic biology. The use of computational tools and machine learning to design novel aptamers and predict binding interactions is accelerating bioreceptor discovery [26]. Furthermore, the convergence of biosensors with microfluidics for "lab-on-a-chip" devices and with wireless electronics for wearable sensors is translating this fundamental understanding of the bio-recognition event from the research laboratory into real-world applications for personalized medicine, environmental monitoring, and global health [29] [4].
From Principle to Practice: Methodologies and Cutting-Edge Applications in Drug Development
A biosensor is an analytical device that converts a biological response into an quantifiable electrical or optical signal [1]. Its core functionality hinges on two integral components: the bioreceptor and the transducer. The bioreceptor is a biological or biomimetic element (e.g., enzyme, antibody, nucleic acid, lectin, or whole cell) that serves as the recognition layer, providing high selectivity by specifically interacting with the target analyte [9] [30]. The transducer, which can be electrochemical, optical, piezoelectric, or thermal, then converts this specific biochemical interaction into a measurable signal proportional to the analyte concentration [31] [32].
The immobilization of the bioreceptor onto the transducer surface is a critical step in biosensor fabrication, directly influencing performance metrics such as sensitivity, stability, selectivity, and reproducibility [33] [34]. Effective immobilization ensures optimal orientation and stability of the bioreceptor, preserves its biological activity, and facilitates efficient signal transduction. Among the various strategies available, covalent bonding, physical adsorption, and the use of self-assembled monolayers (SAMs) are foundational techniques that enable precise control over the biosensor's interface [33] [34].
Core Principles of Immobilization Techniques
Covalent Bonding
Covalent bonding involves the formation of stable, irreversible covalent bonds between functional groups on the bioreceptor (e.g., amino, carboxyl, thiol) and reactive groups on the activated transducer surface [34] [33]. This method often requires cross-linkers like glutaraldehyde or carbodiimides (e.g., EDC) to facilitate the bond formation. A prime example is the immobilization of a non-modified single-stranded DNA (ssDNA) capture probe onto a cysteamine-modified gold surface through a phosphoramidate bond between the 5'-terminal phosphate group of the DNA and the primary amine group of cysteamine [35].
Physical Adsorption
Physical adsorption is a straightforward method reliant on non-covalent interactions—such as electrostatic forces, hydrophobic interactions, van der Waals forces, or hydrogen bonding—between the bioreceptor and the transducer surface [34] [32]. For instance, a transducer surface functionalized with a SAM containing amine groups ( carrying a positive charge at neutral pH can immobilize negatively charged biomolecules via electrostatic attraction [33]. While this technique is simple and requires no chemical modifiers, the binding is generally weaker and can lead to random orientation and desorption of the bioreceptor over time [35].
Self-Assembled Monolayers (SAMs)
Self-assembled monolayers (SAMs) are highly ordered, molecularly organized layers that form spontaneously on surfaces when molecules with a specific head group (e.g., thiols for gold, silanes for oxides) are adsorbed from a solution or vapor phase [36]. The process typically involves a head group with a strong affinity for the substrate, a backbone chain, and a functional end group that can be tailored to present specific chemical moieties (e.g., -OH, -COOH, -NH2, biotin) for subsequent bioreceptor immobilization [36] [33]. Alkanethiolates on gold are a classic SAM system, where the sulfur-gold bond is semi-covalent with an energy of approximately 100-45 kcal/mol, forming a stable monolayer [36]. SAMs terminated with ethylene glycol (e.g., EG6OH) are particularly valuable for preventing non-specific adsorption of proteins, thereby enhancing the biosensor's specificity [33].
Comparative Analysis of Immobilization Techniques
Table 1: Comparative characteristics of immobilization techniques.
| Characteristic | Covalent Bonding | Physical Adsorption | Self-Assembled Monolayers (SAMs) |
|---|---|---|---|
| Binding Force | Strong covalent bonds [35] | Weak non-covalent interactions (electrostatic, hydrophobic, etc.) [34] [32] | Strong chemisorption of head group (e.g., Au-S bond) & van der Waals in chain [36] |
| Stability | High; irreversible binding reduces desorption [35] | Low to moderate; susceptible to desorption and leaching [35] | High; stable due to strong head group attachment & dense packing [36] [33] |
| Bioreceptor Orientation | Controllable; depends on the specific covalent chemistry used [35] | Random; can block active sites [35] | Highly controllable; end-group functionalization allows specific, oriented attachment [33] [36] |
| Procedure Simplicity | Complex; requires surface activation and cross-linkers [34] | Simple; one-step immersion without complex chemistry [34] | Moderate; requires preparation of SAM, but process is spontaneous [36] |
| Impact on Bioactivity | Risk of denaturation or reduced activity if active site is involved [34] | Risk of denaturation due to strong surface interactions [34] | Generally minimal; well-defined layer reduces unwanted interactions [33] |
| Common Applications | DNA biosensors, enzyme electrodes [35] [34] | Simple, disposable sensors, initial proof-of-concept studies [32] | High-performance optical & electrochemical biosensors, surface patterning [33] [30] |
Table 2: Key functional groups and their roles in surface functionalization.
| Functional Group | Surface Property | Interaction/Reaction with Biomolecules |
|---|---|---|
| R-NH₃⁺ | Positive Charge | Electrostatic interaction with negatively charged biomolecules; EDC-mediated bonding with -COOH [33] |
| R-COO⁻ | Negative Charge | Electrostatic interaction with positively charged biomolecules; EDC-mediated bonding with -NH₂ [33] |
| Aldehyde | Electrophilic | Chemical bonding with amine groups (-NH₂) of biomolecules [33] |
| Maleimide | Thiol-reactive | Chemical bonding with sulfhydryl groups (-SH) of biomolecules [33] |
| Biotin | Affinity Ligand | Specific, high-affinity interaction with avidin or streptavidin [33] |
| Ethylene Glycol | Anti-fouling | Prevents non-specific adsorption of proteins and cells [33] |
Experimental Protocols for Immobilization
Protocol: Covalent Immobilization of DNA on a Cysteamine-Modified Gold Surface
This protocol details the covalent attachment of a non-modified ssDNA probe via its 5'-phosphate group to an amine-functionalized surface, creating a phosphoramidate bond [35].
Materials and Reagents:
- Pencil Graphite Electrode (PGE) or Gold Electrode: Serves as the electrochemical transducer platform.
- Carbon Black (CB) and Gold Nanoparticles (AuNPs): Used to modify the PGE to enhance surface area and conductivity [35].
- Cysteamine (CysAm): A short-chain molecule with a thiol group and a primary amine, used to form the functional interlayer.
- 1-Ethyl-3-(3-dimethylaminopropyl)carbodiimide (EDC): A carbodiimide cross-linker used to activate the phosphate group on DNA.
- Methylene Blue (MB): An electrochemical redox indicator used to monitor the hybridization event.
- ssDNA Capture Probe: The non-modified DNA sequence of interest with a 5'-phosphate group.
Procedure:
- Electrode Modification: Prepare the sensing platform. For a PGE, this involves coating with a dispersion of carbon black and gold nanoparticles (AuNPs/CB–PGE) [35].
- Cysteamine Self-Assembly: Immerse the AuNP-modified electrode in an aqueous solution of cysteamine (e.g., 10 mM) for a set period (e.g., 1 hour) to form a self-assembled monolayer terminating in primary amine groups (-NH₂) [35].
- ssDNA Immobilization: Incubate the cysteamine-functionalized electrode with a solution of the non-modified ssDNA capture probe in the presence of EDC. EDC activates the 5'-phosphate group of the DNA, enabling it to form a covalent phosphoramidate bond with the primary amine of cysteamine [35].
- Hybridization and Detection: Expose the DNA-functionalized biosensor to a solution containing the target complementary sequence (e.g., microRNA-21). Monitor the hybridization event electrochemically using differential pulse voltammetry (DPV) with Methylene Blue as the indicator. A decrease in the MB reduction current signals successful hybridization, as the DNA duplex hinders MB access to guanine bases [35].
Diagram 1: Covalent DNA sensor workflow.
Protocol: Formation of a Thiol-Based SAM on Gold for Bioreceptor Immobilization
This protocol describes creating an ordered SAM on a gold surface, which can be further functionalized for covalent attachment or used to resist non-specific binding [36] [33].
Materials and Reagents:
- Gold Substrate: A thin film of gold on a silicon or glass slide.
- Alkanethiol Solution: A dilute (e.g., 0.1 - 1 mM) solution of the desired thiol (e.g., 16-mercaptohexadecanoic acid for -COOH termination, or EG6OH for anti-fouling) in ethanol.
- Absolute Ethanol: High-purity solvent for thiol solution.
Procedure:
- Substrate Cleaning: Clean the gold substrate thoroughly using an oxygen plasma cleaner or by piranha solution (a mixture of concentrated sulfuric acid and hydrogen peroxide; Note: Piranha solution is extremely corrosive and must be handled with extreme care), followed by rinsing with copious amounts of ethanol and drying under a stream of nitrogen [36].
- SAM Formation: Immerse the clean, dry gold substrate into the alkanethiol solution. Allow the self-assembly process to proceed for a period ranging from 12 to 72 hours at room temperature to ensure the formation of a well-ordered, dense monolayer [36].
- Rinsing and Drying: After incubation, remove the substrate from the thiol solution and rinse it thoroughly with pure ethanol to remove any physisorbed molecules. Dry the substrate gently under a stream of nitrogen or inert gas [36].
- Characterization (Optional): The resulting SAM can be characterized using techniques such as ellipsometry or X-ray photoelectron spectroscopy (XPS) to measure thickness and elemental composition, contact angle goniometry to assess surface energy, or electrochemical methods to confirm monolayer integrity [36].
Diagram 2: SAM formation process.
The Scientist's Toolkit: Essential Research Reagents and Materials
Table 3: Key research reagents and materials for immobilization protocols.
| Item | Function/Application | Example Use Case |
|---|---|---|
| Cysteamine | Short-chain molecule with thiol and amine groups; creates an amine-functionalized surface on gold. | Used as a linker for covalent immobilization of 5'-phosphate-terminated DNA [35]. |
| EDC (1-Ethyl-3-(3-dimethylaminopropyl)carbodiimide) | Cross-linking agent; activates carboxylate or phosphate groups for reaction with primary amines. | Facilitates the formation of a phosphoramidate bond between DNA and a cysteamine-modified surface [35]. |
| Alkanethiols (e.g., MHDA, EG6OH) | Molecules that form Self-Assembled Monolayers (SAMs) on gold surfaces. | MHDA provides a carboxyl-terminated surface for further conjugation; EG6OH creates an anti-fouling background [33] [36]. |
| Gold Nanoparticles (AuNPs) | Nanomaterial used to modify electrode surfaces; enhances conductivity and surface area for bioreceptor immobilization. | Used in composite with carbon black on pencil graphite electrodes to improve DNA sensor performance [35]. |
| Carbon Black (CB) | A low-cost carbon nanomaterial with good conductivity; used for electrode modification. | Combined with AuNPs to create a high-performance, low-cost electrochemical sensing platform [35]. |
| Methylene Blue | An electrochemical redox-active dye; acts as a hybridization indicator. | Binds preferentially to single-stranded DNA; signal decrease indicates target hybridization in DNA biosensors [35]. |
Impact on Biosensor Performance and Concluding Perspectives
The choice of immobilization technique profoundly affects the analytical performance of a biosensor. Covalent bonding provides the robust stability required for reusable sensors and complex matrices but requires careful optimization to maintain bioreceptor activity [35]. Physical adsorption, while simple, often results in lower stability and random orientation, which can compromise the limit of detection and reproducibility [35] [34]. SAMs represent a powerful intermediate strategy, offering a high degree of control over surface properties, bioreceptor orientation, and density, which often leads to enhanced sensitivity and specificity, particularly in optical and electrochemical transducers that are sensitive to the proximity and order of the recognition layer [33] [30].
The evolution of biosensing research increasingly relies on the rational design of the bioreceptor-transducer interface. The integration of these immobilization techniques with nanomaterials and advanced lithography is paving the way for a new generation of biosensors with multiplexing capabilities, ultra-high sensitivity, and applicability in point-of-care diagnostics [33] [30] [1]. A deep understanding of covalent bonding, physical adsorption, and self-assembled monolayers is, therefore, indispensable for researchers and scientists aiming to develop innovative and reliable biosensing platforms for drug development, clinical diagnostics, and environmental monitoring.
Electrochemical biosensors are integrated analytical devices that combine a biological recognition element with an electrochemical transducer, converting a biological response into a quantifiable electrical signal [1] [37]. The core of any biosensor lies in its two fundamental components: the bioreceptor and the transducer. The bioreceptor is a biological or biomimetic element that specifically interacts with the target analyte, while the transducer translates this recognition event into a measurable electrical output [1]. These devices have gained prominence in biomedical diagnosis, environmental monitoring, food safety, and drug discovery due to their remarkable sensitivity, selectivity, portability, and cost-effectiveness [1] [38]. This technical guide provides an in-depth examination of three principal electrochemical biosensing techniques—amperometric, potentiometric, and impedimetric—detailing their working principles, experimental protocols, and applications within modern research and development.
Fundamental Components of a Biosensor
The Bioreceptor: The Recognition Element
The bioreceptor is a biologically derived or inspired molecule that confers high specificity to the biosensor by selectively binding to the target analyte. The choice of bioreceptor is paramount, as it directly determines the sensor's selectivity and robustness [1] [37].
- Enzymes: Catalytic proteins that convert a specific substrate into a product, often generating an electroactive species in the process. Glucose oxidase, used in glucose biosensors, is a classic example [1] [39].
- Antibodies: Immunoglobulin molecules that bind with high affinity to a specific antigen, forming the basis of immunosensors [1] [40].
- Nucleic Acids (DNA/RNA): Single-stranded DNA or RNA probes that hybridize with a complementary sequence, enabling genetic detection [1] [40].
- Aptamers: Short, single-stranded oligonucleotides or peptides selected for their high binding affinity to specific targets, serving as synthetic alternatives to antibodies [41] [42].
- Whole Cells: Microorganisms or tissue sections that respond to analytes through metabolic activity, often measured via oxygen consumption or acid production [43].
- Molecularly Imprinted Polymers (MIPs): Synthetic polymers containing tailor-made recognition sites that mimic natural bioreceptors, known for their high stability [42].
The Transducer: The Signal Converter
The transducer is the component that converts the biological recognition event into a measurable electrical signal. In electrochemical biosensors, this occurs at the electrode-solution interface [1].
- Working Electrode: The site where the biorecognition event occurs and the electrochemical signal is generated. Its surface is often modified with the bioreceptor and nanomaterials to enhance sensitivity [39] [37].
- Reference Electrode: Provides a stable and known reference potential against which the working electrode's potential is measured.
- Counter Electrode (Auxiliary Electrode): Completes the electrical circuit, allowing current to flow.
The subsequent sections explore how different electrochemical techniques leverage this bioreceptor-transducer architecture.
Amperometric Biosensors
Amperometric biosensors operate by applying a constant potential to the working electrode and measuring the resulting current generated from the oxidation or reduction of an electroactive species involved in the biorecognition process [39]. This current is typically proportional to the concentration of the analyte [39] [37].
Signaling Pathway and Mechanism
The following diagram illustrates the general signaling pathway for amperometric detection, exemplified by a glucose biosensor.
Experimental Protocol: Glucose Detection using Glucose Oxidase
Principle: Glucose oxidase (GOx) catalyzes the oxidation of glucose to gluconolactone and hydrogen peroxide (H₂O₂). The subsequent oxidation of H₂O₂ at the electrode surface generates a measurable current [39].
Materials:
- Working Electrode: Platinum (Pt) or Glassy Carbon Electrode (GCE), often modified with nanomaterials (e.g., carbon nanotubes, graphene) [39] [37].
- Reference Electrode: Ag/AgCl.
- Counter Electrode: Platinum wire.
- Bioreceptor: Glucose oxidase enzyme.
- Immobilization Matrix: A polymer (e.g., Nafion, polypyrrole) or hydrogel to entrap and stabilize the enzyme on the electrode [39] [38].
- Buffer: Phosphate Buffered Saline (PBS), pH 7.4.
Procedure:
- Electrode Modification: Clean the working electrode surface. Immobilize GOx onto the electrode by:
- Physical Entrapment: Mixing GOx with a polymer solution (e.g., Nafion) and drop-casting onto the electrode.
- Cross-linking: Using a cross-linker like glutaraldehyde in the presence of a protein (e.g., Bovine Serum Albumin).
- Calibration: Place the modified electrode in an electrochemical cell containing stirring PBS. Apply a constant potential sufficient to oxidize H₂O₂ (e.g., +0.7 V vs. Ag/AgCl).
- Measurement: Inject known concentrations of glucose standard solutions into the cell. The enzyme catalyzes the reaction, producing H₂O₂, which is oxidized at the electrode, generating a current.
- Data Analysis: Record the steady-state current after each addition. Plot the current response versus glucose concentration to obtain a calibration curve.
Applications: Amperometric biosensors are extensively used for continuous monitoring of metabolites like glucose, lactate, and cholesterol, as well as for detecting pathogens and environmental pollutants [39] [38].
Potentiometric Biosensors
Potentiometric biosensors measure the potential difference between the working and reference electrodes under conditions of zero or negligible current flow [41] [44] [42]. This potential is related to the analyte concentration by the Nernst equation [44].
Signaling Pathway and Mechanism
The mechanism for ion-selective electrodes (ISEs), a common type of potentiometric sensor, is shown below.
Experimental Protocol: Urea Detection using a Urease-Based Ion-Selective Electrode
Principle: The enzyme urease is immobilized on an ammonium ion (NH₄⁺)-selective membrane. Urease catalyzes the hydrolysis of urea into ammonium carbonate. The produced NH₄⁺ is then detected by the underlying ion-selective electrode, causing a potential shift [41] [37].
Materials:
- Working Electrode: Ion-Selective Electrode (ISE) with a polymeric membrane selective for NH₄⁺ or H⁺.
- Reference Electrode: Double-junction Ag/AgCl.
- Bioreceptor: Urease enzyme.
- Immobilization Matrix: Polyvinyl chloride (PVC) membrane or a polymer hydrogel.
- Buffer: A weakly buffered solution to allow pH change detection if using a pH electrode.
Procedure:
- Enzyme Immobilization: Immobilize urease on the surface of the NH₄⁺-ISE membrane via physical adsorption or entrapment within a polymer film like PVC.
- Potential Measurement: Immerse the urease-modified ISE and the reference electrode in a gently stirred sample solution. Measure the open-circuit potential (zero current) between them.
- Calibration: Add standard solutions of urea. The enzyme reaction produces NH₄⁺ ions, which alter the potential at the membrane. Allow the potential to stabilize after each addition.
- Data Analysis: Plot the measured potential (E) versus the logarithm of the urea concentration. The plot should be linear according to the Nernstian relationship.
Applications: Potentiometric biosensors are widely used for measuring ions (e.g., K⁺, Na⁺, Ca²⁺), gases (e.g., CO₂, NH₃), and clinically relevant molecules like urea and creatinine [41] [44]. They are also emerging in wearable sensors for monitoring electrolytes in sweat [41] [42].
Impedimetric Biosensors
Impedimetric biosensors utilize Electrochemical Impedance Spectroscopy (EIS) to monitor changes in the impedance (a measure of resistance to current flow, including both magnitude and phase) at the electrode interface resulting from a biorecognition event [40]. This label-free technique is highly sensitive to surface modifications.
Signaling Pathway and Mechanism
Impedimetric biosensors typically track the increase in charge-transfer resistance (Rₑₜ) when a target binds to the surface.
Experimental Protocol: Pathogen Detection using an Impedimetric Immunosensor
Principle: Antibodies specific to a target bacterium (e.g., E. coli) are immobilized on a gold or carbon electrode. Binding of the bacterial cells creates an insulating layer that hinders electron transfer to a redox probe in solution, thereby increasing the interfacial charge-transfer resistance (Rₑₜ) [40].
Materials:
- Working Electrode: Gold disk electrode or Screen-printed Carbon Electrode (SPCE).
- Reference Electrode: Ag/AgCl.
- Counter Electrode: Platinum wire.
- Bioreceptor: Specific antibody.
- Redox Probe: [Fe(CN)₆]³⁻/⁴⁻ in buffer solution.
- Immobilization Reagents: Thiol-based self-assembled monolayer (SAM) for gold electrodes, or EDC/NHS for carboxylated surfaces.
Procedure:
- Electrode Functionalization:
- For gold electrodes: incubate in a solution of a thiol (e.g., 11-mercaptoundecanoic acid) to form a SAM. Activate the carboxyl termini with EDC/NHS chemistry.
- Immobilize the specific antibodies onto the activated surface.
- Blocking: Incubate the electrode with a blocking agent (e.g., BSA) to cover any non-specific binding sites.
- EIS Measurement:
- Baseline: Measure the impedance of the functionalized electrode in a solution containing the [Fe(CN)₆]³⁻/⁴⁻ redox probe. Apply a small amplitude sinusoidal voltage (e.g., 5-10 mV) over a frequency range (e.g., 0.1 Hz to 100 kHz).
- Fit the EIS data to a Randles equivalent circuit to extract the Rₑₜ value.
- Target Incubation: Expose the electrode to samples containing the target pathogen.
- Post-Binding Measurement: Wash the electrode and measure the impedance again in the fresh redox probe solution. An increase in Rₑₜ indicates successful binding of the target.
- Data Analysis: Plot the change in Rₑₜ (ΔRₑₜ) versus the logarithm of the bacterial concentration.
Applications: Impedimetric biosensors are ideal for label-free detection of pathogens, proteins, DNA hybridization, and cellular analysis [40]. Their sensitivity to surface properties also makes them excellent tools for studying biofilm formation and drug-cell interactions.
Comparative Analysis of Electrochemical Biosensing Techniques
The table below summarizes the key characteristics of the three electrochemical biosensing techniques.
Table 1: Comparison of Amperometric, Potentiometric, and Impedimetric Biosensors
| Feature | Amperometric | Potentiometric | Impedimetric |
|---|---|---|---|
| Measured Quantity | Current | Potential (Voltage) | Impedance (Z) and Phase Shift (φ) |
| Detection Limit | Very High (nM–pM) [38] | Moderate–High (μM–nM) [41] [42] | Very High (single cell possible) [40] |
| Linearity Range | Wide (typically 3–4 orders of magnitude) | Wide (3–5 orders of magnitude) [42] | Moderate |
| Label Requirement | Often requires enzyme label or mediator | Label-free | Label-free |
| Key Advantage | High sensitivity, well-established | Simple instrumentation, low power consumption [41] | Label-free, real-time monitoring, rich information on interface [40] |
| Key Disadvantage | Interference from electroactive species, requires constant potential | Sensitivity to background ions, longer response time can be an issue [44] [42] | Complex data interpretation, requires modeling with equivalent circuits [40] |
| Primary Applications | Metabolite monitoring (glucose), pathogen detection [39] [38] | Ion sensing (pH, K⁺), urea detection, wearable sensors [41] [44] | Pathogen detection, protein-protein interactions, cell growth monitoring [40] |
The Scientist's Toolkit: Essential Research Reagents and Materials
Table 2: Key Research Reagent Solutions for Electrochemical Biosensor Development
| Item | Function in Research | Example Use Cases |
|---|---|---|
| Glucose Oxidase (GOx) | Model enzyme for amperometric biosensing; catalyzes glucose oxidation. | Development of glucose sensors; fundamental studies on electron transfer mechanisms [39] [38]. |
| Nafion | Cation-exchange polymer; used for enzyme immobilization and anti-fouling. | Coating on electrodes to repel negatively charged interferents (e.g., ascorbic acid) in amperometric sensors [39] [41]. |
| Gold Electrodes & Thiols | Platform for creating self-assembled monolayers (SAMs) for robust bioreceptor attachment. | Immobilization of antibodies or aptamers for label-free impedimetric or potentiometric immunosensors [40]. |
| Carbon Nanotubes (CNTs) | Nanomaterial for electrode modification; enhances surface area and facilitates electron transfer. | Used to modify glassy carbon or screen-printed electrodes to lower detection limits and amplify signals in amperometric and impedimetric sensors [39] [40] [37]. |
| Redox Mediators (e.g., Ferrocene) | Electron shuttles that transport electrons between the enzyme's active site and the electrode. | Used in "second-generation" amperometric biosensors to replace oxygen as the natural electron acceptor, enabling operation at lower potentials [39] [37]. |
| EDC/NHS Chemistry | Cross-linking reagents for covalent immobilization of biomolecules onto carboxylated surfaces. | Covalent attachment of antibodies or enzymes to electrode surfaces modified with CNTs or graphene for enhanced stability [40]. |
| [Fe(CN)₆]³⁻/⁴⁻ | Redox probe for impedimetric and voltammetric measurements. | Added to the solution in EIS experiments to monitor changes in charge-transfer resistance (Rₑₜ) upon target binding [40]. |
Amperometric, potentiometric, and impedimetric biosensors each offer a unique set of advantages that make them powerful tools for researchers and drug development professionals. The ongoing integration of novel nanomaterials, sophisticated bioreceptors like aptamers and MIPs, and advanced microfluidics is pushing the boundaries of sensitivity, specificity, and miniaturization [41] [40] [37]. Furthermore, the convergence of biosensors with wearable technology and artificial intelligence for data analysis heralds a future of intelligent, connected, and personalized diagnostic systems [37]. A deep understanding of the fundamental principles governing these electrochemical techniques, as outlined in this guide, is essential for driving innovation and translating biosensing technology from the research laboratory into real-world applications that address pressing challenges in healthcare and environmental monitoring.
The pursuit of robust, real-time monitoring in bioprocessing is fundamentally an advancement in biosensing technology. At the heart of any biosensor are two core components: the bioreceptor and the transducer. The bioreceptor is a biological molecular recognition element (e.g., enzyme, antibody, nucleic acid, cell) designed to interact specifically with a target analyte—the substance of interest, such as a host cell protein (HCP) [2] [45]. This specific interaction, known as biorecognition, generates a physical or chemical change. The transducer then converts this change into a measurable electrical or optical signal that is proportional to the analyte's concentration, a process termed signalization [2] [46]. This whitepaper explores how innovations in these core components are revolutionizing the monitoring of critical process impurities.
Table: Core Components of a Biosensor for Bioprocessing Monitoring
| Component | Description | Examples in Bioprocessing |
|---|---|---|
| Analyte | The substance or impurity to be detected and measured. | Host Cell Proteins (HCPs), residual DNA, dsRNA, specific protein biomarkers [47] [2]. |
| Bioreceptor | The biological element that selectively recognizes the analyte. | Antibodies (for HCPs, DNA), enzymes, DNA aptamers, whole cells [2] [45]. |
| Transducer | The device that converts the biorecognition event into a quantifiable signal. | Electrochemical electrodes, optical elements (for SPR, fluorescence), piezoelectric crystals [2] [46]. |
The Critical Need for Monitoring Host Cell Proteins and Contaminants
In biopharmaceutical manufacturing, therapeutic proteins are produced in host cells like Chinese Hamster Ovary (CHO) cells. Throughout this process, the host cells themselves express thousands of their own native proteins, termed Host Cell Proteins (HCPs), which are considered problematic process-related impurities [48]. Despite sophisticated purification, trace amounts can persist in the final drug product.
The presence of HCPs, even at levels as low as 1-100 nanograms per milligram of product (ppm), poses significant risks to patient safety and drug efficacy [49] [48]. These risks include:
- Immunogenicity: HCPs are foreign to the human body and can trigger unwanted immune responses [47] [48].
- Product Degradation: Some HCPs are proteases that can fragment the therapeutic protein, reducing its efficacy and stability [48].
- Adverse Effects: HCPs can form aggregates that act as adjuvants, exacerbating immunogenic responses [48].
Regulatory agencies like the FDA and EMA require HCPs to be monitored and controlled as Critical Quality Attributes (CQAs) [47] [48]. While there is no universal numerical limit, the industry standard is typically to maintain HCP levels below 100 ng/mg of the final product, with each product evaluated on a case-by-case basis [47] [48]. Other critical contaminants include residual host cell DNA, which is often limited to <10 ng per dose, and double-stranded RNA (dsRNA), a potent activator of innate immune responses in mRNA-based therapeutics [47].
Limitations of Traditional Monitoring Methods
The gold standard for HCP detection has long been the Enzyme-Linked Immunosorbent Assay (ELISA) [47] [48]. While ELISA offers high sensitivity and throughput, it is primarily an off-line method. This requires manual sampling from the bioreactor, followed by time-consuming analysis in a separate lab, which can take hours or even days [50]. This delay creates a significant gap between the process and the data, making it impossible to intervene in real-time to correct deviations.
Furthermore, ELISA provides an aggregate value of total HCP content but lacks the ability to identify and quantify individual HCP species, some of which may be particularly immunogenic or problematic [48]. Orthogonal methods like mass spectrometry (MS) offer detailed characterization but are even more complex, expensive, and unsuitable for real-time decision-making [48]. The bioprocessing industry therefore faces a critical need for inline, real-time monitoring solutions that can provide immediate feedback on process health and product quality [50].
Emerging Technologies for Real-Time, Inline Monitoring
The convergence of biotechnology, nanomaterials science, and microelectronics is paving the way for a new generation of biosensors capable of real-time, inline monitoring.
Chip-Based and Microfluidic Biosensors
Semiconductor chip technology enables the creation of compact, multi-functional lab-on-a-chip devices that can be integrated directly into the bioprocess stream [50]. These microfluidic platforms manipulate small fluid volumes in micro-scale channels, offering advantages like laminar flow, small reagent consumption, and the integration of various sensing elements [46]. Research organizations like imec are developing multi-parameter probes that can be deployed inline to wirelessly monitor key parameters such as pH, dissolved oxygen, glucose, lactate, cell density, and proteins continuously for weeks at a time [50].
Advanced Transduction Mechanisms
Label-free biosensing techniques, which detect the analyte in its native state without the need for fluorescent or enzymatic tags, are particularly suited for real-time monitoring [46]. Key transduction methods include:
- Electrochemical Biosensors: These sensors measure electrical changes (current, potential, impedance) resulting from the biorecognition event on an electrode surface. The integration of nanomaterials like graphene, carbon nanotubes, and polyaniline enhances their signal transduction, leading to improved sensitivity and a higher signal-to-noise ratio [45] [2].
- Optical Biosensors: Techniques such as Surface Plasmon Resonance (SPR) and optical interferometry can detect minute changes in the refractive index at a sensor surface when an analyte (like an HCP) binds to an immobilized bioreceptor (like an antibody). This allows for real-time, label-free tracking of binding interactions [46] [45].
- Photonic Immuno-assays: Integrated on-chip, these assays can provide extremely fast, specific detection of protein contaminants with a sample-to-result time of less than 10 minutes, making them ideal for at-line contamination monitoring [50].
The Role of Nanomaterials
Nanomaterials are pivotal in enhancing the performance of next-generation biosensors. Their high surface-to-volume ratio and unique electronic properties significantly improve signal amplification and lower detection limits [17] [2].
- Gold nanoparticles are widely used in optical and electrochemical sensors to enhance signal transmission [45].
- Carbon nanotubes and graphene offer large surface areas and excellent electrical conductivity, ideal for electrochemical transducers [2] [45].
- Quantum dots provide color tunability and are used as highly sensitive fluorescent labels, though label-free approaches often seek to avoid them [2].
Experimental Protocols for Advanced Monitoring
To transition from traditional methods to real-time monitoring, researchers are developing and validating new experimental protocols centered on novel biosensor platforms.
Protocol: Real-Time HCP Profiling Using an Integrated Microfluidic SPR Biosensor
This protocol outlines the use of a label-free Surface Plasmon Resonance (SPR) biosensor integrated with a microfluidic chip for continuous monitoring of HCP levels [46].
1. Biosensor Functionalization:
- Immobilize a broad-spectrum anti-HCP polyclonal antibody onto the gold sensor surface within the microfluidic channel. This is typically achieved using a covalent coupling chemistry like amine-coupling to create a stable bioreceptive layer.
- Block the sensor surface with an inert protein (e.g., BSA) to minimize non-specific binding of other proteins from the process stream.
2. System Calibration:
- Prepare standard solutions with known concentrations of a generic HCP standard (e.g., from null cell culture harvest) in a buffer matching the bioprocess matrix.
- Perfuse standards through the microfluidic channel at a controlled flow rate.
- Record the SPR response (in Resonance Units, RU) for each standard and generate a calibration curve of RU vs. HCP concentration.
3. Inline Sample Analysis:
- Integrate the biosensor probe into a side stream of the bioreactor or a downstream purification unit.
- Continuously perfuse the process fluid past the functionalized sensor surface.
- Monitor the SPR signal in real-time. Any binding of HCPs to the immobilized antibodies will cause a shift in the SPR angle, which is directly recorded.
4. Data and Regeneration:
- The sensorgram (a plot of RU vs. time) provides a continuous readout of HCP levels. A rising signal indicates increasing HCP concentration.
- Regenerate the sensor surface between cycles by injecting a mild acidic or basic solution (e.g., glycine-HCl, pH 2.0) to dissociate the bound HCPs, preparing the sensor for the next measurement cycle.
Protocol: At-line dsRNA Contamination Monitoring using a Microfluidic Immuno-assay
For monitoring specific contaminants like dsRNA in mRNA vaccine production, a rapid at-line photonic immuno-assay can be employed [47] [50].
1. Sample Preparation:
- Automated sampling: Use an at-line sampler to withdraw a small volume (microliters) from the in-vitro transcription (IVT) reaction or purification pool.
- Dilution: Dilute the sample in an appropriate assay buffer to fit the dynamic range of the sensor.
2. Microfluidic Assay Execution:
- Load the sample into a disposable microfluidic chip that has been pre-functionalized with the J2 monoclonal antibody, which is highly specific to dsRNA.
- Flow the sample through the microfluidic channel. dsRNA contaminants will bind to the immobilized J2 antibodies.
- After a brief wash, a secondary antibody may be used for signal enhancement in a sandwich assay format, or a label-free method (e.g., photonic detection of bound mass) is used.
- Measure the signal (e.g., change in light interference or wavelength shift) which is proportional to the amount of bound dsRNA.
3. Data Analysis:
- The result is obtained in less than 10 minutes [50].
- The concentration is calculated based on a pre-loaded calibration curve, allowing for rapid batch quality assessment and decision-making.
The Scientist's Toolkit: Essential Research Reagents and Materials
The development and implementation of these advanced monitoring systems rely on a specific set of reagents and materials.
Table: Key Research Reagent Solutions for Biosensor Development
| Reagent/Material | Function in Biosensing | Specific Application Example |
|---|---|---|
| Polyclonal Anti-HCP Antibodies | Bioreceptor that broadly recognizes a wide range of HCP epitopes from a specific host (e.g., CHO, E. coli). | Used to functionalize SPR sensor chips or electrochemical electrodes for total HCP detection [47] [48]. |
| J2 anti-dsRNA Monoclonal Antibody | Bioreceptor with high specificity and affinity for double-stranded RNA. | Key capture agent in dsRNA-specific ELISA kits and microfluidic immuno-assays for mRNA therapeutic QC [47]. |
| Functionalized Nanomaterials (e.g., Gold NPs, Graphene) | Transducer enhancement; increase surface area, improve electron transfer, and amplify detection signals. | Used to modify electrodes in electrochemical biosensors to achieve lower detection limits and higher sensitivity [45] [17]. |
| Microfluidic Chip Substrates (e.g., Glass, PDMS) | Platform for fluid handling and sensor integration; provides a biocompatible environment with low protein adsorption. | Serves as the mechanical structure for lab-on-a-chip devices, often with integrated optical or electrochemical transducers [46]. |
| Carboxylated or Aminated Sensor Chips | Provide reactive groups for the stable, oriented covalent immobilization of bioreceptors (antibodies, aptamers). | Gold sensor chips with a carboxymethylated dextran layer are standard for SPR biosensor functionalization [46]. |
Visualizing the Future: Biosensor Architecture and Process Integration
The following diagrams, generated using DOT language, illustrate the core architecture of a biosensor and its potential for integration into a bioprocess monitoring framework.
Diagram Title: Core Biosensor Component Signal Flow
Diagram Title: Integrated Real-Time Bioprocess Monitoring System
The revolution in bioprocessing monitoring is underway, driven by advancements that redefine the core elements of biosensing: the bioreceptor and the transducer. The shift from offline, manual assays to real-time, inline biosensing platforms represents a paradigm shift towards more agile, efficient, and controlled biomanufacturing. By leveraging microfluidics, nanomaterials, and label-free transduction methods, these systems provide immediate insight into critical quality attributes like HCPs and contaminants, enabling proactive process control.
The future of this field lies in the increased miniaturization, multiplexing, and integration of artificial intelligence. The development of multi-parameter sensors that can detect several analytes simultaneously on a single chip is a key focus [50]. Furthermore, the vast datasets generated by continuous sensors will be leveraged by AI and machine learning for predictive process modeling, enabling not just monitoring but anticipatory control and fully automated closed-loop bioprocessing [50]. This technological evolution will ultimately intensify biomanufacturing processes, reduce costs, and ensure the consistent production of safer, more effective biologics for patients.
Wearable and implantable biosensors represent a transformative technological paradigm in healthcare, enabling the continuous, non-invasive monitoring of physiological status. This whitepaper details the core principles of these biosensors, focusing on their application for analyzing biomarkers in sweat and interstitial fluid (ISF). We examine the fundamental components of biosensing systems—the bioreceptor and transducer—within the context of molecular monitoring. The technical performance of emerging devices, detailed experimental protocols for their operation, and the essential reagent toolkit for research and development are provided to inform researchers, scientists, and drug development professionals engaged in this rapidly advancing field.
Biosensors are analytical devices that integrate a biological recognition element with a physicochemical transducer to produce an electronic signal proportional to the concentration of a specific analyte [9] [1]. The groundbreaking work of Leland C. Clark Jr. in 1962, with his development of an enzyme electrode for glucose, laid the foundation for the field [51] [1]. Today, biosensors have evolved into sophisticated, miniaturized systems capable of continuous molecular monitoring, moving healthcare from reactive to proactive and personalized models.
The drive toward non-invasive monitoring has focused significant research on easily accessible biofluids like sweat and interstitial fluid (ISF). Unlike single-point blood tests, continuous monitoring with wearable biosensors provides dynamic, real-time data on biomarker fluctuations, offering unprecedented insights into an individual's metabolic state, disease progression, and treatment efficacy [52] [53]. This is particularly crucial for managing chronic diseases such as diabetes, cardiovascular conditions, and respiratory illnesses, which account for a significant portion of global mortality [52]. Epidermal wearable biosensors, fabricated on flexible, body-compliant substrates like textiles, wristbands, and temporary tattoos, offer a comfortable, user-friendly platform for prolonged use [52] [53]. The following sections will deconstruct the core components of these sophisticated devices, beginning with the elements of biorecognition and signal transduction.
Core Components of a Biosensor: Bioreceptors and Transducers
A biosensor's functionality hinges on the synergistic operation of its two fundamental units: the bioreceptor, which provides molecular specificity, and the transducer, which converts the biological event into a quantifiable signal [2] [1]. Figure 1 illustrates the architecture and workflow of a typical biosensor, demonstrating the pathway from analyte binding to a readable output.
Figure 1. Biosensor Architecture and Workflow. This diagram illustrates the core components of a biosensor and the sequential process from analyte detection to user-readable output.
Bioreceptors: The Molecular Recognition Element
The bioreceptor is a biological or biomimetic molecule that selectively binds to the target analyte. This specific interaction, termed biorecognition, is the first critical step that confers selectivity to the biosensor [9] [10]. The choice of bioreceptor depends on the target analyte and the required sensor performance.
- Enzymes: These biocatalytic receptors recognize their substrate and catalyze its conversion into a detectable product. The reaction can be monitored via substrate consumption or product formation. Enzymes like glucose oxidase are widely used due to their high catalytic activity and specificity, though their lifetime can be limited by stability [9] [32].
- Antibodies: These affinity-based receptors bind with high specificity to a unique epitope on an antigen. This robust interaction forms the basis of immunosensors. A key limitation is that the binding can be disrupted by chaotropic reagents, organic solvents, or temperature changes [9].
- Nucleic Acids (Aptamers and Genosensors): Single-stranded DNA or RNA aptamers, selected via the SELEX process, fold into specific 3D structures that bind targets with antibody-like affinity, hence the name "aptasensors" [9] [10]. Genosensors rely on complementary base pairing (hybridization) to detect specific DNA or RNA sequences [9].
- Artificial Binding Proteins: To overcome the size, stability, and cost limitations of antibodies, engineered protein scaffolds (e.g., Affimers, DARPins) are used. These are small, stable, and can be produced in high yield in bacterial systems, making them ideal for biosensing applications [9].
- Cells and Tissues: Whole cells or tissue slices can be used as bioreceptors, often to measure functional responses like toxicity or metabolic stress. They offer a natural environment for enzymes but may have longer response times and lack specificity due to the presence of multiple interfering enzymes [9].
Transducers: Converting Biological Events into Measurable Signals
The transducer transforms the physicochemical change resulting from the biorecognition event into a quantifiable electrical or optical signal. This process, signalization, defines the primary classification of biosensors [51] [2]. The major transduction mechanisms are detailed below and summarized for comparison in Table 1.
- Electrochemical Transducers: These are the most common and commercially successful transducers. They monitor electrical changes from redox reactions at an electrode surface [51] [32].
- Amperometric sensors measure the current generated by the oxidation or reduction of an electroactive species (e.g., H₂O₂ from an enzyme reaction) at a constant applied potential [1] [32].
- Potentiometric sensors measure the potential difference between a working electrode and a reference electrode when the net current is zero, often using ion-selective membranes [32].
- Conductometric sensors measure the change in the electrical conductivity of a solution due to an enzymatic reaction [32].
- Optical Transducers: These transducers detect changes in light properties.
- Colorimetric sensors measure a visible color change, often quantified with a simple camera or photodetector [54].
- Fluorescence sensors detect the emission of light from a fluorophore that is excited by a specific wavelength; the intensity, lifetime, or quenching of fluorescence can be correlated to analyte concentration [32].
- Surface Plasmon Resonance (SPR) detects changes in the refractive index on a metal surface, which alters the angle of reflected light when biomolecular binding occurs, allowing for label-free detection [32].
- Thermometric Transducers: These sensors, or thermistors, measure the heat absorbed or released during an enzymatic reaction, as many biological reactions are exothermic [32].
- Piezoelectric Transducers: These devices, such as Quartz Crystal Microbalances (QCM), measure the change in the resonant frequency of a crystal when mass is added to its surface from the binding of the analyte [32].
Table 1: Comparison of Major Biosensor Transducer Types
| Transducer Type | Measured Parameter | Principles | Examples in Wearables |
|---|---|---|---|
| Electrochemical | Current, Potential, Impedance | Redox reactions, ion activity | Glucose monitors (FreeStyle Libre), lactate sensors |
| Optical | Light Intensity, Wavelength | Color change, fluorescence, SPR | 3D-printed colorimetric patches for sweat rate, glucose, lactate [54] |
| Thermometric | Temperature / Heat | Enthalpy change from bioreaction | Less common in wearables; used in laboratory bio-calorimetry |
| Piezoelectric | Mass / Frequency | Mass change on resonant crystal | Detection of volatile compounds; challenging for liquid biofluids |
Molecular Monitoring in Sweat and Interstitial Fluid
The selection of the biofluid is a primary design consideration for continuous molecular monitoring. Sweat and ISF have emerged as the two most promising sources for non-invasive epidermal wearable biosensors.
Interstitial Fluid (ISF): A Window to Blood Biochemistry
ISF is an extracellular fluid that bathes the cells in the dermis and is formed through transcapillary exchange from the blood. Its composition is closely correlated with that of blood plasma for many analytes, as they diffuse directly from blood vessels through the capillary endothelium [52] [55]. This makes ISF a highly attractive medium for clinical monitoring.
- Composition and Advantages: ISF contains ions (Na⁺, K⁺, Ca²⁺, Cl⁻), small molecules (glucose, lactate, uric acid), hormones (cortisol), and proteins. Key advantages over other biofluids include:
- High Correlation with Blood: The concentration of many biomarkers in ISF is nearly identical to that in blood (e.g., glucose, lactate) [52].
- Minimal Dilution: There is much lesser dilution of biomarkers compared to sweat [52].
- Stability: Free from blood cells and clotting factors, offering a more stable matrix for sensing [52].
- ISF Extraction Methods: Accessing ISF requires minimally invasive techniques because it resides beneath the skin's surface.
- Reverse Iontophoresis: A low-level electrical current is applied to the skin, which drives the electro-migration of uncharged ISF molecules (like glucose) to the surface for detection [55]. This is the principle used in the first commercial continuous glucose monitor (GlucoWatch).
- Microneedle-Based Extraction: Hollow or hydrogel-based microneedles painlessly penetrate the stratum corneum (the outer skin layer) to directly sample ISF. Recent advances include 3D-printed hollow microneedles with integrated pumps for continuous sampling [54].
Table 2: Key Biomarkers in Interstitial Fluid and Their Clinical Relevance
| Biomarker | Concentration Range (Approx.) | Correlation with Blood | Chronic Disease Relevance |
|---|---|---|---|
| Glucose | 4.4 - 6.1 mmol/L (fasting) | Strong | Diabetes Management |
| Lactate | 0.5 - 2.2 mmol/L (resting) | Strong | Hypoxia, Sepsis, Athletic Performance |
| Cortisol | 5 - 50 nM | Weak (time-lag) | Stress, Cushing's Syndrome |
| Urea | 2.5 - 7.5 mmol/L | Data needed | Renal Function |
Sweat: An Easily Accessible Biofluid for Epidermal Sensing
Sweat is an acidic, electrolyte-rich fluid secreted by eccrine glands distributed across nearly the entire body surface. With over 100 glands per square centimeter, it provides an abundant and easily accessible source for non-invasive sampling [53].
- Composition and Transport: Sweat is 99% water but contains a rich matrix of analytes, including electrolytes (Na⁺, K⁺, Cl⁻), metabolites (lactate, urea, glucose), hormones (cortisol), and trace elements [53]. Analytes enter sweat via diffusion through cell membranes, transport between cells, or via vesicles.
- Sweat Stimulation Methods: Unlike ISF, sweat must be excreted to the skin surface, which often requires stimulation, especially at rest.
- Iontophoretic Delivery: A mild electrical current is used to deliver a sweat-inducing agonist drug (e.g., pilocarpine) into the skin, triggering localized sweat generation [55] [53].
- Physical Stimulation: Exercise or thermal heating can induce sweat, though this leads to less controlled and localized generation [53].
Table 3: Key Biomarkers in Sweat and Their Clinical Relevance
| Biomarker | Concentration Range (Approx.) | Correlation with Blood | Chronic Disease Relevance |
|---|---|---|---|
| Chloride (Cl⁻) | Tens of mM | Weak | Cystic Fibrosis Diagnosis [53] |
| Glucose | 10 - 200 μM | Moderate (complex physiology) | Diabetes (research focus) [53] |
| Lactate | 10 - 40 mM (exercise) | Weak (local metabolic product) | Athletic Performance, Hypoxia |
| Ethanol | Correlated with blood levels | Strong | Alcohol Abuse Monitoring [55] |
| Cortisol | Low ng/mL levels | Research ongoing | Chronic Stress |
Figure 2 illustrates the simultaneous extraction and analysis of these two critical biofluids using a single, integrated wearable platform.
Figure 2. Simultaneous Sweat and ISF Monitoring Workflow. This diagram outlines the process of on-demand, simultaneous sampling and analysis of sweat and interstitial fluid using a single wearable epidermal platform, as demonstrated in research settings [55].
Experimental Protocol: Simultaneous Sweat and ISF Monitoring
The following protocol details the methodology for a dual-iontophoretic system that enables simultaneous sampling and analysis of sweat and ISF, as referenced in the scientific literature [55].
Device Fabrication
- Substrate Preparation: Use a flexible, body-compliant substrate such as a temporary tattoo paper or medical-grade polyester.
- Electrode Printing: Fabricate the anode and cathode electrodes, as well as the working, reference, and counter electrodes for biosensing, onto the substrate using screen-printing or inkjet printing with conductive inks (e.g., Ag/AgCl, carbon).
- Bioreceptor Immobilization:
- At the anode chamber (for sweat alcohol sensing), immobilize Alcohol Oxidase (AOx) on the working electrode surface via cross-linking with glutaraldehyde or entrapment within a polymer matrix like Nafion.
- At the cathode chamber (for ISF glucose sensing), immobilize Glucose Oxidase (GOx) on its respective working electrode using a similar method.
- Hydrogel Integration: Place hydrogel pads containing the necessary reagents over the electrodes. The anode hydrogel is loaded with a pilocarpine nitrate solution (e.g., 10 mg/mL) for sweat stimulation. The cathode hydrogel is loaded with a buffer solution.
Experimental Setup and Measurement
- Device Application: Clean the volunteer's skin (e.g., forearm) with an alcohol swab and deionized water. Apply the dual-iontophoretic patch to the skin, ensuring good contact between the hydrogels and the epidermis.
- Simultaneous Fluid Sampling:
- Apply a constant current (e.g., 0.2 - 0.5 mA) between the anode and cathode for a set duration (e.g., 2-5 minutes). This current simultaneously drives pilocarpine delivery at the anode (inducing sweat) and reverse iontophoretic extraction of ISF glucose at the cathode.
- Electrochemical Biosensing:
- After the sampling phase, switch the electronic circuit to amperometric measurement mode.
- Apply a suitable potential to the working electrodes (e.g., +0.7 V vs. Ag/AgCl for H₂O₂ detection from oxidase enzymes).
- Measure the generated current at the anode (proportional to sweat alcohol) and the cathode (proportional to ISF glucose) simultaneously.
- Signal Processing: The measured analog currents are amplified, converted to digital signals, and wirelessly transmitted (e.g., via Bluetooth) to a smartphone or computer for data visualization and analysis.
The Scientist's Toolkit: Research Reagent Solutions
The development and operation of advanced biosensors for sweat and ISF monitoring rely on a suite of specialized reagents and materials. The table below details essential components for constructing such research platforms.
Table 4: Essential Research Reagents and Materials for Sweat and ISF Biosensor Development
| Reagent / Material | Function / Role | Specific Example |
|---|---|---|
| Glucose Oxidase (GOx) | Bioreceptor for glucose detection; catalyzes oxidation of glucose to gluconolactone and H₂O₂. | From Aspergillus niger; immobilized on electrode surface for ISF glucose sensing [55]. |
| Alcohol Oxidase (AOx) | Bioreceptor for ethanol detection; catalyzes oxidation of ethanol to acetaldehyde and H₂O₂. | Used in amperometric biosensors for monitoring sweat alcohol [55]. |
| Single-Atom Catalysts | Nanomaterial used to enhance signal in colorimetric or electrochemical assays; improves sensitivity and accuracy. | Integrated into 3D-printed colorimetric biosensors for sweat biomarkers [54]. |
| Pilocarpine Nitrate | Cholinergic agonist drug; stimulates localized sweat production when delivered via iontophoresis. | Loaded into anode hydrogel chamber for on-demand sweat generation at rest [55]. |
| Ag/AgCl Ink | Conductive ink for printing reference electrodes; provides a stable, reversible potential. | Screen-printed to form a stable reference electrode for electrochemical cells in wearable patches. |
| Nafion Polymer | Cation-exchange polymer membrane; used to entrap enzymes and repel anionic interferents (e.g., ascorbate, urate). | Coated over enzyme-modified working electrodes to improve selectivity [55]. |
| Flexible Substrate | The base material for the wearable sensor; must be skin-conformable, breathable, and biocompatible. | Temporary tattoo paper, medical-grade polyester, or polyurethane [55] [53]. |
Wearable and implantable biosensors for sweat and ISF analysis represent the vanguard of personalized healthcare and chronic disease management. Their effectiveness is rooted in the sophisticated integration of highly specific bioreceptors with sensitive transducers, enabling the continuous tracking of physiologically relevant biomarkers. While significant challenges remain—including ensuring long-term stability, accuracy in complex biological matrices, and large-scale clinical validation—the ongoing convergence of nanotechnology, advanced materials science, and wireless electronics is rapidly accelerating the field. The experimental protocols and research tools outlined in this whitepaper provide a foundational guide for scientists and engineers dedicated to advancing this transformative technology, ultimately bridging the gap between physiological data and actionable health insights.
This technical guide explores the application of silicon nanowire (SiNW) field-effect transistors (FETs) as transducers in biosensors for protein quantification, a critical process in drug development and manufacturing. The case study focuses on the technology pioneered by Advanced Silicon Group (ASG), which demonstrates a 15-fold reduction in time and cost compared to conventional enzyme-linked immunosorbent assay (ELISA) tests. Framed within the broader context of biosensing fundamentals, this paper details the interplay between bioreceptors and transducers, provides quantitative performance data, and outlines detailed experimental protocols for implementing this transformative technology.
A biosensor is an analytical device that detects a biological analyte by combining a bioreceptor with a physicochemical transducer [9]. The bioreceptor is a biological or biomimetic element (e.g., antibody, enzyme, aptamer, nucleic acid) engineered to bind specifically to the target analyte. The transducer then converts this binding event into a quantifiable electrical or optical signal [30] [23]. The performance of a biosensor hinges on the synergistic combination of these two components: the bioreceptor determines the sensor's specificity, while the transducer dictates its sensitivity and limit of detection (LOD) [23].
In drug manufacturing, the quantification of proteins, including potential contaminants like host cell proteins, is vital for ensuring drug safety and efficacy. Traditional methods like ELISA, while reliable, are often time-consuming, expensive, and require specialized equipment and trained technicians [56]. Silicon nanowire-based biosensors represent a significant advancement, offering a pathway to rapid, low-cost, and highly sensitive point-of-care and quality-control diagnostics.
Silicon Nanowire Transducer Technology
Fundamental Operating Principle
Silicon nanowire field-effect transistors (SiNW-FETs) function as biosensors by transducing the binding of a charged biomolecule (the analyte) to the nanowire surface into a measurable change in electrical conductance [57]. The SiNW acts as a semiconductor channel whose conductance is exquisitely sensitive to surface electric fields. The working principle involves several key steps:
- Surface Functionalization: The silicon nanowire is coated with a specific bioreceptor, such as an antibody, which is immobilized onto the nanowire surface [56].
- Analyte Binding: When the target protein is introduced, it binds to the antibody. Proteins carry a net electrical charge at physiological pH.
- Field-Effect Transduction: The charge from the bound protein molecules acts like a gate voltage, effectively modulating the electric field at the surface of the SiNW. This field change alters the density of charge carriers (electrons or holes) within the nanowire.
- Signal Readout: The change in charge carrier density causes a change in the electrical conductance (or resistance) of the nanowire. This change in photocurrent can be measured in real-time, is proportional to the number of bound analyte molecules, and thus to the analyte concentration in the solution [56] [57].
This label-free, direct electrical detection method eliminates the need for fluorescent or enzymatic tags, simplifying assay design and reducing time and cost.
ASG's Commercial Implementation
Advanced Silicon Group (ASG) has successfully commercialized this technology. Their sensor integrates silicon nanowires functionalized with antibodies specific to target proteins. The platform includes a handheld testing system into which the disposable sensor is inserted [56]. ASG reports that their system can deliver results in less than 15 minutes, a significant improvement over the hours required for traditional ELISA. Furthermore, the cost per test is dramatically lower, making extensive testing and quality control more economically viable [56].
Experimental Protocols and Methodologies
Sensor Fabrication and Functionalization
Objective: To create a SiNW-FET biosensor specific to a target protein (e.g., a host cell protein impurity).
Materials:
- Silicon-on-Insulator (SOI) wafers.
- Photolithography or electron-beam lithography equipment.
- Reactive ion etching (RIE) system.
- Metal deposition system (for source/drain electrodes).
- Specific antibodies against the target protein.
- Silane-based linkers (e.g., (3-Aminopropyl)triethoxysilane, APTES).
- Cross-linkers (e.g., glutaraldehyde).
- Buffer solutions (e.g., phosphate-buffered saline, PBS).
Procedure:
- Nanowire Fabrication: SiNWs are typically fabricated from SOI wafers using top-down processes involving lithography and etching to define nanowire structures with widths on the order of tens to hundreds of nanometers [57].
- Surface Activation: The native oxide on the silicon nanowire surface is activated for chemical functionalization.
- Linker Attachment: The activated surface is treated with a silane linker like APTES, which provides amine (-NH₂) groups on the surface.
- Bioreceptor Immobilization: The cross-linker glutaraldehyde is introduced to bridge the amine groups on the surface and amine groups on the antibody molecules. The specific antibody is then immobilized onto the functionalized surface.
- Blocking: The sensor is treated with a blocking agent (e.g., bovine serum albumin, BSA) to passivate any non-specific binding sites on the nanowire surface.
Protein Detection and Quantification Assay
Objective: To quantitatively measure the concentration of a target protein in a solution.
Materials:
- Functionalized SiNW-FET biosensor.
- Protein samples of known concentration for calibration.
- Unknown test samples.
- Potentiostat or custom electrical measurement system.
- Buffer solution for sample dilution and rinsing.
Procedure:
- Baseline Measurement: The functionalized sensor is placed in the measurement system, and a buffer solution is applied. The baseline electrical conductance (G₀) of the SiNW is recorded.
- Sample Introduction: The test sample (or a standard of known concentration) is introduced onto the sensor surface and allowed to incubate. Incubation times are typically short, on the order of minutes.
- Real-Time Monitoring: The change in conductance (ΔG) of the SiNW is monitored in real-time as proteins bind to the immobilized antibodies.
- Rinsing: The sensor is gently rinsed with buffer to remove unbound or weakly bound molecules. The remaining conductance change corresponds to specifically bound analyte.
- Calibration and Quantification: The signal (ΔG/G₀) is plotted against the concentration of the standard solutions to create a calibration curve. The concentration of the target protein in an unknown sample is determined by interpolating its signal on this calibration curve.
Performance Data and Comparative Analysis
The following tables summarize the quantitative performance of SiNW biosensors and compare them with conventional technologies.
Table 1: Performance Metrics of ASG's Silicon Nanowire Biosensor
| Parameter | Performance Value | Context / Comparative Method |
|---|---|---|
| Time to Result | < 15 minutes | ELISA: Hours [56] |
| Cost Reduction | 15x lower | Compared to standard ELISA tests [56] |
| Production Capacity | ~2,000 sensors per 8-inch chip | In partner semiconductor foundry [56] |
| Detection Capability | Multiplexing possible | Can measure many different proteins/molecules at once [56] |
Table 2: Comparison of Biosensor Transduction Methods for Protein Detection
| Transducer Type | Detection Principle | Typical LOD for Proteins | Key Advantages | Key Challenges |
|---|---|---|---|---|
| Silicon Nanowire (FET) | Electrical conductance change | Zeptomole (zmol) level [57] | Label-free, real-time, highly sensitive, portable | Complex fabrication, signal drift, "charge screening" in high-salt buffers |
| Electrochemical (EIS) | Impedance change at electrode interface | ~0.03 μg/μL (for IgG) [30] | Highly sensitive, low-cost, portable | Can be sensitive to non-specific adsorption |
| Surface Plasmon Resonance (SPR) | Change in refractive index | Not specified in sources | Label-free, real-time kinetics | Expensive instrumentation, not easily portable |
| Traditional ELISA | Enzymatic colorimetric reaction | ≥105 CFU mL⁻¹ (for bacteria) [13] | Well-established, highly specific | Long process, high cost, requires trained staff [56] |
The Scientist's Toolkit: Essential Research Reagents and Materials
Table 3: Key Reagent Solutions for SiNW Biosensor Development
| Reagent / Material | Function | Example |
|---|---|---|
| Bioreceptor | Provides specificity by binding the target analyte. | Monoclonal antibodies, aptamers [58]. |
| Silane Linker | Creates a chemical bridge between the SiNW surface and the bioreceptor. | (3-Aminopropyl)triethoxysilane (APTES). |
| Cross-linker | Covalently attaches the bioreceptor to the linker on the surface. | Glutaraldehyde, NHS-EDC chemistry. |
| Blocking Agent | Reduces non-specific binding by passivating unused surface areas. | Bovine Serum Albumin (BSA), casein. |
| Buffer Solutions | Maintain a stable pH and ionic strength for biomolecule stability and binding. | Phosphate Buffered Saline (PBS), HEPES. |
Silicon nanowire transducers represent a paradigm shift in protein quantification for drug manufacturing. By leveraging the high sensitivity and label-free detection capabilities of SiNW-FETs, this technology directly addresses the critical needs for speed, cost-efficiency, and portability in bioprocess development and quality control. The successful commercialization by companies like ASG underscores its practical viability and transformative potential.
Future development in this field will likely focus on overcoming remaining challenges, such as simplifying mass fabrication to further reduce costs and improving the robustness of assays in complex biological matrices. Furthermore, the integration of SiNW sensors into larger microfluidic systems for automated sample handling will pave the way for fully integrated, high-throughput analytical platforms. As the technology matures, its adoption is expected to accelerate, not only in drug manufacturing but also in clinical diagnostics, environmental monitoring, and food safety, ultimately making precise biomolecular quantification more accessible than ever before.
Optimizing Performance and Overcoming Challenges in Biosensor Development
In biosensing research, the analytical device's performance is paramount to its successful application in medical diagnostics, environmental monitoring, and drug development. While the fundamental components of a biosensor—the bioreceptor and transducer—establish its core functionality, the critical performance parameters ultimately determine its real-world viability [9] [10]. The bioreceptor is a biological or biomimetic element (such as an enzyme, antibody, nucleic acid, or cell) designed to interact specifically with the target analyte [9]. The transducer then converts this biological recognition event into a quantifiable signal [4].
This whitepaper provides an in-depth technical examination of the four critical performance parameters: sensitivity, selectivity, reproducibility, and stability. We will explore their fundamental definitions, the methodologies for their quantitative assessment, and their intrinsic dependence on the choices of bioreceptor and transducer. The aim is to furnish researchers and scientists with a structured framework for evaluating and enhancing biosensor performance.
Defining the Core Parameters
The performance of a biosensor is quantified through several key characteristics. Among these, sensitivity, selectivity, reproducibility, and stability are foundational for assessing analytical utility and reliability [59] [10] [60].
- Sensitivity is defined as the minimum amount of analyte that can be reliably detected by the biosensor [10] [4]. It is often determined by the affinity of the bioreceptor and the signal-to-noise ratio of the transducer [4]. In practice, it is quantified by the Limit of Detection (LOD), which is the lowest analyte concentration that produces a signal statistically distinct from the background noise [59].
- Selectivity is the ability of a biosensor to detect a specific analyte in a sample containing other admixtures, contaminants, or interferents [59]. This parameter is primarily determined by the specificity of the bioreceptor [4]. A highly selective bioreceptor will recognize and bind only to its intended target, minimizing false positive or negative signals.
- Reproducibility refers to the ability of the biosensor to generate identical responses for a duplicated experimental setup, indicating the precision of the measurements across different sensors, operators, or laboratories [59]. It is affected by the consistency in bioreceptor production and its immobilization on the transducer surface [4].
- Stability is the degree to which a biosensor maintains its performance over time and under various storage and operating conditions [59] [4]. It is influenced by the longevity of the bioreceptor's activity and the robustness of the transducer. Stability can be compromised by the degradation or denaturation of the bioreceptor [4].
The following diagram illustrates the fundamental relationship between the biosensor's core components and these critical performance parameters.
Figure 1. Component-Parameter Relationship Map. This diagram shows the primary relationships between the core biosensor components (bioreceptor and transducer) and the four critical performance parameters.
Quantitative Assessment and Methodologies
A rigorous, standardized approach is required to evaluate the critical performance parameters of a biosensor accurately. The following sections outline established experimental protocols and quantitative measures.
Sensitivity and the Calibration Curve
The sensitivity is empirically determined through the construction of a calibration curve.
- Objective: To establish a mathematical relationship between the concentration of the target analyte and the magnitude of the output signal.
- Experimental Protocol:
- Prepare a series of standard solutions with known analyte concentrations, covering the expected dynamic range of the biosensor.
- For each standard solution, measure the output signal (e.g., current for amperometric sensors, voltage for potentiometric, fluorescence intensity for optical) using the biosensor.
- Plot the measured signal against the corresponding analyte concentration.
- Perform regression analysis to fit the data. The slope of the linear portion of this calibration curve represents the analytical sensitivity [4].
- Determining LOD: The LOD is typically calculated as the concentration corresponding to the signal of the blank (sample without analyte) plus three times the standard deviation of the blank signal (LOD = Meanblank + 3σblank) [59].
Selectivity and Interference Testing
Selectivity is evaluated by challenging the biosensor with potential interferents.
- Objective: To quantify the biosensor's response to non-target substances compared to its response to the target analyte.
- Experimental Protocol:
- Identify likely interfering substances present in the sample matrix (e.g., ascorbic acid, uric acid, and acetaminophen in blood for a glucose biosensor) [59].
- Measure the biosensor's signal for a solution containing only the interfering substance at a physiologically relevant concentration.
- Compare this signal to the signal generated by the target analyte at its typical concentration.
- The selectivity can be reported as the percentage of response relative to the target analyte or as a ratio of signals (Analyte Signal / Interferent Signal).
- Advanced Technique: For biosensor arrays or complex samples, machine learning techniques like Principal Component Analysis (PCA) can be employed to differentiate the unique signal pattern (fingerprint) of the target analyte from interferents [61] [62].
Reproducibility and Statistical Analysis
Reproducibility assesses the precision and reliability of the biosensor's manufacturing and measurement process.
- Objective: To determine the variance in the biosensor's output under identical conditions.
- Experimental Protocol:
- Intra-assay Precision: Using the same biosensor device (or from the same production batch), perform multiple (n ≥ 5) measurements of the same sample containing a known analyte concentration in a single session. Calculate the coefficient of variation (CV = Standard Deviation / Mean × 100%).
- Inter-assay Precision: Using multiple biosensors from different production batches, measure the same sample over different days. Calculate the CV across these different batches and time points [4].
- The lower the CV percentage, the higher the reproducibility of the biosensor.
Stability and Lifetime Studies
Stability testing evaluates the biosensor's ability to retain its performance over time.
- Objective: To monitor the degradation of the biosensor's response under storage and operational conditions.
- Experimental Protocol:
- Operational Stability: Use the same biosensor to repeatedly measure a standard analyte solution at regular intervals (e.g., every hour for 8 hours, or daily for a week). The signal loss over time indicates the operational stability.
- Shelf-Life Stability: Store multiple biosensors under recommended conditions (e.g., 4°C, dry environment). At predetermined time points (e.g., weekly or monthly), test the biosensors with a standard solution. The time until the signal degrades to a predefined threshold (e.g., 90% of initial response) defines the shelf life.
- The results are often presented as a plot of relative response (%) versus time.
The table below summarizes the key metrics and methods for assessing each parameter.
Table 1: Summary of Quantitative Assessment Methods for Critical Performance Parameters
| Parameter | Key Quantitative Metric | Primary Assessment Method | Typical Target Value |
|---|---|---|---|
| Sensitivity | Limit of Detection (LOD), Calibration Curve Slope | Analysis of calibration curve and blank signal | LOD below the lowest clinically/relevantly significant concentration |
| Selectivity | Signal Ratio (Target/Interferent), % Cross-reactivity | Measurement of response in the presence of known interferents | >100:1 signal ratio for key interferents |
| Reproducibility | Coefficient of Variation (CV) | Repeated measurements (intra- and inter-assay) | CV < 5-10% (dependent on application) |
| Stability | Shelf Life, % Signal Retention over Time/Use | Long-term testing under storage and use conditions | >90% initial activity over 30 days (application-dependent) |
The Scientist's Toolkit: Essential Reagents and Materials
The experimental assessment of biosensor performance relies on a suite of specialized reagents and materials. The following table details key items central to the development and evaluation process.
Table 2: Key Research Reagent Solutions for Biosensor Development and Evaluation
| Item | Function/Description | Application in Performance Assessment |
|---|---|---|
| Specific Bioreceptors (e.g., Glucose Oxidase, Anti-PSA Antibody, DNA Aptamer) | The biological recognition element that provides selectivity by binding the target analyte [9]. | The choice of bioreceptor is fundamental to testing selectivity and specificity against interferents. |
| Analyte Standard Solutions | High-purity preparations of the target molecule at known concentrations. | Essential for constructing the calibration curve to determine sensitivity, LOD, and linear range. |
| Chemical Interferents (e.g., Ascorbic Acid, Uric Acid) | Substances with similar chemical properties or found in the sample matrix that may cause non-specific signals [59]. | Used in selectivity experiments to challenge the biosensor and quantify interference. |
| Immobilization Matrix/Reagents (e.g., Glutaraldehyde, NHS-EDC, Nafion, Polymer Hydrogels) | Chemicals or polymers used to stably attach the bioreceptor to the transducer surface [10]. | Critical for achieving reproducibility (consistent immobilization across batches) and stability (preventing bioreceptor leaching). |
| Buffer Salts and Stabilizers (e.g., PBS, BSA, Trehalose) | Solutions to maintain physiological pH and ionic strength; additives to prevent bioreceptor denaturation. | Used in all protocols to ensure consistent experimental conditions and to enhance long-term stability during storage. |
Advanced Considerations and Integrated Workflow
Modern biosensing challenges, such as detecting analytes in complex matrices like blood or soil, require an integrated approach to performance optimization. A significant challenge is biofouling, where the non-specific accumulation of proteins or other biological materials on the sensor surface can degrade sensitivity, selectivity, and stability over time [4]. Furthermore, the emergence of bioreceptor-free biosensors (e.g., electronic tongues/noses, SERS-based sensors) that use semi-specific sensor arrays presents a unique case. In these systems, machine learning (ML) algorithms, such as Support Vector Machines (SVM) and Artificial Neural Networks (ANN), effectively replace the bioreceptor's function by providing specificity through pattern recognition in the multivariate data [61] [62].
The following diagram synthesizes the concepts discussed in this guide into a cohesive experimental workflow for the development and validation of a biosensor.
Figure 2. Biosensor Development and Validation Workflow. This diagram outlines a generalized iterative process for developing a biosensor, highlighting the stages where critical performance parameters are assessed and optimized.
In conclusion, the rigorous characterization of sensitivity, selectivity, reproducibility, and stability is not a mere formality but the cornerstone of credible biosensing research. A deep understanding of how these parameters are governed by the interplay between the bioreceptor and transducer enables researchers to design better biosensors, optimize their performance, and provide meaningful data that can advance scientific knowledge and commercial application.
A biosensor is an integrated analytical device that converts a biological response into a quantifiable electrical signal [2]. Its core functionality hinges on two fundamental components: the bioreceptor and the transducer. The bioreceptor is a biological molecular species (e.g., enzyme, antibody, nucleic acid, or cell) that provides specificity by recognizing the target analyte. The transducer then converts this biorecognition event into a measurable output, such as an electrical, optical, or gravimetric signal [2] [63]. Electrochemical transducers, which measure electrical currents or potentials resulting from biochemical reactions, are particularly prominent due to their cost-effectiveness, portability, and high sensitivity [64] [65].
The commercial viability and diagnostic accuracy of biosensors, especially for point-of-care testing and continuous monitoring, are severely hampered by two interconnected challenges: biofouling and signal drift [64] [66] [67]. Biofouling refers to the non-specific, uncontrolled adsorption of proteins, cells, and other biomolecules present in complex biological fluids (e.g., blood, serum, urine) onto the sensor surface [67]. This process can physically block access to the bioreceptor, increase background noise, and lead to a rapid loss of sensitivity and specificity, often causing false-positive results [64] [67]. Consequently, biofouling is a primary driver of signal drift—the undesirable change in sensor output over time despite a constant analyte concentration. Signal drift diminishes the reliability and longevity of biosensors, making long-term or continuous monitoring, particularly within the body (in vivo), exceptionally difficult [66]. This whitepaper explores how novel nanocomposite coatings and sophisticated interface engineering strategies are providing innovative solutions to these persistent problems, thereby advancing the field of biosensing research.
Core Challenges: Biofouling and Signal Drift
Mechanisms and Impact on Biosensor Performance
The deleterious effects of biofouling and signal drift are not merely theoretical but represent significant practical barriers. In complex biological fluids like blood plasma or serum, countless biomolecules compete for binding sites on the electrode surface. When these molecules adsorb non-specifically, they form an insulating layer that fouls the surface [67]. This fouling layer obstructs electron transfer to the electrode surface, which is the fundamental mechanism of signal generation in electrochemical biosensors. The result is a gradual degradation of the electrochemical signal, manifesting as signal drift and a loss of sensitivity [64] [68]. For implantable biosensors, the challenge is even greater, as the foreign body response triggers fibrotic encapsulation, where collagen and fibroblasts form a physical barrier that isolates the sensor from the target analytes in the surrounding tissue [69].
The lack of built-in redox properties in many traditional biosensor designs further exacerbates these issues. Such sensors require additional steps and external redox probes, complicating the process and reducing practical applicability for point-of-care testing [64]. The scarcity of biosensors capable of direct, reliable detection in unprocessed biofluids is a direct consequence of these limitations [64]. Therefore, the development of a universal electrode coating with integrated functionalities—such as improved bioreceptor immobilization, excellent antifouling behavior, and built-in redox capability—is pivotal for the successful commercialization of next-generation biosensors [64].
Novel Nanocomposite Coatings as a Strategic Solution
Universal Nanocomposite Coatings with Multifunctional Properties
Recent research has yielded groundbreaking advances in multifunctional nanocomposite coatings designed to simultaneously address biofouling, enable efficient bioreceptor immobilization, and facilitate signal transduction. One prominent example is a universal nanocomposite coating comprising a 3D porous matrix of cross-linked Bovine Serum Albumin (BSA) embedded with conductive nanomaterials, such as graphene nanosheets modified with amino-ferrocene (Fc-GNS) or networks of gold nanowires (AuNWs) [64] [68].
This architecture is uniquely designed to tackle three critical challenges:
- Improved Antibody Immobilization: The 3D BSA matrix provides a scaffold with abundant carboxylic groups from aspartate and glutamate side chains. These groups allow for the oriented, covalent conjugation of biorecognition elements (e.g., antibodies) via standard EDC/NHS chemistry, which improves the availability of active binding sites [64].
- Antifouling Properties: The cross-linked BSA matrix creates a hydrophilic, protein-repellent surface that minimizes non-specific interactions, acting as a robust antifouling barrier [64] [68].
- Mediator-Free Sensing: The embedded Fc-GNS or other conductive nanomaterials enhance the electrode's conductivity and serve as a built-in redox mediator. This eliminates the need for external redox probes in the solution, enabling simpler, mediator-free biosensing [64].
The performance of this coating is exceptional. It demonstrated minimal signal degradation despite prolonged exposure (up to 30 days) to challenging environments like 1% BSA, artificial urine, and untreated human serum [64]. In a separate study, a similar BSA-based nanocomposite preserved 88% of the original signal after a 1-month exposure to unprocessed human plasma [68].
Table 1: Performance Metrics of Select Antifouling Nanocomposite Coatings
| Coating Composition | Conductive Nanomaterial | Tested Biofluid | Stability Duration | Key Performance Outcome |
|---|---|---|---|---|
| Cross-linked BSA Matrix [64] | Fc-GNS | Untreated human serum, artificial urine | 30 days | Minimal signal degradation |
| Cross-linked BSA Matrix [68] | AuNWs, AuNPs, or CNTs | Unprocessed human plasma | 30 days | Retained 88% of original signal |
| BSA + Pentaamine-functionalized RGO [69] | Reduced Graphene Oxide (RGO) | Complex human plasma | 3 weeks | Maintained electrochemical stability |
Advanced and Specialized Coating Strategies
Beyond universal BSA-based coatings, other innovative strategies are emerging:
- Biomimetic Interfaces for In Vivo Stability: Drawing inspiration from the intestinal mucosa, which protects host cell receptors in the presence of the gut microbiome, researchers have developed a synthetic biosensor featuring a hierarchical nano-biointerface. This design includes a three-dimensional bicontinuous nanoporous structure, a polymer coating, and aptamer switches. This system balanced small-molecule sensing with surface protection and demonstrated stability for at least 1 month in undiluted serum in vitro, or 1 week implanted within the blood vessels of free-moving rats, while retaining over 50% of its baseline signal [66].
- Antimicrobial and Antifibrotic Coatings: For implantable biosensors, preventing microbial infection and the foreign body response is critical. A nanocomposite composed of cross-linked BSA and pentaamine-functionalized reduced graphene oxide was covalently coupled with antibiotic drugs (e.g., gentamicin or ceftriaxone). This coating actively inhibited the proliferation of Pseudomonas aeruginosa bacteria and the adhesion of primary human fibroblasts, thereby combating both biofouling and microbial-induced corrosion while retaining high electroconductivity [69].
- Supramolecular-Assisted Nanocomposites: To address the instability and aggregation of inorganic nanoparticles in coatings, controlled supramolecular self-assembly has been employed. For instance, polyvinylpyrrolidone (PVP)-mediated molecule entanglement strengthens the dispersion and fixation of encapsulated silver nanoparticles (AgNPs) within a polyurethane matrix. This coating exhibits broad-spectrum bactericidal efficiencies of 99.99% against Staphylococcus aureus and Escherichia coli, robust resistance to microbial-influenced corrosion, and can endure 720 hours of salt spray testing [70].
Experimental Protocols for Key Developments
Fabrication of a Universal BSA-Nanocomposite Coated Electrode
The following protocol details the synthesis of a universal antifouling and redox-active nanocomposite coating, adapted from recent literature [64].
1. Synthesis of Amino-Ferrocene Functionalized Graphene Nanosheets (Fc-GNS):
- Materials: Graphene nanosheets (GNS, <3 nm), amino-ferrocene (Fc–NH₂, >98%), 2-(N-morpholino) ethanesulfonic acid (MES) buffer.
- Procedure:
- Disperse GNS in MES buffer (pH ~6.0) via ultrasonication for 30 minutes to create a homogeneous suspension.
- Add a stoichiometric excess of Fc–NH₂ to the GNS suspension.
- Activate the coupling reaction by adding EDC and NHS to the final mixture, stirring for 12 hours at room temperature.
- Purify the resulting Fc-GNS product by repeated cycles of centrifugation and washing with deionized water to remove unreacted reagents.
2. Preparation of the Nanocomposite Coating Solution:
- Materials: Bovine Serum Albumin (BSA), Glutaraldehyde (GA, 25% in H₂O), synthesized Fc-GNS.
- Procedure:
- Dissolve BSA (e.g., 10 mg/mL) in a neutral phosphate buffer or deionized water.
- Add the purified Fc-GNS suspension to the BSA solution at a desired mass ratio (e.g., 1:1) and mix thoroughly by vortexing and brief sonication to achieve a uniform dispersion.
- Add glutaraldehyde (e.g., 0.1% v/v final concentration) to the BSA/Fc-GNS mixture to act as a cross-linking agent. Mix well and allow the solution to incubate for 1 hour at room temperature to pre-polymerize.
3. Electrode Modification and Coating Formation:
- Procedure:
- Clean the bare electrode (e.g., glassy carbon or gold electrode) according to standard protocols (e.g., polishing with alumina slurry, sonication in water and ethanol).
- Drop-cast a precise volume (e.g., 5-10 µL) of the pre-polymerized BSA/Fc-GNS/GA solution onto the clean electrode surface.
- Allow the coated electrode to dry under ambient conditions or in a humidified chamber for several hours, facilitating the formation of a stable, cross-linked 3D porous matrix on the electrode surface.
Immobilization of Biorecognition Elements and Biosensor Testing
1. Antibody Immobilization via EDC/NHS Chemistry:
- Materials: EDC, NHS, antibody (e.g., anti-IL-8 or anti-VEGF).
- Procedure:
- Activate the carboxylic acid groups on the cross-linked BSA matrix by incubating the modified electrode with a fresh solution of EDC and NHS (e.g., 20 mM and 10 mM, respectively) in MES buffer for 30-60 minutes.
- Rinse the electrode gently with a clean buffer to remove excess EDC/NHS.
- Incubate the activated electrode with a solution of the specific antibody (e.g., 10-50 µg/mL) for 2 hours at room temperature or overnight at 4°C. The amine groups on the antibody will form stable amide bonds with the activated carboxylic acids on the BSA matrix.
- Rinse the electrode thoroughly to remove physically adsorbed antibodies.
2. Electrochemical Biosensing and Antifouling Validation:
- Materials: Electrochemical analyzer, phosphate buffer saline (PBS), target analyte (e.g., IL-8, VEGF), complex biofluids (e.g., human serum, artificial urine).
- Procedure:
- Perform electrochemical measurements (e.g., Cyclic Voltammetry or Electrochemical Impedance Spectroscopy) in a standard redox probe solution like [Fe(CN)₆]³⁻/⁴⁻ to characterize the modified electrode.
- To test sensing performance, incubate the immunosensor with solutions containing varying concentrations of the target analyte. Measure the electrochemical response (e.g., change in peak current or charge transfer resistance). The built-in ferrocene groups enable direct, mediator-free detection.
- To validate antifouling stability, incubate the biosensor in undiluted or minimally diluted human serum, plasma, or artificial urine for extended periods (days to weeks). Periodically measure the electrochemical signal in a standard solution to monitor any signal degradation.
The Scientist's Toolkit: Essential Research Reagents and Materials
Table 2: Key Research Reagent Solutions for Nanocomposite Biosensor Development
| Reagent/Material | Function and Role in Development | Example Use Case |
|---|---|---|
| Bovine Serum Albumin (BSA) | Forms a 3D cross-linked matrix that provides a biocompatible scaffold for bioreceptor immobilization and confers antifouling properties. | Primary structural and antifouling component in universal coatings [64] [68]. |
| Amino-Ferrocene (Fc-NH₂) | Acts as a redox mediator. Its amino group allows covalent attachment to nanomaterials, building redox activity into the coating. | Functionalization of graphene nanosheets to create Fc-GNS for mediator-free sensing [64]. |
| Gold Nanowires (AuNWs) | Form a conductive network within a polymer matrix, enhancing electron transfer while the polymer provides antifouling. | Conductive nanomaterial in BSA-based nanocomposites for signal enhancement [68]. |
| Graphene Nanosheets (GNS) | Provide a high surface area, excellent conductivity, and a platform for functionalization with redox mediators or bioreceptors. | Base conductive nanomaterial, often functionalized with ferrocene, in nanocomposite coatings [64]. |
| EDC & NHS | Carbodiimide crosslinker chemistry agents that activate carboxyl groups for covalent bonding with amine groups on antibodies or other biomolecules. | Standard chemistry for oriented immobilization of antibodies onto the BSA matrix [64]. |
| Glutaraldehyde | A homobifunctional crosslinker that reacts with amine groups, used to create stable, cross-linked polymeric networks. | Cross-linking of BSA molecules to form a stable 3D porous matrix [64]. |
| Polyvinylpyrrolidone (PVP) | A polymer that acts as a supramolecular entangler, improving the dispersion and fixation of nanoparticles within a coating to prevent aggregation. | Used in supramolecular-assisted nanocomposites to stabilize silver nanoparticles [70]. |
Visualizing the Biosensor Architecture and Fouling Defense Mechanism
The following diagram illustrates the core components and operational principle of a biosensor, with a detailed focus on the structure and antifouling action of a advanced nanocomposite coating.
This diagram titled "Biosensor Structure and Coating Defense" illustrates the journey from analyte detection to signal output. The process begins with the specific binding of the analyte to the bioreceptor, which generates a signal interpreted by the transducer. The detailed view reveals the nanocomposite coating's sophisticated defense mechanism. The conductive nanomaterials embedded within the 3D porous BSA matrix facilitate electron transfer to the electrode surface while also providing built-in redox activity. The BSA matrix serves a dual purpose: it enables the oriented covalent immobilization of antibodies for optimal binding and, crucially, acts as a non-fouling barrier. This barrier actively repels non-target proteins and other fouling agents present in complex biofluids, preventing the formation of an insulating fouling layer that would cause signal drift and sensor failure.
The integration of novel nanocomposite coatings represents a paradigm shift in the battle against biofouling and signal drift. By thoughtfully engineering the biosensor interface with materials like cross-linked BSA, conductive graphene nanosheets, and metallic nanowires, researchers have created multifunctional systems that not only protect the sensor from complex biological environments but also enhance its analytical performance. These coatings address the core requirements of effective biosensing: stable immobilization of bioreceptors, robust antifouling capabilities, and efficient signal transduction. As these technologies mature, moving from proof-of-concept studies to commercial applications, they hold the immense promise of enabling a new generation of reliable, sensitive, and long-lasting biosensors for point-of-care diagnostics, continuous health monitoring, and advanced drug development.
The development of high-performance biosensors is a complex, multivariate challenge where the interactions between biological and physicochemical components dictate overall system performance. Traditional one-variable-at-a-time (OVAT) optimization approaches prove inadequate for these multidimensional systems, often missing critical factor interactions and failing to identify true optimal conditions. This technical guide examines the systematic application of Design of Experiments (DoE) methodology as a powerful alternative for biosensor optimization. Focusing on the intricate relationship between bioreceptors and transducers—the core components of any biosensing system—we demonstrate how structured experimentation can efficiently map experimental space, quantify interaction effects, and accelerate the development of robust, sensitive biosensing platforms for pharmaceutical and diagnostic applications.
A biosensor is an integrated analytical device that converts a biological response into a quantifiable electrical signal [9]. This process centers on the coordinated function of two fundamental components: the bioreceptor and the transducer.
The bioreceptor is a biological or biomimetic element that provides specific recognition for the target analyte (substance of interest) [2] [1]. Common bioreceptors include enzymes, antibodies, nucleic acids, cells, tissues, and aptamers. The specific interaction between the bioreceptor and analyte—termed biorecognition—generates a physicochemical change such as heat, light, pH shift, or mass change [2].
The transducer converts this biorecognition event into a measurable analytical signal, typically electrical or optical [2] [32]. Transducers are classified based on their operating principle: electrochemical (amperometric, potentiometric, conductometric), optical (surface plasmon resonance, fluorescence, colorimetric), thermal, piezoelectric, or gravimetric [2] [32].
The performance of a biosensor depends critically on how effectively the bioreceptor's specific response is captured and translated by the transducer. This complex interplay creates a multivariate optimization challenge that traditional approaches struggle to address efficiently.
The Limitation of One-Variable-at-a-Time Approaches
For decades, biosensor development has relied heavily on OVAT methodology, where researchers vary a single factor while holding all others constant [71] [72]. While straightforward, this approach presents significant limitations:
- Inefficiency: Examining multiple factors requires an exponentially growing number of experiments [72]. For example, optimizing just 6 factors at 3 levels each would require 729 (3⁶) experiments—a prohibitively large number.
- Interaction Blindness: OVAT cannot detect interactions between factors [73] [72]. For instance, the optimal immobilization pH for a bioreceptor may depend on the temperature, but this synergy would remain undetected.
- Suboptimal Solutions: Without understanding factor interactions, the identified "optimum" is often false or incomplete, potentially missing significantly better performance conditions [71].
- No Robustness Information: OVAT provides little insight about how sensitive the system is to small variations around the supposed optimum [72].
These limitations are particularly problematic in biosensor development, where subtle interactions between bioreceptor immobilization strategies, transducer surface properties, and detection conditions significantly impact critical performance parameters including sensitivity, selectivity, and stability [73] [1].
Fundamental Aspects of Design of Experiments
DoE is a structured, statistical methodology for efficiently planning, conducting, and analyzing multi-factor experiments [71] [73]. Rather than varying factors in isolation, DoE systematically changes multiple factors simultaneously according to predetermined experimental matrices, enabling researchers to:
- Identify influential factors from many potential variables [72]
- Quantify individual and interaction effects of multiple factors [73]
- Build mathematical models relating factors to responses [73]
- Locate optimal conditions with minimal experimental effort [74]
- Establish robustness of the optimized system [72] [75]
The DoE workflow typically progresses through screening, optimization, and robustness testing phases, with each stage employing specialized experimental designs appropriate for its objectives [72].
Core DoE Designs for Biosensor Optimization
Table 1: Common Experimental Designs in Biosensor Development
| Design Type | Purpose | Factors Typically Assessed | Key Advantage |
|---|---|---|---|
| Full Factorial [73] [72] | Screening to identify influential factors | Bioreceptor density, buffer pH, temperature, incubation time | Estimates all main effects and interactions |
| Fractional Factorial [75] | Screening when many factors exist | Cell density, reagent concentrations, incubation times, detection parameters | Reduced experimental burden while maintaining key information |
| Central Composite [73] [72] | Optimization of critical factors | Key parameters identified in screening | Models curvature and identifies true optimum |
| Mixture Design [73] | Formulating multicomponent systems | Buffer composition, nanomaterial ratios in composite transducers | Accounts for constraint that components sum to 100% |
Implementing DoE in Biosensor Development
Preliminary Planning and Risk Assessment
Successful DoE implementation begins with multidisciplinary brainstorming to identify potential factors and quality attributes [72]. The team—including biologists, chemists, and engineers—uses risk assessment tools to prioritize factors based on their potential impact on Critical Quality Attributes (CQAs) such as sensitivity, dynamic range, and reproducibility [72]. Factors are typically ranked on a 1-5 scale, with those scoring ≥4 considered high priority for inclusion in initial screening designs [72].
Screening Phase: Identifying Influential Factors
The screening phase aims to distinguish the few truly influential factors from the many potentially irrelevant ones [72]. For a biosensor, this might involve assessing 5-10 factors across 2 levels in a highly efficient design such as a Resolution III fractional factorial, which requires only 8-16 experimental runs [75].
Table 2: Example Screening Design for an Electrochemical Immunosensor
| Experiment | Antibody Concentration (μg/mL) | Immobilization pH | Blocking Time (min) | Response (Signal-to-Noise) |
|---|---|---|---|---|
| 1 | 10 (-1) | 6.0 (-1) | 30 (-1) | 15.2 |
| 2 | 50 (+1) | 6.0 (-1) | 30 (-1) | 28.7 |
| 3 | 10 (-1) | 8.5 (+1) | 30 (-1) | 12.4 |
| 4 | 50 (+1) | 8.5 (+1) | 30 (-1) | 32.9 |
| 5 | 10 (-1) | 6.0 (-1) | 120 (+1) | 16.8 |
| 6 | 50 (+1) | 6.0 (-1) | 120 (+1) | 30.1 |
| 7 | 10 (-1) | 8.5 (+1) | 120 (+1) | 14.2 |
| 8 | 50 (+1) | 8.5 (+1) | 120 (+1) | 35.6 |
Statistical analysis of the screening results identifies which factors significantly affect each CQA. For example, a coefficients plot can visually represent the magnitude and direction of each factor's effect [72]. This phase typically reduces the number of critical factors from potentially 10+ to 3-5 for further optimization [72].
Optimization Phase: Finding the Sweet Spot
Once critical factors are identified, optimization designs characterize the response surface in detail [72]. Central Composite Designs (CCD) are particularly valuable here, as they can model curvature in the response and identify true optimal conditions [73] [72]. A CCD explores each factor at five levels (-α, -1, 0, +1, +α), allowing estimation of quadratic effects that indicate optimum points within the experimental region [73].
The data from optimization experiments are used to build mathematical models that predict biosensor performance across the entire experimental domain. For example, a second-order model for a biosensor might take the form:
Y = b₀ + b₁X₁ + b₂X₂ + b₁₂X₁X₂ + b₁₁X₁² + b₂₂X₂²
Where Y is the predicted response (e.g., sensitivity), X₁ and X₂ are factors (e.g., antibody concentration and pH), and the b-values are coefficients estimated from experimental data [73].
These models enable the generation of response surface plots and design space diagrams that visually represent the relationship between factors and responses, clearly showing optimal operating regions and "edges of failure" where performance deteriorates [72].
Figure 1: DoE Workflow for Biosensor Optimization. This systematic approach progresses from screening to design space establishment.
Robustness Evaluation
The final DoE phase evaluates robustness—how sensitive the optimized biosensor is to small variations in critical parameters [72] [75]. This is particularly important for transfer to manufacturing or routine use. Robustness testing typically involves varying factors around their setpoints within expected operational ranges and measuring the impact on key performance indicators [75].
Case Studies: DoE in Biosensor Applications
Whole Cell Biosensor Optimization
Researchers applied DoE to optimize whole-cell biosensors for detecting protocatechuic acid (PCA) and ferulic acid, aromatic compounds derived from lignin [74]. They systematically modified regulatory components—promoter strength and ribosome binding site (RBS) strength—using a Definitive Screening Design with 13 experiments [74].
The results demonstrated dramatic improvements:
- Maximum signal output increased up to 30-fold
- Dynamic range improved by >500-fold
- Sensitivity increased by >1500-fold
- Sensing range expanded by approximately 4 orders of magnitude
The DoE approach also enabled modulation of the dose-response curve slope, creating biosensors with both digital (switch-like) and analog (graded) response modalities suitable for different applications [74].
Cell-Based Bioassay for Neutralizing Antibodies
In developing a cell-based bioassay for detecting anti-drug neutralizing antibodies, researchers employed DoE to characterize, optimize, and validate the assay [76]. They evaluated multiple parameters including cell number, serum matrix percentage, drug concentration, cross-linker concentration, and various incubation times [76].
Through three sequential DoE studies (two for optimization, one for validation), the team thoroughly understood how assay parameters individually and interactively affected performance. This systematic approach enabled identification of key parameters, definition of operating ranges, and ultimately yielded a robust, sensitive assay with significantly reduced development time compared to traditional approaches [76].
Table 3: Research Reagent Solutions for Biosensor Optimization
| Reagent/Material | Function in Biosensor Development | Application Examples |
|---|---|---|
| Enzymes (e.g., Glucose Oxidase) [2] | Bioreceptor that catalyzes specific reactions | Enzyme-based electrochemical biosensors |
| Antibodies [9] | Bioreceptor for specific antigen recognition | Immunosensors for protein detection |
| Aptamers [9] | Synthetic nucleic acid-based bioreceptors | Aptasensors for small molecules |
| Allosteric Transcription Factors [74] | Biological sensing elements in whole-cell biosensors | Detection of metabolic intermediates |
| Gold Nanoparticles [2] | Signal amplification, transducer enhancement | Colorimetric and electrochemical biosensors |
| Carbon Nanotubes [2] | Transducer element with high surface area | Electrochemical biosensing platforms |
| Quantum Dots [2] | Fluorescent labels for optical detection | FRET-based biosensing systems |
| Cross-linking Reagents | Immobilization of bioreceptors on transducer surfaces | Covalent attachment of antibodies to electrodes |
Practical Implementation Guide
Designing Your First DoE for Biosensor Optimization
Define Clear Objectives: Specify which Critical Quality Attributes (sensitivity, selectivity, dynamic range) require optimization and establish measurable metrics for each [72].
Assemble Multidisciplinary Team: Include expertise in biology (bioreceptor function), chemistry (surface modification), and engineering (transducer operation) [72].
Identify Potential Factors: Brainstorm all factors that might influence biosensor performance, then use risk assessment to prioritize [72].
Select Appropriate Design: Choose screening designs when exploring many factors (>5) and optimization designs when working with few critical factors (2-4) [73] [72].
Establish Experimental Ranges: Set factor ranges based on scientific knowledge and practical constraints—sufficiently wide to detect effects but not so extreme as to cause system failure [73].
Randomize Run Order: Conduct experiments in randomized sequence to minimize confounding from external variables [73].
Analyze and Iterate: Use statistical analysis to identify significant effects, then refine models through additional experiments if needed [73].
Figure 2: Critical Factors in Bioreceptor-Transducer Integration. Successful biosensor development requires optimizing multiple interacting factors at the bioreceptor-transducer interface.
Statistical Analysis Fundamentals
DoE relies on linear regression to model the relationship between factors and responses [73]. The general model form for a two-factor system is:
Y = b₀ + b₁X₁ + b₂X₂ + b₁₂X₁X₂
Where:
- Y is the predicted response
- b₀ is the intercept (overall average)
- b₁ and b₂ represent the main effects of factors X₁ and X₂
- b₁₂ represents the interaction effect between X₁ and X₂ [73]
Statistical significance is typically determined using analysis of variance (ANOVA), with p-values <0.05 indicating significant effects [75]. Model adequacy is checked by examining residuals (differences between predicted and observed values) and calculating the coefficient of determination (R²) [73].
The systematic application of Design of Experiments represents a paradigm shift in biosensor optimization, moving beyond the limitations of one-variable-at-a-time approaches. By simultaneously varying multiple factors and quantitatively analyzing their individual and interactive effects, researchers can efficiently navigate complex experimental spaces to identify truly optimal conditions for bioreceptor-transducer systems. The resulting biosensors demonstrate enhanced performance, greater robustness, and more predictable manufacturing—critical advantages for drug development, diagnostic applications, and environmental monitoring. As the field advances toward increasingly complex multiplexed and point-of-care biosensing platforms, DoE methodology will play an increasingly vital role in accelerating development while ensuring reliability and performance.
Biosensors are analytical devices that revolutionize healthcare, environmental monitoring, and biomedical research by providing rapid, sensitive, and selective detection of target analytes. The core functionality of any biosensor hinges on two fundamental components: the bioreceptor and the transducer [30] [77]. The bioreceptor is a biological recognition element (such as an enzyme, antibody, nucleic acid, or lectin) that interacts specifically with the target analyte (e.g., a glucose molecule, virus, or cancer biomarker) [30] [58]. This interaction produces a physicochemical change, which the transducer then converts into a measurable quantitative signal, typically electrical or optical [30] [77].
The performance of this signal transduction is profoundly influenced by the material properties of the substrate upon which the biosensor is fabricated. The substrate forms the physical backbone of the sensor, supporting the bioreceptor and transducer, and its characteristics—such as electrical properties, thermal stability, and flexibility—directly impact the sensor's sensitivity, stability, and applicability [78] [79]. Among the plethora of materials available, silicon, polyethylene terephthalate (PET), and polyethylene naphthalate (PEN) have emerged as critical substrates, each offering a unique set of advantages for different biosensing paradigms. This review provides an in-depth technical evaluation of these three materials, focusing on their role in enhancing transducer performance within modern biosensing research and drug development.
Fundamental Principles of Biosensor Operation
A biosensor operates through a coordinated sequence of events: (1) the selective binding of the target analyte to the immobilized bioreceptor, and (2) the transduction of this binding event into a measurable signal [58]. Transducers can be broadly classified based on their operating principle.
- Electrochemical Transducers measure electrical changes—such as current (amperometry), potential (potentiometry), or impedance (impedimetry)—resulting from biochemical reactions at an electrode surface [30]. For instance, the oxidation of glucose by the enzyme glucose oxidase generates a measurable current proportional to glucose concentration.
- Optical Transducers detect changes in light properties, including absorbance, fluorescence, or surface plasmon resonance (SPR), caused by the analyte-bioreceptor interaction [30] [79].
- Field-Effect Transistor (FET) Based Transducers utilize a semiconductor channel whose conductance is modulated by the electric field generated when charged analyte molecules bind to the gate surface [78] [80]. This makes them exceptionally sensitive for detecting biomarkers.
The following diagram illustrates the core architecture and signal transduction pathway of a generic biosensor.
Critical Substrate Properties for Transducer Performance
The choice of substrate material is paramount, as its properties directly dictate the efficiency and reliability of the signal transduction process. Key properties to consider include:
- Electrical Properties: For electrochemical and FET-based transducers, high charge-carrier mobility and good conductivity are crucial for high sensitivity and fast response times [78].
- Thermal Stability: The substrate must withstand fabrication processes (e.g., thermal oxidation, sintering) and operational environments without degrading. This is vital for sensor longevity and signal stability [78] [81].
- Flexibility and Mechanical Strength: For wearable biosensors and applications requiring conformal contact with biological tissues, mechanical robustness and flexibility are essential [80] [79].
- Chemical Resistance: Resistance to hydrolysis and corrosion from biological fluids (e.g., sweat, serum) ensures the sensor's structural integrity and performance in real-world conditions [81] [82].
- Surface Chemistry and Biocompatibility: The substrate surface must allow for efficient and stable immobilization of bioreceptors while minimizing non-specific adsorption of other molecules (biofouling) [78].
- Cost and Fabrication Scalability: The economic viability and ease of manufacturing, including compatibility with standard microfabrication techniques, are critical for widespread adoption and commercialization [78] [81].
In-Depth Analysis of Substrate Materials
Silicon
Silicon is the cornerstone of modern electronics and has been extensively adopted for high-performance biosensors, particularly FET-based transducers.
Key Properties and Advantages: Silicon's exceptional electrical properties, including high charge-carrier mobility, make it ideal for transducers that rely on electrical signal modulation [78]. It exhibits outstanding thermal stability, allowing it to endure high-temperature fabrication processes like thermal oxidation and chemical vapor deposition [78]. Furthermore, its well-established, scalable microfabrication processes (e.g., photolithography, etching) enable the creation of highly sensitive nanostructures such as silicon nanowires (SiNWs) that maximize the surface-to-volume ratio for enhanced sensitivity [78].
Role in Transducer Performance: In SiNW-FET biosensors, the silicon substrate itself forms the semiconducting channel. Binding of a charged target analyte to the SiNW surface effectively modulates the channel's conductance, translating a biological event directly into an ultrasensitive electrical readout with a low limit of detection (LOD) [78]. Silicon's rigidity and stability also provide a robust platform for optical transducers like interferometers and porous silicon-based devices, where its precise etchability allows for the creation of photonic structures that transduce binding events into sharp optical resonance shifts [78].
Common Fabrication Protocols:
- Silicon Nanowire (SiNW) FET Fabrication: A common "top-down" approach involves using a silicon-on-insulator (SOI) wafer. Photolithography and reactive ion etching (RIE) define the nanowire patterns. Thermal oxidation grows a thin, uniform oxide layer on the nanowire surface, which serves as the dielectric and functionalization site. Metal contacts (e.g., gold) for source and drain electrodes are then deposited via electron-beam evaporation and lift-off processes [78].
- Porous Silicon for Optical Biosensing: This typically involves the electrochemical etching of a silicon wafer in a hydrofluoric (HF) acid-based electrolyte. Precise control over the current density and etching time allows for the formation of a porous layer with a specific porosity and thickness, creating a photonic crystal that reflects light at a specific wavelength [78].
Polyethylene Terephthalate (PET)
PET is a thermoplastic polymer widely used for its cost-effectiveness and decent mechanical properties, making it a popular choice for flexible and disposable biosensors.
Key Properties and Advantages: PET's primary advantage is its low cost, making it suitable for mass production of single-use, point-of-care diagnostic sensors [81] [79]. It offers good dimensional stability under normal conditions and sufficient transparency for colorimetric and fluorescent optical transduction methods [79]. While not as robust as silicon, PET provides adequate flexibility for many wearable and static flex applications [81].
Role in Transducer Performance: PET is extensively used as a substrate for printed electrochemical electrodes. In these devices, conductive inks (e.g., carbon, silver/silver chloride) are printed onto PET to form working, counter, and reference electrodes. The PET substrate provides mechanical support and electrical insulation. Its flexibility allows these electrodes to be integrated into wearable patches for monitoring biomarkers in sweat or other biofluids [79]. Its optical clarity also makes it suitable for microfluidic and colorimetric detection systems incorporated into flexible sensing platforms [79].
Common Fabrication Protocols:
- Screen-Printing of Electrodes on PET: The PET substrate is first cleaned with solvents. A screen with the designed electrode pattern is aligned over the PET. Conductive ink is forced through the screen using a squeegee. The printed electrodes are then cured in an oven at a moderate temperature (typically below 150°C, the heat resistance limit of PET) to solidify the ink and ensure good adhesion [79].
- Laser Ablation for Microfluidics: A laser cutter/engraver can be used to ablate microfluidic channels directly into a PET sheet. A second PET layer with inlet/outlet ports is then thermally or adhesively bonded to seal the channels, creating a disposable lab-on-a-chip device for sample handling and analysis [79].
Polyethylene Naphthalate (PEN)
PEN is a high-performance polyester that occupies a middle ground between PET and polyimide, offering better thermal and mechanical properties than PET at a more accessible cost than silicon or polyimide.
Key Properties and Advantages: PEN offers superior thermal resistance compared to PET, with a continuous use temperature of up to ~180°C, allowing it to better withstand soldering and other processing steps [81] [82]. It demonstrates excellent dimensional stability with very low shrinkage, which is critical for maintaining the alignment and integrity of microfabricated features [82]. It also possesses higher chemical resistance and mechanical strength than PET [81] [82].
Role in Transducer Performance: PEN's enhanced thermal stability makes it a suitable flexible substrate for more durable electrochemical sensors and for flexible organic field-effect transistors (OFETs). Its ability to maintain performance under moderate thermal stress improves the reliability and longevity of the transducer. The combination of good flexibility, thermal properties, and chemical resistance allows PEN to be used in harsher environments, such as in automotive or industrial biosensing applications, where PET might fail [81] [82].
Common Fabrication Protocols:
- Photolithography on PEN: Similar to processes on silicon but at lower temperatures. A photoresist is spin-coated onto the PEN substrate, which is then soft-baked. UV light exposure through a photomask transfers the circuit pattern. After development, metal layers (e.g., Au, Pt) can be deposited via sputtering or evaporation, followed by a lift-off process to define the electrodes. The entire process must carefully control thermal budgets to avoid damaging the PEN film [81] [82].
- Fabrication of Flexible OFETs: Gate, source, and drain electrodes are patterned on a PEN substrate. An organic semiconductor layer (e.g., pentacene, P3HT) is deposited via thermal evaporation or solution processing. A dielectric layer is then added. The use of PEN enables a fully flexible device that can transduce biological binding events into electrical signals while being bent or conformed to a surface [82].
Comparative Analysis of Material Properties
Table 1: Quantitative comparison of key properties for silicon, PEN, and PET substrates.
| Property | Silicon | PEN | PET |
|---|---|---|---|
| Max Continuous Temperature | > 600°C (process dependent) [78] | ~180°C [81] | ~150°C [81] |
| Tensile Strength | High (but brittle) | 38 kpsi [82] | 32 kpsi [82] |
| Flexibility | Rigid / Brittle | Good | Moderate [81] |
| Dielectric Properties | Excellent (tunable via doping) | Good [82] | Good [79] |
| Chemical Resistance | High (but etched by strong bases) | Good [81] | Average [81] |
| Optical Transparency | Opaque (can be made porous) | Transparent to Opaque | Transparent [79] |
| Relative Cost | High | Medium | Low [81] |
Table 2: Suitability of substrates for different transducer types and applications.
| Transducer / Application | Silicon | PEN | PET |
|---|---|---|---|
| FET / SiNW Biosensors | Excellent [78] | Fair (for OFETs) | Poor |
| Electrochemical Sensors | Good | Good | Excellent (for disposable) [79] |
| Optical Sensors (e.g., Colorimetric) | Fair (porous Si) | Good | Excellent [79] |
| Wearable / Flexible Sensors | Poor | Good | Good (for low-flex) [81] |
| High-Temperature Processing | Excellent | Fair | Poor |
| Point-of-Care / Disposable | Poor | Fair | Excellent |
The Scientist's Toolkit: Research Reagent Solutions
Table 3: Essential materials and reagents for biosensor fabrication and experimentation.
| Item | Function | Example Application |
|---|---|---|
| Silicon-on-Insulator (SOI) Wafers | Provides the base substrate for fabricating high-performance, isolated silicon nanostructures like nanowires. | SiNW-FET biosensor fabrication [78]. |
| Photoresist (e.g., SU-8, AZ系列) | A light-sensitive polymer used in photolithography to transfer micro/nano-scale patterns onto a substrate. | Defining electrode channels or semiconductor layers on silicon, PEN, or PET [78]. |
| Conductive Inks (Carbon, Ag/AgCl) | Form the conductive traces and electrodes (working, counter, reference) on flexible substrates. | Screen-printing electrochemical sensors on PET or PEN films [79]. |
| Bioreceptors (Antibodies, Aptamers, Lectins) | The biological recognition element that provides selectivity by binding specifically to the target analyte. | Immobilization on transducer surfaces (e.g., SiNW, electrode) for specific detection [30] [58]. |
| Cross-linkers (e.g., Glutaraldehyde) | Chemicals that create covalent bonds between bioreceptor molecules and functionalized transducer surfaces. | Stabilizing the immobilization layer of enzymes or antibodies on a substrate [58]. |
| Polydimethylsiloxane (PDMS) | An elastomer used for constructing microfluidic channels and soft, flexible device encapsulation. | Creating sweat collection and routing channels in wearable skin sensors [79]. |
Advanced Fabrication Workflow and Integration
The fabrication of a biosensor involves a multi-step process that integrates substrate processing, transducer formation, and bioreceptor immobilization. The following diagram outlines a generalized fabrication workflow for a FET-based biosensor, highlighting key steps where substrate choice is critical.
The selection of an appropriate substrate material—silicon, PET, or PEN—is a fundamental decision in biosensor design that directly dictates transducer performance and practical application. Silicon remains unmatched for ultra-sensitive, lab-based diagnostic platforms leveraging FET transduction, where its superior electrical properties and nanoscale fabrication capabilities are paramount. PET is the material of choice for low-cost, high-volume disposable sensors and simple flexible electronics, particularly in consumer health monitoring and point-of-care testing. PEN effectively bridges the performance gap, offering a robust and thermally stable yet flexible platform for more demanding electrochemical and optical biosensors that require reliability beyond PET's capabilities without the cost and rigidity of silicon.
Future developments will likely focus on the hybrid integration of these materials, combining the high performance of silicon islands on flexible PEN substrates, for instance, to create next-generation wearable diagnostic systems. Furthermore, the continued advancement in nanostructuring and surface functionalization protocols for all three substrates will further push the limits of sensitivity, selectivity, and stability, solidifying their critical role in the evolving landscape of biosensing research and drug development.
Enhancing Signal-to-Noise Ratio and Long-Term Stability for Clinical-Grade Sensing
At the heart of any clinical-grade biosensor lies the synergistic partnership between two fundamental components: the bioreceptor and the transducer. A biosensor is defined as an integrated receptor-transducer device that converts a biological response into a quantifiable and processable signal [2] [9]. The bioreceptor is a biological or biomimetic element (such as an enzyme, antibody, nucleic acid, or whole cell) designed to interact specifically with the target analyte [51] [9]. This specific interaction, known as biorecognition, produces a physicochemical change. The transducer then converts this change into a measurable electrical, optical, or mechanical signal [4]. The performance of this duo is paramount, dictating the sensor's sensitivity, specificity, and ultimately, its clinical viability. For a biosensor to transition from a research tool to a clinical-grade device, two performance characteristics become critically important: a high Signal-to-Noise Ratio (SNR) for unparalleled accuracy and robust Long-Term Stability for reliable, continuous operation [4] [83]. This guide delves into the technical strategies and experimental methodologies to achieve these critical performance metrics.
Bioreceptor and Transducer Fundamentals
Bioreceptor Types and Selection Criteria
Bioreceptors confer the essential specificity to a biosensor. The choice of bioreceptor is dictated by the target analyte and the intended application. Common types and their characteristics are detailed below.
Table 1: Classification and Characteristics of Bioreceptors
| Bioreceptor Type | Recognition Element | Key Advantage | Common Transduction Method | Exemplary Analytic |
|---|---|---|---|---|
| Enzymatic [9] | Enzyme (e.g., Glucose Oxidase) | Catalytic amplification; reusable | Electrochemical (Amperometric) | Glucose, Urea, Lactate |
| Immunological [9] | Antibody/Antigen | Very high specificity and affinity | Optical (SPR), Piezoelectric | Pathogens, Hormones |
| Nucleic Acid-based [9] | DNA/RNA strand, Aptamer | Programmable; genetic identification | Electrochemical, Optical | Genetic markers, Viruses |
| Cellular [9] | Whole cells, Organelles | Provides functional/metabolic info | Thermal, Electrochemical | Toxicity, Stress conditions |
| Affinity Binding Protein [9] | e.g., Concanavalin A | Reversible binding; continuous monitoring | Optical (Fluorescent) | Glucose |
Transducer Mechanisms and Operational Principles
The transducer is the interface that translates the biorecognition event into an analytically useful signal. The mechanism of this signal conversion forms the primary basis for classifying biosensors.
Electrochemical Transducers: These measure electrical changes due to biorecognition events. They are subdivided into:
Optical Transducers: These detect changes in the properties of light, such as intensity, wavelength, phase, or polarization, resulting from the analyte-bioreceptor interaction. Surface Plasmon Resonance (SPR) is a prominent label-free optical technique [4].
Field-Effect Transistor (FET) Transducers: These are three-terminal devices (source, drain, gate) where the charge generated on the gate insulator surface by the binding of charged target molecules modulates the conductance of the channel between the source and drain, leading to a measurable change in current [84].
Piezoelectric Transducers: These measure the change in mass on the sensor surface by detecting the shift in the resonant frequency of a vibrating crystal (e.g., Quartz Crystal Microbalance) [4].
Thermal Transducers: These measure the enthalpy change (heat absorbed or released) during a biochemical reaction using thermistors [4].
Figure 1: The core biosensing principle shows the analyte-bioreceptor interaction leading to a physicochemical change, which is converted into a measurable signal by the transducer.
Strategies for Enhancing Signal-to-Noise Ratio (SNR)
A high SNR is crucial for detecting low-abundance analytes in complex clinical matrices like blood or saliva. It ensures that the signal from the target binding is distinguishable from background interference.
Transducer Design and Operational Regime
The fundamental design and operating point of the transducer are primary determinants of SNR.
Subthreshold Operation of Transistors: Research on carbon nanotube transistors demonstrates that the maximum SNR for biosensing is achieved when the device is operated in the subthreshold regime, not at the peak transconductance. In the ON-state, additional noise contributions can reduce the SNR by up to a factor of 5. Operating in the subthreshold regime minimizes these noise sources, optimizing the overall SNR [85].
Signal Amplification via Organic Electrochemical Transistors (OECTs): A groundbreaking method involves integrating biofuel cells (enzymatic or microbial) with OECTs. This configuration can amplify weak electrical signals by three orders of magnitude (1,000 to 7,000 times), far exceeding traditional amplification techniques (typically 10-100 times). The OECT acts as a signal amplifier, while the fuel cell provides the specific biorecognition and initial signal generation. This separation allows for independent optimization, leading to dramatically improved SNR with low power consumption, making it ideal for wearable sensors [86].
Nanomaterial-Enhanced Transduction: The integration of nanomaterials is a powerful strategy for SNR enhancement. Nanomaterials like carbon nanotubes, graphene, and metal nanoparticles increase the active surface area for bioreceptor immobilization, facilitate electron transfer in electrochemical sensors, and can themselves act as transducers. This leads to a larger response signal (increased signal) and often a lower background (reduced noise), collectively boosting the SNR [2] [17].
Experimental Protocol: OECT-Fuel Cell Integration for SNR Enhancement
This protocol outlines the methodology for creating a high-SNR biosensing platform by integrating an OECT with a microbial fuel cell for the detection of a target like arsenite [86].
Preparation of the Bio-Recognition Element:
- Genetically engineer Escherichia coli bacteria to incorporate an arsenite-responsive extracellular electron transfer pathway. This modifies the bacteria's metabolism so that electron flow to the external environment becomes dependent on the presence of arsenite.
Fabrication of the OECT:
- Use photolithography to pattern interdigitated source and drain electrodes (e.g., gold) on a solid substrate.
- Spin-coat a channel of semiconducting polymer (e.g., PEDOT:PSS) between the electrodes.
- Encapsulate the device, leaving the channel and a separate gate electrode exposed to the electrolyte.
Assembly of the Microbial Fuel Cell (MFC):
- Immobilize the engineered E. coli on the anode of the fuel cell.
- Use a standard electrolyte medium that supports bacterial viability.
System Integration and Measurement:
- Electronically connect the MFC's output to the gate terminal of the OECT (cathode-gate configuration is reported to be most effective [86]).
- Expose the MFC to a sample containing arsenite. The bacterial metabolism generates a small current proportional to the arsenite concentration.
- This small current gates the OECT, which acts as an amplifier. The resulting change in the OECT's drain current is the amplified output signal.
- Measure the drain current and compare it to the signal obtained from the MFC alone to calculate the amplification factor and assess the SNR improvement.
Table 2: Quantitative Signal Amplification Factors of OECT Configurations
| OECT Configuration | Amplification Factor | Key Advantage | Noted Challenge |
|---|---|---|---|
| Cathode-Gate [86] | 1,000 - 7,000 x | Highest amplification; optimal performance with specific polymers | - |
| Anode-Gate [86] | Up to 1,000 x | Effective signal amplification | Irreversible degradation at higher fuel cell currents |
| Traditional Amplification [86] | 10 - 100 x | Established, simple circuitry | Limited gain for very weak signals |
Figure 2: OECT signal amplification workflow shows how a small current from a biorecognition event is amplified into a large, measurable signal.
Strategies for Ensuring Long-Term Stability
Long-term stability is a prerequisite for biosensors used in continuous monitoring applications, such as implantable devices or those intended for prolonged point-of-care use. The key challenge is maintaining consistent performance of both the bioreceptor and transducer over days or weeks in complex biological environments.
Interface Stabilization and Coating Technologies
The sensor-electrolyte interface is a primary site of degradation. Protecting this interface is critical for stability.
Barrier Coatings with 2D Nanomaterials: The long-term stability of silicon-based Field-Effect Transistor (FET) biosensors in aqueous, ionic environments (like phosphate-buffered saline or body fluids) can be significantly improved by applying a reduced Graphene Oxide (rGO) coating on the gate insulator. The rGO forms a defect-free, two-dimensional barrier that prevents the invasion of cations from the solution into the gate insulator, which can cause device drift and failure. This coating can be applied simply by dropping GO suspension onto an aminosilane (e.g., APS)-functionalized surface, followed by thermal reduction to rGO [84].
Biocompatible Material Integration: For wearable and implantable sensors, material biocompatibility is essential for both stability and user safety. This involves:
- Mechanical Biocompatibility: Using low-modulus, flexible, and stretchable materials (e.g., PDMS, polyimide) in "island-bridge" or serpentine layouts ensures the device can withstand bodily movements without fracture or delamination, maintaining stable electrical contact [83].
- Immune Biocompatibility: Employing materials that do not provoke an immune response or inflammation is vital. Natural biomaterials like chitosan and synthetic hydrogels are increasingly used for their skin-friendly and low-toxicity properties, enabling long-term deployment on or in the body [83].
Bioreceptor Immobilization and Preservation
The activity and stability of the immobilized bioreceptor directly define the functional lifetime of the biosensor.
Advanced Immobilization Techniques: Moving beyond simple physical adsorption, methods like covalent binding to self-assembled monolayers (SAMs) or entrapment within stable polymer matrices provide more robust and oriented immobilization. This reduces leaching and denaturation of the bioreceptor, thereby enhancing operational stability [4].
Storage in Ready-to-Use Conditions: To ensure biosensors are ready for immediate use, they can be stored in a hydrated state in appropriate buffers. The aforementioned rGO coating, for instance, allows FET biosensors to be stored in solution for extended periods (e.g., 7 days) without significant degradation of semiconductor characteristics, preserving the activity of pre-immobilized antibodies [84].
Experimental Protocol: rGO Coating for FET Stability
This protocol details a specific method to enhance the long-term stability of a silicon-based FET biosensor for operation in physiological conditions [84].
Surface Functionalization:
- Start with a standard silicon FET with a SiO₂ gate insulator.
- Clean the surface with an oxygen plasma treatment.
- Vapor-phase silanization: Expose the FET chips to 3-aminopropyltriethoxysilane (APTES) vapor at 70°C for 2 hours to form an aminopropylsilane (APS) monolayer on the SiO₂ surface.
Graphene Oxide (GO) Deposition:
- Drop-cast a 2 mg/mL aqueous dispersion of Graphene Oxide onto the APS-functionalized FET surface.
- Incubate for 20 minutes at room temperature. The negatively charged GO sheets electrostatically adsorb to the positively charged APS layer.
- Rinse gently with deionized water to remove loosely bound GO and blow-dry with nitrogen.
Reduction to rGO:
- Thermally reduce the GO-coated FETs at 200°C for 1 hour in an inert atmosphere (e.g., nitrogen or argon). This process converts GO into the more stable and conductive rGO, enhancing its barrier properties.
Stability Assessment:
- Immerse the functionalized FETs in phosphate-buffered saline (1x PBS, pH 7.4) at 37°C to simulate physiological conditions.
- Periodically (e.g., on days 0, 1, 3, 7) measure the transfer characteristics (drain current Id vs. gate voltage Vg) of the FET.
- Quantify the stability by calculating the variability rate of the transconductance (gm = ΔId/ΔVg) over time. A lower variability rate indicates superior long-term stability. Studies show that APS/rGO-coated FETs retain stable characteristics for over a week, a significant improvement over uncoated or only APS-coated devices [84].
The Scientist's Toolkit: Essential Reagents and Materials
Table 3: Key Research Reagent Solutions for Enhanced SNR and Stability
| Reagent/Material | Function/Application | Key Benefit | Reference |
|---|---|---|---|
| Organic Electrochemical Transistors (OECTs) | Signal amplification platform | Amplifies weak bioelectronic signals by 1000-7000x; low power. | [86] |
| Reduced Graphene Oxide (rGO) | Barrier coating for FET biosensors | Prevents cation invasion; enables long-term aqueous stability. | [84] |
| Aminopropylsilane (e.g., APTES) | Surface functionalization | Provides amine groups for electrostatic GO attachment and biomolecule immobilization. | [84] |
| Engineered Microbial Strains | Living bioreceptor element | Provides metabolic response to specific analytes (e.g., arsenite). | [86] |
| Flexible Polymer Substrates (e.g., PDMS, PI) | Conformable base for wearables | Provides mechanical biocompatibility and comfort for skin contact. | [83] |
| Noble Metal Nanoparticles (e.g., Gold NPs) | Nanomaterial transducer | Enhances electrical conductivity and surface area for signal amplification. | [2] [17] |
Achieving clinical-grade performance in biosensing is a multifaceted engineering challenge centered on optimizing the bioreceptor-transducer partnership. As detailed in this guide, enhancing the Signal-to-Noise Ratio through strategic transducer operation, nanomaterial integration, and powerful amplification technologies like OECTs, directly addresses the need for high sensitivity and low detection limits. Concurrently, ensuring Long-Term Stability through protective barrier coatings, advanced bioreceptor immobilization, and biocompatible device design is non-negotiable for reliable, continuous monitoring. The experimental protocols and material solutions provided offer a tangible roadmap for researchers and scientists to reform next-generation healthcare with robust, precise, and stable biosensing technologies.
Validation Frameworks and Comparative Analysis of Biosensor Technologies
Biosensing technology fundamentally relies on the specific interaction between a bioreceptor and a target analyte, with a transducer converting this biological event into a quantifiable signal [2] [9]. This whitepaper examines established assay methodologies within this framework, using the enzyme-linked immunosorbent assay (ELISA) as a benchmark for evaluating performance in diagnostic and research applications. ELISA exemplifies the core biosensing principle, incorporating an antibody as the bioreceptor and an enzyme-mediated color change as the transduction method [87]. Understanding this bioreceptor-transducer relationship is crucial for researchers and drug development professionals to effectively benchmark existing technologies, push the boundaries of detection sensitivity, and develop next-generation assays for precision medicine [2] [88].
The evolution of biosensors provides critical context for this benchmarking exercise. The first 'true' biosensor was an oxygen electrode developed by Leland C. Clark, Jr. in 1956 [1]. The subsequent demonstration of an amperometric enzyme electrode for glucose detection in 1962 paved the way for the development of ELISA by Engvall and Perlmann in 1971 [2] [87] [1]. This established the foundational model for immunoassays that remains relevant today, even as novel biosensing platforms emerge.
Core Biosensing Components: Bioreceptors and Transducers
Bioreceptor Elements
The bioreceptor is the molecular recognition element that confers specificity to the biosensing system. It is designed to interact selectively with a target analyte among a matrix of other components [9] [1]. The major classes of bioreceptors include:
Antibodies: These immunoglobulins provide high specificity through binding to unique antigenic epitopes. The antibody-antigen interaction is analogous to a lock and key fit, though this binding can be affected by assay conditions such as pH and temperature [9]. Immunosensors utilizing this interaction form the basis of ELISA technology [87].
Enzymes: Enzymatic bioreceptors utilize catalytic activity for analyte recognition through mechanisms including substrate conversion, enzyme inhibition/activation by the analyte, or monitoring property changes from analyte interaction [9]. A key advantage is that enzymes are not consumed in reactions, enabling continuous sensing, though sensor lifetime is limited by enzyme stability [9].
Nucleic Acids: Genosensors employ complementary base pairing (adenine:thymine, cytosine:guanine in DNA) for recognition, while aptasensors use engineered oligonucleotides (aptamers) that fold into specific structures for target binding [9]. These can be combined with nucleic acid enzymes like DNAzymes, providing both recognition and signal generation in a single molecule [9].
Cellular and Tissue Structures: Whole cells, organelles, or tissue slices can serve as bioreceptors, offering sensitivity to environmental changes and the ability to respond to diverse stimuli [9]. Cellular biosensors are particularly valuable for monitoring global parameters like toxicity and drug effects [4].
Artificial Binding Proteins: Engineered protein scaffolds address limitations of antibodies by offering smaller size (<100 amino acids), enhanced stability, absence of disulfide bonds, and efficient production in bacterial systems [9]. These are selected through display techniques like phage display and yeast display [9].
Transducer Mechanisms
The transducer serves as the signal conversion element, transforming the biorecognition event into a measurable output [2] [4]. Transduction methods are broadly categorized as follows:
Electrochemical Transducers: These measure changes in electrical properties due to biorecognition events [4]. They are further classified into:
Optical Transducers: These detect alterations in light properties including fluorescence, absorbance, or surface plasmon resonance [4]. Colorimetric detection, as used in conventional ELISA, represents a fundamental optical transduction method where enzyme-substrate reactions produce measurable color changes [89] [87].
Piezoelectric Transducers: These measure mass changes on the sensor surface through frequency variations in quartz crystal microbalances, enabling highly sensitive detection of small molecules [4].
Thermal Transducers: These detect heat generated or absorbed during biochemical reactions using calorimetric principles, allowing label-free detection [4].
The relationship between these core components is illustrated below, showing how they integrate within a complete biosensing system:
ELISA: The Established Gold Standard
Fundamental Principles and Methodology
The enzyme-linked immunosorbent assay (ELISA) represents a cornerstone analytical biochemistry technique that exploits the specificity of antibody-antigen interactions combined with enzymatic signal amplification for detection [87]. As a solid-phase enzyme immunoassay (EIA), ELISA detects the presence of a ligand (typically a protein) in liquid samples using antibodies directed against the target molecule [87]. The assay's versatility has established it as a diagnostic tool in medicine, plant pathology, biotechnology, and quality control across various industries [87].
In its most fundamental form, ELISA involves immobilizing antigens from the test sample on a surface, applying an enzyme-linked antibody that binds specifically to the antigen, and adding an enzymatic substrate that generates a detectable signal (typically a color change) [87] [90]. The key advantage of this system is the signal amplification provided by the enzyme; even minimal antibody-antigen binding can produce substantial signal through enzymatic conversion of substrate molecules [87].
The basic workflow of a sandwich ELISA, one of the most common formats, can be visualized as follows:
ELISA Formats and Applications
ELISA technology has evolved into several specialized formats, each with distinct advantages for particular applications:
Direct ELISA: Features an enzyme-linked primary antibody that binds directly to the antigen immobilized on the plate surface [87]. This format offers simplicity with fewer steps but may lack signal amplification and specificity compared to other formats.
Indirect ELISA: Utilizes an unlabeled primary antibody followed by an enzyme-conjugated secondary antibody that recognizes the primary antibody [87]. This provides signal amplification through multiple secondary antibodies binding to each primary antibody.
Sandwich ELISA: Employs a capture antibody immobilized on the plate that binds the target antigen, which is then detected by a second enzyme-linked antibody [88] [87]. This format is particularly valuable for complex samples as it minimizes cross-reactivity and enhances specificity through dual antibody recognition.
Competitive ELISA: Used for detecting small antigens with limited epitopes. The sample antigen competes with a labeled antigen for binding to a limited amount of antibody [91]. The signal is inversely proportional to the antigen concentration in the sample.
ELISA applications span multiple domains including clinical diagnostics (detection of infections, autoimmune disorders, and hormones), pharmaceutical development (drug screening), environmental monitoring, and food safety testing [88] [90]. The technique's adaptability to high-throughput screening and relatively low cost maintain its position as a preferred methodology across research and diagnostic laboratories.
Experimental Protocol: Sandwich ELISA
The following detailed protocol outlines the standard procedure for performing a sandwich ELISA, the format most commonly employed for protein biomarker detection:
1. Coating: Dilute the capture antibody in carbonate/bicarbonate buffer (pH 9.6) to a concentration typically ranging from 1-10 μg/mL. Add 100 μL per well to a 96-well microtiter plate and incubate overnight at 4°C or for 1-2 hours at 37°C [87].
2. Blocking: Remove the coating solution and wash the plate three times with PBS or Tris-buffered saline containing 0.05% Tween 20 (TBST). Add 200-300 μL of blocking buffer (1-5% BSA or casein in PBS) per well and incubate for 1-2 hours at room temperature to cover any remaining protein-binding sites [87].
3. Sample and Standard Incubation: Prepare serial dilutions of the standard antigen in appropriate matrix. Dilute test samples in assay buffer. Remove blocking solution, wash plate three times, and add 100 μL of standards or samples per well. Incubate for 1-2 hours at room temperature with gentle shaking [87].
4. Detection Antibody Incubation: Wash plate three times. Add detection antibody (typically biotin-conjugated or enzyme-linked) diluted in blocking buffer. Incubate for 1-2 hours at room temperature [87].
5. Enzyme Conjugate Incubation: For biotinylated detection antibodies, wash plate and add streptavidin-HRP conjugate diluted in blocking buffer. Incubate for 30-60 minutes at room temperature [87].
6. Signal Development: Wash plate 3-5 times. Add enzyme substrate (e.g., TMB for HRP) and incubate for 15-30 minutes until color development occurs. Stop the reaction with stop solution (e.g., sulfuric acid for TMB) [87].
7. Data Acquisition and Analysis: Measure absorbance immediately using a microplate reader at appropriate wavelengths (e.g., 450 nm for TMB). Generate a standard curve from serial dilutions and interpolate sample concentrations [87].
Table 1: Key Research Reagent Solutions for ELISA
| Reagent | Function | Typical Composition | Considerations |
|---|---|---|---|
| Coating Buffer | Immobilizes capture antibody | Carbonate/bicarbonate buffer, pH 9.6 | High pH enhances antibody adsorption to polystyrene |
| Washing Buffer | Removes unbound components | PBS or Tris with 0.05-0.1% Tween 20 | Detergent reduces nonspecific binding |
| Blocking Buffer | Covers unused binding sites | 1-5% BSA, casein, or gelatin in PBS | Prevents false positive signals |
| Assay Diluent | Dilutes standards and samples | Blocking buffer with potential serum additives | Maintains protein stability and minimizes interference |
| Enzyme Substrate | Generates detectable signal | TMB, ABTS, or OPD with hydrogen peroxide | Choice depends on required sensitivity and detection method |
Performance Benchmarking: Quantitative Comparisons
Key Performance Metrics for Biosensing Assays
Evaluating assay performance requires assessment of standardized metrics that directly impact practical utility. The most critical parameters include:
Sensitivity/Limit of Detection (LOD): The minimum analyte concentration that can be reliably distinguished from zero [4] [1]. This parameter is particularly crucial for applications requiring detection of trace biomarkers, such as early cancer detection where prostate-specific antigen (PSA) concentrations as low as 4 ng/mL must be detected [1].
Selectivity/Specificity: The ability to discriminate between the target analyte and similar substances in the sample matrix [4] [1]. This is primarily determined by the bioreceptor's affinity and is exemplified by the precise antigen-antibody interaction in ELISA [9].
Dynamic Range: The concentration interval over which the assay provides a linear response [4]. This determines the usable working range without sample dilution.
Reproducibility: The capacity to generate consistent results across replicate measurements and different production batches [2] [4]. This encompasses both precision (agreement between replicates) and accuracy (proximity to true values).
Response Time: The duration required to generate a stable signal after analyte exposure [4]. This parameter varies significantly between assay types, from minutes in rapid tests to hours in conventional ELISA.
Comparative Performance Data
Table 2: Performance Benchmarking of Conventional Assays and Emerging Technologies
| Assay Platform | Typical LOD | Assay Time | Multiplexing Capacity | Key Applications |
|---|---|---|---|---|
| Traditional ELISA [87] [90] | pg-ng/mL | 3-5 hours | Low (single-plex) | Clinical diagnostics, drug discovery, quality control |
| Enhanced ELISA (8pG cell-based) [91] | 1.5-23x improvement over traditional ELISA | Similar to traditional ELISA | Low (single-plex) | High-sensitivity protein detection, particularly with unpurified antibodies |
| Gold Nanorod LSPR [92] | Comparable to ELISA | <1 hour | Moderate | Hepatitis B detection, clinical serum/plasma samples |
| Lateral Flow Immunoassay [92] | μg/mL | 10-15 minutes | Low | Point-of-care testing, rapid diagnostics |
| Multiplexed Microarray ELISA [88] | pg-ng/mL | 3-6 hours | High (dozens to hundreds) | Biomarker panels, neurodegenerative disease research |
The data in Table 2 illustrates the performance trade-offs between established and emerging technologies. While traditional ELISA offers robust sensitivity and reproducibility, it requires extended assay times and has limited multiplexing capability. Recent enhancements, such as the poly-protein G cell-based microplates, demonstrate significant improvements in detection sensitivity while maintaining the fundamental ELISA workflow [91]. This approach increased antibody-coating capacity by 1.5-23 times compared to traditional polystyrene plates and 1.2-6.8 times compared to commercial protein G-based plates, directly translating to enhanced sensitivity [91].
Advanced ELISA Enhancement Methodology
A recent innovative approach to enhancing ELISA sensitivity utilizes poly-protein G-expressing cell-based microplates. This methodology addresses the fundamental limitation of traditional ELISA: the low binding avidity and heterogeneous orientation of capture antibodies randomly adsorbed onto polystyrene surfaces [91]. The experimental workflow for this enhanced platform proceeds as follows:
Cell-Based Microplate Fabrication:
- Engineer BALB/c 3T3 cells to stably express eight tandemly repeated Fc binding domains of protein G (8pG cells) on their surface
- Fix the 8pG cells onto microplates using standard cell culture and fixation techniques
- Verify surface expression and antibody-trapping ability via western blot and flow cytometry
Enhanced ELISA Procedure:
- Apply capture antibody directly to 8pG cell-based microplates without purification
- Incubate for 1-2 hours at room temperature to allow antibody binding to protein G domains
- Proceed with standard sandwich ELISA steps: blocking, sample incubation, detection antibody addition, and signal development
Performance Validation:
- Compare antibody-coating capacity against traditional polystyrene and commercial protein G plates using biotin-conjugated antibodies
- Assess antigen-capturing ability with model systems (e.g., anti-IFN-α sandwich ELISA, anti-CTLA4 competitive ELISA)
- Evaluate detection sensitivity with statistical analysis (student's t-test for significance)
This innovative platform demonstrated a dramatic enhancement in detection sensitivity, with the 8pG cell-based microplates showing 728-fold higher antigen-capturing ability at low antibody concentrations (0.04 μg/mL) compared to traditional plates [91]. The methodology preserves homogeneous antibody orientation through specific Fc domain binding, significantly improving antigen-binding avidity while enabling direct use of unpurified antibodies - addressing two major limitations of conventional ELISA simultaneously [91].
Emerging Technologies and Future Directions
Technological Innovations in Conventional Assays
Recent advancements have focused on addressing limitations of traditional assays while maintaining their robustness:
Nanomaterial Integration: Quantum dots provide tunable light emissions and high stability, enhancing sensitivity and enabling multiplexing in bioassays [88]. Gold nanorods exploit localized surface plasmon resonance (LSPR) for sensitive, label-free detection with applications in complex matrices like blood serum and plasma [92].
Microfluidic Automation: Platforms like the MACpro system combine robotic microfluidic handling with multicolor sensing, improving speed, sensitivity, and automation for disease diagnosis [88]. These systems enable ELISA-based detection outside traditional laboratory settings.
Multiplexing Technologies: Microarray ELISA methods now permit simultaneous detection of multiple biomarkers from minimal sample volumes [88]. These approaches are particularly valuable for comprehensive biomarker panels in complex conditions like neurodegenerative disorders.
Point-of-Care Adaptation: Lab-on-compact-disc platforms integrate ELISA procedures into automated, portable systems suitable for resource-limited settings [89]. These systems maintain high accuracy (95% sensitivity, 100% specificity for dengue detection) while significantly reducing operational complexity [89].
Comparative Analysis Framework
When evaluating assay platforms for specific applications, researchers should consider the following decision framework:
Clinical Diagnostics with Regulatory Approval: Traditional ELISA remains preferred due to established validation protocols and regulatory acceptance, despite longer processing times [90].
Research Applications Requiring Maximum Sensitivity: Enhanced ELISA platforms (e.g., 8pG cell-based) offer significant improvements in detection limits while maintaining familiar workflows [91].
Point-of-Care and Resource-Limited Settings: Lateral flow immunoassays and microfluidic adaptations provide rapid results with minimal infrastructure, though with potentially reduced sensitivity [89] [92].
Multiplexed Biomarker Discovery: Microarray-based platforms enable parallel analysis of multiple targets, though with increased complexity and cost [88].
The continued evolution of conventional assays demonstrates that established technologies like ELISA remain relevant when integrated with innovative enhancements. The fundamental bioreceptor-transducer paradigm continues to guide development, with improvements targeting enhanced sensitivity, reduced complexity, and expanded multiplexing capability. As the field advances, the benchmarking criteria established through decades of ELISA utilization provide the foundation for evaluating increasingly sophisticated biosensing platforms.
A biosensor is an analytical device that converts a biological response into a quantifiable and processable signal [1]. This sophisticated device integrates two fundamental components: a bioreceptor and a transducer. The bioreceptor is a biological or biomimetic element (e.g., enzyme, antibody, nucleic acid, cell) designed to interact specifically with the target analyte. The transducer then converts this biological interaction into a measurable output signal, typically electrical or optical [9] [1]. The performance of any biosensor is governed by its static and dynamic characteristics, including selectivity, sensitivity, reproducibility, stability, and linearity [1]. This review provides a comparative analysis of three dominant transducer platforms—electrochemical, optical, and field-effect transistor (FET)-based systems—framed within the core context of bioreceptor and transducer function in modern biosensing research.
Bioreceptors: The Foundation of Molecular Recognition
Bioreceptors confer the critical attribute of selectivity to a biosensor. They are immobilized on the transducer surface and are responsible for the specific recognition of the analyte of interest [9] [93]. The choice of bioreceptor is paramount and depends on the application, required specificity, and stability.
Table 1: Key Bioreceptor Types and Their Characteristics
| Bioreceptor Type | Recognition Principle | Key Advantages | Common Transducer Pairings |
|---|---|---|---|
| Enzymes [9] [1] | Catalytic conversion of analyte or modulation of activity by analyte. | High catalytic activity; signal amplification; reusability. | Electrochemical, Optical, FET |
| Antibodies/Antigens [9] | Specific, lock-and-key binding affinity. | Very high specificity and strong binding. | Optical (SPR), Electrochemical |
| Nucleic Acids [9] | Complementary base pairing (genosensors) or specific folding (aptamers). | Aptamers are chemically stable; design flexibility. | FET, Electrochemical, Optical |
| Whole Cells & Organelles [9] | Response to broad stimuli (e.g., toxicity, metabolites). | Can monitor complex functional responses. | Electrochemical, Optical |
| Artificial Binding Proteins [9] | Engineered protein scaffolds with specific affinity. | Small size, high stability, no disulfide bonds. | Optical, FET |
Transducer Platforms: Mechanism and Operation
The transducer is the core of the sensing platform, transforming the biorecognition event into a measurable signal. The mechanism of this signal transduction varies significantly between platforms.
Electrochemical Transducers
Electrochemical biosensors measure electrical properties arising from bioelectrochemical reactions [93]. The reaction is detected in close proximity to a working electrode, which is part of a system that typically includes a reference and a counter electrode [93]. They are categorized based on the specific electrical property measured:
- Amperometric: Measures current generated by the electrochemical oxidation or reduction of a species at a constant working electrode potential [93].
- Potentiometric: Measures the potential difference (charge accumulation) between the working and reference electrode at zero current [93].
- Impedimetric: Measures the impedance (both resistance and reactance) of the electrochemical cell, often monitoring binding-induced changes [93].
Optical Transducers
Optical biosensors detect changes in the properties of light resulting from the biorecognition event [1]. While not the primary focus of the available search results, common techniques include surface plasmon resonance (SPR), which was commercialized by Biacore in the 1990s [1], and fluorescence-based methods. These sensors often offer high sensitivity and the capability for multiplexing.
Field-Effect Transistor (FET)-Based Transducers
FET-based biosensors (Bio-FETs) represent a potent class of electrochemical sensors that leverage transistor technology [94] [80]. In a Bio-FET, the biological recognition element is immobilized on the gate region of a transistor. Charged molecules binding to this gate surface induce an electrostatic potential change, which modulates the conductance of the semiconductor channel between the source and drain electrodes [94]. This change in current (IDS) is the measurable output signal. A significant advantage of Bio-FETs is their intrinsic signal amplification, as small changes in surface potential result in large changes in current, eliminating the need for complex external circuitry [94]. The performance of FET-based biosensors in biological fluids is heavily influenced by the Debye screening effect, where ions in the solution screen the charge of the target biomarker, limiting sensitivity [80].
Comparative Analysis of Transducer Platforms
A direct, quantitative comparison of these platforms highlights their distinct advantages, limitations, and ideal application spaces.
Table 2: Comparative Analysis of Transducer Platforms
| Parameter | Electrochemical | Optical (e.g., SPR) | FET-Based |
|---|---|---|---|
| Principle | Measures current, potential, or impedance from redox reactions [93]. | Measures changes in light properties (e.g., angle, intensity) [1]. | Measures channel conductance modulated by surface charge [94]. |
| Sensitivity | High (e.g., nM to pM) [93]. | Very High (e.g., pM to fM) [1]. | Very High to Ultrahigh (fM demonstrated) [80]. |
| Selectivity | Defined by bioreceptor; can suffer from interferents. | Defined by bioreceptor; generally high. | Defined by bioreceptor; non-specific binding is a concern [95]. |
| Miniaturization & Cost | Excellent; low-cost, portable devices possible (e.g., glucose meter) [93]. | Moderate to difficult; often requires bulky, expensive equipment. | Excellent; inherent to semiconductor technology, low-cost mass production possible [94]. |
| Multi-plexing | Moderate | High | High (with array fabrication) |
| Label Requirement | Often label-free, but can use enzymatic labels. | Often requires labeling (fluorescence); SPR is label-free. | Label-free detection [94] [80]. |
| Sample Throughput | Moderate to High | High | High |
| Key Advantage | Robustness, portability, low cost [93]. | High sensitivity and multiplexing capability. | Label-free detection, high sensitivity, and intrinsic amplification [94] [80]. |
| Key Limitation | Sensitivity to pH and ionic strength [93]. | Cost and portability. | Debye screening in high ionic strength solutions [80]. |
Experimental Insight: A direct experimental comparison between a FET and a Bipolar Junction Transistor (BJT) as transducers in an otherwise identical chloride sensor demonstrated the impact of transducer choice. The BJT-based sensor showed a 20 to 2 times greater signal-to-noise ratio and a higher sensitivity (signal change of 10 times per pCl vs. 8 or less for the FET). Furthermore, the BJT sensor's calibration was independent of applied voltages, simplifying its use for mobile diagnostics [96].
Advanced Fabrication and Surface Engineering
FET Fabrication and Architectures
The fabrication of Bio-FETs typically involves standard silicon processing technology to create the transistor, followed by the exposure of the active gate site and the functionalization of that site with a sensing film and bioreceptors [94]. FETs can be classified by their gate architecture, which impacts their performance and application:
- Liquid-Gate: The most common for biosensing, where a reference electrode in the solution acts as the gate, ideal for simulating physiological environments [80].
- Top-Gate: The gate electrode is deposited on top, and can itself be functionalized for sensing [80].
- Back-Gate: Uses the silicon substrate as the gate, often resulting in a larger sensing area [80].
Signal Transduction Interfaces
A critical area of development for FET-based biosensors is the engineering of the signal transduction interface—the layer between the biological sample and the transducer channel. These interfaces are designed to enhance performance by improving specificity, increasing the signal-to-noise ratio, and overcoming limitations like the Debye length [95]. They can be categorized as:
- Chemically Synthesized Interfaces: Use functionalized polymeric membranes (e.g., molecularly imprinted polymers) to transduce interactions into electrical signals without biological receptors [95].
- Physically Structured Interfaces: Incorporate nanostructures like nanopillars or nanofilters to increase surface area or selectively filter interfering species [95].
- Biologically Induced Interfaces: Utilize immobilized enzymes, antibodies, or even living cells cultured on the gate to provide specificity [95].
The Scientist's Toolkit: Essential Research Reagents and Materials
The development and implementation of advanced biosensors rely on a suite of specialized reagents and materials.
Table 3: Key Research Reagent Solutions for Biosensor Development
| Reagent/Material | Function in Biosensing | Example Use Case |
|---|---|---|
| Ion-Sensitive Membranes (ISMs) [95] | Entrap ionophores to selectively coordinate target ions, transducing concentration into a potentiometric signal. | pH sensing, ion detection in sweat for healthcare monitoring [80]. |
| Molecularly Imprinted Polymers (MIPs) [95] | Artificial, polymeric receptors with tailor-made cavities for a specific analyte; alternative to biological receptors. | Creating stable, low-cost recognition elements for small molecules in FET sensors [95]. |
| Aptamers [9] [95] | Short, single-stranded DNA or RNA oligonucleotides that bind specific targets; used as synthetic bioreceptors. | Selective, stable recognition layer for FET and electrochemical sensors; can be combined with DNAzymes for signal generation [9]. |
| Nanohybrid Materials [97] | Combine organic/inorganic nanomaterials (e.g., AuNPs, graphene, MOFs) to enhanceelectrical properties and immobilize bioreceptors. | Used in electrochemical biosensors to increase sensitivity, stability, and electron transfer rates [97]. |
| Enzymes (e.g., Glucose Oxidase) [93] | Act as bioreceptors and catalytic signal generators, often consuming or producing a detectable species. | The core of the commercial glucose biosensor, where it catalyzes a reaction producing a measurable current [93]. |
Experimental Protocol: Fabrication and Measurement of a Liquid-Gate FET Biosensor
The following protocol outlines a generalized methodology for creating and testing a FET-based biosensor, as derived from the literature [94] [80].
Objective: To fabricate a liquid-gate FET biosensor functionalized with a specific bioreceptor (e.g., an antibody) for the label-free detection of a target protein.
Materials:
- Semiconductor wafer (e.g., Silicon, or pre-fabricated FET chips with a channel material like MoS₂ or In₂O₃).
- Photoresist and developer for lithography.
- Metal targets for deposition (e.g., Ti/Au for source/drain electrodes).
- Atomic Layer Deposition (ALD) system for gate dielectric deposition (e.g., HfO₂).
- Oxygen plasma cleaner.
- Bioreceptor solution (e.g., 100 µg/mL antibody in PBS).
- Crosslinking chemistry (e.g., EDC/NHS).
- Phosphate Buffered Saline (PBS) for washing.
- Analyte solutions of known concentration in appropriate buffer.
- Ag/AgCl reference electrode.
- Semiconductor Parameter Analyzer (e.g., Keithley 4200).
Procedure:
FET Fabrication:
- Photolithography: Pattern the source and drain electrodes on the substrate using contact lithography and a metal lift-off process [80].
- Semiconductor Deposition: Deposit the semiconductor channel material (e.g., via chemical vapor deposition for 2D materials or sputtering for metal oxides).
- Dielectric Deposition: Deposit a thin, high-quality gate dielectric layer (e.g., SiO₂/HfO₂ stack) using thermal oxidation and ALD to minimize gate leakage current [96].
- Passivation: Apply a hydrophobic passivation layer everywhere except the active gate sensing area to reduce non-specific binding [94].
Gate Surface Functionalization:
- Surface Activation: Treat the exposed gate dielectric surface with oxygen plasma to generate hydroxyl groups.
- Receptor Immobilization: Incubate the gate surface with the antibody solution. Covalent immobilization can be achieved using a crosslinker like EDC/NHS. This is followed by a blocking step (e.g., with BSA) to passivate any remaining reactive sites [80].
Electrical Characterization & Sensing Measurements:
- Setup: Mount the functionalized FET in a measurement cell. Insert an Ag/AgCl reference electrode as the liquid gate into the electrolyte solution covering the sensor [80].
- Transfer Curve Measurement: Connect the source, drain, and reference (gate) electrodes to the parameter analyzer. At a fixed drain voltage (VD, e.g., 50 mV), sweep the gate voltage (VG) and measure the drain current (IDS) to obtain the transfer characteristic of the FET [96].
- Sensing Experiment:
- a. Introduce a baseline buffer solution and record the IDS at a fixed VG and VD.
- b. Introduce the analyte solution at a specific concentration.
- c. Monitor the real-time change in IDS as the analyte binds to the immobilized antibody, causing a shift in the threshold voltage of the FET.
- d. Wash with buffer to observe reversibility (if applicable).
- e. Repeat steps a-d with increasing analyte concentrations to generate a calibration curve.
Data Analysis: The change in drain current (ΔI) or the shift in threshold voltage (ΔVth) is plotted against the logarithm of the analyte concentration. The limit of detection (LOD) can be calculated as the concentration corresponding to three times the standard deviation of the baseline noise.
The choice of transducer platform is a fundamental decision in biosensor design, dictated by the specific requirements of the application. Electrochemical sensors offer robustness and portability, optical systems provide high sensitivity and multiplexing, and FET-based platforms deliver exquisite sensitivity and miniaturization for label-free, continuous monitoring. The ongoing convergence of nanotechnology, materials science, and biotechnology is leading to the development of novel signal transduction interfaces and hybrid materials that continually push the boundaries of sensitivity, specificity, and practicality. As research overcomes challenges such as the Debye screening limitation in FETs and improves the stability of biological receptors, these transducer platforms will become even more deeply integrated into the next generation of point-of-care diagnostics, wearable health monitors, and biomedical research tools.
Diagrams
Biosensor System Architecture
Transducer Operational Principles
In biosensing research, a biosensor is defined as an integrated analytical device that combines a biological recognition element (bioreceptor) with a physicochemical transducer to detect a specific analyte [10] [1]. The bioreceptor is responsible for the selective interaction with the target molecule, while the transducer converts this biological event into a quantifiable signal [98] [2]. The commercial success of a biosensor is not solely dependent on its analytical performance but is critically governed by factors of commercial readiness: manufacturing cost, scalability of production, and seamless integration into existing user workflows. This guide details the technical evaluation of these parameters within the context of bioreceptor and transducer selection and design.
Bioreceptor Technologies: Commercial Viability
The bioreceptor confers specificity to the biosensor. Its choice profoundly impacts the device's cost, stability, and manufacturing complexity.
Types of Bioreceptors and Their Characteristics
Bioreceptors can be broadly classified into catalytic (e.g., enzymes) and affinity-based (e.g., antibodies, nucleic acids) types [10] [9].
Figure 1: Bioreceptor Classification. This diagram outlines the primary classes of bioreceptors used in biosensing, highlighting the distinction between biological and synthetic elements.
Commercial Evaluation of Bioreceptors
The selection of a bioreceptor is a trade-off between performance and commercial factors.
Table 1: Commercial Evaluation of Common Bioreceptors
| Bioreceptor | Cost & Sourcing | Stability & Shelf-Life | Scalability of Production | Key Commercial Considerations |
|---|---|---|---|---|
| Enzymes [9] | Moderate cost; readily available from biological suppliers. | Limited long-term stability; activity can degrade with time and temperature [4]. | Well-established fermentation and purification processes; highly scalable. | Ideal for single-use, disposable sensors (e.g., glucose test strips). Consumable nature drives recurring revenue. |
| Antibodies [9] [99] | High cost for high-affinity monoclonal versions; animal-dependent production. | Sensitive to denaturation; requires cold chain storage [4]. | Scalable via hybridoma or recombinant cell culture; but process is complex and costly. | High specificity is advantageous but high cost and stability issues can hinder commercial deployment, especially for point-of-care use. |
| Aptamers [10] [99] | Moderate initial R&D cost (SELEX process); chemical synthesis is cost-effective. | High stability; tolerant to wide pH and temperature ranges [9]. | Highly scalable, reproducible chemical synthesis; no batch-to-batch variation. | Very attractive for commercial scale-up. Superior stability reduces logistics costs and enables room-temperature storage. |
| Nucleic Acids (DNA probes) [99] | Low cost for short sequences; commoditized chemical synthesis. | Very high chemical stability. | Highly scalable and reproducible chemical synthesis. | The gold standard for scalability and cost for genetic tests. Ideal for high-volume manufacturing. |
| Molecularly Imprinted Polymers (MIPs) [10] [99] | Very low cost; synthetic polymers. | Extreme robustness; stable under harsh conditions. | Highly scalable using standard polymer synthesis. | Excellent for harsh environments (e.g., industrial monitoring). Affinity and specificity are generally lower than biological receptors. |
Transducer Technologies: Integration and Scalability
The transducer defines the fundamental sensing mechanism and greatly influences the form factor, readout requirements, and integration potential of the final device.
Transducer Classification and Operating Principles
Transducers are categorized based on their signal conversion mechanism [51] [2].
Figure 2: Transducer Technology Classification. This diagram shows the main types of transducers based on their signal conversion principle, which directly impacts device integration and cost.
Commercial Evaluation of Transducers
The choice of transducer dictates the complexity of the associated electronics, the manufacturing process, and the final device cost.
Table 2: Commercial Viability of Transducer Platforms
| Transducer Type | Cost & Readout Electronics | Scalability & Manufacturing | Ease of Integration | Key Commercial Considerations |
|---|---|---|---|---|
| Electrochemical [51] [4] | Low-cost electronics; simple potentiostats. | Highly scalable; compatible with screen-printing and roll-to-roll fabrication. | Excellent; ideal for miniaturization into handheld, wearable, and disposable formats [51]. | Dominates the point-of-care market (e.g., glucose meters). Low power consumption and simple electronics enable compact, low-cost devices. |
| Optical (SPR & Photonic) [1] [99] | High-cost; sophisticated instrumentation (lasers, detectors, optics). | Fabrication often requires cleanroom processes (e.g., for silicon chips), limiting scalability and increasing cost. | Low; typically benchtop instruments. Lab-on-a-chip integration is an active R&D area but remains complex. | Best suited for central lab settings or high-value research. The high sensitivity is often offset by high cost and poor portability. |
| Piezoelectric (QCM) [4] | Moderate cost; electronics for frequency measurement are more complex than basic electrochemical systems. | Batch fabrication of quartz crystals is possible but not as scalable as printed electrodes. | Moderate; systems can be miniaturized but often remain as bench-top instruments. | Excellent for label-free study of binding interactions in R&D. Less common in decentralized clinical or consumer applications. |
| Thermal (Calorimetric) [4] | Moderate cost; requires precise temperature control and measurement. | Microfabrication of thermal sensors (thermistors) is scalable. | Moderate; can be integrated into flow cells, but insulation and control can complicate miniaturization. | Niche applications where label-free detection is required and other transducer types are not suitable. |
Experimental Protocols for Commercial Assessment
Beyond basic functionality testing, specific experimental protocols are required to evaluate commercial readiness.
Protocol for Assessing Bioreceptor Immobilization Scalability
A consistent and scalable immobilization method is critical for manufacturing.
- Objective: To evaluate the reproducibility, stability, and cost-effectiveness of a bioreceptor immobilization protocol on transducer surfaces.
Materials:
- Functionalized transducer chips (e.g., gold for SPR, carbon for electrochemistry)
- Bioreceptor (e.g., antibody, aptamer)
- Cross-linkers (e.g., EDC/NHS for carboxyl groups)
- Blocking agents (e.g., BSA, ethanolamine)
- Analytical setup (e.g., SPR instrument or potentiostat)
Methodology:
- Surface Functionalization: Activate the transducer surface to present reactive groups (e.g., carboxyl, amine). A standardized protocol (e.g., thiol-gold self-assembled monolayers) should be used [99].
- Immobilization: Apply the bioreceptor to the surface using a defined method (e.g., pipetting, inkjet printing). Chemisorption (e.g., of thiolated DNA) is often more robust than physisorption [99].
- Quenching and Blocking: Deactivate remaining reactive groups and block the surface to minimize non-specific binding.
- Quality Control: Measure the density and activity of the immobilized bioreceptor. For example, use the initial binding rate in SPR to assess active concentration [99]. This test must be performed across multiple batches (n≥5) to assess reproducibility.
- Stability Testing: Store the functionalized sensors under accelerated aging conditions (e.g., 37°C) and monitor activity loss over time to predict shelf-life.
Protocol for Manufacturing Cost Analysis
A bottom-up cost model is essential for go/no-go decisions.
- Objective: To estimate the Bill of Materials (BOM) and Cost of Goods Sold (COGS) for the biosensor at scale.
- Materials & Workflow:
- Component Listing: List every component (bioreceptor, transducer substrate, membranes, plastics, electronics).
- Material Costing: Obtain quotes from multiple suppliers for each component at volumes of 10,000, 100,000, and 1,000,000 units to understand economies of scale.
- Assembly Costing: Break down the assembly process into steps (e.g., surface modification, dispensing, lamination, packaging). Estimate the time and labor cost per step.
- Yield Analysis: Incorporate the measured yield from reproducibility testing (Protocol 4.1) into the cost model. A 90% yield versus a 70% yield dramatically impacts unit cost.
- Overhead Allocation: Add costs for facility, utilities, quality control, and packaging.
The Scientist's Toolkit: Key Research Reagent Solutions
Selecting the right materials and reagents is fundamental for developing a commercially viable biosensor.
Table 3: Essential Research Reagents and Their Functions in Biosensor Development
| Reagent / Material | Function in Development | Commercial Readiness Consideration |
|---|---|---|
| Thiolated DNA Probes / Aptamers [99] | Enable robust, oriented immobilization on gold transducer surfaces (e.g., in SPR or electrochemical sensors). | Chemical synthesis is highly scalable and reproducible, making this a commercially attractive immobilization strategy. |
| EDC/NHS Chemistry [99] | A common cross-linking system for covalently immobilizing proteins (antibodies, enzymes) onto carboxyl-functionalized surfaces. | Cost-effective and effective, but the reaction must be tightly controlled in manufacturing to ensure consistent bioreceptor activity. |
| Mercaptohexanol (MCH) [99] | Used as a backfiller and spacer molecule on gold surfaces with thiolated receptors to reduce non-specific binding and improve orientation. | Inexpensive and widely available. Its use is a simple yet critical step for enhancing signal-to-noise ratio. |
| Anti-fouling Coatings (e.g., PEG derivatives) [99] | Polymer coatings applied to the sensor surface to minimize non-specific adsorption of proteins from complex samples (e.g., blood, serum). | Critical for analytical performance in real-world samples. The cost and stability of the coating must be validated for mass production. |
| Screen-Printed Electrodes (SPEs) [51] | Mass-producible, disposable electrochemical transducer platforms. | The low cost and disposability of SPEs make them the foundation of the multi-billion dollar point-of-care diagnostics industry. |
| Microfluidic Chips (e.g., PDMS, PMMA) [14] | Manipulate small fluid volumes for sample preparation and delivery to the sensor. | Integration of microfluidics is key for automating assays and improving usability, impacting scalability and integration into workflows. |
Evaluating the commercial readiness of a biosensing technology requires a holistic look beyond the laboratory bench. The interplay between the bioreceptor's cost and stability and the transducer's integration feasibility and manufacturing scalability ultimately determines the path to market. A technology using a low-cost, stable aptamer immobilized on a mass-producible electrochemical transducer platform presents a much clearer commercial trajectory than one reliant on a fragile antibody paired with a complex optical transducer. By systematically applying the evaluation frameworks for cost, scalability, and workflow integration outlined in this guide, researchers can de-risk the development process and strategically focus resources on biosensor technologies with the highest potential for real-world impact and commercial success.
A biosensor is an analytical device that integrates two core functional components: a bioreceptor and a transducer [1]. The bioreceptor is a biological recognition element (such as an enzyme, antibody, aptamer, or lectin) that specifically interacts with the target analyte [58] [77]. The transducer then converts this biological interaction into a measurable physical signal, such as an electrical or optical output [1]. For researchers and drug development professionals, validating these biosensors, particularly for use with complex biological samples like blood, serum, or urine, is paramount. This validation ensures that the device reliably detects the target analyte at clinically relevant concentrations amidst a background of interfering substances. Two of the most critical parameters in this validation are the Limit of Detection (LOD) and the Linear Range [100] [1]. The LOD defines the lowest concentration of an analyte that can be reliably distinguished from a blank sample, representing the ultimate sensitivity of the method [101]. The Linear Range establishes the concentration interval over which the sensor's response changes proportionally with analyte concentration, defining the bounds for accurate quantification [1]. Establishing these parameters in complex matrices presents a significant challenge, as sample components can interfere with bioreceptor binding, suppress the transducer signal, or increase background noise, thereby degrading analytical performance [100].
Fundamental Concepts: LOD and Linear Range
Limit of Detection (LOD)
The Limit of Detection (LOD) is a statistical parameter representing the lowest quantity of an analyte that can be reliably detected—but not necessarily quantified—by the analytical method with a defined level of confidence [101] [100]. It is fundamentally an indicator of the method's sensitivity. The LOD is distinguished from the Limit of Blank (LOB), which is the highest apparent analyte concentration observed from replicate measurements of a blank sample [100]. A reliable LOD ensures that trace-level analytes, such as low-abundance disease biomarkers, are not missed due to methodological insensitivity. The most common approach for LOD determination is based on the signal-to-noise ratio (SNR), where the signal from a low-concentration analyte is compared to the background noise level of the measurement system. An SNR of 3:1 is widely accepted for LOD estimation [101] [100].
Linear Range
The Linear Range, also referred to as the dynamic range, is the span of analyte concentrations for which the biosensor's output signal is directly proportional to the concentration [1]. This relationship is critical for accurate quantification, as it allows for the use of a simple calibration curve. The upper and lower bounds of this range are often defined by the Limit of Quantification (LOQ) at the lower end and by signal saturation at the upper end. The LOQ is the lowest concentration that can be quantitatively measured with acceptable precision and accuracy, typically defined by an SNR of 10:1 [101] [100]. A wide linear range is essential for applications where analyte concentrations can vary over several orders of magnitude, such as monitoring disease progression or drug pharmacokinetics.
Methodologies for Determining LOD and Linear Range
Calculation of LOD and LOQ via Calibration Curve
A robust and widely accepted method for determining LOD and LOQ involves the use of a calibration curve constructed with known analyte standards [102] [100]. The procedure is as follows:
- Plot a Standard Curve: Prepare a series of standard solutions at known concentrations of the analyte. Measure the biosensor's response for each standard and plot concentration (X-axis) versus response (Y-axis). The relationship should be linear within the working range [102].
- Perform Regression Analysis: Use statistical software (e.g., Microsoft Excel's Data Analysis toolpack) to perform a linear regression on the standard curve data. This analysis yields the equation of the best-fit line (y = mx + c), its slope (s), and the standard deviation of the y-intercept residuals (σ) [102].
- Apply LOD and LOQ Formulas:
- LOD = 3.3 × (σ / s)
- LOQ = 10 × (σ / s) [102]
The coefficients 3.3 and 10 are expansion factors derived from a 95% confidence level, linking the standard deviation to the minimum detectable and quantifiable signals, respectively [102] [100].
Experimental Workflow for Validation in Complex Matrices
Validating LOD and linear range in complex matrices requires additional steps to account for matrix effects. The following workflow, depicted in the diagram below, outlines a comprehensive experimental approach.
Title: Experimental Validation Workflow
The key steps involve:
- Bioreceptor and Transducer Selection: The choice (e.g., lectin for glycan recognition [30] or enzyme like pyruvate oxidase for metabolite detection [103]) dictates fundamental specificity.
- Preparation of Matrix-Matched Standards: To accurately evaluate performance, calibration standards must be prepared in the same complex matrix (e.g., serum, urine) as the real samples. This is crucial for identifying suppression or enhancement of the signal caused by the matrix [100].
- Analysis and Statistical Validation: The matrix-matched standards are analyzed, and the resulting data is used to calculate the apparent LOD and LOQ within the complex matrix, which can then be compared to values obtained in simple buffer.
Case Study: Electrochemical Lectin Biosensor for Breast Cancer Cells
To illustrate these concepts, consider the development of an electrochemical lectin-based biosensor for detecting MCF-7 breast cancer cells [30]. The bioreceptor, the lectin PHA-L, specifically recognizes glycans on the cancer cell surface. The transducer is an electrochemical platform using nitrogen-doped graphene quantum dots (NGQDs) to enhance the signal.
Experimental Protocol:
- Sensor Fabrication: Immobilize the PHA-L lectin onto the NGQD-modified working electrode surface.
- Calibration: Spike known concentrations of MCF-7 cells into a buffer or a simulated biological fluid. Measure the electrochemical response (e.g., via Electrochemical Impedance Spectroscopy, EIS) at each concentration.
- Data Analysis: Plot the sensor response (e.g., change in charge transfer resistance, Rct) against the logarithm of cell concentration. Perform linear regression on the linear portion of the curve.
- LOD Determination: Using the standard deviation of the blank (buffer) response and the slope of the calibration curve, calculate the LOD via the formula LOD = 3.3σ/s. This biosensor achieved an impressive LOD of 1 cell mL⁻¹ in phosphate-buffered saline [30].
Table 1: Performance Metrics of Selected Validated Biosensors
| Target Analyte | Bioreceptor | Transducer Method | Linear Range | LOD | Matrix | Ref |
|---|---|---|---|---|---|---|
| MCF-7 Breast Cancer Cells | Lectin (PHA-L) | Electrochemical (EIS) | Not Specified | 1 cell mL⁻¹ | PBS | [30] |
| Alanine Aminotransferase (ALT) | Pyruvate Oxidase (POx) | Amperometric | 1–500 U/L | 1 U/L | Buffer | [103] |
| Alanine Aminotransferase (ALT) | Glutamate Oxidase (GlOx) | Amperometric | 5–500 U/L | 1 U/L | Buffer | [103] |
| Viruses (ZIKV, DENV2, etc.) | Lectin (ConA) | Electrochemical (EIS) | Not Specified | 0.0382 - 0.062 pfu mL⁻¹ | Not Specified | [30] |
| 17β-Estradiol (E2) | Non-bioreceptor (MMIP) | Electrochemical | 0.06–175 μM | 0.02/0.06 μM | Milk | [58] |
The Scientist's Toolkit: Key Reagents and Materials
The successful development and validation of a biosensor rely on a suite of specialized reagents and materials. The following table details essential components for a typical electrochemical biosensor project.
Table 2: Essential Research Reagent Solutions for Biosensor Development
| Reagent/Material | Function and Importance in Development/Validation | Example from Literature |
|---|---|---|
| Bioreceptors (Antibodies, Lectins, Aptamers, Enzymes) | Provides the specific molecular recognition for the target analyte. The choice dictates the sensor's fundamental selectivity and affinity. | Lectins (ConA, PHA-L) for pathogen/cancer cell detection [30]; Pyruvate Oxidase for ALT detection [103]. |
| Electrode Materials (Gold, Platinum, Glassy Carbon, Screen-printed electrodes) | Serves as the physical platform for bioreceptor immobilization and the site for electrochemical signal transduction. | Platinum disc working electrodes used in amperometric ALT biosensors [103]. |
| Nanomaterials (Graphene Quantum Dots, Metal Nanoparticles, CNTs) | Enhances the transducer surface area and electron transfer kinetics, leading to improved sensitivity and a lower LOD. | Nitrogen-doped Graphene Quantum Dots (NGQDs) for ultrasensitive cancer cell detection [30]. |
| Immobilization Reagents (Glutaraldehyde, PVA-SbQ, BSA) | Used to covalently or physically attach the bioreceptor to the transducer surface, ensuring stability and reagent retention. | Glutaraldehyde for crosslinking GlOx; PVA-SbQ photopolymer for entrapping POx [103]. |
| Redox Mediators ([Fe(CN)₆]³⁻/⁴⁻, Ferrocene) | Facilitates electron shuttling between the biorecognition event and the electrode, often enabling measurements at lower, less interfering potentials. | Ferrocene was historically used in mediated glucose biosensors [104] [1]. |
| Blocking Agents (BSA, Casein, Ethanolamine) | Passivates unused surface areas on the transducer to minimize non-specific binding of interferents present in complex matrices. | BSA was used in the bioselective membranes for both POx and GlOx ALT biosensors [103]. |
Troubleshooting and Optimization in Complex Matrices
Complex matrices pose the greatest challenge to robust LOD and linear range determination. Key issues and mitigation strategies include:
- Matrix Effects: Components of the sample can non-specifically suppress or enhance the analytical signal, altering the calibration curve's slope and leading to inaccurate quantification [100].
- Solution: Employ the method of standard additions, where known amounts of analyte are spiked into the actual sample. This technique accounts for matrix effects directly in the quantification step. Alternatively, use extensive sample dilution, provided it does not push the analyte concentration below the LOQ.
- High Background Noise: Electroactive species (e.g., ascorbic acid, uric acid) in biological fluids can increase the background signal, thereby raising the effective LOD [104] [103].
- Solution: Incorporate protective membranes or use selective electrochemical potentials. For instance, electropolymerizing a meta-phenylenediamine (PPD) membrane on a platinum electrode creates a size-exclusion layer that permits the passage of small H₂O₂ molecules while blocking larger interferents [103].
- Non-Specific Binding (NSB): Proteins and other biomolecules can adsorb to the sensor surface, occluding the bioreceptor and causing false positives or signal suppression.
- Solution: Effective surface blocking with agents like Bovine Serum Albumin (BSA) is critical [103]. Optimizing the density of the immobilized bioreceptor can also reduce NSB.
The relationships between these challenges and the biosensor's core components are summarized below.
Title: Matrix Challenges & Solutions
The rigorous clinical and analytical validation of biosensors, with a focus on establishing the LOD and linear range within complex matrices, is a cornerstone of their translation from research tools to reliable clinical diagnostics. This process is intrinsically linked to the fundamental design of the biosensor—the careful selection of a high-affinity bioreceptor and a sensitive transducer [30] [1]. By employing systematic experimental workflows, statistical calculations, and proactive troubleshooting strategies to combat matrix effects, researchers can ensure their biosensing methods are sensitive, robust, and reproducible. As the field advances with new bioreceptors and transducing materials, the principles of validation outlined here will remain critical for developing next-generation biosensors that meet the stringent demands of drug development and personalized medicine.
A biosensor is an analytical device that integrates two core functional components: a bioreceptor and a transducer [1]. The bioreceptor is a biological or biomimetic element (e.g., enzyme, antibody, nucleic acid, cell) designed to interact specifically with a target analyte. This bio-recognition event is then converted into a measurable signal by the transducer, which can be optical, electrochemical, thermal, or piezoelectric in nature [9] [32]. The performance of a biosensor is traditionally evaluated by its selectivity, sensitivity, stability, and linearity [1]. In recent years, the field has witnessed a paradigm shift with the confluence of multiplexed detection—the simultaneous measurement of multiple analytes—and advanced Artificial Intelligence (AI) for data processing and interpretation. This integration is transforming biosensors from simple single-analyte probes into sophisticated analytical systems capable of deciphering complex biological patterns, thereby enabling earlier disease diagnosis, more comprehensive environmental monitoring, and personalized healthcare solutions [105] [106].
The traditional workflow of biosensing, while powerful, often generates complex, high-dimensional data, especially in multiplexed formats. AI, particularly machine learning (ML) and deep learning (DL), is uniquely suited to process this data, extract statistically significant patterns, and mitigate challenges such as signal noise and non-specific binding [105]. This synergy is creating a new generation of "smart" biosensors that are not only highly sensitive and specific but also capable of real-time decision-making and adaptive sensing in dynamically changing conditions [105]. This article explores how AI is revolutionizing the core components of biosensing—from enhancing the data output of transducers to intelligently interpreting the complex signals from advanced bioreceptors—with a specific focus on multiplexed detection systems.
The Biosensor Foundation: Bioreceptors and Transducers
Bioreceptors: The Specificity Element
The bioreceptor confers selectivity to the biosensor by leveraging specific biochemical interactions. Different types of bioreceptors are utilized based on the target analyte and application requirements [9].
- Antibodies: These proteins are widely used in immunosensors due to their high binding affinity and specificity for a unique epitope on an antigen. However, their application can be limited by stability under varying assay conditions and production costs [9].
- Enzymes: Enzyme-based biosensors exploit the catalytic activity and specificity of enzymes. The analyte may be a substrate, inhibitor, or modulator of the enzyme, and the reaction often produces a detectable product (e.g., electrons, protons, light) [9].
- Nucleic Acids: Genosensors use complementary DNA or RNA sequences to detect hybridization, while aptasensors employ single-stranded oligonucleotides (aptamers) that fold into specific 3D structures to bind targets with antibody-like affinity [9].
- Lectins: These carbohydrate-binding proteins are emerging as powerful bioreceptors for detecting glycans on cells and biomarkers. Their ability to recognize complex sugar patterns makes them invaluable for identifying pathogens and cancer biomarkers [30].
- Artificial Binding Proteins: Engineered protein scaffolds (e.g., affibodies, DARPins) offer advantages over antibodies, including smaller size, higher stability, and easier production, making them suitable for biosensing applications [9].
- Cells and Tissues: Whole cells or tissue sections can be used as bioreceptors, particularly for monitoring global physiological effects, such as toxicity or drug responses [9].
Transducers: The Signal Conversion Element
The transducer is the component that converts the biological recognition event into a quantifiable physical signal. The choice of transducer directly impacts the sensitivity, detection limit, and applicability of the biosensor [32].
Table 1: Common Transducer Types and Their Principles in Biosensing
| Transducer Type | Detection Principle | Common Applications |
|---|---|---|
| Electrochemical [30] [32] | Measures electrical changes from redox reactions (e.g., current, potential, impedance). | Glucose monitoring, pathogen detection, cancer biomarkers. |
| Optical [30] [32] | Measures changes in light properties (e.g., wavelength, intensity, polarization). | Surface Plasmon Resonance (SPR), fluorescence-based assays. |
| Piezoelectric [32] | Measures change in mass via frequency shift of a vibrating crystal. | Quartz Crystal Microbalance (QCM) for gas sensing and affinity studies. |
| Thermal [32] | Measures enthalpy change from biochemical reactions. | Enzyme substrate detection, metabolite monitoring. |
The following diagram illustrates the fundamental components of a biosensor and the flow of information from analyte to result, including the new role of AI in data interpretation.
AI-Driven Methodologies for Multiplexed Data Analysis
The integration of AI into biosensing is not a single tool but a suite of methodologies tailored to different data types and challenges inherent to multiplexed detection. Machine Learning (ML) algorithms excel at finding patterns in the complex, high-dimensional datasets generated by multi-analyte sensors [105].
Key Machine Learning Algorithms
- Support Vector Machines (SVM): A powerful supervised learning algorithm used for classification and regression. SVM operates by mapping input data into a high-dimensional space to find an optimal hyperplane that separates data into different classes, making it highly effective for complex, non-linear biosensor data [105].
- Random Forests (RF): An ensemble method that constructs multiple decision trees during training and outputs the mode of their classes (for classification) or mean prediction (for regression). RF reduces overfitting and improves generalization, which is crucial for robust biomarker classification from noisy sensor data [105].
- k-Nearest Neighbors (k-NN): A simple, non-parametric algorithm used for classification and regression. It assigns a data point to the class most common among its k-nearest neighbors in the feature space. While effective for complex decision boundaries, it can be computationally intensive for large datasets [105].
Deep Learning for Hierarchical Feature Extraction
Deep Learning (DL), a subset of ML based on neural networks with multiple layers, automatically learns hierarchical representations from raw data, eliminating the need for manual feature extraction [105]. This is particularly advantageous for processing raw signal streams from biosensors, such as electrochemical impedance spectroscopy or time-series data from wearables. DL architectures like convolutional neural networks (CNNs) can identify local patterns and dependencies in sensor data, while recurrent neural networks (RNNs) are suited for sequential data analysis [107] [105].
The workflow below outlines the standard process for applying these AI models to data generated by multiplexed biosensors.
Table 2: AI/ML Model Applications in Biosensor Data Analysis
| AI/ML Model | Type | Primary Use in Biosensing | Reported Advantage |
|---|---|---|---|
| Support Vector Machine (SVM) [105] | Supervised Learning | Classification of disease states from biomarker patterns. | Effective in high-dimensional spaces; robust for non-linear data. |
| Random Forest (RF) [105] | Ensemble Supervised Learning | Multiclass analyte identification; biomarker selection. | Reduces overfitting; provides high accuracy on complex datasets. |
| k-Nearest Neighbors (k-NN) [105] | Instance-based Learning | Pattern recognition in electrochemical or optical sensor arrays. | Simple implementation; effective for small to medium datasets. |
| Deep Learning (DL) [105] | Neural Networks | Processing raw signal data (e.g., ECG, spectra) for feature extraction. | Automatic feature learning; superior performance with large datasets. |
Experimental Protocols for AI-Enhanced Multiplexed Biosensing
The development and validation of an AI-integrated multiplexed biosensor require a meticulous experimental approach. The following protocol outlines a generalized workflow for creating such a system, drawing from recent advancements in the field.
Protocol: Development of an AI-Assisted Electrochemical Aptasensor for Cytokine Profiling
Objective: To simultaneously detect and quantify multiple cytokine biomarkers (e.g., IL-6, IL-8, TNF-α) from a human serum sample using a multiplexed electrochemical aptasensor, with AI-driven data analysis for concentration prediction and sample classification.
Materials and Reagents:
- Bioreceptors: DNA aptamers specific for IL-6, IL-8, and TNF-α, pre-modified with a thiol group at the 5' end and a unique redox reporter (Methylene Blue, Ferrocene, or Anthraquinone) for each analyte.
- Transducer Platform: A custom-fabricated or commercial multi-electrode array (MEA) with individually addressable gold working electrodes, an integrated Ag/AgCl reference electrode, and a platinum counter electrode.
- Chemical Reagents: 6-Mercapto-1-hexanol (MCH) for creating a mixed self-assembled monolayer, ethanolamine for blocking, and phosphate-buffered saline (PBS) as the running electrolyte.
- Instrumentation: A potentiostat capable of performing simultaneous multi-channel electrochemical impedance spectroscopy (EIS) and square-wave voltammetry (SWV).
- AI/Software: Python environment with standard data science libraries (e.g., NumPy, Pandas) and ML libraries (e.g., Scikit-learn, TensorFlow).
Procedure:
Sensor Functionalization:
- Clean the gold working electrodes on the MEA via oxygen plasma treatment and subsequent piranha solution etching (Caution: Piranha solution is highly corrosive and must be handled with extreme care).
- Spot 5 µL of each thiolated aptamer solution (1 µM in PBS) onto designated working electrodes. Incubate for 16 hours at 4°C in a humidified chamber to form a self-assembled monolayer.
- Rinse the array thoroughly with deionized water to remove non-specifically bound aptamers.
- Treat the array with 1 mM MCH for 1 hour to backfill unoccupied gold sites, creating a well-ordered and anti-fouling monolayer.
- Rinse and store the functionalized MEA in PBS at 4°C until use.
Multiplexed Electrochemical Measurement:
- Prepare standard solutions of the cytokines (IL-6, IL-8, TNF-α) in PBS or diluted human serum across a clinically relevant concentration range (e.g., 0.1 pg/mL to 100 ng/mL).
- Incubate the functionalized MEA with the sample solution (or standard) for 30 minutes at room temperature with gentle shaking.
- Perform electrochemical measurements in a solution containing a redox probe like [Fe(CN)₆]³⁻/⁴⁻.
- Record EIS spectra for each electrode (frequency range: 0.1 Hz to 100 kHz, amplitude: 10 mV) to monitor binding-induced changes in charge transfer resistance (Rₜ).
- Subsequently, run SWV for each electrode (potential window: -0.6 V to 0 V, frequency: 25 Hz) to measure the faradaic current from the specific redox reporters. The unique redox potential of each reporter allows for the simultaneous readout of all three analytes in a single voltammetric scan.
AI-Integrated Data Processing and Analysis:
- Data Pre-processing: For EIS data, extract the Rₜ value from a fitted equivalent circuit for each electrode. For SWV data, extract the peak current for each redox reporter. Compile all features (Rₜ and three peak currents) into a structured data matrix.
- Model Training:
- Regression Task: Use a Random Forest regressor to model the relationship between the extracted features and the known concentrations of the cytokines. The model will learn to predict the concentration of each cytokine from the multiplexed signal.
- Classification Task: Use a Support Vector Machine with a non-linear kernel to classify samples into diagnostic categories (e.g., "healthy" vs. "sepsis") based on the combined cytokine profile.
- Model Validation: Validate the trained models using a hold-out test set or k-fold cross-validation. Report standard performance metrics: for regression, use R² and Root Mean Square Error (RMSE); for classification, use accuracy, precision, recall, and F1-score.
The Scientist's Toolkit: Essential Reagents and Materials
The development of advanced, AI-integrated biosensors relies on a specific set of reagents and materials that enable multiplexing, enhance signal transduction, and provide robust data for AI models.
Table 3: Research Reagent Solutions for AI-Enhanced Multiplexed Biosensing
| Reagent / Material | Function | Application in AI Workflow |
|---|---|---|
| Nanomaterials (Graphene, Metal NPs, QDs) [105] [58] | Enhance signal transduction, increase electrode surface area, and enable multi-label detection. | Generates stronger, more stable signals, improving the signal-to-noise ratio for more accurate AI pattern recognition. |
| Specific Bioreceptors (Aptamers, Lectins) [30] [9] | Provide high-affinity recognition for specific targets (e.g., glycans, proteins). | Enables the creation of sensor arrays for multiplexing, generating the complex, multi-parameter datasets required for ML model training. |
| Magnetic Beads (e.g., POEGMA-coated) [108] | Solid support for immobilizing bioreceptors; minimizes non-specific binding in complex samples. | Reduces background noise and false positives in the raw data, leading to cleaner and more reliable datasets for AI analysis. |
| Redox Reporters (e.g., Methylene Blue) [58] | Produce distinct, quantifiable electrochemical signals for different analytes in a single sample. | Creates a unique "electrochemical fingerprint" for each analyte, which AI models can deconvolute for multiplexed quantification. |
| Microfluidic Chips & CMOS Sensors [108] | Automate sample handling and integrate multiple sensing modalities on a single chip. | Provides a automated, high-throughput platform for generating large, consistent datasets necessary for training robust DL models. |
Applications and Future Perspectives
The fusion of AI with multiplexed biosensing is making significant impacts across several domains. In healthcare, AI-driven biosensors are moving beyond single-analyte monitoring (like glucose) towards comprehensive health assessment. For instance, wearable biosensors that collect multimodal physiological data (heart rate, HRV, electrodermal activity) are being fused with ML models to objectively monitor mental health conditions like stress, depression, and anxiety, offering a potential alternative to traditional diagnostic methods [107]. In disease diagnostics, this synergy is pivotal for early detection. AI-assisted biosensors are being developed to detect ultra-low levels of cancer biomarkers, pathogens, and other disease indicators in complex bodily fluids, with the goal of achieving non-invasive, point-of-care testing that bypasses central laboratories [106].
Future advancements in this field will be driven by several key trends. There is a growing emphasis on device integration, particularly with Complementary Metal-Oxide-Semiconductor (CMOS) technology, which allows for the mass production of highly sensitive, miniaturized, and cost-effective biosensor arrays ideal for portable diagnostics [108]. Furthermore, the successful translation of these technologies from research labs to clinical and commercial settings hinges on standardization and rigorous clinical validation. International efforts, such as those by the FDA and ISO, are crucial for establishing metrological frameworks to ensure reliability and build trust [106] [108]. Finally, as the field progresses, addressing ethical considerations, data privacy, and the environmental impact of sensor production and disposal will be paramount for sustainable and equitable deployment [108].
The integration of Artificial Intelligence with multiplexed biosensing represents a fundamental shift in bioanalytical science. By marrying the molecular specificity of diverse bioreceptors and the sensitivity of various transducers with the computational power of AI, we are creating intelligent systems capable of interpreting complex biological signatures with unprecedented speed and accuracy. This powerful synergy is not merely an incremental improvement but a transformative force that is paving the way for highly personalized medicine, advanced environmental monitoring, and a new era of predictive health analytics. As research in nanomaterials, device integration, and sophisticated AI algorithms continues to advance, these intelligent biosensing systems are poised to become indispensable tools in scientific research and clinical practice.
Conclusion
The synergistic partnership between bioreceptors and transducers forms the bedrock of modern biosensing, a field poised to dramatically reshape biomedical research and clinical diagnostics. The foundational principles of specific bio-recognition and robust signal transduction, when combined with advanced methodologies in nanotechnology and microfabrication, are enabling unprecedented applications from low-cost drug development to personalized wearable monitors. Despite persistent challenges in optimization and reproducibility, systematic approaches like Design of Experiments and novel anti-fouling materials are paving the way for more reliable and clinically translatable devices. As validation frameworks mature and comparative analyses highlight the strengths of platforms like FET-based and electrochemical sensors, the future points toward integrated, multiplexed, and AI-enhanced biosensing systems. These advancements promise not only to accelerate drug discovery and biomanufacturing but also to usher in a new era of predictive, personalized medicine through continuous, real-time molecular monitoring.
References
- 1. Introduction to biosensors - PMC [https://pmc.ncbi.nlm.nih.gov/articles/PMC4986445/]
- 2. A Review on Biosensors and Recent Development of Nanostructured... [https://pmc.ncbi.nlm.nih.gov/articles/PMC7915135/]
- 3. Biosensors: An Introduction – Environmental Microbiology... [https://ebooks.inflibnet.ac.in/esp15/chapter/biosensors-an-introduction/]
- 4. Biosensors and Transducers - Biomedical Engineering... | Fiveable [https://fiveable.me/biomedical-engineering-i/unit-5/biosensors-transducers/study-guide/fGrpzz9Y3xwZxmEh]
- 5. Frontiers | A bibliometric and visualization analysis of electrochemical biosensors for early diagnosis of eye diseases [https://www.frontiersin.org/journals/medicine/articles/10.3389/fmed.2024.1487981/full]
- 6. Nanotechnology-Enabled Biosensors: A Review of Fundamentals, Design Principles, Materials, and Applications - PMC [https://pmc.ncbi.nlm.nih.gov/articles/PMC9856107/]
- 7. (PDF) Biosensors : Functions and Applications [https://www.academia.edu/78590447/Biosensors_Functions_and_Applications]
- 8. SYNTHETIC BIOLOGY AND THE ART OF BIOSENSOR DESIGN - The Science and Applications of Synthetic and Systems Biology - NCBI Bookshelf [https://www.ncbi.nlm.nih.gov/books/NBK84465/]
- 9. Biosensor - Wikipedia [https://en.wikipedia.org/wiki/Biosensor]
- 10. Biosensing Basics | IntechOpen [https://www.intechopen.com/chapters/89025]
- 11. Emerging applications of biorecognition elements-based optical... [https://link.springer.com/article/10.1007/s44397-025-00003-3]
- 12. Recent Advances in Biosensors for Nucleic Acid and Exosome Detection - PMC [https://pmc.ncbi.nlm.nih.gov/articles/PMC6536430/]
- 13. modified electrochemical biosensors for the detection of... Bioreceptor [https://pubs.rsc.org/en/content/articlehtml/2024/ra/d4ra04038d]
- 14. Transducer Technologies for Biosensors and Their Wearable Applications | Encyclopedia MDPI [https://encyclopedia.pub/entry/23872]
- 15. Nucleic Acid Aptamer-Based Biosensors: A Review - PMC [https://pmc.ncbi.nlm.nih.gov/articles/PMC10741014/]
- 16. Aptamers and antibodies in optical biosensing | Discover Chemistry [https://link.springer.com/article/10.1007/s44371-025-00094-2]
- 17. Nanomaterials for Biosensing and Bioassays | Frontiers Research ... [https://www.frontiersin.org/research-topics/41252/nanomaterials-for-biosensing-and-bioassays/magazine]
- 18. Nanostructured Materials-Enabled Biosensors | Encyclopedia MDPI [https://encyclopedia.pub/entry/7900]
- 19. Advances in nanomaterial -based sensors : a study of carbon... [https://link.springer.com/article/10.1007/s10470-025-02417-w]
- 20. of blood gas analysis. IV. Leland History 's Clark oxygen electrode [https://link.springer.com/article/10.1007/BF01637680]
- 21. - Wikipedia Clark electrode [https://en.wikipedia.org/wiki/Clark_electrode]
- 22. of blood gas analysis. IV. Leland History 's Clark oxygen electrode [https://pubmed.ncbi.nlm.nih.gov/3519875/]
- 23. Biosensors: Design, Development and Applications | IntechOpen [https://www.intechopen.com/chapters/76543]
- 24. Self-Powered Sensors : New Opportunities and Challenges from... [https://pmc.ncbi.nlm.nih.gov/articles/PMC8398567/]
- 25. modified electrochemical biosensors for the detection of... Bioreceptor [https://pmc.ncbi.nlm.nih.gov/articles/PMC11378029/]
- 26. Designing the Future of Biosensing: Advances in Aptamer Discovery, Computational Modeling, and Diagnostic Applications [https://www.mdpi.com/2079-6374/15/10/637]
- 27. Frontiers | Innovative applications and research advances of bacterial biosensors in medicine [https://www.frontiersin.org/journals/microbiology/articles/10.3389/fmicb.2025.1507491/full]
- 28. Frontiers | Recent advances in glucose monitoring utilizing oxidase electrochemical biosensors integrating carbon-based nanomaterials and smart enzyme design [https://www.frontiersin.org/journals/chemistry/articles/10.3389/fchem.2025.1591302/full]
- 29. Editorial: Insights in biosensors and biomolecular electronics 2024: novel developments, current challenges, and future perspectives - PMC [https://pmc.ncbi.nlm.nih.gov/articles/PMC12423070/]
- 30. A comprehensive review of transduction methods of lectin-based... [https://pmc.ncbi.nlm.nih.gov/articles/PMC11462017/]
- 31. Biotransducer - Wikipedia [https://en.wikipedia.org/wiki/Biotransducer]
- 32. Biosensor - an overview | ScienceDirect Topics [https://www.sciencedirect.com/topics/agricultural-and-biological-sciences/biosensor]
- 33. Molecular Recognition and Specific Interactions for Biosensing Applications - PMC [https://pmc.ncbi.nlm.nih.gov/articles/PMC3707470/]
- 34. Electrochemical Enzyme-based Biosensors | Encyclopedia MDPI [https://encyclopedia.pub/entry/9421]
- 35. Electrochemical DNA Biosensor Based on Immobilization of... [https://pmc.ncbi.nlm.nih.gov/articles/PMC9736659/]
- 36. Self-assembled monolayer - Wikipedia [https://en.wikipedia.org/wiki/Self-assembled_monolayer]
- 37. Advances in Electrochemical Nano-Biosensors for Biomedical and Environmental Applications: From Current Work to Future Perspectives - PMC [https://pmc.ncbi.nlm.nih.gov/articles/PMC9573286/]
- 38. Recent Advances in Electrochemical Biosensors: Applications, Challenges, and Future Scope - PMC [https://pmc.ncbi.nlm.nih.gov/articles/PMC8472208/]
- 39. sciencedirect.com/topics/nursing-and-health-professions... [https://www.sciencedirect.com/topics/nursing-and-health-professions/amperometric-biosensor]
- 40. New Trends in Impedimetric Biosensors for the Detection of Foodborne Pathogenic Bacteria - PMC [https://pmc.ncbi.nlm.nih.gov/articles/PMC3376556/]
- 41. Recent Advances in Potentiometric Biosensing - PMC [https://pmc.ncbi.nlm.nih.gov/articles/PMC8162913/]
- 42. A critical review on the use of potentiometric based biosensors for biomarkers detection - ScienceDirect [https://www.sciencedirect.com/science/article/abs/pii/S095656632100289X]
- 43. with Immobilised Microbial Cells Using Biosensors ... Amperometric [https://link.springer.com/chapter/10.1007/1-4020-3363-X_33]
- 44. Potentiometric Sensor - an overview | ScienceDirect Topics [https://www.sciencedirect.com/topics/chemistry/potentiometric-sensor]
- 45. Advancing protein biosensors: redefining detection through innovations in materials, mechanisms, and applications for precision medicine and global diagnostics - PMC [https://pmc.ncbi.nlm.nih.gov/articles/PMC11987851/]
- 46. Label-Free Physical Techniques and Methodologies for Proteins Detection in Microfluidic Biosensor Structures - PMC [https://pmc.ncbi.nlm.nih.gov/articles/PMC8868674/]
- 47. CHO Cells : Biologics Production Champions | Krishgen [https://krishgen.com/integrating-elisa-in-bioprocessing-monitoring-critical-quality-attributes-in-therapeutic-development/]
- 48. Analysis in Biopharma | Technology Networks Host Cell Protein [https://www.technologynetworks.com/biopharma/articles/host-cell-protein-analysis-in-biopharma-309563]
- 49. Testing in the Host World: 5 Uses You'll Actually... Cell Protein Real [https://www.linkedin.com/pulse/host-cell-protein-testing-real-world-5-uses-youll-actually-vgzff]
- 50. Bioprocess monitoring and control | imec [https://www.imec-int.com/en/expertise/health-technologies/process-analytical-technologies]
- 51. Technologies for Transducer and Their Wearable... Biosensors [https://pmc.ncbi.nlm.nih.gov/articles/PMC9221076/]
- 52. Epidermal Wearable Biosensors for the Continuous Monitoring of Biomarkers of Chronic Disease in Interstitial Fluid [https://www.mdpi.com/2072-666X/14/7/1452]
- 53. Epidermal Wearable Biosensors for Monitoring Biomarkers of Chronic Disease in Sweat - PMC [https://pmc.ncbi.nlm.nih.gov/articles/PMC10045998/]
- 54. 3D-Printed Wearable Colorimetric and Electrochemical Health... [https://www.mrs.org/meetings-events/annual-meetings/archive/meeting/presentations/view/2025-mrs-spring-meeting/2025-mrs-spring-meeting-4205731]
- 55. Simultaneous Monitoring of Sweat and Interstitial Using... Fluid [https://pmc.ncbi.nlm.nih.gov/articles/PMC6193173/]
- 56. Startup’s biosensor makes drug development and manufacturing ... [https://news.mit.edu/2025/startup-biosensor-makes-drug-development-and-manufacturing-cheaper-0615]
- 57. [PDF] Quantification of the affinities and kinetics of protein ... [https://www.semanticscholar.org/paper/Quantification-of-the-affinities-and-kinetics-of-Duan-Li/7918f38b31bb5f361ff54562da988d79aa511476]
- 58. Frontiers | 17β-estradiol biosensors based on different bioreceptors ... [https://www.frontiersin.org/journals/bioengineering-and-biotechnology/articles/10.3389/fbioe.2024.1347625/full]
- 59. Biosensor | PPTX [https://www.slideshare.net/slideshow/biosensor-250263143/250263143]
- 60. Essential Guide to Biosensors: Understanding... - EdrawMind [https://www.edrawmind.com/mind-maps/40182/essential-guide-to-biosensors-understanding-functionality-and-components]
- 61. Machine Learning Enhances the Performance of Bioreceptor-Free Biosensors - PMC [https://pmc.ncbi.nlm.nih.gov/articles/PMC8401027/]
- 62. Machine Learning Enhances the Performance of Bioreceptor-Free Biosensors [https://www.mdpi.com/1424-8220/21/16/5519]
- 63. Frontiers | Materials and Methods of Biosensor Interfaces With Stability [https://www.frontiersin.org/journals/materials/articles/10.3389/fmats.2020.583739/full]
- 64. Universal nanocomposite with antifouling and redox... coating [https://pubs.rsc.org/en/content/articlehtml/2024/nh/d3nh00541k]
- 65. Wearable Electrochemical Biosensors for Advanced Healthcare Monitoring - PMC [https://pmc.ncbi.nlm.nih.gov/articles/PMC11727287/]
- 66. A biochemical sensor with continuous extended stability in vivo | Nature Biomedical Engineering [https://www.nature.com/articles/s41551-025-01389-6]
- 67. Antifouling Strategies for Electrochemical Biosensing: Mechanisms and Performance toward Point of Care Based Diagnostic Applications - PubMed [https://pubmed.ncbi.nlm.nih.gov/33765383/]
- 68. An antifouling coating that enables affinity-based electrochemical... [https://pubmed.ncbi.nlm.nih.gov/31712665/]
- 69. An Antimicrobial and Antifibrotic Coating for Implantable Biosensors [https://pubmed.ncbi.nlm.nih.gov/40136968/]
- 70. Supramolecular-assisted nanocomposite with sustainable... coatings [https://www.jmst.org/EN/Y2025/V205/I0/286]
- 71. drug delivery Optimizing using systems "design of..." systematic [https://pubmed.ncbi.nlm.nih.gov/15715503/]
- 72. Process optimisation by design [https://www.manufacturingchemist.com/news/article_page/Process_optimisation_by_design/151096]
- 73. Perspectives on systematic optimization of ultrasensitive biosensors through experimental design - PMC [https://pmc.ncbi.nlm.nih.gov/articles/PMC11403992/]
- 74. Development of High-Performance Whole Cell Biosensors Aided by Statistical Modeling - PMC [https://pmc.ncbi.nlm.nih.gov/articles/PMC7146887/]
- 75. Biological Assay Qualification Using Design of Experiments [https://www.bioprocessintl.com/assays/biological-assay-qualification-using-design-of-experiments]
- 76. Implementation of design of experiments (DOE) in the development and validation of a cell-based bioassay for the detection of anti-drug neutralizing antibodies in human serum - PubMed [https://pubmed.ncbi.nlm.nih.gov/22119514/]
- 77. (doc) biosensore and medicine [https://www.academia.edu/8342686/BIOSENSORE_AND_MEDICINE]
- 78. Silicon-Based Biosensors: A Critical Review of Silicon’s Role in Enhancing Biosensing Performance [https://www.mdpi.com/2079-6374/15/2/119]
- 79. Frontiers | Flexible Biosensors Based on Colorimetry, Fluorescence, and Electrochemistry for Point-of-Care Testing [https://www.frontiersin.org/journals/bioengineering-and-biotechnology/articles/10.3389/fbioe.2021.753692/full]
- 80. Field effect transistor based wearable biosensors for healthcare monitoring | Journal of Nanobiotechnology | Full Text [https://jnanobiotechnology.biomedcentral.com/articles/10.1186/s12951-023-02153-1]
- 81. How to Choose a Flex PCB Substrate : PI, PEN or PET ? [https://www.flexplusfpc.com/post/how-to-choose-a-flex-pcb-substrate-pi-pen-or-pet]
- 82. Tekra Fundamentals - What are the Differences between PEN Film and PET Film? | Tekra, LLC [https://www.tekra.com/resources/tekra-fundamentals/tekra-fundamentals-what-are-differences-between-pen-film-and-pet-film]
- 83. Biocompatible and Long-Term Monitoring Strategies of Wearable, Ingestible and Implantable Biosensors: Reform the Next Generation Healthcare - PMC [https://pmc.ncbi.nlm.nih.gov/articles/PMC10054135/]
- 84. Improvement in long-term stability of field effect transistor biosensor in aqueous environments using a combination of silane and reduced graphene oxide coating - ScienceDirect [https://www.sciencedirect.com/science/article/abs/pii/S0167931722001538]
- 85. Optimizing the signal - to - noise for ratio with carbon... biosensing [https://pubmed.ncbi.nlm.nih.gov/19072626/]
- 86. Breakthrough Method Revolutionizes Bioelectronic Sensor Technology [https://bioengineer.org/breakthrough-method-revolutionizes-bioelectronic-sensor-technology/]
- 87. ELISA - Wikipedia [https://en.wikipedia.org/wiki/ELISA]
- 88. Advancements in ELISA Assay Technology | MyBioSource Learning Center [https://www.mybiosource.com/learn/improved-reagent-stability/]
- 89. A Colorimetric Enzyme-Linked Immunosorbent Assay (ELISA) Detection Platform for a Point-of-Care Dengue Detection System on a Lab-on-Compact-Disc - PubMed [https://pubmed.ncbi.nlm.nih.gov/25993517/]
- 90. ELISA: What It Is, Purpose, Procedure & Results [https://my.clevelandclinic.org/health/articles/24990-elisa]
- 91. Development of a highly sensitive enzyme-linked immunosorbent assay (ELISA) through use of poly-protein G-expressing cell-based microplates | Scientific Reports [https://www.nature.com/articles/s41598-018-36192-8]
- 92. Gold nanorod-based localized surface plasmon resonance biosensor for sensitive detection of hepatitis B virus in buffer, blood serum and plasma - ScienceDirect [https://www.sciencedirect.com/science/article/abs/pii/S0956566310004963]
- 93. - Sensor Principles and Architectures... Electrochemical Biosensors [https://pmc.ncbi.nlm.nih.gov/articles/PMC3663003/]
- 94. Bio-FET - Wikipedia [https://en.wikipedia.org/wiki/Bio-FET]
- 95. Signal transduction interfaces for field-effect transistor-based biosensors | Communications Chemistry [https://www.nature.com/articles/s42004-024-01121-6]
- 96. Comparison between Field Effect Transistors and Bipolar Junction Transistors as Transducers in Electrochemical Sensors - PMC [https://pmc.ncbi.nlm.nih.gov/articles/PMC5278393/]
- 97. Assistant - Bohrium | AI for Science with Global Scientists Research [https://www.bohrium.com/paper-details/hybrid-nanobioengineered-nanomaterial-based-electrochemical-biosensors/817402273092075520-3450]
- 98. SENSORS_UNIT-4.pptx | Chemistry | Science [https://www.slideshare.net/slideshow/sensorsunit4pptx/252386952]
- 99. Biochemistry strategies for label-free optical sensor biofunctionalization: advances towards real applicability | Analytical and Bioanalytical Chemistry [https://link.springer.com/article/10.1007/s00216-021-03751-4]
- 100. in Laboratory Detection : An In-Depth... Limits Method Validation [https://www.linkedin.com/pulse/detection-limits-laboratory-method-validation-in-depth-overview-ofa7f]
- 101. ( Limit ) and of Quantitation... Detection LOD Limit of [https://www.pharmaspecialists.com/2023/09/lod-and-loq-in-analytical-method-validation.html]
- 102. Calculate LOD and LOQ with Microsoft Excel [https://bitesizebio.com/48459/excel-lod-loq/]
- 103. Development and Comparative Evaluation of Two Enzyme-Based Amperometric Biosensor Designs for Alanine Aminotransferase Determination in Biological Fluids [https://www.mdpi.com/2072-666X/16/10/1168]
- 104. Application of Electrochemical Biosensors in Clinical Diagnosis - PMC [https://pmc.ncbi.nlm.nih.gov/articles/PMC6807684/]
- 105. The Role of Artificial Intelligence in Advancing Biosensor Technology: Past, Present, and Future Perspectives - PMC [https://pmc.ncbi.nlm.nih.gov/articles/PMC12392873/]
- 106. AI-Assisted Detection of Biomarkers by Sensors and Biosensors for Early Diagnosis and Monitoring - PMC [https://pmc.ncbi.nlm.nih.gov/articles/PMC11274923/]
- 107. Fusing Wearable Biosensors with Artificial Intelligence for Mental Health Monitoring: A Systematic Review [https://www.mdpi.com/2079-6374/15/4/202]
- 108. Frontiers | Editorial: Insights in biosensors and biomolecular... [https://www.frontiersin.org/journals/bioengineering-and-biotechnology/articles/10.3389/fbioe.2025.1668411/full]