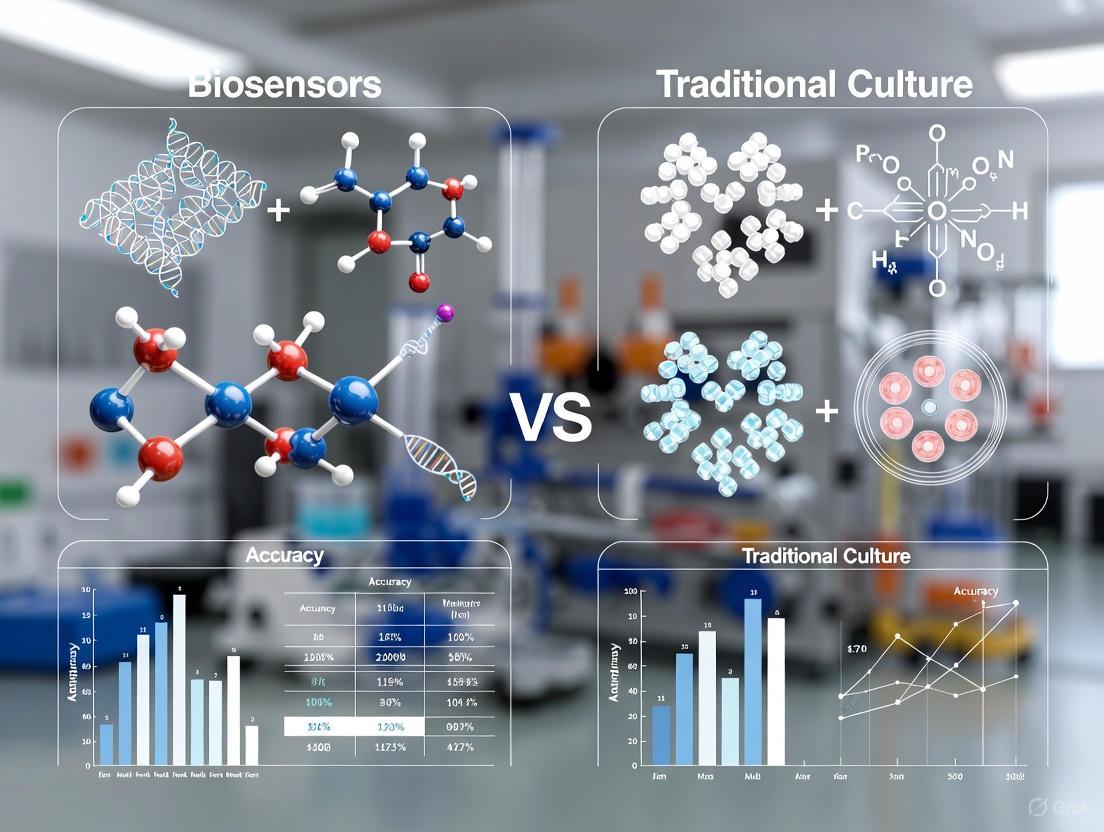
Biosensor Accuracy vs. Culture Methods: A Critical Evaluation for Modern Diagnostics and Drug Development
This article provides a comprehensive evaluation of biosensor performance against the traditional gold standard of culture-based methods for microbial detection.
Biosensor Accuracy vs. Culture Methods: A Critical Evaluation for Modern Diagnostics and Drug Development
Abstract
This article provides a comprehensive evaluation of biosensor performance against the traditional gold standard of culture-based methods for microbial detection. Aimed at researchers, scientists, and drug development professionals, it explores the foundational principles of both techniques, details cutting-edge biosensor methodologies and their applications in clinical and industrial settings, analyzes key challenges and optimization strategies, and rigorously compares diagnostic accuracy through performance metrics and real-world case studies. The synthesis of this information outlines a path forward for integrating these rapid, sensitive tools into next-generation diagnostic and research workflows.
The Gold Standard and the New Challenger: Understanding Culture Methods and Biosensor Fundamentals
Traditional culture methods, involving the growth of microorganisms on selective and differential media, have constituted the gold standard for microbial detection for over a century. These methods provide the foundational framework for clinical diagnostics, food safety monitoring, and public health surveillance. This guide objectively examines the principles, performance, and limitations of traditional cultural techniques, framing them within the context of modern analytical biosensor development. We detail standard experimental protocols, present quantitative performance data, and delineate the specific scenarios where culture-based methods remain indispensable despite the emergence of rapid, innovative paradigms.
For more than a century, traditional culture methods have served as the cornerstone of microbiological analysis [1]. These techniques rely on a simple yet powerful principle: the growth and proliferation of microorganisms in or on a nutrient-rich medium under controlled conditions to allow for their detection, enumeration, and identification [2]. Despite the rapid advancement of molecular-based techniques, nanotechnology, and biosensors, culture methods maintain their status as the unchallenged gold standard against which all novel detection technologies are validated [1] [3]. Their preeminence stems from their direct approach to confirming microbial viability, which involves the phenotypic identification of microorganisms through staining, culturing, and straightforward biochemical analyses [1]. This review deconstructs the core components of these methods, evaluates their analytical performance, and critically assesses their role in the contemporary scientific toolkit where the push for rapid, on-site detection is driving innovation in biosensor technologies.
Core Principles and Standard Experimental Protocols
Traditional cultural methods follow a systematic, multi-stage workflow designed to isolate and identify target pathogens from complex samples. The foundational principle is the provision of specific nutritional and environmental conditions that support the growth of viable microorganisms while inhibiting competing flora.
Foundational Workflow
The following diagram illustrates the standard multi-step protocol for traditional culture methods:
Detailed Methodology of Key Workflow Steps
1. Sample Collection and Pre-enrichment
- Principle: Samples are collected from relevant matrices (food, water, clinical specimens) and introduced into a non-selective liquid broth.
- Protocol: A defined sample weight (e.g., 25 g) is homogenized with a non-selective broth medium (e.g., Buffered Peptone Water). The purpose is to resuscitate stressed or injured cells and allow for the initial multiplication of the target microorganism, increasing the detection probability [2].
- Incubation: Typically 18-24 hours at a temperature optimal for the target pathogen (e.g., 35±2°C for mesophilic bacteria) [1].
2. Selective Enrichment
- Principle: A small aliquot from the pre-enrichment culture is transferred to a selective liquid medium.
- Protocol: Media such as Tetrathionate Broth for Salmonella or Listeria Enrichment Broth are used. These contain chemical agents (e.g., bile salts, azide, antimicrobials) that suppress the growth of competing background flora while permitting the proliferation of the target pathogen [1] [2].
3. Selective Plating and Colony Isolation
- Principle: The selectively enriched culture is streaked onto solid, differential, and selective agar media to obtain isolated, pure colonies.
- Protocol: Using a sterile loop, a sample from the selective enrichment is streaked onto media such as:
- XLD Agar for Salmonella (appears as pink colonies with black centers due to H₂S production).
- Mannitol Salt Agar for Staphylococcus aureus (appears as yellow colonies due to mannitol fermentation) [4].
- Incubation: Plates are incubated for 18-24 hours at a defined temperature, after which visible colonies are examined [1].
4. Biochemical Confirmation
- Principle: Presumptive colonies are confirmed through their unique metabolic fingerprints.
- Protocol: Isolated colonies are subjected to a series of biochemical tests. A classic suite is the IMViC tests (Indole, Methyl Red, Voges-Proskauer, and Citrate) for members of the Enterobacteriaceae family [1]. Other common tests include catalase, oxidase, urease, and nitrate reduction assays. These tests provide valuable insights to pinpoint target microorganisms based on their distinctive biochemical profiles [1].
Performance Data: A Quantitative Comparison
The following table summarizes the key performance metrics of traditional culture methods against emerging rapid diagnostic technologies.
Table 1: Performance Comparison of Microbial Detection Methods
| Parameter | Traditional Culture Methods | Rapid Biosensors (e.g., Electrochemical) | Molecular Techniques (e.g., PCR, NGS) |
|---|---|---|---|
| Total Analysis Time | 2-5 days for full identification [1] [3] | Minutes to a few hours (<90 mins in some optical sensors) [4] | 3-6 hours for PCR; longer for NGS [2] |
| Limit of Detection (LoD) | 1 CFU (theoretically, after enrichment) [1] | Varies widely; can be 10-1000 CFU/mL without enrichment [2] | High sensitivity; can detect low copy numbers of DNA [1] |
| Ability to Determine Viability | Yes, direct measurement. Confirms only live, growing cells [1] | Limited. Often detects biomarkers (antigens, DNA) from both live and dead cells [2] | No. Detects genetic material regardless of cell viability [1] |
| Specificity | High, based on phenotypic characteristics [1] | Moderate to High, dependent on the bioreceptor (antibody, aptamer) [5] | Very High, based on genetic sequence [1] |
| Cost per Test | Low (consumables) [2] | Moderate to High (nanomaterials, fabrication) [5] | High (equipment, reagents) [1] |
| Key Strength | Gold standard; provides live isolates for further analysis (e.g., AST, typing) [1] | Rapid, portable, and suitable for point-of-care/field use [2] [3] | High throughput, can detect non-culturable organisms and resistance genes [1] |
| Key Limitation | Time-consuming and labor-intensive [1] | Lack of real-world validation; only 1/77 studies used naturally contaminated food samples [5] | Cannot differentiate live/dead cells; requires sophisticated equipment [1] |
CFU: Colony Forming Unit; AST: Antimicrobial Susceptibility Testing
The Researcher's Toolkit: Essential Reagents and Materials
Table 2: Key Research Reagent Solutions in Traditional Culture Methods
| Reagent/Material | Function in Experimental Protocol | Specific Examples |
|---|---|---|
| Selective Media | Suppresses non-target microbes, promoting growth of pathogens. | Mannitol Salt Agar (S. aureus), XLD Agar (Salmonella), MacConkey Agar (Gram-negative rods) [1] [4]. |
| Enrichment Broths | Resuscitates and amplifies target microbes from the sample matrix. | Buffered Peptone Water (pre-enrichment), Tetrathionate Broth, Selenite Cystine Broth (selective enrichment) [2]. |
| Biochemical Test Kits | Provides metabolic profile for species-level identification. | IMViC reagents, Oxidase strips, Urease slants, API test strips [1]. |
| Viability Markers | Visual indicators of metabolic activity (e.g., acid production, gas). | pH indicators (Phenol Red, Neutral Red), Tetrazolium salts [4]. |
Critical Limitations and Challenges in Modern Diagnostics
Despite their foundational role, traditional methods possess significant limitations that drive the development of alternative technologies like biosensors.
Lengthy Turnaround Time: The multi-step incubation process requires 18-24 hours or longer for each stage, leading to a total time-to-result of 2 to 5 days [1] [3]. This delay is often too lengthy for timely clinical decision-making or rapid screening in the food industry [1].
Inability to Detect Viable But Non-Culturable (VBNC) States: Some bacteria can enter a dormant, VBNC state in response to environmental stress. These cells are metabolically active and potentially pathogenic but cannot form colonies on conventional culture media, leading to false-negative results [1].
Limited Throughput and Labor-Intensive Nature: The processes of media preparation, serial dilution, plating, and manual interpretation of results are time-consuming and labor-intensive, making them impractical for high-throughput screening of large sample volumes [1] [2].
Challenge in Antimicrobial Resistance (AMR) Detection: Traditional antimicrobial susceptibility testing (AST) methods, like disk diffusion, require additional 18-24 hours after a pure culture is obtained [1]. Furthermore, they can only detect resistance in cultivable bacteria and often fail to identify the specific molecular mechanisms or genes responsible for the resistance [1].
Traditional culture methods remain the unchallenged gold standard in microbial detection due to their unparalleled ability to confirm the presence of viable pathogens, their cost-effectiveness, and their provision of isolate material for further characterization. Their core strength lies in confirming microbial viability through growth, a feature that many modern biosensors and molecular methods lack [1]. However, their lengthy turnaround times, inability to detect VBNC pathogens, and labor-intensive protocols represent significant drawbacks in a world that demands rapid, on-site, and high-throughput diagnostics [1] [3].
The future of microbial detection does not lie in the outright replacement of cultural methods but in a synergistic approach. Emerging biosensors, with their ASSURED (Affordable, Sensitive, Specific, User-friendly, Rapid and Robust, Equipment-free, and Deliverable) characteristics, are poised to act as powerful screening tools [2] [3]. For rapid, preliminary results, biosensors are invaluable. However, for definitive confirmation, epidemiological typing, and when a viable isolate is required for downstream applications like antimicrobial susceptibility testing, traditional culture methods will continue to be the indispensable reference against which all new technologies are measured and validated.
The global burden of infectious diseases and the rising challenge of antimicrobial resistance necessitate diagnostic tools that are not only accurate but also rapid and accessible. For decades, traditional culture methods have been the gold standard for pathogen detection, offering high specificity but requiring 24 to 72 hours to yield results [4]. This long turnaround time hinders timely clinical decision-making and outbreak control. In this context, biosensors have emerged as a transformative technology, leveraging the specificity of biological recognition and coupling it with physicochemical transducers to enable rapid, sensitive, and often portable detection. This guide provides a systematic comparison of biosensor technologies, framing their performance and accuracy against traditional methods to inform researchers and drug development professionals.
Core Components of a Biosensor
All biosensors, regardless of their specific type, integrate three fundamental components that work in concert to detect and report the presence of an analyte.
Biological Recognition Element
This is the sensing heart of the biosensor, responsible for the selective interaction with the target analyte. The choice of element dictates the sensor's specificity.
- Antibodies: Proteins that bind to specific antigens (e.g., on pathogens). They are widely used in immunosensors for their high affinity [6].
- Enzymes: Biocatalysts that convert a specific substrate, producing a detectable product. Common examples include glucose oxidase (for glucose monitoring) and acetylcholinesterase (for pesticide detection) [7].
- Nucleic Acids: Single-stranded DNA or RNA probes that hybridize with complementary sequences, enabling the detection of genetic biomarkers or pathogens [8]. Aptamers, synthetic single-stranded DNA or RNA molecules, can also be engineered to bind various targets like proteins, small molecules, and even whole cells [8].
- Whole Cells: Engineered bacteria or other cells that respond to target stimuli (e.g., toxins, metabolites) through synthetic genetic circuits [9]. These can be designed to produce a measurable output, such as fluorescence, in response to a specific environmental trigger.
Transducer
The transducer converts the biological recognition event into a quantifiable signal. The mechanism of this conversion forms the basis for biosensor classification, as detailed in Section 3.
Signal Processor
This component takes the raw signal from the transducer and processes it into a user-interpretable output, such as a digital readout on a screen. It often involves data amplification, filtering, and analysis. Advanced systems may incorporate machine learning (ML) algorithms for enhanced signal processing and anomaly detection [6].
The functional relationship between these components is summarized below.
Classification of Biosensors by Transduction Mechanism
Biosensors are primarily classified based on their transduction method. The following table compares the major types, their underlying principles, and key applications.
Table 1: Classification of Biosensors by Transduction Mechanism
| Transduction Type | Working Principle | Measurable Output | Example Applications |
|---|---|---|---|
| Electrochemical [6] [8] | Measures changes in electrical properties (current, potential, impedance) due to a biochemical reaction. | Current (Amperometric), Voltage (Potentiometric), Impedance (EIS) | Glucose monitoring, pathogen detection, cancer biomarker detection. |
| Optical [4] [6] | Detects changes in light properties (absorbance, fluorescence, reflectance) caused by the analyte. | Color change, fluorescence intensity, refractive index shift (SPR) | Bacterial detection (S. aureus), viral detection (SARS-CoV-2), biomarker quantification. |
| Piezoelectric [6] | Measures changes in the mass or mechanical properties on a sensor surface, often through frequency shift of a crystal. | Resonance frequency | Detection of volatile compounds, gas sensors. |
| Thermal [7] | Measures the heat absorbed or released during a biochemical reaction. | Temperature change / Heat | Detection of substrates for enzymatic reactions that are enthalpy-rich. |
Among these, electrochemical and optical biosensors are the most prevalent in diagnostic applications due to their high sensitivity and potential for miniaturization.
Electrochemical Biosensors
These sensors leverage electrochemical techniques such as cyclic voltammetry (CV), differential pulse voltammetry (DPV), and electrochemical impedance spectroscopy (EIS) to quantify the binding event [6]. Their performance is often enhanced by modifying electrodes with nanomaterials like graphene, carbon nanotubes, and gold nanoparticles, which increase the active surface area and improve electron transfer, thereby boosting sensitivity [6] [8].
Optical Biosensors
This category encompasses a wide range of technologies. Colorimetric sensors detect visible color changes, often linked to bacterial metabolism in culture media [4]. Surface Plasmon Resonance (SPR) sensors, a label-free technique, detect real-time binding events by monitoring changes in the refractive index at a metal-dielectric interface [10]. The integration of novel materials like MoSe₂ (Molybdenum diselenide) has been shown to significantly enhance SPR sensitivity [10].
Performance Comparison: Biosensors vs. Traditional Methods
The primary advantage of biosensors lies in their speed and efficiency. The following table provides a quantitative comparison based on a specific experimental model.
Table 2: Quantitative Performance Comparison for S. aureus Detection
| Parameter | Traditional Culture Method (Mannitol Salt Agar) | Optical Biosensor (Example from Research) |
|---|---|---|
| Detection Time | 24 - 72 hours [4] | 90 - 120 minutes [4] |
| Detection Principle | Visual colony formation & color change | Optical transmittance change measured by LED/LDR [4] |
| Sensitivity | High (culture-based) | Demonstrated ability for early growth detection [4] |
| Reagent Consumption | Standard volume per test | Up to 140x fewer reagents per test [4] |
| Key Advantage | Established, high specificity | Speed, potential for miniaturization & real-time monitoring |
Beyond raw speed, biosensors are evaluated against the REASSURED criteria, a benchmark for ideal point-of-care tests: Real-time connectivity, Ease of sample collection, Affordable, Sensitive, Specific, User-friendly, Rapid and robust, Equipment-free, and Deliverable to end-users [6]. While no single biosensor meets all criteria perfectly, they address many of the limitations of traditional lab-based methods.
Experimental Protocols for Biosensor Evaluation
To illustrate the practical application and validation of biosensor technology, we examine a documented experimental protocol for bacterial detection.
Case Study: Optical Biosensor forStaphylococcus aureusDetection
This experiment demonstrates a rapid method leveraging metabolic-induced color changes in a culture medium [4].
5.1.1 Aim: To detect the growth of Staphylococcus aureus by measuring optical transmittance changes in Mannitol Salt Agar (MSA) within 90-120 minutes.
5.1.2 Materials & Reagents: Table 3: Research Reagent Solutions for S. aureus Detection
| Item | Function / Description |
|---|---|
| Mannitol Salt Agar (MSA) | Selective culture medium for S. aureus; acid production from mannitol fermentation causes a color change [4]. |
| Staphylococcus aureus strain | Target pathogen for detection. |
| Light-Emitting Diodes (LEDs) | Light source at specific wavelengths to illuminate the culture medium [4]. |
| Light-Dependent Resistor (LDR) | Detector that measures the intensity of light transmitted through the medium [4]. |
| Signal processing circuit | Converts the LDR's resistance change into a quantifiable electrical signal. |
5.1.3 Detailed Workflow:
The following diagram outlines the key steps in the experimental protocol, from sample preparation to data analysis.
5.1.4 Data Interpretation: Bacterial growth and metabolism in the MSA cause a decrease in the medium's optical transmittance. A statistically significant drop in the detected signal over the baseline, typically occurring within 90-120 minutes, is interpreted as a positive detection of S. aureus [4]. This method correlates the optical signal with bacterial metabolic activity, providing a much faster alternative to waiting for visible colony formation.
Biosensors represent a significant leap forward from traditional culture methods, offering a powerful combination of speed, sensitivity, and potential for miniaturization. As demonstrated by the experimental case study, detection times can be reduced from days to hours or even minutes without sacrificing accuracy. The ongoing integration of novel nanomaterials, synthetic biology, and artificial intelligence is continuously enhancing the performance of these devices [11] [9]. For researchers and drug development professionals, understanding the core components, transduction mechanisms, and experimental validation of biosensors is crucial for leveraging their capabilities in developing next-generation diagnostic tools for precision medicine and global health challenges.
The detection and identification of microorganisms have long been a bottleneck in diagnostics, food safety, and clinical microbiology, constrained by the inherent growth rates of biological organisms. Traditional culture-based methods, while considered the gold standard for many applications, typically require 24 to 72 hours, and sometimes up to 15 days, to yield results because they depend on the visible growth of microorganisms on agar plates or in liquid media [4] [12] [13]. This prolonged incubation period creates critical delays in clinical decision-making, treatment initiation, and product release in the food industry. In response to this challenge, biosensor technologies have emerged as a transformative alternative, leveraging biochemical recognition and sophisticated signal transduction to slash detection times to a matter of minutes or hours. This paradigm shift from days to minutes is not merely an incremental improvement but a fundamental change in diagnostic capabilities, enabling real-time monitoring and early intervention. This article provides a comparative analysis of these divergent timelines, supported by experimental data and detailed methodologies, framing the discussion within the broader thesis of evaluating biosensor accuracy against traditional culture methods.
The Traditional Paradigm: Culture-Based Methods and Their Inherent Time Delays
Traditional microbial detection relies on cultivating samples in nutrient-rich media and waiting for microorganisms to multiply to visually detectable levels. The requisite incubation time is a biological constraint, dependent on the generation time of the target microbe and the starting concentration of cells in the sample.
The following table summarizes the extensive incubation requirements of various traditional methods:
Table 1: Incubation Timelines for Traditional Culture-Based Methods
| Method Type | Typical Incubation Time | Application Context | Key Limitation |
|---|---|---|---|
| Standard Agar Plates [12] | 24-48 hours | General bacterial colony appearance | Time to visible growth |
| Liquid Cultures [12] | 17-19 hours | To reach end of log growth phase | Dependent on initial inoculum |
| Blood Cultures (Modern Systems) [14] | 4-5 days | Detecting bacteremia/fungemia | Slow growth of some pathogens/contaminants |
| Sterility Testing (UHT Products) [13] | 7-14 days | Confirming product sterility | Extremely long holding time for product release |
Experimental Protocol for Traditional Culture
A standard protocol for detecting Staphylococcus aureus via culture involves inoculating a sample onto Mannitol Salt Agar (MSA), a selective and differential medium [4]. The inoculated plate is then incubated at 35±2°C for 24-48 hours. Detection of positive growth relies on visual observation of colony formation and a color change in the medium due to mannitol fermentation. This method, while specific, is inherently slow and provides no actionable data during the incubation period. For blood cultures, the standard practice involves incubating bottles in automated systems like the BacT/Alert Virtuo for up to 5 days, with the mean time to positivity for common pathogens like Staphylococcus aureus and Escherichia coli being approximately 15.6 and 9.5 hours, respectively [14]. It is noteworthy that 99% of positive bottles in modern systems flag positive within 91.5 hours (aerobic) and 108 hours (anaerobic), prompting a re-evaluation of the necessary incubation duration [14].
The Modern Paradigm: Biosensor Technologies and Rapid Detection
Biosensors function on fundamentally different principles, typically involving a biorecognition element (e.g., antibody, enzyme, aptamer) that specifically interacts with a target analyte and a transducer that converts this interaction into a quantifiable signal. This bypasses the need for extensive microbial growth, dramatically accelerating detection.
The following table contrasts the performance of several rapid biosensor-based approaches with traditional methods:
Table 2: Comparison of Traditional vs. Biosensor Detection Timelines
| Technology / Method | Target Analyte | Detection Time | Key Performance Data |
|---|---|---|---|
| Traditional MSA Culture [4] | Staphylococcus aureus | 24-72 hours | Standard reference method |
| Optical Sensor (MSA) [4] | Staphylococcus aureus | 90-120 minutes | Measures metabolic color change |
| Innovate System (Rapid ATP Detection) [13] | General microbial contamination | <30 minutes (assay); 24h (enrichment) | Detects ~10 CFU/pack after 24h enrichment |
| RAA-TS-DTL Test Strip [15] | Pseudomonas fluorescens (gyrB gene) | ~90 minutes (total process) | Detection limit: 50 CFU/mL |
| Blood Culture System (Virtuo) [14] | Mixed bloodstream pathogens | Mean: 12.3-48.9 hours (varies by species) | 90% detected by 38.5 hours |
Experimental Protocol for an Optical Biosensor
A specific experimental paradigm is detailed in a 2025 study on an optical biosensor for Staphylococcus aureus [4]. The methodology is as follows:
- Sample Inoculation: The bacterial sample is inoculated into Mannitol Salt Agar (MSA).
- Incubation and Sensing: Instead of waiting for visible growth, the culture is placed in a sensor system equipped with light-emitting diodes (LEDs) at specific wavelengths and a photodetector (e.g., a light-dependent resistor).
- Signal Measurement: As bacterial metabolites change the color and optical transmittance of the medium, the sensor measures these changes in real-time.
- Data Interpretation: The system correlates the intensity of transmitted light with bacterial growth, achieving detection in approximately 90-120 minutes [4]. This protocol offers a significant reduction in detection time (up to 48x faster than the upper range of traditional culture) and uses up to 140 times fewer reagents per test, highlighting its efficiency and potential for resource-limited settings.
Visualizing the Paradigm Shift: Workflow Comparisons
The dramatic difference in these approaches can be visualized through their respective workflows.
Traditional Culture Workflow
The following diagram illustrates the multi-step, time-intensive process of traditional culture methods.
Figure 1: The traditional culture workflow is a linear, multi-day process requiring manual intervention and subculturing.
Rapid Biosensor Workflow
In contrast, the biosensor workflow is a streamlined, automated process focused on rapid signal detection.
Figure 2: The biosensor workflow integrates sample processing and detection into a single, rapid automated system.
The Scientist's Toolkit: Essential Research Reagent Solutions
The development and operation of advanced biosensors rely on a suite of specialized reagents and materials.
Table 3: Key Research Reagent Solutions for Biosensor Development
| Reagent/Material | Function | Example Application |
|---|---|---|
| Mannitol Salt Agar (MSA) | Selective culture medium for S. aureus; also used as a matrix in optical biosensors [4]. | Provides metabolic substrate for colorimetric change detection. |
| PYR1 Scaffold | A malleable plant hormone receptor used as a reprogrammable scaffold for evolving new biosensors [16]. | Engineered to detect synthetic cannabinoids and organophosphates. |
| Aptamers | Single-stranded DNA or RNA oligonucleotides that bind specific targets with high affinity; used as biorecognition elements [17]. | Core component of "aptasensors" for detecting food hazards, pathogens, and toxins. |
| Polydopamine/Melanin-like Materials | Biocompatible coating that mimics mussel adhesion; used for surface functionalization of sensors [17]. | Enhances biocompatibility and provides a versatile platform for immobilization in electrochemical sensors. |
| Gold-Silver Nanostars | Plasmonic nanoparticles with sharp tips that provide intense signal enhancement for SERS [17]. | Platform for ultra-sensitive detection of cancer biomarkers like α-fetoprotein. |
| Recombinase-Aided Amplification (RAA) Reagents | Isothermal enzymatic amplification system for nucleic acids [15]. | Enables rapid, instrument-free detection of specific bacterial genes on test strips. |
The data presented unequivocally demonstrates a paradigm shift in detection speed. The transition from days to minutes is made possible by abandoning the principle of waiting for microbial replication in favor of directly detecting microbial presence through metabolic activity, specific antigens, or genetic markers. A critical aspect of this shift is the evaluation of biosensor accuracy against traditional methods. The described optical biosensor, for instance, does not invent a new growth curve but provides a more sensitive, automated, and rapid way to monitor the early metabolic changes associated with that curve [4]. Similarly, rapid molecular methods like RAA-TS-DTL achieve high consistency (100% in cited studies) with traditional culture methods while being four times more sensitive and 96% faster [15].
The implications for research and drug development are profound. Rapid biosensing technologies facilitate real-time monitoring of bioprocesses, quick quality control of cell cultures, and high-throughput screening. Furthermore, the emergence of intravascular biosensors points to a future where monitoring extends beyond the bench to continuous, in-vivo sensing of physiological parameters and biomarkers [18]. As these technologies mature, the focus will expand beyond raw speed to encompass the ASSURED criteria (Affordable, Sensitive, Specific, User-friendly, Rapid and robust, Equipment-free, and Deliverable to end-users) to ensure they meet the practical needs of global health [19]. The ongoing integration of nanomaterials, synthetic biology scaffolds like PYR1 [16], and artificial intelligence will further enhance sensitivity, specificity, and the ability to multiplex, solidifying the role of biosensors as an indispensable tool in modern science and medicine.
The detection and identification of pathogenic microorganisms traditionally rely on culture-based methods, which, while considered a gold standard, are often characterized by prolonged incubation periods of 24 to 72 hours [20] [4]. This time lag presents a significant bottleneck in clinical diagnostics, food safety assurance, and outbreak prevention, where rapid results are critical for timely intervention. In recent years, biosensor technology has emerged as a powerful alternative, offering the promise of rapid, sensitive, and specific detection. Among the various types, electrochemical, optical, and piezoelectric biosensors have formed a formidable arsenal, each with unique operating principles and advantages. This guide provides an objective comparison of these three biosensor systems, framing their performance and experimental protocols within a broader thesis evaluating their accuracy against traditional culture methods. The content is tailored for researchers, scientists, and drug development professionals who require a detailed, data-driven understanding of these technologies.
Performance Comparison at a Glance
The following table summarizes the key performance metrics and characteristics of electrochemical, optical, and piezoelectric biosensors, particularly in the context of pathogen detection.
Table 1: Comparative Overview of Major Biosensor Types for Pathogen Detection
| Feature | Electrochemical Biosensors | Optical Biosensors | Piezoelectric Biosensors |
|---|---|---|---|
| Transduction Principle | Measures changes in electrical properties (current, potential, impedance) due to bio-recognition events [21]. | Measures changes in light properties (absorbance, fluorescence, reflectance, refractive index) [4] [22]. | Measures changes in mass on the sensor surface via oscillation frequency shift [23] [24]. |
| Typical Detection Limit | As low as 1 CFU mL⁻¹ for E. coli [25]. | Enables detection in 90-120 minutes for S. aureus [4]. | High mass sensitivity, suitable for label-free detection of biomarkers [24]. |
| Linearity Range | Demonstrated from 10 to 10¹⁰ CFU mL⁻¹ [25]. | Wide range, dependent on specific optical method (e.g., colorimetry, SPR) [22]. | Linear response to mass loading on the sensor surface [24]. |
| Key Advantage | High sensitivity, portability, cost-effectiveness, and compatibility with miniaturization [25] [21]. | High sensitivity, capacity for multiplexing, and potential for visual readout [4] [22]. | Label-free, real-time monitoring of binding events [23] [24]. |
| Key Limitation/Challenge | Stability of biorecognition elements and potential sensor drift [21]. | Optical interference from complex sample matrices can be a challenge [4]. | Sensitive to environmental vibrations and temperature fluctuations [23]. |
| Example Experiment | Detection of E. coli using Mn-doped ZIF-67/antibody sensor [25]. | Detection of S. aureus via color change in Mannitol Salt Agar [4]. | Detection of Immunoglobulin E (IgE) using Quartz Crystal Microbalance (QCM) [24]. |
Detailed Experimental Protocols and Methodologies
To understand the data generated by these biosensors, a clear grasp of their underlying experimental workflows is essential. The following diagrams and protocols outline the general procedures for each type.
Electrochemical Biosensor Protocol
Electrochemical biosensors convert a biological recognition event into a quantifiable electrical signal. A prominent example is the detection of E. coli using a Mn-doped Zeolitic Imidazolate Framework-67 (ZIF-67) conjugated with anti-O antibody [25].
Diagram 1: Workflow for Electrochemical E. coli Detection
Detailed Methodology [25]:
Sensor Fabrication:
- Material Synthesis: A bimetallic Co/Mn Zeolitic Imidazolate Framework (ZIF-67) is synthesized through a solvothermal process. The incorporation of Mn induces phase reconstruction, enhances surface area, and improves electron transfer.
- Characterization: The synthesized material is characterized using X-ray diffraction (XRD) to confirm crystallinity, Fourier-Transform Infrared (FTIR) spectroscopy to identify functional groups, and N₂ adsorption-desorption measurements to determine surface area and porosity via the Brunauer-Emmett-Teller (BET) method.
- Electrode Modification: The working electrode (e.g., glassy carbon or screen-printed carbon electrode) is modified with the optimized Co/Mn ZIF composite.
Bioreceptor Immobilization: Anti-E. coli O-specific antibodies are conjugated onto the surface of the Co/Mn ZIF-modified electrode. This step introduces specific binding sites and modulates the wettability of the sensor surface. The successful conjugation can be confirmed by the appearance of amide I and II vibrational modes in FTIR spectra.
Sample Measurement and Transduction:
- Binding Event: When E. coli cells are introduced, they bind specifically to the immobilized antibodies. This binding event selectively blocks electron transfer at the electrode interface.
- Signal Measurement: The change in electron transfer resistance is quantitatively measured using electrochemical techniques such as Electrochemical Impedance Spectroscopy (EIS). The measured impedance increase correlates directly with the bacterial concentration in the sample.
Optical Biosensor Protocol
Optical biosensors detect pathogens by measuring changes in the properties of light. A representative method is the detection of Staphylococcus aureus by monitoring colorimetric changes in a culture medium [4].
Diagram 2: Workflow for Optical S. aureus Detection
Detailed Methodology [4]:
Optical Setup Configuration: A simplified optical system is constructed, typically comprising a light-emitting diode (LED) as the light source and a light-dependent resistor (LDR) or photodiode as the detector. The system is designed to measure light transmittance through a sample container at specific wavelengths.
Sample Preparation and Incubation:
- The sample is inoculated into a selective culture medium, such as Mannitol Salt Agar (ASM), which is specific for S. aureus.
- The medium contains a pH indicator. As target bacteria metabolize nutrients, they produce acidic byproducts.
Signal Transduction: The metabolic activity causes a drop in pH, leading to a visible color change in the medium and a corresponding change in its optical transmittance.
Signal Detection and Analysis: The LED transmits light through the medium, and the photodetector on the other side quantifies the intensity of the transmitted light. A change in bacterial concentration over time alters the transmittance, which is recorded by the detector. This system can detect bacterial growth in approximately 90–120 minutes, offering a significant reduction in detection time compared to traditional culture methods that rely on visual colony inspection.
Piezoelectric Biosensor Protocol
Piezoelectric biosensors operate on the principle of mass-sensitive detection. A common platform is the Quartz Crystal Microbalance (QCM), which can be used for detecting biomarkers like Immunoglobulin E (IgE) [24].
Diagram 3: Workflow for Piezoelectric Biosensor Operation
Detailed Methodology [24]:
Sensor Platform: The core of the sensor is a piezoelectric crystal, typically quartz, with metal electrodes on its surfaces. Applying an alternating voltage causes the crystal to oscillate at a specific fundamental resonant frequency.
Surface Functionalization: The surface of the crystal is modified with a biorecognition element, such as an antibody or an aptamer (a single-stranded DNA or RNA molecule that binds to a specific target), which provides selectivity for the target analyte (e.g., IgE).
Measurement: The crystal's resonant frequency is continuously monitored. When the target analyte binds to the immobilized bioreceptor on the surface, it increases the mass loaded on the crystal.
Signal Transduction: The increase in mass results in a decrease in the resonant frequency of the crystal (Δf). This frequency shift is directly proportional to the mass bound to the surface, as described by the Sauerbrey equation for rigid, thin films. This allows for real-time, label-free monitoring of the binding event.
The Scientist's Toolkit: Key Research Reagent Solutions
The development and operation of high-performance biosensors rely on a suite of specialized reagents and materials. The following table details key components and their functions in biosensor experiments.
Table 2: Essential Research Reagents and Materials in Biosensor Development
| Reagent/Material | Function in Biosensing Experiments | Example Biosensor Type |
|---|---|---|
| Aptamers | Single-stranded DNA or RNA sequences that act as synthetic bioreceptors; bind to specific targets (proteins, cells) with high affinity, expanding detection to non-nucleic acid targets [20]. | Electrochemical, Optical, Piezoelectric |
| CRISPR/Cas Systems | Provides exceptional specificity for nucleic acid detection; the collateral cleavage activity of Cas12/Cas13 enzymes can be harnessed to generate amplified signals [20]. | Electrochemical, Optical |
| Nanomaterials (e.g., Graphene, AuNPs, QDs) | Enhance signal transduction by providing high surface area, excellent conductivity, or unique optical properties (e.g., fluorescence, plasmonic enhancement) [20] [17] [21]. | Electrochemical, Optical |
| Metal-Organic Frameworks (MOFs) | Porous crystalline materials used to modify electrode surfaces; enhance electron transfer and offer large surface areas for immobilizing bioreceptors or enzymes [25]. | Electrochemical |
| Enzymes (e.g., FAD-GDH) | Biological catalysts used in recognition layers; catalyze reactions involving the target analyte, producing a measurable product (e.g., a mediator for electron transfer) [26]. | Electrochemical |
| Water-Soluble Mediators (e.g., Quinone derivatives) | Shuttle electrons between the enzyme's active site and the electrode surface, facilitating the amperometric measurement of the enzymatic reaction rate [26]. | Electrochemical |
| Selective Culture Media (e.g., Mannitol Salt Agar) | Supports the growth of specific pathogens while inhibiting others; often contains pH indicators for colorimetric detection of metabolic byproducts [4]. | Optical |
The field of biosensing is continuously evolving, driven by the convergence of multiple advanced technologies. A significant trend is the integration of artificial intelligence (AI) and machine learning, which enhances biosensor capabilities by improving signal processing, enabling intelligent pattern recognition for multiplexed detection, and facilitating automated decision-making, particularly in optical biosensors [22]. Furthermore, the push towards miniaturization and the development of flexible sensors is expanding applications into wearable health monitoring and smart diagnostics [21] [27]. The synergy of different sensing strategies, such as the combination of optoelectronic mechanisms, is also being explored to overcome the limitations of individual platforms and achieve superior analytical performance [24].
In conclusion, the expanding arsenal of electrochemical, optical, and piezoelectric biosensors provides the scientific community with a diverse and powerful toolkit for pathogen detection and biomarker analysis. While each type has distinct operational principles, advantages, and challenges, they collectively offer a compelling alternative to traditional culture methods, primarily through drastically reduced detection times—from days to hours or even minutes—while maintaining high sensitivity and specificity. The choice of biosensor depends heavily on the specific application requirements, such as the need for portability, label-free detection, or visual readout. For researchers evaluating these technologies, the future lies in leveraging novel materials, intelligent data analysis, and integrated systems to develop next-generation biosensors that are not only accurate but also accessible for point-of-care diagnostics and routine monitoring.
Biosensors in Action: Methodologies and Sector-Specific Applications for Pathogen Detection
The accurate and timely detection of pathogenic microorganisms is a critical challenge across clinical, food, and environmental sectors. Traditional culture-based methods, while specific, typically require 24 to 72 hours to yield results, creating significant delays in diagnosis and intervention [4] [6]. This limitation is particularly pressing given the global burden of infectious diseases; bacterial infections alone were responsible for an estimated 7.7 million deaths in 2019 [4]. Optical biosensors have emerged as a transformative alternative, offering rapid, portable, and highly sensitive detection capabilities. By leveraging principles of colorimetry, fluorescence, and surface plasmon resonance (SPR), these biosensors convert biological recognition events into quantifiable optical signals, enabling real-time analysis and a significant reduction in detection time [4] [28] [6]. This guide provides a comparative evaluation of these three core optical biosensing technologies, framing their performance against traditional methods and detailing the experimental protocols that underpin their application in modern diagnostics.
Technology Comparison: Colorimetry, Fluorescence, and SPR
Optical biosensors function by detecting changes in optical properties—such as absorption, reflectance, fluorescence intensity, or refractive index—that occur when a target analyte interacts with a biological recognition element immobilized on the sensor surface [28]. The following table provides a quantitative comparison of the three primary technologies discussed in this guide.
Table 1: Performance Comparison of Key Optical Biosensor Technologies
| Technology | Typical Detection Limit (CFU/mL) | Detection Time | Key Advantages | Primary Limitations | Example Pathogens Detected |
|---|---|---|---|---|---|
| Colorimetric | 10 - 1000 [28] [29] | 10 min - 2.5 hours [4] [29] | Visual readout, low cost, simplicity, equipment-free potential [28] [29] | Lower sensitivity, susceptible to sample matrix interference [28] | S. aureus, E. coli, Salmonella, L. monocytogenes [4] [28] |
| Fluorescence | As low as single molecule (digital assays) [30] | Minutes to hours [28] | Very high sensitivity, multiplexing capability, real-time monitoring [28] [30] | Can require complex labeling, potential photobleaching, instrument-dependent [28] | Various pathogens via immunoassays; NDD biomarkers [28] [30] |
| Surface Plasmon Resonance (SPR) | < 100 [29] | Real-time (minutes) [4] | Label-free, real-time kinetic data, high specificity [4] [31] | High cost, complex data analysis, bulk refractive index sensitivity [28] | S. aureus, E. coli, P. aeruginosa [4] [11] |
Table 2: Comparison with Traditional Culture Methods
| Parameter | Traditional Culture Methods | Optical Biosensors (Aggregate) |
|---|---|---|
| Time-to-Result | 24 - 72 hours [4] [6] | 10 minutes - 4 hours [4] [28] [29] |
| Reagent Consumption | High (mL to L volumes) | Low (µL volumes; up to 140x fewer reagents) [4] |
| Portability | Low (requires lab setting) | High to Medium (potential for point-of-care use) [4] [6] |
| Sensitivity | High (can detect single CFU) | Moderate to Very High (varies by technology) |
| Information Gained | Presence/Absence, species ID | Presence, concentration, kinetic binding data (e.g., SPR) [4] |
Experimental Protocols for Biosensor Evaluation
To ensure the accurate evaluation of biosensor performance against traditional methods, standardized experimental protocols are essential. The following sections detail common methodologies for each technology.
Colorimetric Detection via Metabolic Activity
This protocol is adapted from studies detecting Staphylococcus aureus using Mannitol Salt Agar (MSA) [4] [29].
Principle: Bacterial metabolic byproducts (e.g., acids from mannitol fermentation) cause a pH shift in the culture medium, inducing a visible color change in a pH indicator (e.g., phenol red from red to yellow) [4] [29].
Materials:
- Selective culture medium (e.g., Mannitol Salt Agar for S. aureus)
- Light source (e.g., LEDs at specific wavelengths)
- Optical detector (e.g., photodiode, spectrometer, or smartphone camera)
- Temperature-controlled incubation chamber
Procedure:
- Sample Preparation: Inoculate the liquid or solid culture medium with the test sample.
- Incubation: Place the inoculated medium in the sensor system and incubate at 35-37°C.
- Optical Measurement: The light source illuminates the medium, and the detector measures the intensity of transmitted light at specific wavelengths (e.g., in the 400-700 nm visible range) over time.
- Data Analysis: The change in transmittance intensity is correlated with bacterial concentration. A positive result is confirmed by a significant change in the optical signal (e.g., a 50% reduction in transmittance at a key wavelength) within 90-120 minutes [4].
Fluorescence-Based Immunoassay
This protocol outlines a standard sandwich immunoassay, a workhorse for fluorescent pathogen detection [28] [30].
Principle: Target pathogens are captured between a surface-immobilized antibody and a fluorescently-labeled detection antibody, generating a signal proportional to the pathogen concentration.
Materials:
- Capture antibodies specific to the target pathogen
- Fluorescently-labeled detection antibodies (e.g., with FITC, quantum dots)
- Solid substrate (e.g., microtiter plate, functionalized glass slide)
- Fluorescence reader (or microscope for imaging-based sensors)
- Washing buffers
Procedure:
- Immobilization: Coat the solid substrate with capture antibodies and block non-specific binding sites.
- Sample Incubation: Introduce the sample to the substrate, allowing pathogens to bind to the capture antibodies.
- Washing: Remove unbound material by washing.
- Labeling: Incubate with fluorescent detection antibodies to form a "sandwich" complex.
- Final Washing: Remove unbound detection antibodies.
- Signal Readout: Measure the fluorescence intensity. The limit of detection (LOD) can be calculated using the formula: LOD = 3σ/S, where σ is the standard deviation of the blank signal and S is the sensitivity (slope of the calibration curve) [6].
Label-Free Detection via Surface Plasmon Resonance (SPR)
SPR measures binding events in real-time without labels by detecting changes in the refractive index at a metal sensor surface [4] [28].
Principle: At a specific angle and wavelength of incident light, plasmon waves are excited at a thin metal (typically gold) film, causing a drop in reflected light intensity. The binding of an analyte to the surface alters the refractive index, shifting this "resonance" angle, which is monitored in real-time [4].
Materials:
- SPR instrument with a gold-coated sensor chip
- Running buffer (e.g., PBS)
- Ligand (e.g., specific antibody or aptamer)
- Analytic (purified pathogen or bacterial lysate)
Procedure:
- Surface Functionalization: Immobilize the ligand (capture molecule) onto the gold sensor surface using covalent chemistry (e.g., amine coupling).
- Baseline Establishment: Flow running buffer over the sensor surface to establish a stable baseline signal.
- Association Phase: Inject the analyte sample over the sensor surface. The binding event causes an increase in the SPR signal (response units, RU).
- Dissociation Phase: Switch back to running buffer. The decrease in signal indicates the dissociation of the analyte from the ligand.
- Data Analysis: Analyze the resulting sensorgram to determine kinetic parameters (association rate,
k_a, and dissociation rate,k_d) and the equilibrium dissociation constant (K_D = k_d / k_a), which quantifies affinity [4].
Signaling Pathways and Workflows
The fundamental operational principles of colorimetric, fluorescence, and SPR biosensors can be visualized through the following logical pathways.
Diagram 1: Core Sensing Pathways of Optical Biosensors.
The Scientist's Toolkit: Essential Research Reagent Solutions
Successful development and implementation of optical biosensors rely on a suite of specialized reagents and materials.
Table 3: Key Research Reagent Solutions for Optical Biosensor Development
| Reagent/Material | Function | Example Application |
|---|---|---|
| Mannitol Salt Agar (MSA) | Selective and differential culture medium. High salt selects for Staphylococci; mannitol fermentation with pH indicator enables colorimetric detection [4]. | Selective growth and colorimetric detection of S. aureus [4] [29]. |
| Gold Nanoparticles (AuNPs) | Colorimetric reporters. Aggregation or conformational changes around bacteria cause visible color shifts from red to blue [28] [30]. | Label-free colorimetric detection of multiple pathogens [28]. |
| Specific Antibodies | Biorecognition elements that bind with high affinity and specificity to target pathogens or their markers [6]. | Capture and detection in fluorescence immunoassays and SPR sensors [28] [30]. |
| Fluorescent Dyes/Labels | Signal generators. Emit light at a specific wavelength upon excitation, providing a detectable signal for quantification [28]. | Labeling detection antibodies in fluorescence-based biosensors [28] [30]. |
| Molecularly Imprinted Polymers (MIPs) | Synthetic polymer receptors with tailor-made cavities for specific analytes. Offer an artificial, stable alternative to antibodies [6]. | Recognition element in electrochemical and optical sensors for various targets [6]. |
| CRISPR-Cas Systems | Nucleic acid detection. Cas proteins (e.g., Cas12a, Cas13) with guide RNA bind target DNA/RNA and exhibit collateral cleavage activity, which can be linked to a fluorescent reporter [30]. | Ultra-sensitive, specific detection of viral pathogens [30]. |
The data and protocols presented herein demonstrate that optical biosensors—specifically colorimetric, fluorescent, and SPR-based platforms—offer a compelling alternative to traditional culture methods, primarily through radically reduced detection times and minimal reagent use. The choice of technology involves a trade-off between speed, cost, sensitivity, and informational depth. Colorimetry excels in simplicity and low cost, fluorescence in sensitivity and multiplexing, and SPR in providing label-free, real-time kinetic data.
Future advancements are likely to be driven by the integration of artificial intelligence (AI) and machine learning for enhanced signal processing and pattern recognition, improving analytical accuracy in complex samples [22]. Furthermore, the convergence of these optical technologies with microfluidics for automated sample handling and nanomaterials for signal enhancement will continue to push the limits of detection, paving the way for robust, multiplexed, and deployable diagnostic systems for researchers and clinicians alike [28] [31].
The accurate and timely detection of bacterial metabolism is a cornerstone of microbiology, with profound implications for clinical diagnostics, food safety, and pharmaceutical development. For over a century, traditional culture-based methods have served as the gold standard for pathogen detection. However, their lengthy procedural times—often requiring 5 to 7 days to obtain results—present significant limitations for rapid response scenarios [32] [33]. In recent years, electrochemical biosensing platforms have emerged as powerful alternatives, offering rapid, sensitive, and real-time analysis of bacterial metabolic activity. Among these, amperometric and impedimetric biosensors represent two of the most promising technologies, each with distinct operational principles and performance characteristics [32] [34] [35].
This guide provides an objective comparison of these electrochemical platforms, evaluating their performance against traditional culture methods and within the context of broader thesis research on biosensor accuracy. We present structured experimental data, detailed methodologies, and essential resource information to assist researchers, scientists, and drug development professionals in selecting appropriate sensing platforms for specific applications in bacterial metabolism detection.
Performance Comparison: Amperometric vs. Impedimetric Biosensors
The table below summarizes the key performance characteristics of amperometric and impedimetric biosensors for detecting bacterial metabolism, with comparative data against traditional culture methods.
Table 1: Performance comparison of biosensing platforms for bacterial detection
| Feature | Amperometric Biosensors | Impedimetric Biosensors | Traditional Culture Methods |
|---|---|---|---|
| Detection Principle | Measurement of current from redox reactions [34] | Measurement of impedance change at electrode interface [32] [35] | Microbial growth and biochemical testing [33] |
| Typical Detection Time | Minutes to hours [34] | 3-5 minutes to hours [32] [36] | 5-7 days [32] [33] |
| Limit of Detection (LOD) | Varies; ~1 log CFU/g in cell-based sensors [33] | 9 CFU/mL for Salmonella [36]; aM-zM for nucleic acids [37] | Culture-dependent (theoretical: 1 CFU) [33] |
| Label Requirement | Often requires redox mediators/enzymes [34] [35] | Label-free (non-Faradaic) or with redox probes (Faradaic) [36] [35] | Not applicable |
| Selectivity Control | Specific metabolic pathways; engineered cells [33] [34] | Biorecognition elements (antibodies, aptamers, phages) [32] | Selective media and enrichment broths [33] |
| Viability Discrimination | Based on metabolic activity [34] | Possible with live-cell specific capture [36] | Yes (inherent) [33] |
| Key Advantage | Direct measurement of metabolic flux | High sensitivity, label-free operation | High accuracy, isolates live bacteria |
| Primary Limitation | Interference from electroactive species [34] | Signal complexity in complex media [32] | Time-consuming and labor-intensive [32] [33] |
Experimental Protocols for Key Studies
Impedimetric Protocol for LiveSalmonella typhimuriumDetection
This protocol enables viability-specific detection of live S. typhimurium in food samples using non-Faradaic electrochemical impedance spectroscopy (EIS) [36].
1. Electrode Functionalization:
- Utilize a ZnO/Au-modified working electrode.
- Activate the surface with a crosslinker (3,3'-dithiobis(sulfosuccinimidyl propionate), DTSSP).
- Immobilize monoclonal Salmonella typhimurium antibodies (clone AC04) onto the DTSSP-linked surface.
- Block non-specific binding sites using SuperBlock Blocking Buffer.
2. Sample Preparation and Measurement:
- Incurate the functionalized electrode with the sample (e.g., salad extract) for 5 minutes.
- Perform non-Faradaic EIS measurement in 1× phosphate-buffered saline (PBS).
- Apply a low-amplitude sinusoidal voltage signal (10 mV) across a frequency range (e.g., 100 Hz to 1 MHz).
- Monitor the change in charge-transfer resistance (Rct) or interfacial capacitance.
3. Data Analysis:
- Fit impedance data to an appropriate equivalent circuit model (e.g., Randles circuit).
- Correlate the impedance change with bacterial concentration using a calibration curve.
Cell-Based Amperometric Protocol forSalmonellaspp. Detection
This protocol uses membrane-engineered mammalian cells as the recognition element in a biosensor system (e.g., B.EL.D) [33].
1. Biosensor Cell Preparation:
- Culture monkey African green kidney (Vero) cells in Dulbecco's medium (DMEM) with 10% fetal bovine serum.
- Detach cells from culture vessels using trypsin/EDTA.
- Resuspend the cell pellet in PBS containing anti-Salmonella spp. antibodies.
- Perform electroinsertion of antibodies into cell membranes using electroporation (e.g., two square pulses at 1800 V/cm with an Eppendorf Eporator).
- Incubate the cell-antibody mixture in nutrient medium at 37°C with 5% CO₂ for 24 hours to create the final biosensors (Vero/anti-Salmonella cells).
2. Sample Preparation and Analysis:
- Enrich food samples (meat products) in selective broth for 24 hours.
- Mechanically detach the prepared biosensor cells and collect them in nutrient medium in Eppendorf tubes.
- Mix the sample with the biosensor cell suspension.
- Measure the change in cell membrane potential using the bioelectric recognition assay (BERA) principle.
- The analytical result is typically available within 3 minutes after the 24-hour enrichment period.
Signaling Pathways and Experimental Workflows
The following diagram illustrates the core operational principles and electron transfer pathways in amperometric and impedimetric biosensors for detecting bacterial metabolism.
The diagram outlines the fundamental signaling pathways for amperometric (top) and impedimetric (bottom) biosensors, both originating from bacterial metabolic activity. In the amperometric pathway, bacterial metabolism leads to redox-active products (e.g., hydrogen peroxide), which participate in electron transfer reactions, ultimately generating a measurable current at the working electrode [34] [38]. In the impedimetric pathway, the capture of bacteria or their metabolic products on the sensor surface alters the electrical properties (resistance and capacitance) at the electrode-electrolyte interface. This change is quantified through Electrochemical Impedance Spectroscopy (EIS) as a shift in impedance [32] [36] [35].
The Scientist's Toolkit: Essential Research Reagents and Materials
The table below lists key reagents, materials, and equipment essential for developing and implementing electrochemical biosensors for bacterial metabolism detection.
Table 2: Essential research reagents and materials for electrochemical biosensing
| Item | Function/Application | Example from Research |
|---|---|---|
| Anti-Salmonella antibodies | Biorecognition element for specific capture | Clone AC04 used in impedimetric sensor for S. typhimurium [36] |
| Vero Cells | Platform for creating membrane-engineered biosensors | Used in cell-based amperometric sensor for Salmonella spp. [33] |
| Crosslinker (DTSSP) | Immobilizes biorecognition elements on electrode surface | Used to anchor antibodies on ZnO/Au electrode [36] |
| Electroporator | Enables antibody electroinsertion into cell membranes | Eppendorf Eporator used for creating Vero/anti-Salmonella cells [33] |
| Redox Mediators | Facilitate electron transfer in amperometric sensors | e.g., Ferricyanide; used with S. cerevisiae in MFCs [34] |
| ZnO/Au Electrode | Transduction platform for impedimetric sensing | Provides high sensitivity and stability for pathogen detection [36] |
| Polymer Matrices | Entrapment of cells/enzymes on electrode surface | Alginate, PVA-SbQ used for whole-cell immobilization [34] |
| Potentiostat with EIS | Core instrumentation for impedance measurements | Required for applying frequency sweep and measuring impedance [36] |
Amperometric and impedimetric biosensors represent complementary electrochemical platforms that offer significant advantages over traditional culture methods for assessing bacterial metabolism, primarily through drastically reduced detection times. The choice between these platforms depends on the specific research requirements: impedimetric biosensors excel in label-free, rapid detection with high sensitivity, while amperometric biosensors provide direct measurement of metabolic fluxes, particularly when integrated with whole-cell systems [33] [36] [35].
When evaluated against the thesis context of assessing biosensor accuracy versus traditional methods, both platforms show strong correlation with standard techniques but address different aspects of bacterial detection. Impedimetric sensors demonstrate exceptional performance in viable cell detection, while amperometric systems effectively probe specific metabolic functions. For researchers, the integration of these electrochemical platforms offers a powerful approach to obtain rapid, accurate data on bacterial metabolism, accelerating diagnostics and drug development processes.
This guide provides a comparative analysis of rapid detection methods for key foodborne pathogens, evaluating their performance against traditional culture-based techniques to help researchers select optimal tools for food safety monitoring.
Comparative Performance: Rapid Methods vs. Traditional Culture
The table below summarizes the performance metrics of advanced detection methods compared to traditional culture for key foodborne pathogens.
Table 1: Performance Comparison of Pathogen Detection Methods
| Pathogen | Detection Method | Total Time | Detection Limit | Key Advantages | Key Limitations |
|---|---|---|---|---|---|
| Listeria monocytogenes | Traditional Culture (ISO 11290-1) [39] | 24-72 hours [40] | 5-100 CFU/25 g [39] | Gold standard; detects viable cells | Laborious; slow; prone to false negatives from competing microflora [39] |
| Streamlined Workflow (Culture + qPCR) [40] | ~8 hours [40] | 1-5 cells/25 g [40] | Highly sensitive; significantly faster than standard culture | Requires enrichment and multiple integrated steps | |
| Closed Dumbbell-mediated Amplification (CDA) [41] | ~30-60 minutes [41] | 1 copy/μL [41] | Isothermal; simple primer design; visual (HNB) or real-time readout | Laboratory-developed; requires DNA extraction | |
| Colorimetric Biosensor (Protease Detection) [42] | < 1 minute [42] | 2.17×10² CFU/mL [42] | Ultra-rapid; low-cost; simple; suitable for in-field use | Lower sensitivity; detects protease, not genetic material | |
| Escherichia coli | Traditional Culture (ISO 9308-1) [43] | 18-24 hours [43] | 1 CFU/filtered volume [43] | Trusted and sensitive | Slow; requires visual colony counting |
| MICA Advance (Culture + Fluorescence) [43] | ~6 hours [43] | 1 CFU/filtered volume [43] | Same-shift results; digital output; uses standard agar | Focuses on E. coli only (not other coliforms) | |
| DNA-ELISA Biosensor [44] | ~4 hours [44] | ~40,000 cells [44] | Direct genomic DNA detection without amplification | Lower sensitivity than amplification methods | |
| OmpA-targeting Nanobodies [45] | Information Missing | < 50 CFU/mL [45] | Captures viable cells for further testing; high specificity | Requires careful handling of O-antigen interference | |
| Staphylococcus aureus | Traditional Culture (e.g., MSA, Baird-Parker) [46] | 24-48 hours [46] | Information Missing | Foundational; allows further characterization | Cannot distinguish toxin-producing strains [46] |
| Bacteriophage-based Colorimetric Biosensor [47] | 14 minutes [47] | 78 CFU/mL [47] | Detects viable cells; high specificity via RBP; rapid | Laboratory-developed; performance may vary with food matrix | |
| Nanomotion Sensing [48] | Real-time (minutes) [48] | Information Missing | Provides real-time metabolic activity; can test antibiotic susceptibility | Specialized equipment required; not for pathogen identification |
Experimental Protocols and Workflows
Protocol: Streamlined Detection ofListeria monocytogenes
This integrated workflow enables detection of low-level contamination within 8 hours [40].
Workflow Diagram: Streamlined Listeria Detection
- Sample Preparation and Enrichment: Artificially contaminate 25 g of ground beef with a low level (1-5 cells) of L. monocytogenes. The sample is homogenized in a enrichment broth and incubated for a shortened period to increase bacterial count [40].
- Sample Pre-processing and Concentration: The enriched sample is processed using a filtration-based method to concentrate the target bacteria and remove potential PCR inhibitors from the food matrix [40].
- Magnetic Separation: Specific antibodies or other binding agents conjugated to magnetic beads are used to selectively capture and separate L. monocytogenes from the sample concentrate, improving detection specificity [40].
- Nucleic Acid Extraction and Real-time PCR: DNA is extracted from the captured bacteria. Real-time PCR is performed using primers and probes specific to L. monocytogenes genes (e.g., hly). The detection limit of this streamlined workflow is as low as 2 cells per 25-gram sample [40].
Protocol: Isothermal Amplification forListeria(CDA Assay)
This method offers a rapid, simple alternative to qPCR, suitable for lab and field use [41].
- Primer Design: Design two core primers (MF and MR, ~30 nucleotides) based on the conserved region of the target L. monocytogenes hly gene. Outer primers (F2 and R2) can be added to accelerate the reaction (O-CDA) [41].
- DNA Extraction: Extract genomic DNA from food samples or bacterial cultures using a commercial DNA extraction kit [41].
- CDA Reaction Setup: Prepare a 25 μL reaction mixture containing:
- 8 U Bst 2.0 WarmStart DNA polymerase
- 2 μL of target DNA template
- Specifically designed MF and MR primers
- dNTPs, and reaction buffer [41]
- Amplification and Detection:
- Real-time Fluorescence CDA: Incubate the reaction at a constant temperature (e.g., 63°C) for 30-60 minutes in a real-time PCR machine while monitoring fluorescence. Perform melting curve analysis post-amplification for specificity confirmation [41].
- Visual Colorimetric CDA: Include Hydroxy Naphthol Blue (HNB) dye in the reaction master mix. A color change from violet to sky blue indicates a positive result, observable with the naked eye after incubation [41].
Workflow Diagram: CDA Assay Principle
Protocol: Phage-Based Detection ofStaphylococcus aureus
This biosensor detects viable S. aureus cells rapidly using a bacteriophage as a biorecognition element [47].
- Biosensor Construction: Synthesize a CuCo₂S₄ nanozyme with peroxidase-like activity. Immobilize the bacteriophage SapYZU01 onto the nanozyme surface to create the SapYZU01@CuCo₂S₄ complex. The phage's Receptor Binding Protein (RBP) provides high specificity by binding to wall teichoic acid (WTA) on S. aureus [47].
- Sample Preparation and Incubation: Homogenize the ready-to-eat food sample (e.g., braised beef, teriyaki chicken) in a buffer. Incubate the prepared sample with the SapYZU01@CuCo₂S₄ biosensor for 2 minutes. Viable S. aureus cells bind specifically to the phage on the biosensor [47].
- Colorimetric Reaction and Detection: Add the substrate 3,3',5,5'-Tetramethylbenzidine (TMB) and H₂O₂ to the mixture. The nanozyme, if not blocked by bound bacteria, catalyzes the reaction, producing a blue color. The presence of S. aureus reduces the nanozyme's activity, leading to a decrease in color intensity. Measure the absorbance or observe the color change within 12 minutes. The entire process takes 14 minutes, with a detection limit of 78 CFU/mL [47].
Workflow Diagram: Phage-Based S. aureus Biosensor
The Scientist's Toolkit: Key Research Reagents and Materials
Table 2: Essential Reagents for Featured Pathogen Detection Methods
| Item | Function/Application | Example Pathogen/Target |
|---|---|---|
| Bst 2.0 WarmStart DNA Polymerase | Isothermal amplification enzyme for CDA and LAMP assays; resistant to inhibitors [41]. | Listeria monocytogenes (CDA) [41] |
| Hydroxy Naphthol Blue (HNB) | Colorimetric dye for endpoint visual detection in isothermal amplification; changes from violet to blue [41]. | Listeria monocytogenes (CDA) [41] |
| Specific Bacteriophage (e.g., SapYZU01) | Biorecognition element for biosensors; provides high specificity to viable target cells via RBP [47]. | Staphylococcus aureus [47] |
| Nanozymes (e.g., CuCo₂S₄) | Nanomaterial with enzyme-like activity (e.g., peroxidase) for signal generation in biosensors [47]. | Staphylococcus aureus [47] |
| Chromogenic Coliform Agar (CCA) | Selective culture medium for growth and differentiation of E. coli and coliforms [43]. | Escherichia coli (Culture/MICA) [43] |
| Magnetic Nanoparticles | Used for immunomagnetic separation of target pathogens from complex food samples [40] [42]. | Listeria monocytogenes [40] |
| OmpA-targeting Nanobodies (Nb01, Nb39) | Small recombinant antibodies for capturing and detecting a wide range of E. coli strains via a conserved surface protein [45]. | Escherichia coli [45] |
| PrepMan Ultra Reagent | Rapid preparation of DNA templates for PCR from bacterial cultures or enrichment broths [39]. | Listeria monocytogenes (PCR) [39] |
The data demonstrates that modern biosensors and molecular methods are revolutionizing food safety by providing rapid, sensitive, and specific detection of major pathogens, significantly outperforming traditional culture methods in speed while maintaining or enhancing analytical performance.
The field of clinical diagnostics is undergoing a profound transformation, moving away from time-consuming traditional methods toward rapid, sensitive, and personalized technologies. This evolution is particularly critical in life-threatening conditions like sepsis, where delayed diagnosis significantly increases mortality rates [49]. Traditional microbial culture methods, while specific, typically require 24 to 72 hours to provide results, creating a dangerous diagnostic gap during the critical early stages of infection [4] [50]. The emergence of biosensor technologies and their integration with advanced platforms like Organ-on-a-Chip (OoC) represents a paradigm shift, offering the potential for real-time, patient-specific diagnostic insights. These innovations are not merely incremental improvements but fundamental changes in how we approach disease management, enabling faster therapeutic interventions and moving us closer to the goal of precision medicine.
Biosensors function by integrating a biological recognition element with a physicochemical detector to measure analytes of interest. In clinical diagnostics, their value proposition lies in their speed, sensitivity, and portability [4]. When these biosensors are combined with OoC technology—microfluidic devices that mimic human organ physiology—they create a powerful synergistic platform. This integration allows for the continuous monitoring of cellular responses and biomarker secretion in a human-relevant system, bridging the long-standing gap between conventional in vitro models and human clinical outcomes [51] [52]. This article provides a comprehensive comparison of these advanced diagnostic technologies against traditional methods, detailing their experimental protocols, performance metrics, and transformative potential for clinical practice and drug development.
Biosensor Technology: A Direct Comparison with Traditional Culture Methods
Performance Data and Comparative Analysis
The superiority of modern biosensors over traditional diagnostic methods is quantifiable across multiple performance parameters. The table below provides a direct comparison of key metrics, illustrating the dramatic advancements offered by biosensor technology.
Table 1: Performance Comparison of Diagnostic Technologies for Bacterial Detection
| Performance Metric | Traditional Culture Methods | Optical Biosensors | MetaSPR Biosensors |
|---|---|---|---|
| Assay Time | 24 - 72 hours [4] [50] | 90 - 120 minutes [4] [50] | Real-time, continuous monitoring [49] |
| Sample Volume | Larger volumes often needed [53] | Up to 140x fewer reagents [50] | Minimal (nanoliter to microliter range) [53] [49] |
| Sensitivity | Variable; can yield false negatives [53] | High (e.g., for S. aureus) [4] | Extremely High (LOD: 39 pg/mL for sepsis biomarkers) [49] |
| Portability | Laboratory-bound equipment [53] | Compact and portable systems [4] | Platform-based, high-throughput [49] |
| Key Advantage | Specificity, low cost per test | Speed, simplicity, cost-effectiveness | Multiplexing, real-time kinetics, high sensitivity |
The data demonstrates that biosensors significantly outperform traditional methods in speed, often reducing detection times from days to hours or even minutes. This is largely due to their ability to detect specific biomarkers or metabolic products directly, bypassing the need for lengthy microbial cultivation [53] [4]. Furthermore, their miniaturized design leads to dramatic reductions in reagent consumption and sample volumes, making them more cost-effective and suitable for point-of-care testing [53] [50].
Detailed Experimental Protocol: MetaSPR Biosensor for Sepsis
To understand the operational principles of advanced biosensors, it is instructive to examine the methodology for a metasurface plasmon resonance (MetaSPR) biosensor, a cutting-edge platform for sepsis diagnosis [49].
1. Sensor Chip Fabrication: The process begins with the creation of a MetaSPR chip featuring a nanocup array structure.
- A silicon substrate is patterned with a nanocup array using standard photolithography and reactive ion etching.
- A UV-curable resin is applied to the silicon master mold, and a polyethylene terephthalate (PET) film is pressed onto it. The resin is cured through UV exposure, transferring the inverse nanostructure to the PET film.
- A thin layer of gold (approximately 50 nm) is deposited onto the nanostructured PET surface via sputtering to create the plasmonic sensing layer [49].
2. Surface Functionalization: The gold sensor surface is modified with a self-assembled monolayer of an oligopeptide sequence (e.g., CGGGK(N3), where N3 is azide) to enhance binding specificity and reduce non-specific adsorption. This creates a biointerface ready for antibody conjugation [49].
3. Assay Procedure (Sandwich Immunoassay):
- Capture: A solution of biomarker-specific capture antibodies is introduced to the functionalized sensor surface and immobilized.
- Blocking: The surface is treated with a blocking agent (e.g., bovine serum albumin) to prevent non-specific binding of other proteins.
- Sample Incubation: The clinical sample (e.g., patient plasma) is applied. Target biomarkers (PCT, CRP, SAA) bind to the immobilized capture antibodies.
- Detection & Amplification: Gold nanoparticle (AuNP)-conjugated detection antibodies are added, which bind to the captured biomarkers, forming a "sandwich" complex. The AuNPs amplify the local refractive index change, leading to a significantly enhanced MetaSPR signal.
- Real-Time Reading: The MetaSPR platform continuously monitors binding events in real-time, generating kinetic data for each sample and biomarker [49].
Diagram 1: MetaSPR Biosensor Workflow for Sepsis Biomarker Detection
The Scientist's Toolkit: Key Reagents for MetaSPR Sepsis Detection
The following table catalogues the essential reagents and materials required to perform the described MetaSPR sepsis biomarker assay, based on the protocol from the search results [49].
Table 2: Research Reagent Solutions for MetaSPR Sepsis Biosensing
| Reagent / Material | Function / Role in the Experiment |
|---|---|
| MetaSPR Chip (Nanocup Array) | The core sensing platform. The nanostructured gold surface enhances the plasmonic signal for highly sensitive detection. |
| Oligopeptide (e.g., CGGGK(N3)) | Forms a self-assembled monolayer on the gold surface for specific antibody immobilization and reduced non-specific binding. |
| Capture Antibodies (anti-PCT, anti-CRP, anti-SAA) | Immobilized on the sensor surface to specifically bind and capture target biomarkers from the sample. |
| Gold Nanoparticle (AuNP)-conjugated Detection Antibodies | Bind to the captured biomarkers, forming a sandwich complex. The AuNPs provide massive signal amplification. |
| Biomarker Proteins (PCT, CRP, SAA) | The analytes of interest; key protein biomarkers for sepsis and inflammatory response. |
| Clinical Plasma Samples | The real-world test matrix obtained from patient blood, used to validate the sensor's clinical utility. |
Organ-on-a-Chip Integration: The Next Frontier for Biosensing
Principles and Market Trajectory
Organ-on-a-Chip (OoC) technology represents a convergence of microengineering, cell biology, and biosensing. OoCs are microfluidic devices containing living human cells that are arranged to simulate the tissue architecture and physiological environment of human organs [51] [52]. A defining feature of advanced OoCs is the incorporation of continuous, real-time biosensors directly into the platform. This integration moves beyond simple endpoint analysis, allowing researchers to monitor dynamic cellular processes, such as the secretion of biomarker proteins like interleukin-6 (IL-6), in response to drugs or disease stimuli [51].
The transformative potential of this field is reflected in its rapid market growth. The global OoC market, valued at approximately USD 168 million in 2024, is projected to expand at a compound annual growth rate (CAGR) of over 35%, reaching nearly USD 3.45 billion by 2034 [54] [55]. This growth is largely driven by the demand for more human-relevant preclinical testing models from pharmaceutical and biotechnology companies, which currently account for the largest end-user segment [54] [55].
Experimental Protocol: Integrated Biosensor OoC for Inflammation Monitoring
A representative experimental workflow for an OoC platform with integrated biosensors, designed for monitoring inflammatory responses, is detailed below [51].
1. OoC Device Fabrication:
- Microfluidic Perfusion Chamber (MPC): The cell culture chamber is typically fabricated from polydimethylsiloxane (PDMS) using soft lithography. A computer-aided design defines a microchannel (e.g., 1 mm wide, 10 mm long). PDMS base and curing agent are mixed (e.g., 10:1 ratio), poured over the mold, and baked to cure. The PDMS slab is then peeled off, and inlet/outlet ports are punched.
- Porous Membrane: A transparent, porous polyester membrane is often incorporated to separate fluidic channels and support cell growth, mimicking the basal lamina in tissues.
- Sensor Integration: Commercially fabricated printed circuit boards (PCBs) can be used as a cost-effective substrate. Reduced graphene oxide (rGO) is often deposited to create the sensor transducers. These biosensor arrays are positioned downstream from the MPC to analyze the effluent medium without disrupting the cultured cells [51].
2. Biosensor Functionalization (for IL-6 Detection):
- An indirect immobilization strategy is used to preserve antibody activity.
- The rGO sensor surface is modified with streptavidin.
- A biotinylated anti-IL-6 antibody is then introduced. The strong biotin-streptavidin interaction securely anchors the capture antibody to the sensor surface [51].
3. Cell Culture and Assay:
- Human cell lines (e.g., MCF-7 breast cancer cells) are seeded into the microfluidic perfusion chamber and allowed to adhere and grow under constant perfusion of culture medium.
- To model an inflammatory response, cells are stimulated with an agent such as lipopolysaccharide (LPS).
- The cell culture medium flows from the MPC to the integrated biosensor unit.
- The functionalized sensors continuously monitor the concentration of IL-6 secreted by the cells into the flowing medium in real-time [51].
Diagram 2: Organ-on-a-Chip with Integrated Biosensor Workflow
Synergistic Applications and Future Outlook
The integration of biosensors with OoC technology unlocks powerful applications, particularly in personalized medicine and drug development. A compelling case study involves using a patient-derived Esophageal Adenocarcinoma Organ-Chip for functional precision oncology. Tumor biopsies and stromal cells are isolated from a patient and cultured in an OoC. This patient-specific "avatar" can then be exposed to various chemotherapeutic regimens. The integrated biosensors and analytical readouts can monitor tumor cell death and biomarker secretion, predicting the patient's clinical response to those drugs before administration, thereby avoiding ineffective treatments and associated toxicity [52].
The future trajectory of this field points toward increased technological convergence. Key trends include the shift from single-organ to multi-organ "body-on-a-chip" models to study complex inter-organ interactions and systemic drug effects [54]. Furthermore, the integration of Artificial Intelligence (AI) and machine learning is set to revolutionize data analysis, enabling predictive modeling of human physiological responses from the complex, high-throughput data generated by these sensor-integrated systems [53] [54] [55]. As these technologies mature and standardization increases, biosensor-integrated OoCs are poised to become indispensable tools for revolutionizing clinical diagnostics and creating more predictive, personalized, and effective healthcare solutions.
Navigating the Hurdles: Key Challenges and Strategic Optimization of Biosensor Performance
The accurate detection of pathogens and biomarkers is fundamental to public health, food safety, and clinical diagnostics. Traditional culture methods, while considered a gold standard, require days to yield results, amplifying risks in modern food production and clinical management [56]. Complex sample matrices like food homogenates and blood present formidable barriers to diagnostic accuracy through the "matrix effect," where interfering substances such as fats, proteins, biofilms, and salts reduce detection sensitivity and specificity [57]. These matrices shield target analytes, quench signal output, and generate false positives, thereby compromising the reliability of results. Biosensors have emerged as transformative tools to address these challenges, yet their performance is intrinsically linked to overcoming matrix-derived interference. This evaluation examines how advanced biosensing platforms mitigate the matrix effect to achieve rapid, sensitive detection that outperforms traditional methods, with critical implications for research and drug development.
Performance Comparison: Biosensors Versus Traditional Culture Methods
The following comparison quantifies the significant advantages that modern biosensing platforms offer over traditional culture-based techniques, with a specific focus on their performance in complex sample matrices.
Table 1: Performance Comparison of Detection Technologies for Pathogens in Complex Matrices
| Detection Method | Typical Detection Time | Limit of Detection (LOD) | Sample Matrix | Key Challenges with Matrix Effects |
|---|---|---|---|---|
| Traditional Culture Methods | 2–5 days [56] | Not applicable (relies on growth) | Food (dairy, meat, produce), Clinical samples | Time-intensive; cannot detect viable but non-culturable (VBNC) microbes [56] |
| Electrochemical Biosensors | 20 minutes for E. coli O157:H7 [56] | Varies with target and design | Meat, dairy, fresh produce [56] | Fouling of electrodes by proteins and fats; requires effective surface functionalization [57] [6] |
| Optical Biosensors (e.g., SPR) | Real-time monitoring [56] | Varies with target and design | Meat, fresh produce [56] | Scattering and absorption from particulate matter; autofluorescence in food samples [58] |
| Fluorescent Biosensors with Nanomaterials | Minutes to a few hours [58] | Greatly enhanced sensitivity [58] | Various food samples [58] | Mitigates interference via signal amplification; can be tailored for specific matrices [57] [58] |
| Lateral Flow Assays | <30 minutes [56] | Moderate | Point-of-care settings | Viscosity of blood and food homogenates can affect flow and capillary action [6] |
The data demonstrates that biosensors significantly reduce detection time from days to minutes or hours while maintaining high sensitivity. Their design often incorporates specific strategies, such as the use of nanomaterials and surface engineering, to counteract the suppression of signals caused by complex matrices, thereby improving robustness and reliability for real-world samples [57] [58].
Experimental Protocols for Evaluating Matrix Effects
To objectively compare biosensor accuracy against traditional methods, researchers employ standardized experimental protocols that rigorously assess performance in the presence of complex matrices. The following methodologies are critical for validation.
Protocol for Biosensor Validation in Food Matrices
This protocol is designed to evaluate biosensor performance in detecting pathogens within challenging food samples, using selective enrichment and signal amplification to overcome interference.
- Sample Preparation and Enrichment: Artificially inoculate a representative food sample (e.g., 25 g of ground meat or leafy greens) with a target pathogen, such as Salmonella spp. or Listeria monocytogenes. Homogenize the sample in a selective enrichment broth and incubate. This step increases the target pathogen concentration while suppressing background flora [56] [58].
- Analyte Extraction and Separation: For nanoparticle-based or electrochemical sensors, separate the target bacteria from the food matrix using immunomagnetic separation or centrifugation. Alternatively, employ filtration to remove large particulate matter that causes optical interference [57].
- Signal Detection and Amplification: Introduce the extracted sample to the biosensor. For fluorescent biosensors, utilize signal amplification strategies such as CRISPR/Cas systems or functional nanomaterials (e.g., quantum dots, gold nanoparticles) to enhance the output signal and distinguish it from background noise [58].
- Data Comparison: Compare the biosensor's result (positive/negative and quantification) with parallel analysis using the standard culture method (ISO 6571) and/or PCR. Statistical analysis, including calculation of sensitivity, specificity, and correlation coefficients, validates the biosensor's accuracy [58] [15].
Protocol for Clinical Biosensor Validation in Blood
This protocol assesses biosensor functionality for biomarker detection in blood, where components like hemoglobin and lipids are major interferents.
- Sample Collection and Pre-treatment: Collect fresh venous blood samples with anticoagulant. For whole blood analysis, directly apply a fixed volume to the sensor. For plasma/serum analysis, centrifuge the blood and use the supernatant [59].
- Matrix Effect Challenge: Spike a known concentration of the target analyte (e.g., uric acid, a specific pathogen antigen) into the blood sample. As a control, spike the same concentration into a pure buffer solution.
- Sensor Measurement and Analysis: Apply both the spiked blood and buffer control to the biosensor platform. For photochemical sensors, measure the signal (e.g., colorimetric change) and compare the output between the blood and buffer samples. A significant signal reduction in blood indicates a matrix effect [59].
- Validation Against Reference Methods: Test the same clinical samples using a reference method, such as standard clinical chemistry analyzers in a hospital lab. Evaluate concordance using statistical methods like Passing-Bablok regression and Bland-Altman analysis, with a target concordance of >95% demonstrating high reliability despite matrix interference [59].
Technological Mechanisms for Overcoming Matrix Interference
Advanced biosensors incorporate specific design features and technological innovations to neutralize the impact of complex matrices. The following diagram illustrates the multi-layered strategies employed by nanoparticle-enhanced biosensors to combat interference.
Figure 1: Mechanisms for Overcoming Matrix Interference. This diagram visualizes the core strategies nanoparticle-based biosensors use to isolate the target signal from complex sample backgrounds.
The core mechanisms behind overcoming interference include:
- Magnetic Separation: Utilizing magnetic nanoparticles functionalized with antibodies or aptamers to selectively bind and physically isolate target pathogens from complex mixtures like food homogenates under a magnetic field. This effectively pre-concentrates the analyte and removes soluble interferents [57].
- Optical Shielding: Engineering nanomaterials with specific optical properties (e.g., gold nanoparticles for surface plasmon resonance or quantum dots for fluorescence) whose signals are strong and occur at wavelengths where background interference from the matrix (e.g., autofluorescence) is minimal [57] [58].
- Surface Functionalization: Coating sensor surfaces and nanoparticles with polymers or hydrogels that resist non-specific adsorption of proteins or other matrix components. This biofouling-resistant layer is critical for maintaining sensor sensitivity and specificity in blood and protein-rich food samples [57] [6].
The Scientist's Toolkit: Essential Reagents and Materials
Success in developing and applying biosensors for complex samples relies on a suite of specialized research reagents and materials.
Table 2: Key Research Reagent Solutions for Biosensor Development
| Reagent/Material | Function | Specific Application Example |
|---|---|---|
| Gold Nanoparticles (AuNPs) | Signal amplification and transduction; colorimetric or electrochemical signal generation. | Used for rapid, visual detection in lateral flow assays; enhance conductivity in electrochemical sensors [57] [6]. |
| Magnetic Nanoparticles | Target separation and pre-concentration from complex samples. | Isolate E. coli O157:H7 from ground beef homogenates prior to detection, reducing matrix interference [57]. |
| CRISPR/Cas Systems | Highly specific nucleic acid recognition and signal amplification. | Detect pathogen-specific DNA/RNA sequences from Salmonella in spiked milk with high sensitivity, even without pre-amplification [58] [15]. |
| Molecularly Imprinted Polymers (MIPs) | Artificial, stable antibody mimics for selective molecular recognition. | Detect small toxic molecules or antibiotic residues in food and environmental samples; offer enhanced stability over biological receptors [6]. |
| Specific Aptamers | Synthetic biological recognition elements that bind targets with high affinity. | Used in aptasensors for detecting Salmonella spp. in meat; offer flexibility in immobilization and design compared to traditional antibodies [56] [6]. |
| Functionalized Electrodes | Transduce biological binding events into measurable electrical signals. | Microelectrode arrays for electrochemical detection of Listeria in dairy products; surface modification is key to prevent fouling [56] [6]. |
The "matrix effect" remains a significant hurdle in diagnostic testing, but the evolution of biosensing technologies provides a powerful arsenal to overcome it. As demonstrated, modern biosensors that leverage nanoparticles, innovative recognition elements, and smart design principles can effectively neutralize interference from complex samples like food and blood. This enables them to deliver performance that surpasses traditional culture methods in speed while matching or approaching their accuracy. For researchers and drug development professionals, the ongoing integration of artificial intelligence for data interpretation [60] and the development of multi-analyte detection platforms [58] represent the next frontier. These advancements promise to further enhance the accuracy, reliability, and field-deployability of biosensors, solidifying their role as indispensable tools for ensuring public health, food safety, and effective clinical diagnostics.
The performance and reliability of biosensors are fundamentally governed by the stability of their core component: the bioreceptor. Bioreceptors, including enzymes, antibodies, nucleic acids, and whole cells, are biological molecules responsible for the specific recognition of target analytes. However, their inherent biological nature makes them susceptible to denaturation, degradation, and inactivation under operational conditions, creating a significant "stability conundrum." This challenge directly impacts the shelf-life during storage and the operational longevity during use, ultimately determining the translational potential of biosensing technologies from laboratory research to commercial and clinical applications. Instability can arise from various factors, including conformational changes, chemical degradation, and the harsh physicochemical environment encountered during sensor operation, such as fluctuations in temperature, pH, or ionic strength, as well as non-specific binding and biofouling [61].
The broader thesis of evaluating biosensor accuracy against traditional culture methods hinges on this very conundrum. While biosensors promise rapid, real-time results, their accuracy must be maintained not just at the first use but consistently over time and across different sample matrices to be a viable replacement for established, albeit slower, culture-based techniques. Therefore, enhancing the robustness of bioreceptors is not merely an engineering improvement but a critical prerequisite for the adoption of biosensing in critical areas like clinical diagnostics, food safety, and environmental monitoring [62] [63]. This guide objectively compares the performance of various strategies employed to tackle this stability challenge, providing a detailed analysis of the experimental data and methodologies that underpin recent advancements.
Comparative Analysis of Stabilization Strategies and Performance
Recent research has focused on a multi-faceted approach to stabilize bioreceptors, ranging from advanced material designs to biomimetic strategies. The following table summarizes quantitative data on the performance of different stabilization methods, highlighting their impact on key stability parameters.
Table 1: Comparison of Bioreceptor Stabilization Strategies and Performance Outcomes
| Stabilization Strategy | Bioreceptor Type | Sensor Platform | Key Performance Metric | Reported Stability Enhancement | Reference / Model System |
|---|---|---|---|---|---|
| Biomimetic Nano-Bio Interface | DNA Aptamer | Electrochemical, Implantable | Operational Longevity in vivo | >1 week in rat femoral vein (retained >50% signal) | [64] |
| Polymer-Based Hydrogel Coating | DNA Aptamer | Electrochemical, Implantable | Stability in Serum | >1 month in undiluted serum at 37°C | [64] |
| AI-Optimized Surface Functionalization | Antibodies, Enzymes | General Biosensor Design | Sensitivity & Selectivity | Enhanced prediction of optimal configurations, reducing experimental cycles | [61] |
| Nanomaterial-enhanced Immobilization (3D) | Antibodies, Oligonucleotides | Electrochemical | Binding Site Density | Increased probe loading vs. 2D surfaces, improving LOD | [65] |
| Whole-Cell Biosensor | Engineered Bacteria (E. coli) | Fluorescence (Whole-Cell) | Functional Shelf-life | System viability for cobalt detection in food matrices | [66] |
The data reveals that for implantable applications, where the biological environment is most aggressive, composite strategies that combine physical protection (e.g., hydrogels, nanoporous structures) with careful interfacial chemistry are most effective. The biomimetic approach, which draws inspiration from protective biological systems like the intestinal mucosa, represents a paradigm shift, moving from mere inert encapsulation to creating a bioactive, protective niche for the bioreceptor [64]. Furthermore, the integration of artificial intelligence (AI) and machine learning (ML) marks a transformative advancement. AI-driven models can predict optimal surface architectures and bioreceptor configurations by analyzing vast datasets on material properties and biomolecular interactions, thereby accelerating the rational design of highly stable biosensor interfaces without relying solely on traditional trial-and-error methods [61].
Experimental Protocols for Assessing Bioreceptor Stability
To generate the comparative data presented, researchers employ rigorous and standardized experimental protocols. The following section details the key methodologies used to quantify shelf-life and operational longevity, which are essential for validating any stabilization strategy.
Protocol for In Vitro Stability Assessment in Biological Fluids
This protocol is designed to simulate the challenging conditions of a biological environment without the complexity of a live animal model.
- Step 1: Sensor Incubation: The fabricated biosensors are immersed in a relevant biological fluid, such as undiluted bovine or human serum. The incubation is performed at a controlled temperature of 37°C to mimic physiological conditions [64].
- Step 2: Periodic Functional Calibration: At predetermined time points (e.g., daily or weekly), sensors are removed from the serum, rinsed gently, and calibrated using standard solutions of the target analyte. This measures the retained biosensing function.
- Step 3: Data Analysis: The sensor's response (e.g., current, fluorescence intensity) is plotted over time. Stability is quantified as the duration for which the sensor maintains a predefined performance threshold, commonly >50% of its initial signal amplitude or a reproducible calibration curve slope [64].
Protocol for In Vivo Operational Longevity Testing
This protocol provides the most direct evidence of sensor performance in a real-world application context.
- Step 1: Sensor Implantation: The biosensor is implanted into a live animal model, typically a rodent. For intravascular stability, the sensor is inserted into a major blood vessel like the femoral vein [64].
- Step 2: Real-Time Monitoring in Free-Moving Subjects: The animal is allowed to recover, and sensor signals are monitored continuously or at regular intervals in a free-moving state. This tests stability against biofouling, immune response, and flow-induced shear stress.
- Step 3: Pharmacokinetic Tracking Validation: To demonstrate functional stability, the sensor's ability to track the real-time pharmacokinetic profile of a drug or metabolite is assessed after several days of implantation, comparing the results to established gold-standard methods like periodic blood sampling [64].
Protocol for Comparative Accuracy vs. Traditional Culture Methods
This is critical for validating biosensors in applications like pathogen detection.
- Step 1: Parallel Sample Analysis: A food sample (e.g., milk) or clinical sample is spiked with a target pathogen (e.g., Pseudomonas fluorescens, Staphylococcus aureus) and split into two portions [63] [15].
- Step 2: Simultaneous Testing: One portion is analyzed using the biosensor. The other is tested using the traditional culture method (e.g., plating on mannitol salt agar and counting colony-forming units after 24-48 hours) [63].
- Step 3: Statistical Comparison: Results from both methods are compared for key parameters: detection time, sensitivity (true positive rate), and specificity (true negative rate). A rapid biosensor achieving >90% concordance with the culture method demonstrates high accuracy and a significant time advantage [15].
Visualizing Stabilization Strategies and Experimental Workflows
The following diagrams illustrate the core concepts and experimental workflows discussed in this guide, providing a visual summary of the logical relationships and processes.
Biomimetic Sensor Architecture for Enhanced Longevity
Workflow for Validating Against Culture Methods
The Scientist's Toolkit: Essential Research Reagent Solutions
The development and implementation of advanced stabilization strategies rely on a specific set of reagents and materials. The following table details key solutions that form the foundation of this research field.
Table 2: Key Research Reagent Solutions for Bioreceptor Stabilization
| Reagent/Material | Function in Stabilization | Specific Examples & Notes |
|---|---|---|
| Functionalized Nanomaterials | Provide a high-surface-area 3D scaffold for dense, oriented bioreceptor immobilization, enhancing signal and stability. | Gold nanoparticles (AuNPs), carbon nanotubes (CNTs), graphene oxide, covalent organic frameworks (COFs) [61] [65]. |
| Smart Polymer Hydrogels | Create a hydrating, protective barrier that shields bioreceptors from denaturation and biofouling in complex media. | Polyethylene glycol (PEG), polydopamine (PDA), chitosan; often used for implantable sensors [61] [64]. |
| Surface Coupling Agents | Enable stable, covalent attachment of bioreceptors to transducer surfaces, preventing leaching and denaturation. | (3-Aminopropyl)triethoxysilane (APTES), alkanethiol-based self-assembled monolayers (SAMs) [61]. |
| Engineered Whole Cells | Serve as self-renewing, robust bioreceptors for specific analytes, useful in environmental and food safety monitoring. | E. coli engineered with stress-responsive promoters (e.g., UspA) for heavy metal detection [66]. |
| AI/Material Informatics Platforms | Computational tools to predict optimal material compositions and surface architectures, accelerating stable biosensor design. | Machine learning models trained on material properties and biomolecular interaction datasets [61]. |
The "stability conundrum" remains a central challenge in biosensor development, but significant progress is being made through interdisciplinary approaches that merge materials science, nanotechnology, and biology. As the experimental data and comparisons in this guide illustrate, strategies that employ biomimetic designs, intelligent materials, and AI-driven optimization are proving capable of substantially extending both the shelf-life and operational longevity of bioreceptors. The ongoing refinement of these strategies, validated through rigorous protocols against traditional methods, is steadily bridging the gap between the potential of biosensors and their practical, reliable application in research, clinical, and industrial settings. The future of accurate and long-lasting biosensing lies in the continued innovation at the intersection of these advanced fields.
The transition of biosensors from promising laboratory prototypes to commercially viable products hinges on overcoming significant challenges in reproducible mass production. For researchers and drug development professionals evaluating biosensor accuracy against traditional culture methods, consistency in manufacturing is not merely an industrial concern but a fundamental scientific prerequisite for reliable data and clinical decision-making. Reproducibility ensures that biosensor performance remains consistent across different production batches, geographical locations, and time periods, which is particularly crucial when these devices are deployed for critical applications such as medical diagnostics, food safety monitoring, and environmental detection [67] [68].
The Clinical and Laboratory Standards Institute (CLSI) has established rigorous guidelines requiring a coefficient of variation (CV) of less than 10% for reproducibility, accuracy, and stability before biosensors can be considered for point-of-care use [67]. Meeting these standards demands innovative approaches that span from molecular-level design to full-scale manufacturing processes. This guide objectively compares the performance of emerging biosensor technologies against traditional methods, with a specific focus on the strategies that enhance reproducibility while maintaining commercial viability.
Comparative Performance Analysis: Biosensors vs. Traditional Methods
Quantitative Comparison of Detection Capabilities
The following tables summarize experimental data comparing the performance of various biosensor technologies against traditional culture methods across key parameters, including detection time, sensitivity, and reproducibility.
Table 1: Performance comparison of biosensor technologies for bacterial detection
| Detection Method | Target Analyte | Detection Time | Limit of Detection (LOD) | Reproducibility (CV%) | Reference Method |
|---|---|---|---|---|---|
| Microfluidic Impedance Biosensor [69] | Salmonella Typhimurium | 40-50 minutes | 1-2 cells/mL | Data not specified | Culture-based (ISO 6579-1:2017) |
| B.EL.D Cell-Based Biosensor [33] | Salmonella spp. | 24 hours (including enrichment) | 1 log CFU g⁻¹ | 86.1% accuracy | Culture-based (ISO 6579-1:2017) |
| Optical Colorimetric Sensor [4] | Staphylococcus aureus | 90-120 minutes | Not specified | Data not specified | Traditional culture (24-72 hours) |
| Traditional Culture Methods [33] | Salmonella spp. | 5-7 days | 1 CFU (after enrichment) | High specificity | Gold standard |
| Electrochemical Biosensor Platform [67] | Multiple biomarkers | Minutes to hours | Nanomolar range | <10% CV | CLSI guidelines |
Table 2: Key characteristics affecting commercial viability
| Technology | Reproducibility Challenges | Mass Production Suitability | Stability Issues | Reported Solutions |
|---|---|---|---|---|
| Molecularly Imprinted Polymer (MIP) Biosensors [68] | Batch-to-batch variations in electrode properties | Screen-printing compatible | Long-term storage stability | Quality control with Prussian blue nanoparticles |
| Electrochemical Biosensors [67] | Electrode surface consistency | Semiconductor manufacturing technology | Bioreceptor degradation | Optimized SMT settings, GW linkers |
| Cell-Based Biosensors [33] | Cell membrane stability and viability | Moderate challenges | Limited cell lifespan | Membrane engineering with antibodies |
| Optical Biosensors [4] | Light source and detector calibration | Good for miniaturization | Signal drift over time | LED-photodiode integration |
Experimental Evidence and Case Studies
Recent studies provide compelling experimental data demonstrating how advanced biosensor technologies achieve reproducible performance while maintaining detection accuracy. A microfluidic impedance biosensor developed for Salmonella detection in raw chicken products achieved an exceptionally low detection limit of 1-2 cells/mL within 40-50 minutes, significantly outperforming traditional culture methods that require 5-7 days [69]. This biosensor incorporated multiple distinct regions that concentrated Salmonella antigens to detectable levels and trapped them on an interdigitated electrode array functionalized with specific antibodies. The impedance changes resulting from antibody-antigen binding provided a reliable detection signal, with the system demonstrating high specificity by distinguishing between live and dead cells and minimizing cross-reactivity with Listeria monocytogenes and E. coli O157:H7 [69].
In a separate approach, researchers developed an electrochemical biosensor platform that directly addressed reproducibility challenges through optimized manufacturing parameters. By calibrating semiconductor manufacturing technology (SMT) production settings to produce electrodes with thickness greater than 0.1 μm and surface roughness less than 0.3 μm, they achieved significant improvements in signal consistency [67]. Furthermore, the integration of a streptavidin biomediator with a unique GW linker enhanced bioreceptor orientation and stability, resulting in biosensors that met CLSI standards for reproducibility (CV <10%), accuracy, and stability [67].
Methodological Approaches for Enhanced Reproducibility
Quality Control Strategies in Biosensor Fabrication
Implementing robust quality control (QC) measures during manufacturing is essential for achieving reproducible biosensor performance. A novel strategy utilizing embedded Prussian blue nanoparticles (PB NPs) as internal redox probes has demonstrated significant improvements in reproducibility for molecularly imprinted polymer (MIP) biosensors [68]. This approach enables real-time, non-destructive monitoring of critical fabrication stages, including electrodeposition, electropolymerization, and template extraction.
The methodology involves four key QC checkpoints:
- QC1: Visual inspection and verification of storage conditions for bare electrodes
- QC2: Monitoring electrodeposition of PB NPs through current intensity measurements
- QC3: Tracking electropolymerization of MIP films using cyclic voltammetry
- QC4: Verifying template extraction efficiency through signal changes
Experimental results demonstrated that this QC strategy reduced the relative standard deviation (RSD) by 79% for agmatine detection (RSD = 2.05% with QC vs. 9.68% without QC) and by 87% for glial fibrillary acidic protein detection (RSD = 1.44% with QC vs. 11.67% without QC) [68]. This systematic approach addresses the inherent variability in manufacturing processes, particularly for screen-printed electrodes where differences in ink properties and substrate characteristics can lead to batch-to-batch variations.
Experimental Protocol for Reproducible Biosensor Manufacturing
The following workflow illustrates the quality control process for manufacturing reproducible biosensors:
Diagram 1: Quality control workflow for reproducible biosensor manufacturing
Standardized Experimental Protocols for Performance Validation
To ensure consistent evaluation of biosensor performance against traditional methods, researchers should adhere to standardized experimental protocols. For foodborne pathogen detection, the following methodology provides a framework for comparative analysis:
Sample Preparation Protocol:
- Sample Collection: Obtain food samples (e.g., raw chicken, meat products) and transport under refrigerated conditions
- Pre-enrichment: Incubate samples in non-selective broth (e.g., Buffered Peptone Water) at 37°C for 18-24 hours
- Selective Enrichment: Transfer aliquots to selective media (e.g., Rappaport-Vassiliadis Soy Broth) and incubate at 41.5°C for 24 hours
- Serial Dilution: Prepare ten-fold serial dilutions in phosphate-buffered saline (PBS) for quantitative analysis
Biosensor Analysis Procedure:
- Sensor Preparation: Functionalize electrodes with appropriate capture probes (antibodies, aptamers, or MIPs)
- Calibration: Perform calibration curves using standard solutions of target analytes
- Sample Loading: Introduce prepared samples into biosensor chambers or microfluidic channels
- Signal Measurement: Record electrochemical, optical, or impedance signals according to manufacturer protocols
- Data Analysis: Convert signals to analyte concentrations using calibration curves
Reference Method (Traditional Culture):
- Plating: Spread enriched samples on selective agar media (e.g., XLD Agar for Salmonella)
- Incubation: Incubate plates at 37°C for 24-48 hours
- Colony Identification: Identify characteristic colonies and confirm through biochemical tests
- Enumeration: Count colony-forming units (CFU) and calculate concentration in original sample
Validation Metrics:
- Calculate limit of detection (LOD) and limit of quantification (LOQ)
- Determine linear range and correlation coefficients
- Assess precision through intra-day and inter-day reproducibility studies
- Evaluate specificity against non-target microorganisms
- Compute accuracy relative to reference method [33] [69]
The Scientist's Toolkit: Essential Research Reagents and Materials
Table 3: Key research reagents and materials for biosensor development
| Reagent/Material | Function | Application Examples | Considerations for Reproducibility |
|---|---|---|---|
| Prussian Blue Nanoparticles [68] | Embedded redox probe for quality control | Monitoring electropolymerization and template extraction | Uniform size distribution (80-200 nm) ensures consistent performance |
| Anti-Salmonella Antibodies [33] | Biological recognition element | Functionalization of cell-based and immunosensors | Binding affinity and specificity vary between batches; require validation |
| Mannitol Salt Agar [4] | Selective culture medium | Staphylococcus aureus detection and cultivation | pH and composition consistency affects bacterial growth and metabolism |
| Screen-Printed Electrodes [68] | Transducer platform | Electrochemical biosensors | Ink formulation and printing parameters affect surface properties |
| Molecularly Imprinted Polymers [68] | Biomimetic recognition element | Synthetic receptors for various analytes | Monomer-to-template ratio and cross-linking density impact specificity |
| Streptavidin Biomediator with GW Linker [67] | Immobilization platform | Enhanced bioreceptor stability and orientation | Linker flexibility affects bioreceptor accessibility and function |
| Vero Cells [33] | Cellular transduction element | Bioelectric recognition assay (BERA) | Passage number and viability influence signal response |
The journey toward reproducible mass production and commercial viability of biosensors requires a multifaceted approach that addresses challenges at both technical and manufacturing levels. The experimental data and comparative analyses presented demonstrate that while biosensors offer significant advantages in speed and sensitivity compared to traditional methods, ensuring reproducibility remains a critical hurdle. Strategies such as implementing real-time quality control during fabrication, optimizing bioreceptor immobilization, and standardizing manufacturing protocols have shown promising results in bridging this gap.
For researchers and drug development professionals, the selection of appropriate biosensor technologies should consider not only analytical performance but also manufacturing reproducibility and long-term stability. The continuous advancement in materials science, nanotechnology, and quality control methodologies promises to further enhance the reproducibility of biosensors, ultimately accelerating their translation from research laboratories to commercial products that reliably outperform traditional detection methods across various applications.
The convergence of nanotechnology and synthetic biology represents a paradigm shift in the development of biosensing platforms, dramatically enhancing their sensitivity, specificity, and practical utility. This synergistic enhancement addresses critical limitations of traditional diagnostic methods, particularly culture-based techniques, which often suffer from prolonged incubation times, limited sensitivity, and labor-intensive protocols [70] [71]. In the context of a broader thesis evaluating biosensor accuracy against traditional culture methods, this comparison guide objectively examines how nano-bio hybrid systems are transforming diagnostic capabilities across healthcare, environmental monitoring, and food safety sectors.
Traditional culture methods, while considered a gold standard for pathogen identification like Helicobacter pylori and foodborne contaminants, require 7-10 days for results and exhibit variable sensitivity (58-95%) [71]. In contrast, biosensors enhanced with nanomaterials and synthetic biology principles demonstrate detection capabilities at femtomolar concentrations, reduce analysis times to minutes or hours, and enable precise quantification of target analytes [72] [73]. The fundamental advantage of this integration lies in the unique properties of nanomaterials—exceptional surface-to-volume ratios, tunable optical and electrical characteristics, and superior catalytic efficiency—combined with the programmable biological components derived from synthetic biology, including genetic circuits, aptamers, and CRISPR systems [74] [72].
This review systematically compares the performance of these advanced biosensing platforms against traditional methods through structured experimental data, detailed methodologies, and visual representations of underlying mechanisms. By objectively examining the empirical evidence, this guide provides researchers and drug development professionals with a comprehensive resource for evaluating these transformative technologies.
Synergistic Enhancement Mechanisms
The enhanced sensitivity of biosensors utilizing nanomaterials and synthetic biology arises from complementary physical and biological mechanisms that collectively amplify the detection signal and improve specificity.
Nanomaterial-Based Signal Amplification
Nanomaterials enhance biosensor sensitivity through multiple physical mechanisms:
- Surface Enhancement: Two-dimensional nanomaterials like graphene provide an exceptionally high surface area (2630 m²/g) for biomolecule immobilization, significantly increasing the density of recognition elements and improving the signal-to-noise ratio [72].
- Electron Transfer Facilitation: Carbon nanotubes (CNTs) and metal nanoparticles (e.g., Au, Ag) enhance electrical conductivity in electrochemical biosensors, facilitating rapid electron transfer between biological recognition elements and transducer surfaces [70] [75].
- Plasmonic Effects: Gold and silver nanoparticles exhibit localized surface plasmon resonance (LSPR), concentrating electromagnetic fields at their surfaces and dramatically enhancing optical signals in colorimetric and fluorescence-based detection systems [72] [17].
Synthetic Biology Components for Recognition
Synthetic biology provides programmable biological elements that offer superior specificity and versatility:
- CRISPR-Based Detection: CRISPR-Cas systems enable ultra-sensitive nucleic acid detection through programmable recognition and enzymatic signal amplification, as demonstrated in SHERLOCK and DETECTR platforms that achieve attomolar sensitivity for pathogen identification [74].
- Engineered Genetic Circuits: Synthetic genetic circuits incorporating transcription factors, riboswitches, and aptamers can be designed to respond to specific small molecules, metals, or biomarkers, enabling custom-tailored detection profiles [74] [73].
- Cell-Free Systems: By utilizing biological machinery without maintaining cell viability, cell-free biosensors overcome transport barriers and viability constraints, operating reliably in complex environmental and clinical samples [73].
The integration of these physical and biological enhancement mechanisms creates a powerful synergistic effect, enabling detection limits several orders of magnitude lower than conventional biosensors or culture methods.
Figure 1: Synergistic Enhancement Mechanism. Integration of nanomaterial properties with synthetic biology elements creates amplified detection signals.
Performance Comparison: Advanced Biosensors vs. Traditional Methods
Quantitative comparison of detection performance reveals the significant advantages of nano-bio enhanced biosensors over conventional culture-based methods and traditional biosensing approaches.
Table 1: Performance Comparison of Detection Methods
| Method Category | Specific Technique | Target Analyte | Detection Limit | Time Required | Sensitivity (%) | Specificity (%) |
|---|---|---|---|---|---|---|
| Traditional Culture Methods | Bacterial Culture | H. pylori | Viable organisms | 7-10 days | 58 | 99 [71] |
| Foodborne pathogens | Viable organisms | 2-5 days | Variable | Variable | ||
| Conventional Biosensors | Serology | H. pylori antibodies | N/A | >3 hours | 75-85 | 79-90 [71] |
| Urea Breath Test | H. pylori urease | N/A | 1 hour | 90 | 95 [71] | |
| Nano-Enhanced Biosensors | Electrochemical (CL/MWCNTs/HRP/AChE/GCE) | Organophosphorus pesticides | 4.5 × 10⁻¹² M | Minutes | >95 | >95 [75] |
| AuNP SERS Platform | α-Fetoprotein (cancer biomarker) | 16.73 ng/mL | Minutes | High | High [17] | |
| Cell-free with aTFs | Lead (Pb²⁺) in water | 0.1 nM | Hours | High | High [73] | |
| Synthetic Biology Biosensors | CRISPR-based | Pathogens | Femtomolar | Hours | ~100 | ~100 [74] |
| Cell-free paper-based | Mercury (Hg²⁺) | 0.5 nM | Hours | High | High [73] | |
| Engineered TtgR-based | Flavonoids | 0.01 mM | Hours | High | High [15] |
The data demonstrates that integration of nanomaterials and synthetic biology components improves detection limits by several orders of magnitude while dramatically reducing analysis time from days to minutes or hours. This performance enhancement is particularly evident in the comparison between traditional H. pylori culture (58% sensitivity, 7-10 days) and nanomaterial-based platforms that achieve near-perfect sensitivity and specificity within hours [71].
Experimental Protocols and Methodologies
To ensure reproducibility and facilitate comparative analysis, this section details standardized experimental protocols for key biosensor configurations highlighted in the performance comparison.
Nanomaterial-Enhanced Electrochemical Biosensor for Pesticide Detection
Protocol based on Cl/MWCNTs/HRP/AChE/GCE biosensor [75]:
- Electrode Preparation: Glassy carbon electrode (GCE) is polished with alumina slurry and thoroughly rinsed. Functionalized multi-walled carbon nanotubes (Cl/MWCNTs) are deposited via drop-casting.
- Enzyme Immobilization: Horseradish peroxidase (HRP) and acetylcholinesterase (AChE) are co-immobilized using glutaraldehyde cross-linking on the Cl/MWCNTs modified electrode.
- Measurement Procedure: The biosensor is incubated with sample solutions, and electrochemical measurements are performed using chronoamperometry at +0.4V vs. Ag/AgCl in 0.1M phosphate buffer (pH 7.0).
- Validation: Recovery tests in vegetable samples show 83-104% recovery rates, with RSD of 3.0-5.6% demonstrating excellent reproducibility.
Cell-Free Biosensor for Heavy Metal Detection
Protocol based on allosteric transcription factors (aTFs) for water monitoring [73]:
- Sensor Preparation: Lyophilized cell-free reactions are reconstituted with nuclease-free water containing allosteric transcription factors specific to target metals (Hg²⁺ or Pb²⁺).
- Paper-Based Immobilization: The reconstituted mixture is applied to paper pads and air-dried for field-stable storage.
- Detection Procedure: Water samples are applied to the paper pads, and reactions are incubated at room temperature for 60-90 minutes.
- Signal Measurement: Colorimetric or fluorescent outputs are quantified using smartphone-based imaging or portable fluorometers.
- Performance Metrics: Detection limits of 0.5 nM for Hg²⁺ and 0.1 nM for Pb²⁺ with recovery rates of 91-123% in actual water samples.
SERS-Based Immunoassay for Protein Biomarkers
Protocol based on Au-Ag Nanostars Platform [17]:
- Nanostar Synthesis: Gold-silver nanostars are synthesized via seed-mediated growth, with concentration tuned by simple centrifugation (10, 30, and 60 minutes).
- Surface Functionalization: Nanostars are functionalized with mercaptopropionic acid (MPA), followed by EDC/NHS chemistry for covalent attachment of antibodies.
- Assay Procedure: Functionalized nanostars are incubated with samples, and SERS measurements are performed using a portable Raman spectrometer.
- Quantification: Intensity of intrinsic vibrational modes of target biomarkers is quantified, achieving detection limits of 16.73 ng/mL for α-fetoprotein.
Figure 2: Generalized Experimental Workflow. Standardized protocol for nano-bio enhanced biosensor operation.
The Scientist's Toolkit: Essential Research Reagents
Successful implementation of nano-bio enhanced biosensors requires specific reagents and materials that facilitate the synergistic enhancement effects. The following table catalogs essential research reagents with their respective functions in biosensor development.
Table 2: Essential Research Reagents for Nano-Bio Enhanced Biosensors
| Reagent/Material | Function | Specific Examples | Application Notes |
|---|---|---|---|
| Gold Nanoparticles (AuNPs) | Signal amplification via plasmonic effects; electron transfer enhancement | Spherical AuNPs (10-100nm); Au-Ag nanostars | Surface functionalization with thiol chemistry required [72] [17] |
| Carbon Nanotubes (CNTs) | Electrode modification; enhanced surface area; electron transfer mediation | Functionalized MWCNTs with -SH, -NH₂, -Cl, or -OH groups | Ionic liquid modification optimizes enzyme immobilization [70] [75] |
| Graphene & Derivatives | High surface area support; exceptional electrical conductivity | Graphene oxide; reduced graphene oxide | Ideal for FET-based sensors; high surface area (2630 m²/g) [72] |
| CRISPR-Cas Systems | Programmable nucleic acid recognition; signal amplification | Cas12, Cas13 proteins; guide RNA constructs | Enables attomolar detection limits; high specificity [74] |
| Allosteric Transcription Factors | Selective small molecule recognition | Engineered PbrR (for Pb²⁺); MerR (for Hg²⁺) | Can be engineered for improved sensitivity and dynamic range [73] |
| Cell-Free Expression Systems | Protein synthesis without viability constraints | Lyophilized E. coli extracts; PURExpress | Enables field-deployable biosensors; shelf-stable [73] |
| Functional Monomers | Molecular imprinting; synthetic receptor creation | Acrylamide; vinylferrocene; pyrrole | Electropolymerization creates selective recognition sites |
The comprehensive comparison of experimental data presented in this guide demonstrates conclusively that the synergistic integration of nanomaterials and synthetic biology principles significantly enhances biosensor sensitivity compared to traditional culture methods and conventional biosensing approaches. The performance metrics reveal consistent improvements across multiple detection domains: from heavy metals in environmental samples to pathogens in clinical diagnostics and contaminants in food safety monitoring.
While traditional culture methods provide valuable information about bacterial viability, their extended time requirements (7-10 days) and variable sensitivity (as low as 58% for H. pylori culture) limit their utility in settings requiring rapid intervention [71]. In contrast, nano-bio enhanced biosensors achieve remarkable detection limits (e.g., 4.5 × 10⁻¹² M for pesticides, 0.1 nM for lead) with significantly reduced analysis times (minutes to hours) while maintaining high specificity and reproducibility [73] [75].
For researchers and drug development professionals evaluating these technologies, the evidence supports the superior analytical performance of integrated nano-bio systems while acknowledging that translation to clinical and field settings requires further addressing challenges related to standardization, scalability, and regulatory approval. Future development should focus on multiplexed detection capabilities, enhanced signal stability, and improved portability for point-of-care applications to fully realize the potential of these synergistic technologies in transforming diagnostic paradigms across multiple sectors.
The Verdict: Rigorous Validation, Performance Metrics, and Comparative Analysis of Diagnostic Accuracy
The evaluation of biosensor accuracy against traditional culture methods represents a cornerstone of modern analytical science, particularly in clinical diagnostics and food safety. Conventional techniques, such as culture-based methods, remain the gold standard for bacterial detection but require centralized laboratories and well-trained technicians, with processes taking several hours or days to complete [3]. In contrast, biosensors are measurement systems that combine a biological component with a physicochemical detector, offering the potential for rapid, on-site pathogen detection [76]. The utility of any biosensor, especially those intended for point-of-care or real-time deployment, hinges on a discrete set of performance characteristics that objectively quantify its analytical capabilities [77]. This guide provides a structured comparison of these essential performance metrics—sensitivity, specificity, and limit of detection (LOD)—framed within the context of evaluating biosensor accuracy against traditional culture methods.
Within clinical and research settings, these metrics determine how reliably a sensor can detect, quantify, and respond to biological signals in both controlled and real-world environments [77]. Sensitivity measures the sensor's signal response to incremental changes in analyte concentration, while specificity captures its ability to uniquely identify the target analyte amidst interferents. The LOD defines the minimum amount of analyte that can be reliably detected, a crucial parameter for early disease diagnosis or contamination detection [76]. Together, these metrics form the fundamental triad for assessing biosensor performance and establishing their viability as alternatives to traditional methods.
Core Performance Metrics: Definitions and Significance
The performance of biosensors is quantitatively assessed through several key parameters that determine their reliability and applicability for specific use cases. Understanding these metrics is essential for meaningful comparison between different biosensing platforms and traditional methods.
Sensitivity is the extent to which the sensor's signal responds to incremental changes in analyte concentration. Clinically relevant biomarkers often exist at femtomolar to attomolar concentrations in complex fluids, requiring biosensors with extremely efficient signal transduction mechanisms [77]. In optical biosensors, sensitivity may be reported as a wavelength shift per refractive index unit (nm/RIU), with higher values indicating better performance. For example, advanced plasmonic biosensors can achieve sensitivities of 811 nm/RIU, attributed to Fano resonance effects in optimized nanostructures [78].
Specificity refers to the capacity of a bioreceptor to detect a specific bio-entity when analyzing a sample composed of other components. This is probably the main feature of any biosensor and determines the choice of bioreceptor element [76]. High specificity ensures that the biosensor can distinguish between target and non-target analytes, reducing false positives in complex matrices like food, blood, or environmental samples.
Limit of Detection (LOD) represents the minimum concentration of an analyte that can be reliably detected by the biosensor. For clinical applications, it is often required to detect analytes at ng/mL or fg/mL concentrations [76]. The LOD is a critical parameter that determines the biosensor's applicability for early diagnosis or detection of low-abundance pathogens.
Other Important Metrics include precision (the reproducibility of a sensor's output under repeated conditions), response time (how quickly a sensor produces a stable output after encountering the target), and linearity (how accurate measurements are across the analyte's concentration range) [77] [76]. Stability—the capacity to endure ambient disturbances that could affect precision and accuracy—is equally important for real-world deployment.
Comparative Performance Analysis: Biosensors vs. Traditional Methods
The following tables provide quantitative comparisons of performance metrics between various biosensor technologies and traditional culture methods, highlighting the advantages and limitations of each approach.
Table 1: Performance Comparison of Bacterial Detection Methods
| Method Type | Specific Example | Detection Time | Limit of Detection (LOD) | Target Pathogen | Reference |
|---|---|---|---|---|---|
| Traditional Culture | Mannitol Salt Agar (Standard) | 24-72 hours | 10-100 CFU/mL | Staphylococcus aureus | [4] |
| Optical Biosensor | LED-Photodetector (ASM Medium) | 90-120 minutes | Not specified | Staphylococcus aureus | [4] [15] |
| Molecular Biosensor | RAA-Test Strip (gyrB target) | ~90 minutes | 37 CFU/mL | Pseudomonas fluorescens | [15] |
| Molecular Biosensor | RAA-Test Strip (aprX target) | ~90 minutes | 233 CFU/mL | Pseudomonas fluorescens | [15] |
| Whole-Cell Biosensor | Engineered CusRS System | ~5 hours | 0.01 μM | Copper Ions | [79] |
Table 2: Performance Metrics for Different Biosensor Types
| Biosensor Category | Technology Platform | Sensitivity | Specificity Assessment | Key Advantages |
|---|---|---|---|---|
| Plasmonic Optical | MISM Nanoring | 811 nm/RIU | Detects multiple viruses (HSV, HIV-1, Influenza A) | Label-free, rapid detection |
| Electrochemical | Microfluidic Graphene | Not specified | Selective detection of E. coli | Portable, rapid in-situ detection |
| Whole-Cell | Engineered TtgR-based | Quantifies resveratrol at 0.01 mM | Altered sensing profiles via protein engineering | Tailorable ligand response |
| Nucleic Acid-Based | Recombinase-Aided Amplification | 4x more sensitive than PCR-AGE | No cross-reactivity with 19 other bacteria | High accuracy, short time consumption |
The data reveal that biosensors significantly reduce detection time compared to traditional culture methods. While culture-based approaches remain the gold standard for specificity, they require 24-72 hours for results [4], whereas biosensors can provide detection in 90 minutes to 5 hours [4] [15] [79]. Furthermore, biosensors demonstrate excellent sensitivity, with some platforms detecting pathogens at concentrations as low as 37 CFU/mL [15] or copper ions at 0.01 μM [79].
Experimental Protocols for Key Biosensor Technologies
To properly evaluate and compare biosensor performance, understanding the underlying experimental methodologies is essential. The following section details protocols for several representative biosensor technologies documented in recent literature.
Optical Biosensor for Bacterial Detection via Color Change
This protocol outlines the methodology for detecting Staphylococcus aureus through optical measurements of color changes in culture medium [4] [15].
Principle: As bacterial growth progresses in mannitol salt agar (ASM), the medium undergoes changes in thickness and, primarily, color due to metabolic products. These changes are optically measurable at specific wavelengths.
Procedure:
- Sample Preparation: Inoculate mannitol salt agar with the sample potentially containing Staphylococcus aureus.
- Optical Setup: Utilize a system with simplified light-emitting diodes (LEDs) at specific wavelengths and a photodetector (e.g., light-dependent resistor).
- Measurement: Monitor the optical transmittance through the ASM medium over time.
- Detection: Record changes in transmittance intensity correlated with bacterial growth. A significant change indicates positive detection.
Performance Notes: This system demonstrated detection of bacterial growth in approximately 90-120 minutes, significantly faster than traditional incubation. It offers simplicity, sensitivity, low reagent consumption, and potential for real-time monitoring [4] [15].
Recombinase-Aided Amplification Test Strip (RAA-TS)
This protocol describes a rapid detection system for Pseudomonas fluorescens in milk using recombinase-aided amplification combined with a dual test line strip [15].
Principle: The system targets both the virulence gene aprX and the housekeeping gene gyrB of P. fluorescens using nucleic acid amplification followed by lateral flow detection.
Procedure:
- Sample Pretreatment: Process milk samples to concentrate bacterial cells if necessary.
- RAA Reaction: Perform recombinase-aided amplification at 39°C for 20-30 minutes using specific primers for gyrB and aprX genes.
- Test Strip Detection: Apply the amplified product to the test strip containing two test lines.
- Result Interpretation: Visually observe the appearance of lines corresponding to gyrB (control) and aprX (target) within 5-10 minutes.
Performance Notes: This method achieves detection limits of 37 CFU/mL for gyrB and 233 CFU/mL for aprX in milk samples, with no cross-reactivity with 19 other bacterial species. The entire process, including sample pretreatment, RAA reaction, and detection, is completed within 90 minutes [15].
Plasmonic MISM Nanoring Biosensor for Virus Detection
This protocol outlines the numerical design and evaluation of a high-sensitivity plasmonic biosensor for virus detection, based on simulation data [78].
Principle: The sensor utilizes metal-insulator-semiconductor-metal (MISM) nanoring structures that exhibit Fano resonance. Virus binding induces refractive index changes in the surrounding medium, causing measurable resonance wavelength shifts.
Procedure:
- Sensor Fabrication: Create nanohole arrays and MISM nanorings using advanced nanofabrication techniques (e.g., electron beam lithography).
- Microfluidic Integration: Incorporate the sensor with microfluidic systems to analyze liquid medical samples.
- Optical Measurement: Expose the sensor to a plane wave light source (1300-3500 nm wavelength).
- Signal Detection: Measure reflection spectrum shifts using a frequency-domain field and power monitor.
Performance Notes: Finite-difference time-domain (FDTD) simulations demonstrate the sensor's capability to detect minute refractive index changes induced by viruses such as HSV, HIV-1, and Influenza A, achieving a sensitivity of 811 nm/RIU [78].
Essential Research Reagent Solutions for Biosensor Development
The development and implementation of high-performance biosensors rely on specialized reagents and materials that enable specific biorecognition and efficient signal transduction. The following table catalogues key research reagent solutions essential for biosensor experimentation.
Table 3: Essential Research Reagents for Biosensor Development
| Reagent/Material | Function in Biosensing | Example Application |
|---|---|---|
| Mannitol Salt Agar (ASM) | Selective culture medium that undergoes color changes due to bacterial metabolism. | Optical detection of Staphylococcus aureus [4]. |
| Primers for gyrB/aprX genes | Nucleic acid probes for specific amplification of target bacterial genes. | RAA-based detection of Pseudomonas fluorescens in milk [15]. |
| Gold/Silver Nanoparticles | Plasmonic materials that enhance light-matter interaction in optical sensors. | MISM nanoring biosensor for virus detection [78]. |
| RepL Protein & oriL System | Copy-number inducible plasmid system for signal amplification in whole-cell sensors. | Enhancing output signal in copper ion biosensors [79]. |
| NanoLuc Binary Technology | Split-luciferase complementation system for highly sensitive detection. | NanoBiT biosensor for African Swine Fever virus [80]. |
| Three-Dimensional Carbon Nanomaterials | High surface-area scaffolds that enhance electrochemical sensitivity. | Improving biosensor sensitivity and signal stability [77]. |
| Propidium Monoazide (PMAxx) | Chemical reagent that selectively penetrates compromised membranes. | Differentiating viable vs. non-viable bacteria in molecular detection [15]. |
Signaling Pathways and Experimental Workflows in Biosensing
Understanding the fundamental signaling pathways and experimental workflows is crucial for appreciating how different biosensor technologies operate and how their performance metrics are derived.
Two-Component System (TCS) Signaling in Whole-Cell Biosensors
Bacterial two-component systems represent an important biological pathway exploited in whole-cell biosensor design, particularly for detecting metal ions and other environmental stimuli [79].
General Workflow for Biosensor Performance Evaluation
A standardized experimental approach is necessary to consistently evaluate and compare the performance metrics of different biosensor platforms.
The comparative analysis of performance metrics reveals that biosensors present a compelling alternative to traditional culture methods, particularly when rapid detection, portability, and quantitative analysis are required. While traditional methods like culture-based techniques remain the gold standard for specificity and are indispensable for certain applications, biosensors significantly reduce detection time from days to hours or minutes while maintaining excellent sensitivity and specificity [3] [4].
The strategic selection of an appropriate biosensor platform depends heavily on the specific application requirements. For instance, plasmonic optical sensors offer exceptional sensitivity for virus detection [78], while nucleic acid-based sensors like RAA-TS provide excellent specificity for bacterial identification in food safety applications [15]. Whole-cell biosensors offer the unique advantage of detecting bioactive compounds through natural signaling pathways [79]. When evaluating biosensor performance, researchers must consider the complete set of metrics—sensitivity, specificity, LOD, response time, precision, and stability—within the context of their intended application to select the most appropriate technology for their specific needs.
The continuous advancement of biosensor technology, driven by innovations in nanomaterials [77] [78], synthetic biology [79], and data processing techniques [81], promises further enhancements in these critical performance metrics. As these technologies mature, they are positioned to transform diagnostic paradigms across healthcare, environmental monitoring, and food safety sectors.
The diagnosis of bacterial infections is a cornerstone of modern medicine, directly influencing treatment decisions and patient outcomes. For decades, the conventional culture method has been the unchallenged gold standard in clinical microbiology laboratories, providing a robust means to identify pathogens and test their susceptibility to antimicrobial agents [82]. However, this method carries significant limitations, most notably the extended time required to obtain results, which can delay the initiation of targeted therapy [82] [3]. In response, biosensor technologies have emerged as a promising alternative, offering the potential for rapid, sensitive, and point-of-care detection of pathogens [82] [83]. This meta-analysis aims to systematically evaluate and compare the performance outcomes of these two methodologies—innovative biosensors versus traditional culture—framed within the broader thesis of evaluating diagnostic accuracy in clinical research.
Performance Metrics: A Quantitative Comparison
The comparative analysis of biosensors and culture methods reveals a trade-off between speed and the scope of information. The data, synthesized from recent studies, are summarized in the table below.
Table 1: Head-to-Head Comparison of Biosensor and Culture Method Performance Characteristics
| Performance Characteristic | Biosensor Methods | Conventional Culture Methods |
|---|---|---|
| Detection Time | 90 minutes – 2 hours [4]30 – 55 minutes (Nucleic Acid-Based) [84] | 2 – 3 days [82] |
| Sensitivity | 82.8% (Leukocyte Esterase dipstick) [82]Detection limit of 10² CFU/mL (RPA-based) [84] | High (Qualitative, considered the reference) [82] |
| Specificity | 68.1% (Leukocyte Esterase dipstick) [82] | High (Qualitative, considered the reference) [82] |
| Key Advantage | Rapid results, portability for point-of-care use, user-friendly designs [82] [3] | Provides live isolates for antimicrobial susceptibility testing (AST) [82] |
| Primary Limitation | Generally does not provide an isolate for AST [82] | Time-consuming, requires specialized laboratory settings [82] [3] |
| Analyte Targets | Biomarkers (e.g., LE, Nitrite), whole pathogens, nucleic acids [82] | Viable, cultivable pathogen cells [82] |
The data unequivocally demonstrates that the most significant advantage of biosensors is their speed. While culture methods require 2 to 3 days to yield results, biosensors can detect the presence of bacteria in as little as 30 minutes to 2 hours, enabling a dramatically faster diagnostic turnaround [82] [4] [84]. In terms of sensitivity, certain advanced biosensor formats, such as those incorporating recombinase polymerase amplification (RPA), can achieve detection limits as low as 10² colony-forming units (CFU) per milliliter, rivaling the sensitivity of traditional methods for detection purposes [84]. However, a critical distinction remains: culture methods provide a live isolate of the pathogen, which is essential for conducting antimicrobial susceptibility testing (AST) to guide targeted therapy. Most current biosensors, in contrast, focus on detection and identification but do not yield an isolate for further phenotypic analysis [82].
Experimental Protocols in Focus
To understand the data presented in the previous section, it is essential to examine the underlying experimental methodologies that generate it. The following workflows detail the standard procedures for both the traditional culture method and a representative optical biosensor.
Conventional Culture Method for Bacterial Diagnosis
The culture method remains the definitive procedure for confirming an active bacterial infection and obtaining an isolate for antimicrobial testing [82].
Table 2: Key Research Reagents for Culture-Based Methods
| Research Reagent | Function in Protocol |
|---|---|
| Culture Media (e.g., Mannitol Salt Agar) | A selective and differential medium that supports the growth of specific pathogens (e.g., Staphylococcus aureus) and allows for preliminary identification based on metabolic byproducts [4] [50]. |
| MacConkey Agar | A selective medium used to isolate and differentiate members of the Enterobacteriaceae (e.g., E. coli) based on lactose fermentation [82]. |
| Blood Agar | An enriched, non-selective medium that supports the growth of a wide variety of bacteria and reveals hemolytic properties [82]. |
Workflow Protocol:
- Sample Collection & Inoculation: A clinical sample (e.g., urine, blood, swab) is collected and inoculated onto appropriate solid or liquid culture media [82].
- Incubation: The inoculated media is incubated at a controlled temperature (typically 35-37°C) for 24-48 hours to allow for the growth of viable bacterial cells [82] [3].
- Colony Identification: Following incubation, bacterial growth is observed as visible colonies on solid media. These colonies are identified based on their morphological characteristics (size, shape, color) and biochemical tests [82].
- Antimicrobial Susceptibility Testing (AST): Pure colonies are used to prepare a bacterial suspension, which is then tested against a panel of antibiotics to determine the most effective treatment, a process that can require an additional 24 hours [82].
Diagram 1: Culture method workflow
Optical Biosensor Protocol for Bacterial Detection
Optical biosensors represent a class of devices that detect pathogens by measuring a change in light properties caused by bacterial metabolism or specific binding [4] [50].
Table 3: Key Research Reagent Solutions for Optical Biosensors
| Research Reagent | Function in Protocol |
|---|---|
| Selective Culture Medium (e.g., Mannitol Salt Agar) | Serves as the matrix in which bacterial metabolism produces measurable byproducts (e.g., acids), leading to a color change in colorimetric sensors [4] [50]. |
| Fluorescent Dyes / Labels (e.g., SYTO 9, FITC) | Intercalating dyes or labeled antibodies/primers that emit fluorescent signals upon binding to target DNA or proteins, enabling highly sensitive detection [85] [84]. |
| Specific Primers & Probes (for nucleic acid sensors) | Oligonucleotides designed to bind uniquely to target pathogen DNA, enabling amplification (e.g., via RPA, LAMP) and specific detection [84]. |
| CRISPR/Cas12a System | A programmable complex where the Cas12a enzyme, upon recognizing target DNA, cleaves a reporter probe, generating a fluorescent signal for ultra-specific detection [84]. |
Workflow Protocol:
- Sample Introduction: The liquid clinical sample is introduced into the biosensor system, which contains a specific recognition element (e.g., antibodies, nucleic acid probes, or a specialized culture medium) [82] [84].
- Analyte Interaction & Signal Generation: The target pathogen or its biomarker interacts with the recognition element. This interaction produces a measurable signal, such as:
- Signal Transduction & Readout: The optical signal (change in color, fluorescence intensity) is captured by a detector (e.g., photodiode, camera). This signal is transduced and processed, often in real-time.
- Result Interpretation: The processed signal is interpreted to indicate the presence and/or concentration of the target pathogen, typically within 90 minutes to 2 hours [4] [84].
Diagram 2: Biosensor detection workflow
Signaling Pathways and Detection Mechanisms in Biosensors
Biosensors achieve their high specificity and sensitivity through sophisticated molecular recognition events. The mechanism varies significantly based on the type of biosensor.
Optical Biosensor Signaling Pathway
This pathway is characteristic of sensors that rely on colorimetric changes or fluorescence.
Diagram 3: Optical biosensor signaling
Nucleic Acid-Based Biosensor with CRISPR/Cas Signaling Pathway
This pathway illustrates the mechanism for some of the most sensitive and specific next-generation biosensors [84].
Diagram 4: CRISPR/Cas biosensor signaling
Discussion and Future Perspectives
The meta-analysis of current research data clearly positions biosensors as a transformative technology in diagnostic microbiology, primarily due to their unprecedented speed. The ability to detect pathogens in under two hours, as demonstrated by optical and nucleic acid-based biosensors, presents a paradigm shift from the multi-day workflow of culture methods [82] [4] [84]. This rapid turnaround is crucial in clinical settings, enabling earlier initiation of appropriate therapy and improving patient outcomes.
However, the comparison also underscores that biosensors are not a one-to-one replacement for culture. The culture method's unique value lies in its ability to provide a live isolate for Antimicrobial Susceptibility Testing (AST), which is critical for combating antimicrobial resistance [82]. Currently, most biosensors are detection-and-identification devices that cannot perform phenotypic AST. Therefore, the future of bacterial diagnosis likely lies in a synergistic approach. Biosensors could be used for rapid initial screening and identification, while culture is reserved for cases requiring AST or when biosensor results are equivocal.
Future developments in biosensor technology are focused on integrating artificial intelligence for data analysis [86], enhancing multiplexing capabilities to detect multiple pathogens simultaneously [85], and developing novel materials for improved sensitivity [82]. The ultimate goal is the creation of closed-loop "sense-and-treat" systems, where a biosensor continuously monitors a biomarker and triggers the release of a therapeutic agent from an integrated drug delivery system, a concept already under exploration for chronic diseases like diabetes [87]. For infectious diseases, such integrated systems could revolutionize patient management, moving diagnostics from the central laboratory directly to the point-of-care.
The demand for rapid and accurate diagnostic tools during the COVID-19 pandemic has accelerated the development of aptamer-based biosensors. This case study evaluates the diagnostic performance of these biosensors against the traditional gold standard, RT-PCR. Quantitative meta-analysis reveals that specific biosensing platforms, particularly those utilizing Surface Enhanced Raman Scattering (SERS), demonstrate sensitivity and specificity exceeding 97%, rivaling the accuracy of RT-PCR. Furthermore, innovative designs employing aptamer cocktails for multi-target detection show significant potential for enhancing diagnostic reliability and reducing false-negative results in real-world clinical settings.
The unprecedented global challenge of the SARS-CoV-2 pandemic underscored a critical need for diagnostic technologies that are not only accurate but also rapid, accessible, and deployable at the point of care. Reverse Transcription-Polymerase Chain Reaction (RT-PCR), while the established gold standard for molecular detection, faces limitations including operational complexity, lengthy processing times, and the requirement for specialized laboratory infrastructure [6] [88]. These challenges have catalyzed the exploration of alternative diagnostic platforms, among which aptamer-based biosensors have emerged as a formidable contender.
Aptamers are single-stranded DNA or RNA oligonucleotides that bind to specific targets, such as viral proteins, with high affinity and specificity. Their advantages over traditional antibodies include superior stability, ease of synthetic production, and lower batch-to-batch variability [89]. This case study objectively analyzes the performance of biosensors leveraging these synthetic molecules for detecting SARS-CoV-2, directly comparing their diagnostic accuracy to that of RT-PCR. Framed within a broader thesis on evaluating novel diagnostics against traditional methods, this analysis synthesizes recent meta-analytical data and experimental findings to demonstrate that certain aptamer-based biosensor configurations now rival the benchmark accuracy of RT-PCR, heralding a significant advancement in the field of infectious disease diagnostics [90] [91] [92].
Performance Comparison: Aptamer-Based Biosensors vs. RT-PCR
A comprehensive meta-analysis of 14 studies, encompassing 8,082 clinical samples, provides robust, pooled evidence on the performance of various aptamer-based biosensing platforms for SARS-CoV-2 detection compared to RT-PCR. The results are summarized in the table below.
Table 1: Diagnostic Accuracy of Aptamer-Based Biosensor Platforms vs. RT-PCR (Meta-Analysis Summary) [90] [91]
| Biosensing Platform | Sensitivity (95% CI) | Specificity (95% CI) | Diagnostic Odds Ratio (95% CI) | Area Under Curve (AUC) |
|---|---|---|---|---|
| SERS (Surface Enhanced Raman Scattering) | 0.97 (0.91–0.99) | 0.98 (0.95–1.00) | 766.63 (133.85–4391.03) | 0.98 |
| Electrochemical | 0.95 (0.92–0.97) | 0.96 (0.93–0.98) | 312.15 (145.22–670.78) | 0.98 |
| Fluorescence | 0.93 (0.89–0.96) | 0.95 (0.91–0.97) | 198.47 (102.34–385.01) | 0.97 |
| ELONA (Enzyme-Linked Oligonucleotide Assay) | 0.91 (0.87–0.94) | 0.93 (0.89–0.96) | 145.89 (78.45–271.35) | 0.96 |
The data demonstrates that all major aptamer-based platforms perform with excellent diagnostic accuracy. The SERS platform stands out, showing the highest pooled sensitivity and specificity, indicating its superior capability to correctly identify both infected and non-infected individuals. The exceptionally high Diagnostic Odds Ratio (DOR) for SERS, which is a single indicator of test performance combining sensitivity and specificity, further underscores its diagnostic strength [90] [91].
Beyond these established platforms, novel biosensor configurations are being developed to address challenges such as viral mutation and variable antigen expression. Research into multiple aptamer cocktail-based lateral flow assays (mACLFAs), which simultaneously target both the nucleocapsid (N) and spike (S) proteins of SARS-CoV-2, has shown promising results. One study reported that the most effective assay model achieved 100% sensitivity and 100% specificity when validated against RT-PCR using clinical samples. This approach mitigates the risk of false negatives that can occur if a virus mutates in a region targeted by a single aptamer, thereby enhancing diagnostic robustness [92].
Experimental Protocols and Workflows
Key Methodologies in Aptamer-Based SARS-CoV-2 Detection
The high accuracy of aptamer-based biosensors is underpinned by specific and carefully optimized experimental protocols. The following workflows detail two primary detection strategies: the SERS platform, which demonstrated top-tier performance in the meta-analysis, and the lateral flow platform, which offers rapid point-of-care potential.
Diagram 1: SERS biosensor workflow. The binding of the viral target to the immobilized aptamer alters the local refractive index and the Raman vibrational fingerprint, producing a quantifiable signal shift [90] [93].
Diagram 2: Aptamer cocktail LFA workflow. This model uses a mixture of aptamers targeting different viral proteins (e.g., N and S) on a single strip, improving detection accuracy by capturing multiple antigens simultaneously [92] [94].
Detailed Experimental Protocol: Multiple Aptamer Cocktail Lateral Flow Assay (mACLFA)
The following protocol is derived from a study that achieved 100% sensitivity and specificity using aptamer cocktails for the detection of SARS-CoV-2 [92]:
Reagent Preparation:
- Gold Nanoparticle (AuNP) Synthesis: Spherical AuNPs are synthesized by reducing tetrachloroauric acid with trisodium citrate under boiling and stirring conditions. The resulting wine-red solution is characterized by UV-Vis spectroscopy (peak absorbance ~520 nm) and electron microscopy to confirm size and morphology.
- Aptamer Conjugation: Thiol-modified capture aptamers (specific to N and S proteins) are reduced using Tris(2-carboxyethyl)phosphine hydrochloride (TCEP) to expose free thiol groups. These are then incubated with the synthesized AuNPs to form stable Au-thiol bonds, creating the AuNP-aptamer conjugates. The conjugates are stabilized in a buffer containing sucrose and Tween-20.
Assay Assembly and Execution:
- Strip Construction: The lateral flow strip consists of a sample pad, conjugate pad, nitrocellulose membrane, and absorbent pad.
- Test Line Preparation: Biotinylated detection aptamers (distinct from the capture aptamers) are immobilized onto the nitrocellulose membrane at two test lines (T1 and T2) using streptavidin-biotin interaction. A control line is prepared with a biotinylated oligonucleotide complementary to one of the capture aptamers.
- Assay Procedure: The clinical sample (e.g., nasopharyngeal swab in transport medium) is applied to the sample pad. The liquid migrates, rehydrating the AuNP-aptamer conjugates in the conjugate pad. If SARS-CoV-2 antigens are present, they form complexes with the conjugates. These complexes continue to migrate across the membrane.
- Sandwich Formation: The complexes are captured at the respective test lines by the immobilized aptamers, forming a sandwich structure (e.g., immobilized aptamer - viral protein - AuNP-aptamer conjugate). The accumulation of AuNPs produces a visible red band.
- Control Line: The control line must show a red band to validate that the assay has functioned correctly.
The critical innovation in this protocol is the use of optimized "aptamer cocktails" that target different epitopes on the N and S proteins simultaneously, which enhances the assay's robustness and diagnostic accuracy compared to single-aptamer approaches [92].
The Scientist's Toolkit: Essential Research Reagents and Materials
The development and deployment of high-performance aptamer-based biosensors rely on a specific set of reagents and materials. The following table details key components and their functions in a typical experimental setup.
Table 2: Key Research Reagent Solutions for Aptamer-Based Biosensor Development
| Reagent/Material | Function in Experiment | Specific Examples |
|---|---|---|
| Oligonucleotide Aptamers | Biological recognition element; binds specifically to viral target (e.g., N or S protein). | Thiol- or biotin-modified DNA aptamers (e.g., N APT3, S APT1) [92]. |
| Gold Nanoparticles (AuNPs) | Signal label or transducer; enables visual (colorimetric) or electrochemical signal detection. | Spherical citrate-capped AuNPs; conjugated to thiolated aptamers [92] [94]. |
| Nanostructured Substrates | Enhances signal transduction; provides high surface area for aptamer immobilization. | Gold nanohole arrays (for SERS), screen-printed carbon electrodes (electrochemical) [90] [89]. |
| Signal Amplification Enzymes | Enhances detection sensitivity by catalyzing a reaction that generates a measurable signal. | Horseradish Peroxidase (HRP), Klenow Fragment exo-DNA polymerase (for SDA) [89] [94]. |
| Specialized Buffers | Maintains optimal pH and ionic strength; reduces non-specific binding. | Saline-sodium citrate (SSC) buffer, Tris-based buffers with Tween-20 [92]. |
| Nitrocellulose Membrane | Porous matrix for capillary flow and immobilization of capture probes in lateral flow assays. | High-flow-rate membranes from suppliers like Millipore [92] [94]. |
The consolidated evidence from recent high-quality studies indicates that aptamer-based biosensors are no longer just a promising alternative but a mature technology capable of matching the diagnostic accuracy of the gold-standard RT-PCR for SARS-CoV-2 detection. The SERS platform, with sensitivity and specificity metrics at 97% and 98% respectively, and novel lateral flow assays employing multi-target aptamer cocktails, achieving 100% accuracy in validation studies, represent significant milestones. These biosensors successfully address several limitations of traditional culture and molecular methods, including speed, cost, and deployability, without compromising on performance. This case study confirms that the integration of highly specific aptamers with advanced transduction technologies constitutes a powerful and reliable paradigm for infectious disease diagnosis, with profound implications for future pandemic preparedness and routine clinical practice.
The escalating demand for rapid and precise diagnostic tools in clinical practice has intensified the focus on biosensor technologies as alternatives to traditional culture methods. While conventional techniques like microbiological plating and polymerase chain reaction (PCR) remain cornerstone approaches in pathogen identification, they often involve protracted turnaround times, sophisticated equipment, and specialized personnel [95] [2]. These limitations become particularly critical in scenarios requiring immediate therapeutic decisions, such as sepsis management, stroke diagnosis, or outbreak containment. The assessment of clinical utility for any diagnostic technology fundamentally hinges on three interdependent pillars: cost-effectiveness, operational speed (turnaround time), and ultimate impact on patient outcomes. This guide provides a systematic comparison between emerging biosensor technologies and traditional methods, framing the evaluation within the broader thesis of diagnostic accuracy and its translation to clinical efficacy. For researchers and drug development professionals, understanding these parameters is crucial for guiding future development, validation, and implementation of biosensor platforms in real-world healthcare settings.
The evolution of diagnostic methodologies spans from conventional culture-based techniques to sophisticated biosensor platforms. Table 1 provides a quantitative comparison of their core performance metrics, while Table 2 details the cost and resource profiles.
Table 1: Performance Comparison of Diagnostic Methods
| Method Category | Specific Method | Typical Turnaround Time | Limit of Detection (LOD) | Key Advantages | Major Limitations |
|---|---|---|---|---|---|
| Traditional Culture | Microbiological plating | 24–72 hours [2] | 10–100 CFU/ml (post-enrichment) [2] | Gold standard, high specificity | Lengthy process, high resource use [2] |
| Molecular Methods | Conventional PCR | 3–6 hours [2] | Varies by target | High sensitivity, specific | Requires thermocycling, trained staff [2] |
| Loop-Mediated Isothermal Amplification (LAMP) | 20–60 minutes [95] [3] | Varies by target | Rapid, isothermal conditions | Can be prone to false positives | |
| Immunological Methods | Enzyme-Linked Immunosorbent Assay (ELISA) | 2–4 hours | 103–105 CFU/ml [2] | High-throughput, quantitative | Moderate sensitivity, false positives [2] |
| Biosensors | Electrochemical Biosensors | 1 minute – 1 hour [95] [2] | As low as 2 CFU/ml [2] | Rapid response, high sensitivity, portable [95] | May not distinguish live/dead cells [2] |
| Optical Biosensors (e.g., Biolayer Interferometry) | Minutes to hours [66] | High sensitivity for proteins [66] | Label-free, real-time kinetic data | Signal interference in complex media | |
| Cell-Free Biosensors | 90 minutes or less [96] | Attomolar for nucleic acids [96] | Bypass regulatory GMO concerns, field-deployable [96] | Limited shelf-life, reagent stability |
Table 2: Cost and Resource Profile Comparison
| Parameter | Traditional Culture Methods | Molecular Methods (e.g., PCR) | Rapid Biosensors |
|---|---|---|---|
| Equipment Cost | Moderate to High [2] | High (thermocyclers) [2] | Low to Moderate (portable devices) [3] |
| Per-Test Cost | Low (consumables) | Moderate to High (reagents) | Varies (disposable cartridges can increase cost) |
| Personnel Skill Level | High (trained technicians) [95] | High (trained staff) [95] [2] | Low (designed for user-friendliness) [3] |
| Sample Preparation | Extensive (enrichment, plating) [2] | Intensive (nucleic acid extraction) [2] | Minimal to Moderate (often integrated) [2] |
| ASSURED* Criteria Compliance | Low | Moderate | High [2] [3] |
*ASSURED: Affordable, Sensitive, Specific, User-friendly, Rapid and Robust, Equipment-free, and Deliverable to end-users [2].
The data reveals a clear trade-off. Traditional methods, while inexpensive per test and considered highly accurate, suffer from long turnaround times that delay critical clinical decisions [2]. Biosensors address this fundamental bottleneck, offering results in minutes to hours, which is crucial for acute conditions. Furthermore, their design often aligns with the WHO's ASSURED criteria, making them suitable for low-resource settings [2] [3].
Experimental Protocols for Biosensor Assessment
A critical component of evaluating clinical utility is understanding the experimental workflows used to generate performance data. The following protocols detail two prominent approaches: one for a whole-cell bacterial biosensor and another for a general electrochemical biosensor platform.
Protocol 1: Development and Testing of a Two-Component System (TCS) Whole-Cell Biosensor
This protocol is adapted from studies engineering E. coli CusRS two-component systems for copper ion detection, demonstrating the process of enhancing biosensor performance through genetic optimization [79].
- Strain Engineering and Plasmid Construction: The native copper-sensitive CusRS TCS is utilized. A positive feedback circuit plasmid is constructed, housing the cusR gene and a reporter gene (e.g., superfolder green fluorescent protein, sfGFP) under the control of the CusR-activated promoters PcusR and PcusC, respectively.
- Signal Amplification Module: To enhance the output signal, a copy-number inducible gene (e.g., repL) is introduced upstream of the reporter gene. Upon analyte detection, the activated promoter drives repL expression, which increases the plasmid copy number, thereby amplifying the reporter signal.
- Host Genome Modification: To improve sensitivity, host genes involved in copper detoxification (e.g., cueO and cusCFBA) are knocked out. This prevents the bacterial cell from rapidly expelling the target analyte, allowing for greater accumulation and a stronger signal.
- Cell Culture and Induction:
- An overnight culture of the engineered biosensor strain is diluted (e.g., 1:100) in fresh LB medium and incubated until the mid-log growth phase (OD600 ≈ 0.6).
- The culture is induced with a range of target analyte concentrations (e.g., Cu(II) from 0 to 100 µM).
- Induction is typically carried out for a set period (e.g., 5 hours) to ensure a measurable response.
- Response Measurement and Analysis: Fluorescence intensity (from sfGFP) and optical density are measured using a microplate reader. The fold-change (I/I0) is calculated as the ratio of fluorescence in induced samples (I) to that in uninduced controls (I0). The limit of detection (LOD) is determined from the lowest concentration producing a statistically significant signal over background.
Protocol 2: General Workflow for Electrochemical Biosensor Analysis
This protocol outlines a standard procedure for characterizing electrochemical biosensors, such as those used for pathogen or biomarker detection [95] [2].
- Biosensor Fabrication: The working electrode is modified with a biorecognition element (e.g., antibody, aptamer, peptide). This often involves surface cleaning, followed by immobilization of the capture element through chemical cross-linking or adsorption.
- Experimental Setup: A fluidic cell system is used, sometimes with multiple channels, to allow for parallel measurement of several sensors and ensure controlled sample flow.
- Sample Exposure and Data Acquisition:
- The modified biosensor is exposed to the target analyte (e.g., bacterial pathogens, proteins) in a buffer or complex matrix (e.g., milk, serum).
- The electrochemical response (e.g., impedance, amperometric, or voltammetric signal) is recorded in real-time. Techniques like Electrochemical Impedance Spectroscopy (EIS) or Differential Pulse Voltammetry (DPV) are commonly employed.
- Data Processing and Forecasting: The raw time-dependent signal is collected. To reduce the effective response time, machine learning models such as Long Short-Term Memory (LSTM) networks can be applied. These models are trained on initial response data to forecast the ultimate equilibrium signal, significantly cutting down the required measurement period [97].
- Calibration and LOD Determination: A calibration curve is generated by plotting the sensor response (e.g., change in charge transfer resistance, peak current) against the logarithm of the target analyte concentration. The LOD is calculated as the concentration corresponding to a signal three times the standard deviation of the blank (negative control) response.
Signaling Pathways and Experimental Workflows
The operation of advanced biosensors is often based on specific biological signaling pathways or optimized experimental workflows. The following diagrams illustrate the core mechanisms of a two-component system biosensor and a general workflow integrating machine learning for accelerated response.
Diagram 1: Two-Component System (TCS) Biosensor Pathway. This diagram illustrates the signal transduction mechanism in engineered bacterial biosensors. The process begins with analyte binding to the membrane-bound sensor kinase (CusS), triggering its autophosphorylation. The phosphate group is then transferred to the response regulator (CusR). The phosphorylated CusR (CusR~P) binds to and activates its target promoter, driving the expression of a reporter gene (e.g., sfGFP). A key feature for signal amplification is the positive feedback loop, where the promoter also drives additional expression of the response regulator itself [79].
Diagram 2: Workflow for ML-Accelerated Biosensor Reading. This workflow demonstrates how machine learning (ML) integrates with biosensing to reduce turnaround time. After sample introduction, the biosensor begins acquiring a real-time signal. Instead of waiting for the signal to reach equilibrium (which can be slow due to diffusion limits), an initial portion of the time-series data is fed into a pre-trained ensemble of Long Short-Term Memory (LSTM) networks. The LSTM model forecasts the final, steady-state response. This allows for a clinical decision to be made significantly faster than if one waited for the full, traditional measurement to complete [97].
The Scientist's Toolkit: Key Research Reagent Solutions
The development and deployment of high-performance biosensors rely on a suite of specialized reagents and materials. Table 3 catalogues essential components and their functions, forming a toolkit for researchers in the field.
Table 3: Essential Research Reagents and Materials for Biosensor Development
| Reagent/Material | Function | Example Application |
|---|---|---|
| Biorecognition Elements | Provides specificity by binding the target analyte. | Antibodies for E. coli O157:H7 [2], aptamers for proteins [2], engineered transcription factors [96]. |
| Single-Wall Carbon Nanotubes (SWCNTs) | Nanomaterial transducer; signal conversion and amplification. Electrochemical properties depend on chirality [98]. | Electrode modification for sensitive dopamine or hormone detection [98]. |
| Plasmid Vectors with Inducible Systems | Genetic platform for housing sensor circuits and reporter genes. | pCWCu32 vector for CusRS copper-sensing circuitry [79]. |
| Cell-Free Transcription-Translation (TX-TL) Systems | Lysate-based system for executing genetic circuits without living cells. | CRISPR-based detection of SARS-CoV-2 RNA [96]. |
| Europium Complex-Loaded Nanoparticles | Long-lifetime luminescent labels for signal enhancement in immunoassays. | Time-resolved luminescent immunoassay for human IgG [66]. |
| Porous Silicon | High-surface-area substrate for immobilizing biorecognition elements. | Optical biosensors for real-time protein detection [97]. |
| Modular Receptor Scaffolds (e.g., CadC) | Engineered signaling platform allowing exchange of sensing domains. | Detection of bile salts in patient serum [96]. |
Impact on Patient Outcomes and Clinical Decision-Making
The ultimate measure of a diagnostic technology's value is its tangible impact on patient care. The accelerated turnaround times enabled by biosensors directly influence clinical pathways in critical areas.
In stroke management, where "time is brain," rapid diagnosis is paramount. Biosensors capable of detecting blood-based biomarkers like glial fibrillary acidic protein (GFAP), neurofilament light chain (NfL), and matrix metalloproteinases (MMPs) at the point-of-care can facilitate immediate intervention within the "golden hour," dramatically improving prospects for recovery and reducing long-term disability [99]. Similarly, in infectious disease control, the ability to detect pathogens like SARS-CoV-2 or foodborne illnesses in minutes to a few hours, as opposed to days with traditional culture, allows for swift isolation, targeted antibiotic administration, and source identification, thereby curbing transmission and improving individual patient outcomes [95] [2]. The integration of machine learning for response-time forecasting further compresses this diagnostic timeline, leading to faster clinical decision-making [97].
Furthermore, the trend towards continuous health monitoring using implantable or wearable biosensors opens new frontiers for managing chronic conditions and detecting physiological fluctuations. For instance, the development of highly sensitive sensors based on chirality-purified carbon nanotubes aims to monitor hormone levels millions of times lower than glucose, promising new insights into personal health and enabling pre-symptomatic disease detection [98]. These advancements, coupled with the move towards multiplexed assays that can detect multiple biomarkers from a single sample, position biosensor technology as a cornerstone of future personalized medicine and proactive healthcare strategies [3] [99].
Conclusion
The comparative evaluation firmly establishes biosensors as a transformative technology, offering a compelling alternative to traditional culture methods with radical reductions in detection time—from days to hours or even minutes—while maintaining high diagnostic accuracy. Despite persistent challenges in stability and commercialization, the integration of nanomaterials, synthetic biology, and artificial intelligence is rapidly advancing the field. The future of biomedical research and clinical diagnostics lies in the strategic combination of culture methods' robustness for validation and biosensors' speed for rapid screening and real-time monitoring, ultimately accelerating drug discovery and enabling precision medicine.
References
- 1. A Comprehensive Review of Innovative Paradigms in ... [https://pmc.ncbi.nlm.nih.gov/articles/PMC11216122/]
- 2. Advances, applications, and limitations of portable and rapid ... [https://pmc.ncbi.nlm.nih.gov/articles/PMC9760820/]
- 3. Biosensors for rapid detection of bacterial pathogens in ... [https://www.sciencedirect.com/science/article/pii/S0160412022002847]
- 4. Biosensor for Bacterial Detection Through Color Change in ... [https://pmc.ncbi.nlm.nih.gov/articles/PMC12384555/]
- 5. A systematic review of electrochemical biosensors for ... [https://www.sciencedirect.com/science/article/abs/pii/S0956713525004724]
- 6. Point-of-care biosensors for infectious disease diagnosis [https://pubs.rsc.org/en/content/articlehtml/2025/ra/d5ra03897a?page=search]
- 7. Advances in Enzyme-Based Biosensors: Emerging Trends ... [https://www.mdpi.com/2673-4591/106/1/5]
- 8. Advancing protein biosensors: redefining detection through ... [https://pmc.ncbi.nlm.nih.gov/articles/PMC11987851/]
- 9. Innovative applications and research advances of bacterial ... [https://www.frontiersin.org/journals/microbiology/articles/10.3389/fmicb.2025.1507491/full]
- 10. Mathematical modeling of a MoSe₂-based SPR biosensor ... [https://www.frontiersin.org/journals/bioengineering-and-biotechnology/articles/10.3389/fbioe.2025.1547248/full]
- 11. Advances in optical biosensors as alternative diagnostics ... [https://www.sciencedirect.com/science/article/pii/S2666053925000839]
- 12. Incubation Time - an overview [https://www.sciencedirect.com/topics/biochemistry-genetics-and-molecular-biology/incubation-time]
- 13. 3 Reasons Why Rapid Microbiological Testing is Essential for... | Hygiena [https://www.hygiena.com/news/3-reasons-why-rapid-microbiological-testing-essential-uht-vs-esl-milk-products]
- 14. Evaluation of Optimal Blood Culture To Maximize... Incubation Time [https://pmc.ncbi.nlm.nih.gov/articles/PMC8106720/]
- 15. Biosensors, Volume 15, Issue 8 (August 2025) – 85 articles [https://www.mdpi.com/2079-6374/15/8]
- 16. Rapid biosensor development using plant hormone ... [https://www.nature.com/articles/s41587-022-01364-5]
- 17. Biosensors, Volume 15, Issue 9 (September 2025) [https://www.mdpi.com/2079-6374/15/9]
- 18. Recent Advances in Micro- and Nano-Enhanced Intravascular ... [https://pmc.ncbi.nlm.nih.gov/articles/PMC12349352/]
- 19. Low-Cost Biosensor Technologies for Rapid Detection of ... [https://pmc.ncbi.nlm.nih.gov/articles/PMC11537281/]
- 20. Advances in biosensor strategies for detecting foodborne ... [https://www.sciencedirect.com/science/article/abs/pii/S0026265X25028218]
- 21. Biosensors Market Size, Share & Analysis | Growth Report ... [https://www.fortunebusinessinsights.com/industry-reports/bio-sensors-market-100146]
- 22. Emerging trends in AI-integrated optical biosensors for point ... [https://pubs.rsc.org/en/content/articlehtml/2025/cc/d5cc04899k]
- 23. North America Piezoelectric Biosensor Market Data-Driven ... [https://www.linkedin.com/pulse/north-america-piezoelectric-biosensor-market-data-driven-hb3jf/]
- 24. Advances in Biosensing Technologies for Immunoglobulin E [https://www.sciencedirect.com/science/article/pii/S2949913525000527]
- 25. High-performance electrochemical biosensor comprising ... [https://www.nature.com/articles/s42004-025-01703-y]
- 26. Insights into the performance-determining aspects of ... [https://pubs.rsc.org/en/content/articlehtml/2025/sd/d5sd00095e]
- 27. Flexible Piezoelectric Sensor 2025-2033 Trends [https://www.archivemarketresearch.com/reports/flexible-piezoelectric-sensor-818644]
- 28. Research Progress on Multiplexed Pathogen Detection ... [https://www.mdpi.com/2079-6374/15/6/378]
- 29. Optical Sensor for Bacterial Detection Through Color ... [https://www.preprints.org/manuscript/202506.0999]
- 30. Optical biosensors for diagnosing neurodegenerative ... [https://www.nature.com/articles/s44328-025-00040-3]
- 31. Recent Advances in Flexible Materials for Wearable ... [https://pmc.ncbi.nlm.nih.gov/articles/PMC12467128/]
- 32. New Trends in Impedimetric Biosensors for the Detection of ... [https://pmc.ncbi.nlm.nih.gov/articles/PMC3376556/]
- 33. Biosensor-Based Detection of Salmonella spp. in Food [https://pmc.ncbi.nlm.nih.gov/articles/PMC11674448/]
- 34. From Microorganism-Based Amperometric Biosensors ... [https://pmc.ncbi.nlm.nih.gov/articles/PMC8038125/]
- 35. Advances in Impedimetric Biosensors: Current Applications ... [https://www.mdpi.com/2072-666X/16/11/1244]
- 36. Label-Free Electrochemical Biosensor for Real-Time ... [https://www.sciencedirect.com/science/article/abs/pii/S0956566325008371]
- 37. Impedimetric and amperometric genosensors for the highly ... [https://www.sciencedirect.com/science/article/pii/S2590137022001157]
- 38. Development and Comparative Evaluation of Two Enzyme ... [https://www.mdpi.com/2072-666X/16/10/1168]
- 39. Comparison of Culture, Conventional and Real-time PCR ... [https://pmc.ncbi.nlm.nih.gov/articles/PMC4662229/]
- 40. Study Finds a Faster Way to Detect Listeria [https://asm.org/press-releases/2025/february/study-finds-a-faster-way-to-detect-listeria]
- 41. Rapid and simple detection of Listeria monocytogenes ... [https://pmc.ncbi.nlm.nih.gov/articles/PMC12401984/]
- 42. Rapid colorimetric sensing platform for the detection of ... [https://www.sciencedirect.com/science/article/abs/pii/S0956566316306741]
- 43. E coli detection in 6 hours. From overnight to same-shift [https://www.rapidmicrobiology.com/news/from-overnight-to-same-shift-how-a-6h-culture-test-is-re-shaping-e-coli-control-in-water-labs]
- 44. Designing a new biosensor “DNA ELISA” to detect ... [https://pmc.ncbi.nlm.nih.gov/articles/PMC6010088/]
- 45. Rapid detection and capture of clinical Escherichia coli ... [https://pmc.ncbi.nlm.nih.gov/articles/PMC12259851/]
- 46. A Comprehensive Review of Detection Methods for ... [https://pmc.ncbi.nlm.nih.gov/articles/PMC12298662/]
- 47. Rapid and sensitive colorimetric detection of viable ... [https://www.sciencedirect.com/science/article/pii/S0023643825013076]
- 48. Unveiling the real-time behaviour of Staphylococcus ... [https://www.nature.com/articles/s41598-025-16164-5]
- 49. High-throughput real-time detection of sepsis inflammatory ... [https://www.sciencedirect.com/science/article/abs/pii/S1385894725086693]
- 50. Biosensor for Bacterial Detection Through Color Change in ... [https://www.mdpi.com/2079-6374/15/8/551]
- 51. An Organ-on-a-Chip Modular Platform with Integrated ... [https://pmc.ncbi.nlm.nih.gov/articles/PMC12300027/]
- 52. Using Organ-on-a-Chip Technology to Unlock Patient ... [https://emulatebio.com/using-organ-on-a-chip-technology-to-unlock-patient-derived-precision-medicine/]
- 53. Advancing healthcare through laboratory on a chip technology [https://pmc.ncbi.nlm.nih.gov/articles/PMC11577522/]
- 54. Organ-on-a-Chip Market Size to Hit USD ... [https://www.precedenceresearch.com/organ-on-a-chip-market]
- 55. Organ on a Chip Market Size Skyrockets 35.15% CAGR by ... [https://www.towardshealthcare.com/insights/organ-on-a-chip-market-sizing]
- 56. Biosensors in Microbial Ecology: Revolutionizing Food ... [https://pmc.ncbi.nlm.nih.gov/articles/PMC12300841/]
- 57. Nanoparticle-based detection of foodborne pathogens [https://www.sciencedirect.com/science/article/pii/S2590157525005437]
- 58. Fluorescent biosensors for the detection of foodborne ... [https://pubs.rsc.org/en/content/articlehtml/2025/ay/d5ay01025j]
- 59. Development and clinical validation of photochemical ... [https://pubmed.ncbi.nlm.nih.gov/39711147/]
- 60. Integration of Artificial Intelligence in Biosensors for ... [https://pubmed.ncbi.nlm.nih.gov/41149342/?utm_source=FeedFetcher&utm_medium=rss&utm_campaign=None&utm_content=1TOjW_LBRK9_qxvXqaCXc4RtH8pq9gaK-5lQ1w6F3yWD11kEm6&fc=None&ff=20251102013323&v=2.18.0.post22+67771e2]
- 61. AI-Enhanced Surface Functionalization in Biosensors [https://www.sciencedirect.com/science/article/abs/pii/S0165993625003887]
- 62. Emerging trends in nano-sensors: A new frontier in food ... [https://www.sciencedirect.com/science/article/pii/S240584402417212X]
- 63. Biosensor for Bacterial Detection Through Color Change ... [https://pubmed.ncbi.nlm.nih.gov/40863011/]
- 64. A biochemical sensor with continuous extended stability in ... [https://www.nature.com/articles/s41551-025-01389-6]
- 65. Electrochemical biosensors based on the 3D immobilization of ... [https://pubs.rsc.org/en/content/articlehtml/2025/ra/d5ra03744a]
- 66. Biosensors, Volume 15, Issue 11 (November 2025) [https://www.mdpi.com/2079-6374/15/11]
- 67. Improving the reproducibility, accuracy, and stability of an ... [https://www.sciencedirect.com/science/article/abs/pii/S0956566320301081]
- 68. A novel strategy for controllable electrofabrication of ... [https://www.nature.com/articles/s41598-025-93025-1]
- 69. A highly sensitive microfluidic biosensor for rapid and ... [https://www.sciencedirect.com/science/article/pii/S2666053924000730]
- 70. Frontiers | Nano-enabled biosensors in early detection of plant diseases [https://www.frontiersin.org/journals/nanotechnology/articles/10.3389/fnano.2025.1545792/full]
- 71. Unlocking the potential of 2D nanomaterial-based biosensors ... [https://pubs.rsc.org/en/content/articlehtml/2025/ma/d4ma00546e]
- 72. Advances in nanomaterial-based biosensors [https://www.sciencedirect.com/science/article/abs/pii/S235249282501846X]
- 73. Recent Advances in Developing Cell-Free Protein ... [https://pmc.ncbi.nlm.nih.gov/articles/PMC12385134/]
- 74. Integrating synthetic biology and biosensing [https://www.sciencedirect.com/science/article/abs/pii/S305047592500778X]
- 75. Research Progress on Nanotechnology-Driven Enzyme Biosensors for Electrochemical Detection of Biological Pollution and Food Contaminants - PMC [https://pmc.ncbi.nlm.nih.gov/articles/PMC11989163/]
- 76. Biosensors for the Detection of Bacterial and Viral Clinical ... [https://pmc.ncbi.nlm.nih.gov/articles/PMC7730340/]
- 77. The measures of biosensor performance and how to ... [https://blog.igii.uk/the-measures-of-biosensor-performance-and-how-to-improve-accuracy]
- 78. Design and numerical evaluation of a high sensitivity ... [https://www.nature.com/articles/s41598-025-07501-9]
- 79. Development of a two component system based biosensor ... [https://www.nature.com/articles/s42003-024-07112-6]
- 80. Biosensor Technology: Advances and Applications in ... [https://www.mdpi.com/2306-7381/12/1/23]
- 81. The Role of Artificial Intelligence in Advancing Biosensor ... [https://pmc.ncbi.nlm.nih.gov/articles/PMC12392873/]
- 82. Innovative Biosensor Technologies in the Diagnosis of ... [https://pmc.ncbi.nlm.nih.gov/articles/PMC11399381/]
- 83. Biosensors applications in medical field: A brief review [https://www.sciencedirect.com/science/article/pii/S2666351121000218]
- 84. Comparison of Biosensing Methods Based on Different ... [https://www.mdpi.com/2079-6374/12/12/1174]
- 85. A general method for the development of multicolor ... [https://pmc.ncbi.nlm.nih.gov/articles/PMC10449634/]
- 86. Information visualization and machine learning driven ... [https://www.sciencedirect.com/science/article/abs/pii/S0165993623002029]
- 87. Biosensor-Integrated Drug Delivery Systems as New ... [https://pmc.ncbi.nlm.nih.gov/articles/PMC9496590/]
- 88. Current Technologies for Detection of COVID-19 [https://pmc.ncbi.nlm.nih.gov/articles/PMC9824404/]
- 89. Advances in aptamer-based electrochemical biosensors for ... [https://pubs.rsc.org/en/content/articlehtml/2025/nh/d5nh00368g?page=search]
- 90. Diagnostic accuracy of aptamer-based biosensors for the ... [https://www.sciencedirect.com/science/article/pii/S2405844025017463]
- 91. Diagnostic accuracy of aptamer-based biosensors for the ... [https://ui.adsabs.harvard.edu/abs/2025Heliy..1143362M/abstract]
- 92. Multiple detection method for SARS-CoV-2 with aptamer ... [https://pmc.ncbi.nlm.nih.gov/articles/PMC12498445/]
- 93. Nanoplasmonic biosensors for detecting viruses and ... [https://www.nature.com/articles/s44328-025-00043-0]
- 94. Aptamer based lateral flow biosensor for rapid detection of ... [https://www.frontiersin.org/journals/microbiology/articles/10.3389/fmicb.2025.1643764/full]
- 95. A comparison of conventional and advanced electroanalytical ... [https://pmc.ncbi.nlm.nih.gov/articles/PMC9270057/]
- 96. Microbial biosensors for diagnostics, surveillance and ... [https://pmc.ncbi.nlm.nih.gov/articles/PMC11568237/]
- 97. Sensor Response-Time Reduction using Long-Short Term ... [https://arxiv.org/abs/2404.17144]
- 98. Researchers invent new method for developing accurate ... [https://www.sciencedaily.com/releases/2025/03/250313130536.htm]
- 99. Emerging Biosensor Technologies for Stroke Biomarker ... [https://pmc.ncbi.nlm.nih.gov/articles/PMC12343203/]