Biosensors for Pesticide Detection: A Comprehensive Guide to Principles, Applications, and Emerging Technologies
This article provides a comprehensive overview of the latest advancements in biosensor technology for pesticide detection, tailored for researchers, scientists, and drug development professionals.
Biosensors for Pesticide Detection: A Comprehensive Guide to Principles, Applications, and Emerging Technologies
Abstract
This article provides a comprehensive overview of the latest advancements in biosensor technology for pesticide detection, tailored for researchers, scientists, and drug development professionals. It explores the foundational principles of different biosensor types, including enzyme-based, immunosensors, aptasensors, and whole-cell biosensors. The scope extends to detailed methodologies, leveraging nanomaterials like metal-organic frameworks (MOFs) and nanozymes, and covers practical applications in food safety and environmental monitoring. The review also addresses key challenges in sensor stability and specificity, offers comparative analyses with traditional chromatographic methods, and discusses future trajectories involving AI integration and multimodal sensing for enhanced on-site detection capabilities.
The Principles and Urgent Need for Biosensing in Pesticide Monitoring
The global population has surpassed 8 billion, presenting a monumental challenge in securing the global food supply [1]. Pesticides play an indispensable role in enhancing crop yields and maintaining quality by controlling pests and diseases; however, their excessive or improper use leads to persistent environmental contamination and poses significant health risks to consumers, including links to cancer, neurological disorders, and endocrine disruptions [2]. This creates a critical tension between the need for agricultural productivity and the imperative of food safety. Traditional pesticide detection methods, such as gas chromatography (GC) and high-performance liquid chromatography (HPLC), while accurate, are labor-intensive, time-consuming, and require sophisticated laboratory settings [3] [2]. Consequently, there is an urgent need for advanced, field-deployable analytical tools. Biosensor technology has emerged as a viable and efficient solution, offering rapid, sensitive, and on-site detection capabilities that are crucial for modern food safety control and environmental monitoring [3] [4].
Biosensing Fundamentals and Relevance
A biosensor is an analytical device that integrates a biological recognition element (such as an enzyme, antibody, or aptamer) with a physicochemical transducer (optical, electrochemical, etc.) to convert a biological interaction into a quantifiable signal [2]. The effectiveness of biosensors for pesticide detection hinges on their design, which leverages specific biological interactions with pesticide molecules.
Table 1: Core Components of a Biosensor
| Component | Description | Common Examples |
|---|---|---|
| Biological Recognition Element | Provides specificity by interacting with the target analyte | Acetylcholinesterase (AChE), antibodies, aptamers, whole cells [5] [2] |
| Transducer | Converts the biological response into a measurable signal | Electrode (electrochemical), photodetector (optical), piezoelectric crystal [3] [6] |
| Signal Processor | Amplifies and displays the output signal | Potentiostat, spectrophotometer, computer interface [2] |
For pesticide detection, biosensors often exploit specific mechanisms, most notably enzyme inhibition. Enzymes like acetylcholinesterase (AChE) are strongly inhibited by organophosphorus (OP) and carbamate pesticides. The degree of inhibition is proportional to the pesticide concentration, allowing for quantitative detection [5]. Alternative strategies involve direct binding using immunochemical reactions with antibodies or specific oligonucleotide sequences (aptamers) [2].
Diagram 1: Enzyme inhibition biosensor principle. The core mechanism of an enzyme inhibition-based biosensor. The target pesticide molecule inhibits the enzyme, reducing its catalytic activity and leading to a measurable decrease in signal output.
Current Biosensor Technologies for Pesticide Detection
Recent advancements have led to the development of highly sensitive and specific biosensing platforms. The performance of these technologies varies based on their underlying principle and configuration.
Table 2: Analytical Performance of Major Biosensor Platforms
| Biosensor Platform | Detection Principle | Typical Detection Limit | Key Advantages |
|---|---|---|---|
| Electrochemical | Measures change in electrical properties (current, potential) due to biorecognition event [3] | pM-nM range [3] | High sensitivity, portability, cost-effectiveness [3] |
| Fluorescence | Quantifies change in fluorescence intensity/quenching upon analyte binding [3] [4] | Nanomolar range (e.g., paraoxon) [4] | High spatial resolution, visual detection potential |
| Colorimetric | Detects color change visible to the eye or via a smartphone [2] | ~0.08 mg/L for malathion [2] | Simplicity, user-friendliness, no complex instrumentation |
| Surface Plasmon Resonance (SPR) | Monitors refractive index change on a sensor surface [3] [6] | Real-time pathogen detection [6] | Label-free, real-time monitoring |
| Surface-Enhanced Raman Scattering (SERS) | Enhances Raman signal of molecules on nanostructured surfaces [3] | High sensitivity for trace analysis [3] | Fingerprint molecular identification |
The integration of nanomaterials has been a key driver in enhancing biosensor performance. Materials such as metal-organic frameworks (MOFs), quantum dots, and gold nanoparticles provide high surface areas for enzyme immobilization, improve electron transfer in electrochemical sensors, and enhance optical signals [1] [2]. For instance, MOFs can serve as protective "armor" for natural enzymes, boosting their stability, or function as nanozymes themselves, mimicking catalytic activity while offering superior robustness [1].
Detailed Experimental Methodologies
Acetylcholinesterase (AChE) Inhibition-Based Detection
This is a classic and widely adopted protocol for detecting organophosphorus and carbamate pesticides [5].
- Principle: Target pesticides inhibit the activity of AChE, reducing its catalytic hydrolysis of the substrate acetylthiocholine (ATCh). This leads to a decreased production of thiocholine, which is correlated to the pesticide concentration [5] [2].
- Materials:
- Enzyme: Acetylcholinesterase (from electric eel or genetically modified variants).
- Substrate: Acetylthiocholine (ATCh).
- Chromogenic Agent: 5,5′-Dithiobis(2-nitrobenzoic acid) (DTNB), which reacts with thiocholine to produce a yellow-colored product [5].
- Buffer: Phosphate buffer saline (PBS), pH ~7.4.
- Procedure:
- Enzyme Inhibition: Incubate a standard amount of AChE with the sample containing the target pesticide for a fixed time (e.g., 10-15 minutes).
- Substrate Addition: Add ATCh and DTNB to the mixture.
- Signal Measurement: The active AChE hydrolyzes ATCh to thiocholine, which reacts with DTNB to form 2-nitro-5-thiobenzoate (TNB⁻), a yellow anion. The intensity of the color is measured spectrophotometrically at 412 nm.
- Quantification: The absorbance is compared to a control without pesticide. The percentage of enzyme inhibition is calculated as
(1 - A_sample/A_control) × 100%and correlated to pesticide concentration via a calibration curve.
Fluorescence-Based Biosensor using Thermostable Esterase
This method, reported for sensitive organophosphate detection, uses fluorescence quenching [4].
- Principle: A thermostable esterase (EST2) is labeled with a fluorescent probe. Upon binding to specific organophosphate pesticides (e.g., paraoxon), a change in the local environment of the probe causes fluorescence quenching, which is quantitatively measured.
- Materials:
- Biological Receptor: Double mutant of thermostable esterase-2 (EST2).
- Fluorescent Probe: A suitable fluorophore.
- Buffer: Optimal pH buffer for EST2 activity.
- Procedure:
- Labeling: The EST2 enzyme is covalently labeled with the fluorescent probe.
- Incubation: The labeled enzyme is incubated with the sample containing the pesticide.
- Measurement: Fluorescence intensity is measured (excitation/emission at specific wavelengths). A decrease in fluorescence (quenching) indicates the presence of the pesticide.
- Analysis: The degree of quenching is proportional to the pesticide concentration, allowing for detection in the nanomolar range, even in complex food matrices like fruits and juices [4].
Diagram 2: Enzyme inhibition assay workflow. A generalized flowchart for a standard enzyme inhibition assay, illustrating the key steps from sample preparation to data analysis.
The Scientist's Toolkit: Essential Research Reagents
The development and operation of advanced biosensors rely on a suite of specialized reagents and materials.
Table 3: Key Research Reagents and Their Functions in Biosensor Development
| Research Reagent / Material | Function in Biosensor Development |
|---|---|
| Acetylcholinesterase (AChE) | Biorecognition Element: The primary biological component in inhibition-based sensors for neurotoxic insecticides [5]. |
| Aptamers | Biorecognition Element: Synthetic single-stranded DNA/RNA molecules that bind targets with high specificity; offer advantages in stability and production over antibodies [2]. |
| Metal-Organic Frameworks (MOFs) | Nanomaterial Support/ Nanozyme: Porous crystals used to immobilize and stabilize enzymes, or act as enzyme mimics (nanozymes) with high catalytic activity [1]. |
| Gold Nanoparticles (AuNPs) | Signal Amplification/Tranducer: Used for colorimetric detection or to enhance electrochemical signals due to their excellent conductivity and optical properties [3]. |
| Quantum Dots (QDs) | Fluorescent Probe: Semiconductor nanocrystals used as fluorescent labels in optical sensors due to their bright and stable fluorescence [2]. |
| 3,3',5,5'-Tetramethylbenzidine (TMB) | Enzyme Substrate: A chromogenic substrate that produces a blue color when oxidized by peroxidase-like enzymes (e.g., nanozymes), used in colorimetric assays [2]. |
The field of biosensors is rapidly evolving toward multiplexing (detecting multiple analytes simultaneously), intelligent microdevices, and deeper integration with artificial intelligence (AI) for data processing [3] [6]. The incorporation of CRISPR/Cas technology has already demonstrated breakthroughs in sensitivity and specificity for nucleic acid detection, and its principles are being expanded to other domains [7]. Furthermore, the rise of wearable and implantable biosensors points toward a future of continuous, real-time monitoring of environmental contaminants [7]. However, challenges remain in standardizing these devices for commercial use, ensuring their robustness in diverse and complex food matrices, and reducing costs for widespread adoption [7] [8].
In conclusion, the global challenge of balancing population-driven food production with safety necessitates a paradigm shift in monitoring technologies. Biosensors, with their exceptional sensitivity, rapid response, and potential for portability, are poised to revolutionize pesticide residue analysis. By providing advanced technical support for on-site monitoring and source management across the entire "farm-to-fork" supply chain, biosensors offer a powerful tool to safeguard public health and ensure the sustainable development of the global food industry.
A biosensor is an analytical device that converts a biological response into a quantifiable electrical or optical signal [2]. It integrates a biological recognition element with a physicochemical transducer to detect a specific analyte [9]. In the context of pesticide detection, biosensors have emerged as a viable alternative to conventional techniques like gas chromatography (GC) and mass spectrometry, addressing the need for swift on-site analysis with their exceptional sensitivity, rapid response, and ease of operation [3] [10]. This guide details the core architecture, functioning, and experimental protocols of biosensors, providing a technical foundation for research and development professionals.
Core Components of a Biosensor
Every biosensor comprises three fundamental components that work in concert to achieve detection.
Biorecognition Element
This is the biological part of the sensor that provides specificity by interacting selectively with the target analyte. Common types used in pesticide detection include:
- Enzymes: Proteins that catalyze biochemical reactions. Biosensors for organophosphorus and carbamate pesticides often use enzymes like acetylcholinesterase (AChE) or butyrylcholinesterase (BChE), whose activity is inhibited by these pesticides [2] [11].
- Antibodies: Immunoglobulins with high binding affinity for specific antigens. Antibody-based biosensors (immunosensors) can be designed to detect a wide array of pesticide molecules [10] [9].
- Nucleic Acid Aptamers: Synthetic single-stranded DNA or RNA oligonucleotides selected for their high affinity to specific targets, such as pesticides or proteins related to pesticide exposure [2] [9].
- Whole Cells: Microbial cells, such as bacteria or fungi, that function as integrated sensing systems. They can be engineered for specific responses to environmental pollutants, including pesticides [9].
- Molecularly Imprinted Polymers (MIPs): Synthetic polymers with tailor-made recognition sites that mimic biological receptors, offering high stability for detecting pesticide residues [10] [2].
Transducer
The transducer converts the biological interaction between the biorecognition element and the analyte into a measurable signal. The principal types are:
- Electrochemical Transducers: Measure electrical changes (current, potential, impedance) resulting from the biochemical reaction. They are prominent in pesticide detection due to their simplicity, low cost, and potential for portability [10] [11].
- Optical Transducers: Measure changes in light properties, such as fluorescence [3] [2], colorimetry [3] [10], or Surface Plasmon Resonance (SPR) [3].
- Other Transducers: Include piezoelectric (measuring mass changes) and thermal transducers (measuring heat changes) [10].
Signal Processing System
This electronic component amplifies, processes, and displays the signal from the transducer in a user-interpretable format, often quantitative [2].
Table 1: Core Components of a Biosensor
| Component | Function | Common Examples in Pesticide Detection |
|---|---|---|
| Biorecognition Element | Provides specificity by binding the target analyte | Acetylcholinesterase (AChE), antibodies, aptamers, whole cells, Molecularly Imprinted Polymers (MIPs) |
| Transducer | Converts the biological event into a measurable signal | Electrode (electrochemical), photodetector (optical), piezoelectric crystal |
| Signal Processor | Amplifies and displays the output signal | Potentiostat, smartphone detector, digital display |
Working Mechanisms and Signaling Pathways
The operational principle of a biosensor hinges on the specific interaction between the bioreceptor and the target pesticide, which modulates a biochemical or physical signal captured by the transducer.
Enzyme Inhibition Mechanism
This is a prevalent mechanism for detecting organophosphorus (OP) and carbamate pesticides. The enzyme acetylcholinesterase (AChE) normally catalyzes the hydrolysis of its substrate, acetylthiocholine (ATCh), producing thiocholine and acetic acid. In the presence of OP pesticides, AChE is inhibited, reducing the production of thiocholine. This reduction is measured electrochemically or optically [2] [11]. The following diagram illustrates the signaling logic for this inhibition-based detection.
Affinity-Based Detection
This mechanism relies on the specific binding of a pesticide to a bioreceptor without causing inhibition.
- Immunosensors: Rely on the binding of a pesticide (antigen) to its specific antibody, which can directly cause a measurable change in mass or refractive index (label-free) or be measured using a secondary antibody tagged with an enzyme or fluorescent marker (labeled) [9].
- Aptasensors: Aptamers undergo a conformational change upon binding their target pesticide, which can be transduced into an optical or electrochemical signal [9].
Experimental Protocols for Key Biosensor Types
Protocol: Paper Strip Biosensor for Multi-Pesticide Screening
This protocol is adapted from a study detecting pesticides in animal feed, milk, and soil [12].
1. Bioreceptor Preparation:
- Microbial Culture: Revive Bacillus megaterium (MTCC 2949) in nutrient broth at 37°C for 24 hours.
- Spore Production: Inoculate the revived culture into a sporulation medium and incubate at 37°C for 42 hours.
- Spore Harvesting: Centrifuge the culture at 10,000 rpm for 10 minutes at 10°C. Wash the pellet containing spores twice with potassium phosphate buffer (pH 6.8, 10 mM) and resuspend in the same buffer.
2. Sample Preparation:
- Extract samples (e.g., feed, soil) using appropriate organic solvents.
- Add PSA (Primary Secondary Amine) and MgSO4 at a 1:2 ratio to remove pigments and other interferences that could affect the color development on the strip.
3. Assay Execution:
- Apply the processed sample to the paper strip functionalized with bacterial spores and a chromogenic substrate.
- The presence of pesticides inhibits specific marker enzymes from the spores.
- Observe the color change: a reduction in color intensity indicates pesticide presence.
4. Detection and Analysis:
- The assay is semi-quantitative. The developed technology can detect various pesticides (e.g., organochlorine, organophosphate, carbamate) at limits of detection (LOD) ranging from 1 to 500 μg/L, suitable for screening under field conditions [12].
Protocol: Electrochemical On-Glove Biosensor for Fruit Peel Analysis
This protocol describes a wearable biosensor for direct detection of organophosphorus pesticides on fruit surfaces [11].
1. Biosensor Fabrication:
- Electrode Modification: Engineer a screen-printed electrode on a glove finger by modifying it with a bio-hybrid probe. The probe consists of:
- Prussian blue and Carbon black (electron mediators to enhance electrochemical signal).
- Butyrylcholinesterase (BChE) enzyme (the biorecognition element).
2. Sample Collection and Analysis:
- Direct Sampling: The end-user simply scrubs the surface of the fruit (e.g., apple, orange) with the sensor strip on the glove finger.
- Electrochemical Reading: Perform an electrochemical measurement on the glove-integrated system. The principle is based on the inhibition of BChE by the pesticide (dichlorvos).
3. Signal Measurement:
- The degree of enzyme inhibition correlates with the reduction in electrochemical signal (e.g., current), which is quantified.
- The system achieved a detection limit for dichlorvos in the nanomolar range (high ppt), which is lower than the maximum residue limits established by the EU, with a repeatability of less than 10% [11].
Table 2: Key Research Reagent Solutions
| Reagent/Material | Function in the Experiment | Example Application |
|---|---|---|
| Acetylcholinesterase (AChE) / Butyrylcholinesterase (BChE) | Biorecognition element; its inhibition is measured to detect pesticides. | Detection of organophosphorus and carbamate pesticides [2] [11]. |
| Bacterial Spores (e.g., B. megaterium) | Source of marker enzymes that are inhibited by pesticides; used as a robust bioreceptor. | Broad-spectrum pesticide detection in paper strip sensors [12]. |
| Aptamers | Synthetic nucleic acid bioreceptors with high affinity for specific targets. | Detection of various pesticides via optical or electrochemical aptasensors [9]. |
| Prussian Blue & Carbon Black | Redox mediators that enhance electron transfer in electrochemical sensors. | Signal amplification in on-glove electrochemical biosensors [11]. |
| Primary Secondary Amine (PSA) | Clean-up sorbent; removes pigments and fatty acids from samples during extraction. | Reducing matrix interference in analysis of complex samples like feed [12]. |
| Chromogenic Substrate (e.g., o-dianisidine) | Changes color upon enzymatic action; allows for visual or colorimetric detection. | Color development in paper-based optical sensors [2]. |
Biosensors represent a powerful convergence of biology and transducer technology, defined by their core components: a biorecognition element, a transducer, and a signal processor. Their working mechanisms, particularly enzyme inhibition and affinity-based binding, provide the specificity and sensitivity required for modern pesticide detection. The experimental protocols for paper strip and on-glove biosensors highlight the trend towards portability, rapid analysis, and user-friendly application in field settings. As research progresses, the integration of advanced nanomaterials, microfluidic systems, and artificial intelligence is poised to further enhance the capabilities and application scope of biosensors in ensuring agricultural and environmental safety [3] [10].
Biosensors are analytical devices that combine a biological recognition element with a physicochemical detector to measure the presence or concentration of a target analyte [13]. The biorecognition element is the cornerstone of a biosensor, responsible for the specific and selective interaction with the target molecule. In the context of pesticide detection, which is crucial for environmental protection and food safety, these elements enable the identification of trace amounts of hazardous substances [14] [15]. The integration of biological sensing elements with transducers has led to the development of highly sensitive and selective biosensors that provide rapid, real-time, and often portable means of analysis, addressing the limitations of conventional methods like gas chromatography-mass spectrometry (GC-MS) and high-performance liquid chromatography (HPLC) [14] [3].
The performance of a biosensor is fundamentally governed by the properties of its biorecognition element. Key parameters include sensitivity (the ability to detect low analyte concentrations), specificity (the ability to distinguish the target from interfering substances), affinity (the strength of binding), and stability under operational conditions [13]. This guide provides an in-depth technical examination of the four primary classes of biorecognition elements—enzymes, antibodies, aptamers, and whole cells—framed within the specific application of pesticide detection research.
Enzymes
Enzymes are biocatalysts that accelerate specific biochemical reactions. In biosensors, their catalytic activity is harnessed for the detection of target analytes, which may be the enzyme's substrate, an inhibitor, or a co-factor.
Mechanism of Action and Key Characteristics
Enzyme-based biosensors typically operate on one of two principles. The first is substrate detection, where the enzymatic reaction with the target analyte produces a measurable product (e.g., a change in pH, electron transfer, or light emission). The second, more common for pesticides, is inhibition-based detection. Many pesticides, such as organophosphates (OPs) and carbamates, are potent acetylcholinesterase (AChE) inhibitors [14]. The mechanism involves the pesticide binding to the active site of AChE, inhibiting its function in hydrolyzing the neurotransmitter acetylcholine. The degree of inhibition is proportional to the pesticide concentration, which can be measured electrochemically or optically [14].
A key advantage of enzymes is their catalytic nature, which provides signal amplification as a single enzyme molecule can turn over many substrate molecules, enhancing sensitivity. However, a significant limitation is their susceptibility to environmental factors such as pH, temperature, and ionic strength, which can denature the protein and lead to irreversible loss of activity, thereby reducing sensor shelf-life [14] [13].
Experimental Protocol for an Acetylcholinesterase Inhibition Assay
This protocol is commonly used for detecting organophosphorus and carbamate pesticides [14].
- Step 1: Sensor Preparation. Immobilize acetylcholinesterase (AChE) enzyme onto a transducer surface (e.g., a screen-printed carbon electrode). Common immobilization methods include cross-linking with glutaraldehyde, entrapment within a polymer matrix like Nafion, or covalent binding to a functionalized surface.
- Step 2: Baseline Measurement. Incubate the sensor with a standard solution of the enzyme's substrate, acetylthiocholine. Measure the initial rate of enzymatic reaction by detecting the product, thiocholine, typically via its electrochemical oxidation current.
- Step 3: Inhibition (Sample Exposure). Incubate the sensor with the sample solution containing the target pesticide for a fixed period (e.g., 10-15 minutes). During this time, the pesticide inhibitor binds to the active site of AChE, reducing its activity.
- Step 4: Residual Activity Measurement. Re-introduce the substrate solution and measure the rate of the enzymatic reaction again. The signal will be lower than the baseline due to enzyme inhibition.
- Step 5: Quantification. The percentage of enzyme inhibition is calculated as
(1 - I/I₀) × 100%, where I₀ and I are the currents before and after inhibition, respectively. The pesticide concentration is determined by interpolating the inhibition percentage against a pre-established calibration curve.
Diagram 1: Acetylcholinesterase inhibition assay workflow for pesticide detection.
Antibodies
Antibodies, or immunoglobulins, are Y-shaped proteins produced by the immune system that bind to a unique molecular structure, known as an antigen, with high specificity.
Mechanism of Action and Key Characteristics
Antibody-based biosensors, known as immunosensors, rely on the specific antigen-antibody binding event. The antibody serves as the capture probe, and its binding to the target pesticide (or a pesticide derivative) generates a signal. This signal transduction can be achieved through various methods, including label-free techniques like Surface Plasmon Resonance (SPR) or by using enzyme-linked labels (e.g., in an ELISA-style format) that produce an optical or electrochemical signal upon binding [13] [16].
The primary strength of antibodies is their exceptional specificity and high binding affinity, which minimizes cross-reactivity and allows for precise target identification. They are well-established in clinical diagnostics. However, their production is a significant drawback, as it requires animal hosts, making it a time-consuming and costly process [17]. Furthermore, antibodies are large proteins sensitive to their environment; denaturation is often irreversible, leading to limited shelf-life and stability, particularly under harsh conditions [17] [13].
Experimental Protocol for a Competitive Immunoassay
This is a common format for detecting small molecules like pesticides, which may not be large enough to bridge two antibodies simultaneously.
- Step 1: Surface Functionalization. Immobilize a pesticide-protein conjugate or a capture antibody onto the sensor surface (e.g., a gold chip for SPR or an electrode).
- Step 2: Incubation with Sample and Label. Mix the sample with a known concentration of a labeled (e.g., with an enzyme or nanoparticle) pesticide or antibody. This mixture is then introduced to the functionalized sensor surface. The target pesticide in the sample and the labeled analyte compete for a limited number of binding sites on the capture probe.
- Step 3: Washing. Remove unbound molecules by washing with a buffer solution to reduce non-specific binding and background signal.
- Step 4: Signal Detection. Measure the signal generated from the bound label. In a competitive assay, a higher concentration of the target pesticide in the sample will result in less labeled analyte binding, leading to a lower final signal.
- Step 5: Data Analysis. The signal is inversely proportional to the pesticide concentration in the sample. A calibration curve is generated using standards of known concentration to quantify the target.
Aptamers
Aptamers are short, single-stranded DNA or RNA oligonucleotides that are engineered in vitro to bind to a specific target molecule with high affinity.
Mechanism of Action and Key Characteristics
Aptamers are identified through an in vitro process called Systematic Evolution of Ligands by Exponential Enrichment (SELEX) [17] [18]. Through iterative rounds of selection and amplification, aptamers that bind tightly to a target pesticide are enriched from a vast random sequence library. In a biosensor (an aptasensor), the aptamer undergoes a conformational change upon binding the target. This structural shift can be directly measured if it alters the aptamer's distance from a transducer surface, or it can be linked to a signal-generating probe [17] [19].
Aptamers offer several distinct advantages over antibodies. They are produced by chemical synthesis, leading to low batch-to-batch variation and lower production costs. They are also highly stable under a wide range of temperatures and pH conditions, and their denaturation is often reversible [17]. Furthermore, they can be easily chemically modified to enhance stability or for immobilization. A key limitation is that RNA aptamers are susceptible to nuclease degradation in biological fluids, though this can be mitigated using modified nucleotides [17].
Experimental Protocol for a SELEX Procedure
The SELEX process is used to develop novel aptamers for specific targets, such as a new pesticide.
- Step 1: Library Preparation. Synthesize a large single-stranded DNA (ssDNA) or RNA library containing a central random sequence region (e.g., 30-50 nucleotides) flanked by constant primer regions for PCR amplification.
- Step 2: Incubation and Binding. Incubate the oligonucleotide library with the immobilized target pesticide.
- Step 3: Partitioning. Wash away unbound and weakly bound sequences. The tightly bound sequences are then eluted.
- Step 4: Amplification. The eluted sequences are amplified by PCR (for DNA) or reverse transcription-PCR (for RNA) to create an enriched pool for the next selection round.
- Step 5: Iteration. Repeat steps 2-4 for multiple rounds (typically 8-15) under increasingly stringent conditions (e.g., higher wash volumes, shorter incubation times, or the addition of counter-targets) to select for the highest-affinity binders.
- Step 6: Cloning and Sequencing. After the final round, the enriched pool is cloned, sequenced, and the individual aptamer candidates are characterized for their binding affinity and specificity.
Diagram 2: SELEX workflow for aptamer development against a pesticide target.
Whole Cells
Whole-cell biosensors utilize living microorganisms (e.g., bacteria, yeast, or microalgae) as the biorecognition element. The cells respond to the presence of a target analyte through their inherent metabolic or genetic pathways.
Mechanism of Action and Key Characteristics
Whole-cell biosensors can be designed to be either constitutive or inducible [15]. In an inducible system, the exposure to a specific pesticide or class of pesticides triggers a cellular response. This is often achieved by using genetically engineered cells where a promoter sequence, activated by the pesticide or its metabolic byproduct, is linked to a reporter gene (e.g., for green fluorescent protein (GFP), luciferase, or β-galactosidase). The presence of the pesticide induces the expression of the reporter protein, generating a measurable signal.
The primary advantage of whole-cell biosensors is their ability to report on the bioavailability and overall toxicity of a sample, rather than just the concentration of a single compound. They can detect a class of pollutants simultaneously. However, they have a slower response time compared to molecular biosensors due to the time required for gene expression and protein synthesis. They also require strict control of growth conditions (nutrients, temperature, pH) to maintain cell viability, which complicates their use in the field [15].
Experimental Protocol for a Genetically Engineered Whole-Cell Biosensor
This protocol describes the use of a bacterial cell engineered to express a reporter protein in response to pesticide stress.
- Step 1: Cell Culture and Preparation. Grow the engineered bacterial strain (e.g., E. coli) to the mid-logarithmic phase in an appropriate culture medium under sterile conditions.
- Step 2: Sample Exposure. Harvest the cells and expose them to the environmental water sample or a solution containing the target pesticide. A negative control (no pesticide) and positive control (known pesticide concentration) must be run in parallel.
- Step 3: Incubation. Incubate the cell-sample mixture for a predetermined period (e.g., 1-2 hours) to allow for the induction of the genetic circuit and the expression of the reporter protein.
- Step 4: Signal Measurement. Measure the signal from the reporter. For luminescent reporters like luciferase, add the substrate and measure light emission with a luminometer. For fluorescent reporters like GFP, measure the fluorescence intensity at specific excitation/emission wavelengths.
- Step 5: Data Interpretation. The magnitude of the signal is correlated with the level of pesticide-induced stress. The signal from the sample is compared to the calibration curve generated from the positive controls to estimate the pesticide's toxic equivalent concentration.
Comparative Analysis of Biorecognition Elements
The choice of biorecognition element depends on the specific requirements of the application, such as the need for portability, sensitivity, specificity, or robustness. The tables below summarize the key properties and performance metrics of the four elements in the context of pesticide detection.
Table 1: Characteristic Comparison of Biorecognition Elements
| Property | Enzymes | Antibodies | Aptamers | Whole Cells |
|---|---|---|---|---|
| Molecular Nature | Protein (Catalyst) | Protein (Binding) | Nucleic Acid (DNA/RNA) | Living Microorganism |
| Production | Isolation/Recombinant | Animal Hosts | Chemical Synthesis (SELEX) | Cell Culture |
| Specificity | Moderate | Very High | Very High | Low to Moderate (Class-specific) |
| Stability | Low (Irreversible denaturation) | Moderate (Irreversible denaturation) | High (Reversible denaturation) | Low (Require viable conditions) |
| Modification | Difficult | Moderate | Easy (Chemical synthesis) | Genetic Engineering |
| Key Advantage | Catalytic Signal Amplification | Well-established, High Specificity | Stability, Cost, Design Flexibility | Reports on Bioavailability & Toxicity |
| Key Limitation | Susceptible to Inhibitors | Cost, Production Time, Stability | Susceptibility to Nucleases (RNA) | Slow Response, Complex Maintenance |
Table 2: Performance Metrics in Pesticide Detection
| Biorecognition Element | Example Target | Detection Mechanism | Reported Detection Limit | Reference |
|---|---|---|---|---|
| Enzyme (AChE) | Organophosphates, Carbamates | Electrochemical Inhibition | Varies by specific sensor | [14] |
| Antibody | Chlorpyrifos | Fluorescence Immunoassay | Varies by specific sensor | [15] |
| Aptamer | Chlorpyrifos | Fluorescence Resonance Energy Transfer (FRET) | 0.051 ng/mL | [19] |
| Whole Cell | General Toxicity | Luminescence Induction | Varies by specific sensor and test organism | [15] |
The Scientist's Toolkit: Essential Research Reagents and Materials
The development and application of biosensors for pesticide detection rely on a suite of specialized reagents and materials.
Table 3: Key Research Reagent Solutions for Biosensor Development
| Reagent / Material | Function | Example Use Case |
|---|---|---|
| Acetylcholinesterase (AChE) | Biorecognition element for inhibition-based detection of OPs and carbamates. | Electrochemical biosensor for organophosphate pesticides [14]. |
| Nucleic Acid Aptamer | Synthetic biorecognition element selected for a specific pesticide. | Fluorescence aptasensor for chlorpyrifos detection [19]. |
| Gold Nanoparticles (AuNPs) | Signal amplification; Quencher in FRET assays; Platform for immobilization. | Used as a quencher in a FRET-based aptasensor [19]. |
| SELEX Kit | Contains reagents and protocols for the systematic evolution of ligands by exponential enrichment. | In vitro selection of a novel DNA aptamer against a pesticide target [17]. |
| Nafion Polymer | Cation-exchange polymer used for enzyme immobilization on electrode surfaces. | Entrapment of AChE on an electrode for enhanced stability [14]. |
| Surface Plasmon Resonance (SPR) Chip | Gold-coated glass chip for label-free, real-time monitoring of biomolecular interactions. | Characterization of antibody-pesticide binding kinetics [13] [16]. |
Biosensors are analytical devices that combine a biological recognition element with a physicochemical transducer to detect target analytes. In the critical field of pesticide detection, biosensors provide a powerful alternative to conventional chromatographic methods, offering the potential for rapid, cost-effective, and on-site monitoring of harmful residues ( [15] [5] [10]). The core of any biosensor is its signal transduction platform, which converts the specific biological recognition event into a quantifiable electrical or optical signal. The choice of transduction method—electrochemical, optical, or piezoelectric—profoundly influences the sensor's sensitivity, selectivity, portability, and practical applicability. This whitepaper provides an in-depth technical guide to these three principal signal transduction platforms, detailing their fundamental principles, experimental protocols, and performance in the context of pesticide detection research. The ongoing development of these biosensing technologies is essential for safeguarding environmental and public health against pesticide contamination ( [15] [20]).
Electrochemical Biosensors
Working Principle
Electrochemical biosensors detect pesticides by measuring electrical signals—such as current, potential, or impedance—that arise from a biochemical reaction or binding event at the surface of an electrode ( [10]). The biological recognition element, often an enzyme like acetylcholinesterase (AChE), is immobilized on the electrode. Upon exposure to a sample, several mechanisms can generate a signal:
- Inhibition-Based Detection: For neurotoxic organophosphates (OPs) and carbamates (CBs), the operational principle is often the inhibition of AChE. The enzyme's normal activity converts its substrate, acetylcholine, into products that can be electrochemically detected (e.g., thiocholine, which oxidizes at a certain potential). When the enzyme is inhibited by a pesticide, this catalytic activity decreases, leading to a reduction in the electrochemical signal that is proportional to the pesticide concentration ( [5]).
- Affinity-Based Detection: Other biosensors rely on the direct binding of a pesticide to a recognition element (e.g., an antibody, aptamer, or whole cell), which alters the interfacial properties of the electrode. This change can be measured as a shift in potential (potentiometric), a change in the current at a fixed potential (amperometric), or a modification of the electrical impedance at the electrode surface (impedimetric) ( [10]).
Experimental Protocol: Enzyme-Inhibition Based Amperometric Sensor
Objective: To detect organophosphorus and carbamate pesticides via inhibition of acetylcholinesterase.
Materials and Reagents:
- Acetylcholinesterase (AChE): Enzyme from electric eel or genetically engineered variants from Drosophila melanogaster for tailored sensitivity ( [5]).
- Acetylthiocholine (ATCh): Enzyme substrate.
- 5,5'-dithiobis(2-nitrobenzoic) acid (DTNB): Chromogenic reagent for Ellman's assay, used in spectrophotometric calibration.
- Working Electrode: Often glassy carbon or gold electrode, modified with nanomaterials (e.g., graphene oxide, carbon nanotubes) to enhance surface area and electron transfer ( [10]).
- Pesticide Standards: Analytical grade paraoxon, carbofuran, etc.
Procedure:
- Electrode Modification: Prepare a suspension of the nanomaterial (e.g., graphene oxide) and deposit a fixed volume onto the polished surface of the working electrode. Allow to dry.
- Enzyme Immobilization: Immobilize AChE onto the modified electrode surface. This can be achieved via drop-casting, followed by cross-linking with glutaraldehyde, or through layer-by-layer assembly.
- Baseline Activity Measurement:
- Place the modified electrode in an electrochemical cell containing a suitable buffer (e.g., 0.1 M phosphate buffer, pH 7.4) and the substrate acetylthiocholine.
- Apply a fixed potential (e.g., +0.5 V vs. Ag/AgCl) and record the steady-state oxidation current of the enzymatic product (thiocholine). This is the initial current, ( I_0 ).
- Inhibition Step: Incubate the biosensor in the sample solution containing the target pesticide for a fixed period (e.g., 10-15 minutes).
- Inhibited Activity Measurement: Rinse the electrode and measure the electrochemical current again under identical conditions as in step 3. This is the inhibited current, ( I_i ).
- Data Analysis: Calculate the percentage of enzyme inhibition using the formula: [ \%\text{Inhibition} = \frac{(I0 - Ii)}{I_0} \times 100 ] The inhibition percentage is then correlated with pesticide concentration using a calibration curve prepared with standard solutions.
Table 1: Performance of Selected Electrochemical Biosensors for Pesticide Detection
| Recognition Element | Transducer | Target Pesticide(s) | Linear Range | Limit of Detection (LOD) | Reference |
|---|---|---|---|---|---|
| Acetylcholinesterase (AChE) | Amperometric | Paraoxon, Carbofuran | 0–20 μg L⁻¹ | 0.9 μg L⁻¹ (Paraoxon) | [5] |
| Genetically engineered AChE variants | Amperometric | Paraoxon, Dichlorvos | 0–5 μg L⁻¹ | 0.4 μg L⁻¹ (Paraoxon) | [5] |
| Antibodies (Immunosensor) | Electrochemical | Various | Varies by design | ~nM to pM | [10] |
| Aptamers (Aptasensor) | Electrochemical | Various | Varies by design | ~nM to pM | [10] |
Research Reagent Solutions
- AChE Enzymes: Wild-type and mutant forms (e.g., from Drosophila melanogaster) for tuning sensitivity and selectivity in inhibitor mixtures ( [5]).
- Nanomaterial Modifiers: Graphene oxide (GO), carbon nanotubes, and metal nanoparticles to enhance electrode conductivity and enzyme loading ( [10]).
- Cross-linking Agents: Glutaraldehyde and BS³ for stable enzyme immobilization on electrode surfaces.
Optical Biosensors
Working Principle
Optical biosensors transduce the binding or inhibition event into a measurable change in light properties. These changes can include intensity, wavelength, polarization, or phase ( [10]). Several modalities are prominent in pesticide detection:
- Fluorescence: Measures the change in fluorescence intensity, anisotropy, or lifetime. This can be based on the intrinsic fluorescence of a recognition element, fluorescence resonance energy transfer (FRET), or the use of fluorescently labeled molecules ( [10]).
- Colorimetry: Involves a visual or spectrophotometric color change, often using enzyme-catalyzed reactions (e.g., with horseradish peroxidase) or aggregation of metal nanoparticles like gold ( [3] [10]).
- Surface Plasmon Resonance (SPR): Detects changes in the refractive index on a thin metal (typically gold) surface, allowing for real-time, label-free monitoring of binding interactions (e.g., between an antibody and a pesticide) ( [3] [10]).
Experimental Protocol: Whole-Cell Colorimetric Biosensor for Chlorpyrifos
Objective: To visually detect chlorpyrifos (CPF) and its toxic metabolite, TCP, using an engineered bacterial cell system.
Materials and Reagents:
- Biosensor Strain: E. coli cells engineered to harbor the ChpR transcriptional regulator and the pigment-producing vioABCE gene cluster on a plasmid (e.g., pET-21a backbone) ( [20]).
- LB Growth Medium: For cell culture.
- CPF and TCP Standards: Analytical grade.
- Induction Agent: Isopropyl β-d-1-thiogalactopyranoside (IPTG) to induce the biosensing system.
- Spectrophotometer or Plate Reader: For quantitative colorimetric measurement.
Procedure:
- Cell Culture and Induction: Inoculate the engineered biosensor strain into LB medium with appropriate antibiotics. Grow to mid-log phase and induce with a predetermined optimal concentration of IPTG.
- Sample Exposure: Aliquot the induced cells into multi-well plates. Add a series of concentrations of CPF or TCP to the test wells. Use a negative control (no pesticide) and a positive control if available.
- Incubation and Color Development: Incubate the plate with shaking at a specified temperature (e.g., 30°C or 37°C) for several hours to allow for color development. The presence of CPF/TCP triggers the ChpR regulator, which activates the vioABCE operon, leading to the production of a violet pigment.
- Signal Acquisition:
- Visual Inspection: Observe the wells for a visible color change from colorless/pale to violet. This provides a qualitative yes/no result.
- Quantitative Measurement: Measure the absorbance of the solution at a specific wavelength (e.g., 550-580 nm for the violet pigment) using a plate reader.
- Data Analysis: Plot the absorbance against the logarithm of the pesticide concentration to generate a calibration curve. The limit of detection (LOD) and linear range can be determined from this curve. The reported LOD for this system is 0.8 μM for CPF and 7.813 nM for TCP ( [20]).
Table 2: Performance of Selected Optical Biosensors for Pesticide Detection
| Recognition Element | Transducer | Target Pesticide(s) | Linear Range | Limit of Detection (LOD) | Reference |
|---|---|---|---|---|---|
| Engineered E. coli (ChpR/vioABCE) | Colorimetric | Chlorpyrifos (CPF) | 1.6–12.5 μM | 0.8 μM | [20] |
| Engineered E. coli (ChpR/vioABCE) | Colorimetric | TCP (metabolite) | 15.6–125 nM | 7.813 nM | [20] |
| Antibodies | SPR | Various | Varies by design | ~nM to pM | [3] [10] |
| Enzymes (e.g., HRP) | Fluorescence | Various | Varies by design | ~nM to pM | [10] |
Figure 1: Workflow of a whole-cell colorimetric biosensor for detecting chlorpyrifos.
Research Reagent Solutions
- ChpR/vioABCE Plasmid System: Genetic construct for building whole-cell biosensors specific to chlorpyrifos and TCP ( [20]).
- Fluorescent Dyes/Tags: Such as green fluorescent protein (GFP) variants for constructing fluorescence-based reporter systems.
- Gold Nanoparticles: For colorimetric sensors, where analyte-induced aggregation causes a visible color shift from red to blue ( [3] [10]).
Piezoelectric Biosensors
Working Principle
Piezoelectric biosensors are mass-sensitive devices based on quartz crystal microbalance (QCM) technology. The core component is a quartz crystal disc sandwiched between two metal electrodes. An alternating voltage applied across the electrodes induces a shear deformation of the crystal at its resonant frequency. The fundamental principle, described by the Sauerbrey equation, states that the resonant frequency decreases linearly with an increase in mass adsorbed on the crystal surface ( [21]). The equation is: [ \Delta f = -\frac{2f0^2 \Delta m}{A \sqrt{\rhoq \muq}} = -C \Delta m ] where ( \Delta f ) is the frequency change, ( f0 ) is the fundamental resonant frequency, ( \Delta m ) is the mass change, ( A ) is the active area, and ( \rhoq ) and ( \muq ) are the density and shear modulus of quartz, respectively. ( C ) is a constant for the specific crystal ( [21]). In liquid environments, the frequency is also affected by the viscosity and density of the liquid, requiring more complex analysis, sometimes including the dissipation factor (D) to account for viscoelastic effects (QCM-D) ( [21]).
Experimental Protocol: QCM Immunosensor for Pesticide Detection
Objective: To detect a specific pesticide (e.g., carbaryl) using an antibody-based QCM immunosensor.
Materials and Reagents:
- PZ Crystals: AT-cut quartz crystals with gold electrodes (e.g., 10 MHz fundamental frequency).
- Oscillator Circuit: To drive the crystal and monitor frequency changes (e.g., based on a 74LS320 integrated circuit) ( [21]).
- Frequency Counter: A high-resolution (≥1 Hz) device connected to a computer for data acquisition.
- Anti-pesticide Antibody: Specific to the target analyte.
- Cross-linkers: Such as carbodiimide hydrochloride (EDC) and N-hydroxysuccinimide (NHS) for antibody immobilization.
- Flow Cell: To facilitate controlled introduction of samples and buffers.
Procedure:
- Crystal Functionalization: Clean the gold electrode surface of the PZ crystal. Immobilize a self-assembled monolayer (SAM) of a linker molecule (e.g., 11-mercaptoundecanoic acid) onto the gold surface to provide functional groups for antibody attachment.
- Antibody Immobilization: Activate the carboxyl groups on the SAM using a mixture of EDC and NHS. Then, expose the crystal to a solution of the specific antibody, allowing covalent amide bond formation to immobilize the antibodies on the sensor surface.
- Baseline Establishment: Mount the crystal in a flow cell and perfuse with a stable running buffer. Monitor the resonant frequency until a stable baseline (( f_0 )) is achieved.
- Sample Injection: Inject the sample or standard solution containing the target pesticide. The binding of the pesticide to the immobilized antibody increases the mass on the crystal surface, leading to a frequency shift (( \Delta f )).
- Regeneration (Optional): For reusability, inject a regeneration solution (e.g., a low-pH glycine buffer) to dissociate the antibody-pesticide complex, returning the frequency close to its original baseline.
- Data Analysis: The frequency shift is recorded in real-time. The magnitude of ( \Delta f ) is proportional to the mass of bound analyte. A calibration curve of ( \Delta f ) vs. pesticide concentration is used for quantification. Advanced signal analysis, such as phase-shift measurement, can significantly improve the LOD ( [21]).
Table 3: Performance and Characteristics of Piezoelectric Biosensors
| Parameter | Specifications / Performance | Reference |
|---|---|---|
| Mass Sensitivity | ~4.4 ng/cm² per 1 Hz frequency shift for a 10 MHz crystal | [21] |
| Detection Method | Active (oscillator-based) or passive (impedance analysis) | [21] |
| Target Pesticide | Carbaryl (as an example) | [21] |
| LOD (Phase Shift Method) | 0.14 ng/mL (with 100 MHz resonator) | [21] |
| Key Advantage | Label-free, real-time monitoring of binding events | [21] |
Figure 2: Operating principle of a piezoelectric quartz crystal microbalance (QCM) biosensor.
Research Reagent Solutions
- QCM Crystals & Chips: AT-cut quartz crystals with gold electrodes, available in various resonant frequencies (e.g., 5-20 MHz) ( [21]).
- Surface Chemistry Kits: Containing thiol-based linkers (e.g., 11-mercaptoundecanoic acid) and cross-linkers (EDC, NHS) for biomolecule immobilization.
- QCM-D Instruments: Commercial systems (e.g., from QSense/Biolin Scientific) for simultaneous monitoring of frequency (f) and dissipation (D) to characterize soft, viscoelastic layers ( [21]).
Electrochemical, optical, and piezoelectric transduction platforms each offer distinct advantages for pesticide detection. Electrochemical methods, particularly amperometry, are prized for their high sensitivity, portability, and cost-effectiveness, making them ideal for on-site screening ( [5] [10]). Optical biosensors, including colorimetric and fluorescence-based systems, provide versatility, the potential for multiplexing, and, in the case of whole-cell sensors, biologically relevant detection of toxic metabolites ( [20] [10]). Piezoelectric QCM sensors offer the unique benefit of real-time, label-free monitoring of binding kinetics and mass deposition ( [21]). The future of biosensing lies in the integration of these platforms with advanced nanomaterials, microfluidics, and artificial intelligence for data analysis. Furthermore, the development of multi-parameter sensor arrays, using engineered enzymes or different transducer types in combination, will be crucial for discriminating between complex mixtures of pesticides in real-world environments ( [15] [5] [10]).
The Critical Role of Biosensors in Smart Agriculture and Public Health Protection
Biosensors are analytical devices that combine a biological recognition element with a physicochemical transducer to detect specific analytes. In the context of pesticide detection, these systems leverage bioreceptors such as enzymes, antibodies, nucleic acids, and whole cells to identify residue contaminants with high specificity and sensitivity [9]. The global expansion of agricultural and industrial activities has intensified the challenge of controlling pesticide residues, making the development of rapid, accurate, and on-site detection technologies a critical research focus [3] [10]. This whitepaper examines the transformative impact of biosensing technologies in enabling smart agriculture practices and protecting public health from pesticide-related hazards, framing this discussion within the broader thesis of biosensor research for pesticide detection.
Fundamental Principles of Biosensors for Pesticide Detection
Biosensors operate on the principle of converting a biological interaction into a quantifiable signal. The core components include a biorecognition element that specifically interacts with the target pesticide and a transducer that converts this interaction into a measurable output [9]. The analytical performance of these devices is characterized by several key parameters: sensitivity (ability to detect low analyte concentrations), specificity (selectivity for target analytes), dynamic range (span between minimal and maximal detectable signals), response time, and signal-to-noise ratio [22].
The detection mechanisms vary significantly based on the bioreceptor and transducer employed. Enzyme-based biosensors often rely on the inhibition of enzyme activity by pesticides, where the reduction in catalytic activity correlates with pesticide concentration [9]. Immunosensors utilize the specific binding between antibodies and pesticide antigens, generating signals through label-free or labeled approaches [9]. Aptasensors employ synthetic single-stranded DNA or RNA aptamers selected through Systematic Evolution of Ligands by Exponential Enrichment (SELEX) to bind specific targets through various electrostatic and intramolecular mechanisms [9]. Whole cell-based biosensors use microorganisms as integrated sensing elements, leveraging their metabolic activity, stress responses, or genetic regulation mechanisms to detect pesticide presence [9].
Table 1: Fundamental Biosensor Types for Pesticide Detection
| Biosensor Type | Biorecognition Element | Detection Principle | Key Advantages |
|---|---|---|---|
| Enzyme-based | Enzymes (e.g., acetylcholinesterase) | Enzyme inhibition or metabolism of analyte | High specificity, rapid response for specific pesticide classes |
| Antibody-based | Monoclonal or polyclonal antibodies | Antigen-antibody binding | High affinity and specificity, adaptable to various formats |
| Nucleic acid-based | DNA or RNA aptamers | Aptamer-target binding with structural change | Chemical synthesis, stability, programmable |
| Whole cell-based | Microorganisms (e.g., bacteria, algae) | Metabolic activity or stress response | Robustness, self-replication, detects bioavailable fraction |
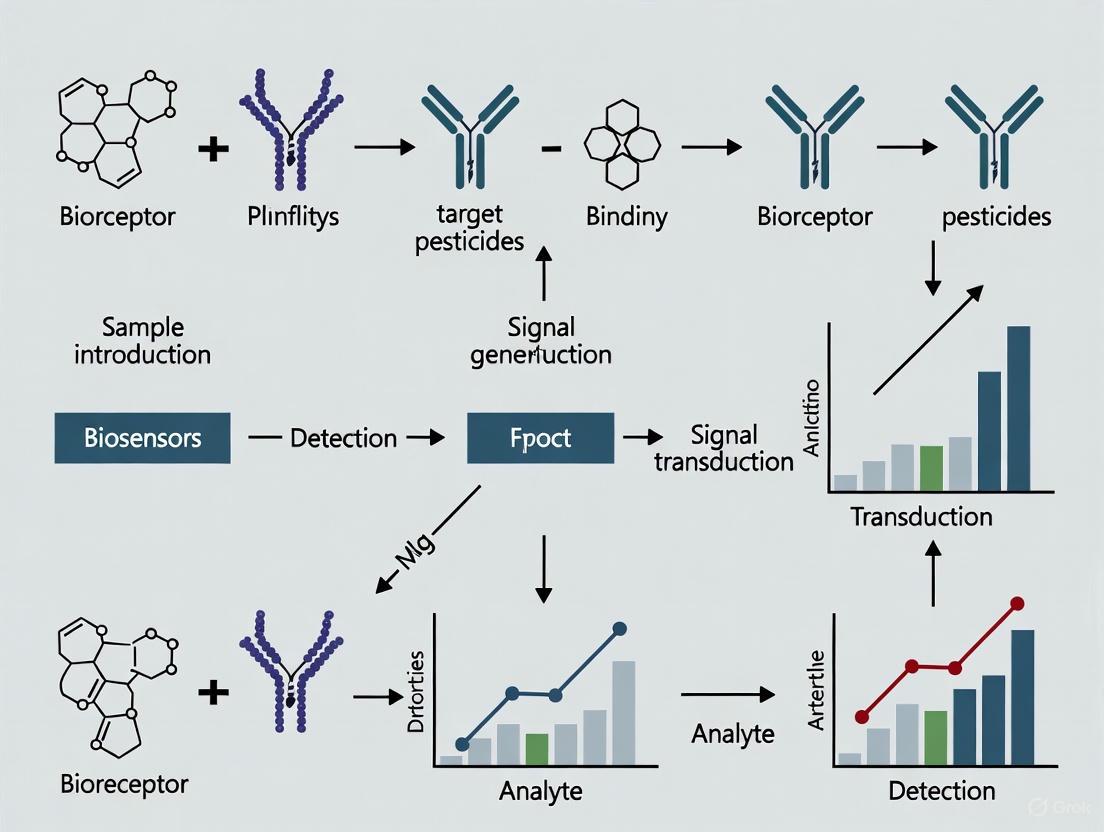
Figure 1: Fundamental Architecture of Biosensors for Pesticide Detection
Biosensing Technologies in Smart Agriculture
Monitoring Pesticide Residues in Crops
The application of biosensors in agriculture has revolutionized pesticide monitoring, enabling real-time detection directly in field conditions. For high-value crops like tea, which face significant export restrictions due to stringent pesticide regulations, biosensors offer a viable alternative to conventional techniques such as gas chromatography (GC) and inductively coupled plasma mass spectrometry (ICP-MS) [3]. These traditional methods, despite their high precision, require intricate pretreatment, incur substantial operational expenses, and are inadequate for swift on-site analysis [3].
Recent research has demonstrated the successful application of various biosensing platforms for detecting pesticide residues in crops. Electrochemical biosensors have shown particular promise for portable, on-site use owing to their enhanced sensitivity, cost-effectiveness, and adaptability to intricate plant matrices [3]. Similarly, fluorescence-based biosensors provide high sensitivity with detection limits ranging from nM to pM, while being resistant to interference from plant compounds like polyphenols and alkaloids [3].
Detection of Genetically Modified Traits
Beyond pesticide detection, biosensors play a crucial role in characterizing genetically modified (GM) crops. Recent developments include portable, paper-based biosensors for identifying GM traits in corn and soybean using loop-mediated isothermal amplification (LAMP) [23]. This technology offers a fast and less expensive alternative to conventional molecular tools, with test reactions costing approximately $2.90 each compared to $8-9 for other LAMP techniques [23].
A significant advantage of this approach is its compatibility with crude leaf extracts, eliminating the need for purified DNA. As Verma et al. reported, "We use that crude extract directly with our biosensor. Our biosensor with the leaf extract is as good as purified DNA" [23]. This feature dramatically simplifies field applications, allowing farmers to perform testing without laboratory infrastructure.
Table 2: Performance Comparison of Pesticide Detection Technologies
| Detection Method | Detection Limit | Analysis Time | Cost per Test | Portability | Key Applications |
|---|---|---|---|---|---|
| Biosensors (General) | nM to pM range [3] | 5-30 minutes [3] | Low [9] | High | On-site screening, routine monitoring |
| Electrochemical Biosensors | Very low (varies by target) [10] | Rapid (minutes) [10] | Low [10] | High | Field detection of organophosphates, carbamates |
| Optical Biosensors | nM range [10] | Moderate (15-30 min) [3] | Moderate [10] | Moderate to High | Laboratory and field applications |
| Chromatography (GC, HPLC) | Very low (ppt-ppb) [3] | Hours to days [3] | High [3] | Low | Reference laboratory confirmation |
| Spectrometry (ICP-MS) | Very low (ppt) [3] | Hours [3] | Very High [3] | Low | Regulatory testing, research |
Advanced Materials and Sensing Mechanisms
Innovative Biomaterials in Biosensor Design
The performance of biosensors heavily depends on the materials used in their construction. Recent advancements have introduced various nanomaterials and functional biomaterials that significantly enhance detection capabilities. These include graphene oxide (GO), molecularly imprinted polymers (MIPs), graphitic carbon nitride (g-C3N4), and metal-organic frameworks (MOFs) [10].
These advanced materials contribute to lower detection limits, excellent selectivity, and in some cases, large adsorption capacities for pesticide removal applications [10]. For instance, metal-organic frameworks offer high surface areas and tunable porosity, making them ideal for both sensing and removing pesticide contaminants [10]. The integration of these materials with biological recognition elements creates sophisticated sensing platforms capable of detecting multiple pesticide residues simultaneously—a significant advantage for comprehensive environmental monitoring.
Engineering Biosensor Performance
Strategic engineering of biosensor components allows fine-tuning of performance characteristics critical for agricultural applications. Key parameters such as dynamic range (the span between minimal and maximal detectable signals) and operating range (the concentration window where the biosensor performs optimally) can be optimized through various approaches [22].
Engineering methods include "exchanging promoters and ribosome binding site number and position of the operator region" [22]. Additionally, "the chimeric fusion of the DNA and ligand binding domains have also been used to engineer the specificity of the biosensor" [22]. High-throughput techniques like cell sorting, combined with directed evolution strategies, can lead to improved sensitivity and specificity of the engineered biosensor [22].
Figure 2: Generalized Workflow for Pesticide Detection Using Biosensors
Experimental Protocols and Methodologies
Standardized Testing Procedures
Implementing biosensor technology requires standardized protocols to ensure reproducibility and reliability across different applications. For pesticide residue detection in agricultural products, a typical experimental workflow involves several critical stages:
Sample Preparation: For plant materials like tea leaves, this involves extraction using appropriate solvents followed by potential cleanup steps to remove interferents. Recent advancements have enabled the use of crude extracts, as demonstrated in GM crop detection where researchers "homogenized [the sample] as a liquid, then diluted to one part extract and seven parts water" [23].
Assay Procedure: The specific protocol varies by biosensor type. For enzyme-based detection cards, a representative method involves: "Using a detection card, add two or three drops of the test solution and set it in an incubator at 37°C for 10 min to initiate a pre-reaction. After the pre-reaction, half-fold the detection card and maintain 37°C at a steady temperature for three minutes" [24].
Signal Measurement and Analysis: Depending on the biosensor platform, this may involve electrochemical measurements, optical readings (colorimetric, fluorescent, etc.), or other transduction methods. For colorimetric sensors, "image recognition technology is used to extract the color information RGB eigenvalues from the detection results" [24].
Quantitative Analysis Models
Advanced data processing techniques enhance the accuracy of biosensor outputs. Research has compared multiple regression models for quantifying pesticide residue concentrations from detection cards, including:
- Linear regression model
- Quadratic polynomial regression model
- Exponential regression model
- RBF neural network model [24]
Studies found that "the exponential regression model is superior at predicting the pesticide residue concentration indicated by the rapid detection card" with a correlation value of 0.900 and root mean square error of 0.106 [24]. This approach prevents negative prediction values when the expected concentration is near zero, addressing a common limitation in quantitative analysis.
The Scientist's Toolkit: Essential Research Reagents and Materials
Table 3: Key Research Reagent Solutions for Biosensor Development
| Reagent/Material | Function | Example Applications | Performance Characteristics |
|---|---|---|---|
| Acetylcholinesterase (AChE) | Enzyme bioreceptor for organophosphate and carbamate detection | Enzyme inhibition-based biosensors | High sensitivity to specific pesticide classes; detection limits down to nM range [9] |
| Nucleic Acid Aptamers | Synthetic DNA/RNA recognition elements | Aptasensors for various pesticides | Selected via SELEX; high affinity and specificity; tunable through chemical modification [9] |
| Metal-Organic Frameworks (MOFs) | Nanostructured sensing/adsorption platform | Signal enhancement and pesticide removal | High surface area; tunable porosity; functionalizable with biorecognition elements [10] |
| Molecularly Imprinted Polymers (MIPs) | Artificial antibody mimics | Bionic-guided detection strategies | High stability; customizable for specific pesticide molecules; reusable [10] |
| Gold Nanoparticles | Signal amplification and transduction | Colorimetric and electrochemical biosensors | Enhanced sensitivity; color change properties; excellent conductivity [3] |
| Whole Microbial Cells | Living bioreporters for bioavailable contaminants | Cell-based biosensors for environmental monitoring | Detect functional toxicity; self-replicating; can report via bioluminescence or fluorescence [9] |
Public Health Protection through Environmental Monitoring
Water Quality Assessment
Biosensors play a crucial role in safeguarding public health by monitoring pesticide contamination in water systems. The detection of emerging contaminants (ECs) in water environments has become a growing concern due to their high toxicity even at minimal concentrations [9]. Traditional analytical techniques like HPLC, GC, MS, and ICP-MS, while accurate, face limitations for routine monitoring due to high costs, complex sample preparation, and labor-intensive processes [9].
Biosensors address these challenges by offering highly sensitive, selective, low-cost, and simple-to-use alternatives for detecting hazardous elements in water [25]. Their portability enables on-site monitoring of water sources, providing real-time data for rapid response to contamination events. This capability is particularly valuable for assessing pesticide runoff from agricultural areas, where timely detection can prevent broader environmental dissemination and human exposure.
Integration with Public Health Surveillance
The application of biosensor technologies extends beyond environmental monitoring to direct public health protection. As demonstrated during the COVID-19 pandemic, biosensing platforms can be adapted for various health threats, showcasing their versatility [26]. This adaptability is equally relevant for pesticide surveillance, where exposure biomarkers in biological samples can be detected using similar principles.
The integration of biosensors with data analytics and wireless communication technologies creates comprehensive monitoring networks that can track pesticide exposure pathways from agricultural applications through environmental distribution to potential human exposure. These systems provide critical data for public health authorities to identify at-risk populations, implement targeted interventions, and evaluate the effectiveness of regulatory measures.
Future Perspectives and Research Directions
The future of biosensors in smart agriculture and public health protection will be shaped by several emerging trends and technological advancements. Research is increasingly focusing on multi-analyte detection platforms that can simultaneously screen for multiple pesticide residues and other contaminants [3]. The integration of microfluidic systems enhances the portability and automation of biosensing devices, while artificial intelligence improves data analysis and interpretation [3].
Future biosensor development will also leverage advances in synthetic biology to create more sophisticated biological recognition elements. As noted in recent research, "Dynamic control circuits in biosensors are typically characterized by input–output dose–response curves, but their dynamic performance—such as the response speed and signal-to-noise ratios—should also be key metrics of their evaluation" [22].
The growing emphasis on sustainability in agriculture will further drive biosensor innovation, with research focusing on devices that support integrated pest management and precision farming practices. Ultimately, these advancements will contribute to the development of comprehensive monitoring networks spanning the entire "tea garden-to-cup" supply chain and analogous systems for other agricultural products [3].
Biosensors represent a transformative technology for addressing the dual challenges of agricultural productivity and public health protection in the context of pesticide use. Their exceptional sensitivity, portability, and cost-effectiveness position them as indispensable tools for advancing smart agriculture practices through real-time monitoring and precision application of agrochemicals. Simultaneously, their application in environmental surveillance and exposure assessment provides critical data for protecting population health from pesticide-related risks.
As research continues to enhance the performance, reliability, and accessibility of these technologies, biosensors are poised to become increasingly integrated into agricultural management systems and public health protection frameworks. The ongoing convergence of biosensing with developments in materials science, data analytics, and wireless connectivity will further expand their capabilities, ultimately contributing to more sustainable agricultural systems and enhanced health security.
Cutting-Edge Biosensor Platforms and Their Real-World Applications
Enzyme-based biosensors have emerged as transformative analytical tools that leverage biological recognition for detecting specific analytes. Within this domain, biosensors utilizing the inhibition mechanism of acetylcholinesterase (AChE) represent a particularly significant technology for environmental monitoring and food safety, specifically for detecting neurotoxic pesticides [27] [28]. These biosensors combine the exceptional specificity of enzymatic reactions with the sensitivity of physical transducers, offering a robust alternative to conventional chromatographic methods such as gas chromatography (GC) and high-performance liquid chromatography (HPLC), which are often hampered by high operational costs, intricate sample pretreatment, and lack of portability for on-site analysis [27] [3] [10].
The core principle of AChE-based biosensors hinges on the enzyme's vital role in the nervous system. AChE catalyzes the hydrolysis of the neurotransmitter acetylcholine (ACh) into choline and acetic acid, a process crucial for terminating synaptic transmission [27] [29]. Organophosphorus (OP) and carbamate pesticides inhibit AChE by covalently binding to the serine residue in its active site, leading to enzyme inactivation and accumulation of ACh, which causes neurological dysfunction and other toxic effects [27] [30] [28]. The degree of enzyme inhibition is directly proportional to the pesticide concentration, forming the fundamental detection mechanism for AChE-based biosensors [27].
This technical guide provides an in-depth examination of AChE inhibition mechanisms, detailed experimental protocols, and advanced biosensing architectures, framed within the broader context of biosensor research for pesticide detection.
Inhibition Mechanism and Biochemical Principle
Acetylcholinesterase is a serine hydrolase concentrated at neuromuscular junctions and cholinergic brain synapses. Its primary function is to catalyze the breakdown of the neurotransmitter acetylcholine (ACh) into choline and acetic acid, thereby terminating synaptic transmission and ensuring proper muscular response [27] [29]. The catalytic efficiency of AChE is extraordinarily high, hydrolyzing ACh within microseconds to maintain clear synaptic communication [27].
The enzyme's active site consists of two key subsites: the anionic site, which attracts and positions the positively charged quaternary ammonium group of acetylcholine, and the esteratic subsite, which contains a catalytic triad of serine, histidine, and glutamate residues that mediate the hydrolysis of the ester bond [27]. In the absence of inhibitors, AChE efficiently converts its substrate, acetylthiocholine (AChI), into electrochemically active thiocholine and acetic acid [27] [30].
Organophosphorus (OP) and carbamate pesticides exert their toxicity through a common inhibition mechanism. These compounds structurally resemble the natural ACh substrate and are attracted to the enzyme's active site. Once bound, the electrophilic phosphorus atom (in OPs) or carbonyl carbon (in carbamates) undergoes a nucleophilic attack by the serine hydroxyl group in the catalytic triad. This reaction results in the formation of a stable, covalent phosphorylated or carbamylated enzyme complex, which effectively blocks the active site and prevents further catalysis [27] [30] [28]. The intensity of AChE inhibition is quantitatively proportional to the concentration of the inhibiting pesticide, forming the fundamental principle for biosensor-based detection [27]. While both classes inhibit AChE, phosphorylated enzymes are generally more stable, leading to longer-lasting inhibition compared to carbamylated complexes.
The following diagram illustrates the core biochemical workflow of the AChE inhibition mechanism used in pesticide detection.
Biosensor Fabrication and Immobilization Strategies
The performance of an AChE biosensor—including its sensitivity, stability, and reproducibility—is critically dependent on the method used to immobilize the enzyme onto the transducer platform. Effective immobilization preserves enzymatic activity, prevents leakage, and often enhances stability by restricting conformational changes [27] [31]. The choice of support material and immobilization technique must therefore be carefully considered.
Immobilization Techniques
Several well-established methods are available for AChE immobilization, each with distinct advantages and limitations [27]:
- Physical Adsorption: This method relies on weak interactions such as Van der Waals forces, hydrogen bonding, or electrostatic attractions between the enzyme and the support material. It is simple, economical, and avoids harsh chemical conditions that could denature the enzyme. However, the binding is weak, often resulting in enzyme leakage from the electrode surface over time, especially in variable pH or ionic strength conditions [27].
- Covalent Coupling: This approach forms stable covalent bonds between functional groups on the enzyme (e.g., amino, carboxyl, or hydroxyl groups) and chemically activated groups on the support surface. It strongly prevents enzyme leaching and allows for direct analyte-enzyme interaction, leading to a fast response time. The drawbacks include complex procedures, potential for enzyme denaturation if harsh coupling agents are used, and high enzyme consumption [27] [30].
- Entrapment/Encapsulation: The enzyme is physically confined within a porous matrix or membrane, such as a polymer gel (e.g., polysaccharides, polyacrylamide) or an inorganic silica network. This method is a simple, one-step procedure that is gentle on the enzyme. A significant challenge is the potential for leaching of smaller enzyme molecules, along with possible diffusion barriers for the substrate that can increase response time and cause lower reproducibility [27].
- Self-Assembled Monolayers (SAMs): This technique involves the spontaneous organization of molecules with a specific head group (e.g., thiols on gold) and a functional tail group into an ordered, nanoscale layer. The AChE enzyme is then attached to this monolayer. SAMs provide a well-defined and ordered structure. Their drawbacks include difficulties in reproduction and susceptibility to fouling over time as interactions weaken [27].
- Cross-Linking: Enzymes are interconnected via bi- or multi-functional reagents (e.g., glutaraldehyde), often forming a robust network. While this method effectively prevents leaching, it can lead to a loss of activity due to the potential for creating diffusion barriers and rigidifying the enzyme structure [30].
Advanced Support Materials
The selection of the support material is equally critical for biosensor performance. Recent research has focused on nanomaterials and novel composites to enhance electron transfer, increase surface area, and improve biocompatibility.
- Renewable Carbon (RC): Derived from biomass pyrolysis, RC is a sustainable, carbon-rich material with moderate surface area and porosity. It can be functionalized with acid treatments to introduce surface groups that enhance enzyme binding. RC represents a low-cost and environmentally friendly alternative to more complex carbon nanomaterials [30] [32].
- Metal-Organic Frameworks (MOFs): These are crystalline porous materials formed by metal ions and organic linkers. MOFs can serve as excellent immobilization matrices due to their ultra-high surface area and tunable pore size. They can physically protect the enzyme, enhancing its stability against harsh conditions [1].
- Nanoparticles: The incorporation of nanoparticles, such as gold and carbon nanotubes, has been widely reported to significantly improve biosensor efficiency. They provide a large surface area for enzyme loading, facilitate electron transfer, and can be functionalized to promote oriented enzyme immobilization, making the biosensor more reliable and robust [27] [28].
Experimental Protocols and Methodologies
This section details specific protocols for AChE inhibition assays, ranging from high-throughput screening formats to applications with real food samples.
Cell-Based AChE Inhibition Assay (qHTS Format)
This protocol uses a human neuroblastoma cell line (SH-SY5Y) to provide a physiological environment for detecting AChE inhibition [29].
Key Reagents and Materials:
- Human neuroblastoma cell line (SH-SY5Y)
- Customized DMEM/F-12 cell assay medium (without choline and phenol red)
- Positive controls: Chlorpyrifos-oxon (potent AChE inhibitor) or BW284c51
- Detection Kit: Amplite Red Fluorimetric Acetylcholinesterase Assay Kit
- Assay Plates: 1536-well black wall/clear-bottom plates
Procedure:
- Cell Preparation: Detach SH-SY5Y cells from culture flasks using 0.25% trypsin. Centrifuge the suspension at 900 rpm for 4 minutes and resuspend the cells in the customized assay medium at a density of 500,000 cells per mL.
- Cell Plating: Dispense the cell suspension into 1536-well plates at 2,000 cells per well (4 µL volume) using a Multidrop Combi dispenser.
- Incubation: Incubate the plates for 18 hours at 37°C with 5% CO₂ to allow the cells to adhere and stabilize.
- Compound Transfer: Using a Pintool workstation, transfer 23 nL of test compounds, negative control (DMSO), and positive controls to the assay plates.
- Inhibition Incubation: Incubate the plates for 1 hour at 37°C with 5% CO₂ to allow the inhibitors to act on cellular AChE.
- Detection: Add 4 µL of the Amplite Red detection solution to each well using a BioRAPTR Flying Reagent Dispenser (FRD). Incubate the plates at room temperature for 40-90 minutes to allow the enzymatic reaction to proceed.
- Signal Measurement: Measure the fluorescence intensity (Ex/Em = 544 nm / 590 nm) using a plate reader such as a ViewLux.
- Data Analysis: Calculate the percentage inhibition relative to the negative (DMSO) and positive control wells.
Human Recombinant AChE Assay with Liver Microsomes for Metabolic Activation
Many organophosphate pesticides are protoxins that require metabolic activation to become potent AChE inhibitors. This cell-free protocol incorporates liver microsomes to enable the detection of such compounds [29].
Key Reagents and Materials:
- Recombinant human AChE
- Human or rat liver microsomes (e.g., InVitroCYP 150-D HLM)
- NADPH regeneration system
- Colorimetric Acetylcholinesterase Assay Kit
Procedure:
- Reaction Mixture: Dispense a 3 µL mixture containing human recombinant AChE (50 mU/mL) and liver microsomes (0.25 mg/mL) into each well of a 1536-well plate.
- Compound Addition: Immediately transfer 23 nL of test compounds or controls into the assay plate.
- Metabolic Activation: Pre-incubate the plate for 30 minutes at room temperature to allow metabolism of the test compounds by the microsomal enzymes.
- Reaction Initiation: Add 1 µL of NADPH solution to initiate the metabolic reactions. Incubate further to allow generated metabolites to inhibit AChE.
- Detection: Add 4 µL of the colorimetric detection solution to each well.
- Signal Measurement: Incubate the plate and measure the absorbance at 405 nm using a plate reader.
- Data Analysis: Compare the signal to controls to determine the level of inhibition, factoring in bioactivation.
Electrochemical Biosensor for Carbaryl Detection in Food Samples
This protocol demonstrates the application of a functionalized renewable carbon (RCF) based biosensor for detecting the carbamate pesticide carbaryl in apple samples [30] [32].
Key Reagents and Materials:
- Acetylcholinesterase enzyme from Electrophorus electricus
- Acetylthiocholine iodide (AChI)
- Carbaryl standard
- Functionalized Renewable Carbon (RCF)
- Phosphate Buffer Saline (PBS, 0.2 mol L⁻¹, pH 7.0)
- Glassy Carbon (GC) electrode
Biosensor Fabrication:
- Electrode Preparation: Polish and clean the Glassy Carbon (GC) electrode.
- Modification: Mix 1 mL of RCF suspension (1.0 mg mL⁻¹) with 200 µL of AChE enzyme suspension (containing 80 units of activity) in PBS.
- Immobilization: Drop-cast 10 µL of the RCF/AChE mixture onto the GC electrode surface and allow it to dry at room temperature, resulting in the GC/RCF/AChE biosensor.
Measurement and Analysis:
- Experimental Setup: Perform Differential Pulse Voltammetry (DPV) in a standard three-electrode system with the biosensor as the working electrode, Ag/AgCl as reference, and a platinum plate as the counter electrode.
- Baseline Measurement: Record the DPV response in PBS (pH 7.0) containing 50.0 µmol L⁻¹ of AChI. This gives the initial anodic peak current (I_i), corresponding to uninhibited enzyme activity.
- Inhibition Step: Incubate the biosensor in a sample solution containing carbaryl for 5 minutes.
- Post-Inhibition Measurement: Wash the biosensor and record the DPV signal again under the same conditions to obtain the peak current after inhibition (I_f).
- Quantification: Calculate the percentage of inhibition (I%) using the formula: I% = [(I_i - I_f) / I_i] × 100% The inhibition percentage is then correlated to the carbaryl concentration using a calibration curve.
Sample Preparation (Apple):
- Homogenize 100 g of apple (including peel and seeds) in 100 mL of PBS (0.2 mol L⁻¹, pH 7.5).
- Centrifuge the mixture at 3500 rpm for 5 minutes.
- Collect the supernatant and fortify it with known concentrations of carbaryl for analysis via the standard addition method.
Performance Data and Analytical Characteristics
The analytical performance of AChE biosensors is typically evaluated based on detection limit, linear range, and recovery in real samples. The following table summarizes performance data from selected studies, illustrating the capabilities of different biosensor configurations.
Table 1: Analytical Performance of Representative AChE Biosensors for Pesticide Detection
| Biosensor Configuration | Target Pesticide | Detection Principle | Linear Range | Detection Limit | Sample Application | Reference |
|---|---|---|---|---|---|---|
| GC/RCF/AChE | Carbaryl (Carbamate) | Electrochemical (DPV) | 5.0 - 30.0 nmol L⁻¹ | 4.5 nmol L⁻¹ | Apple | [30] |
| AChE-based Biosensor | Organophosphates & Carbamates | Electrochemical | Varies with design | ~10⁻⁷ to 10⁻¹⁰ M | Environmental, Food | [27] |
| Human recombinant AChE (qHTS) | Various Inhibitors | Fluorimetric / Colorimetric | Dependent on assay | - | Compound Libraries | [29] |
Beyond the core performance metrics, the storage stability and operational stability of the biosensor are critical for practical application. Stability is influenced by the immobilization method and support material. For instance, biosensors using covalent binding or encapsulation in robust matrices like MOFs often demonstrate longer shelf lives [27] [1]. Reproducibility, measured by the relative standard deviation (RSD) of signals from multiple sensors, is another key parameter, with nanomaterials often helping to achieve RSDs below 5% [30].
Advanced Sensing Technologies and Future Perspectives
The field of AChE biosensing is rapidly evolving, with several advanced technologies emerging to enhance sensitivity, specificity, and field-deployability.
- Nanozymes and MOF Composites: Metal-Organic Frameworks (MOFs) are increasingly used not only as protective carriers for natural AChE but also as nanozymes—materials mimicking enzyme activity. MOF-based nanozymes offer superior stability, tunable catalytic activity, and resistance to denaturation under harsh conditions, overcoming the inherent instability of natural enzymes [1] [10]. Composites that incorporate natural AChE within MOFs leverage the strengths of both, resulting in platforms with remarkable catalytic activity and stability for pesticide detection [1].
- High-Throughput Screening (qHTS) Platforms: The adaptation of AChE inhibition assays to quantitative high-throughput screening (qHTS) in 1536-well plate formats allows for the rapid profiling of large chemical libraries. This is crucial for identifying potential chemical hazards and prioritizing compounds for further toxicological testing, facilitating the development of predictive toxicology models [29].
- Multimodal Detection and Integration: Future biosensors are trending toward multi-component detection. An example is the development of single biosensors capable of simultaneously quantifying both pesticide concentrations and associated neurotransmitter levels, such as acetylcholine, providing a more comprehensive diagnostic tool [28]. Furthermore, the integration of microfluidic chips (Lab-on-a-Chip) and artificial intelligence (AI) for data processing is paving the way for intelligent, portable, and automated sensing systems suitable for real-time monitoring in the field [3] [31].
The following diagram outlines the integrated experimental workflow for developing and applying an AChE biosensor, from fabrication to data analysis.
The Scientist's Toolkit: Essential Research Reagents
The following table compiles key reagents and materials essential for conducting AChE inhibition assays and fabricating AChE-based biosensors.
Table 2: Key Research Reagents and Materials for AChE Biosensor Research
| Reagent/Material | Function/Application | Example Specifications |
|---|---|---|
| Acetylcholinesterase (AChE) | Biological recognition element; catalyzes substrate hydrolysis for signal generation. | Source: Electrophorus electricus (Electric eel) or human recombinant. Activity: 200-1000 units/mg protein. [29] [30] |
| Acetylthiocholine Iodide (AChI) | Synthetic enzyme substrate; converted to electroactive thiocholine. | Purity: ≥98% (e.g., Sigma-Aldrich PESTANAL). Used in electrochemical detection. [30] [32] |
| Positive Control Inhibitors | Quality control for assay/biosensor performance. | Chlorpyrifos-oxon (potent OP), Carbaryl (Carbamate), BW284c51 (specific AChE inhibitor). [29] |
| Liver Microsomes | In vitro metabolic activation system for detecting protoxin pesticides. | Human (HLM) or Rat (RLM) liver microsomes. Pooled from multiple donors for metabolic competence. [29] |
| Functionalized Renewable Carbon (RCF) | Sustainable, low-cost electrode nanomaterial for enzyme immobilization. | Derived from biomass pyrolysis, functionalized with HNO₃/H₂SO₄. [30] [32] |
| Detection Kits (Fluorimetric/Colorimetric) | Homogeneous assay reagents for high-throughput screening (qHTS). | Amplite Red/Fluorimetric, Amplite Colorimetric AChE Assay Kits (AAT Bioquest). [29] |
| Nanomaterials (MOFs, NPs) | Enhance electron transfer, increase surface area, and improve biosensor stability. | Metal-Organic Frameworks (MOFs), Gold Nanoparticles (AuNPs), Carbon Nanotubes (CNTs). [27] [1] [28] |
AChE-based biosensors represent a mature yet continuously evolving technology that effectively addresses the critical need for rapid, sensitive, and on-site detection of neurotoxic pesticides. The core inhibition mechanism provides a robust foundation for analytical detection, while advancements in enzyme immobilization strategies, novel nanomaterials, and sophisticated assay protocols have significantly enhanced their performance, reliability, and scope of application. The integration of these biosensors with high-throughput screening platforms, metabolic activation systems, and emerging technologies like MOF-nanozymes and microfluidics is pushing the boundaries of pesticide analysis. As research progresses, the focus on improving stability, multiplexing capability, and real-world applicability will further solidify the role of AChE biosensors as indispensable tools in ensuring environmental safety, food security, and public health.
Nanozymes are a class of synthetic nanomaterials that exhibit intrinsic enzyme-like catalytic activity, mimicking the functions of natural enzymes such as peroxidases, oxidases, catalases, and superoxide dismutases [33]. The term "nanozyme," derived from "nanomaterial" and "enzyme," was first introduced in 2004 to describe gold nanoparticles functionalized with triazacyclonane that catalyze transphosphorylation reactions [33]. The field gained significant momentum in 2007 with the discovery that Fe₃O₄ nanoparticles possess intrinsic peroxidase-like activity, revolutionizing our understanding of nanomaterial biocatalytic properties [33] [34]. This breakthrough opened new horizons for nanomaterials as promising alternatives to natural enzymes across various research fields, particularly in biosensing and bioassays [34].
Nanozymes are defined as "nanomaterials that catalyze the conversion of enzyme substrates to products and follow enzymatic kinetics under physiologically relevant conditions" [33]. Unlike traditional artificial enzymes that mimic the catalytic structures or mechanisms of natural enzymes, nanozymes possess unique nanostructures and mechanisms that drive their intrinsic biocatalytic properties [33]. Their catalytic activity stems from the co-existence of metal ions at different valences on their surface, enabling rapid transition between valences and subsequent electron transfer on the nanoparticle surface [34]. Nanozymes integrate biocatalytic activity with unique nano-physicochemical properties, making them versatile and multifunctional entities for various applications [33].
Fundamental Properties and Classification
Key Advantages of Nanozymes
Nanozymes offer significant advantages over natural enzymes, making them particularly valuable for biosensing applications. These advantages include higher stability under extreme pH and temperature conditions, lower production costs, simpler preparation methods, superior recyclability, and mass production capability [34] [35]. Natural enzymes, being biological macromolecules, are prone to denaturation at extreme pH values and temperatures, leading to poor reusability and limited practical application [34]. In contrast, nanozymes maintain stable catalytic performance across a wide temperature range (4–90°C) and various pH conditions, making them suitable for applications where natural enzymes would fail [34]. Furthermore, nanozymes can be separated from solutions by centrifugation or magnetic separation (for magnetic nanozymes) and reused multiple times without substantial loss of catalytic activity, significantly reducing operational costs [34].
Table 1: Comparison Between Natural Enzymes and Nanozymes
| Property | Natural Enzymes | Nanozymes |
|---|---|---|
| Catalytic Activity | High | Variable, can be tuned |
| Stability | Sensitive to temperature, pH, and environmental conditions | High stability under extreme conditions |
| Production Cost | High due to complex purification | Relatively low, scalable synthesis |
| Storage & Shelf Life | Limited, often requires specific conditions | Long-term stability, easier storage |
| Reusability | Limited | Excellent recyclability |
| Modification | Complex | Tunable surface chemistry and composition |
| Mass Production | Challenging | Facile and scalable |
Classification of Nanozymes
Nanozymes can be classified based on their material composition and the type of enzyme activity they mimic. The primary classification by material composition includes:
- Carbon-based nanozymes: Including graphene, carbon nanotubes, carbon dots, and fullerenes [36]. Their catalytic activity depends on surface functional groups and dopant elements, with oxygen-containing functional groups (hydroxyl and carbonyl) combining with substrates through hydrogen bonding [36].
- Metal-based nanozymes: Utilizing noble metals such as gold, silver, platinum, and palladium [36].
- Metal-oxide-based nanozymes: Including Fe₃O₄, CeO₂, and other metal oxides [36].
- Metal-organic framework (MOF)-based nanozymes: Offering highly tunable structures and functionalities [36].
- Composite nanozymes: Combining multiple nanomaterials to enhance catalytic performance [36].
Based on enzymatic activity, nanozymes are primarily categorized as oxidoreductases (including peroxidase, oxidase, catalase, and superoxide dismutase mimics) and hydrolases (including phosphatase, protease, and nuclease mimics) [37]. The most commonly used nanozymes in biosensing applications are those with peroxidase-like, oxidase-like, catalase-like, and superoxide dismutase-like activities [37].
Table 2: Major Types of Nanozymes and Their Applications in Biosensing
| Nanozyme Type | Example Materials | Mimicked Enzyme Activity | Typical Applications |
|---|---|---|---|
| Carbon-based | Graphene Quantum Dots, Carbon Nanotubes | Peroxidase, Oxidase | Detection of organophosphates, carbamates |
| Metal-based | Au, Ag, Pt, Pd nanoparticles | Peroxidase, Oxidase, Catalase | Heavy metal detection, pesticide monitoring |
| Metal-oxide-based | Fe₃O₄, CeO₂, V₂O₅ | Peroxidase, SOD, Catalase | Antioxidant sensing, pesticide detection |
| MOF-based | ZIF-8, MIL-100 | Peroxidase, Oxidase | Antibiotic detection, environmental monitoring |
| Composite | Fe₃O₄@MnO₂, Au@Pt | Multiple enzyme activities | Multimodal sensing, complex sample analysis |
catalytic mechanisms in biosensing
peroxidase-like activity
Peroxidase-like activity is the most extensively studied and utilized nanozyme property in biosensing applications. Peroxidases typically catalyze the oxidation of substrates using hydrogen peroxide (H₂O₂) as an electron acceptor. Nanozymes with peroxidase-mimicking activity follow similar catalytic mechanisms, primarily through electron transfer pathways or hydroxyl radical production based on Fenton reactions [37]. In the Fenton reaction, hydrogen peroxide is catalytically decomposed by ferrous ions (Fe²⁺), generating reactive oxygen species including hydroxyl radicals (•OH) that oxidize chromogenic substrates [37].
The general catalytic mechanism involves:
- Adsorption of H₂O₂ onto the nanozyme surface
- Generation of hydroxyl radicals via electron transfer
- Oxidation of chromogenic substrates (e.g., TMB, OPD, ABTS)
- Production of colored products measurable by spectrophotometry [37]
The ping-pong mechanism (double-displacement reaction) is recognized as the primary mechanism for peroxidase activity, where the nanozyme alternately binds with H₂O₂ and the reducing substrate [37].
Figure 1: Peroxidase-like Catalytic Mechanism of Nanozymes
Oxidase-like and Other Enzyme Activities
Beyond peroxidase-like activity, nanozymes can mimic various other enzyme functions. Oxidase-like nanozymes catalyze the oxidation of substrates using molecular oxygen as an electron acceptor, producing hydrogen peroxide or water as byproducts [34]. This activity is particularly valuable for detecting analytes that inhibit or enhance the oxidase-mimicking activity. Catalase-like nanozymes facilitate the decomposition of hydrogen peroxide into water and oxygen, while superoxide dismutase-like nanozymes catalyze the dismutation of superoxide radicals into oxygen and hydrogen peroxide [37]. Some nanozymes also exhibit hydrolase-like activities, including phosphatase-like, protease-like, and nuclease-like activities, though these are less common in biosensing applications [33].
Nanozyme Applications in Pesticide Detection Biosensors
Detection Mechanisms and Strategies
Nanozyme-based biosensors employ various mechanisms for pesticide detection, primarily falling into three categories:
Enzyme Inhibition-based Detection: This approach utilizes the inhibitory effect of pesticides on specific enzymes. For instance, organophosphorus and carbamate pesticides inhibit acetylcholinesterase (AChE) activity. In a typical biosensor design, AChE hydrolyzes acetylcholine to produce choline, which is further oxidized by choline oxidase to generate H₂O₂. The H₂O₂ then reacts with a peroxidase-mimicking nanozyme to produce a detectable signal. Pesticide presence inhibits AChE, reducing H₂O₂ production and causing measurable signal changes [36].
Immunoassay-based Detection: Nanozymes serve as enzyme labels in immunoassays, replacing traditional enzymes like horseradish peroxidase. In this approach, antibodies specific to target pesticides are conjugated with nanozymes. The presence of pesticides affects antibody-antigen binding, modulating the nanozyme's catalytic activity and generating detectable signals [9].
Direct Catalysis-based Detection: Some pesticides directly inhibit or enhance nanozyme catalytic activity. For example, certain pesticides may quench the peroxidase-like activity of nanozymes by binding to their active sites, enabling direct detection without additional biological components [38].
Table 3: Nanozyme-Based Detection Mechanisms for Different Pesticide Classes
| Pesticide Class | Detection Mechanism | Nanozyme Type | Signal Modulations |
|---|---|---|---|
| Organophosphates | AChE enzyme inhibition | Carbon-based, Metal-oxide | Decreased colorimetric/fluorescent signal |
| Carbamates | AChE enzyme inhibition | Metal-based, MOF | Decreased electrochemical response |
| Triazines | Immunoassay | Metal-based, Composite | Increased/decreased colorimetric signal |
| Pyrethroids | Direct interaction | Carbon-based, Metal-oxide | Fluorescence quenching/enhancement |
| Neonicotinoids | Aptamer-based | Metal-based, Carbon-based | Photothermal/colorimetric change |
Multimodal Sensing Platforms
Recent advances in nanozyme research have enabled the development of multimodal sensing platforms that combine multiple detection techniques to enhance sensitivity, accuracy, and reliability. These platforms integrate colorimetric, fluorescent, photothermal, and electrochemical sensing modalities to provide complementary information and mutual verification of results [36]. For example, a single nanozyme-based biosensor might simultaneously monitor color changes and temperature variations induced by pesticide presence, significantly reducing false-positive results and improving detection reliability [36].
Common multimodal combinations include:
- Colorimetric/Fluorescent: Visual color changes with quantitative fluorescence measurements
- Fluorescent/Photothermal: Fluorescence signals with photothermal response
- Photothermal/Colorimetric: Temperature changes with color development
- Electrochemical/Colorimetric: Electrical signals with visual detection [36]
Experimental Protocols and Methodologies
Synthesis of Carbon-Based Nanozymes
Graphene Quantum Dots (GQDs) for Pesticide Detection [36]
Objective: To synthesize peroxidase-mimicking GQDs for detecting organophosphorus pesticides.
Materials:
- Citric acid (carbon source)
- NaOH or Na₂CO₃ (for pH adjustment)
- Acetylcholinesterase (AChE)
- Choline oxidase (CHOx)
- Acetylcholine (substrate)
- Phosphate buffer (0.1 M, pH 7.4)
- 3,3',5,5'-Tetramethylbenzidine (TMB) or other chromogenic substrates
Procedure:
- GQD Synthesis:
- Heat citric acid (2.0 g) at 200°C for 30 minutes in a heating mantle.
- The citric acid will melt, first turning liquid and then solidifying with color changing from white to yellow to orange.
- Dissolve the resulting orange solid in NaOH solution (10 mg/mL) under stirring.
- Adjust pH to 7.0-7.5 using Na₂CO₃ or dilute NaOH solution.
- Dialyze the solution against distilled water using a dialysis membrane (molecular weight cutoff: 1000 Da) for 24 hours to remove small molecules.
- Collect the GQD solution by freeze-drying.
Biosensor Fabrication:
- Immobilize AChE and CHOx on GQDs through physical adsorption or covalent conjugation.
- For covalent conjugation, activate carboxyl groups on GQDs using EDC/NHS chemistry.
- Mix activated GQDs with enzyme solutions in phosphate buffer (pH 7.4) and incubate at 4°C for 12 hours.
- Remove unbound enzymes by centrifugation or dialysis.
Pesticide Detection:
- Incubate the GQD/AChE/CHOx biosensor with sample containing pesticides for 10-15 minutes.
- Add acetylcholine substrate and incubate for another 10 minutes.
- Add TMB solution and record absorbance at 652 nm or observe color development.
- The inhibition percentage correlates with pesticide concentration.
Figure 2: GQD Nanozyme Synthesis and Biosensor Fabrication
Evaluation of Nanozyme Activity
Kinetic Analysis of Peroxidase-Mimicking Nanozymes
Objective: To determine kinetic parameters (Km and Vmax) of nanozymes using Michaelis-Menten kinetics.
Materials:
- Nanozyme solution
- Hydrogen peroxide (substrate)
- TMB or other chromogenic substrates
- Buffer solution (optimal pH for the nanozyme)
- Spectrophotometer or microplate reader
Procedure:
- Prepare varying concentrations of H₂O₂ (e.g., 0.1-10 mM) in buffer.
- Add fixed concentrations of nanozyme and TMB.
- Immediately measure absorbance changes at appropriate wavelength (652 nm for oxidized TMB) over time.
- Calculate initial reaction rates (V) at different substrate concentrations.
- Plot V versus [S] and fit data to Michaelis-Menten equation: V = (Vmax × [S]) / (Km + [S])
- Determine Km (Michaelis constant) and Vmax (maximum reaction rate) from the plot.
Note: Similar procedures can be performed with varying TMB concentrations while keeping H₂O₂ concentration constant to determine kinetic parameters for the electron donor.
Research Reagent Solutions
Essential Materials for Nanozyme Research
Table 4: Key Research Reagents for Nanozyme-Based Pesticide Detection
| Reagent Category | Specific Examples | Function in Research |
|---|---|---|
| Nanozyme Materials | Fe₃O₄ NPs, Au NPs, CeO₂ NPs, Graphene Oxide, Carbon Dots, MOFs (ZIF-8, MIL-100) | Core catalytic elements that mimic enzyme activity |
| Chromogenic Substrates | TMB (3,3',5,5'-Tetramethylbenzidine), ABTS (2,2'-Azinobis), OPD (o-Phenylenediamine) | Produce detectable color changes upon oxidation by nanozymes |
| Enzymes for Inhibition Assays | Acetylcholinesterase (AChE), Choline Oxidase (CHOx), Butyrylcholinesterase (BChE) | Biological components inhibited by target pesticides |
| Cross-linking Agents | EDC (1-Ethyl-3-(3-dimethylaminopropyl)carbodiimide), NHS (N-Hydroxysuccinimide) | Facilitate covalent immobilization of biomolecules on nanozymes |
| Buffer Systems | Phosphate Buffer (PB), Phosphate-Buffered Saline (PBS), Acetate Buffer | Maintain optimal pH for catalytic activity and biomolecule stability |
| Detection Probes | Fluorescent dyes, Electrochemical mediators, Magnetic beads | Enable multimodal detection and signal amplification |
| Pesticide Standards | Chlorpyrifos, Parathion, Carbaryl, Atrazine, Glyphosate | Reference materials for method development and validation |
Current Challenges and Future Perspectives
Despite significant progress, nanozyme-based biosensors face several challenges that require further research and development. One major challenge is the selectivity of nanozymes toward specific pesticides in complex sample matrices [36]. While natural enzymes exhibit high substrate specificity, most nanozymes have broader specificity, potentially leading to interference from other compounds. Strategies to enhance selectivity include surface modification with molecularly imprinted polymers, aptamers, or antibodies that provide specific recognition elements [36].
Another challenge involves the potential aggregation and stability issues of nanozymes in real sample matrices, which can affect reproducibility and reliability [38]. Extensive validation against standard analytical methods is necessary to establish credibility for real-world applications [9]. Future research directions should focus on developing nanozymes with enhanced specificity, improved stability in complex matrices, and integration with portable detection platforms for on-site applications [36].
The emerging integration of artificial intelligence (AI) with nanozyme research shows promise for optimizing nanozyme design and performance prediction [36]. AI algorithms can accelerate the discovery of novel nanozymes with desired properties by analyzing structure-activity relationships and predicting catalytic efficiency [36]. Additionally, the development of multifunctional nanozymes that combine multiple enzyme activities and other functionalities (e.g., magnetic separation, photothermal properties) will expand their applications in pesticide detection and environmental monitoring [33].
As research progresses, nanozyme-based biosensors are expected to play an increasingly important role in ensuring food safety, environmental monitoring, and public health protection by enabling rapid, sensitive, and on-site detection of pesticide residues [38] [36].
The need for precise and reliable monitoring of environmental contaminants has positioned biosensor technology at the forefront of analytical research. This is particularly critical in the field of pesticide detection, where conventional techniques, while accurate, are often hampered by high costs, complex workflows, and a lack of portability for rapid, on-site analysis [3] [39]. Metal-organic frameworks (MOFs) have emerged as a revolutionary class of porous materials that are redefining the capabilities of biosensors. Composed of metal ions or clusters coordinated to organic linkers, MOFs offer an unparalleled combination of high specific surface area, tunable porosity, and versatile functionality [40] [39]. These properties can be strategically engineered to significantly enhance two of the most critical parameters in sensing applications: stability and sensitivity. When integrated into biosensing platforms, MOFs facilitate precise pesticide detection via fluorescent, colorimetric, electrochemical, or hybrid mechanisms, enabling the detection of trace analytes even within complex matrices like food extracts and biological fluids [40] [10]. This technical guide examines the role of MOF-based biosensors within pesticide detection research, detailing the underlying mechanisms, experimental protocols, and advanced material considerations that are pushing the boundaries of analytical science.
Fundamental Properties of MOFs for Biosensing
The exceptional suitability of MOFs for biosensing stems from a set of intrinsic structural properties that can be fine-tuned for specific applications.
Tunable Porosity and High Surface Area: MOFs possess extraordinarily high surface areas, often exceeding 6000 m²/g, which provides a vast platform for the immobilization of biomolecular recognition elements such as enzymes, antibodies, and aptamers [39]. Their pore sizes and chemical environments can be systematically adjusted by selecting different metal clusters and organic linkers, allowing for the selective adsorption and pre-concentration of target pesticide molecules, thereby directly amplifying the sensor's signal [41].
Tailorable Surface Chemistry and Functionalization: The organic ligands within MOFs can be designed to include specific functional groups (-NH₂, -COOH, etc.) either during synthesis or through post-synthetic modification [40]. This enables strong covalent or coordinative bonding with biorecognition elements, enhancing the stability and longevity of the biosensor interface. Furthermore, the incorporation of open metal sites (OMS) on the framework creates highly reactive centers that can strongly interact with target analytes, leading to improved selectivity and sensitivity [42].
Enhanced Stability through Structural Design: A historical limitation of some MOFs has been their instability in aqueous environments. Recent advancements have led to the development of more robust structures, including Zeolitic Imidazolate Frameworks (ZIFs) and water-stable MOFs like UiO-66 and MIL-series, which maintain their structural integrity in the complex liquid samples typical of pesticide analysis [39] [41]. Stability can be further enhanced by forming composites with materials like graphene oxide or polymers [10].
Detection Mechanisms and Performance
MOF-based biosensors leverage various transduction mechanisms to convert the binding or catalytic event into a quantifiable signal. The table below summarizes the primary mechanisms and their performance characteristics in pesticide detection.
Table 1: Performance of MOF-Based Biosensing Mechanisms for Pesticide Detection
| Detection Mechanism | Signal Readout | Typical Analytes | Limit of Detection (LOD) | Key Advantages |
|---|---|---|---|---|
| Fluorescent | Fluorescence intensity, quenching, or shift | OPPs, carbamates, pyrethroids [39] | Low nM to pM range [10] | High sensitivity, real-time detection, versatility |
| Electrochemical | Current (amperometric), potential (potentiometric), impedance (impedimetric) | OPPs, herbicides, insecticides [39] | Low nM to pM range [10] | Portability, low cost, rapid response, suitability for miniaturization |
| Colorimetric | Visible color change | Broad-spectrum pesticides [3] | nM to µM range | Simplicity, visual readout, no need for sophisticated equipment |
| SERS (Surface-Enhanced Raman Scattering) | Raman signal intensity | Various pesticides with specific Raman fingerprints [3] | High sensitivity (single molecule in some cases) | Provides molecular fingerprint, high specificity |
Detailed Signaling Pathways
Fluorescent Mechanisms often operate via a "turn-off" or "turn-on" principle. In a typical "turn-off" sensor, the MOF itself is highly fluorescent. Upon interaction with or catalytic degradation of the target pesticide, the electron or energy transfer between the MOF and the analyte leads to fluorescence quenching, providing a quantifiable signal drop [40] [10]. For instance, a MOF with OMS can selectively bind to the phosphoryl group of organophosphorus pesticides (OPPs), causing a measurable change in its fluorescence properties.
Electrochemical Mechanisms frequently rely on the enzyme-inhibition principle. Acetylcholinesterase (AChE) enzyme is immobilized on a MOF-modified electrode. The enzymatic hydrolysis of acetylcholine produces thiocholine, which generates a detectable electrochemical current. The presence of OPPs inhibits AChE activity, leading to a reduction in the current signal that is proportional to the pesticide concentration [39] [10]. MOFs enhance this system by providing a high-surface-area matrix for enzyme loading, improving electron transfer, and sometimes exhibiting intrinsic nanozyme activity that amplifies the signal.
The following diagram illustrates the core workflow for developing and operating a MOF-based biosensor for pesticide detection.
Experimental Protocols for Key Methodologies
This section provides detailed methodologies for fabricating and applying MOF-based biosensors, focusing on electrochemical and fluorescent platforms.
Protocol: Fabrication of an Electrochemical MOF-Biosensor for Organophosphorus Pesticides
This protocol outlines the steps to create an acetylcholinesterase (AChE)-inhibition-based sensor [39] [10].
- Electrode Pretreatment: Clean the glassy carbon electrode (GCE) successively with 0.3 and 0.05 µm alumina slurry on a microcloth pad. Rinse thoroughly with deionized water and ethanol, then dry under a nitrogen stream.
- MOF Suspension Preparation: Disperse 5 mg of synthesized MOF (e.g., ZIF-8 or a functionalized UiO-66) in 1 mL of DMF or water using ultrasonic agitation for 30 minutes to form a homogeneous suspension.
- Electrode Modification: Pipette 8 µL of the MOF suspension onto the pre-treated GCE surface and allow it to dry at room temperature, forming a MOF-modified electrode (MOF/GCE).
- Enzyme Immobilization: Prepare a solution of AChE (0.5 U/µL) in a phosphate buffer (pH 7.4). Cast 5 µL of this enzyme solution onto the MOF/GCE and incubate at 4°C for 12 hours to allow for covalent attachment and physical adsorption. The resulting biosensor is denoted as AChE/MOF/GCE.
- Electrochemical Measurement:
- Use the AChE/MOF/GCE as the working electrode in a standard three-electrode system.
- First, record the amperometric current response in a solution containing the substrate (acetylthiocholine). This serves as the baseline signal (I₀).
- Then, incubate the biosensor in a sample solution containing the target OPP (e.g., parathion) for 10 minutes.
- Rinse the electrode gently and record the amperometric current response again (I).
- The percentage of inhibition is calculated as (I₀ - I)/I₀ × 100%, which is correlated to the pesticide concentration via a pre-established calibration curve.
Protocol: Fluorescent MOF Sensor for Pesticide Detection
This protocol describes a direct detection method using a fluorescent MOF probe [40] [41].
- Synthesis of Luminescent MOF: A MOF with strong luminescence (e.g., Ln-MOF like Tb-MOF or a Zr-MOF with fluorescent linkers) is synthesized via a solvothermal method. For example, combine the metal salt (e.g., TbCl₃) and organic linker (e.g., 1,3,5-benzenetricarboxylic acid) in a DMF/water mixture in a Teflon-lined autoclave. Heat at 120°C for 24 hours, then cool slowly to room temperature. Collect the crystals via centrifugation, and wash several times with DMF and ethanol, then activate under vacuum.
- Sensor Probe Preparation: Disperse 2 mg of the activated luminescent MOF in 10 mL of ethanol under sonication to form a stable colloidal probe solution.
- Detection Procedure:
- Add 1 mL of the MOF probe solution into a standard quartz cuvette.
- Record the initial fluorescence emission spectrum (λ_ex = 330 nm) to obtain the baseline intensity (F₀).
- Spike the cuvette with incremental volumes of the standard pesticide solution (e.g., a carbamate pesticide), mixing thoroughly after each addition.
- Record the fluorescence spectrum after each addition.
- The fluorescence intensity (F) will be quenched ("turn-off") upon interaction with the pesticide. Plot F₀/F versus pesticide concentration to generate the calibration curve.
- Selectivity Testing: To validate specificity, repeat the detection procedure with other potential interfering compounds (e.g., metal ions, other pesticides) and compare the quenching efficiency.
Table 2: Essential Research Reagents and Materials for MOF-Based Biosensor Development
| Reagent/Material | Function and Role in Biosensing |
|---|---|
| ZIF-8 (Zeolitic Imidazolate Framework-8) | A water-stable MOF with high surface area; commonly used for enzyme immobilization, providing a protective microenvironment that enhances enzymatic stability [39]. |
| UiO-66 Series MOFs | Known for exceptional chemical and thermal stability; easily functionalized with groups like -NH₂, making it a versatile platform for covalent bioconjugation [41]. |
| Acetylcholinesterase (AChE) | A key biorecognition element in inhibition-based biosensors for organophosphorus and carbamate pesticides [39] [10]. |
| Nucleic Acid Aptamers | Synthetic single-stranded DNA/RNA molecules that bind specific pesticide targets with high affinity; offer advantages of stability and reusability over antibodies [10]. |
| Gold Nanoparticles (AuNPs) | Often used in composite with MOFs to enhance electrical conductivity in electrochemical sensors or to act as SERS substrates for signal amplification [40] [3]. |
| Graphene Oxide (GO) | Combined with MOFs to form composites that improve electrical conductivity, mechanical strength, and adsorption capacity, leading to lower detection limits [10]. |
Advanced Material Considerations: MOF-Composites and Functionalization
To overcome limitations such as low electrical conductivity or to introduce new functionalities, MOFs are often engineered into composite materials.
MOF-Composites for Signal Amplification: Integrating MOFs with conductive materials is a common strategy for electrochemical sensors. Composites of MOFs with graphene oxide or carbon nanotubes create a synergistic effect where the MOF provides a high density of recognition sites and the carbon material facilitates rapid electron transfer, resulting in significantly enhanced sensitivity [10]. Similarly, combining MOFs with gold nanoparticles can introduce plasmonic properties or catalytic activity, useful for both optical and electrochemical sensing [40].
Functionalization with Open Metal Sites (OMS): MOFs with OMS are created by removing terminal solvent molecules from the metal clusters, creating unsaturated coordination sites. These OMS act as strong Lewis acid centers that can selectively interact with Lewis basic functional groups (e.g., phosphoryl groups in OPPs, amino groups) [42]. This specific interaction provides a powerful recognition mechanism that can work in tandem with biomolecular recognition, boosting the sensor's selectivity in complex samples like food extracts or biological fluids.
The following diagram illustrates how a functionalized MOF with OMS interacts with a target pesticide molecule to produce a detectable signal.
MOF-based biosensors represent a significant leap forward in pesticide detection technology, directly addressing the need for highly sensitive, stable, and portable analytical tools. Their tunable porosity and surface chemistry allow for the design of interfaces that greatly enhance the performance of traditional biosensors. While challenges remain in scalability, long-term stability in real-world samples, and the cost of some sophisticated MOF syntheses, the future of the field is bright [40] [39]. The integration of MOFs with other advanced technologies, such as microfluidic chips for automated fluid handling, artificial intelligence for data analysis, and the development of multi-analyte detection arrays, is poised to create next-generation sensing systems [3] [10]. These systems will be capable of comprehensive monitoring across the entire "farm-to-fork" supply chain, ultimately providing a more effective safeguard for environmental and food safety.
Optical biosensors have emerged as powerful analytical tools for the detection of pesticide residues, addressing critical needs in food safety and environmental monitoring. These sensors leverage the interaction between light and matter to transduce a biological recognition event into a quantifiable signal. Within this domain, fluorescence, colorimetric, and Surface-Enhanced Raman Spectroscopy (SERS) platforms have garnered significant attention due to their high sensitivity, potential for portability, and rapid response times. This whitepaper provides an in-depth technical examination of these three optical biosensing platforms, detailing their operational principles, experimental protocols, and performance metrics, framed within the broader context of biosensor research for pesticide detection. The drive towards these technologies stems from the limitations of conventional methods like chromatography and mass spectrometry, which, while highly accurate, are often cumbersome, expensive, and unsuitable for on-site analysis [43] [3].
Fluorescence-Based Biosensors
Principles and Signaling Mechanisms
Fluorescence biosensors operate on the principle of detecting changes in fluorescence intensity, wavelength, or lifetime resulting from the interaction between a biorecognition element and the target pesticide. A common mechanism is enzyme inhibition. For instance, organophosphorus pesticides (OPs) can inhibit enzymes such as acetylcholinesterase (AChE) or alkaline phosphatase (ALP). The loss of enzymatic activity leads to a reduction in the generation of a fluorescent product, providing a quantifiable signal that is inversely proportional to the pesticide concentration [44] [4].
A specific innovative approach involves the ALP-mediated hydrolysis of L-ascorbic acid 2-phosphate sesquimagnesium salt hydrate (AAP) to L-ascorbic acid (AA). The generated AA then reacts with o-phenylenediamine (OPD) to form a highly fluorescent compound, 3-(1,2-dihydroxyethyl)furo[3,4-b]quinoxalin-1(3H)-one (DFQ). The presence of OPs inhibits ALP, thereby decreasing the production of AA and DFQ, and leading to a drop in fluorescence intensity [44] [45].
Detailed Experimental Protocol
The following workflow delineates the protocol for detecting malathion (a model OP) using the ALP-based fluorescence biosensor [44]:
- Solution Preparation:
- Prepare a solution containing ALP enzyme in a suitable buffer (e.g., Tris-HCl buffer).
- Prepare substrate solutions: AAP and OPD in deionized water.
- Prepare standard solutions of the target pesticide (e.g., malathion) in an appropriate solvent.
- Inhibition and Reaction Incubation:
- Mix a fixed concentration of the ALP enzyme with varying concentrations of the pesticide standard. Incubate for a predetermined time (e.g., 15-30 minutes) to allow for enzyme inhibition.
- Add the substrate AAP to the mixture and incubate further. If ALP is not inhibited, it will hydrolyze AAP to produce AA.
- Add OPD to the reaction mixture. The generated AA will react with OPD to form the fluorescent DFQ.
- Signal Measurement and Transduction:
- Transfer the solution to a cuvette or a microplate.
- Using a conventional spectrofluorometer: Measure the fluorescence emission intensity at the characteristic wavelength of DFQ (e.g., 425 nm) upon excitation at the suitable wavelength.
- Using a portable smartphone-based device: Place the sample in a custom-built portable fluorescence device. The device uses an excitation light source (e.g., an LED) and an appropriate filter to isolate the emission light. A smartphone camera, controlled by a dedicated application, captures the fluorescence image and instantly converts it into Red-Green-Blue (RGB) intensity values for quantification. This portable approach has been reported to offer a sensitivity over 70 times higher than conventional spectrofluorometers [44].
- Quantification:
- Construct a calibration curve by plotting the fluorescence intensity (or the corresponding RGB value) against the logarithm of the pesticide concentration. The decrease in signal is proportional to the pesticide concentration in the sample.
The diagram below illustrates the signaling pathway and experimental workflow.
Performance Metrics
The developed fluorescence biosensor for malathion detection demonstrated the following analytical performance [44]:
- Detection Limit: 0.05 ppm
- Linear Range: 0.1 - 1 ppm
- Practical Application: Successfully applied to the detection of OPs in vegetable samples, with results validating well against the standard HPLC method.
Colorimetric Biosensors
Principles and Signaling Mechanisms
Colorimetric biosensors translate the presence of a target analyte into a visible color change, detectable by the naked eye or simple spectrophotometers. The integration with smartphones for RGB analysis further enhances their quantitative capability for on-site use [43]. A prevalent mechanism in pesticide detection is the enzyme inhibition-based colorimetric assay. The activity of AChE is central to this process. In a typical system:
- In the absence of pesticide, AChE catalyzes the hydrolysis of its substrate, acetylthiocholine (ATCh), to produce thiocholine.
- Thiocholine can then cause a color change, for example, by reducing yellow Au³⁺ to red Au⁰ nanoparticles, leading to a visible color shift, or by inducing the aggregation of pre-synthesized gold nanoparticles (AuNPs) [43].
- In the presence of OPs or carbamates, AChE is inhibited, reducing the production of thiocholine. Consequently, the color change is suppressed, providing a direct visual readout of the pesticide concentration.
Detailed Experimental Protocol
The following protocol describes a colorimetric biosensor using AuNPs and AChE inhibition [43]:
- Synthesis of AuNPs: Prepare gold nanoparticles, typically by the citrate reduction method of chloroauric acid, resulting in a stable red dispersion.
- Assay Execution:
- Control Reaction (No Pesticide): Incubate AChE with its substrate, ATCh. The enzymatic hydrolysis produces thiocholine. Add this mixture to the AuNPs solution. Thiocholine induces AuNP aggregation via Au-S bonds, causing a color change from red to blue.
- Test Reaction (With Pesticide): Pre-incubate AChE with the sample containing the pesticide for a fixed period (e.g., 10-20 minutes). Then, add ATCh. The inhibited enzyme produces less or no thiocholine. When this mixture is added to the AuNPs, the aggregation is minimized, and the solution remains red.
- Signal Measurement and Transduction:
- Visual Inspection: Directly observe the color change. A blue color indicates a negative result (no pesticide), while a red color indicates a positive result (pesticide present).
- Spectrophotometric Quantification: Measure the UV-Vis absorbance spectrum of the solutions. The control (aggregated AuNPs) will show a redshift in the surface plasmon resonance (SPR) peak compared to the test sample.
- Smartphone Quantification: Capture an image of the assay solution under consistent lighting conditions using a smartphone. A dedicated application analyzes the RGB values of the image, correlating the specific color channel intensity (e.g., the Red value) with the pesticide concentration.
The logical relationship of the colorimetric assay is summarized below.
Performance Metrics
Colorimetric biosensors offer varying performance based on the substrate and assay design. A paper-based biosensor (PesticidePAD) reported the following performance using different substrates [46]:
- With Indoxyl Acetate (IOA): Limit of Detection (LOD) = 0.09 ppm for ethyl-paraoxon.
- With Acetylthiocholine (ATCh): Broader detection range of 1.56 - 100 ppm.
Surface-Enhanced Raman Spectroscopy (SERS) Platforms
Principles and Signaling Mechanisms
SERS is a powerful vibrational spectroscopy technique that provides a dramatic enhancement of the Raman scattering signal from molecules adsorbed on or in close proximity to nanostructured metallic surfaces, typically gold or silver. The enhancement arises from two primary mechanisms: an electromagnetic effect (due to localized surface plasmon resonances) and a chemical effect (due to charge transfer). SERS allows for the ultrasensitive, label-free detection of pesticides by providing their unique vibrational "fingerprint" [47] [48]. Each pesticide molecule has a distinct SERS spectrum, enabling direct identification and quantification without the need for extensive sample preparation or labeling.
Detailed Experimental Protocol
The following protocol outlines the steps for SERS-based detection and imaging of pesticides on fruit surfaces [47]:
- Substrate Preparation: Synthesize or commercially procure SERS-active substrates. A common method is the synthesis of gold nanoparticles (AuNPs) or silver nanoparticles (AgNPs) as colloidal sols. Alternatively, solid substrates with nanostructured surfaces can be fabricated.
- Sample Preparation and Extraction:
- For solid samples like fruits, a simple extraction can be performed. A swab dipped in a solvent (e.g., ethanol) can be wiped across the fruit surface to collect pesticide residues. The swab is then immersed in a solvent to elute the residues.
- Alternatively, the SERS substrate (e.g., a silicon wafer coated with AuNPs) can be directly pressed onto the fruit surface to extract and measure the pesticides in a single step.
- SERS Measurement:
- Mix the extracted sample with the nanoparticle sol, or drop-cast the sample onto the solid SERS substrate. Allow the analyte molecules to adsorb onto the metal surface.
- Place the sample under the Raman microscope.
- Focus the laser beam (e.g., a 785 nm or 633 nm laser) onto the sample.
- Collect the scattered light and disperse it with a spectrometer onto a CCD detector to acquire the SERS spectrum.
- SERS Imaging:
- To map the distribution of pesticide residues, configure the system for hyperspectral imaging.
- Raster-scan the laser spot across a defined area of the sample surface.
- At each pixel, a full SERS spectrum is recorded.
- Generate a false-color image by integrating the intensity of a characteristic Raman peak of the pesticide (e.g., 413 cm⁻¹ for omethoate, 346 cm⁻¹ for chlorpyrifos) across the scanned area. This visualizes the spatial distribution of the pesticide residue [47].
- Quantification:
- Construct a calibration curve by plotting the intensity of the characteristic Raman peak against the concentration of standard pesticide solutions.
The workflow for SERS detection and imaging is as follows.
Performance Metrics
SERS provides exceptional sensitivity for pesticide detection. A study on omethoate and chlorpyrifos detection on apple surfaces established a quantitative regression model, demonstrating the technique's capability for rapid and quantitative analysis with high sensitivity, often at trace levels [47] [48].
Comparative Analysis of Optical Biosensing Platforms
The table below summarizes the key characteristics of the three optical biosensing platforms.
Table 1: Comparative Analysis of Fluorescence, Colorimetric, and SERS Biosensing Platforms
| Feature | Fluorescence Biosensors | Colorimetric Biosensors | SERS Platforms |
|---|---|---|---|
| Detection Principle | Measurement of fluorescence intensity change | Measurement of visible color change / absorbance | Measurement of enhanced Raman scattering intensity |
| Sensitivity | High (e.g., LOD 0.05 ppm for malathion) [44] | Moderate to High (e.g., LOD 0.09 ppm for paraoxon) [46] | Very High (Ultrasensitive, trace-level detection) [48] |
| Multiplexing Capability | Moderate | Low | High (due to unique spectral fingerprints) |
| Quantification Ease | Excellent (with spectrometer or smartphone) | Excellent (naked eye & smartphone RGB) | Excellent (requires spectrometer) |
| Portability Potential | High (with smartphone integration) [44] | Very High (naked eye readout) [43] [46] | Moderate (systems are becoming more portable) |
| Label Requirement | Often requires fluorescent labels/probes | Often label-free (intrinsic NP color) | Largely label-free |
| Key Advantage | High sensitivity, adaptable to portable devices | Simplicity, low cost, rapid on-site screening | Provides molecular fingerprint, high specificity & sensitivity |
The Scientist's Toolkit: Essential Research Reagents and Materials
Table 2: Key Research Reagent Solutions for Optical Biosensors in Pesticide Detection
| Reagent / Material | Function in Biosensing | Example Application |
|---|---|---|
| Acetylcholinesterase (AChE) | Biorecognition element; its inhibition by OPs/carbamates is the core detection mechanism. | Colorimetric and fluorescence sensors using substrates like ATCh [43] [46]. |
| Alkaline Phosphatase (ALP) | Biorecognition element; its inhibition is used for pesticide detection in fluorescence assays. | Fluorescence biosensor generating AA from AAP for subsequent reaction with OPD [44]. |
| Gold Nanoparticles (AuNPs) | Signal transducers; their aggregation or redox state change causes a visible color shift. | Colorimetric detection of thiocholine produced from AChE-catalyzed hydrolysis [43]. |
| L-ascorbic acid 2-phosphate (AAP) / o-Phenylenediamine (OPD) | Enzyme substrates; ALP hydrolyzes AAP to AA, which reacts with OPD to form a fluorescent product (DFQ). | Fluorescence "turn-off" biosensor for OPs [44]. |
| Acetylthiocholine (ATCh) / Indoxyl Acetate (IOA) | Enzyme substrates for AChE; hydrolysis products (TCh/indoxyl) induce color changes. | Paper-based biosensors (PesticidePAD) for on-site detection of AChE inhibitors [46]. |
| SERS-Active Substrates (Au/Ag NPs) | Provide massive signal enhancement for Raman scattering, enabling ultrasensitive detection. | Direct detection and imaging of pesticide residues (e.g., omethoate) on fruit surfaces [47]. |
The field of optical biosensors is rapidly evolving towards higher intelligence, integration, and field-deployability. Future advancements are anticipated in several key areas: the development of multi-analyte detection systems to screen for multiple pesticides simultaneously; the integration with microfluidic chips (lab-on-a-chip) for automated sample handling and analysis; and the application of artificial intelligence (AI) for enhanced data processing, pattern recognition, and result interpretation [49] [3]. Furthermore, the exploration of novel nanomaterials, such as MXenes and metal-organic frameworks (MOFs), promises to further enhance the sensitivity and stability of these biosensing platforms [50] [3].
In conclusion, fluorescence, colorimetric, and SERS-based optical biosensors represent a paradigm shift in pesticide detection methodology. They offer a compelling combination of sensitivity, speed, and portability, moving analysis from the central laboratory directly to the field. This aligns perfectly with the growing demand for rapid, on-site monitoring tools to ensure food safety and environmental health within a comprehensive "farm-to-fork" surveillance framework.
The increasing global reliance on pesticides in agriculture has necessitated the development of rigorous monitoring techniques to ensure food and environmental safety. While traditional laboratory-based methods such as gas chromatography (GC) and high-performance liquid chromatography (HPLC) offer high accuracy, they are constrained by expensive instrumentation, complex sample pretreatment, and the inability to perform rapid on-site analysis, particularly in resource-limited regions [51] [3]. Biosensors have emerged as a powerful alternative, providing high sensitivity, rapid response, and ease of operation. A biosensor is an analytical device that integrates a biological recognition element (e.g., enzyme, antibody, aptamer) with a physico-chemical transducer to produce a measurable signal proportional to the concentration of a target analyte [3] [16].
The integration of microfluidic technologies, especially paper-based microfluidic analytical devices (μPADs), with biosensors has catalyzed a significant shift from complex laboratory tests to compact, portable chips [51] [52]. These platforms are characterized by their low cost, minimal reagent consumption, high portability, and user-friendliness, as they often leverage capillary action to fluid movement, eliminating the need for external pumps [52]. This technical guide explores the core principles, materials, methodologies, and future directions of paper-based sensors and their microfluidic integration within the broader context of biosensor research for pesticide detection.
Core Principles and Material Foundations
Detection Mechanisms in Paper-Based Sensors
Paper-based biosensors for pesticides primarily operate on three main transduction mechanisms, each with distinct working principles and applications.
- Fluorescent Sensing: This mechanism often relies on the principle of Fluorescence Resonance Energy Transfer (FRET). A typical configuration involves a fluorescently-labeled aptamer (e.g., Cy3-labeled) adsorbed onto the surface of a quencher like Graphene Oxide (GO). In the absence of the target pesticide, the fluorescence is quenched ("off" state). Upon the introduction of the target, the aptamer undergoes a conformational change and detaches from the GO, leading to fluorescence recovery ("on" state) [51]. The resulting fluorescence intensity is quantitatively correlated with the pesticide concentration.
- Colorimetric Sensing: These sensors produce a visible color change detectable by the naked eye or a smartphone camera. The mechanism can be based on enzyme inhibition (e.g., of acetylcholinesterase) or the use of chromogenic reagents. The integration with smartphones allows for the quantification of color intensity by analyzing the Red, Green, Blue (RGB) values of the captured image [3].
- Electrochemical Sensing: This approach measures changes in electrical properties (current, potential, or impedance) resulting from the specific binding event between the biorecognition element and the pesticide. Electrochemical biosensors are known for their high sensitivity and suitability for miniaturization and portability [3].
Materials and Fabrication of Microfluidic Devices
The performance of a microfluidic biosensor is heavily influenced by the substrate material. The following table summarizes the common materials used and their characteristics [52].
Table 1: Materials for Microfluidic Device Fabrication
| Material | Key Characteristics | Advantages | Disadvantages |
|---|---|---|---|
| Paper (μPADs) | Porous, fibrous structure creating hydrophilic channels bounded by hydrophobic barriers. | Very low cost, biodegradable, no external pump needed (capillary action), easy functionalization. | Limited structural rigidity, can be sensitive to environmental conditions. |
| Polydimethylsiloxane (PDMS) | An elastomeric polymer. | Optically transparent, gas-permeable, biocompatible, easy to mold. | Can cause non-specific adsorption of proteins and small molecules. |
| Polymethylmethacrylate (PMMA) | A rigid, thermoplastic polymer. | Excellent optical clarity, good chemical resistance, low cost. | Fabrication can involve high temperatures; bonding can be challenging. |
| Glass | Inorganic, rigid material. | Excellent optical transparency, high chemical resistance, inert surface. | Brittle, complex and expensive fabrication process. |
Paper-based devices are typically fabricated using techniques such as wax printing, inkjet printing, or photolithography to define hydrophobic barriers that create precise hydrophilic channels and reaction zones [52]. For more complex multi-layer structures, as demonstrated in a sensor for omethoate, a larger pore-size glass-microfiber filter paper can be used as a sample dispensing layer stacked atop a smaller pore-size nitrocellulose (NC) membrane detection layer. This design effectively filters out potential interferents, including the intrinsic fluorescence of materials like GO, ensuring a cleaner signal [51].
Experimental Protocols and Workflows
Detailed Protocol: Fabrication and Operation of a Fluorescent Paper Sensor for Omethoate
The following workflow delineates the experimental procedure for developing a microfluidic paper-based fluorescent sensor for the organophosphorus pesticide omethoate, integrated with a smartphone platform [51].
- Probe Preparation: Prepare the fluorescent "off-on" probe by incubating the Cy3-labeled aptamer (Cy3-APT) with a graphene oxide (GO) solution. The Cy3-APT adsorbs onto the GO surface via π-π stacking, leading to the initial quenching of the Cy3 fluorescence.
- Sensor Fabrication:
- Construct a two-layer microfluidic paper strip.
- The sample dispensing layer consists of a glass-microfiber filter paper with larger pores.
- The detection layer is a nitrocellulose (NC) membrane with smaller pores.
- Immobilize the pre-formed Cy3-APT/GO probe complex onto the detection zone of the NC membrane.
- Sample Assay:
- Dispense the sample solution (e.g., extracted from a food matrix) onto the dispensing layer.
- The solution migrates via capillary action to the detection layer.
- If omethoate is present, it specifically binds to the aptamer, causing the Cy3-APT to detach from the GO surface.
- This detachment results in the recovery of Cy3 fluorescence.
- Signal Acquisition and Analysis:
- Place the reacted sensor strip into a 3D-printed smartphone-based sensing platform. This platform typically houses a uniform LED light source for excitation and a filter to isolate the emission light.
- Use the smartphone camera to capture an image of the fluorescent detection zone.
- Analyze the image using a custom-developed smartphone application embedded with a pre-trained Convolutional Neural Network (CNN) model, such as an improved LeNet model.
- The app directly outputs the omethoate concentration, achieving a high regression coefficient (R² = 0.9964) across a range of 0–750 nM. The entire process from sample application to result is completed in less than 10 minutes [51].
Figure 1: Workflow of a fluorescent paper sensor for omethoate detection.
Performance Comparison of Biosensing Technologies
The selection of a biosensing platform depends on the specific requirements of the application. The table below provides a comparative overview of different biosensor types used for pesticide detection.
Table 2: Performance Comparison of Biosensor Technologies for Pesticide Detection
| Sensor Type | Detection Principle | Typical Analytes | Advantages | Limitations |
|---|---|---|---|---|
| Fluorescent | Fluorescence intensity change (e.g., FRET) | Omethoate, other OPs [51] | High sensitivity, suitable for multiplexing. | Can be susceptible to background fluorescence. |
| Electrochemical | Change in electrical properties | Organophosphates, carbamates [3] | Very high sensitivity, low cost, compact size. | Sensor surface can foul over time. |
| Colorimetric | Visible color change | Various pesticides [3] | Simple, low-cost, visual readout. | Lower sensitivity than other methods. |
| Surface-Enhanced Raman Spectroscopy (SERS) | Enhancement of Raman signal by plasmonic nanostructures | Various pesticides [16] | Fingerprint identification, multi-residue capability. | Requires complex substrate fabrication. |
The Scientist's Toolkit: Essential Research Reagents and Materials
Successful development of these biosensing platforms requires a suite of specific biological and chemical reagents. The following table details key components and their functions in a typical experiment.
Table 3: Essential Research Reagents and Materials for Biosensor Development
| Item | Function/Description | Application Example |
|---|---|---|
| Aptamers | Single-stranded DNA or RNA oligonucleotides that bind to a specific target with high affinity; serve as biorecognition elements. | Cy3-labeled aptamer for omethoate detection [51]. |
| Graphene Oxide (GO) | A two-dimensional nanomaterial that acts as an efficient fluorescence quencher in FRET-based assays. | Fluorescence quencher for Cy3-aptamer [51]. |
| Nitrocellulose (NC) Membrane | A microporous membrane used as the substrate in paper-based sensors for protein/aptamer immobilization. | Detection layer in microfluidic paper strips [51]. |
| Gold Nanoparticles (AuNPs) | Metallic nanoparticles used as colorimetric labels, electrode modifiers, or SERS substrates. | Signal amplification in colorimetric and electrochemical sensors [16]. |
| Specific Antibodies | Immunoglobulin molecules that bind to a unique pesticide or a class of pesticides. | Biorecognition element in immunoassays and immunosensors [3] [16]. |
| Enzymes (e.g., AChE) | Acetylcholinesterase; its inhibition by OPs/carbamates is a common detection mechanism. | Used in enzyme inhibition-based sensors [3]. |
| Fluorescent Dyes (e.g., Cy3) | Molecules that absorb and emit light at specific wavelengths, used as signal tags. | Fluorescent label for aptamers in "off-on" sensors [51]. |
Future Outlook and Emerging Trends
The field of portable biosensors for pesticide detection is rapidly evolving, driven by advancements in nanotechnology, material science, and data analytics. Key future trends include:
- Multi-analyte Detection: The development of multiplexed platforms capable of simultaneously detecting several pesticide residues in a single assay run is a major focus. Microfluidic devices are ideally suited for this, as they can incorporate multiple detection channels on one chip [3] [52].
- Advanced Data Integration and Portability: The integration of biosensors with smartphones and other portable devices will continue to advance. The use of deep learning algorithms, such as Convolutional Neural Networks (CNNs) for image analysis, will further enhance detection accuracy, automate result interpretation, and minimize the need for manual intervention [51] [3].
- Novel Nanomaterials and Sensing Modalities: Exploration of new signal amplification strategies using nanomaterials like metal-organic frameworks (MOFs) and quantum dots (QDs) will improve sensitivity [3]. Furthermore, the combination of multiple detection techniques (e.g., photoelectrochemical, dual-mode sensors) into a single platform is an emerging trend to improve reliability and provide cross-verification of results [52].
- System Integration and Automation: Future research will focus on creating fully integrated "sample-in-answer-out" systems that automate the entire process, from sample preparation to final readout, making the technology more robust and user-friendly for field applications [52].
Figure 2: Emerging trends and future directions for portable pesticide sensors.
In conclusion, the integration of paper-based sensors with microfluidic technology represents a paradigm shift in pesticide detection, moving analysis from centralized laboratories to the point of need. Continued innovation in biorecognition elements, sensor materials, and data processing algorithms promises to deliver even more powerful, affordable, and connected tools for ensuring global food safety and environmental health.
Overcoming Technical Hurdles: Stability, Specificity, and Performance Enhancement
Addressing the Instability of Natural Enzymes and Biological Elements
A biosensor is an analytical device that converts the concentration of a biological analyte into a measurable signal, typically comprising a bioreceptor for target recognition, a transducer for signal conversion, and electronic components for signal processing [53]. In the specific context of pesticide detection, enzyme-based biosensors are particularly valuable as many pesticides function by inhibiting key enzymatic processes, allowing detection based on the compound's toxicity [5]. However, the widespread deployment of these biosensors, especially for on-site monitoring in environmental and food safety applications, is hampered by one critical limitation: the inherent instability of natural enzymes and biological elements [1] [54].
Natural enzymes, while offering high catalytic efficiency and specificity, possess weak anti-interference ability, are difficult to recycle, and are highly susceptible to denaturation when exposed to fluctuations in temperature, pH, or organic solvents [1] [54]. This instability directly impacts the key performance metrics of a biosensor, including its operational lifetime, reproducibility, and accuracy [53]. Consequently, developing strategies to enhance the stability of these biological recognition elements is a central research focus within the field of biosensors for pesticide detection. This guide provides an in-depth technical examination of the materials and methodologies currently employed to address this fundamental challenge.
Core Strategies for Stabilization
The instability of biological elements in biosensors can be mitigated through several advanced approaches. The primary strategies involve the use of novel nanostructured materials for immobilization and the development of artificial enzyme mimics.
Advanced Materials for Enzyme Immobilization
Immobilizing enzymes within or onto a supportive matrix is a cornerstone technique for enhancing their stability. This process protects the enzyme's three-dimensional structure, reduces leaching, and often allows for reuse.
Table 1: Nanomaterials for Stable Biosensor Interfaces
| Material Category | Example Materials | Key Properties | Function in Stabilization |
|---|---|---|---|
| Metallic Nanomaterials | Gold Nanoparticles (AuNPs), ZnO Nanoparticles, MoS2 nanosheets [54] | Good microenvironment, large specific surface area, high conductivity, good biocompatibility, high isoelectric point (e.g., ZnO = 9.5) [54] | Provides ideal immobilization platform; enhances electron transfer; protects enzymatic activity. |
| Carbon-Based Nanomaterials | Graphene Oxide (GO), Carbon Nanotubes, reduced Graphene Oxide (RGO) [54] | Large surface area, high electrocatalytic activity, numerous edge-plane-like defects, high electrical conductivity [54] | Offers a stable platform for biomolecule loading; accelerates electron transfer. |
| Polymeric & Composite Materials | Chitosan (CS), Polyaniline (PANI), Poly 3,4-ethylenedioxythiophene (PEDOT) [54] | Excellent film-forming ability, high biodegradability, good biocompatibility, can act as a binder [54] | Creates a biocompatible intermedium layer; forms a protective 3D network around enzymes. |
Metal-Organic Frameworks (MOFs) as Versatile Platforms
MOFs are crystalline porous materials formed by metal ions and organic ligands. Their unique properties make them exceptionally suitable for stabilizing biological elements [1]. MOF-based composites can be categorized based on their design:
- MOF-based Enzyme Composites: Here, MOFs act as protective carriers for natural enzymes. A prominent method is one-pot encapsulation (de novo synthesis), where enzymes are mixed during the MOF synthesis process, leading to their entrapment within the MOF crystals. This method forms a protective armor around the enzyme, significantly enhancing its stability against harsh conditions [1].
- MOF-based Nanozymes: In this approach, the MOFs themselves function as enzyme mimics or nanozymes [1]. This strategy bypasses the instability of natural enzymes altogether by using the MOF's catalytic centers, which are often more robust, to mimic the activity of natural enzymes like peroxidase or oxidase for sensing applications [1].
Biomolecular Motors and Alternative Bioreceptors
Beyond enzymes, other biological elements like antibodies and DNA aptamers are used as bioreceptors. Their stability is equally critical. Emerging research explores the use of biomolecular motors (e.g., kinesin, dynein, DNA polymerase) in detection systems. These molecular machines offer unique signal conversion mechanisms and high energy conversion efficiencies, and through rational design, they can enable precise and efficient detection [55]. Furthermore, the use of genetically engineered mutant enzymes with enhanced stability or tailored sensitivity profiles is a growing trend, particularly in array-type sensors for discriminating between different pesticides [5].
Detailed Experimental Protocols
This section outlines specific methodologies for implementing the stabilization strategies discussed above.
Protocol 1: One-Pot Encapsulation of Enzymes in MOFs
This protocol describes the co-precipitation method for encapsulating an enzyme (e.g., acetylcholinesterase for pesticide detection) within a zeolitic imidazolate framework (ZIF-8).
Materials:
- Enzyme Solution: Acetylcholinesterase (AChE) in a suitable buffer (e.g., 10 mM phosphate buffer, pH 7.4).
- Zinc Salt Precursor: 25 mM Zinc nitrate hexahydrate (Zn(NO3)2·6H2O).
- Organic Linker Solution: 50 mM 2-Methylimidazole (2-Melm) in buffer.
- Centrifugation Equipment.
Procedure:
- Preparation: Mix the AChE enzyme solution with the Zinc nitrate solution in a 1:1 volume ratio and vortex briefly.
- Reaction Initiation: Rapidly add an equal volume of the 2-Methylimidazole solution to the mixture. Vortex for 60 seconds to ensure thorough mixing.
- Crystallization and Encapsulation: Allow the reaction to proceed at room temperature for 1 hour. During this period, the ZIF-8 framework will crystallize, encapsulating the AChE molecules in situ.
- Product Recovery: Centrifuge the resulting milky suspension at 8,000 rpm for 5 minutes to collect the AChE@ZIF-8 composite.
- Washing and Storage: Wash the pellet three times with deionized water to remove unencapsulated enzyme and residual reactants. The final AChE@ZIF-8 composite can be re-dispersed in buffer and stored at 4°C for further use in electrode modification [1].
The following workflow diagram illustrates this encapsulation process:
Protocol 2: Construction of a Nanozyme-Based Electrochemical Sensor
This protocol details the creation of an electrode modified with a MOF nanozyme for the detection of pesticides, which often involves mimicking peroxidase activity to generate an electrochemical signal.
Materials:
- Working Electrode: Glassy Carbon Electrode (GCE, 3 mm diameter).
- MOF Nanozyme Suspension: e.g., Fe-based MIL-88B or Cu-based HKUST-1, sonicated in ethanol (1 mg/mL).
- Polishing Supplies: Alumina slurry (0.3 and 0.05 µm) and polishing cloth.
- Electrochemical Cell: Potentiostat, Ag/AgCl reference electrode, and Pt counter electrode.
Procedure:
- Electrode Pretreatment: Polish the GCE sequentially with 0.3 µm and 0.05 µm alumina slurry on a microcloth to a mirror finish. Rifice thoroughly with deionized water and then ethanol. Dry under a stream of nitrogen gas.
- Electrode Modification: Deposit 5 µL of the well-dispersed MOF nanozyme suspension onto the clean, dry surface of the GCE. Allow the solvent to evaporate at room temperature, forming a uniform film.
- Sensor Assembly and Testing: Assemble the three-electrode system in an electrochemical cell containing a suitable buffer and the substrate (e.g., H2O2 or TMB). The MOF nanozyme will catalyze the oxidation of the substrate. The subsequent electrochemical reduction of the oxidized product can be measured using techniques like amperometry or differential pulse voltammetry (DPV).
- Pesticide Detection: Introduce the pesticide sample. Certain pesticides (e.g., organophosphates) may inhibit the nanozyme's activity. The resulting decrease in the electrochemical signal is proportional to the pesticide concentration, enabling quantification [1].
The Scientist's Toolkit: Key Reagents and Materials
Table 2: Essential Research Reagents for Stabilization Strategies
| Reagent/Material | Function/Explanation | Example Use Case |
|---|---|---|
| Gold Nanoparticles (AuNPs) | Provide high surface area and biocompatibility for enzyme adsorption; facilitate electron transfer in electrochemical biosensors. | Immobilization of acetylcholinesterase on electrode surfaces for insecticide detection [54]. |
| Chitosan (CS) | A natural biopolymer used to form stable, biocompatible hydrogel films on sensor surfaces, entrapping enzymes. | Creating a Graphene Oxide-Chitosan composite interface for stable antigen immobilization [54]. |
| Zeolitic Imidazolate Framework-8 (ZIF-8) | A type of MOF known for its mild synthesis conditions and high stability, ideal for enzyme encapsulation. | One-pot encapsulation of enzymes for protection against thermal denaturation and protease digestion [1]. |
| Genetically Engineered Enzymes | Mutant enzymes (e.g., AChE from Drosophila melanogaster) with enhanced stability or tailored inhibitor sensitivity. | Used in sensor arrays with chemometrics to discriminate between different pesticide classes [5]. |
| 1-Ethyl-3-(3-dimethylaminopropyl)carbodiimide (EDC)/N-Hydroxysuccinimide (NHS) | Crosslinking agents that activate carboxyl groups for covalent bonding with amine groups on enzymes or antibodies. | Covalent immobilization of antibodies on functionalized SERS platforms or electrode surfaces [56]. |
The instability of natural enzymes and biological elements represents a significant bottleneck in the practical application of biosensors for pesticide detection. However, as detailed in this guide, a multifaceted arsenal of strategies is available to researchers to address this challenge. The integration of advanced nanomaterials like MOFs, graphene, and metal nanoparticles provides a robust physical and chemical environment for biological elements. Furthermore, techniques such as one-pot encapsulation and the development of stable nanozymes offer powerful pathways to significantly extend operational lifespans and enhance sensor robustness. The continued evolution of these stabilization methodologies, coupled with the rational design of interfaces and the use of engineered proteins, is paving the way for the development of next-generation biosensors that are reliable, sensitive, and deployable in real-world settings for environmental and food safety monitoring.
Strategies for Enhancing Specificity in Complex Matrices
Biosensors, defined as analytical devices that integrate a biological recognition element with a physicochemical transducer, represent a powerful tool for the rapid detection of pesticide residues in food and environmental samples [3] [10]. A significant hurdle in transforming these tools from laboratory prototypes to reliable field-deployable instruments is achieving high specificity within complex matrices. Complex samples such as tea, fruits, and vegetables contain innumerable interfering substances—including polyphenols, alkaloids, pigments, and other organic compounds—that can obscure signal detection, cross-react with recognition elements, or foul the sensor surface, leading to false positives or negatives [3] [5]. Specificity, the sensor's ability to accurately identify and quantify a target analyte amid this background noise, is therefore paramount. This guide details advanced strategies to enhance biosensor specificity, focusing on the refinement of biorecognition elements, sophisticated sensor design, sample pre-treatment protocols, and data processing techniques, providing researchers with a comprehensive toolkit for developing robust analytical platforms.
Foundational Strategies: Biorecognition and Immobilization
The foundation of a specific biosensor lies in the selection and engineering of its biorecognition element and its stable integration onto the transducer surface.
Advanced Biorecognition Elements
Moving beyond conventional enzymes and antibodies can dramatically improve specificity and stability. The key is to select a receptor whose intrinsic affinity and selectivity align with the desired application.
Table 1: Biorecognition Elements for Enhanced Specificity
| Biorecognition Element | Mechanism of Action | Key Advantage for Specificity | Example Target(s) |
|---|---|---|---|
| Genetically Engineered Mutant Enzymes [5] | Site-directed mutagenesis of active sites to alter affinity profiles. | Enables discrimination between members of the same pesticide class (e.g., paraoxon vs. malaoxon) [5]. | Organophosphates, Carbamates |
| Nucleic Acid Aptamers [10] | Folding into specific 3D structures that bind targets with high affinity. | In vitro selection (SELEX) generates receptors for targets without natural binders; minimal batch-to-batch variation. | Small molecules, antibiotics |
| Molecularly Imprinted Polymers (MIPs) [10] | Synthetic polymers with cavities complementary to the target molecule in shape, size, and functional groups. | High chemical stability; resistance to harsh matrices where biological elements would denature. | Triazines, Glyphosate |
| Recombinant Antibodies (e.g., scFv) [57] | Engineered antibody fragments. | Smaller size can allow for higher density immobilization; can be engineered for improved kinetics. | Viral proteins, Macromolecules |
Precision Immobilization Techniques
The method of tethering the biorecognition element to the transducer is critical. It must preserve the element's activity, prevent leaching, and orient the active site towards the sample solution to maximize analyte capture. Covalent immobilization using crosslinkers like EDC/NHS (1-Ethyl-3-(3-dimethylaminopropyl)carbodiimide / N-Hydroxysuccinimide) on a well-structured self-assembled monolayer (SAM) provides a stable and reproducible platform [57]. Alternatively, affinity-based immobilization, such as using a biotin-streptavidin bridge, ensures a uniform and favorable orientation, which can significantly enhance the effective specificity and sensitivity of the sensor [57].
Experimental Protocol: Specificity Profiling with Mutant Enzyme Arrays
The following protocol details a method for using arrays of engineered enzymes to achieve highly specific discrimination between similar pesticides, as demonstrated for organophosphates [5].
Objective: To quantitatively discriminate between two organophosphates, chlorpyriphos-oxon and malaoxon, in a binary mixture using an array of two genetically engineered acetylcholinesterase (AChE) mutants.
Principle: Different mutant enzymes, derived from Drosophila melanogaster, exhibit distinct inhibition profiles (characterized by inhibition constants, k_i) for different insecticides. The unique pattern of inhibition across the array, when deconvoluted with chemometrics, provides a fingerprint for each analyte [5].
Materials & Reagents
- Enzymes: AChE mutants B4 and B394 from Drosophila melanogaster [5].
- Analytes: Standard solutions of chlorpyriphos-oxon and malaoxon in appropriate solvent (e.g., methanol).
- Buffer: 0.1 M Phosphate Buffer Saline (PBS), pH 7.4.
- Substrate: Acetylthiocholine (ATCh).
- Chromogenic Reagent: 5,5'-Dithiobis(2-nitrobenzoic acid) (DTNB, Ellman's reagent).
- Apparatus: Multi-well plate reader, electrochemical workstation with multi-channel capability, or automated flow analysis system [5].
Procedure
- Sensor Fabrication: Immobilize the two mutant enzymes (B4 and B394) separately on distinct electrodes of a multi-electrode chip or in different wells of a microplate.
- Baseline Activity Measurement:
- To each sensor, add the substrate solution (ATCh in PBS with DTNB).
- Monitor the initial rate of enzymatic reaction for 2-5 minutes. For optical detection, track the increase in absorbance at 412 nm from the hydrolyzed TNB product. For electrochemical detection, monitor the oxidation current of thiocholine.
- Record this value as the uninhibited reaction rate (V_0).
- Inhibition Phase:
- Incubate the sensors with the sample containing the pesticide mixture for a fixed time (e.g., 10-15 minutes).
- Rinse the sensors thoroughly with buffer to remove unbound analytes.
- Inhibited Activity Measurement:
- Re-measure the enzymatic reaction rate as in Step 2.
- Record this value as the inhibited reaction rate (V_i).
- Data Calculation and Analysis:
- Calculate the percentage of inhibition (I%) for each enzyme variant using the formula: I% = [1 - (Vi / V0)] × 100.
- Input the two inhibition values (from B4 and B394) into a pre-calibrated Artificial Neural Network (ANN) model. The ANN, trained with a set of known standard mixtures, will output the predicted concentration of each pesticide in the sample.
Workflow Visualization
Advanced Enhancement Strategies
Physical and Chemical Sample Pre-Treatment
Mitigating matrix effects begins before the sample even contacts the sensor. Effective pre-treatment cleans up the sample and can pre-concentrate the analyte, improving the signal-to-noise ratio [58]. Solid-Phase Extraction (SPE) using cartridges functionalized with specific sorbents can selectively retain the target pesticide while letting common interferents like polyphenols and sugars pass through [10]. Centrifugation and filtration are simple yet critical steps to remove particulate matter and large colloidal particles that could non-specifically adsorb to the sensor surface [58]. For liquid samples, membrane-based preconcentration can increase the local concentration of the analyte, effectively enhancing the sensor's apparent sensitivity and specificity by ensuring the target is the dominant species interacting with the receptor [58].
Nanomaterial-Enhanced Transducer Interfaces
The integration of nanomaterials into the sensor design directly combats non-specific binding (NSB) and amplifies the specific signal. A core strategy involves using nanomaterials with antifouling properties. Coating the transducer with a layer of zwitterionic polymers, polyethylene glycol (PEG), or bovine serum albumin (BSA) creates a hydrophilic barrier that resists the adhesion of proteins and other biomolecules from complex samples [10]. Furthermore, nanomaterials like graphene oxide (GO) and metal-organic frameworks (MOFs) can be functionalized with the biorecognition element to increase the effective surface area for binding. This not only lowers the detection limit but also improves specificity by presenting a higher density of capture probes, outcompeting non-specific interactions [10].
Data Processing with Chemometrics
When physicochemical strategies reach their limit, computational methods can extract specificity from the data itself. Using an array-based sensor with multiple, slightly different recognition elements (e.g., different enzyme mutants or aptamers) generates a multivariate response pattern for each analyte or mixture [5]. Chemometric tools like Artificial Neural Networks (ANNs) or Partial Least Squares (PLS) regression are then trained to recognize these unique patterns. This approach, known as differential sensing, allows the sensor to "smell" the difference between analytes, providing a powerful method to identify and quantify specific pesticides even in the presence of unknown interferents with overlapping signals [5].
The Scientist's Toolkit: Key Reagents for Specificity
Table 2: Essential Research Reagents and Materials
| Item | Function in Enhancing Specificity | Example Use Case |
|---|---|---|
| AChE Mutant Enzymes (e.g., B394) [5] | Engineered for heightened and differential sensitivity to specific pesticide classes, enabling discrimination in mixtures. | Core element in enzyme-inhibition biosensor arrays for organophosphates. |
| Nucleic Acid Aptamers [10] | High-affinity, synthetic recognition elements selected against specific targets, reducing cross-reactivity. | Immobilized on AuNP electrodes for selective detection of small molecules in food. |
| Molecularly Imprinted Polymers (MIPs) [10] | Robust, synthetic receptors with tailor-made cavities for a specific pesticide, stable in harsh conditions. | Used as a pre-concentration filter or direct sensing layer for glyphosate in soil. |
| Artificial Neural Network (ANN) Software [5] | Chemometric tool for deconvoluting complex signals from sensor arrays to quantify individual analytes. | Processing inhibition data from a multi-enzyme biosensor to output concentrations of multiple pesticides. |
| Antifouling Coating (e.g., Zwitterionic Polymer) [10] | Forms a hydration layer that minimizes non-specific adsorption of matrix components onto the sensor. | Coating on a SPR chip surface to ensure signals originate from target binding in serum samples. |
Enhancing the specificity of biosensors in complex matrices is not a single-step solution but a multi-faceted engineering challenge. A synergistic approach is essential, combining the precision of advanced biorecognition elements like mutant enzymes and aptamers, the robustness of nanomaterial interfaces with antifouling properties, the practicality of sample pre-treatment, and the analytical power of chemometrics. By systematically applying the strategies and protocols outlined in this guide, researchers can advance biosensor technology beyond laboratory benchmarks, creating reliable, field-deployable tools that provide accurate pesticide detection in real-world samples, thereby ensuring food safety and environmental health.
Advanced Immobilization Techniques and Novel Stabilization Methods
Within the broader thesis of developing robust biosensors for pesticide detection, the immobilization of biological recognition elements is a foundational step that dictates the analytical performance and practical viability of the final device. Biosensors are composed of two intimately associated elements: a bioreceptor (an immobilized sensitive biological element like an enzyme, DNA probe, or antibody) that recognizes the analyte, and a transducer that converts the biochemical signal into an quantifiable electronic signal [59]. The method by which the bioreceptor is fixed onto the transducer surface is critical. It influences the sensor's sensitivity, selectivity, stability, and reproducibility by affecting the enzyme's orientation, loading, mobility, structure, and biological activity [59]. In the context of monitoring hazardous substances like pesticide residues in food products such as tea leaves, where effective on-site screening is limited by conventional techniques like gas chromatography, the development of biosensors with optimal immobilization strategies is paramount [3].
Core Immobilization Techniques: Mechanisms and Workflows
The choice of immobilization technique is a strategic decision in biosensor design. The following sections detail the primary methods, their mechanisms, and standardized protocols for their implementation.
Physical Adsorption
Mechanism: This simplest form of physical immobilization relies on weak bonds such as Van der Waals forces, electrostatic, and/or hydrophobic interactions between the enzyme and the solid support [59].
- Advantages: The procedure is straightforward, rapid, and inexpensive. It does not involve any chemical modification of the enzyme or support, potentially preserving the enzyme's native activity [59].
- Disadvantages: The binding is weak, leading to enzyme leakage and poor operational stability, especially under changing pH, ionic strength, or temperature [59].
Experimental Protocol: Adsorption onto Planar Surfaces
- Support Preparation: Clean the transducer surface (e.g., gold, carbon) thoroughly with solvents and oxygen plasma to ensure a contaminant-free, hydrophilic surface.
- Enzyme Solution Preparation: Dissolve the purified enzyme in a suitable buffer (e.g., 0.1 M phosphate buffer, pH 7.4). The concentration typically ranges from 0.1 to 10 mg/mL.
- Incubation: Pipette the enzyme solution onto the support surface, ensuring complete coverage. Incubate for 1-2 hours at room temperature or 4°C.
- Washing: Rinse the surface extensively with the same buffer and deionized water to remove any non-adsorbed enzyme.
- Storage: The modified biosensor can be stored dry at 4°C until use.
Covalent Bonding
Mechanism: Enzymes are bound to the support through stable covalent bonds between functional groups on the enzyme (e.g., amino, carboxyl, thiol) and reactive groups on the activated support surface [59].
- Advantages: Creates a strong, stable attachment that minimizes enzyme leaching, resulting in a biosensor with a long operational lifetime.
- Disadvantages: The chemical reactions involved can lead to enzyme denaturation, a loss of activity due to conformational changes, or blocking of the enzyme's active site if the orientation is not controlled [59].
Experimental Protocol: Covalent Immobilization using EDC/NHS Chemistry
- Surface Activation: The support surface (e.g., one with inherent carboxyl groups or modified to have them) is activated by immersion in a solution containing 2-10 mM EDC (1-Ethyl-3-(3-dimethylaminopropyl)carbodiimide) and 1-5 mM NHS (N-Hydroxysuccinimide) in a buffer like MES (0.1 M, pH 5.5-6.0) for 30-60 minutes.
- Washing: The activated surface is rinsed with a cold, weak acid solution (e.g., 10 mM HCl) to remove excess crosslinkers.
- Enzyme Coupling: The activated surface is immediately incubated with the enzyme solution (0.5-5 mg/mL in a mild buffer like PBS, pH 7.2-7.4) for 2-4 hours.
- Quenching and Washing: The surface is treated with a quenching agent (e.g., 1 M ethanolamine, pH 8.5, or 100 mM glycine) to block any remaining active esters. A final rigorous wash is performed to remove any physically adsorbed enzyme.
Entrapment
Mechanism: Enzymes are physically confined within a porous three-dimensional matrix, such as a polymer network, silica gel, or carbon paste. The matrix allows the substrate and product to diffuse through while retaining the enzyme [59].
- Advantages: Protects the enzyme from the external environment, enhancing stability. It allows for the co-immobilization of enzymes, mediators, and additives in a single step [59].
- Disadvantages: Can introduce significant diffusion barriers, leading to increased response times and reduced sensitivity. The enzyme can eventually leak out if the pore size is too large [59].
Experimental Protocol: Entrapment within a Sol-Gel Matrix
- Precursor Preparation: Mix a silica alkoxide precursor (e.g., tetramethyl orthosilicate, TMOS) with water, a solvent (e.g., ethanol), and a catalyst (e.g., HCl) under vigorous stirring to initiate hydrolysis.
- Enzyme Incorporation: Once the sol forms, mix the enzyme solution (in a pH-stable, buffer-free solution to avoid interference with gelation) with the sol gently to avoid denaturation.
- Deposition and Gelation: Pipette the enzyme-sol mixture onto the transducer surface. Allow it to gel under controlled humidity and temperature for 12-24 hours, forming a rigid, porous silica matrix encapsulating the enzyme.
- Aging and Drying: The gel is aged and then air-dried to complete the process.
Cross-Linking
Mechanism: Enzymes are immobilized by creating intermolecular bonds between enzyme molecules using bifunctional or multifunctional agents (e.g., glutaraldehyde). This can be done with enzymes alone (Cross-Linked Enzyme Aggregates, CLEAs) or in the presence of an inert protein like bovine Serum Albumin (BSA) [59].
- Advantages: Simple and creates strong, stable chemical binding.
- Disadvantages: High risk of significant activity loss due to excessive rigidity or modification of the enzyme's active site. The resulting aggregates can have poor and unpredictable mechanical properties [59].
Experimental Protocol: Enzyme Cross-Linking with Glutaraldehyde and BSA
- Mixing: Combine the enzyme solution with a 5-10% (w/v) solution of BSA in a phosphate buffer.
- Cross-Linking: Add glutaraldehyde to the mixture to a final concentration of 0.1-2.0% (v/v). Mix gently and allow it to react for 1-2 hours at room temperature until a cross-linked gel forms.
- Deposition: Apply small aliquots of the cross-linked gel onto the transducer surface.
- Curing and Washing: Allow the film to cure and dry, then wash thoroughly with buffer to remove any unreacted reagents.
Affinity Immobilization
Mechanism: This method utilizes highly specific biological interactions (e.g., avidin-biotin, lectin-carbohydrate, antibody-epitope) to immobilize the enzyme in a controlled, oriented manner [59].
- Advantages: Allows for precise orientation of the enzyme, which can maximize the accessibility of its active site to the substrate, leading to higher sensitivity and activity retention. The binding is both strong and specific [59].
- Disadvantages: Can be more complex and expensive, as it requires the enzyme or support to be modified with affinity tags (e.g., biotinylation).
Experimental Protocol: Avidin-Biotin Affinity Immobilization
- Surface Functionalization: Immobilize streptavidin or neutravidin onto the transducer surface via adsorption or covalent binding.
- Enzyme Tagging: Biotinylate the enzyme of interest using a biotinylation reagent (e.g., NHS-PEG4-Biotin) under conditions that avoid modifying the active site.
- Purification: Remove excess, unreacted biotin using gel filtration or dialysis.
- Affinity Binding: Incubate the biotinylated enzyme with the streptavidin-functionalized surface. The strong affinity interaction (K_d ≈ 10^(-15) M) will rapidly and specifically immobilize the enzyme.
- Washing: Wash with buffer to remove any unbound enzyme.
The table below provides a comparative summary of these core techniques.
Table 1: Comparison of Core Enzyme Immobilization Techniques
| Technique | Binding Mechanism | Required Expertise | Stability | Risk of Activity Loss | Cost | Ideal Use Case |
|---|---|---|---|---|---|---|
| Adsorption | Physical (Weak bonds) | Low | Low | Low | Low | Proof-of-concept, short-term sensors |
| Covalent | Chemical (Covalent bonds) | High | High | High | Medium | Commercial, long-life sensors |
| Entrapment | Physical (Confinement) | Medium | Medium | Low | Low | Multi-enzyme systems, harsh environments |
| Cross-Linking | Chemical (Intermolecular bonds) | Medium | High | High | Low | Stabilizing pre-adsorbed enzymes |
| Affinity | Bio-affinity (Specific pairs) | High | High | Low | High | High-performance, oriented immobilization |
Advanced Stabilization through Nanomaterial Integration
The integration of nanomaterials has revolutionized enzyme immobilization by providing superior support matrices that enhance stability, loading capacity, and electron transfer. The high surface-to-volume ratio of nanomaterials ensures a significant increase in sensor-sensitive surfaces, allowing for more efficient enzyme immobilization [60].
Table 2: Nanomaterials for Enhanced Enzyme Immobilization and Stabilization
| Nanomaterial Class | Example Materials | Key Properties | Function in Stabilization |
|---|---|---|---|
| Metal & Metal Oxide Nanoparticles | Gold nanoparticles (AuNPs), Magnetic nanoparticles (Fe₃O₄) | Excellent conductivity, biocompatibility, large surface area [59] | Enhance electron transfer; magnetic particles allow easy immobilization and separation [60]. |
| Carbon-Based Nanomaterials | Carbon nanotubes (CNTs), Graphene oxide | Remarkable electrical and mechanical properties, high surface area [59] | Promote electron-transfer reactions; provide a biocompatible microenvironment for enzymes [60]. |
| Metal-Organic Frameworks (MOFs) | ZIF-8, UiO-66 | Extremely high porosity, tunable pore size, diverse structures [3] | Protect enzymes from denaturation by providing a confined, stable nano-cage [60]. |
| Conducting Polymers | Polypyrrole, Polyaniline | Electrical conductivity, can be electro-polymerized | Can entrap enzymes during polymerization, forming a conductive, protective hydrogel film [60]. |
Workflow for Nanomaterial-Enhanced Biosensor Fabrication
The following diagram illustrates a generalized experimental workflow for fabricating a biosensor using nanomaterial-based enzyme immobilization, applicable to various transducer platforms.
The Scientist's Toolkit: Essential Research Reagents and Materials
Successful implementation of advanced immobilization strategies requires a suite of specialized reagents and materials.
Table 3: Essential Research Reagent Solutions for Enzyme Immobilization
| Category | Item | Function/Description |
|---|---|---|
| Crosslinkers | Glutaraldehyde, EDC, NHS | Create covalent bonds between enzymes and supports or between enzyme molecules. |
| Affinity Tags | Biotin, Polyhistidine-tag (His-tag) | Genetically encoded or chemically added to enzymes for oriented, high-affinity immobilization. |
| Nanomaterials | Citrate-capped AuNPs, Carboxylated CNTs, Aminated magnetic beads | Provide high-surface-area supports to enhance enzyme loading, stability, and electron transfer. |
| Polymer Matrices | Chitosan, Polyacrylamide, Sol-gel precursors | Form porous 3D networks for gentle enzyme entrapment. |
| Stabilizing Agents | Bovine Serum Albumin (BSA), Trehalose | Inert proteins and sugars used to stabilize enzyme structure during immobilization and storage. |
| Blocking Buffers | Ethanolamine, Glycine, Casein | Quench unreacted active sites on surfaces to prevent non-specific binding of interferents. |
Application in Pesticide Detection: A Case Study
The principles of advanced immobilization are directly applicable to the critical challenge of detecting pesticide residues. For instance, biosensors have emerged as a viable alternative to conventional techniques like gas chromatography for monitoring pesticides in tea leaves, offering exceptional sensitivity, rapid response, and ease of operation [3]. The immobilization of enzymes like acetylcholinesterase (AChE), which is inhibited by organophosphorus and carbamate pesticides, is a common strategy [3]. Using advanced entrapment within a MOF or oriented covalent immobilization on a CNT-modified electrode can significantly improve the biosensor's shelf life and detection limit for pesticides such as omethoate or carbofuran, enabling swift on-site analysis [3].
The selection and optimization of enzyme immobilization techniques are pivotal in the design of high-performance biosensors for pesticide detection. While classical methods provide a foundation, the integration of advanced strategies—particularly those employing nanomaterials and site-specific affinity immobilization—offers a path to devices with superior stability, sensitivity, and specificity. As this field progresses, the synergy between sophisticated immobilization protocols and novel transducer platforms will be instrumental in realizing the full potential of biosensors for ensuring food safety and environmental monitoring.
The detection of pesticide residues represents a significant challenge in ensuring global food safety. Conventional techniques, such as gas chromatography (GC) and high-performance liquid chromatography (HPLC), despite their high accuracy, are constrained by requirements for sophisticated instrumentation, specialized personnel, and complex sample pretreatment, rendering them unsuitable for rapid, on-site screening [3] [2]. Within this context, biosensors have emerged as a viable alternative, offering exceptional sensitivity, rapid response, and ease of operation [3]. The performance of these biosensors, particularly their catalytic efficiency in converting biochemical recognition into a quantifiable signal, is paramount.
The integration of nanomaterials and hybrid composites has fundamentally transformed the catalytic cores of these sensing platforms. Hybrid nanomaterials are distinguished from simple composites by several defining characteristics: each component possesses a highly organized structure at the molecular level; the components interact to form a chemical bond; and the resultant system exhibits synergistic properties not observed in the individual components, leading to new catalytic capabilities [61]. This technical guide explores the material science underpinning these advanced catalysts, detailing their synthesis, functional mechanisms, and application within the specific framework of biosensors for pesticide detection, thereby contributing to the broader thesis of advanced research in this field.
Fundamental Principles of Hybrid Nanomaterials in Catalysis
Defining Hybrid Nanomaterial Catalysts
In catalytic biosensing, a hybrid nanomaterial is an engineered system where two or more distinct nanoscale components, such as metals, metal oxides, carbonaceous materials, or organic macrocycles, are chemically bonded or structurally organized to create a synergistic interface. This interface is designed to enhance the catalytic activity, stability, and selectivity of the biosensor's transduction mechanism [61] [62]. The ultimate goal is to achieve a system where the final properties are not merely additive but synergistic, leading to the emergence of new properties [61].
The architecture of these hybrids can take several forms, with "core-shell" systems being particularly prominent. In such structures, a core nanoparticle (e.g., a metal or oxide) is encapsulated by a shell of another material (e.g., a polymer or a different metal). These nanoparticles are often further embedded within a porous matrix, such as a metal-organic framework (MOF) or a polymer, to prevent coalescence and facilitate the transport of analyte molecules to the active sites [61].
Signaling Pathways and Catalytic Enhancement Mechanisms
The enhancement of biosensor signals through hybrid catalysts can be understood through several key pathways, as illustrated in the following diagram.
The catalytic enhancement mechanism primarily functions through several interconnected processes:
- Enhanced Electron Transfer: Hybrid materials, particularly those combining conductive elements like carbon nanotubes or metal nanoparticles with redox-active macrocycles like phthalocyanines, create highly efficient pathways for electron movement during the biochemical recognition event. This significantly improves the sensitivity of electrochemical biosensors [63] [62].
- Increased Active Surface Area: The nanoscale architecture of these hybrids provides an immense surface area for the immobilization of biorecognition elements (enzymes, aptamers, antibodies) and for catalytic reactions to occur, leading to higher loading capacity and a stronger output signal [64] [62].
- Synergistic Catalytic Activity: The combination of materials can create new active sites or enhance the intrinsic catalytic properties of each component. For instance, metal nanoparticles supported on a metal-organic framework (MOF) can exhibit superior catalytic activity compared to either component alone [61] [65].
Key Nanomaterial and Hybrid Composite Classes
Nanomaterials as Signal-Amplifying Components
The choice of nanomaterial is critical for dictating the performance of the catalytic interface. The table below summarizes the primary classes of nanomaterials used in biosensors for pesticide detection, along with their distinct functions.
Table 1: Key Nanomaterials and Their Functions in Biosensor Catalysis
| Nanomaterial Class | Example Materials | Primary Function in Catalysis | Relevant Biosensor Type |
|---|---|---|---|
| Noble Metal Nanoparticles | Gold (Au), Silver (Ag) | Signal amplification, plasmonic enhancement, electron transfer facilitation | Electrochemical, SERS, Colorimetric [64] [66] |
| Carbon Nanomaterials | Graphene, Carbon Nanotubes (CNTs) | High electrical conductivity, large surface area, mechanical stability | Electrochemical [67] [64] |
| Metal Oxides | Cerium Oxide (CeO₂), Copper Oxide (CuO) | Catalytic activity (e.g., peroxidase-like), oxygen storage capacity, stability | Optical, Colorimetric [61] [2] |
| Macrocyclic Compounds | Phthalocyanines (Pcs), Porphyrins | Redox mediation, catalytic activity, tunable electronic properties | Electrochemical [63] [62] |
| Metal-Organic Frameworks (MOFs) | Zeolitic Imidazolate Frameworks (ZIFs), Ln-MOFs | Ultra-high porosity, molecular sieving, active site isolation | Fluorescent, Electrochemical [61] [65] |
Advanced Hybrid Composites for Superior Performance
The true advancement in catalysis comes from combining these materials into hybrids. The synergistic interactions in these composites address the limitations of individual components.
- Polymer-Metal-Carbon (PMC) Hybrids: These composites often combine the processability and biocompatibility of polymers, the catalytic or conductive properties of metal nanoparticles, and the exceptional conductivity and surface area of carbon nanomaterials. For example, a porous chitosan–graphene oxide aerogel was used to stabilize uniformly sized Pd nanoparticles (~1.7 nm), resulting in a catalyst with unique activity for hydrogen generation, a principle applicable to various catalytic biosensing platforms [61].
- Phthalocyanine-Based Hybrids: Metallophthalocyanines (MPcs) are N4-macrocyclic compounds with a highly conjugated π-electron system and excellent redox activity. Their integration with carbon nanomaterials or metal nanoparticles improves electrochemical response, signal amplification, and stability. The planar structure of MPcs facilitates efficient electron transfer, while the hybrid component prevents aggregation and enhances conductivity [63].
- Core-Shell and Matrix-Stabilized Nanocatalysts: Architectures such as ruthenium nanoparticles localized inside halloysite aluminosilicate nanotubes have shown enhanced activity and selectivity in Fischer–Tropsch synthesis, demonstrating the principle of using a matrix to control the catalytic environment, which can be directly translated to designing sensitive biosensor interfaces [61].
Experimental Protocols for Hybrid Material Synthesis and Biosensor Fabrication
Synthesis of a Phthalocyanine-Graphene Oxide Hybrid Electrode
This protocol details the synthesis of a hybrid material for an electrochemical biosensor, leveraging the synergistic effect between a macrocycle and a carbon nanomaterial [63] [62].
Research Reagent Solutions:
- Graphene Oxide (GO) Dispersion: Serves as the conductive scaffold with high surface area.
- Metal Phthalocyanine (MPc) complex: Acts as the redox-active catalytic center.
- N,N-Dimethylformamide (DMF): Solvent for dissolving the MPc.
- Coupling Agent (e.g., EDC/NHS): Facilitates covalent bonding between GO and MPc.
- Buffer Solution (e.g., Phosphate Buffer Saline, PBS): Medium for biochemical assembly.
Step-by-Step Procedure:
- Functionalization of Graphene Oxide: Prepare a 1 mg/mL dispersion of GO in deionized water. Subject it to probe sonication for 30 minutes to achieve a homogeneous exfoliated dispersion.
- Covalent Grafting of MPc: Dissolve the selected MPc (e.g., cobalt phthalocyanine) in DMF at a concentration of 0.5 mM. Add this solution dropwise to the GO dispersion under constant stirring. To promote covalent amide bond formation, add the coupling agents EDC and NHS, and maintain the reaction at 60°C for 12 hours.
- Purification and Isolation: The resulting hybrid material is collected via vacuum filtration through a polycarbonate membrane. Wash thoroughly with ethanol and deionized water to remove any unreacted precursors. Finally, dry the obtained solid under vacuum at 50°C overnight.
- Electrode Modification: Prepare an ink by dispersing the synthesized hybrid material in a mixture of water and isopropanol (with a small amount of Nafion as a binder). Deposit a calculated volume of this ink onto a polished glassy carbon working electrode and allow it to dry at room temperature, creating a modified working electrode.
Fabrication of an Immunosensor with a Metal Nanoparticle-MOF Composite
This protocol describes the use of a hybrid composite to create a highly sensitive platform for capturing biorecognition elements [61] [65].
Research Reagent Solutions:
- Metal-Organic Framework (MOF) Crystals: Provides a porous matrix for nanoparticle stabilization.
- Gold Nanorods (AuNRs): Function as both a plasmonic signal amplifier and a substrate for antibody immobilization.
- Antibody Solution: The specific biorecognition element for the target pesticide.
- Crosslinker (e.g., glutaraldehyde): Used to conjugate antibodies to the composite surface.
Step-by-Step Procedure:
- In-Situ Growth of MOF on AuNRs: Synthesize AuNRs using a seed-mediated growth method. Then, immerse the AuNRs in a precursor solution containing the metal ion (e.g., Zn²⁺) and organic linker (e.g., 2-methylimidazole) of the target MOF (e.g., ZIF-8). Allow the MOF to crystallize on the surface of the AuNRs at room temperature for 24 hours.
- Composite Purification: Centrifuge the AuNR@ZIF-8 composite solution at high speed to separate the composite from unreacted precursors. Resuspend the pellet in deionized water and repeat the process three times.
- Antibody Immobilization: Activate the surface of the composite by incubating it with a crosslinker like glutaraldehyde. Subsequently, incubate the activated composite with a solution of the specific antibody for 2 hours at 37°C. The porous ZIF-8 shell concentrates the analyte near the plasmonic AuNR core, while the antibodies provide specificity.
- Biosensor Assembly and Testing: Drop-cast the antibody-conjugated AuNR@ZIF-8 composite onto a transducer surface (e.g., an electrode or a glass slide). The biosensor is then used by exposing it to a sample solution. The binding of the target pesticide to the antibody induces a change in the local refractive index or electrochemical impedance, which is measured as the analytical signal.
Analytical Performance: Quantitative Data and Comparison
The implementation of hybrid nanomaterials has led to a demonstrable and significant leap in the analytical performance of biosensors. The following table compiles representative data from recent research, highlighting the effectiveness of these materials in detecting common pesticides.
Table 2: Analytical Performance of Selected Hybrid Nanomaterial-Based Biosensors
| Target Pesticide | Hybrid Material Used | Biosensor Type | Detection Limit | Food Matrix Tested | Reference |
|---|---|---|---|---|---|
| Organophosphorus (e.g., Paraoxon) | Pd NPs / Chitosan-Graphene Oxide Aerogel | Electrochemical | ~1.0 nM | Apple, Cabbage | [61] [66] |
| Chlorpyrifos | AuNPs / Antibody | Immunosensor | 0.07 ng/L | Chinese cabbage, Lettuce | [66] |
| Tetracycline (Veterinary Drug) | Cr(III)-MOF | Fluorescent | 0.78 ng/mL | - | [65] |
| Thiophanate-methyl (TM) | Fe₃O₄ / Graphene Oxide Nanoribbons | Colorimetric-Fluorescent | 8.81 ng/mL (Fluorescent) | - | [65] |
| Organophosphorus (General) | CdTe Quantum Dot Aerogel / Microfluidic Chip | Fluorescent | 0.38 pM | Apples | [2] |
The data consistently shows that hybrid nanomaterial-based biosensors achieve detection limits significantly lower than the maximum residue limits (MRLs) defined by international food safety standards, such as the Codex Alimentarius [66]. This high sensitivity, combined with the selectivity imparted by the biorecognition elements, makes these platforms exceptionally reliable for monitoring trace-level contaminants in complex food matrices.
The strategic application of nanomaterials and hybrid composites has unequivocally established a new paradigm in catalytic biosensing for pesticide detection. By engineering materials at the nanoscale to create synergistic systems, researchers have developed biosensors with unparalleled sensitivity, selectivity, and robustness. The fundamental principles of enhanced electron transfer, maximized surface area, and synergistic catalysis, as realized in PMC hybrids, phthalocyanine-based composites, and matrix-stabilized nanocatalysts, provide a robust toolkit for addressing the complex challenges of food safety analysis.
Future research will likely focus on increasing the intelligence and integration of these systems. Key directions include the development of multi-analyte detection platforms on a single chip, the deeper integration of microfluidic technologies for automated sample handling, and the application of artificial intelligence for data analysis and interpretation [3] [65]. Furthermore, the pursuit of sustainable and green synthesis methods for these advanced hybrid materials will be crucial for their widespread commercialization and environmental compatibility. As material science continues to evolve, the next generation of hybrid catalysts will further push the boundaries of what is detectable, enabling comprehensive "tea garden-to-cup" and "farm-to-fork" monitoring systems that ensure global food safety [3].
The evolution of biosensing technologies has ushered in a new era of multimodal detection systems that integrate colorimetric, fluorescent, and photothermal sensing modalities. These integrated platforms represent a paradigm shift from traditional single-mode detection, offering enhanced accuracy through signal verification, improved sensitivity from synergistic effects, and greater robustness in complex sample matrices. Framed within the broader context of biosensor research for pesticide detection, this technical guide explores the fundamental principles, experimental methodologies, and implementation frameworks underpinning these sophisticated sensing systems. By leveraging advancements in nanotechnology and artificial intelligence, multimodal biosensors are overcoming traditional limitations of conventional detection methods, providing researchers with powerful tools for precise analytical measurements across diverse applications from food safety to environmental monitoring.
Multimodal sensing represents a significant advancement over traditional single-mode biosensors by simultaneously employing multiple detection principles to analyze a single analyte. This approach utilizes complementary transduction mechanisms that generate orthogonal data streams, creating a more comprehensive analytical profile for target substances. In the specific context of pesticide detection, where accurate measurement of trace-level contaminants in complex food matrices is critical, multimodal systems provide the cross-verification capability necessary for reliable results. The integration of colorimetric, fluorescent, and photothermal signals addresses fundamental challenges in biosensing, including false positives/negatives, matrix interference effects, and limited dynamic range that often plague conventional approaches.
The theoretical foundation for multimodal sensing rests on the principle that different sensing modalities exhibit varying dependencies on environmental factors and sample conditions. While colorimetric signals may suffer from turbidity interference and fluorescent signals from autofluorescence, photothermal measurements remain largely unaffected by these factors. By combining these modalities, the system can compensate for individual limitations through internal calibration and validation mechanisms. This cross-modality referencing is particularly valuable for pesticide detection in field applications where laboratory-grade control over experimental conditions is impossible. Furthermore, the multi-parameter data generated enables sophisticated pattern recognition through machine learning algorithms, facilitating predictive analytics that transcend the capabilities of any single detection method.
Fundamental Principles of Detection Modalities
Colorimetric Sensing Mechanisms
Colorimetric detection operates on the principle of measurable color change in response to target analyte presence, typically quantified through RGB (Red, Green, Blue) value extraction from digital images. This modality leverages the peroxidase-like activity of nanozymes, which catalyze substrate reactions to produce visible color changes. The catalytic mechanism involves electron transfer processes where surface functional groups on nanomaterials act as active sites, facilitating electron transfer to hydrogen peroxide and subsequent oxidation of chromogenic substrates like 3,3',5,5'-tetramethylbenzidine (TMB). The resulting color intensity directly correlates with analyte concentration, enabling quantitative analysis through spectrophotometric measurements or digital image colorimetry.
The significant advantage of colorimetric sensing lies in its instrumentation simplicity and potential for naked-eye detection without sophisticated equipment. Recent advancements have enhanced its sensitivity through nanomaterial engineering, particularly with noble metal nanoparticles exhibiting localized surface plasmon resonance (LSPR) effects that produce intense colors at low concentrations. For pesticide detection, colorimetric systems often employ enzyme inhibition principles, where pesticide molecules suppress enzyme activity, reducing color development in proportion to pesticide concentration. This approach has demonstrated effectiveness for organophosphate and carbamate pesticides that inhibit acetylcholinesterase (AChE), providing a rapid screening method with detection limits satisfying regulatory requirements for maximum residue limits (MRLs) [36] [66].
Fluorescent Sensing Mechanisms
Fluorescent detection utilizes the phenomenon where specific materials emit light at characteristic wavelengths upon excitation, with emission intensity modulated by analyte presence. This modality operates through various mechanisms including fluorescence quenching (Förster resonance energy transfer), fluorescence enhancement (photoinduced electron transfer), and ratiometric fluorescence using dual-emission probes. Nanozymes functionalized with fluorescent tags exhibit changes in emission properties when interacting with target pesticides, enabling highly sensitive detection with limits often reaching picogram per milliliter levels.
The exceptional sensitivity and selectivity of fluorescent sensing stems from the multiple parameters that can be monitored, including emission intensity, lifetime, and spectral shift. Quantum dots, carbon dots, and rare-earth doped nanoparticles have emerged as preferred fluorescent materials due to their high quantum yields, photostability, and tunable emission properties. In multimodal systems, fluorescent signals provide a complementary detection channel to colorimetric methods, with independent response mechanisms that validate results across modalities. For pesticide detection, aptamer-functionalized fluorescent probes offer particular advantage through their molecular recognition capabilities, binding specifically to target molecules with high affinity and producing measurable signal changes even at trace concentrations in complex matrices [36] [68].
Photothermal Sensing Mechanisms
Photothermal detection converts light energy into thermal signals through the photothermal effect, where materials absorb photons and non-radiatively relax, generating localized heat. This temperature change, measured by infrared thermography or thermal sensors, provides quantitative information about analyte concentration. Photothermal sensing typically employs materials with high photothermal conversion efficiency, such as gold nanoparticles, carbon-based materials, and two-dimensional transition metal carbides/nitrides (MXenes), which absorb strongly at specific wavelengths.
The principal strength of photothermal sensing lies in its minimal background interference in complex samples, as few biological components generate significant photothermal effects. This makes it particularly valuable for turbid or colored samples where optical methods face challenges. Additionally, photothermal signals can be quantitatively measured with simple instrumentation, offering potential for field-deployable devices. In multimodal systems, photothermal detection provides an orthogonal verification method that is largely independent of the optical properties that affect colorimetric and fluorescent modalities, thereby enhancing overall system reliability. The integration of photothermal with colorimetric sensing (photothermal/colorimetric multimodal sensing) has shown particular promise for pesticide detection, leveraging the advantages of both approaches for improved accuracy [36] [69].
Experimental Protocols and Methodologies
Nanozyme Synthesis and Functionalization
The foundation of effective multimodal sensors lies in the careful synthesis and functionalization of nanozymes with multiple catalytic activities. The following protocol details the synthesis of V2C MXenes nanomaterials (V2C-NMS) with dual peroxidase-like and fluorescence quenching capabilities, adapted from recent research on ochratoxin A detection with applicability to pesticide sensing systems [68]:
Materials Required:
- Vanadium Aluminum Carbide (V2AlC) MAX phase precursor
- Lithium fluoride (LiF)
- Hydrochloric acid (HCl)
- Sodium acetate (CH₃COONa)
- Acetic acid (CH₃COOH)
- Target-specific aptamer (ssDNA) with modifications (e.g., FAM-labeled)
- Deionized water, ethanol, and other standard laboratory solvents
Synthesis Procedure:
- In-situ HF Etching: Generate hydrofluoric acid in situ by mixing LiF (2.0 g) with HCl (9 M, 40 mL). Slowly add V2AlC powder (1.0 g) to this mixture while maintaining continuous stirring at 35°C for 72 hours. This process selectively removes aluminum layers, creating accordion-like multilayer V2C MXenes.
- Washing and Separation: Centrifuge the resulting mixture at 3500 rpm for 10 minutes and discard the supernatant. Resuspend the sediment in deionized water and repeat centrifugation until the pH reaches approximately 6.0.
- Delamination and Exfoliation: Subject the washed sediment to probe sonication in an ice bath under nitrogen atmosphere for 2 hours at 400W power. Subsequently, centrifuge at 3500 rpm for 30 minutes to collect the supernatant containing few-layer V2C-NMS.
- Functionalization: Incubate the prepared V2C-NMS (1 mg/mL) with FAM-labeled ssDNA aptamer (100 nM) in sodium acetate buffer (20 mM, pH 4.0) for 12 hours at 4°C. Purify the resulting V2C-NMS@ssDNA conjugate through centrifugation at 12,000 rpm for 15 minutes.
Characterization and Quality Control:
- Verify successful etching and exfoliation through scanning electron microscopy (SEM) and transmission electron microscopy (TEM), observing the transition from dense block structure to layered morphology.
- Confirm elemental composition through energy-dispersive X-ray spectroscopy (EDS), showing decreased aluminum content post-etching.
- Validate functionalization by measuring fluorescence quenching efficiency and peroxidase-like activity compared to unconjugated V2C-NMS.
This synthesis protocol yields nanozymes with the dual functionality essential for colorimetric/fluorescent multimodal detection, providing the foundation for subsequent sensor development and implementation.
Multimodal Detection Procedure
The following comprehensive protocol details the simultaneous detection of target analytes using colorimetric and fluorescent modalities, with applicability to pesticide detection systems:
Sample Preparation:
- Extraction: Prepare food samples using standardized extraction protocols such as QuEChERS (Quick, Easy, Cheap, Effective, Rugged, Safe). For pesticide analysis in fruits and vegetables, homogenize samples and extract with acetonitrile followed by cleanup with primary secondary amine (PSA) and magnesium sulfate.
- Dilution: Dilute extracts appropriately in sodium acetate buffer (20 mM, pH 4.0) to ensure target analyte concentration falls within the detection range.
Multimodal Detection Assay:
- Reaction Mixture Preparation: For each sample, prepare 200 μL reaction mixtures containing:
- V2C-NMS@ssDNA conjugate (50 μg/mL)
- Chromogenic substrate (TMB, 0.5 mM)
- Hydrogen peroxide (1.0 mM)
- Varying concentrations of target analyte or sample extract
- Sodium acetate buffer (20 mM, pH 4.0)
- Incubation: Incubate reaction mixtures at 25°C for 20 minutes to allow complete reaction.
- Colorimetric Measurement:
- Transfer 100 μL of each reaction mixture to a 96-well plate.
- Measure absorbance at 652 nm using a microplate reader.
- Alternatively, capture digital images under standardized lighting conditions and extract RGB values using image processing software.
- Fluorescence Measurement:
- Transfer the remaining 100 μL of each reaction mixture to a black 96-well plate.
- Measure fluorescence intensity at excitation/emission wavelengths appropriate for the fluorescent label (e.g., 495/520 nm for FAM).
- Photothermal Measurement (if applicable):
- Irradiate sample with 808 nm laser at 1.5 W/cm² power density for 5 minutes.
- Monitor temperature changes using an infrared thermal camera.
- Calculate photothermal conversion efficiency based on temperature rise kinetics.
Data Analysis:
- Generate standard curves for each modality by plotting signal intensity (absorbance, fluorescence, or temperature change) against analyte concentration.
- Calculate analyte concentration in unknown samples using the standard curves.
- For integrated multimodal analysis, employ machine learning algorithms (e.g., fully connected artificial neural networks) trained on datasets combining all modality signals to predict analyte concentrations.
This protocol enables comprehensive multimodal detection with internal validation, where consistency across modalities confirms result reliability while discrepancies indicate potential interference or matrix effects requiring further investigation.
Performance Metrics and Comparative Analysis
The implementation of multimodal sensing systems has demonstrated significant advantages across key performance parameters compared to conventional single-mode detection approaches. The following table summarizes quantitative performance data from recent research on nanozyme-based detection systems:
Table 1: Performance Comparison of Sensing Modalities for Pesticide Detection
| Detection Modality | Limit of Detection (LOD) | Dynamic Range | Analysis Time | Key Advantages | Reported Applications |
|---|---|---|---|---|---|
| Colorimetric | 0.002–0.045 mg/kg [69] | 2-3 orders of magnitude | 10-30 minutes | Instrument-free readout potential, cost-effectiveness | Organophosphorus pesticides in vegetables and edible oils [69] |
| Fluorescent | 6.77–8.03 pg/mL [68] | 3-4 orders of magnitude | 20-60 minutes | High sensitivity, multiplexing capability | Ochratoxin A in food samples [68] |
| Photothermal | 220.35 pg/mL [69] | 2-3 orders of magnitude | 5-15 minutes | Minimal background interference, works with turbid samples | Chlorpyrifos with SERS aptamer sensor [69] |
| Colorimetric/Fluorescent Multimodal | 7.10 pg/mL [68] | 4-5 orders of magnitude | 20-30 minutes | Mutual verification, enhanced reliability | OTA via V2C-NMS@ssDNA system [68] |
| Fluorescent/Photothermal Multimodal | Not specified | Not specified | 15-45 minutes | Complementary strengths, matrix effect resistance | Emerging research for pesticide detection [36] |
| Photothermal/Colorimetric Multimodal | Not specified | Not specified | 15-45 minutes | Field deployment potential, robust operation | Emerging research for pesticide detection [36] |
The comparative data reveals that multimodal approaches achieve superior performance metrics, particularly in detection limits and reliability. The colorimetric/fluorescent multimodal system demonstrates a detection limit of 7.10 pg/mL when enhanced with artificial intelligence, representing approximately 2-3 orders of magnitude improvement over traditional colorimetric methods alone [68]. This enhanced sensitivity stems from the complementary nature of the signals, where colorimetric provides robust quantitative measurement while fluorescent offers confirmation at ultra-trace levels.
Beyond the quantitative metrics, multimodal systems exhibit significant advantages in practical application scenarios. The integration of multiple detection channels reduces false-positive and false-negative rates through internal validation mechanisms. For instance, in complex food matrices like tea or honey where interfering compounds may affect single-modality sensors, multimodal systems maintain accuracy by requiring consistent responses across all modalities. This reliability is particularly valuable for regulatory decision-making where incorrect results could have significant public health implications. Furthermore, the rich datasets generated enable machine learning enhancement, with demonstrated improvements in prediction accuracy when models train on combined modality data rather than single-modality inputs [68].
The Scientist's Toolkit: Essential Research Reagents and Materials
The development and implementation of effective multimodal sensing systems requires carefully selected materials and reagents optimized for their specific roles in the detection mechanism. The following table details essential components and their functions in nanozyme-based multimodal sensors:
Table 2: Essential Research Reagents for Multimodal Nanozyme Sensors
| Material/Reagent | Function | Specific Examples | Key Characteristics |
|---|---|---|---|
| 2D MXene Nanomaterials | Signal transduction platform with dual enzyme-mimetic and fluorescence quenching activity | V2C MXenes, Ti₃C₂ MXenes | Large specific surface area, rich surface functional groups, excellent chemical stability [68] |
| Recognition Elements | Molecular recognition for target-specific binding | Aptamers (ssDNA), antibodies, molecularly imprinted polymers | High specificity, stability under varying conditions, compatibility with nanomaterial functionalization [36] [68] |
| Chromogenic Substrates | Colorimetric signal generation through enzymatic oxidation | TMB (3,3',5,5'-tetramethylbenzidine), ABTS (2,2'-azino-bis(3-ethylbenzothiazoline-6-sulfonic acid)) | Distinct color change upon oxidation, compatibility with peroxidase-like nanozymes, stability in solution [36] |
| Fluorescent Probes | Fluorescence signal generation and modulation | FAM (carboxyfluorescein), quantum dots, carbon dots | High quantum yield, photostability, appropriate excitation/emission profiles, compatibility with quenching materials [68] |
| Photothermal Agents | Light-to-heat conversion for thermal signal generation | Gold nanostars, carbon nanotubes, MXenes | High photothermal conversion efficiency, appropriate absorption profiles, stability under laser irradiation [36] [69] |
| Buffer Systems | Maintenance of optimal pH for catalytic activity | Sodium acetate buffer, phosphate buffered saline | Optimal pH range for nanozyme activity, compatibility with recognition elements, minimal interference with signals |
This collection of specialized materials enables the sophisticated functionality of multimodal sensors, with each component playing a critical role in the overall detection mechanism. The selection of appropriate materials must consider not only individual performance but also compatibility within the integrated system, particularly at nano-bio interfaces where recognition elements interact with nanomaterial surfaces. Recent advances have focused on developing hybrid nanomaterials that combine multiple functionalities, such as MXenes with intrinsic peroxidase-like activity and photothermal conversion efficiency, simplifying sensor design while maintaining performance across modalities [68].
Signaling Pathways and System Workflows
The functional efficacy of multimodal sensing systems arises from precisely engineered signaling pathways that coordinate detection events across multiple modalities. The following diagram illustrates the integrated workflow for a colorimetric/fluorescent multimodal sensor:
Multimodal Sensor Signaling Workflow
This workflow illustrates the coordinated signaling pathways that enable simultaneous detection across modalities. The process initiates with molecular recognition, where target analytes specifically bind to recognition elements (e.g., aptamers), inducing conformational changes that trigger signal generation through parallel pathways. In the colorimetric pathway, the dissociation of ssDNA from the nanozyme surface enhances peroxidase-like activity, catalyzing chromogenic substrate oxidation with intensity proportional to analyte concentration. Concurrently, in the fluorescence pathway, the same dissociation event restores fluorescence by separating fluorophores from quenching materials, generating complementary signals. These parallel pathways converge at the detection and integration stage, where machine learning algorithms process the multimodal data to produce validated quantitative results with enhanced accuracy and reliability.
The signaling cascade demonstrates the fundamental advantage of multimodal systems: independent but correlated response mechanisms that provide cross-validation while expanding dynamic range. This coordinated operation enables detection performance exceeding the capabilities of individual modalities, particularly in complex matrices where interfering substances may affect one modality but not others. The integration of artificial intelligence further enhances this advantage by identifying subtle patterns across modalities that might escape conventional analytical approaches, enabling predictive detection with exceptional sensitivity and specificity [68].
Multimodal sensing systems integrating colorimetric, fluorescent, and photothermal detection modalities represent a significant advancement in biosensing technology, offering enhanced accuracy through signal verification and expanded capabilities through complementary detection principles. The synergistic combination of these approaches addresses fundamental limitations of conventional single-mode biosensors, particularly for challenging applications like pesticide detection in complex food matrices. The integration of nanozymes as multifunctional sensing elements provides the foundation for these sophisticated systems, enabling robust, sensitive, and reliable detection performance that meets the stringent requirements of modern analytical science.
Future developments in multimodal sensing will likely focus on several key areas: further miniaturization for field-deployable devices, enhanced integration with artificial intelligence for predictive analytics, expansion of modality combinations to include electrochemical and magnetic sensing, and development of universal platforms adaptable to diverse analyte classes. As these technologies mature, they will play an increasingly important role in ensuring food safety, environmental monitoring, and public health protection through rapid, accurate detection of hazardous substances. The continued convergence of nanotechnology, biotechnology, and information technology will further enhance the capabilities of these systems, ultimately delivering analytical performance previously achievable only in sophisticated laboratory settings to point-of-need applications worldwide.
Benchmarking Biosensor Performance Against Traditional Analytical Methods
The escalating global population and the consequent demand for food security have led to the extensive use of pesticides in modern agriculture. While crucial for protecting crops and ensuring yield, this practice introduces significant risks due to pesticide residues in food products and the environment, posing serious threats to human health [2] [1]. Consequently, the development of robust, sensitive, and efficient methods for detecting these residues is a critical research focus. Traditional chromatographic techniques, primarily gas chromatography-mass spectrometry (GC-MS) and liquid chromatography-mass spectrometry (LC-MS), have long been the regulatory gold standard. However, the emergence of biosensor technology presents a paradigm shift, offering promising alternatives for rapid, on-site analysis [3] [2]. This review provides a comparative analysis of these technological approaches, evaluating their performance in sensitivity and throughput within the context of pesticide detection research.
Conventional Gold Standards: GC-MS and LC-MS
Chromatography coupled with mass spectrometry represents the cornerstone of modern analytical chemistry for pesticide residue analysis.
GC-MS and LC-MS are separation-based techniques. GC-MS is ideal for volatile and semi-volatile pesticides, while LC-MS excels with non-volatile, thermally labile, and polar compounds [8]. Their unparalleled strength lies in performing multi-residue analysis, capable of screening hundreds of pesticides in a single run [70]. A typical workflow involves multiple intricate steps, as outlined below.
Figure 1: Generalized workflow for chromatographic methods (GC-MS/LC-MS) in pesticide analysis.
Performance Metrics and Applications
These methods are celebrated for their high sensitivity and precision. LC-MS/MS, for instance, can achieve detection limits in the part-per-trillion (ppt) range for certain compounds [71]. A study comparing GC-MS and comprehensive two-dimensional GC-MS (GC×GC-MS) demonstrated that the latter detected approximately three times as many metabolite peaks due to superior chromatographic resolution, highlighting the power of advanced chromatographic techniques for complex matrices [72]. Similarly, in a comparison of LC-MS and GC-MS for analyzing pharmaceuticals and personal care products in water, LC-TOF-MS generally provided lower detection limits than GC-MS [73]. These methods are indispensable for regulatory compliance and definitive confirmation of pesticide residues.
The Emerging Paradigm: Biosensors
Biosensors are analytical devices that integrate a biological recognition element with a physicochemical transducer to produce a measurable signal proportional to the target analyte.
Biosensors for pesticide detection primarily operate on two principles: 1) enzyme inhibition and 2) immunoaffinity recognition [2] [1]. Acetylcholinesterase (AChE)-based sensors are a classic example of the former, where organophosphorus pesticides inhibit the enzyme, leading to a measurable decrease in catalytic activity [2]. The general architecture and signal transduction mechanisms of biosensors are illustrated in the following diagram.
Figure 2: Core components and signal transduction pathway of a biosensor.
Advancements in Biosensing: Nanomaterials and MOFs
Recent progress leverages nanomaterials and metal-organic frameworks (MOFs) to dramatically enhance performance. Nanosensors benefit from unique physicochemical properties at the nanoscale, offering user-friendly operation, enhanced sensitivity and specificity, and rapid, on-site detection capabilities [2]. MOFs, with their ultra-high surface area and tunable porosity, are used to create robust composites with natural enzymes or as nanozymes themselves, improving stability and catalytic activity for highly sensitive detection [1]. For example, a fluorescent microfluidic sensor using a quantum dot aerogel achieved a limit of detection (LOD) of 0.38 pM for organophosphorus pesticides in apples [2].
Comparative Analysis: Sensitivity and Throughput
The core distinction between these technologies lies in their operational philosophy, which directly impacts their sensitivity and throughput.
Quantitative Performance Comparison
Table 1: Comparison of key performance indicators for pesticide detection techniques.
| Performance Indicator | Biosensors (Incl. Nanosensors) | GC-MS / LC-MS |
|---|---|---|
| Detection Limit | pM to nM range [3] [2] | ppt to ppb range; highly compound-dependent [71] [73] |
| Analysis Time | 5 - 30 minutes [3] | 30 minutes to several hours (including preparation) [3] [72] |
| Sample Throughput | High (potential for rapid, on-site analysis) | Lower in lab, but high-throughput via multi-residue methods [70] [8] |
| Multi-Residue Capability | Generally limited, but emerging for specific classes [3] | Excellent; can screen hundreds simultaneously (MRMs) [70] [8] |
| Operational Complexity | Low (minimal training required) | High (requires skilled personnel) [3] [2] |
| Portability | High (field-deployable formats available) [2] | Low (confined to laboratory) [3] |
Contextual Strengths and Limitations
The choice between these technologies is application-dependent. GC-MS/LC-MS platforms provide unmatched analytical breadth, precision, and regulatory validation, making them irreplaceable for definitive quantification and non-targeted screening of unknown contaminants [70]. Their primary limitations are cost, operational complexity, and lack of portability, which hinder real-time, on-site decision-making [3].
In contrast, biosensors excel in speed, cost-effectiveness, and field-deployability. They are ideal for high-throughput preliminary screening, enabling rapid monitoring at various points in the agricultural supply chain, from "tea garden-to-cup" as one review notes [3]. Their main challenges include potential matrix interference, the stability of biological elements, and historically more limited multi-residue capability, though these are areas of active innovation [2] [1].
Experimental Protocols and Reagent Tools
To illustrate the practical implementation of these technologies, this section outlines representative experimental protocols.
Protocol: GC-MS/MS Analysis of Chiral Compounds
This protocol, adapted from a study on N-acyl homoserine lactones, demonstrates the complexity of chiral analysis using GC-MS/MS [71].
- Solid Phase Extraction (SPE): Pass the sample through a preconditioned SPE cartridge (e.g., Supelco HLB).
- Elution and Concentration: Elute target analytes with an organic solvent like dichloromethane. Evaporate the eluate to dryness under a gentle nitrogen stream.
- Derivatization: Reconstitute the dried extract in a derivatization agent like N-Methyl-N-(trimethylsilyl)trifluoroacetamide (MSTFA) with 1% trimethylchlorosilane (TMCS). Heat the mixture (e.g., 60 min at 70°C) to form volatile trimethylsilyl derivatives.
- GC-MS/MS Analysis: Inject the derivatized sample into the GC-MS/MS system. Use a chiral column (e.g., β-DEX 225) and a triple quadrupole mass spectrometer in Selected Reaction Monitoring (SRM) mode for high specificity and sensitivity.
Protocol: Enzyme-Inhibition Based Nanosensor for Organophosphates
This protocol describes the construction and use of a fluorescence-based nanosensor [2].
- Sensor Fabrication: Immobilize the enzyme acetylcholinesterase (AChE) and a fluorescent probe (e.g., CdTe quantum dots) onto a solid support or integrate them into a microfluidic device.
- Substrate Introduction: Introduce the enzyme substrate, acetylthiocholine (ATCh), into the system. AChE hydrolyzes ATCh to produce thiocholine, which quenches the fluorescence of the quantum dots.
- Sample Exposure and Measurement: Introduce the sample containing potential organophosphorus pesticides. The pesticides inhibit AChE, reducing the production of thiocholine and resulting in a recovery of fluorescence intensity.
- Detection: Quantify the pesticide concentration by measuring the fluorescence signal, which is inversely proportional to the enzyme inhibition.
The Scientist's Toolkit: Essential Research Reagents
Table 2: Key reagents and materials used in advanced pesticide detection research.
| Reagent/Material | Function in Research | Example Applications |
|---|---|---|
| Acetylcholinesterase (AChE) | Biological recognition element; its inhibition is measured to detect OPs and carbamates. | Enzyme inhibition biosensors [2]. |
| Molecularly Imprinted Polymers (MIPs) | Synthetic, biomimetic receptors that provide high stability and selective binding sites for target pesticides. | Recognition element in optical and electrochemical sensors [2]. |
| Metal-Organic Frameworks (MOFs) | Porous materials used to encapsulate/enhance enzymes or act as nanozymes; improve sensor stability and sensitivity. | MOF-enzyme composites for electrochemical detection [1]. |
| Aptamers | Single-stranded DNA or RNA molecules that bind specific targets with high affinity; used as synthetic recognition elements. | Recognition element in biosensors as antibody alternatives [2]. |
| QuEChERS Extraction Kits | Quick, Easy, Cheap, Effective, Rugged, Safe; standard methodology for multi-pesticide extraction from food matrices. | Sample preparation for GC-MS and LC-MS analysis [70]. |
| Derivatization Reagents (e.g., MSTFA) | Chemically modify target analytes to increase volatility and thermal stability for GC-MS analysis. | Chiral analysis of compounds by GC-MS/MS [71]. |
The future of pesticide detection lies not in the supremacy of one technology over the other, but in their strategic integration and parallel advancement. Chromatographic methods are evolving towards greater automation, higher resolution, and the incorporation of ion mobility spectrometry (IMS) and artificial intelligence (AI) for data processing to manage the complexity of the exposome [70] [74]. Biosensors are progressing towards miniaturization, multiplexing (detecting multiple analytes simultaneously), and the incorporation of intelligent microdevices and AI [3] [1]. The integration of microfluidic chips (Lab-on-a-Chip) with biosensors is a particularly promising direction for creating fully automated, high-throughput portable analysis systems [3] [2].
In conclusion, both GC-MS/LC-MS and biosensors are vital tools in the arsenal for ensuring food safety and environmental health. GC-MS/LC-MS remains the definitive, gold-standard technology for comprehensive, multi-residue analysis and regulatory confirmation. In contrast, biosensors offer a disruptive technology for rapid, on-site screening with high sensitivity and throughput. The choice between them is dictated by the specific application requirements: ultimate accuracy and comprehensiveness versus speed and portability. Ongoing research and development will continue to push the boundaries of both, fostering a more robust and versatile monitoring system for pesticide residues across the global food supply chain.
Biosensors have emerged as transformative analytical tools for pesticide detection, offering a viable alternative to conventional techniques such as gas chromatography (GC) and high-performance liquid chromatography (HPLC) [3] [75]. These devices integrate a biological recognition element with a physicochemical transducer to produce a measurable signal proportional to the concentration of the target analyte [76] [77]. The drive toward developing biosensors for pesticide monitoring is fueled by the need for rapid, cost-effective, and on-site analysis to ensure food safety, environmental health, and regulatory compliance [3] [9] [75].
Evaluating the performance of any biosensing platform relies critically on three interdependent metrics: the limit of detection (LOD), the detection range, and the analysis time. The LOD defines the lowest concentration of a pesticide that can be reliably distinguished from background noise, while the detection range specifies the span of concentrations over which the sensor provides a quantifiable response [78]. Analysis time encompasses the total duration from sample introduction to result acquisition, a crucial factor for real-time monitoring and decision-making [3] [75]. This guide provides an in-depth technical examination of these core metrics, offering structured data, experimental protocols, and strategic frameworks to aid researchers in the design and critical assessment of biosensor technologies.
Core Performance Metrics in Biosensor Design
Limit of Detection (LOD)
The Limit of Detection (LOD) is a fundamental parameter that defines the lowest concentration of an analyte that can be consistently distinguished from a blank sample [78]. In biosensor research, a significant focus is placed on achieving ultra-low LODs, often down to picomolar (pM) or nanomolar (nM) levels, to enable the early identification of trace-level pesticide residues [3] [16]. However, a paradox exists where the relentless pursuit of a lower LOD does not always translate to practical success. A biosensor with a fantastically low LOD may be unnecessary if the relevant clinical or environmental concentrations of the pesticide occur at a much higher level (e.g., nanomolar or microgram per liter) [78]. This can lead to overly complex designs, increased cost, and compromised performance in other parameters like detection range or robustness [78].
The primary drivers for developing ultra-sensitive biosensors include the need for early-stage disease biomarker detection, identifying environmental pollutants at trace levels, and ensuring food safety [78]. For instance, detecting certain biomarkers or highly toxic pesticides at the earliest possible stage can be a game-changer for diagnostic and environmental outcomes [78]. Therefore, the target LOD must be carefully selected based on the minimum required detection limit for the specific application, rather than the sole pursuit of the lowest technologically achievable value.
Detection Range
The detection range, or dynamic range, is the concentration interval over which the biosensor's signal has a defined, quantifiable relationship with the analyte concentration [78]. A common trade-off in biosensor design is observed between achieving a low LOD and maintaining a wide detection range. Optimizing sensor architecture and materials for extreme sensitivity can sometimes restrict the upper limit of quantification, narrowing the useful operating window [78].
A sensor must operate within the clinically or environmentally significant range of the target pesticide. For example, a biosensor designed to monitor pesticide runoff in surface water must have a detection range that encompasses the concentrations typically found in those environments, which can vary from nanograms per liter (ng/L) to micrograms per liter (µg/L) [75]. A narrow detection range might necessitate extensive sample dilution or pre-concentration, increasing analysis time and complexity and defeating the purpose of a rapid, on-site biosensor [78].
Analysis Time
Analysis time refers to the total time required from sample introduction to the acquisition of a reliable result. For biosensors, this typically includes the duration for the biorecognition event, signal transduction, and signal processing [3] [75]. This metric is critical for applications requiring high-throughput screening or rapid on-site decisions, such as checking agricultural products at the point of harvest or monitoring water sources for contamination events [3] [9].
Conventional methods like chromatography and mass spectrometry, while highly accurate, often involve intricate pretreatment, lengthy protocols, and laboratory-bound equipment, resulting in detection cycles that can take hours or days [3] [75]. In contrast, biosensors aim to drastically reduce this time. Recent advancements report analysis times as short as 5–30 minutes for detecting pesticide residues and heavy metals in complex matrices like tea leaves [3]. The integration of microfluidic channels for sample handling and the development of portable, user-friendly devices are key innovations driving this reduction in analysis time, making real-time monitoring a tangible goal [3] [77].
Quantitative Performance of Representative Biosensors
The performance of biosensors varies significantly based on their transduction mechanism and biorecognition element. The table below summarizes the typical performance metrics for various biosensor platforms used in pesticide detection, as reported in recent literature.
Table 1: Performance Metrics of Biosensor Technologies for Pesticide Detection
| Biosensor Type | Transduction Mechanism | Typical LOD | Typical Detection Range | Analysis Time | Key Applications |
|---|---|---|---|---|---|
| Electrochemical [3] [79] | Amperometric, Potentiometric, Impedimetric | nM - pM | Wide | 5 - 30 min | On-site detection of organophosphates, carbamates [3] |
| Fluorescence [3] [9] | Optical (Light emission) | nM - pM | Moderate | 10 - 60 min | Detection of antibiotics, pesticides [9] |
| SERS [3] [16] | Optical (Raman scattering) | Single-molecule level | Narrow to Moderate | < 10 min | Multi-residue detection, fingerprint identification [16] |
| Surface Plasmon Resonance (SPR) [3] | Optical (Refractive index) | nM | Moderate | 15 - 30 min | Label-free detection, kinetic studies |
| Colorimetric [3] | Optical (Visual/UV-Vis) | µM - nM | Narrow | 5 - 20 min | Rapid, visual on-site screening |
| Whole-Cell [9] [75] | Various (Optical, Electrochemical) | Varies (e.g., 3 ng/mL for pyrethroids) [9] | Moderate | 30 min - several hours | Assessing toxicity, bioavailability of pollutants [75] |
Experimental Protocols for Metric Evaluation
Protocol for Determining LOD and Detection Range
This protocol outlines a standard procedure for establishing the calibration curve, limit of detection (LOD), and detection range of an electrochemical biosensor for pesticide analysis.
1. Principle: The biosensor is exposed to a series of standard solutions with known concentrations of the target pesticide. The resulting signals are measured to construct a calibration curve, which is used to determine the analytical sensitivity, LOD, and linear dynamic range.
2. Reagents and Solutions:
- Stock standard solution: Prepare a high-purity standard of the target pesticide (e.g., chlorpyrifos) in an appropriate solvent (e.g., methanol or acetonitrile).
- Working standard solutions: Dilute the stock solution with the selected buffer (e.g., 0.1 M phosphate buffer saline, pH 7.4) to create a calibration series. A typical series might include 8-10 concentrations (e.g., 0.01, 0.1, 1, 10, 100, 1000 nM).
- Assay buffer: A suitable buffer to maintain pH and ionic strength during measurements.
3. Equipment:
- Electrochemical workstation (e.g., potentiostat/galvanostat).
- Fabricated biosensor (e.g., a screen-printed electrode modified with enzymes or aptamers).
- Analytical balance, micropipettes, and volumetric flasks.
4. Procedure: 1. Biosensor Preparation: If required, precondition the biosensor according to the established fabrication protocol (e.g., electrochemical activation). 2. Baseline Measurement: Immerse the biosensor in the assay buffer and measure the baseline signal (e.g., amperometric current or impedance). 3. Sample Measurement: For each standard solution in the calibration series: * Incubate the biosensor in the standard solution for a fixed time (e.g., 5-15 minutes) under stirring or static conditions. * Wash the biosensor gently with assay buffer to remove unbound molecules. * Transfer the biosensor to a fresh cell containing assay buffer and record the electrochemical signal (e.g., differential pulse voltammogram or chronoamperogram). * Perform each measurement in triplicate to ensure reproducibility. 4. Data Analysis: * Plot the average measured signal (y-axis) against the logarithm of the pesticide concentration (x-axis). * Perform linear regression on the linear portion of the curve to obtain the equation: ( y = mx + c ), where ( m ) is the slope (sensitivity) and ( c ) is the y-intercept. * Calculate LOD: LOD = ( 3.3 \times \sigma / m ), where ( \sigma ) is the standard deviation of the blank signal (or the y-intercept residuals) and ( m ) is the slope of the calibration curve [78]. * Define Detection Range: The linear dynamic range is the concentration span between the lowest quantifiable level (LOQ, often calculated as ( 10 \times \sigma / m )) and the highest point where the calibration curve remains linear.
Protocol for Assessing Analysis Time via Enzyme Inhibition
This protocol describes a classic method for detecting organophosphorus and carbamate pesticides based on the inhibition of the enzyme acetylcholinesterase (AChE), with a focus on timing each step of the analysis.
1. Principle: The active site of AChE is inhibited by certain pesticides, reducing its catalytic activity. The rate of enzyme activity recovery, or the residual activity after a fixed inhibition time, is measured and correlated to the pesticide concentration.
2. Reagents and Solutions:
- Acetylcholinesterase (AChE) enzyme solution.
- Acetylthiocholine (ATCh) or another substrate.
- Colorimetric or electrochemical probe (e.g., DTNB for Ellman's method).
- Standard solutions of the target pesticide (e.g., omethoate).
- Assay buffer (e.g., phosphate buffer, pH 7-8).
3. Equipment:
- Spectrophotometer or electrochemical workstation.
- Timer/stopwatch.
- Temperature-controlled water bath or incubator.
4. Procedure: 1. Enzyme Inhibition (Timed Step): * Incubate a fixed volume of AChE with the sample or standard pesticide solution for a precise time (e.g., 10 minutes). Start the timer. * This step is critical as it defines the exposure time and influences sensitivity. 2. Residual Activity Measurement (Timed Step): * After the inhibition period, add the substrate (ATCh) and the probing molecule (DTNB) to the mixture. * Immediately monitor the signal generation (e.g., absorbance at 412 nm for yellow anion formation) for a fixed period (e.g., 2-5 minutes). The rate of signal change is proportional to the residual enzyme activity. 3. Data Analysis: * Calculate the percentage of enzyme inhibition: ( \% Inhibition = [(I0 - Is) / I0] \times 100 ), where ( I0 ) is the signal from the uninhibited control and ( I_s ) is the signal from the sample. * Plot ( \% Inhibition ) versus pesticide concentration to create the quantification curve. * Record Analysis Time: The total analysis time is the sum of the inhibition time, the residual activity measurement time, and any sample preparation/biosensor regeneration time.
Signaling Pathways and Experimental Workflows
The following diagrams illustrate the core working principle of a biosensor and a generalized workflow for evaluating its key performance metrics.
Biosensor Core Working Principle
Figure 1: Core working principle of a biosensor, illustrating the sequence from analyte recognition to signal readout [76] [77].
Performance Metric Evaluation Workflow
Figure 2: A generalized experimental workflow for evaluating the limit of detection (LOD), detection range, and analysis time of a biosensor.
The Scientist's Toolkit: Research Reagent Solutions
The development and operation of high-performance biosensors rely on a suite of specialized reagents and materials. The table below details key components and their functions in a typical biosensor setup.
Table 2: Essential Research Reagents and Materials for Biosensor Development
| Reagent / Material | Function / Explanation | Example Use Cases |
|---|---|---|
| Bioreceptors | Biological elements that provide specificity by recognizing and binding to the target analyte [76] [77]. | |
| • Enzymes (e.g., AChE, BChE) | Catalyze a reaction with the analyte; inhibition of activity is used for detection of organophosphates/carbamates [9] [79]. | Enzyme-based inhibition biosensors. |
| • Antibodies (IgG, IgM) | Bind to target pesticides with high affinity and specificity, forming the basis of immunosensors [9] [77]. | ELISA, optical, or electrochemical immunosensors. |
| • Aptamers (ssDNA, RNA) | Synthetic single-stranded oligonucleotides with high affinity; offer advantages in stability and synthesis over antibodies [9]. | Aptasensors for various small molecules. |
| • Whole Microbial Cells | Act as integrated sensing systems, often responding to analyte-induced stress or metabolic changes [9]. | Toxicity assessment and environmental monitoring. |
| Nanomaterials | Used to enhance signal transduction, increase surface area, and improve biosensor sensitivity [3] [76]. | |
| • Gold Nanoparticles (AuNPs) | Excellent conductivity and optical properties for electrochemical and optical (e.g., SERS, colorimetric) signal amplification [76] [16]. | SERS substrates, electrode modification. |
| • Carbon Nanotubes (CNTs) | High electrical conductivity and large surface area for enhanced electron transfer in electrochemical sensors [76]. | Electrode modification for pesticide detection. |
| • Quantum Dots (QDs) | Semiconductor nanoparticles with size-tunable fluorescence, used as labels in optical biosensors [76] [9]. | Fluorescent immunoassays. |
| • Metal-Organic Frameworks (MOFs) | Highly porous materials with vast surface areas, used for preconcentrating analytes or hosting bioreceptors [3]. | Enhancing sensor sensitivity and loading capacity. |
| Transducer Materials | The platform that converts the biorecognition event into a quantifiable signal [76] [77]. | |
| • Screen-Printed Electrodes (SPEs) | Disposable, low-cost electrodes for electrochemical detection; ideal for portable devices [79]. | Amperometric/potentiometric pesticide sensors. |
| • Plasmonic Chips (Au/Ag films) | Serve as the basis for optical transducers like Surface Plasmon Resonance (SPR) [3]. | Label-free detection of binding events. |
| • SERS-Active Substrates | Nanostructured surfaces (e.g., Au/Ag nanoparticle assemblies) that dramatically enhance Raman signals [16]. | SERS biosensors for fingerprint detection. |
| Other Key Reagents | ||
| • Immobilization Matrices (e.g., chitosan, Nafion) | Polymers used to securely attach bioreceptors to the transducer surface while maintaining their activity [79]. | Enzyme or antibody immobilization on electrodes. |
| • Blocking Agents (e.g., BSA, casein) | Used to passivate unused surface areas on the sensor to minimize non-specific adsorption, which can cause false signals [77]. | Preparation of immunosensors and aptasensors. |
| • Redox Mediators (e.g., ferricyanide) | Molecules that shuttle electrons between the biorecognition element and the electrode, improving electrochemical signal efficiency [76]. | Mediated amperometric biosensors. |
The detection of multiple pesticide residues in a single analysis is a paramount objective in modern food and environmental safety monitoring. Multi-residue detection methods provide significant advantages in throughput, cost-efficiency, and analytical speed compared to single-analyte approaches [80]. However, the pursuit of broader analytical coverage introduces a critical challenge: cross-reactivity. This phenomenon occurs when a sensing element, designed to recognize a specific target, also interacts with non-target compounds that share structural or chemical similarities [10] [80]. While cross-reactivity is sometimes harnessed intentionally to create broadly-specific sensors for compound classes, uncontrolled cross-reactivity severely compromises analytical accuracy, leading to false positives or inflated concentration estimates that can trigger unnecessary regulatory actions or undermine risk assessments [5].
Within the context of biosensors for pesticide detection, the specificity challenge permeates every aspect of sensor design and application. Biosensors integrate biological recognition elements (enzymes, antibodies, aptamers, whole cells) with physical transducers to create analytical devices [9]. The biological component provides the molecular recognition capability, while the transducer converts the binding event into a quantifiable signal [10]. Each type of biosensor presents unique cross-reactivity profiles based on its recognition mechanism. Effectively managing these interactions requires a sophisticated understanding of molecular recognition principles, careful sensor design, and comprehensive validation strategies. This technical guide examines the fundamental causes of cross-reactivity in multi-residue biosensing, explores current technological solutions, details experimental protocols for specificity evaluation, and highlights emerging approaches to overcome these persistent challenges.
Fundamental Causes of Cross-Reactivity
Molecular Recognition Mechanisms
Cross-reactivity in biosensors stems primarily from the fundamental mechanisms of molecular recognition. Biological recognition elements typically feature binding sites with specific structural and chemical complementarity to their intended targets. However, when structurally analogous compounds share key molecular features—such as functional groups, aromatic rings, or hydrophobic regions—they may retain sufficient affinity to trigger a detectable signal [80]. For example, in antibody-based biosensors, the binding site may recognize a common epitope shared across multiple compounds within a pesticide class, such as the thiophosphate moiety in organophosphates (OPs) or the core structure in sulfonamides [80]. Similarly, enzyme-based biosensors relying on inhibition mechanisms may respond to any compound that interacts with the enzyme's active site, regardless of structural differences elsewhere in the molecule [5].
The degree of cross-reactivity depends heavily on the stringency of molecular recognition. High-affinity interactions with exact steric and electronic complementarity typically yield high specificity, while more flexible binding sites that accommodate structural variations produce broader cross-reactivity patterns [80]. In aptamer-based sensors, the three-dimensional folding structure creates binding pockets that may tolerate certain modifications to the target molecule while maintaining binding affinity [9]. Understanding these fundamental recognition principles is essential for both exploiting desired broad-specificity and minimizing undesirable cross-reactivity in multi-residue applications.
Matrix Effects and Interference
Beyond specific molecular recognition, sample matrix effects represent a significant source of analytical interference in real-world biosensor applications. Complex sample matrices like tea, fruits, and other agricultural products contain numerous compounds that can interfere with biosensor performance [3] [81]. Tea, for instance, contains abundant polyphenols, alkaloids (caffeine, theophylline), and pigments that may nonspecifically interact with sensor surfaces or biological recognition elements, potentially mimicking or masking target signals [3]. Similarly, fruit samples contain natural organic acids, sugars, and pigments that can compromise assay specificity if not properly addressed [81].
These matrix effects operate through multiple mechanisms: protein binding (nonspecific adsorption to antibodies or enzymes), optical interference (background fluorescence or absorption in optical sensors), fouling of electrode surfaces in electrochemical sensors, and direct chemical interference with signal transduction systems [10] [9]. The magnitude of matrix effects varies considerably between sample types, necessitating matrix-specific validation and often requiring sample cleanup procedures such as the QuEChERS (Quick, Easy, Cheap, Effective, Rugged, and Safe) method, which has been successfully applied to fruit, vegetable, and sediment samples prior to analysis [81] [82].
Technological Approaches to Manage Cross-Reactivity
Recognition Element Engineering
Strategic engineering of recognition elements provides the most direct approach to managing cross-reactivity profiles in biosensors. Different biological recognition platforms offer distinct advantages and limitations for multi-residue detection, as summarized in Table 1.
Table 1: Recognition Elements for Multi-Residue Pesticide Detection
| Recognition Element | Mechanism of Cross-Reactivity | Strategies for Specificity Control | Typical Applications |
|---|---|---|---|
| Antibodies [80] | Shared epitope recognition; binding site flexibility | Hapten design; heterologous coating antigens; phage display libraries | ELISA, lateral flow immunoassays, immunosensors |
| Aptamers [9] | Structural similarity in target molecules; flexible folding | SELEX optimization; post-SELEX modification; structure-guided mutagenesis | Optical and electrochemical aptasensors |
| Enzymes [5] | Active site interactions; inhibition mechanisms | Enzyme mutagenesis; enzyme arrays; inhibition profiling | Acetylcholinesterase sensors, peroxidase-based sensors |
| Whole Cells [9] | Multiple recognition pathways; stress responses | Genetic engineering; pathway-specific reporters; consortia | Bacterial biosensors, yeast-based assays |
Antibody engineering for controlled cross-reactivity has advanced significantly through computational design and immunization strategies. Generic antibodies can be produced by immunizing with "general-structure" haptens that preserve the common features of an entire pesticide class while varying substituent groups [80]. For instance, antibodies recognizing multiple organophosphorus pesticides have been developed using haptens containing the O,O-diethyl thiophosphate moiety and a benzene ring, resulting in broad but class-specific recognition [80]. Computational approaches such as molecular modeling and quantitative structure-activity relationship (QSAR) studies enable rational hapten design by predicting antibody-analytic interaction patterns and optimizing steric and electronic complementarity before synthetic efforts [80].
Aptamer development through Systematic Evolution of Ligands by Exponential Enrichment (SELEX) offers precise control over specificity through counter-selection against non-target compounds and stringent selection conditions [9]. Post-SELEX modification through sequence optimization and structural tuning can further refine cross-reactivity profiles. Unlike antibodies, aptamers can be thermally denatured and regenerated, allowing for enhanced sensor reusability and stability across varied operating conditions [9].
Enzyme engineering for biosensors primarily focuses on modulating sensitivity to inhibition by different pesticides. Genetic modification of enzymes like acetylcholinesterase (AChE) has produced variants with differential sensitivity patterns to organophosphates and carbamates, enabling the creation of sensor arrays that can discriminate between pesticide classes [5]. Similarly, the development of enzyme-based biosensors utilizing photosynthetic system II, alkaline phosphatase, cytochrome P450A1, peroxidase, tyrosinase, laccase, urease, and aldehyde dehydrogenase expands the toolbox for detecting various pesticide classes through different inhibition mechanisms [5].
Sensor Design and Data Analysis Strategies
Advanced sensor architectures and data analysis methods provide additional layers of specificity control in multi-residue detection. Multi-transducer arrays incorporating different recognition elements or transduction mechanisms generate response patterns that can be deconvoluted to identify and quantify individual analytes in mixtures [5]. For example, electrochemical sensor arrays with multiple working electrodes, each modified with a different enzyme variant or recognition element, can produce distinctive response patterns for different pesticides [10].
Chemometric methods dramatically enhance the information extracted from sensor arrays. Artificial neural networks (ANNs), partial least squares (PLS) regression, and related multivariate analysis techniques can resolve individual component concentrations from complex mixture responses [5]. In one demonstration, an array of four acetylcholinesterase biosensors from different biological sources (electric eel, bovine erythrocytes, rat brain, and Drosophila melanogaster) combined with ANN analysis successfully discriminated between paraoxon and carbofuran in mixtures with prediction errors of 0.9 μg L−1 and 1.4 μg L−1, respectively [5]. Further refinement using genetically engineered enzyme variants improved discrimination capability and reduced the number of required sensing elements [5].
Sample preparation integration represents another critical strategy for managing cross-reactivity. Incorporating microfluidic systems with biosensors enables automated sample cleanup, preconcentration, and matrix removal, significantly reducing nonspecific interference [3] [10]. The integration of molecularly imprinted polymers (MIPs) as synthetic recognition elements or pre-concentration media offers an alternative approach to enhancing specificity, particularly for small molecules that challenge biological recognition systems [10] [80].
Experimental Protocols for Specificity Assessment
Cross-Reactivity Profiling
Comprehensive specificity assessment is essential for validating multi-residue biosensors. The following protocol outlines a standardized approach for cross-reactivity profiling:
Materials and Reagents:
- Purified biosensor recognition element (antibody, aptamer, enzyme, etc.)
- Target analyte and structural analogs (minimum 20-30 related compounds)
- Negative control compounds (chemically distinct from target class)
- Assay buffers and signal generation reagents
- Appropriate transducer platform (electrochemical, optical, piezoelectric)
Procedure:
- Prepare serial dilutions of each test compound across a concentration range spanning at least 6 orders of magnitude (e.g., 10−3 M to 10−9 M).
- For each concentration, perform the standard detection protocol using the biosensor platform.
- Record dose-response curves for all compounds, including the target analyte.
- Calculate IC50 values (concentration producing 50% inhibition or 50% of maximum signal) for each compound from the dose-response curves.
- Determine cross-reactivity percentages using the formula: % CR = (IC50 of target analyte / IC50 of cross-reactant) × 100
- Classify compounds with cross-reactivity >50% as strong cross-reactants, 10-50% as moderate, 1-10% as weak, and <1% as negligible.
Data Interpretation: The cross-reactivity profile reveals the specificity breadth of the biosensor. High cross-reactivity with structurally similar compounds within the same pesticide class may be desirable for class-specific detection, while significant cross-reactivity with unrelated compounds indicates potential false positive issues in practical applications [5] [80]. This profiling should be conducted across multiple lots of recognition elements and under varied environmental conditions (pH, temperature, ionic strength) to assess robustness.
Matrix Effect Evaluation
Assessing matrix effects is crucial for determining real-world applicability. The following protocol evaluates and mitigates matrix interference:
Materials and Reagents:
- Representative sample matrices (e.g., tea leaves, fruits, vegetables, water)
- QuEChERS extraction kits or alternative cleanup materials
- Fortification standards (target analytes)
- Internal standards (when applicable)
Procedure:
- Prepare matrix-matched standards by fortifying blank matrix extracts with known concentrations of target analytes.
- Prepare solvent-based standards at identical concentrations.
- Analyze both sets using the biosensor platform and compare calibration curves.
- Calculate matrix effect (ME) using: % ME = (Slope_matrix / Slopesolvent − 1) × 100
- For significant matrix effects (>±20%), implement cleanup procedures:
- Reassess matrix effects after cleanup implementation.
Validation: Test the optimized protocol across multiple matrix types and contamination levels. Include samples fortified with likely cross-reactants to verify that cleanup procedures do not disproportionately affect certain analytes [81] [82]. The determination of overall uncertainty should incorporate contributions from both cross-reactivity and residual matrix effects.
Emerging Solutions and Future Directions
Advanced Materials and Interfaces
Nanomaterial integration offers promising pathways for enhancing specificity in multi-residue biosensors. Metal-organic frameworks (MOFs), graphene oxide (GO), and molecularly imprinted polymers (MIPs) can be engineered with precise pore sizes and surface functionalities that provide secondary selectivity through size exclusion and chemical interactions [3] [10]. These materials can serve as preconcentration media, separation layers, or signal amplification components that enhance the specificity of the overall sensing platform. For instance, MOFs with tunable pore sizes can selectively exclude larger interferents while concentrating target analytes, effectively functioning as a preliminary specificity filter [10].
Hybrid systems combining multiple recognition mechanisms in a single sensor create complementary verification pathways that reduce false positives. For example, a sensor might sequentially employ size-based separation (nanoporous membrane), affinity selection (aptamer), and catalytic specificity (enzyme) before signal transduction, creating a multi-stage specificity verification system [10]. Similarly, the development of multifunctional nanomaterials that combine recognition, separation, and signal transduction capabilities in a single construct represents an emerging approach to simplifying complex multi-residue assays while maintaining specificity [3] [10].
Artificial Intelligence and Data Science
Machine learning algorithms are revolutionizing cross-reactivity management through advanced pattern recognition. Deep learning networks can be trained on large datasets of sensor responses to complex mixtures, learning to recognize subtle response patterns that distinguish target analytes from cross-reactants [3] [5]. These approaches are particularly powerful when combined with sensor arrays, where the collective response pattern provides a distinctive "fingerprint" for each analyte and mixture composition.
The integration of bioinformatics and computational chemistry tools enables predictive modeling of cross-reactivity early in the biosensor design process. Virtual screening of potential recognition elements against compound libraries can identify likely cross-reactants before experimental validation, guiding the selection of recognition elements with desired specificity profiles [5] [80]. As these computational methods improve, they will enable rational design of biosensors with predetermined specificity boundaries, potentially including built-in digital compensation for known cross-reactivities.
Diagram: Specificity Evaluation Workflow for Multi-Residue Biosensors
The Scientist's Toolkit: Essential Reagents and Materials
Table 2: Key Research Reagents for Cross-Reactivity Management
| Reagent/Material | Function in Specificity Control | Application Notes |
|---|---|---|
| Broad-Specificity Antibodies [80] | Recognition of multiple related analytes | Generated through generic hapten design; require careful characterization of cross-reactivity profiles |
| Engineered Aptamers [9] | Synthetic recognition elements with tunable specificity | Selected via SELEX; modified with functional groups for enhanced specificity |
| Enzyme Variants [5] | Differential inhibition patterns for pesticide discrimination | Genetically modified acetylcholinesterase variants with distinct sensitivity profiles |
| Molecularly Imprinted Polymers (MIPs) [10] [80] | Synthetic receptors with predetermined selectivity | Custom synthesized for target analytes; reusable and stable under harsh conditions |
| QuEChERS Extraction Kits [81] [82] | Sample cleanup and matrix interference removal | Standardized kits containing MgSO4, NaCl, PSA, C18, and other sorbents for efficient sample preparation |
| Chemometric Software [5] | Data analysis for resolving mixture components | ANN, PLS, and other multivariate algorithms for signal deconvolution |
Effective management of cross-reactivity requires not only the core recognition elements but also supporting reagents that enable precise characterization and mitigation. Reference standards for target analytes and potential cross-reactants are essential for comprehensive specificity profiling [5] [80]. Matrix-matched calibration standards prepared in blank sample extracts facilitate accurate quantification and matrix effect assessment [81]. Internal standards, particularly isotope-labeled analogs when using mass spectrometric detection, help correct for recovery variations and sample preparation inconsistencies [81].
Specialized surface chemistry reagents for sensor functionalization play a critical role in minimizing nonspecific binding. Poly(ethylene glycol) derivatives, blocking proteins, and surface passivation agents reduce background interference, thereby enhancing signal-to-noise ratios and effective specificity [10] [9]. For regenerative sensors, regeneration buffers that disrupt analyte-recognition element interactions without damaging the sensing surface enable multiple measurement cycles, facilitating more extensive characterization and validation [9].
Cross-reactivity presents both a challenge and opportunity in multi-residue biosensor development. While uncontrolled cross-reactivity compromises analytical accuracy, strategically managed broad-specificity enables efficient class-based monitoring and comprehensive contaminant screening. The evolving toolkit for addressing cross-reactivity—spanning recognition element engineering, advanced materials integration, sophisticated data analysis, and comprehensive validation protocols—provides a multifaceted approach to this fundamental challenge. As biosensor technology advances toward increasingly complex multi-analyte applications, the systematic management of cross-reactivity will remain essential for delivering accurate, reliable analytical data to support food safety monitoring, environmental protection, and public health initiatives.
The transition of biosensing technology from controlled laboratory settings to real-world analysis represents a critical juncture in pesticide detection research. Demonstrating reliability against complex sample matrices is paramount for regulatory acceptance and practical implementation. This guide details the core validation methodologies of spike recovery and agricultural product analysis, providing researchers with the experimental framework necessary to establish biosensor credibility for food safety and environmental monitoring [3] [4].
Fundamentals of Spike Recovery Assays
Spike recovery experiments are the cornerstone of analytical method validation, quantitatively assessing a biosensor's accuracy by measuring its ability to detect a known quantity of analyte (the "spike") added to a real sample matrix [4].
The core calculation is: Recovery (%) = (Measured Concentration / Spiked Concentration) × 100%.
Acceptable recovery ranges are typically 70-120% for pesticide residue analysis, depending on the analyte and matrix complexity. This process validates that the sample matrix does not cause significant signal suppression (matrix effects) or enhancement, ensuring quantitative accuracy [3].
Experimental Protocols for Validation
Standard Spike Recovery Protocol
The following procedure is adapted from methodologies used to validate biosensors for food samples like fruits and juices [4].
- Sample Preparation: Obtain and homogenize the agricultural product (e.g., tea leaves, fruits). For solid samples, this often involves crushing and lyophilization to create a uniform powder [3].
- Matrix Blank Analysis: Analyze several portions of the unspiked sample to confirm the initial absence of the target pesticide.
- Fortification: Spike known quantities of the target pesticide standard into replicate portions of the sample matrix. Critical concentrations to test include:
- The method's Limit of Detection (LOD)
- The Maximum Residue Limit (MRL) as defined by regulations like GB 2763-2021 or EU standards [3]
- A concentration 10x the MRL
- Extraction & Analysis: Process the spiked samples using the standard extraction protocol for the biosensor (e.g., solvent extraction, filtration). Analyze the extracts using the biosensor platform.
- Data Calculation: Calculate the recovery percentage for each replicate and concentration level. Determine the mean recovery and relative standard deviation (RSD) to evaluate accuracy and precision.
Analysis of Real Agricultural Products
Validation must extend to incurred residues in real products from the supply chain. A typical workflow for analyzing pesticides in tea leaves, for instance, involves the following steps, which can be adapted for other crops [3]:
- Sampling: Collect representative samples from the "tea garden-to-cup" chain, including fresh leaves, processed leaves, and ready-to-drink products.
- Extraction: Subject the sample to a validated extraction process. For tea, this often involves solvent extraction (e.g., acetonitrile) and cleanup steps to remove interferents like polyphenols and alkaloids that can foul the biosensor [3].
- Biosensor Analysis: Analyze the cleaned extract. Common detection methods include:
- Confirmation: Validate biosensor results against a standard reference method, such as Gas Chromatography-Mass Spectrometry (GC-MS) or High-Performance Liquid Chromatography (HPLC), to confirm accuracy [3].
The diagram below illustrates the logical workflow for validating a biosensor using real agricultural samples.
Performance Data of Validated Biosensors
The following tables summarize the experimental performance of various biosensor platforms for pesticide detection in real samples as reported in recent literature.
Table 1: Performance of Enzyme-Based Biosensors in Real Sample Analysis
| Biosensor Type | Target Pesticide | Sample Matrix | Spike Recovery (%) | Limit of Detection (LOD) | Reference Method |
|---|---|---|---|---|---|
| Fluorescent EST2 Mutant [4] | Paraoxon, Methyl-paraoxon | Fruits, Juices | Significant quenching at equimolar (nM) levels | Nanomolar (nM) range | Fluorescence quenching |
| Acetylcholinesterase (AChE) Inhibition [5] | Paraoxon, Carbofuran | Water, Food samples | Quantitative in 0–20 μg L⁻¹ range | Microgram per liter (μg L⁻¹) | Chromatography |
| Thermostable Esterase-2 (EST2) [4] | Organophosphates (14 compounds screened) | Real food samples | Complete inhibition with paraoxon | Not Specified | Enzymatic activity assay |
Table 2: Performance of Other Biosensing Platforms in Complex Matrices
| Biosensor Type | Target Analyte | Sample Matrix | Key Performance Metric | Handling of Matrix Effects |
|---|---|---|---|---|
| SERS-Aptamer Biosensor [16] | Pesticide Residues | Agri-foods | High sensitivity, "finger-print" identification | Bio-affinity elements enhance selectivity against interference |
| Electrochemical / Fluorescent [3] | Pesticides, Heavy Metals | Tea Leaves | Resistant to interference from tea polyphenols, alkaloids | Sample cleanup and extraction protocols |
| Cell-Based (E. coli) [9] | Pyrethroid Insecticide | Water | Detection limit of 3 ng/mL | Robust across various application conditions |
The Scientist's Toolkit: Key Research Reagents and Materials
Successful validation requires a suite of specialized reagents and materials. The following table details essential components for developing and validating biosensors for pesticide detection.
Table 3: Essential Research Reagents and Materials for Biosensor Validation
| Reagent / Material | Function in Validation | Specific Examples / Notes |
|---|---|---|
| Biological Recognition Elements | Provides selectivity and specificity for the target analyte. | Acetylcholinesterase (AChE) for neurotoxic insecticides [5]; Thermostable EST2 mutants for organophosphates [4]; Antibodies and aptamers for SERS biosensors [16]. |
| Pesticide Analytical Standards | Used for spike recovery experiments and calibration curve generation. | Certified reference materials for target pesticides (e.g., paraoxon, carbofuran, pyrethroids) at high purity [5] [4]. |
| Nanomaterial-Enhanced Substrates | Enhances signal transduction, improving sensitivity and lowering LOD. | Noble metal nanoparticles (Au, Ag) for SERS "hot spots" [16]; Metal-organic frameworks (MOFs) and gold nanoparticles in electrochemical and fluorescent biosensors [3]. |
| Sample Preparation Kits | Isolates the analyte and removes matrix interferents. | Solid-phase extraction (SPE) cartridges; Solvent extraction kits; Cleanup columns for removing polyphenols from tea extracts [3]. |
| Signal Transduction Reagents | Generates a measurable signal (optical, electrochemical) upon analyte binding. | Fluorescent probes (e.g., for EST2) [4]; Chromogenic reagents like DTNB for AChE assays [5]; Redox mediators for electrochemical sensors. |
Advanced Validation: Chemometrics and Multi-Analyte Detection
Modern biosensing research increasingly focuses on detecting multiple pesticides simultaneously. This is often achieved by using an array of biosensors with different selectivities, combined with chemometric analysis [5].
For example, artificial neural networks (ANNs) can resolve mixtures of pesticides like paraoxon and carbofuran. This is done by training the algorithm with inhibition data from an array of biosensors, each incorporating a different enzyme variant (e.g., wild-type and mutant AChE from Drosophila melanogaster with varying sensitivity profiles) [5].
The diagram below illustrates the workflow for this advanced, multi-analyte detection and validation strategy.
This technical guide provides a comprehensive cost-benefit analysis of biosensors for pesticide detection against traditional chromatographic methods. For researchers and scientists in drug development, the adoption of biosensor technology represents a paradigm shift, trading the high capital investment and operational complexity of conventional equipment for rapid, cost-effective, and field-deployable analytical capabilities. While traditional techniques like gas chromatography-mass spectrometry (GC-MS) and high-performance liquid chromatography (HPLC) remain the gold standard for regulatory validation, their requirement for instrumentation costing over USD 1 million and highly skilled operators limits their accessibility for rapid screening. In contrast, biosensors leverage nanomaterials and biological recognition elements to achieve detection limits from nM to pM, with electrochemical platforms dominating due to their simplicity, low cost, and portability. The emerging integration of artificial intelligence (AI), microfluidics, and smartphone-based detection further enhances the value proposition of biosensors, positioning them as transformative tools for decentralized quality control and real-time monitoring throughout the agricultural supply chain.
The relentless pursuit of agricultural productivity has made pesticides ubiquitous environmental contaminants, necessitating robust detection methodologies to safeguard food security and public health. For decades, the analytical backbone for pesticide residue analysis has relied on sophisticated laboratory-based techniques, primarily chromatography coupled with mass spectrometry. These methods, while unarguably precise, have created significant bottlenecks in the monitoring pipeline due to their inherent cost, complexity, and inability to provide real-time, on-site data [3]. The research community has responded by pioneering biosensor technology—analytical devices that integrate a biological recognition element with a physicochemical detector. This whitepaper frames the ensuing cost-benefit analysis within the broader thesis of biosensor research: to develop accessible, performant, and sustainable analytical tools that democratize pesticide monitoring from centralized laboratories to the point of need, without compromising on analytical performance.
Comparative Analysis of Detection Platforms
Traditional Chromatographic and Spectroscopic Methods
Traditional techniques are characterized by high capital expenditure and operational demands, establishing a high barrier to entry for routine or field-based analysis.
Table 1: Cost and Operational Requirements of Traditional Detection Methods
| Method | Typical Instrumentation Cost (USD) | Key Operational Expenses | Analysis Time | Personnel Requirements |
|---|---|---|---|---|
| Gas Chromatography-Mass Spectrometry (GC-MS) | ~$100,000 - $250,000 | High-purity carrier gases, certified standards, solvent disposal, maintenance contracts | 30-60 minutes per sample | Highly trained technician/analyst for operation, data interpretation, and maintenance |
| Liquid Chromatography-Mass Spectrometry (LC-MS/MS) | ~$150,000 - $300,000 | High-purity solvents, solvent disposal, costly columns, certified standards | 20-40 minutes per sample | Highly trained technician/analyst with specialized MS knowledge |
| Inductively Coupled Plasma Mass Spectrometry (ICP-MS) | >$1,000,000 | High-purity argon gas, sample introduction components, certified metal standards | Several hours (incl. sample digestion) | Expert operator for method development and complex matrix analysis |
| High-Performance Liquid Chromatography (HPLC) | ~$50,000 - $100,000 | Solvent procurement and disposal, column replacement, degassing systems | 20-40 minutes per sample | Trained analyst for operation and troubleshooting |
The limitations of these methods are systemic. They necessitate intricate sample pretreatment (e.g., solid-phase extraction, microwave digestion), substantial operational expenses, and prolonged detection cycles ill-suited for preliminary screening [3]. Furthermore, their confinement to laboratory settings prevents timely decision-making in the field, creating a critical gap in the food safety monitoring framework [9].
Biosensor Platforms
Biosensors address the limitations of traditional methods by offering a versatile and cost-effective alternative. Their design combines a biorecognition element (e.g., enzyme, antibody, aptamer) with a transducer that converts the biological event into a quantifiable signal.
Table 2: Cost and Performance Profile of Major Biosensor Platforms
| Biosensor Type | Estimated Development/Unit Cost | Key Operational Expenses | Analysis Time | Limit of Detection (LOD) |
|---|---|---|---|---|
| Electrochemical | Low (Screen-printed electrodes: cents to few dollars) | Buffer solutions, minimal solvent use, stable bioreagents | 5-30 minutes | nM to pM range [10] |
| Fluorescent | Low to Moderate | Fluorescent labels/dyes, light source | 10-30 minutes | nM to pM range [3] |
| Colorimetric | Very Low (Paper-based devices) | Colorogenic substrates (e.g., TMB) | 5-20 minutes | nM range [2] |
| Surface Plasmon Resonance (SPR) | High | Sensor chips, specific antibodies/aptamers | 10-30 minutes | pM range [3] |
The primary cost-benefit advantage of biosensors lies in their potential for low-cost fabrication (e.g., screen-printed electrodes, paper-based analytical devices) and dramatically reduced operational overhead due to minimal reagent consumption and no requirement for expensive gases or organic solvents [83]. The rapid response time, often under 30 minutes, enables high-throughput screening [3]. Furthermore, the portability of these systems allows for on-site analysis, empowering farmers and food safety inspectors with immediate results [84].
Detailed Breakdown of Cost and Operational Factors
Equipment and Capital Investment
The financial barrier for establishing analytical capability is vastly different between the two paradigms.
- Traditional Methods: Require a significant initial capital investment, often exceeding hundreds of thousands of dollars for a single LC-MS or ICP-MS system [3] [8]. The market for these technologies is mature, with growth driven by incremental improvements in sensitivity and throughput.
- Biosensor Methods: The core hardware for electrochemical or optical readouts can be engineered to be inexpensive. Research focuses on leveraging ubiquitous technology, such as smartphones, for signal detection and processing, effectively creating a "lab-in-a-phone" [84]. The global pesticide detection market, valued at approximately USD 1.50 billion in 2025, is stimulated by the adoption of these sophisticated, yet affordable, technologies [8]. The capital is redirected from bulky equipment to the synthesis and functionalization of novel materials.
Operational and Consumable Expenses
Recurring costs present another area of stark contrast, directly impacting the sustainability and frequency of testing.
- Traditional Methods: Operational costs are persistently high. They include procurement of high-purity gases (GC-MS, ICP-MS), organic solvents (HPLC, LC-MS), which entail ongoing costs and create hazardous waste requiring disposal. Consumables like analytical columns are also costly and have a limited lifespan [3] [83].
- Biosensor Methods: Operational expenses are minimal. They primarily involve buffer solutions and the cost of maintaining the stability of the biological recognition element (enzyme, antibody, etc.). The use of nanomaterials like gold nanoparticles, graphene oxide, and carbon nanotubes enhances sensitivity and stability, potentially extending the sensor's operational life and reducing the need for frequent recalibration or replacement [2] [85].
Personnel and Expertise Requirements
The human resource requirement is a critical, often overlooked, component of the cost-benefit equation.
- Traditional Methods: These techniques are entirely dependent on skilled personnel—analysts with extensive training to operate sophisticated instrumentation, develop methods, interpret complex chromatographic and spectral data, and perform meticulous maintenance [5]. This specialization increases labor costs and limits the geographical deployment of these technologies.
- Biosensor Methods: The strategic goal of biosensor design is user-friendliness and automation. Devices are being developed for simple operation, such as dip-and-read test strips or integrated microfluidic chips, which require minimal technical expertise [84] [9]. This drastically reduces the training burden and allows non-specialists, such as farmers or food supply chain workers, to perform reliable monitoring, enabling a distributed testing model.
Experimental Protocols in Biosensor Research
The development and validation of a novel biosensor follow a structured experimental workflow, encompassing material synthesis, bioreceptor immobilization, and analytical characterization.
Protocol: Fabrication of an Electrochemical Aptasensor for Organophosphorus Pesticide Detection
This protocol is representative of contemporary research aimed at creating sensitive and selective field-deployable sensors [83] [85].
- Electrode Modification with Nanomaterials:
- Objective: To enhance the electrochemical conductivity and surface area of the transducer.
- Procedure: A glassy carbon electrode (GCE) is polished to a mirror finish with alumina slurry and thoroughly rinsed. A dispersion of graphene oxide (GO) is drop-cast onto the GCE surface and dried, forming a thin film. The GO-modified electrode is then electrochemically reduced to form conductive reduced graphene oxide (rGO).
- Immobilization of the Biorecognition Element:
- Objective: To attach DNA aptamers specific to the target pesticide (e.g., chlorpyrifos) to the electrode surface.
- Procedure: The rGO/GCE is incubated in a solution of the synthesized aptamer. The π-π stacking interactions between the nucleobases of the aptamer and the rGO surface facilitate stable immobilization. The electrode is then rinsed to remove unbound aptamers.
- Blocking of Non-Specific Sites:
- Objective: To prevent false positive signals from the non-specific adsorption of non-target molecules in complex samples.
- Procedure: The aptamer-functionalized electrode is incubated in a solution of bovine serum albumin (BSA) or a similar blocking agent, which coats any remaining active sites on the electrode surface.
- Electrochemical Detection and Quantification:
- Objective: To measure the concentration of the target pesticide based on the change in electrochemical signal.
- Procedure: The fabricated biosensor is immersed in a standard or sample solution containing the pesticide. After a brief incubation, electrochemical measurements (e.g., electrochemical impedance spectroscopy (EIS) or differential pulse voltammetry (DPV)) are performed. The binding of the pesticide to the aptamer causes a measurable change in charge transfer resistance (for EIS) or current (for DPV), which is correlated with the pesticide concentration using a pre-established calibration curve.
The Scientist's Toolkit: Essential Research Reagents and Materials
Table 3: Key Research Reagent Solutions for Biosensor Development
| Reagent/Material | Function in Biosensor Development | Example Application |
|---|---|---|
| Gold Nanoparticles (AuNPs) | Signal amplification; platform for biomolecule immobilization due to high surface area and biocompatibility. | Colorimetric sensors; enhancing electrochemical signal in aptasensors [85]. |
| Graphene Oxide (GO) & Reduced GO (rGO) | Electrode nanomodifier; provides high electrical conductivity and large surface area for enhanced sensitivity. | Electrochemical sensors for carbamate and organophosphate pesticides [83]. |
| Acetylcholinesterase (AChE) Enzyme | Biorecognition element; inhibition by organophosphates/carbamates is measured electrochemically or optically. | Enzyme-based biosensors for neurotoxic insecticides [5]. |
| DNA/RNA Aptamers | Synthetic biorecognition element; selected for high affinity to specific targets via SELEX process. | Aptasensors for various pesticides, offering high specificity and stability [9]. |
| Molecularly Imprinted Polymers (MIPs) | Biomimetic synthetic receptors; contain tailor-made cavities for specific target molecule recognition. | "Artificial antibody" sensors for robust and cost-effective pesticide detection [10] [2]. |
The future trajectory of biosensor research is focused on overcoming remaining challenges and amplifying the cost-benefit advantage. Key areas of development include:
- Multiplexing and Multi-Residue Detection: Efforts are geared towards creating array-based sensors capable of simultaneously quantifying multiple pesticide residues in a single test, enhancing efficiency over single-analyte methods [3] [8].
- Integration of AI and Data Analytics: The use of artificial neural networks (ANNs) and chemometric methods is being explored to deconvolute signals from complex mixtures, improving the accuracy of multi-analyte detection and data interpretation [5].
- Advanced Materials and Manufacturing: The exploration of single-atom nanozymes (SAzymes) and other functional nanomaterials aims to create more stable and sensitive recognition elements than their natural counterparts [2]. Additive manufacturing (3D printing) is being leveraged for cost-effective mass production of sensor components [86].
Conclusion The cost-benefit analysis unequivocally demonstrates that biosensors present a compelling alternative to traditional chromatographic methods for pesticide detection, particularly in applications requiring speed, portability, and cost-effectiveness. The paradigm shift involves accepting a different set of trade-offs: biosensors forego the universality and extensive validation history of GC-MS/LC-MS for unparalleled advantages in operational agility and cost efficiency. The initial and recurring costs are substantially lower, the analysis is exponentially faster, and the expertise required is vastly reduced. For the research community, the future lies in refining the sensitivity, specificity, and robustness of biosensors to match the analytical rigor of traditional methods while preserving their inherent economic and practical benefits. The ultimate goal is the establishment of a dense, real-time monitoring network across the "farm-to-fork" supply chain, a vision that is only attainable through the widespread deployment of biosensing technology.
Conclusion
Biosensors represent a paradigm shift in pesticide detection, moving analysis from centralized laboratories to the field with unprecedented speed, sensitivity, and cost-effectiveness. The integration of advanced nanomaterials like MOFs and nanozymes, coupled with innovative biorecognition elements such as aptamers, has successfully addressed longstanding challenges of stability and specificity. While hurdles remain in achieving the multi-residue specificity of gold-standard chromatographic methods, the trajectory of biosensor development is clear. Future advancements will be driven by the integration of artificial intelligence for rational sensor design, the expansion of multimodal sensing platforms for robust results, and a focused push toward commercializing portable, user-friendly devices. For biomedical and clinical research, these technologies offer a viable path for rapid environmental monitoring and the potential for novel diagnostic applications stemming from exposure assessment.
References
- 1. Enzyme and nanozyme biosensors based on MOFs for ... [https://www.sciencedirect.com/science/article/abs/pii/S0165993625002493]
- 2. Research Advances in Nanosensor for Pesticide Detection in ... [https://pmc.ncbi.nlm.nih.gov/articles/PMC12298915/]
- 3. Research Progress of Biosensors in the Detection ... [https://www.mdpi.com/2079-6374/15/12/778]
- 4. Use of biosensors for rapid and sensitive detection of ... - EFSA [https://www.efsa.europa.eu/en/efsajournal/pub/e200922]
- 5. Advances in Enzyme-Based Biosensors for Pesticide ... [https://pmc.ncbi.nlm.nih.gov/articles/PMC6022933/]
- 6. Biosensors in Microbial Ecology: Revolutionizing Food ... [https://pmc.ncbi.nlm.nih.gov/articles/PMC12300841/]
- 7. Grand Challenges in Biosensors and Biomolecular ... [https://www.frontiersin.org/journals/bioengineering-and-biotechnology/articles/10.3389/fbioe.2021.707615/full]
- 8. Pesticide Detection Market Size & Trends 2025-2035 [https://www.futuremarketinsights.com/reports/pesticide-detection-market]
- 9. A Review on the Application of Biosensors for Monitoring ... [https://pmc.ncbi.nlm.nih.gov/articles/PMC12390133/]
- 10. Biomaterials and biosensing technologies in the detection ... [https://www.sciencedirect.com/science/article/abs/pii/S0010854525006800]
- 11. Organophosphorus pesticide detection directly on fruit peels [https://www.sciencedirect.com/science/article/pii/S0039914024014723]
- 12. Assessment of developed paper strip based sensor with ... [https://pmc.ncbi.nlm.nih.gov/articles/PMC9826873/]
- 13. Aptamers and antibodies in optical biosensing [https://link.springer.com/article/10.1007/s44371-025-00094-2]
- 14. Nanotechnology driven biorecognition element and label ... [https://www.sciencedirect.com/science/article/abs/pii/S2213343724023492]
- 15. Harnessing the power of biosensors for environmental ... [https://pmc.ncbi.nlm.nih.gov/articles/PMC11991957/]
- 16. Surface-enhanced Raman spectroscopy biosensor ... [https://link.springer.com/article/10.1007/s44462-025-00031-7]
- 17. Nucleic Acid Aptamer-Based Biosensors: A Review - PMC [https://pmc.ncbi.nlm.nih.gov/articles/PMC10741014/]
- 18. Recent advances in aptamer-based biosensing technology ... [https://www.frontiersin.org/journals/cell-and-developmental-biology/articles/10.3389/fcell.2025.1555687/full]
- 19. Development of a novel nucleic acid aptamer biosensor for ... [https://www.sciencedirect.com/science/article/pii/S0889157525005915]
- 20. Visual signal transduction for environmental stewardship [https://www.sciencedirect.com/science/article/abs/pii/S0304389424027924]
- 21. Piezoelectric biosensors: shedding light on principles and ... [https://pmc.ncbi.nlm.nih.gov/articles/PMC10920441/]
- 22. Challenges and Opportunities in Smart Biosensing for ... [https://pmc.ncbi.nlm.nih.gov/articles/PMC12455640/]
- 23. Novel biosensor detects genetically modified corn and soybean [https://ag.purdue.edu/news/2025/09/novel-biosensor-detects-genetically-modified-corn-and-soybean.html]
- 24. Comparison and Analysis of Several Quantitative ... [https://www.mdpi.com/2227-9717/11/6/1854]
- 25. A review on biosensor approaches for the detection of ... [https://www.sciencedirect.com/science/article/pii/S2666831925001389]
- 26. Trends in biosensing platforms for SARS-CoV-2 detection [https://pmc.ncbi.nlm.nih.gov/articles/PMC7817481/]
- 27. Acetylcholinesterase Biosensors for Electrochemical ... [https://pmc.ncbi.nlm.nih.gov/articles/PMC3872028/]
- 28. Acetylcholinesterase biosensors for electrochemical ... [https://www.sciencedirect.com/science/article/abs/pii/S0013935123005169]
- 29. Acetylcholinesterase Inhibition Assays for High-Throughput ... [https://pmc.ncbi.nlm.nih.gov/articles/PMC9440486/]
- 30. Acetylcholinesterase Biosensor Based on Functionalized ... [https://pmc.ncbi.nlm.nih.gov/articles/PMC9313315/]
- 31. Advances in Enzyme-Based Biosensors: Emerging Trends ... [https://www.mdpi.com/2673-4591/106/1/5]
- 32. Acetylcholinesterase Biosensor Based on Functionalized ... [https://www.mdpi.com/2079-6374/12/7/486]
- 33. Nanozymes expanding the boundaries of biocatalysis [https://www.nature.com/articles/s41467-025-62063-8]
- 34. A critical comparison of natural enzymes and nanozymes ... [https://www.sciencedirect.com/science/article/abs/pii/S0956566321005315]
- 35. Recent trends in nanozyme research and their potential ... [https://www.sciencedirect.com/science/article/pii/S2590262824000315]
- 36. Nanozyme-Powered Multimodal Sensing for Pesticide ... [https://www.mdpi.com/2304-8158/14/11/1957]
- 37. Nanozymes towards Personalized Diagnostics: A Recent ... [https://pmc.ncbi.nlm.nih.gov/articles/PMC10136715/]
- 38. Application of nanozyme-based biosensors in pesticide ... [https://pubs.rsc.org/en/content/articlelanding/2025/ma/d5ma00800j]
- 39. MOF-based sensor platforms for rapid detection of ... [https://www.sciencedirect.com/science/article/abs/pii/S027869152200374X]
- 40. The Versatility of Metal-Organic Frameworks-based ... [https://www.sciencedirect.com/science/article/pii/S2666831925001675]
- 41. Metal-organic framework for the extraction and detection of ... [https://pubmed.ncbi.nlm.nih.gov/33443797/]
- 42. Opportunities in functionalized metal-organic frameworks ... [https://pubmed.ncbi.nlm.nih.gov/40651338/]
- 43. Recent advances in enzyme-based metal nanoparticles as ... [https://www.sciencedirect.com/science/article/pii/S1359511325000352]
- 44. A fluorescence biosensor for organophosphorus pesticide ... [https://www.sciencedirect.com/science/article/pii/S1386142524014963]
- 45. A fluorescence biosensor for organophosphorus pesticide ... [https://pubmed.ncbi.nlm.nih.gov/39486239/]
- 46. Development and stabilization of a paper-based biosensor ... [https://chemrxiv.org/engage/chemrxiv/article-details/690e4a25a482cba122b2aef1]
- 47. Detection of pesticide residue distribution on fruit surfaces ... [https://pubs.rsc.org/en/content/articlelanding/2018/ra/c7ra11927e]
- 48. Detection of Pesticide Residues in Food Using Surface- ... [https://pubmed.ncbi.nlm.nih.gov/28726388/]
- 49. Frontiers | Nano-enabled biosensors in early detection of plant... [https://www.frontiersin.org/journals/nanotechnology/articles/10.3389/fnano.2025.1545792/full]
- 50. (PDF) Two-dimensional MXenes for detecting based on... pesticides [https://www.academia.edu/144768634/Two_dimensional_MXenes_for_detecting_pesticides_based_on_optical_and_electrochemical_biosensors]
- 51. A microfluidic paper-based fluorescent sensor integrated with a smartphone platform for rapid on-site detection of omethoate pesticide - ScienceDirect [https://www.sciencedirect.com/science/article/abs/pii/S0308814624028553]
- 52. Emerging biosensors integrated with microfluidic devices: a promising analytical tool for on-site detection of mycotoxins | npj Science of Food [https://www.nature.com/articles/s41538-025-00444-5]
- 53. Introduction to biosensors - PMC [https://pmc.ncbi.nlm.nih.gov/articles/PMC4986445/]
- 54. Materials and Methods of Biosensor Interfaces With Stability [https://www.frontiersin.org/journals/materials/articles/10.3389/fmats.2020.583739/full]
- 55. The advancement of biosensor design and construction ... [https://www.sciencedirect.com/science/article/pii/S2405805X25000158]
- 56. Biosensors, Volume 15, Issue 9 (September 2025) [https://www.mdpi.com/2079-6374/15/9]
- 57. An Experimental Framework for Developing Point-of-Need ... [https://pmc.ncbi.nlm.nih.gov/articles/PMC9688365/]
- 58. Sensitivity-Enhancing Strategies in Optical Biosensing - PMC [https://pmc.ncbi.nlm.nih.gov/articles/PMC7884068/]
- 59. Immobilization strategies to develop enzymatic biosensors [https://www.sciencedirect.com/science/article/abs/pii/S073497501100156X]
- 60. Immobilization of Enzyme Electrochemical Biosensors and ... [https://pmc.ncbi.nlm.nih.gov/articles/PMC10526424/]
- 61. Catalysis by Hybrid Nanomaterials - PMC [https://pmc.ncbi.nlm.nih.gov/articles/PMC7827644/]
- 62. Macromolecule–Nanoparticle-Based Hybrid Materials for ... [https://www.mdpi.com/2079-6374/14/6/277]
- 63. Recent Advances in Phthalocyanine-Based Hybrid ... [https://pmc.ncbi.nlm.nih.gov/articles/PMC11433738/]
- 64. Nanomaterials-based biosensor and their applications [https://www.sciencedirect.com/science/article/pii/S2405844023071372]
- 65. New Early Warning Strategies for Pesticide and Veterinary ... [https://www.sciencedirect.com/science/article/abs/pii/S0165993625004303]
- 66. Recent Advances in Nanomaterial-Based Biosensors for ... [https://pmc.ncbi.nlm.nih.gov/articles/PMC9405907/]
- 67. Recent advancements in hybrid electrochemical ... [https://www.sciencedirect.com/science/article/pii/S2773207X24002082]
- 68. A novel multimodal nano-sensor detection system based ... [https://www.sciencedirect.com/science/article/abs/pii/S0956713524007722]
- 69. Multimodal Fusion-Driven Pesticide Residue Detection [https://pmc.ncbi.nlm.nih.gov/articles/PMC12430378/]
- 70. Pesticide Residue Analysis in Food: Advances, Challenges ... [https://www.chromatographyonline.com/view/pesticide-residue-analysis-in-food-advances-challenges-and-case-studies]
- 71. Comprehensive chiral GC-MS/MS and LC-MS/MS methods ... [https://www.sciencedirect.com/science/article/abs/pii/S0039914022007536]
- 72. Comparison of GC-MS and GC×GC-MS in the Analysis ... [https://pmc.ncbi.nlm.nih.gov/articles/PMC4849136/]
- 73. Comparison of LC–MS and GC–MS for the Analysis ... [https://www.spectroscopyonline.com/view/comparison-lc-ms-and-gc-ms-analysis-pharmaceuticals-and-personal-care-products-surface-water-and-tre]
- 74. Pesticide residue detection techniques for increasing ... [https://www.frontiersin.org/journals/plant-science/articles/10.3389/fpls.2025.1694779/full]
- 75. Harnessing the power of biosensors for environmental ... [https://link.springer.com/article/10.1007/s00253-025-13461-x]
- 76. A Review on Biosensors and Recent Development of ... [https://pmc.ncbi.nlm.nih.gov/articles/PMC7915135/]
- 77. Innovations in Biosensor Technologies for Healthcare ... [https://www.mdpi.com/1424-8220/24/16/5143]
- 78. When lower isn't always better in biosensor research and ... [https://www.sciencedirect.com/science/article/abs/pii/S0956566324006766]
- 79. Recent Advances in Biosensor Technology for Potential ... [https://www.frontiersin.org/journals/bioengineering-and-biotechnology/articles/10.3389/fbioe.2016.00011/full]
- 80. Rapid Multi-Residue Detection Methods for Pesticides and ... [https://www.mdpi.com/1420-3049/25/16/3590]
- 81. High resolution mass spectrometry targeted analysis and ... [https://www.sciencedirect.com/science/article/abs/pii/S0269749124008571]
- 82. Evaluation of the QuEChERS Method and Gas ... [https://pmc.ncbi.nlm.nih.gov/articles/PMC3017303/]
- 83. Recent trends on electrochemical carbon-based ... [https://www.sciencedirect.com/science/article/abs/pii/S2214158822000058]
- 84. Sensors and Biosensors as Viable Alternatives in the ... [https://www.mdpi.com/2227-9040/13/8/299]
- 85. Recent Advances in Nanomaterial-Based Biosensors for ... [https://www.mdpi.com/2079-6374/12/8/572]
- 86. Advancing food safety and quality assessment - RSC Publishing [https://pubs.rsc.org/en/content/articlehtml/2025/ay/d5ay00647c]