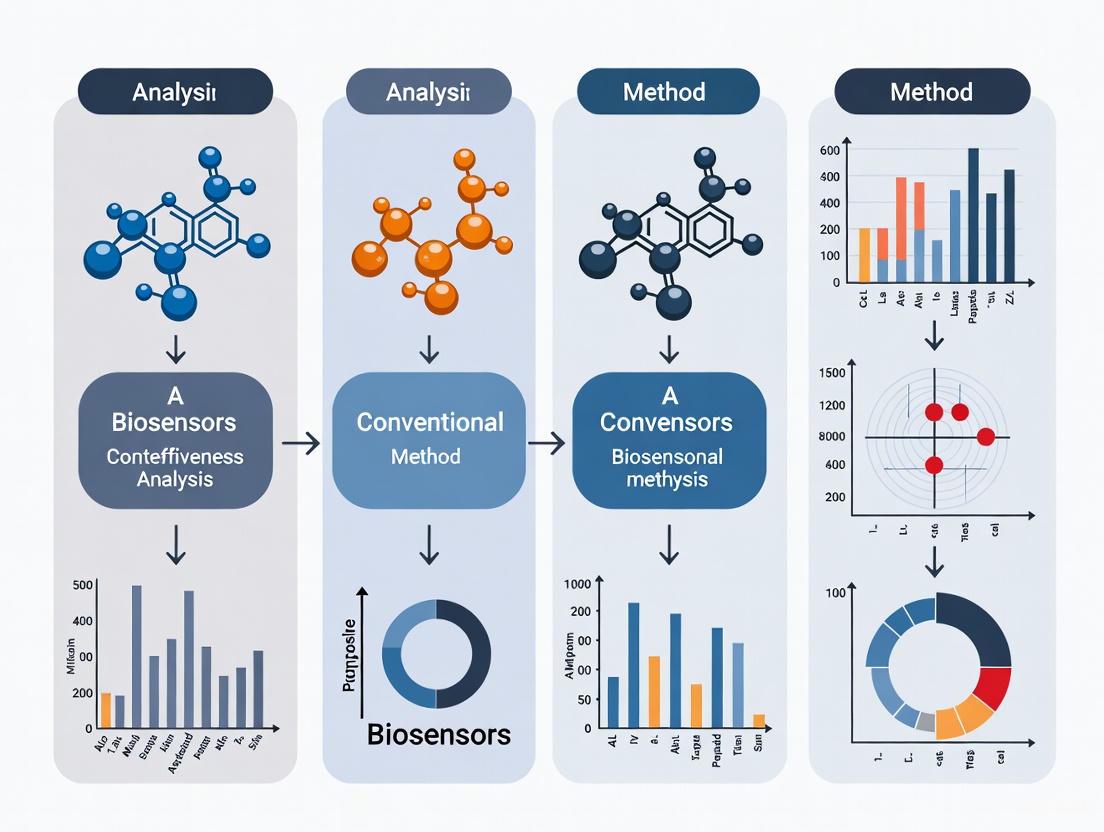
Biosensors vs. Conventional Methods: A Cost-Effectiveness Analysis for Modern Biomedical Research
This article provides a comprehensive cost-effectiveness analysis of biosensors versus conventional analytical methods for researchers, scientists, and drug development professionals.
Biosensors vs. Conventional Methods: A Cost-Effectiveness Analysis for Modern Biomedical Research
Abstract
This article provides a comprehensive cost-effectiveness analysis of biosensors versus conventional analytical methods for researchers, scientists, and drug development professionals. It explores the foundational principles of biosensor technology, examines its methodological applications in real-world settings like drug manufacturing and clinical diagnostics, addresses key challenges in optimization and commercialization, and validates the economic and performance advantages through comparative data. The analysis concludes that biosensors offer a paradigm shift in bioanalysis, delivering significant cost savings, enhanced speed, and superior performance, with profound implications for the efficiency and scope of future biomedical research.
Understanding Biosensors: Core Principles and Economic Drivers in the Bioanalysis Market
Biosensors are analytical devices that integrate a biological recognition element with a physicochemical transducer to detect specific analytes, converting biological events into measurable signals [1] [2]. These devices are pivotal in various fields, including clinical diagnostics, environmental monitoring, and food safety, due to their high specificity, sensitivity, and potential for real-time analysis [1] [2]. This guide objectively compares the performance of major biosensor types against conventional methods, providing detailed experimental data and protocols to support cost-effectiveness analysis in research and drug development.
Core Components of a Biosensor
A typical biosensor consists of four fundamental components that work in sequence to detect and quantify an analyte [1].
- Analyte: The substance of interest that requires detection (e.g., glucose, a specific protein, or a toxin) [1].
- Bioreceptor: A biological molecule (e.g., enzyme, antibody, nucleic acid, or aptamer) that specifically recognizes and binds to the target analyte. This bio-recognition event generates a signal in the form of light, heat, pH change, or mass change [1] [3].
- Transducer: The element that converts the biological signal resulting from the bioreceptor-analyte interaction into a measurable electrical or optical signal. Common transducers include electrochemical, optical, piezoelectric, and thermal detectors [1] [3] [2].
- Electronics and Display: The electronic system that processes the transduced signal (including amplification and conversion from analog to digital) and presents the output in a user-friendly format, such as a numeric value or graph on a display unit [1].
Classification and Operational Mechanisms
Biosensors are primarily classified based on their transduction mechanism and biorecognition element. The following table outlines the main types and their working principles.
Table 1: Classification of Biosensors by Transduction Mechanism
| Transducer Type | Working Principle | Common Bioreceptors | Example Application |
|---|---|---|---|
| Electrochemical [3] [4] | Measures electrical changes (current, potential, impedance) from redox reactions at an electrode surface. | Enzymes, Antibodies, Nucleic Acids | Glucose monitoring (Amperometric), Ion detection (Potentiometric ISE) [5]. |
| Optical [3] [2] | Detects changes in light properties (wavelength, intensity, phase) due to analyte binding. | Antibodies, Enzymes, Nucleic Acids | Cancer biomarker detection (Surface Plasmon Resonance), Pathogen detection (Fluorescence) [6] [7]. |
| Piezoelectric / Acoustic [3] | Measures changes in the mass or viscoelastic properties on a crystal surface through resonance frequency shifts. | Antibodies, Nucleic Acids | Gas detection, real-time study of molecular interactions (Quartz Crystal Microbalance). |
| Thermometric [3] [4] | Measures the heat absorbed or released during a biological reaction. | Enzymes | Detection of serum cholesterol, urea, and penicillin G [4]. |
The general workflow of a biosensor, from sample introduction to result, can be visualized as follows:
Performance Comparison: Biosensors vs. Conventional Methods
A key advantage of biosensors is their performance in terms of sensitivity, specificity, and speed. The table below provides a comparative analysis of different biosensor technologies against conventional laboratory techniques, using real experimental data from recent studies.
Table 2: Performance Comparison of Biosensor Technologies vs. Conventional Methods
| Detection Target / Method | Sensitivity / LOD | Linear Range | Assay Time | Key Performance Metrics |
|---|---|---|---|---|
| Prostate Cancer (PSA) [6] | ||||
| └── SPR Biosensor (fPSA@Au NPs) | 0.010 ng/mL | 0.010 - 0.40 ng/mL | Minutes | High selectivity for free PSA |
| └── Conventional Clinical Immunoassay | ~0.1 ng/mL | Varies | Hours to days | Requires specialized lab |
| Tau Protein (Alzheimer's) [8] | ||||
| └── Electrochemical Immunosensor (COOH-GF) | 0.14 fM | 1 fM – 1 nM | < 1 hour | High selectivity in human serum |
| └── ELISA / PET Scans | ~pg-mg/mL | Varies | Hours to days | Expensive, complex equipment |
| α-Fetoprotein (Cancer) [7] | ||||
| └── SERS Biosensor (Au-Ag Nanostars) | 16.73 ng/mL | 0 - 500 ng/mL | Rapid | Label-free, uses intrinsic AFP vibrations |
| └── HPLC / Mass Spectrometry | ~ng/mL | Wide | Hours | Requires extensive sample prep |
| Glucose Monitoring [5] | ||||
| └── Amperometric Biosensor Strip (FAD-GDH) | High (precise µA current) | Wide, extended | Seconds | Oxygen-independent, high accuracy |
| └── Laboratory Photometric Assay | High | Wide | Minutes to hours | Not suitable for point-of-care |
Experimental Protocols for Key Biosensor Types
To ensure reproducibility and support cost-effectiveness analysis, here are detailed methodologies for two prominent biosensor classes cited in the performance table.
Surface Plasmon Resonance (SPR) Immunosensor for Cancer Cell Detection
SPR biosensors detect changes in the refractive index on a metal surface (often gold) when an analyte binds to an immobilized bioreceptor [6] [2].
- Bioreceptor Immobilization: A thin gold film is functionalized, and specific antibodies (e.g., against cancer cell surface markers) are covalently immobilized onto the surface using chemistries like EDC/NHS [6].
- Sample Preparation & Introduction: Cancer cell suspensions (e.g., Jurkat for blood cancer, HeLa for cervical cancer) are prepared in an appropriate buffer. The sample is flowed over the sensor chip [6].
- Signal Transduction & Measurement: Polarized light is directed through a prism onto the gold film. The angle of reflected light intensity minimum (SPR dip) is monitored in real-time. Binding of cells to the antibodies alters the refractive index, causing a measurable shift in the resonance angle [6].
- Data Analysis: The angular shift (in deg/RIU - Refractive Index Unit) is directly proportional to the mass bound on the surface. Sensitivity is calculated from this shift relative to the analyte concentration [6].
Electrochemical Immunosensor for Neurodegenerative Biomarkers
This protocol details the construction of an electrochemical immunosensor for Tau protein, a biomarker for Alzheimer's disease [8].
- Electrode Modification: A 3D graphene foam (GF) electrode is carboxyl-functionalized (COOH-GF) via π–π non-covalent interactions to preserve conductivity while providing groups for biomolecule attachment [8].
- Antibody Immobilization: Anti-Tau antibodies are covalently immobilized on the COOH-GF surface using EDC/NHS carbodiimide chemistry, which activates carboxyl groups to form stable amide bonds with antibody amines [8].
- Electrochemical Measurement: The immunosensor is incubated with samples containing Tau protein. Detection is performed using Differential Pulse Voltammetry (DPV) in a solution containing a redox probe (e.g., [Fe(CN)₆]³⁻/⁴⁻). Antibody-Tau binding hinders electron transfer of the probe, causing a measurable change in current [8].
- Calibration & Quantification: The change in peak current is plotted against the logarithm of Tau protein concentration to generate a calibration curve, from which the limit of detection (LOD) and linear range are determined [8].
The experimental workflow for such a sensor is methodical and can be summarized as follows:
Essential Research Reagent Solutions
The performance of a biosensor is heavily dependent on the quality and specificity of its core materials. The table below details key reagents and their functions in biosensor development and operation.
Table 3: Key Research Reagents and Materials for Biosensor Construction
| Reagent / Material | Function in Biosensor | Specific Example |
|---|---|---|
| Enzymes (e.g., FAD-GDH, GOx) | Bioreceptor that catalyzes a specific reaction with the analyte, producing a detectable product [5]. | FAD-GDH used in glucose sensor strips for its oxygen-insensitivity [5]. |
| Antibodies & Antigens | Biorecognition elements for immunosensors; provide high specificity for proteins, pathogens, or whole cells [3] [7]. | Anti-α-fetoprotein antibodies for liver cancer detection [7]. |
| Aptamers | Single-stranded DNA or RNA oligonucleotides that bind targets with high affinity and specificity; more stable than antibodies [7]. | Aptamers used for Salmonella detection in food safety [8]. |
| Redox Mediators (e.g., Quinones, Ferrocene) | Shuttle electrons between the bioreceptor and the electrode surface in electrochemical biosensors [5]. | Water-soluble quinone mediators with high enzyme reactivity for improved sensitivity [5]. |
| Nanomaterials (e.g., Graphene, Au-Ag Nanostars) | Enhance surface area, improve electron transfer, and amplify signals (e.g., in SERS or electrochemical sensing) [7] [8]. | Au-Ag nanostars for intense plasmonic enhancement in SERS-based immunoassays [7]. |
| Immobilization Chemicals (e.g., EDC, NHS) | Enable covalent bonding of bioreceptors to the transducer surface, ensuring stability and reusability [7] [8]. | EDC/NHS chemistry for attaching anti-Tau antibodies to graphene electrodes [8]. |
The global biosensor market is experiencing robust growth, driven by increasing demand for point-of-care diagnostics, the rising prevalence of chronic diseases, and continuous technological advancements. Biosensors are analytical devices that combine a biological recognition element with a physicochemical transducer to detect specific analytes, finding extensive applications in healthcare, food safety, and environmental monitoring [9].
The market size was valued between USD 27.40 billion and USD 32.3 billion in 2024 and is projected to grow significantly, reaching between USD 54.37 billion and USD 69.67 billion by 2030-2034 [9] [10] [11]. This growth is underpinned by a Compound Annual Growth Rate (CAGR) ranging from 7.07% to 9.5% over the forecast periods of 2025-2030/2034, reflecting the increasing integration of biosensors into mainstream healthcare and other industries [12] [9] [10].
Table 1: Global Biosensors Market Size and Growth Projections
| Source | Market Size (2024) | Projected Market Size (2030-2034) | CAGR | Forecast Period |
|---|---|---|---|---|
| MarketsandMarkets [10] | - | USD 54.37 billion (by 2030) | 9.5% | 2025-2030 |
| Fortune Business Insights [9] | USD 27.40 billion | USD 55.78 billion (by 2032) | 9.3% | 2025-2032 |
| Precedence Research [12] | USD 30.71 billion | USD 61.29 billion (by 2034) | 7.07% | 2025-2034 |
| GM Insights [11] | USD 32.3 billion | USD 68.5 billion (by 2034) | 7.9% | 2025-2034 |
| Nova one advisor [13] | USD 30.25 billion | USD 69.67 billion (by 2034) | 8.7% | 2025-2034 |
Market Segmentation and Key Drivers
Dominance and Growth by Technology
Electrochemical biosensors represent the largest technology segment, accounting for a dominant revenue share. This is largely attributed to the widespread adoption of electrochemical-based glucose monitoring systems for diabetes management globally [9] [13]. However, optical biosensors are projected to grow at the highest CAGR, fueled by their advantages in real-time, label-free detection and increasing use in drug discovery and cancer diagnostics [12] [9] [10].
Table 2: Biosensors Market Analysis by Technology Segment
| Technology | Market Share & Growth | Key Applications | Advantages |
|---|---|---|---|
| Electrochemical | Largest revenue share (e.g., ~71.7% in 2024 [13]); dominated by glucose monitoring. | Glucose monitoring, cardiac markers, infectious diseases [9] [10]. | Cost-effectiveness, portability, high sensitivity and selectivity [9] [14]. |
| Optical | Projected to grow at the fastest CAGR [12] [9] [10]. | Drug discovery, oncology, infectious disease testing, biomolecular interaction analysis [12] [10]. | Real-time, label-free detection; non-invasive; high sensitivity and specificity [12]. |
| Other Technologies (Piezoelectric, Thermal) | Smaller market share. | Environmental monitoring, research applications. | Mass-sensitive detection (Piezoelectric) [9]. |
Analysis by Application and End-User
The medical application segment holds the commanding market share. Within this segment, blood glucose testing is the most significant application due to the global high prevalence of diabetes [11]. Other critical medical applications include infectious disease screening, pregnancy testing, and drug discovery [9]. In terms of end-users, Point-of-Care (POC) Testing is the dominant segment, as biosensors provide rapid results that enable quick clinical decision-making in homes, clinics, and emergency settings [11] [14].
Table 3: Biosensors Market Analysis by Application and End-User
| Segment | Dominant Sub-segment | Fastest-Growing Sub-segment |
|---|---|---|
| By Application | Medical Applications (e.g., ~66.8% revenue share in 2024 [13]), driven by blood glucose testing, infectious disease detection, and cholesterol testing [9] [13]. | Agriculture segment is set for the fastest growth, using biosensors for detecting pesticides, herbicides, and soil pathogens [12] [13]. |
| By End-User | Point-of-Care (POC) Testing (e.g., 48% revenue share in 2024 [13]), due to the need for rapid diagnostics and decentralized healthcare [11] [14]. | Food Industry segment is anticipated to grow with the highest CAGR, for applications in food toxicity and freshness monitoring [12] [13]. |
Regional Market Landscape
North America, specifically the United States, dominated the global market in 2024, with a revenue share ranging from 39% to 44% [12] [9] [14]. This leadership is attributed to a strong R&D infrastructure, high healthcare expenditure, the presence of key market players, and favorable reimbursement policies [12] [9]. However, the Asia-Pacific region is expected to register the highest growth rate during the forecast period. This accelerated growth is driven by rapid improvements in healthcare infrastructure, a large patient population, rising healthcare expenditures, and government initiatives promoting digital health in countries like China and India [12] [13] [14].
Cost-Effectiveness Analysis: Biosensors vs. Conventional Methods
A core thesis in modern diagnostic research is the cost-effectiveness of biosensors compared to conventional laboratory methods. This analysis covers manufacturing, operational speed, and portability.
Cost-Effective Manufacturing: A Case Study in Electrode Fabrication
Experimental Protocol: A 2025 study demonstrated a rapid, cost-effective method for fabricating gold leaf electrodes (GLEs) for electrochemical biosensors [15].
- Methodology: The process combined lamination of 24-karat gold leaves with low-cost polyvinyl chloride (PVC) adhesive sheets, followed by laser ablation to create customizable electrode patterns with micro-level resolution [15].
- Comparison: This method was contrasted with traditional fabrication techniques like Physical Vapor Deposition (PVD) and Chemical Vapor Deposition (CVD), which require expensive equipment, cleanroom facilities, and produce fragile films [15].
- Application: The fabricated GLEs were functionalized and applied as platforms for magnetic bead-based biosensors to quantitatively detect food-borne pathogens Salmonella typhimurium and Listeria monocytogenes, showcasing their practical application in food safety [15].
The following workflow illustrates this innovative fabrication process:
Key Research Reagent Solutions for GLE Fabrication:
Table 4: Essential Materials for Gold Leaf Electrode Biosensor Fabrication
| Material/Reagent | Function in the Experimental Protocol |
|---|---|
| Gold Leaf Foils | Serves as the highly conductive, biocompatible electrode material. The use of leaf rather than vapor-deposited film drastically reduces cost [15]. |
| PVC Adhesive Sheets | Acts as a low-cost, flexible, and robust substrate for laminating the gold leaf [15]. |
| Laser Ablation System | Enables precise, customizable patterning of electrode geometry without the need for expensive masks or cleanrooms, contrasting with photolithography [15]. |
| Magnetic Beads (MBs) | Functionalized with antibodies/aptamers; used for efficient target capture, preconcentration, and signal amplification in the detection of pathogens [15]. |
| Ferri/Ferrocyanide Redox Couple | A standard electrochemical probe used in Cyclic Voltammetry and Electrochemical Impedance Spectroscopy to characterize the performance and electron transfer efficiency of the fabricated electrodes [15]. |
Operational and Economic Advantages Over Conventional Methods
The primary cost and efficiency advantages of biosensors stem from their operational characteristics compared to conventional methods like Enzyme-Linked Immunosorbent Assay (ELISA), Polymerase Chain Reaction (PCR), or lab-based chromatography.
- Speed and Portability for Point-of-Care Use: Biosensors facilitate rapid diagnostics at the point of care, eliminating the need for sample transport to centralized labs and reducing turnaround time from days/hours to minutes. For example, the NovoLISA biosensor assay platform delivers results in just 15 minutes, a significant reduction compared to traditional ELISA [13]. This aligns with the growing demand for home-based and rapid POC tests [9] [10].
- Continuous Monitoring Capability: Wearable biosensors, like continuous glucose monitors (e.g., Abbott's FreeStyle Libre), provide real-time, dynamic data that is impossible to obtain with conventional single-point blood tests [12] [9]. This enables personalized health management and proactive clinical interventions.
- Reduced Consumption of Reagents and Samples: The miniaturization of biosensors, often leveraging microfluidics and nanotechnology, leads to lower consumption of expensive biological reagents and smaller required sample volumes, reducing the cost per test [10] [15].
Emerging Trends and Future Outlook
The future growth of the biosensor market is tightly linked to several key technological trends. The integration of Artificial Intelligence (AI) and machine learning is transforming biosensors from passive detectors into intelligent systems capable of learning, adapting, and predicting physiological changes in real-time. AI algorithms enhance data analytics by identifying patterns, detecting anomalies, and improving diagnostic precision, particularly in wearable devices for cardiac monitoring and chronic disease management [12] [9].
Furthermore, the proliferation of wearable biosensors in forms like wristwatches, skin patches, and smart textiles is opening new frontiers for remote patient monitoring and personalized medicine [10] [11]. Finally, ongoing advancements in nanomaterials (e.g., graphene, gold nanoparticles, MOFs) and the development of multiplexing biosensors that can detect multiple analytes simultaneously are pushing the boundaries of sensitivity, selectivity, and application scope, ensuring the market's continued expansion and innovation [12] [10] [16].
In the realms of clinical diagnostics, biomedical research, and drug development, conventional methods like Enzyme-Linked Immunosorbent Assay (ELISA), Polymerase Chain Reaction (PCR), and Computed Tomography (CT) scans represent foundational technologies. However, their widespread application is underpinned by significant investments of time, financial resources, and specialized infrastructure. Against the growing promise of cost-effective biosensors, this guide provides an objective, data-driven comparison of these established techniques. We dissect their associated costs, processing times, and technical requirements, offering researchers a clear framework for evaluating diagnostic and analytical options within a broader cost-effectiveness analysis paradigm. The impetus for this examination is clear: the diagnostic market is shifting towards solutions that meet the ASSURED criteria (Affordable, Sensitive, Specific, User-friendly, Rapid and robust, Equipment-free, and Deliverable) [17] [18], a benchmark against which conventional methods often face challenges.
To ensure a consistent and objective comparison, this guide evaluates each method based on a set of unified operational and financial metrics. The quantitative data presented in subsequent sections are synthesized from recent scientific literature and health economic analyses.
Key Performance Indicators (KPIs) for Comparison:
- Direct Cost per Test: The estimated cost of reagents, consumables, and equipment usage for a single test.
- Equipment Investment: The initial capital expenditure required for core instrumentation.
- Processing Time: The total hands-on and processing time required to obtain a result, from sample preparation to data analysis.
- Throughput: The capacity for processing multiple samples simultaneously.
- Personnel Requirements: The level of technical expertise and training needed to operate the technology reliably.
Detailed Analysis of Conventional Methods
Enzyme-Linked Immunosorbent Assay (ELISA)
ELISA is a cornerstone plate-based immunoassay for detecting and quantifying proteins, peptides, antibodies, and hormones. Its reliability and versatility make it a default choice in immunology, endocrinology, and drug development.
Experimental Protocol
A typical sandwich ELISA workflow involves the following key steps [19]:
- Coating: A capture antibody is immobilized onto a polystyrene microplate well surface.
- Blocking: The well is treated with a protein buffer (e.g., BSA) to cover any unsaturated binding sites on the plate, preventing nonspecific binding.
- Sample/Antigen Incubation: The sample containing the target antigen is added. If the antigen is present, it binds to the capture antibody.
- Detection Antibody Incubation: A second, enzyme-conjugated antibody (e.g., Horseradish Peroxidase-HRP) that recognizes a different epitope on the antigen is added, forming a "sandwich."
- Substrate Addition: A colorimetric, chemiluminescent, or fluorescent substrate for the enzyme is added.
- Signal Measurement: The resulting signal is measured using a plate reader. The intensity is proportional to the amount of antigen present in the sample.
The diagram below illustrates this workflow and its associated cost and time drivers.
Cost and Time Analysis
ELISAs are recognized for their cost-effectiveness in large-scale sample processing [20]. The high-throughput capabilities of 96-well and 384-well plate formats allow for processing hundreds of samples in a single run, which streamlines workflows and reduces per-test labor costs [20]. The reagent costs are reduced due to the use of smaller volumes, and bulk purchasing can lower expenses further. The initial equipment investment is moderate, requiring standard laboratory equipment like microplate readers, pipettes, and plate washers, rather than highly specialized, expensive machinery [20].
Polymerase Chain Reaction (PCR)
PCR and its quantitative variant (qPCR) are gold-standard molecular techniques for amplifying and detecting specific DNA or RNA sequences. They are indispensable in pathogen detection (as highlighted during the COVID-19 pandemic), genetic testing, and cancer screening [21] [22].
Experimental Protocol
A standard qPCR protocol for SARS-CoV-2 detection, for instance, involves [21] [23]:
- Sample Collection: Nasopharyngeal or oropharyngeal swab.
- Nucleic Acid Extraction: Isolating viral RNA using commercial kits, often automated.
- Reverse Transcription (for RNA targets): Converting RNA into complementary DNA (cDNA).
- qPCR Amplification: The cDNA is added to a master mix containing DNA polymerase, dNTPs, primers, and a fluorescent probe (e.g., TaqMan). The thermal cycler runs programmed temperature cycles (denaturation, annealing, extension). The accumulation of PCR product is monitored in real-time via fluorescence.
- Data Analysis: The cycle threshold (Ct) value is determined, which correlates inversely with the target's initial concentration.
Comparative Analysis: qPCR vs. Digital PCR (dPCR)
While qPCR dominates the market, digital PCR (dPCR) is an advanced variant that provides absolute quantification without a standard curve. The choice between them depends on the application's requirements [22].
The table below summarizes a comparative analysis of these two PCR variants.
| Parameter | Quantitative PCR (qPCR) | Digital PCR (dPCR) |
|---|---|---|
| Principle | Relative quantification based on standard curve | Absolute quantification by endpoint PCR of partitioned samples |
| Limit of Detection (LoD) | High (capable of detecting an extremely small number of viral RNA copies) [22] | Potentially higher, superior for detecting rare targets [22] |
| Accuracy & Precision | High, but relative | Excellent for absolute quantification; less affected by PCR inhibitors [22] |
| Throughput | Very High (standard 96-well or 384-well formats); suited for mass screening [22] | Lower throughput due to compartmentalization process [22] |
| Cost per Test | Lower; cost-effective for high-volume testing (e.g., ~$0.2 per test in large-scale COVID-19 screening) [22] | Higher, due to costly chips and consumables [22] |
| Equipment Cost | High | Very High |
| Ease of Operation | Standardized protocols, requires skilled staff | Requires skilled staff |
| Ideal Application | High-throughput diagnostics where relative quantification is sufficient (e.g., SARS-CoV-2 infection diagnosis) [22] | Applications requiring absolute quantification, detection of rare alleles, or copy number variation [22] |
The following diagram outlines the fundamental technical divergence between qPCR and dPCR, which underpins their cost and performance differences.
Computed Tomography (CT) Scans
CT scans provide non-invasive, high-resolution 3D internal images of the body. They are crucial for cancer screening (e.g., lung cancer), disease diagnosis, and trauma assessment.
Operational Protocol
A typical diagnostic CT scan involves:
- Patient Preparation: Positioning the patient on the motorized table. Administering contrast agents intravenously, orally, or via inhalation if necessary.
- Scanning: The table moves the patient through the gantry, which rotates an X-ray source and a ring of detectors around them. Multiple 2D X-ray "slices" are captured from different angles.
- Image Reconstruction: A computer processes the absorption data from all the slices using sophisticated algorithms to generate cross-sectional and 3D images.
- Radiologist Interpretation: A specialized radiologist analyzes the images to identify abnormalities, make measurements, and provide a diagnostic report.
Cost and Time Analysis
The primary cost driver for CT is the immense capital investment. Industrial CT scanners (which share technological principles with medical ones) can range from $100,000 to over $1 million, depending on resolution, scanning speed, and features [24]. Medical-grade scanners are similarly, if not more, expensive. Operational costs also include significant service contracts, staff training, and software updates [24]. From a diagnostic perspective, a study on lung cancer screening found that the use of AI support for initial low-dose CT scan analysis could be a cost-effective strategy, improving accuracy and potentially reducing long-term costs associated with false positives and negatives [25]. The procedure itself is relatively rapid, but the cost per scan is high, and access is limited to specialized healthcare facilities.
The following table provides a consolidated, side-by-side comparison of the three conventional methods, summarizing their key quantitative and operational characteristics.
| Method | Estimated Cost per Test | Equipment Investment | Processing Time | Throughput | Key Cost & Time Drivers |
|---|---|---|---|---|---|
| ELISA | Cost-effective for large batches [20] | Moderate (plate reader, washers) [20] | Several hours [19] | High (96/384-well plates) [20] | Antibodies, enzymatic substrates, incubation times [20] [19] |
| PCR / qPCR | ~$0.2 (in high-volume screening) to $62+ [23] [22] | High (thermal cycler) | 1 to several hours [21] | Very High (96/384-well formats) [22] | Enzymes (polymerase), primers/probes, nucleic acid extraction kits, skilled staff [21] [22] |
| CT Scan | High (procedure and interpretation) | Very High ($100,000 to $1M+) [24] | Minutes for scan; longer for report | Moderate | Capital equipment, maintenance, radiologist expertise [24] [25] |
The Scientist's Toolkit: Essential Research Reagent Solutions
The execution of these conventional methods relies on a set of core reagents and materials. The following table details key components for ELISA and PCR, which are central to their experimental workflows.
| Method | Essential Reagent/Material | Function |
|---|---|---|
| ELISA | Capture & Detection Antibodies | Specific molecular recognition and binding to the target analyte. |
| Microplate (96 or 384-well) | Solid phase for the immobilization of assay components. | |
| Enzyme Substrate (e.g., TMB for HRP) | Generates a measurable (colorimetric, chemiluminescent) signal upon reaction with the enzyme label. | |
| Blocking Buffer (e.g., BSA) | Prevents nonspecific binding to the solid phase, reducing background noise. | |
| PCR/qPCR | DNA Polymerase (e.g., Taq) | Enzyme that synthesizes new DNA strands. |
| Primers & Fluorescent Probes | Define the target sequence for amplification and enable real-time detection. | |
| dNTPs | Building blocks for the new DNA strands. | |
| Master Mix | Optimized buffer containing salts and Mg2+ for efficient amplification. |
The data unequivocally shows that conventional methods, while powerful and reliable, carry significant operational burdens. ELISA offers high throughput but is hampered by lengthy protocols and reagent costs. PCR, the sensitivity gold standard, requires expensive instrumentation and skilled technicians, with cost-effectiveness highly dependent on testing volume. CT scans represent the peak of capital expenditure and operational cost, limiting their accessibility. This detailed cost and performance analysis underscores the pressing need for and the potential market disruption of novel biosensing technologies that promise to deliver ASSURED-compliant diagnostics. For researchers and drug development professionals, this comparison provides a critical baseline for evaluating the cost-effectiveness of next-generation diagnostic solutions in their respective fields.
The global biosensors market is experiencing unprecedented growth, projected to expand from USD 30.25 billion in 2024 to approximately USD 69.67-75.84 billion by 2033, demonstrating a robust compound annual growth rate (CAGR) of 8.7% to 10.4% [13] [26]. This acceleration is fueled by critical unmet needs across healthcare, environmental monitoring, and food safety sectors. In healthcare specifically, the World Health Organization reports 422 million diabetic adults globally, with approximately 80% requiring daily glucose monitoring—translating to over 336 million potential biosensor users [26]. Concurrently, food safety concerns remain pressing, with the CDC estimating 48 million annual foodborne illness cases in the United States alone, amplifying the need for rapid pathogen detection solutions [26].
The convergence of three major market forces is reshaping bioanalysis: the demand for speed (rapid results versus traditional laboratory methods), affordability (reducing costs of diagnostic tools), and accessibility (enabling point-of-care and decentralized testing). Wearable biosensor systems represent a significant breakthrough, offering real-time monitoring and quantitative assessment of various human health parameters through non-invasive analysis of biofluids including sweat, tears, epidermal fluids, and interstitial fluid [27]. These systems have emerged as pivotal tools for furnishing physiological insights and facilitating non-invasive monitoring, addressing the escalating demand for continuous and immediate surveillance of both acute and chronic conditions amid constraints in clinical infrastructure [27].
This analysis objectively compares the performance of emerging biosensor technologies against conventional methods, examining experimental data across key parameters including sensitivity, time-to-result, cost-effectiveness, and accessibility.
Market Landscape: Quantifying the Demand for Advanced Bioanalysis
The shift toward biosensor-based solutions is underpinned by quantifiable limitations of conventional methods across multiple sectors. The following table summarizes key market drivers and their measurable impact:
Table 1: Key Market Drivers for Biosensor Adoption
| Driver Sector | Measurable Need | Impact on Biosensor Demand |
|---|---|---|
| Healthcare | 422 million diabetic adults globally (WHO); 80% require daily monitoring [26] | Continuous Glucose Monitoring (CGM) biosensors show 300% improvement over manual checks with 82% accuracy in detecting hypo/hyperglycemic events [26] |
| Food Safety | 600 million annual foodborne illness cases globally (WHO); 48 million in US (CDC) [26] | Biosensors detect pathogens like Salmonella in 15 minutes at 10 CFU/mL sensitivity, slashing lab wait times by 98% [26] |
| Environmental Monitoring | 40% of US rivers contain unsafe E. coli levels (EPA); 70% of India's surface water polluted (CPCB) [26] | Biosensors detect E. coli in 20 seconds versus 24-hour cultures—a 99.9% time reduction [26] |
| Point-of-Care Testing | 68% of outpatient diagnostics in EU now performed at point-of-care [26] | Biosensors reduce result times from 6 hours to 10 minutes for cardiac troponin tests [26] |
North America currently dominates the biosensors market with a 41-44.61% revenue share in 2024, while the Asia-Pacific region is expected to witness the fastest growth (CAGR of 9.9%) from 2025 to 2034, driven by increasing healthcare expenditures and rising patient awareness [13] [26].
Performance Comparison: Biosensors Versus Conventional Methods
Analytical Performance Metrics
Rigorous experimental studies demonstrate the competitive performance of biosensors against conventional laboratory techniques. The following table summarizes quantitative comparisons across critical parameters:
Table 2: Performance Comparison: Biosensors vs. Conventional Methods
| Parameter | Biosensor Technology | Conventional Methods | Experimental Data & Context |
|---|---|---|---|
| Detection Time | 15 minutes - 20 seconds [26] [15] | 24-48 hours [26] | Pathogen detection: 15 min (biosensor) vs. 24h culture; E. coli: 20s (biosensor) vs. 24h [26] |
| Sensitivity | 0.1 fM for miRNAs (CRISPR/Cas13a assay) [28]; 0.01 ng/mL for PSA [26] | Varies by method (e.g., ELISA, PCR) | Cancer biomarker detection: 0.01 ng/mL sensitivity cuts diagnosis time by 97% vs. 48-hour lab tests [26] |
| Cost per Test | USD 3.5/plate (96-well CRISPR assay) [28]; 35% reduction since 2020 [26] | Significantly higher for lab equipment | Miniaturization has reduced biosensor production costs by 35% since 2020 [26] |
| Sample Volume | Small liquid samples (microliter range) [15] | Larger volumes typically required | Biosensors function as advanced analytical tools for small liquid samples [15] |
| Multiplexing Capability | Simultaneous detection of 3 miRNAs [28]; 12 vital signs [26] | Typically single-analyte | Wearables track 12 vital signs simultaneously—up from 3 in 2020 [26] |
Experimental Case Study: Pathogen Detection in Food Safety
A recent study demonstrates a cost-effective, gold leaf electrode (GLE) based biosensor for quantitative detection of foodborne pathogens Salmonella typhimurium and Listeria monocytogenes [15]. The experimental protocol and comparative results highlight key advantages:
Experimental Protocol:
- Fabrication: Electrodes created by laminating 24-karat gold leaves onto polyvinyl chloride (PVC) adhesive sheets followed by laser ablation to create customizable geometries [15].
- Functionalization: Immobilization of specific biorecognition elements (aptamers/antibodies) on electrode surface.
- Detection Platform: Magnetic bead (MB)-labeled biosensors used for target capture and preconcentration [15].
- Measurement: Electrochemical impedance spectroscopy (EIS) and cyclic voltammetry (CV) with ferri/ferrocyanide redox couple [15].
- Quantification: Signal change correlates with pathogen concentration.
Results: The GLE biosensor demonstrated rapid detection (minutes versus days for culture methods), high specificity, and quantitative capability across a clinically relevant concentration range. This fabrication method bypasses expensive, traditional methods like physical vapor deposition (PVD) and chemical vapor deposition (CVD), which require costly equipment and cleanroom facilities [15].
Case Study: Clinical Diagnostics and Wearable Monitoring
In healthcare, wearable biosensors have revolutionized continuous monitoring, particularly for metabolic disorders:
- Continuous Glucose Monitors (CGM): Monitor glucose every 5 minutes, a 300% improvement over manual checks, with 82% accuracy in detecting hypo/hyperglycemic events [26].
- Cardiac Monitoring: Wearable heart rate sensors detect arrhythmias with 97% precision, up from 85% in 2022 [26].
- Non-Invasive Cancer Detection: A high-sensitivity, Bluetooth-enabled PCB biosensor for HER2 and CA15-3 protein detection in saliva offers a rapid, non-invasive approach to breast cancer screening [28].
The following diagram illustrates the typical workflow for a biosensor-based diagnostic assay, from sample introduction to result output:
Diagram 1: Biosensor Assay Workflow
Technological Innovations Addressing Market Forces
Advanced Materials and Fabrication
Novel manufacturing approaches are directly addressing affordability concerns. The gold leaf electrode (GLE) method exemplifies this trend, replacing costly vacuum deposition with a process that combines lamination of affordable gold leaves with laser ablation [15]. This approach enables rapid production of highly conductive electrodes with large surface areas, providing a suitable platform for immobilizing aptamers, antibodies, and other biomolecules without sacrificing performance [15].
Additive manufacturing (3D printing) offers another transformative pathway, allowing precise control over electrode geometry and enabling creation of complex microstructures and flexible, wearable sensors [15]. While challenges remain in resolution and material conductivity, 3D printing holds promise for cost-effective, scalable production of disposable biosensors [15].
Integration of Artificial Intelligence and Multiplexing
The convergence of biosensors with artificial intelligence (AI) creates systems capable of enhanced accuracy and predictive analytics:
- AI Enhancement: AI algorithms boost diagnostic accuracy by 18%, identifying cancer markers in 92% of cases versus 74% manually [26].
- Multiplex Detection: CRISPR/Cas13a assays immobilized in chitosan hydrogel enable unamplified quantification of three distinct miRNAs simultaneously, achieving femtomolar sensitivity [28].
- Real-Time Analytics: Smartphone integration with biosensors has increased consumer adoption by 62% in urban areas, facilitating immediate data interpretation [26].
The Scientist's Toolkit: Essential Research Reagents and Materials
The development and implementation of advanced biosensors rely on specialized materials and reagents. The following table details key components and their functions based on experimental protocols from recent studies:
Table 3: Essential Research Reagent Solutions for Biosensor Development
| Reagent/Material | Function/Application | Experimental Example |
|---|---|---|
| Gold Leaf (24-karat) | Electrode material providing excellent conductivity, chemical stability, and biocompatibility [15] | Cost-effective transducer for electrochemical biosensors [15] |
| Magnetic Beads (MB) | Target capture, preconcentration, and signal amplification; enable separation of analytes from complex mixtures [15] | Used in pathogen detection for S. typhimurium and L. monocytogenes [15] |
| CRISPR/Cas13a System | Biorecognition element for specific nucleic acid detection; collateral RNase activity enables signal amplification [28] | Immobilized in hydrogel for multiplex miRNA detection in Alzheimer's disease [28] |
| Chitosan Hydrogel | 3D matrix for biomolecule immobilization; provides biocompatible environment for biochemical reactions [28] | Coating for 3D-printed plates in CRISPR-based assays [28] |
| Specific Aptamers/Antibodies | Biorecognition elements providing high specificity and affinity for target analytes [15] | Functionalization of electrodes for specific pathogen detection [15] |
| Ferri/Ferrocyanide Redox Couple | Electrochemical reporter molecule for signal generation in voltammetry and impedance spectroscopy [15] | Redox probe in buffer solution for electrode characterization [15] |
The experimental data and market analysis presented demonstrate conclusively that biosensor technologies effectively address the critical unmet needs for speed, affordability, and accessibility in bioanalysis. The performance advantages—ranging from 300% improvement in monitoring frequency to 98% reduction in detection time and 35% cost reduction in manufacturing—position biosensors as transformative tools across healthcare, food safety, and environmental monitoring [26].
The integration of novel materials like gold leaves, advanced manufacturing techniques including 3D printing, and sophisticated detection mechanisms such as CRISPR-based assays and magnetic bead enrichment collectively enable this paradigm shift [28] [15]. Furthermore, the convergence of biosensors with AI and IoT connectivity promises even greater capabilities in predictive analytics and real-time monitoring [26].
For researchers, scientists, and drug development professionals, these advancements translate to powerful new tools for diagnostic development, therapeutic monitoring, and biomedical research. As the field continues to evolve, focusing on standardization, regulatory compliance, and rigorous validation will be essential to fully realize the potential of biosensors in meeting the world's growing bioanalytical needs.
Biosensors in Action: Transforming Drug Development, Healthcare, and Food Safety
The drug development process is notoriously time-consuming and expensive, often taking over a decade and costing billions of dollars from discovery to market approval. A significant bottleneck lies in the analytical techniques used for target validation, lead compound screening, and therapeutic efficacy assessment. Conventional methods like enzyme-linked immunosorbent assays (ELISA) and polymerase chain reaction (PCR), while reliable, are often labor-intensive, require extensive sample preparation, and provide limited temporal resolution for monitoring dynamic cellular processes.
Silicon nanowire (SiNW) biosensors represent a transformative technology poised to disrupt this paradigm. As highly sensitive, label-free detectors that transduce biological binding events directly into measurable electrical signals, SiNW biosensors offer researchers a powerful tool for accelerating critical stages of drug discovery and development [29] [30]. Their unique combination of ultra-sensitivity, real-time response, and potential for miniaturization and multiplexing addresses key limitations of conventional methods, promising to enhance efficiency and reduce costs in pharmaceutical research [31].
Fundamental Operating Principle
At the heart of silicon nanowire biosensors is the field-effect transistor (FET) configuration [29]. A SiNW FET functions as a semiconductor channel whose electrical conductivity is exquisitely sensitive to surface charge variations.
The core detection mechanism is straightforward:
- Surface Functionalization: The silicon nanowire surface is chemically modified and coated with specific receptor molecules (e.g., antibodies, DNA strands, or aptamers) designed to capture a target analyte [29] [31].
- Target Binding: When the target analyte (e.g., a protein, virus, or DNA strand) binds to its receptor on the nanowire surface, it introduces a change in the local surface charge density.
- Signal Transduction: This change in surface charge modulates the conductance of the underlying silicon nanowire. In an n-type SiNW, binding of a negatively charged species decreases conductance, while in a p-type SiNW, it increases conductance [29].
- Real-Time Monitoring: A semiconductor parameter analyzer monitors these conductance changes in real-time, providing a direct electrical readout of the binding event [29].
Key Fabrication Methods
The performance of SiNW biosensors is heavily influenced by their fabrication process, which primarily follows two approaches:
- Bottom-Up Methods: These involve the synthesis of nanowires from atomic or molecular precursors, often using the Vapor-Liquid-Solid (VLS) method. This approach can produce high-quality, single-crystal nanowires and is compatible with CMOS technology integration, making it suitable for cost-effective, scalable production [29] [31].
- Top-Down Methods: These involve patterning and etching bulk silicon or silicon-on-insulator (SOI) wafers using advanced lithography techniques (e.g., electron beam lithography). This method offers excellent control over the nanowire's geometry and alignment, facilitating the creation of complex and uniform device arrays [29] [30].
The following diagram illustrates the core working principle and the general fabrication workflow for a SiNW biosensor.
Performance Comparison: SiNW Biosensors vs. Conventional Methods
Quantitative data from published studies demonstrates the superior performance of SiNW biosensors in key metrics relevant to drug development.
Table 1: Analytical Performance Comparison for Biomarker Detection
| Metric | Silicon Nanowire (SiNW) Biosensor | Conventional ELISA | Conventional PCR |
|---|---|---|---|
| Detection Limit | Sub-femtomolar (fM) range [29] | Picomolar (pM) range | Varies; often similar to ELISA for nucleic acids |
| Assay Time | Real-time, minutes to hours [29] | 2 - 6 hours | 2 - 4 hours (including amplification) |
| Sample Volume | Microliter (μL) scale, suitable for rare samples [30] | Microliter to milliliter scale | Microliter scale |
| Label Requirement | Label-free detection [29] | Requires enzymatic/fluorescent labels | Requires fluorescent labels or dyes |
| Multiplexing Potential | High (via arrayed sensors) [29] [30] | Low to moderate | Moderate (with real-time PCR systems) |
Beyond biomarker detection, SiNW biosensors show exceptional capability in pathogen and cellular activity monitoring.
Table 2: Performance in Specific Drug Development Applications
| Application | SiNW Biosensor Performance | Conventional Method & Performance |
|---|---|---|
| Bacterial Detection (e.g., E. coli) | 102 CFU/mL sensitivity; 83 μA per decade of CFU/mL; results in minutes [31] | Cell Culture: 24-48 hours for results; sensitivity ~101-102 CFU/mL. |
| Virus Detection | Direct, label-free detection of viruses possible at clinically relevant concentrations [29] | qPCR: High sensitivity but requires nucleic acid extraction and amplification. |
| Cancer Biomarker Detection (e.g., Cardiac Troponin I) | High-sensitivity detection demonstrated; suitable for liquid biopsy applications [30] | Immunoassays: High sensitivity but can be limited by dynamic range and labeling. |
Experimental Protocols for Drug Development Applications
Protocol 1: Detection of Protein Biomarkers for Target Validation
This protocol outlines the steps for using a SiNW biosensor to detect a specific protein biomarker, such as a cell surface receptor important in cancer signaling.
- Sensor Fabrication: Create a p-type or n-type SiNW FET array using a top-down lithographic process on a silicon-on-insulator (SOI) wafer. Deposit source and drain electrodes (e.g., gold) to complete the electrical circuit [30].
- Surface Functionalization:
- Silanization: Expose the sensor chip to vapors of (3-Aminopropyl)triethoxysilane (APTES) to form a silane monolayer with exposed amine (-NH2) groups on the nanowire surface [29] [31].
- Cross-linking: Incubate the chip with a solution of glutaraldehyde, which reacts with the amine groups to serve as a cross-linker [31].
- Receptor Immobilization: Immobilize the specific capture antibodies (e.g., targeting the cancer biomarker) onto the activated surface. Unreacted sites are blocked with a neutral protein like bovine serum albumin (BSA) [31].
- Measurement Setup: Connect the sensor chip to a semiconductor parameter analyzer. Introduce a continuous flow of buffer (e.g., phosphate-buffered saline, PBS) at a controlled pH and low ionic strength to maintain a long Debye length for optimal sensitivity [29].
- Sample Injection & Real-Time Monitoring: Inject the sample containing the target protein biomarker. Monitor the source-drain current (Ids) of the SiNW in real-time. A specific, concentration-dependent change in Ids signifies binding events.
- Regeneration (Optional): For reusability, wash the sensor with a low-pH buffer or a mild detergent to dissociate the antigen-antibody complex without denaturing the immobilized receptors [29].
Protocol 2: Monitoring Viral Infection in Cell Culture for Antiviral Screening
This protocol is useful for assessing the efficacy of antiviral compounds by monitoring virus particle secretion from infected cells.
- Sensor Preparation: Functionalize a SiNW sensor array with antibodies specific to the viral surface protein, as described in Protocol 1 [29].
- Cell Culture Integration: Place the functionalized sensor chip in a microfluidic chamber. Seed and culture susceptible cells directly on the chip or in a connected chamber upstream.
- Infection and Compound Administration: Infect the cells with the virus. Introduce the candidate antiviral drug at varying concentrations to the culture medium.
- Continuous Monitoring: Continuously monitor the conductance of the SiNWs. A rising signal indicates increasing viral particle binding to the sensor surface. The rate of signal increase in the presence of a drug compound, compared to an untreated control, provides a direct measure of antiviral efficacy [29].
- Data Correlation: Correlate the electrical signal with standard endpoint assays (e.g., plaque assay) to validate the sensor's readout.
The following diagram maps this experimental workflow for antiviral screening.
The Scientist's Toolkit: Essential Research Reagent Solutions
Successful implementation of SiNW biosensor technology relies on a suite of specialized materials and reagents.
Table 3: Key Research Reagent Solutions for SiNW Biosensors
| Item | Function in Experiment | Key Characteristics |
|---|---|---|
| Silicon-on-Insulator (SOI) Wafers | Substrate for fabricating SiNWs via top-down processes. | Provides a single-crystal silicon device layer on an insulating oxide layer, essential for creating electrically isolated, high-performance nanowires [30]. |
| (3-Aminopropyl)triethoxysilane (APTES) | Silane coupling agent for surface functionalization. | Forms a self-assembled monolayer with terminal amine groups, creating a chemical bridge between the silicon oxide surface and biological receptors [29] [31]. |
| Glutaraldehyde | Homobifunctional cross-linker. | Reacts with amine groups from APTES and antibodies, covalently immobilizing the receptors onto the sensor surface [31]. |
| Specific Capture Antibodies | Biological recognition element for the target analyte. | High affinity and specificity are critical. Monoclonal antibodies are often preferred for their consistency [31]. |
| Bovine Serum Albumin (BSA) | Blocking agent to minimize non-specific binding. | Used to passivate unreacted sites on the functionalized surface after antibody immobilization, reducing background noise [31]. |
| Phosphate Buffered Saline (PBS) | Standard buffer for dilution and measurement. | Must be used at low ionic strength or diluted to maximize the Debye length, enhancing sensitivity to charged biomolecules [29]. |
Cost-Effectiveness Analysis within Biosensor Research
While the initial development and fabrication of SiNW biosensors require sophisticated cleanroom facilities, their long-term value proposition in drug development is compelling.
- Reduced Reagent Costs: SiNW biosensors are label-free, eliminating the ongoing need for expensive fluorescent or enzymatic labels required by ELISA and other optical methods [29] [32].
- Assay Miniaturization: Their small size enables assays with dramatically reduced sample and reagent volumes (microliters), which is particularly valuable for rare or precious compounds [30].
- Accelerated Timelines: The ability to provide real-time, kinetic data can shorten assay times from hours to minutes. Furthermore, continuous monitoring in cell-based assays provides more information-rich data from a single experiment, reducing the number of separate experiments needed [29] [31].
- High-Throughput Potential: The compatibility with CMOS technology allows for the mass production of sensor arrays and their integration into automated, high-throughput screening systems, driving down the cost per assay in the long run [30].
When viewed through the lens of total research expenditure, which includes personnel time, reagent costs, and capital equipment, the efficiency gains offered by SiNW biosensors present a strong case for their adoption, despite a higher upfront investment.
Silicon nanowire biosensors represent a paradigm shift in analytical technology for drug development. Their label-free operation, exceptional sensitivity, capacity for real-time monitoring, and potential for miniaturization and multiplexing directly address the inefficiencies of conventional methods. As the technology matures and becomes more accessible, its integration into standard workflows—from early target validation and lead compound screening to preclinical efficacy and toxicity studies—holds the undeniable potential to disrupt the traditional drug development timeline. By providing richer data faster and at a lower operational cost, SiNW biosensors are poised to play a pivotal role in accelerating the delivery of new therapeutics to patients.
The healthcare landscape is undergoing a fundamental transformation, shifting from reactive hospital-centered care to proactive, personalized health management. This revolution is being driven by the emergence of wearable biosensors—sophisticated devices capable of providing continuous, real-time physiological and biochemical monitoring outside clinical settings. Unlike conventional medical diagnostics that offer sporadic snapshots of health status, wearable biosensors enable a dynamic, comprehensive view of an individual's health trajectory, facilitating early disease detection and personalized intervention strategies [33] [34].
The significance of this technological shift extends beyond clinical applications to encompass profound economic implications. The global market for medical wearable biosensors is experiencing remarkable growth, with a compound annual growth rate (CAGR) of approximately 38% projected from 2017 to 2025, reflecting rapid adoption and technological advancement [34]. These devices represent a convergence of multiple disciplines, including materials science, microfluidics, flexible electronics, and artificial intelligence, creating a new paradigm for preventive medicine and chronic disease management [35] [36]. This guide provides a comprehensive comparison of wearable biosensor performance against conventional methods, with a specific focus on their cost-effectiveness across healthcare applications.
Comparative Analysis: Wearable Biosensors vs. Conventional Methods
Performance and Capability Comparison
The fundamental advantage of wearable biosensors lies in their ability to provide continuous, real-time monitoring, compared to the intermittent data provided by conventional clinical methods. The table below summarizes key performance parameters across different monitoring domains.
Table 1: Performance comparison between wearable biosensors and conventional monitoring methods
| Monitoring Parameter | Wearable Biosensor Technology | Conventional Method | Key Wearable Advantages | Experimental Evidence |
|---|---|---|---|---|
| Glucose Monitoring | Electrochemical sensors in skin patches/implants measuring interstitial fluid [36] | Finger-prick blood glucose meters & lab HbA1c tests [37] | Continuous real-time data, hypoglycemia alarms, trend analysis [35] | GlucoWatch biographer demonstrated non-invasive glucose monitoring via reverse iontophoresis [34] |
| Cardiovascular Monitoring | Wrist-worn PPG sensors, ECG patches, Hall effect devices for blood pressure [34] | Cuff-based BP monitors, clinical ECG, Holter monitors [34] | Unobtrusive continuous monitoring, atrial fibrillation detection, motion artifact correction [33] | Tison et al. developed algorithms detecting AF from PPG heart rate data with accelerometer for motion [34] |
| Sweat Analysis | Epidermal microfluidic patches with electrochemical detection [33] [36] | Laboratory analysis of collected sweat samples [36] | Real-time electrolyte/metabolite measurement, sweat rate correlation, multi-analyte detection [38] | Wang et al. developed eyeglasses with lactate biosensor and potassium ion-selective electrode in nose pads [34] |
| Lactate Monitoring | Enzymatic biosensors in textiles, skin patches [36] | Blood draws with laboratory analysis [36] | Non-invasive exercise intensity monitoring, real-time athletic performance optimization [36] | Visual ratiometric fluorescence sensing of L-lactate by Eu-MOF in sweat; real-time monitoring during physical activity [38] |
Cost-Effectiveness Analysis
Beyond technical performance, the economic evaluation of wearable biosensors reveals significant advantages for healthcare systems, particularly in managing chronic diseases where continuous monitoring can prevent costly complications.
Table 2: Cost-effectiveness analysis of wearable biosensors versus conventional diagnostic approaches
| Analysis Factor | Wearable Biosensors | Conventional Methods | Impact and Evidence |
|---|---|---|---|
| Initial Setup Cost | Moderate to high (device production, sensor integration) [35] | Low to moderate (individual test equipment) [39] | Higher initial cost offset by long-term reusable platform and reduced hospitalizations [33] |
| Operational/Per-Test Cost | Very low after initial investment [35] | Consumables, reagents, and specialized labor per test [37] | Significant long-term savings for continuous monitoring conditions [33] |
| Chronic Disease Management | Reduces hospitalizations through early intervention [33] | Reactive approach with higher emergency care utilization | Patients with chronic diseases using wearables showed reduced hospitalization rates [33] |
| Diagnostic Speed | Real-time results enabling immediate intervention [35] | Hours to days for laboratory processing [34] | Faster intervention potentially reduces disease progression and treatment costs [39] |
| Preventive Capability | High - continuous data enables early anomaly detection [38] | Low - only detects issues present during test | Early diagnosis of conditions like atrial fibrillation can prevent costly complications like stroke [34] |
| Personnel Requirements | Minimal after setup [34] | Requires trained professionals for operation and interpretation [37] | Substantial reduction in healthcare workforce burden [33] |
Technical Foundations and Experimental Methodologies
Biosensing Modalities and Technologies
Wearable biosensors employ diverse transduction mechanisms to detect physiological signals and biochemical analytes, each with distinct operational principles and applications.
Electrochemical Biosensors
Experimental Protocol: Electrochemical biosensors operate by immobilizing biological recognition elements (enzymes, antibodies, aptamers) onto electrode surfaces functionalized with nanomaterials. When target analytes interact with these recognition elements, electrochemical reactions occur, generating measurable signals (current, potential, or impedance change). For continuous monitoring, microfluidic systems transport biofluids (sweat, interstitial fluid) to the sensor interface, while reference electrodes provide stable potential measurements. Signal processing algorithms then convert raw electrochemical signals into analyte concentrations [37] [35].
Key Applications: Continuous glucose monitoring (CGM) systems represent the most widespread application, using glucose oxidase immobilized on electrode surfaces to detect glucose in interstitial fluid. Similarly, lactate biosensors employ lactate oxidase for monitoring exercise intensity and metabolic disorders [35] [36].
Optical Biosensors
Experimental Protocol: Optical biosensors utilize light-matter interactions to detect biomarkers. Configurations include fluorescence-based sensors where analyte binding quenches or enhances fluorescence intensity, photoplethysmography (PPG) for detecting blood volume changes, and colorimetric sensors where analyte concentration correlates with color changes. Fluorescent metal-organic frameworks (MOFs) can be engineered for specific analyte recognition, with detection achieved through smartphone-based cameras or miniaturized photodetectors [38] [35].
Key Applications: Pulse oximetry for blood oxygen saturation, wearable fluorescence sensors for pH monitoring and ion detection, and colorimetric sweat patches for electrolyte balance assessment [35] [36].
Advanced Materials and Fabrication
The development of wearable biosensors relies heavily on advanced materials that enable flexibility, biocompatibility, and high sensitivity.
Flexible Substrates and Electronics: Polymers such as polydimethylsiloxane (PDMS) and polyethylene provide skin-conformable platforms that withstand mechanical deformation during movement. These materials are fabricated using soft lithography and microprinting techniques to create microfluidic channels and electrode patterns [35] [36].
Nanomaterials for Enhanced Sensing: Graphene, carbon nanotubes, and metal nanoparticles significantly increase sensor sensitivity through their high surface area-to-volume ratios and excellent electrical properties. These nanomaterials facilitate electron transfer in electrochemical sensors and can be functionalized with various biorecognition elements [35].
Metal-Organic Frameworks (MOFs): MOFs represent a breakthrough in sensing materials, with their highly porous crystalline structures providing exceptional molecular selectivity and signal enhancement. Their tunable pore sizes and chemical functionality allow for precise biomarker capture and detection, significantly improving sensor specificity in complex biological fluids like sweat [38].
Visualization of Wearable Biosensor Workflows
Biosensor System Architecture and Data Flow
Cost-Benefit Analysis Framework
Essential Research Reagents and Materials
The development and validation of wearable biosensors require specialized materials and reagents that enable precise, reliable biological sensing.
Table 3: Essential research reagents and materials for wearable biosensor development
| Category | Specific Materials/Reagents | Function and Application | Key Characteristics |
|---|---|---|---|
| Biorecognition Elements | Glucose oxidase, Lactate oxidase, Cortisol antibodies, DNA aptamers [37] [36] | Biological recognition of specific analytes; provides sensor specificity | High specificity, stability under operational conditions, compatible immobilization chemistry |
| Nanomaterials | Graphene, Carbon nanotubes, Metal nanoparticles (Au, Pt), MOFs [38] [35] | Signal amplification, increased sensitivity, enhanced electron transfer | High surface area, excellent electrical conductivity, tunable surface chemistry |
| Polymer Substrates | PDMS, Polyethylene, Polyurethane, Hydrogels [35] [36] | Flexible, stretchable sensor substrates; skin interface materials | Biocompatibility, mechanical flexibility, gas permeability, conformability |
| Electrochemical Reagents | Redox mediators (Ferrocene derivatives, Prussian Blue), Reference electrode materials (Ag/AgCl) [37] [35] | Facilitate electron transfer in biological systems; provide stable reference potential | Stable electrochemical properties, biocompatibility, minimal potential drift |
| Microfluidic Components | Soft lithography resists (SU-8), Curing agents, Surface modification reagents [36] | Create microchannels for biofluid transport; precise volume handling | Precise patterning capability, appropriate surface wettability, biocompatibility |
| Signal Transduction Materials | Fluorescent dyes, Quantum dots, Conductive polymers, Piezoelectric materials [38] [35] | Convert biological recognition events into measurable signals | High signal-to-noise ratio, stability, compatibility with detection systems |
Wearable biosensors represent a transformative technology at the intersection of medical diagnostics, materials science, and artificial intelligence. The comparative analysis presented demonstrates their significant advantages over conventional methods, particularly through continuous monitoring capabilities, cost-effective long-term deployment, and personalized health insights. As supported by experimental data and cost-benefit analysis, these devices enable a paradigm shift from episodic healthcare to continuous health optimization, with demonstrated effectiveness in chronic disease management, preventive care, and personalized treatment optimization.
Future research directions focus on enhancing sensor multimodality, developing self-powering systems through energy harvesting, improving AI-driven predictive analytics, and addressing challenges related to long-term stability, data standardization, and regulatory approval. The integration of metal-organic frameworks and machine learning algorithms represents a particularly promising avenue for developing next-generation biosensors with clinical-grade accuracy in wearable form factors [38] [37]. As these technologies mature, wearable biosensors are poised to become indispensable tools in creating more proactive, personalized, and cost-effective healthcare ecosystems.
The rapid and accurate detection of pathogens and specific biomarkers is a cornerstone of modern clinical diagnostics, public health protection, and therapeutic drug development. Conventional detection methods, including culture techniques, microscopy, serological assays, and polymerase chain reaction (PCR), are often constrained by lengthy processing times, high costs, specialized equipment requirements, and the need for skilled personnel [40]. These limitations have catalyzed the development of advanced biosensing platforms designed to offer rapid, sensitive, and cost-effective alternatives.
Biosensors are analytical devices that integrate a biological recognition element (bioreceptor) with a physicochemical transducer to produce a measurable signal proportional to the concentration of a target analyte [40] [41]. The global biosensors market is projected to grow significantly, underscoring their increasing importance [42]. Electrochemical and optical biosensors represent two of the most prominent and rapidly advancing categories. Electrochemical biosensors dominate the market, accounting for over 70% share as of 2024, largely driven by their application in glucose monitoring and point-of-care settings [42]. Optical biosensors, while having a smaller market share, are anticipated to grow rapidly due to their ultrasensitive properties, which are suitable for early disease detection [42]. This guide provides a objective comparison of these two platforms, focusing on their application in detecting pathogens and biomarkers, supported by experimental data and framed within a cost-effectiveness analysis compared to conventional methods.
Electrochemical Biosensors
Electrochemical biosensors operate by detecting changes in the electrical properties of a solution resulting from the interaction between a bioreceptor and its target analyte. The core components include a biorecognition layer and an electrochemical transducer, which measures electrical parameters such as current, potential, or impedance [41]. The integration of functional nanomaterials, such as metal-organic frameworks (MOFs) and metal nanoclusters, has been pivotal in enhancing their sensitivity by improving interface engineering and electron transfer [43] [44]. For instance, Mn-doped zeolitic imidazolate framework-67 (ZIF-67) has been used to create high-performance sensors for E. coli, where the doping enhances surface area and electron transfer, while antibody conjugation provides specificity [44]. Their advantages include high sensitivity, cost-effectiveness, portability, and ease of use, making them ideal for point-of-care (PoC) applications [43] [40].
Optical Biosensors
Optical biosensors transduce a biological interaction into a measurable optical signal, such as changes in light absorption, fluorescence, luminescence, or refractive index [40] [41]. Common modalities include fluorescence-based biosensors, surface plasmon resonance (SPR), and colorimetric assays. These platforms often leverage the unique properties of nanomaterials; for example, metal nanoclusters (MNCs) exhibit strong photoluminescence and high photochemical stability, while spiky Au-Ag nanostars provide intense plasmonic enhancement for Surface-Enhanced Raman Scattering (SERS) [7] [40]. A notable example is a SERS-based immunoassay for the α-fetoprotein biomarker, which utilizes an Au-Ag nanostars platform to achieve sensitive detection without relying on external Raman reporters [7]. Optical biosensors are renowned for their high sensitivity and capacity for real-time, multiplexed detection [40] [45].
Table 1: Fundamental Characteristics of Electrochemical and Optical Biosensors
| Characteristic | Electrochemical Biosensors | Optical Biosensors |
|---|---|---|
| Transduction Principle | Measures changes in current, potential, or impedance | Measures changes in light properties (e.g., absorbance, fluorescence) |
| Key Nanomaterials | Metal-organic frameworks (MOFs), metal nanoclusters, graphene | Gold/Silver nanostars, metal nanoclusters, quantum dots |
| Typical Bioreceptors | Antibodies, aptamers, enzymes | Antibodies, aptamers, nucleic acids |
| Primary Advantages | High sensitivity, portability, low cost, low power needs | Very high sensitivity, potential for multiplexing, real-time kinetics |
| Common Applications | Glucose monitoring, pathogen detection (e.g., E. coli), PoC diagnostics | Cancer biomarker detection (e.g., α-fetoprotein), pathogen identification, research assays |
Comparative Performance Analysis
Direct comparative studies and data from recent literature reveal distinct performance profiles for electrochemical and optical biosensors. The following table summarizes key performance metrics for representative examples of each platform targeting pathogens and biomarkers.
Table 2: Performance Comparison of Representative Electrochemical and Optical Biosensors
| Target Analyte | Biosensor Type | Platform / Recognition Element | Linear Range | Limit of Detection (LOD) | Reference |
|---|---|---|---|---|---|
| E. coli (Pathogen) | Electrochemical | Mn-ZIF-67 / Anti-O antibody | 10 to 1010 CFU mL–1 | 1 CFU mL–1 | [44] |
| α-Fetoprotein (Cancer Biomarker) | Optical (SERS) | Au-Ag Nanostars / Anti-AFP antibody | 0–500 ng mL-1 | 16.73 ng mL-1 | [7] |
| Glucose (Metabolic Biomarker) | Electrochemical | Porous Au/Polyaniline/Pt nanoparticle | N/A (High sensitivity reported) | High Sensitivity: 95.12 ± 2.54 µA mM−1 cm−2 | [7] |
| Pathogens (Bacteria/Viruses) | Optical (Fluorescence) | Metal Nanocluster (MNC)-based | Varies by specific assay | High sensitivity and specificity reported | [40] |
The data indicates that electrochemical biosensors can achieve exceptionally low limits of detection for pathogens, as demonstrated by the 1 CFU mL–1 sensitivity for E. coli [44]. This makes them highly competitive for applications requiring ultra-trace analysis. Optical platforms, such as the SERS-based sensor, also provide high sensitivity suitable for clinical biomarker detection [7]. A critical advantage of optical methods is their potential for multiplexing, or simultaneously detecting multiple analytes in a single sample, which is invaluable for comprehensive diagnostics in areas like cancer and infectious disease monitoring [42]. Both platforms significantly outperform conventional methods in speed, with assays often completed in minutes to a few hours.
Experimental Protocols and Methodologies
Protocol for Electrochemical Detection ofE. coliUsing a Mn-ZIF-67 Biosensor
This protocol is adapted from a study demonstrating a high-performance sensor for E. coli [44].
1. Sensor Fabrication: - Synthesis of Mn-ZIF-67: Combine cobalt nitrate and manganese acetate in methanol. Then, add a methanolic solution of 2-methylimidazole under vigorous stirring. The resulting precipitate is centrifuged, washed with methanol, and dried to obtain the Co/Mn ZIF composite. - Electrode Modification: Prepare a homogeneous ink by dispersing the synthesized Co/Mn ZIF material in a solvent like ethanol. Drop-cast this suspension onto a polished glassy carbon electrode and allow it to dry. - Bioconjugation: Immobilize anti-E. coli O-specific antibody onto the modified electrode surface. This is typically done using cross-linking chemistry (e.g., EDC/NHS) to form stable amide bonds between the antibody and functional groups on the MOF surface.
2. Detection Assay: - Sample Incubation: Expose the functionalized electrode to the sample solution (e.g., spiked tap water or clinical sample) for a fixed period (e.g., 30 minutes) to allow E. coli cells to bind to the antibodies. - Electrochemical Measurement: Use electrochemical techniques such as Electrochemical Impedance Spectroscopy (EIS) or Differential Pulse Voltammetry (DPV) in a standard three-electrode cell. The binding of bacterial cells modulates the electron transfer resistance or current at the electrode interface. - Quantification: Measure the change in the electrochemical signal (e.g., increase in charge transfer resistance, Rct, in EIS). Plot this signal against the logarithm of bacterial concentration to generate a calibration curve for unknown samples.
Protocol for Optical Detection of α-Fetoprotein Using a SERS Immunoassay
This protocol is based on a SERS platform for the cancer biomarker α-fetoprotein (AFP) [7].
1. SERS Substrate Preparation: - Synthesis of Au-Ag Nanostars: Synthesize gold-silver core-shell nanostars with sharp, spiky morphologies via a seed-mediated growth method. The sharp tips are crucial for generating intense electromagnetic fields for SERS enhancement. - Bioconjugation: Functionalize the nanostars with a monoclonal anti-AFP antibody. This can be achieved by creating a self-assembled monolayer of a linker molecule (e.g., mercaptopropionic acid, MPA) on the metal surface, followed by activation with EDC/NHS to covalently attach the antibody.
2. Detection Assay: - Immunoassay Procedure: Incubate the antibody-conjugated nanostars with the sample containing the AFP antigen. This forms an immunocomplex on the surface of the nanostars. - SERS Signal Measurement: After incubation and washing, analyze the suspension with a Raman spectrometer. In this platform, the intrinsic vibrational modes of the AFP protein itself are detected, eliminating the need for an external Raman reporter dye. - Quantification: The intensity of the characteristic Raman peaks of AFP is directly proportional to the concentration of the biomarker in the sample. A calibration curve is constructed by plotting SERS intensity versus known concentrations of AFP.
Signaling Pathways and Experimental Workflows
The following diagrams illustrate the core signaling pathways and experimental workflows for the two biosensor types, highlighting the sequence of events from analyte binding to signal generation.
Electrochemical Biosensor Signaling Pathway
Optical Biosensor (SERS) Signaling Pathway
The Scientist's Toolkit: Essential Research Reagents and Materials
The development and implementation of high-performance biosensors rely on a suite of specialized reagents and materials. The following table details key components and their functions in typical experimental setups.
Table 3: Essential Research Reagents and Materials for Biosensor Development
| Reagent/Material | Function | Example in Context |
|---|---|---|
| Bioreceptors | Provides specificity by binding to the target analyte. | Anti-E. coli O-antibody [44], anti-α-fetoprotein antibody [7], aptamers [40]. |
| Functional Nanomaterials | Enhances signal transduction, provides high surface area for immobilization. | Mn-ZIF-67 MOF (electrocatalyst) [44], Au-Ag Nanostars (SERS substrate) [7], metal nanoclusters (fluorescent probes) [40]. |
| Cross-linking Agents | Covalently immobilizes bioreceptors onto the sensor surface. | EDC (1-Ethyl-3-(3-dimethylaminopropyl) carbodiimide) and NHS (N-Hydroxysuccinimide) [7]. |
| Electrochemical Transducers | The physical platform where the electrochemical reaction occurs. | Glassy carbon electrode, screen-printed electrodes, gold electrodes. |
| Optical Components | For excitation and collection of optical signals. | Laser source, spectrometer, optical fibers (for SERS, fluorescence) [7]. |
| Buffer Solutions | Maintains optimal pH and ionic strength for biological activity. | Phosphate buffered saline (PBS), HEPES. |
Cost-Effectiveness Analysis vs. Conventional Methods
A critical thesis in modern biosensor research is their cost-effectiveness compared to conventional analytical techniques. Methods like liquid or gas chromatography coupled with mass spectrometry (LC-MS/GC-MS), while highly accurate and considered gold standards, are often time-consuming, require expensive instrumentation and specialized operators, and are not portable for on-site measurements [40] [41].
Advantages of Biosensors in Cost-Effectiveness:
- Rapid Response and High Throughput: Biosensors can reduce analysis time from days to minutes, accelerating diagnostic decisions and potentially reducing hospital stays [40] [44].
- Portability and Point-of-Care Use: The miniaturization of electrochemical and some optical platforms enables decentralized testing, eliminating the need for centralized labs and associated transport and logistics costs [27] [42].
- Lower Operational Costs: Biosensors do not typically require expensive solvents, complex infrastructure, or highly specialized continuous training, leading to lower per-test costs [41].
- Real-Time Monitoring: Wearable biosensors, particularly electrochemical ones, allow for continuous monitoring of biomarkers, facilitating proactive healthcare and potentially reducing long-term complications [27].
The integration of artificial intelligence (AI) and big data analytics further enhances the value proposition of biosensors by improving diagnostic accuracy and enabling predictive healthcare, which can optimize resource allocation in healthcare systems [39] [42]. While conventional methods remain essential for confirmatory testing, electrochemical and optical biosensors offer a compelling, cost-effective solution for rapid screening, point-of-care diagnosis, and continuous monitoring.
Biosensors have emerged as critical analytical tools that seamlessly integrate biological recognition elements with physical transducers to detect and measure specific analytes with exceptional sensitivity and precision [46]. While their applications in healthcare are well-established, the unique advantages of biosensors—including miniaturization, portability, and real-time monitoring capabilities—are catalyzing their adoption in food safety and environmental monitoring [46]. These fields share a common need for rapid, on-site detection of hazards that traditional laboratory methods often cannot provide due to extended turnaround times, high costs, and requirements for specialized facilities and personnel [46] [47].
The fundamental architecture of a biosensor consists of a biological recognition element (such as enzymes, antibodies, aptamers, or whole cells) and a transducer (electrochemical, optical, piezoelectric, or thermal) that converts the biological interaction into a quantifiable signal [46]. Recent technological advances have significantly enhanced biosensor capabilities across all application domains. Key developments include the integration of nanotechnology for improved sensitivity, the creation of wearable and implantable devices for continuous monitoring, and the incorporation of artificial intelligence (AI) for data processing and pattern recognition [46] [39]. These innovations position biosensors as transformative tools for addressing global challenges in food security and environmental protection.
Performance Comparison: Biosensors Versus Conventional Methods
Analytical Performance Metrics
The performance of biosensors for detecting various contaminants in food and environmental samples has been systematically evaluated against conventional analytical methods. The comparative data, synthesized from recent studies, reveal significant differences in key operational parameters.
Table 1: Performance Comparison for Pathogen Detection
| Detection Method | Target Pathogen | Linear Range | Limit of Detection (LOD) | Analysis Time | Reference |
|---|---|---|---|---|---|
| Recombinase-Aided Amplification + Test Strip (RAA-TS) | Pseudomonas fluorescens (gyrB gene) | N/A | 37 CFU/mL | ~90 minutes | [48] |
| RAA-TS | Pseudomonas fluorescens (aprX gene) | N/A | 233 CFU/mL | ~90 minutes | [48] |
| Conventional Culture Methods | Pseudomonas fluorescens | N/A | N/A | 24-48 hours | [48] |
| Aptamer-based SERS Biosensor | Salmonella | N/A | 10 CFU/mL | ~1 hour | [8] |
| Traditional PCR/ELISA | Various pathogens | Varies | Varies | 2-24 hours | [8] |
Table 2: Performance Comparison for Chemical Contaminant Detection
| Detection Method | Target Analyte | Linear Range | Limit of Detection (LOD) | Analysis Time | Reference |
|---|---|---|---|---|---|
| Molecularly Imprinted SERS Biosensor | Malachite Green | N/A | Demonstrated for real samples | Rapid | [49] |
| Laboratory Spectroscopy/Chromatography | Malachite Green | Broad | Low ppt-ppb | Hours to days | [49] |
| Electrochemical Immunosensor | BRCA-1 protein | 0.05–20 ng/mL | 0.04 ng/mL | Minutes to hours | [49] |
| Clinical Assays (ELISA, etc.) | BRCA-1 protein | Varies | Varies | Several hours | [49] |
The data reveal that biosensors consistently offer significantly faster analysis times compared to conventional methods, reducing detection from days to hours or even minutes. While traditional laboratory methods may still offer broader linear ranges in some cases, biosensors provide sufficiently low limits of detection for practical application in food safety and environmental monitoring.
Cost-Effectiveness and Operational Considerations
Beyond analytical performance, cost-effectiveness is a crucial factor in method selection. Biosensors demonstrate compelling advantages in several economic dimensions:
- Reduced Reagent Consumption: Biosensors developed for food and environmental applications have demonstrated up to 140-fold reduction in reagent consumption per test compared to conventional methods [48].
- Minimal Sample Preparation: The ability of many biosensor platforms to analyze complex matrices like food samples and environmental water with minimal preprocessing significantly reduces labor costs and time [46].
- Point-of-Need Deployment: The portability and user-friendly operation of modern biosensors enable testing at the point of need, eliminating transportation costs and delays associated with laboratory analysis [46] [47].
- Continuous Monitoring Capability: Unlike batch-processing conventional methods, certain biosensor configurations enable continuous, real-time monitoring of environmental parameters or food production processes [46].
The integration of biosensors with emerging technologies like generative AI and gamification for operator training further enhances their cost-effectiveness by improving accuracy and reducing the learning curve for effective implementation [39].
Experimental Protocols for Key Biosensor Applications
Protocol 1: Aptamer-Based SERS Biosensor for Salmonella Detection
Principle: This method combines the specificity of aptamers with the enhanced sensitivity of Surface-Enhanced Raman Spectroscopy (SERS) for rapid pathogen detection [8].
Materials:
- Aptamer-conjugated magnetic nanoparticles
- SERS-active substrates (e.g., Au-Ag nanostars)
- Raman reporter molecules
- Portable Raman spectrometer
- Food or environmental samples
Procedure:
- Sample Preparation: Suspend food samples in enrichment broth and incubate briefly to allow pathogen growth.
- Target Capture: Add aptamer-conjugated magnetic nanoparticles to the sample and incubate with gentle mixing for 15 minutes.
- Magnetic Separation: Place the sample tube in a magnetic separator for 5 minutes to concentrate the target-pathogen complex.
- SERS Labeling: Resuspend the complex in buffer containing SERS tags and incubate for 10 minutes.
- Signal Detection: Apply the mixture to a SERS substrate and acquire spectra using a portable Raman spectrometer.
- Quantification: Correlate characteristic Raman peak intensities with pathogen concentration using a pre-established calibration curve.
Validation: The method demonstrated a detection limit of 10 CFU/mL for Salmonella in spiked food samples, with high specificity against competing bacteria and a total analysis time under 1 hour [8].
Protocol 2: Electrochemical Biosensor for Pesticide Detection
Principle: This approach utilizes enzyme inhibition (e.g., acetylcholinesterase) or specific recognition elements to detect pesticide residues [46].
Materials:
- Screen-printed carbon electrodes or gold electrodes
- Acetylcholinesterase enzyme or specific aptamers/antibodies
- Electrochemical workstation
- Mediators (e.g., Prussian Blue, Ferrocene derivatives)
- Phosphate buffer solution (pH 7.4)
Procedure:
- Electrode Modification: Immobilize the recognition element (enzyme, antibody, or aptamer) on the electrode surface using appropriate cross-linking chemistry.
- Baseline Measurement: Record the electrochemical signal (amperometric, impedimetric, or voltammetric) in buffer solution to establish baseline.
- Sample Exposure: Incubate the modified electrode with the sample solution containing the target pesticide for 10-15 minutes.
- Signal Measurement: Measure the change in electrochemical signal relative to baseline.
- Quantification: Compare the signal change to a calibration curve prepared with standard solutions.
Validation: Recent electrochemical biosensors for organophosphorus pesticides have achieved detection limits in the nanomolar to picomolar range, successfully applied to fruit, vegetable, and water samples [46].
Signaling Pathways and Experimental Workflows
Biosensor Signaling Pathways
The following diagram illustrates the fundamental signaling pathways in biosensing platforms that enable the detection of food and environmental contaminants.
Figure 1: Biosensor Signaling Pathways. This diagram illustrates the fundamental signal transduction process in biosensors, beginning with specific binding between the analyte and biological recognition element, followed by conversion to a measurable signal.
Experimental Workflow for Contaminant Detection
The workflow for developing and applying biosensors in food safety and environmental monitoring involves multiple interconnected stages, as illustrated below.
Figure 2: Biosensor Development and Application Workflow. This workflow outlines the key stages in creating and implementing biosensors, from initial design and material selection through to final result interpretation.
The Scientist's Toolkit: Essential Research Reagents and Materials
The development and implementation of biosensors for food safety and environmental monitoring rely on specialized materials and reagents that enable sensitive and specific detection. The following table catalogues key components referenced in recent studies.
Table 3: Essential Research Reagents for Biosensor Development
| Reagent/Material | Function | Example Application | Reference |
|---|---|---|---|
| Au-Ag Nanostars | SERS substrate providing intense plasmonic enhancement | α-Fetoprotein cancer biomarker detection | [7] |
| Transition Metal Dichalcogenides (WS₂, MoS₂) | 2D materials enhancing SPR sensitivity | Cancerous cell detection in SPR biosensors | [6] |
| Carbon Quantum Dots (CQDs) | Fluorescent nanomaterials for optical sensing | Heavy metal detection, pathogen detection in food | [50] |
| Aptamers | Synthetic oligonucleotide recognition elements | Specific detection of pathogens (e.g., Salmonella) | [8] |
| Molecularly Imprinted Polymers (MIPs) | Synthetic receptors with tailored binding sites | Malachite green detection in environmental samples | [49] |
| Covalent Organic Frameworks (COFs) | Porous crystalline materials for immobilization | Electrochemical and optical immunoassays | [8] |
| Liquid Metal Composites | Stretchable conductive materials for wearable sensors | Continuous environmental monitoring | [8] |
| Bacteriophages | Natural biological recognition elements | Pathogenic bacteria detection in food | [8] |
| Melanin-related Materials | Biocompatible coatings for surface modification | Toxic metal ion detection | [7] |
| Graphene Foam | 3D electrode material with high surface area | Tau-441 protein detection for environmental neurotoxins | [8] |
These materials enable the sophisticated functionality of modern biosensors, with each component serving specific roles in the detection mechanism. The selection of appropriate materials depends on the target analyte, sample matrix, and required detection parameters.
Biosensor technology has unequivocally demonstrated its value beyond healthcare applications, offering robust, sensitive, and cost-effective solutions for food safety and environmental monitoring. The performance data clearly show that biosensors can compete with or even surpass conventional methods in key metrics, particularly analysis time, portability, and operational costs. As materials science continues to advance, bringing forth novel nanomaterials with enhanced properties, and as integration with AI and machine learning algorithms becomes more sophisticated, the capabilities of biosensors will further expand.
Future development trajectories will likely focus on several key areas: enhancing multiplexing capabilities for simultaneous detection of multiple contaminants, improving stability and shelf-life for field deployment, developing self-powering systems for remote monitoring, and creating more intuitive user interfaces for non-specialist operators. The convergence of these technological advances positions biosensors as transformative tools that will reshape monitoring paradigms across the food supply chain and environmental protection sectors, ultimately contributing to safer food products and a healthier environment.
Navigating the Hurdles: Technical, Commercial, and Regulatory Challenges in Biosensor Adoption
Biosensors have emerged as powerful analytical tools, transforming diagnostic practices across healthcare, environmental monitoring, and food safety. Their distinct advantages—including rapid analysis, high sensitivity, and minimal sample preparation—offer compelling benefits over conventional methods like chromatography and standard immunoassays [51]. However, the translational pathway from laboratory research to commercial deployment is fraught with technical challenges centered on three critical parameters: stability, selectivity, and manufacturing consistency. These limitations directly impact biosensor reliability, performance reproducibility, and ultimately, their cost-effectiveness in real-world applications. This guide objectively compares biosensor performance against conventional analytical techniques, providing experimental data and methodologies that highlight both advancements and persistent challenges within a cost-effectiveness analysis framework.
Comparative Performance Analysis: Biosensors vs. Conventional Methods
The evaluation of biosensors against conventional methods reveals a complex trade-off between analytical performance, operational practicality, and economic feasibility. The table below summarizes key performance metrics and cost drivers.
Table 1: Performance and Cost Comparison: Biosensors vs. Conventional Methods
| Feature | Biosensors | Conventional Methods (e.g., Chromatography, Standard Immunoassays) |
|---|---|---|
| Analysis Speed | Rapid (minutes to hours) [51] | Slow (hours to days), requiring complex procedures [51] |
| Sensitivity | Very High (e.g., LOD of 16.73 ng/mL for AFP) [7] | High, but often requires separate sample preparation and larger volumes |
| Selectivity | High (leveraging biological recognition), but can be compromised by fouling or non-specific binding [52] | Very High (excellent separation of analytes) |
| Operational Stability | Variable; biological components can denature [51] [52] | High; instruments are stable with regular calibration |
| Sample Preparation | Minimal [51] | Extensive often required |
| Skill Requirement | Low; suitable for non-specialists [51] | High; requires trained technicians |
| Equipment & Per-Test Cost | Lower cost per test; potential for disposable, low-cost devices [51] | High capital equipment cost; expensive consumables |
| Manufacturing Scalability | Challenging; requires nanomaterial and bioreceptor consistency [53] | Established and standardized |
| Throughput | Typically low to medium, suited for point-of-care | High throughput in centralized labs |
| Key Cost Drivers | Bioreceptor production/purification, nanomaterial synthesis, signal transducer fabrication, assembly integration | Equipment depreciation, skilled labor, reagent kits, facility overhead |
The primary economic advantage of biosensors lies in their potential for decentralized testing, which reduces turnaround times and can lower overall healthcare costs by enabling early intervention. However, their cost-effectiveness is highly sensitive to reliability. A single false result from issues with stability or selectivity can erase initial savings by necessitating confirmatory testing with conventional methods, leading to delayed treatment and increased patient burden [52].
Deep Dive into Technical Limitations and Experimental Insights
Stability: Beyond Single-Use Applications
Stability refers to a biosensor's ability to maintain its analytical performance over time and usage. A core vulnerability is the inherent instability of biological recognition elements, such as enzymes and antibodies, which can denature under varying temperature, pH, or during storage [51].
Experimental Case Study: Enzyme-Free Glucose Sensor
- Objective: To develop a highly stable glucose sensor for continuous monitoring in interstitial fluid, overcoming the limitation of enzyme-based sensors.
- Materials & Protocol: A nanostructured composite electrode was fabricated on a printed circuit board (PCB). The electrode combined highly porous gold with polyaniline and platinum nanoparticles to create an enzyme-free, electrocatalytic platform [7].
- Key Stability Metric: The sensor demonstrated excellent stability during testing in interstitial fluid, maintaining its high sensitivity over time. This abiotic (non-biological) approach eliminates the primary source of instability in conventional enzymatic glucose sensors [7].
Research Reagent Solutions for Enhanced Stability
- MXenes & 2D Materials (e.g., MoS₂): These materials provide a high-surface-area scaffold for bioreceptor immobilization, improving stability. However, challenges like restacking and long-term electrical conductivity degradation in physiological media remain active research areas [54] [53].
- Covalent Organic Frameworks (COFs): Their highly ordered porous structures and strong covalent bonds enhance the stability of electrochemiluminescence (ECL) systems, leading to more durable sensors [55].
- Melanin-like Coatings (e.g., Polydopamine): These coatings improve biocompatibility and surface stability, protecting the sensor from fouling and degradation in complex sample matrices [7].
Selectivity: Achieving Specificity in Complex Matrices
Selectivity is the sensor's ability to distinguish the target analyte from interfering substances in a sample. Non-specific binding is a major contributor to false positives and negatives [52].
Experimental Case Study: SERS-Based Immunoassay for α-Fetoprotein (AFP)
- Objective: To detect the cancer biomarker AFP with high specificity and sensitivity using a Surface-Enhanced Raman Scattering (SERS) platform.
- Materials & Protocol: Au-Ag nanostars with sharp-tipped morphology were synthesized and concentrated via centrifugation. These nanostars were functionalized with mercaptopropionic acid (MPA), followed by the activation of carboxyl groups using EDC and NHS chemistry. This allowed for the covalent immobilization of monoclonal anti-α-fetoprotein antibodies (AFP-Ab). The binding of the AFP antigen to its antibody on the nanostar surface generates a unique intrinsic SERS fingerprint, eliminating the need for external Raman reporters [7].
- Key Selectivity Metric: The functionalized platform successfully detected AFP antigens across a range of 500–0 ng/mL, with a calculated limit of detection (LOD) of 16.73 ng/mL. The reliance on the specific antibody-antigen interaction and the intrinsic vibrational signature of AFP underpins the high selectivity [7].
Research Reagent Solutions for Enhanced Selectivity
- Aptamers: These synthetic single-stranded DNA or RNA molecules can be engineered for high affinity and specificity toward a wide range of targets, from small molecules to whole cells. They offer an alternative to antibodies with potentially better stability and batch-to-batch consistency [56].
- Molecularly Imprinted Polymers (MIPs): Synthetic polymers that contain cavities tailored to the shape and functional groups of a specific target molecule, providing antibody-like recognition with superior physical and chemical stability [51].
- CRISPR-Cas Systems: These platforms provide exceptional specificity for nucleic acid detection, enabling the development of next-generation biosensors for infectious diseases and genetic markers [56].
Manufacturing Consistency: The Scalability Challenge
Manufacturing consistency ensures that every biosensor unit performs identically, which is a significant hurdle in transitioning from lab prototypes to mass production. Inconsistencies often arise from the synthesis of nanomaterials, the immobilization of bioreceptors, and device assembly [53].
Experimental Insight: Fabrication of MoS₂-Based Biosensors
- Objective: To produce high-quality, uniform MoS₂ nanosheets for reliable biosensor fabrication.
- Materials & Protocol: Multiple fabrication methods are employed, each with a trade-off between quality and scalability.
- Mechanical Exfoliation ("Scotch Tape" method): Produces the cleanest, highest-crystalline nanosheets but yields flakes with random thickness and sizes, making it unsuitable for large-scale production [53].
- Chemical Vapor Deposition (CVD): Can produce large-area, uniform films of MoS₂ and is more scalable. However, it requires high temperatures, sophisticated equipment, and can introduce defects [53].
- Liquid-Phase Exfoliation (LPE): A promising, low-cost, and scalable method where bulk crystals are dispersed in a solvent and exfoliated via ultrasonication. The challenge lies in controlling the nanosheet size and thickness distribution and preventing restacking [53].
Research Reagent and Technology Solutions
- Advanced Manufacturing & PAT: The adoption of Process Analytical Technology (PAT) in manufacturing uses tools like NIR spectroscopy and AI-driven analytics for real-time monitoring and control of Critical Process Parameters (CPPs), ensuring consistent product quality [57].
- Hyperautomation: Integrating AI with Robotic Process Automation (RPA) in production planning and execution minimizes human error and enhances operational consistency [58].
- Standardized Characterization: Techniques like Raman spectroscopy, SEM, and AFM are essential for rigorously assessing the quality, thickness, and morphology of nanomaterials like MoS₂ before sensor fabrication, helping to correlate material properties with sensor performance [53].
Essential Research Toolkit
The following table details key reagents and materials critical for research and development in overcoming the discussed technical limitations.
Table 2: Research Reagent Solutions for Advanced Biosensor Development
| Research Reagent / Material | Primary Function in Biosensor Development |
|---|---|
| MXenes (e.g., Ti₃C₂Tₓ) | Enhance electrochemical properties, signal amplification, and stability in biosensing platforms [54]. |
| Molybdenum Disulfide (MoS₂) | Acts as a transducing material with a high surface-to-volume ratio for ultra-sensitive, label-free detection [53]. |
| Gold-Silver (Au-Ag) Nanostars | Serve as a plasmonic platform for SERS, providing intense signal enhancement due to sharp-tipped morphology [7]. |
| Covalent Organic Frameworks (COFs) | Provide a tunable, porous structure for enhanced electrochemiluminescence (ECL) efficiency and stability [55]. |
| Aptamers | Act as synthetic bioreceptors with high selectivity and stability for targets ranging from ions to whole cells [56]. |
| Polydopamine (PDA) | Used for versatile surface modification to improve biocompatibility, reduce fouling, and enable functionalization [7]. |
| EDC/NHS Chemistry | A standard crosslinking protocol for the covalent immobilization of biomolecules (e.g., antibodies) onto sensor surfaces [7]. |
Experimental Workflow and Signaling Pathways
The following diagram illustrates a generalized experimental workflow for developing and validating a novel biosensor, integrating the key steps and considerations discussed in this guide.
Generalized Biosensor Development Workflow
The journey toward widespread, cost-effective adoption of biosensors hinges on the research community's ability to systematically address the intertwined challenges of stability, selectivity, and manufacturing consistency. While biosensors offer an unparalleled advantage in speed and potential for decentralized testing, their economic viability is compromised by these technical limitations. Future progress depends on a multidisciplinary approach that integrates novel stable materials like MXenes and COFs, high-specificity receptors like aptamers, and smart manufacturing practices guided by PAT and AI. By focusing on these core technical hurdles, the next generation of biosensors can truly fulfill their promise as reliable, affordable, and impactful analytical tools.
Biosensor technology holds transformative potential for medicine, food safety, and environmental monitoring, offering rapid, sensitive, and specific detection of analytes. The ubiquitous personal electrochemical glucose sensor has revolutionized diabetes management, demonstrating how a successfully commercialized biosensor can improve the quality of life for millions of patients [59]. This success story, however, belies a significant challenge in the field: despite extensive academic research and numerous promising laboratory prototypes, very few biosensors successfully transition to commercialized products [59]. This gap between laboratory innovation and widespread clinical or commercial deployment is known as the "commercialization valley." A significant research-to-market gap persists, with key bottlenecks including signal instability, calibration drift, low reproducibility in large-scale fabrication, and the lack of standardized data processing workflows [60]. Understanding the technical, economic, and regulatory dimensions of this valley is crucial for researchers and developers aiming to bridge it. This guide provides a comparative analysis of emerging biosensor technologies against conventional methods, framed within a cost-effectiveness analysis to illuminate the path toward successful translation.
Performance Comparison: Biosensors vs. Conventional Methods
The selection of an appropriate detection technology requires a careful balance of analytical performance, operational requirements, and economic feasibility. The following tables provide a detailed comparison across these dimensions.
Table 1: Analytical Performance and Operational Characteristics
| Technology | Limit of Detection | Detection Time | Throughput | Key Advantages | Key Limitations |
|---|---|---|---|---|---|
| PCR | High (e.g., 7.74 RNA copies/reaction) [61] | >4 hours [61] | Low to Moderate | Sensitive, specific, accurate (gold standard) [61] | Complex procedure, requires trained personnel and clean lab [61] |
| Isothermal Amplification | Moderate [61] | 15-20 min to 1 hour [61] | Low to Moderate | Fast, simpler than PCR [61] | Lower sensitivity than PCR [61] |
| Conventional Antigen Tests | Moderate (e.g., 0.65 ng/mL, 360 TCID50/mL) [61] | ~10-16 min [61] | Moderate | Rapid, simple, suitable for onsite detection [61] | Limited sensitivity and specificity [61] |
| Optical Biosensors | Very High (e.g., fM range for LSPR, 0.8 pg/mL) [61] | 5 min [61] | High (e.g., 384 specimens in 30 min) [61] | High sensitivity, rapid, suitable for automation [61] | Throughput and onsite operation can need improvement [61] |
| Electrochemical Biosensors | High (e.g., µM to fM range) [49] [62] | Minutes [15] | Variable (portable to high-throughput) | Portable, cost-effective, high sensitivity [59] [15] | Can suffer from signal noise and calibration drift [60] |
Table 2: Cost-Effectiveness and Implementation Analysis
| Parameter | Laboratory PCR | Rapid Antigen Tests | Next-Generation Biosensors |
|---|---|---|---|
| Equipment Cost | High (specialized thermocyclers) [61] | Very Low (lateral flow strips) [61] | Moderate (portable readers, automated systems) [61] [15] |
| Assay Cost per Test | Moderate to High [61] | Low [61] | Potentially Low (e.g., cost-effective electrode fabrication) [15] |
| Personnel Requirements | Highly trained technicians [61] | Minimal training [61] | Minimal training for operation [61] |
| Time to Result | Hours to days (with logistics) [61] | Minutes [61] | Minutes (5 min detection shown) [61] |
| Scalability | Centralized labs, lower scalability | Highly scalable for mass distribution | Highly scalable (automated platforms) [61] |
| Return on Investment | High for complex diagnostics | High for widespread screening | High potential via multiplexing, continuous monitoring, and reduced healthcare costs [60] |
Experimental Protocols for Biosensor Development and Validation
To bridge the commercialization valley, standardized and robust experimental protocols are essential. The following section details key methodologies cited in recent literature for developing and validating biosensor performance.
Fabrication of Cost-Effective Gold Leaf Electrodes
A recent study demonstrated a rapid, cost-effective approach for fabricating electrochemical biosensor electrodes, which is critical for scalable production [15].
- Methodology: The fabrication involves laminating 24-karat gold leaves onto polyvinyl chloride (PVC) adhesive sheets. The desired electrode geometry is then created using laser ablation, a technique that allows for customizable patterns with micro-level resolution [15].
- Critical Steps:
- Surface preparation with a PTFE spray to prevent unwanted adhesion.
- Precise lamination of gold leaf onto the PVC substrate.
- Computer-controlled laser ablation to define the working electrode, counter electrode, and reference electrode patterns.
- Electrochemical characterization via cyclic voltammetry and electrochemical impedance spectroscopy in a solution containing a ferri/ferrocyanide redox couple [15].
- Application: This platform was successfully applied as a transducing element in magnetic bead-based biosensors for quantitative detection of food-borne pathogens like Salmonella typhimurium and Listeria monocytogenes [15].
Validation of a High-Throughput Automated Biosensing Platform
For deployment in settings like pandemic screening, automation and throughput are key.
- Platform Design: This platform combined a porous silicon resonant microcavity with localized surface plasmon resonance (LSPR) for sensitive, label-free detection [61].
- Assay Protocol:
- Sample Loading: Robotic arms automatically introduce the sample (e.g., for SARS-CoV-2 detection) to the sensor surface.
- Incubation: The sample incubates with the immobilized biorecognition element (e.g., engineered trimeric ACE2 protein).
- Rinsing: Robotic arms perform an automated rinsing step to remove unbound material.
- Optical Measurement: A portable spectrometer measures the spectral shift in the LSPR signal. The entire process, from sample loading to result, takes approximately 5 minutes per sample, allowing a single robotic site to process up to 384 specimens in 30 minutes [61].
Development of an Enzymatic H₂O₂ Sensing Bioplatform
Enzymatic biosensors are a mainstay of the field, and their development often requires a combination of experimental and computational validation.
- Sensor Preparation: A multi-walled carbon nanotube paste (PMWCNT) electrode is first prepared. The enzyme Cholesterol Oxidase (ChOx) is then immobilized onto the electrode surface via drop-casting [62].
- Electrochemical Characterization: The platform is characterized using cyclic voltammetry and electrochemical impedance spectroscopy. Amperometry is used for quantification by applying a constant potential and measuring the current change generated from the reduction of H₂O₂ [62].
- In Silico Validation: Molecular dynamics simulations and molecular docking assays are performed to characterize and validate the molecular interaction between ChOx and H₂O₂, confirming the spontaneity and nature of the binding interaction [62]. This integration of computational methods helps in rational biosensor design.
Visualizing the Commercialization Pathway and Biosensor Operation
The following diagrams, generated using Graphviz, illustrate the key concepts and workflows discussed in this article.
The Biosensor Commercialization Valley
Electrochemical Biosensor Signaling Pathway
The Scientist's Toolkit: Essential Research Reagent Solutions
The development and optimization of high-performance biosensors rely on a core set of materials and reagents. The following table details key components and their functions in biosensor research and development.
Table 3: Key Research Reagents and Materials for Biosensor Development
| Reagent/Material | Function | Example Application |
|---|---|---|
| Flavin-Adenine Dinucleotide-dependent Glucose Dehydrogenase (FAD-GDH) | Enzyme catalyst for substrate-specific oxidation; oxygen-insensitive, ensuring high selectivity [5]. | Glucose sensor strips for self-monitoring of blood glucose [5]. |
| Water-Soluble Quinone Mediators | Shuttles electrons between the enzyme's active site and the electrode surface; high enzyme reactivity enables a substrate diffusion-limited system [5]. | High-sensitivity glucose sensor strips with extended linear range [5]. |
| Cholesterol Oxidase (ChOx) | Flavin-based oxidoreductase enzyme used for H₂O₂ detection; offers thermal stability and specificity [62]. | Hydrogen peroxide sensing bioplatforms [62]. |
| Magnetic Beads (MBs) | Solid support for immobilizing biorecognition elements (antibodies, aptamers); enable efficient target capture, preconcentration, and separation from complex samples [15]. | Pathogen detection (e.g., S. typhimurium, L. monocytogenes) [15]. |
| Gold Nanoparticles & Nanostars | Provide intense plasmonic enhancement for optical signal generation; high surface-area-to-volume ratio for biomolecule immobilization [7] [49]. | Surface-Enhanced Raman Scattering (SERS) platforms for cancer biomarker detection [7]. |
| Multi-Walled Carbon Nanotubes (MWCNTs) | Enhance electron transfer kinetics and provide a large effective surface area for biomolecule immobilization [62]. | Carbon nanotube paste electrodes for enzymatic biosensors [62]. |
| Polydopamine/Melanin-like Coatings | Versatile, biocompatible coating that mimics mussel adhesion proteins; used for surface functionalization [7]. | Electrochemical sensor modification for environmental monitoring [7]. |
Crossing the commercialization valley requires a holistic, multidisciplinary strategy that extends beyond achieving high analytical performance in the lab. Success hinges on the simultaneous optimization of manufacturing for cost-effectiveness and scalability, as demonstrated by innovative approaches like gold leaf electrodes and laser ablation [15]. Furthermore, engaging with regulatory requirements early, designing for the intended sample matrix (such as saliva or blood) [59], and leveraging advanced tools like machine learning for signal processing and optimization [60] are critical steps. By adopting this integrated approach—which balances performance, cost, and usability—researchers and developers can effectively bridge the gap, transforming promising biosensor prototypes into reliable, accessible tools that positively impact healthcare and industry.
The translation of biosensors from innovative research to clinically approved diagnostic tools is a critical pathway for advancing personalized medicine and point-of-care testing. However, this journey is fraught with significant regulatory challenges that can delay market entry and increase development costs. For researchers and drug development professionals, understanding these regulatory landscapes is not merely a final-stage consideration but a fundamental aspect of cost-effective biosensor design and development. The stringent regulatory frameworks governing medical devices across major markets directly impact both the timeline and financial investment required to bring new biosensing technologies to market [63] [64].
The regulatory process for biosensors is inherently complex due to their dual nature as both biological recognition systems and physical transducers. These devices are classified based on risk, with higher-risk categories facing more rigorous evaluation processes. As noted in a recent analysis, "The higher the risk, the more stringent the regulatory requirements and processes" [63]. This classification system creates a challenging environment for innovators who must navigate divergent regulatory pathways across different international markets, each with its own unique requirements for clinical validation, manufacturing standards, and post-market surveillance [63].
This article provides a comprehensive comparison of regulatory frameworks across major markets and presents experimental data demonstrating how novel biosensor designs can simultaneously address performance metrics and regulatory requirements through cost-effective manufacturing and validation strategies. By examining current challenges and emerging solutions, we aim to provide researchers with a practical framework for overcoming the protracted certification and approval cycles that often impede biosensor commercialization.
Comparative Analysis of International Regulatory Frameworks
Navigating the global regulatory landscape requires a nuanced understanding of the distinct approval pathways in different markets. The United States, European Union, and India represent three significantly different regulatory approaches that biosensor developers must accommodate for international commercialization.
Table 1: Comparative Regulatory Frameworks for Biosensors Across Major Markets
| Regulatory Aspect | United States (FDA) | European Union (MDR/IVDR) | India (MDR 2017) |
|---|---|---|---|
| Governing Authority | Food and Drug Administration (FDA), Center for Devices and Radiological Health (CDRH) | Competent Authorities, Notified Bodies | Central Drugs Standard Control Organization (CDSCO) |
| Classification Basis | Risk-based (Class I, II, III) | Risk-based (Class I, IIa, IIb, III) | Risk-based (Class A, B, C, D) |
| Key Legislation | Food, Drug & Cosmetics Act | Medical Device Regulation (MDR), In Vitro Diagnostic Regulation (IVDR) | Medical Device Rules (2017) |
| Premarket Requirement | 510(k), De Novo, or Premarket Approval (PMA) | Technical documentation review, Clinical evaluation | Import/license application, performance evaluation |
| Post-market Surveillance | Mandatory reporting, Unique Device Identification (UDI) | Vigilance system, UDI, Periodic Safety Update Reports (PSUR) | Mandatory adverse event reporting |
United States FDA Framework
The U.S. Food and Drug Administration employs a risk-based classification system where biosensors typically fall under Class II or III depending on their intended use and potential risk to patients. High-risk biosensors, such as implantable glucose monitors, must meet strict premarket requirements that may include clinical trials and extensive performance data [63] [64]. The FDA's regulatory approach has evolved to address technological innovations through mechanisms like the "sandbox" environments, which allow for controlled experimentation, and adaptive pathways that permit device updates based on real-world performance data [64].
European Union MDR/IVDR Framework
The European Union's Medical Device Regulation (MDR) and In Vitro Diagnostic Regulation (IVDR) have substantially raised the requirements for clinical evidence and device traceability. These regulations emphasize technical documentation, clinical evaluation, and post-market surveillance through a Unique Device Identification (UDI) system [63] [64]. The EU's approach also introduces stricter requirements for qualified personnel and quality management systems throughout the device lifecycle.
India's Regulatory Framework
India's Medical Device Rules (2017) established under the Drugs & Cosmetics Act represent a significant step in creating a comprehensive regulatory system for medical devices, including biosensors. The framework employs a risk-based classification where biosensors with low to moderate risk fall under Class A and B, while those with moderate to high risk fall under Class C and D [63]. This system requires manufacturers to adhere to specific licensing requirements and quality control measures appropriate to their device classification.
Experimental Comparison: Biosensor Performance vs. Conventional Methods
To objectively evaluate the performance and cost-effectiveness of emerging biosensor technologies, we present experimental data comparing novel biosensor platforms against conventional laboratory methods across key analytical parameters.
Table 2: Performance Comparison of Emerging Biosensors vs. Conventional Methods
| Analytical Parameter | Novel Biosensor Platforms | Conventional Laboratory Methods | Experimental Evidence |
|---|---|---|---|
| Glucose Detection Sensitivity | 95.12 ± 2.54 µA mM−1 cm−2 (nanostructured composite electrode) | ~5-20 µA mM−1 cm−2 (standard electrochemical strips) | [7] |
| Pathogen Detection Limit | 10¹-10² CFU/mL (gold leaf electrode with magnetic beads) | 10²-10³ CFU/mL (conventional culture methods) | [15] |
| Detection Time for Food Pathogens | ~30 min - 2 hours (electrochemical biosensor) | 24-72 hours (culture-based methods) | [15] [65] |
| α-Fetoprotein Cancer Biomarker LOD | 16.73 ng/mL (SERS-based immunoassay) | ~1-5 ng/mL (conventional ELISA) | [7] |
| Manufacturing Cost per Electrode | ~$0.50-2.00 (gold leaf lamination) | ~$5.00-15.00 (screen-printed electrodes) | [15] |
Advanced Electrochemical Biosensors
Recent innovations in electrochemical biosensors demonstrate significant improvements in both performance and manufacturing efficiency. A 2025 study reported a durable, enzyme-free glucose sensor based on a nanostructured composite electrode integrated on a printed circuit board. This sensor combined highly porous gold with polyaniline and platinum nanoparticles to achieve high sensitivity (95.12 ± 2.54 µA mM−1 cm−2) and excellent stability in interstitial fluid [7]. The performance of this innovative design surpasses conventional abiotic electrodes, offering a promising solution for wearable and minimally invasive glucose monitoring that aligns with regulatory requirements for accuracy and reliability.
Cost-Effective Manufacturing Approaches
A 2025 study presented an innovative, cost-effective approach for rapid electrode fabrication that combines lamination of 24-karat gold leaves with low-cost polyvinyl chloride adhesive sheets followed by laser ablation. This method enables the creation of electrodes with customizable geometries and patterns with microlevel resolutions while significantly reducing production costs compared to traditional screen-printing or vapor deposition methods [15]. The research demonstrated application of these electrodes in magnetic bead-labeled biosensors for quantitative detection of food-borne pathogens (Salmonella typhimurium and Listeria monocytogenes), achieving detection limits comparable to more expensive conventional methods.
Detailed Experimental Protocols
Protocol 1: Finite Element Method for Biosensor Performance Optimization
Understanding the rate-limiting steps in biosensor function is crucial for optimizing performance parameters that meet regulatory standards for accuracy and reliability.
Objective: To employ finite element method (FEM) simulation to visualize diffusion profiles and identify rate-limiting steps in mediator-type enzyme electrodes, enabling optimization of biosensor design for enhanced performance and simplified regulatory validation [5].
Materials:
- COMSOL Multiphysics v. 5.6 FEM software package
- Parameter values: Mediator diffusion coefficient (2.0 × 10⁻⁵ cm² s⁻¹), glucose diffusion coefficient (6.3 × 10⁻⁶ cm² s⁻¹), enzyme diffusion coefficient (1.0 × 10⁻¹¹ cm² s⁻¹)
- Electrode specifications: 1 μm thickness, 1 mm width, 150 μm sample chamber height
Methodology:
- Model Geometry Definition: Create a 2D model geometry matching experimental glucose sensor strip dimensions with refined mesh at electrode-solution interface
- Parameter Assignment: Input experimentally determined values for diffusion coefficients, enzymatic reaction rate constants, and electrochemical parameters
- Equation Implementation: Apply Fick's law for diffusion and Butler-Volmer equation for electrode reactions
- Simulation Execution: Run time-dependent simulation to obtain concentration distribution profiles of mediator, substrate, and enzyme
- Profile Analysis: Identify reaction layers and determine whether mediator diffusion or substrate diffusion represents the rate-limiting step
Validation: The simulation results should be validated against experimental cyclic voltammetry data obtained from sensor strips containing 0.1 mM quinoline-5,8-dione and 0.008 mM FAD-GDH [5]. This combined computational and experimental approach accelerates optimization while generating comprehensive data for regulatory submissions.
Protocol 2: Gold Leaf Electrode Fabrication for Cost-Effective Biosensing
Objective: To fabricate highly conductive, cost-effective biosensor electrodes using gold leaf lamination and laser ablation technology for sensitive pathogen detection applications [15].
Materials:
- 24-karat gold leaves (Noris Blattgoldfabrik)
- PVC adhesive sheets (Fellowes Brands ImageLast A4 125 μm Laminating Pouch)
- Polytetrafluoroethylene (PTFE) dry lubricant spray (Wurth)
- Laser ablation system
- Electrochemical workstation for characterization
- Magnetic beads (Pathatrix Dual Kit for pathogen capture)
Methodology:
- Substrate Preparation: Clean PVC sheets and apply PTFE spray to create a non-stick surface
- Gold Leaf Lamination: Carefully apply 24-karat gold leaf (80 mm × 80 mm) to the prepared PVC surface
- Laser Ablation Patterning: Use laser ablation to create precise electrode geometries with microlevel resolution
- Electrochemical Characterization: Characterize electrodes using cyclic voltammetry and electrochemical impedance spectroscopy in 10 mM ferri/ferrocyanide redox couple in PBS
- Biofunctionalization: Immobilize specific aptamers or antibodies for target pathogen capture
- Magnetic Bead Integration: Incorporate magnetic beads for enhanced pathogen capture and signal amplification
- Analytical Validation: Test biosensor performance with serial dilutions of Salmonella typhimurium and Listeria monocytogenes
This protocol enables rapid production of highly conductive electrodes with large surface areas at a fraction of the cost of traditional fabrication methods, while maintaining performance characteristics that meet regulatory standards for food safety testing [15].
The Scientist's Toolkit: Essential Research Reagents and Materials
Table 3: Key Research Reagent Solutions for Biosensor Development
| Material/Reagent | Function | Example Application |
|---|---|---|
| FAD-GDH Enzyme | Flavin-adenine dinucleotide-dependent glucose dehydrogenase, oxygen-insensitive for specific glucose detection | Glucose sensor strips for diabetes management [5] |
| Water-soluble Quinone Mediators | High enzyme reactivity mediators that enable substrate diffusion as rate-limiting step | High-sensitivity glucose sensors with extended linear range [5] |
| Gold Nanoparticles | Enhance signal transduction, provide large surface area for biomolecule immobilization | Electrochemical and SERS-based biosensors [7] [56] |
| Magnetic Beads (APD50) | Target capture, preconcentration, and separation | Pathogen detection in food safety applications [15] |
| CRISPR-based Platforms | Enable specific nucleic acid detection with molecular precision | Infectious disease diagnostics, cancer biomarker detection [56] |
| Polyaniline-Platinum Nanocomposites | Provide high conductivity and catalytic activity | Enzyme-free glucose sensors with enhanced stability [7] |
Regulatory Strategy and Cost-Effectiveness Analysis
Navigating the Approval Pathway
Successfully navigating the regulatory approval process requires strategic planning from the earliest stages of biosensor development. The risk-based classification system employed by major regulatory agencies means that developers must carefully consider the intended use claims for their devices, as these claims directly determine the regulatory pathway and evidence requirements [63] [64].
Premarket Strategy: For novel biosensor technologies, engaging with regulatory agencies early through pre-submission meetings can provide valuable guidance on necessary validation studies. The FDA's Interoperable Medical Device Initiative aims to standardize data formats, facilitating integration with electronic health records and potentially streamlining the review process [64].
Clinical Evidence Generation: Regulators are increasingly accepting real-world evidence (RWE) to support device approvals, particularly for iterative improvements to existing technologies. The EU's DARWIN project exemplifies this trend, collecting data from wearables to support faster approvals, especially for applications involving rare diseases [64].
Cost-Effectiveness Analysis
When evaluating the cost-effectiveness of biosensors versus conventional methods, researchers must consider the total lifecycle costs, including development, validation, regulatory submission, manufacturing, and post-market surveillance. While biosensors typically require higher initial R&D investment, they offer significant advantages in operational costs and scalability.
The gold leaf electrode fabrication method demonstrates how innovative manufacturing approaches can reduce production costs by up to 80% compared to traditional screen-printed electrodes while maintaining analytical performance [15]. Similarly, the development of biosensor systems with substrate diffusion as the rate-limiting step enables higher sensitivity with minimal mediator usage, reducing material costs without compromising performance [5].
For continuous monitoring applications, biosensors such as the nanostructured glucose sensor offer significant long-term cost advantages through elimination of recurrent consumable expenses and reduced need for confirmatory laboratory testing [7]. These economic considerations are increasingly important to healthcare providers and payers making adoption decisions.
The evolving regulatory landscape for biosensors presents both challenges and opportunities for researchers and developers. The trend toward global regulatory harmonization through initiatives like the International Medical Device Regulators Forum (IMDRF) offers promise for reducing redundant testing requirements across different markets [63] [64]. However, significant differences remain in regional requirements, particularly for emerging technologies incorporating artificial intelligence, wireless connectivity, and nanotechnology.
Future developments in biosensor regulation will likely focus on cybersecurity requirements for connected devices, validation standards for multiplex assays detecting multiple analytes simultaneously, and environmental safety considerations for biodegradable sensors [64]. The successful navigation of these regulatory challenges requires a proactive approach that integrates regulatory strategy with fundamental biosensor design and development.
By adopting the experimental approaches and manufacturing methodologies outlined in this article, researchers can develop biosensor platforms that not only demonstrate superior analytical performance but also align with regulatory requirements for safety and effectiveness. This integrated approach to biosensor development—addressing both performance optimization and regulatory strategy—will be essential for accelerating the translation of innovative biosensing technologies from the laboratory to clinical practice, ultimately advancing precision medicine and global health outcomes.
The evolution of biosensors is increasingly focused on overcoming the limitations of conventional diagnostic methods, such as high costs, prolonged analysis times, and the need for centralized laboratory facilities. Within this context, optimization strategies centered on nanomaterials, microfluidics, and multiplexing are proving pivotal for enhancing performance and cost-effectiveness. These technological advancements collectively contribute to the development of biosensors that are not only more sensitive and rapid but also accessible for point-of-care (POC) testing and resource-limited settings. The global microfluidics market, projected to grow from USD 40.25 billion in 2025 to USD 116.17 billion by 2034 with a compound annual growth rate (CAGR) of 12.50%, underscores the significant economic and clinical potential of these integrated technologies [66]. This analysis objectively compares the performance gains afforded by these strategies against conventional methods, providing a framework for researchers and drug development professionals to evaluate their implementation.
Nanomaterials: Enhancing Sensitivity and Stability
The integration of nanomaterials into biosensors addresses core limitations of conventional electrodes and optical platforms, primarily concerning sensitivity, stability, and electroactive surface area.
Experimental Performance and Protocols
The performance enhancement from nanomaterials is demonstrated through specific experimental implementations. One study developed an enzyme-free glucose sensor based on a nanostructured composite electrode of highly porous gold, polyaniline, and platinum nanoparticles. This sensor achieved a high sensitivity of 95.12 ± 2.54 µA mM−1 cm−2 and exhibited excellent stability in interstitial fluid, surpassing the performance of conventional abiotic electrodes [7].
Another platform for multiplex biomarker detection utilized electrocatalytic nanocomposites of Ti3C2Tx/Pt-Pd to modify mass-produced screen-printed carbon electrodes (SPCEs). The protocol involved:
- Synthesis of Nanocomposites: Ti3C2Tx/Pt-Pd was prepared using chloroplatinic acid (H2PtCl6), sodium tetrachloropalladate (Na2PdCl4), Ti3C2Tx, and sodium borohydride (NaBH4) as a reducing agent, often with PVP (polyvinylpyrrolidone) as a stabilizer.
- Electrode Modification: The SPCEs were modified with a suspension of the synthesized Ti3C2Tx/Pt-Pd nanocomposite to enhance the electroanalytical performance for detecting hydrogen peroxide (H2O2), a common product of enzyme-catalyzed reactions. This modification enabled high-efficiency performance in under 15 minutes at a cost of less than $4 per test [67].
Comparative Analysis: Nanomaterial-Enhanced vs. Conventional Biosensors
Table 1: Performance Comparison of Nanomaterial-Enhanced and Conventional Biosensors
| Performance Metric | Nanomaterial-Enhanced Biosensors | Conventional Biosensors |
|---|---|---|
| Sensitivity | 95.12 ± 2.54 µA mM−1 cm−2 (Glucose) [7] | Significantly lower; often requires signal amplification |
| Stability | Excellent in biological fluids (e.g., interstitial fluid) [7] | Moderate; prone to fouling and degradation |
| Cost per Test | < $4 (Multiplex biomarker detection) [67] | Higher due to more expensive materials and lower stability |
| Analysis Time | < 15 minutes [67] | Typically longer (30+ minutes) |
Microfluidics: Automating and Miniaturizing Assays
Microfluidic technology, characterized by the manipulation of small fluid volumes (10−6–10−15 L) within microchannels, is instrumental in automating fluid handling and miniaturizing entire laboratory processes onto a single chip [68].
Key Materials and Fabrication Strategies
The choice of substrate material is critical for microfluidic device functionality and cost. The main materials used, each with distinct advantages and disadvantages, are detailed in the table below. Table 2: Comparison of Common Microfluidic Device Materials
| Material | Key Advantages | Key Disadvantages | Fabrication Methods |
|---|---|---|---|
| Paper | Low cost; capillary-driven flow (pump-free); easy reagent storage; biocompatible [66] | Limited channel precision; flow rate affected by pore size and pH [66] | Wax printing, inkjet printing, photolithography [66] [68] |
| PDMS | Biocompatible; flexible; optically transparent; cost-effective for prototyping [66] | Inherent hydrophobicity causes absorption of small molecules; complex fabrication with multiple steps [66] | Soft lithography using molds (e.g., silicon, PET) [66] [68] |
| PMMA | Good optical properties; insulating; surface gloss [68] | Requires high-temperature thermoforming; time-consuming processing [68] | Thermoforming, laser engraving [68] |
| Adhesive Tape | Very low cost; rapid fabrication; simple layer stacking without complex bonding [66] | Adhesive degradation can cause delamination; limited by laser spot size for channel width [66] | Laser engraving, precision cutting [66] |
Experimental Protocol: Portable Microfluidic Platform with Low-Cost Vacuum Pump
A recent study demonstrated a portable microfluidic platform integrated with a novel, low-cost vacuum pump for multiplex biomarker detection [67].
- Pump Fabrication: The pump was assembled from a syringe, a valve, and a spring, with a total cost of approximately $0.50. The compressed spring provides the force to create negative pressure, autonomously driving reagents when the valve switch is actuated.
- Chip Integration: The pump was coupled with a 3D-printed microfluidic chip featuring three parallel microchannels with helical structures to facilitate homogeneous reactions.
- Assay Performance: The platform successfully quantified glucose, uric acid, and lactic acid in human serum, sweat, and saliva, demonstrating consistent pump performance across a pressure range of 0.28 to 10.06 kPa [67].
This approach eliminates the need for expensive, bulky external pumps, a significant barrier to POC application in resource-limited settings.
Multiplexing: Maximizing Information from Single Samples
Multiplexing allows for the simultaneous detection of multiple analytes from a single sample, which is crucial for improving diagnostic accuracy, understanding complex disease mechanisms, and reducing the total cost and time per data point [67] [69].
Experimental Platform: SPOC for High-Throughput Protein Interaction Kinetics
The Sensor-Integrated Proteome On Chip (SPOC) platform addresses the critical need for high-throughput kinetic profiling of protein interactions, which is essential in drug discovery and diagnostic development [70].
- Protocol Workflow:
- Step 1: A customizable library of plasmid DNAs is printed onto a silicon nanowell slide containing thousands of isolated nanowells.
- Step 2: The DNA-printed slide is press-sealed against a biosensor capture slide functionalized with a HaloTag chloroalkane linker.
- Step 3: A cell-free in vitro transcription and translation (IVTT) lysate mix is injected between the slides, filling the nanowells.
- Step 4: During incubation, proteins are expressed and simultaneously capture-purified onto the biosensor slide, creating a functional protein array.
- Step 5: The array is screened using label-free real-time analysis, such as surface plasmon resonance (SPR), to generate kinetic data (association rate
ka, dissociation ratekd) for thousands of interactions simultaneously [70].
- Performance: This platform overcomes the cost and scalability limitations of traditional methods, which require separate expression, purification, and spotting of each individual recombinant protein—a process that can cost over $250 per protein and often leads to loss of functionality [70].
Comparative Advantage over Conventional Methods
Conventional fluorescence-based protein microarrays are primarily suited for qualitative or semi-quantitative endpoint analysis and do not generate the quantitative kinetic data (ka, kd) that SPOC-SPR provides [70]. The ability to measure interaction kinetics in high throughput offers deeper insights into biological mechanisms and drug efficacy that are unavailable from conventional endpoint assays.
Integrated Workflow and Essential Research Reagents
The true power of these optimization strategies is realized when they are integrated into a cohesive biosensing workflow, as illustrated in the following diagram.
The Scientist's Toolkit: Key Research Reagent Solutions
Table 3: Essential Materials and Reagents for Advanced Biosensor Development
| Research Reagent / Material | Function in Experimental Protocols |
|---|---|
| Ti3C2Tx/Pt-Pd Nanocomposite | Electrocatalytic enhancement of electrode surfaces for sensitive detection of enzyme-catalyzed reaction products like H₂O₂ [67]. |
| HaloTag Chloroalkane Linker | Covalent capture of HaloTag-fusion proteins expressed in situ on biosensor chips for label-free kinetic screening (e.g., in SPOC platform) [70]. |
| IVTT Lysate Mix | Cell-free protein expression system used in nanowells to produce functional proteins directly from printed DNA templates [70]. |
| Screen-Printed Carbon Electrodes (SPCEs) | Low-cost, mass-producible electrode substrates; can be modified with nanomaterials for specific sensing applications [67]. |
| UV-curable Resin (e.g., BV007) | Material for rapidly prototyping microfluidic chips via 3D printing, enabling custom channel architectures [67]. |
| Polydimethylsiloxane (PDMS) | Elastomeric polymer used to create flexible and biocompatible microfluidic channels via soft lithography [66] [68]. |
The strategic integration of nanomaterials, microfluidics, and multiplexing technologies presents a compelling path toward outperforming conventional diagnostic methods on both performance and cost-effectiveness. Nanomaterials directly enhance signal transduction and stability, microfluidics enables automation and miniaturization to reduce reagent consumption and facilitate POC use, and multiplexing maximizes informational output per unit cost and time. For researchers and drug development professionals, leveraging these optimization strategies is key to developing the next generation of biosensors that are not only powerful research tools but also practical solutions for global health challenges.
The Bottom Line: A Data-Driven Comparison of Performance, Cost, and ROI
The escalating costs and protracted timelines associated with therapeutic development are a significant challenge for the global healthcare sector. A critical, yet often overlooked, contributor to this burden is the reliance on conventional analytical methods for protein detection and quality control. Methods such as the Enzyme-Linked Immunosorbent Assay (ELISA) and real-time polymerase chain reaction (RT-PCR) have been the gold standards for decades, prized for their specificity and sensitivity [71]. However, their labor-intensive protocols, requirement for specialized equipment and trained technicians, and high consumable costs create a major bottleneck [72] [71]. This analysis directly quantifies the performance advantages of emerging biosensor technologies over these conventional methods, providing a rigorous cost-effectiveness framework for researchers and drug development professionals.
Performance Comparison: Biosensors vs. Conventional Methods
The following tables provide a direct, quantitative comparison of the key performance metrics between established conventional methods and next-generation biosensors.
Table 1: Overall Method Comparison for Protein Detection
| Metric | Conventional Method (ELISA) | Advanced Biosensor (e.g., ASG's Silicon Nanowire) | Advantage Ratio |
|---|---|---|---|
| Assay Time | Several hours [72] | ~15 minutes [72] | ~15x Faster [72] |
| Cost per Test | High (prohibitive for some research) [72] | Dramatically lower [72] | ~15x Lower Cost [72] |
| Multiplexing Capability | Limited, typically single-analyte | High, multi-protein detection on a single chip [72] [73] | Significant |
| Sample Volume | Relatively high [71] | Minimal [74] | Significant |
| Equipment Needs | Specialized, bulky readers [72] | Handheld, portable system [72] | Game-changing for portability |
Table 2: Performance Data for Specific Biosensor Technologies
| Biosensor Technology | Target Analyte | Detection Limit | Linear Range | Assay Time | Reference |
|---|---|---|---|---|---|
| SERS Immunoassay (Au-Ag Nanostars) | α-Fetoprotein (AFP) | 16.73 ng/mL | 0 - 500 ng/mL | Not Specified | [7] |
| Electrochemical Immunosensor (COOH-GF) | Tau-441 Protein | 0.14 fM | 1 fM – 1 nM | Not Specified | [8] |
| THz SPR Biosensor (Graphene-Otto) | General (Liquid) | N/A (Phase Sensitivity: 3.1x10⁵ deg/RIU) | N/A | Not Specified | [7] |
| Aptasensor (AuNP/MXenes) | miR-21 | 0.204 fM | 0.5 – 50,000,000 fM | Not Specified | [74] |
Experimental Protocols for Key Biosensor Technologies
Silicon Nanowire-Based Electrical Biosensor
This protocol is adapted from the methodology developed by Advanced Silicon Group (ASG), which utilizes a semiconductor-based approach to protein sensing [72] [73].
- Principle: The sensor functionalizes silicon nanowires with antibodies specific to a target protein (e.g., a host cell protein). When the target protein binds to the antibody, it introduces an electrical charge near the nanowire surface. This charge alters the recombination rate of light-generated charge carriers (electrons and holes) within the silicon, resulting in a measurable change in photocurrent that is proportional to the target concentration [72].
- Procedure:
- Sample Application: A small volume of the test solution (e.g., from a bioprocessing stream) is placed directly onto the sensor chip.
- Binding and Incubation: The sample is allowed to incubate briefly for antigen-antibody binding.
- Rinse Step: The sensor is rinsed to remove unbound molecules and matrix contaminants.
- Measurement: The sensor is inserted into a handheld reader, which measures the photocurrent. The concentration of the target protein is calculated from the signal change [72].
- Key Advantages: The method is surfactant-free and performed in an aqueous phase, eliminating the need for complex sample preparation and optical labels [72]. The silicon platform allows for high-density multiplexing by functionalizing different nanowires on the same chip with different antibodies [73].
Silicon Nanowire Sensor Workflow
SERS-Based Immunoassay Platform
This protocol details the steps for a Surface-Enhanced Raman Scattering (SERS) immunoassay using Au-Ag nanostars, which provides high sensitivity through plasmonic enhancement [7].
- Principle: Spiky Au-Ag nanostars act as a SERS substrate, generating intense electromagnetic fields at their tips. The platform is functionalized with monoclonal antibodies. Upon binding of the target antigen, the intrinsic vibrational Raman signature of the antigen itself is dramatically enhanced, allowing for its detection without the need for external Raman reporter molecules [7].
- Procedure:
- Nanostar Preparation: Au-Ag nanostars are synthesized and concentrated via centrifugation (e.g., 10, 30, 60 min) to tune their density and SERS performance [7].
- Sensor Functionalization:
- The nanostars are functionalized with mercaptopropionic acid (MPA) to form a self-assembled monolayer.
- Activation is performed using EDC (1-Ethyl-3-(3-dimethylaminopropyl) carbodiimide) and NHS (N-Hydroxy succinimide) to create amine-reactive esters.
- Monoclonal anti-α-fetoprotein antibodies (AFP-Ab) are covalently attached to the activated surface [7].
- Antigen Detection: The functionalized platform is incubated with the sample. After a washing step, the SERS spectrum is acquired. The intensity of the characteristic Raman peaks is used to quantify the antigen concentration across the calibrated range (e.g., 0–500 ng/mL for AFP) [7].
SERS Immunoassay Functionalization
Essential Research Reagent Solutions
The development and implementation of advanced biosensors rely on a specialized toolkit of reagents and materials. The following table outlines key components and their functions in typical biosensor experiments.
Table 3: Key Research Reagents and Materials for Biosensor Development
| Reagent/Material | Function in Biosensing | Example Application |
|---|---|---|
| Silicon Nanowires | High surface-area transducer; enables electrical detection and miniaturization [72] [73]. | ASG's protein sensor for drug development [72]. |
| Gold Nanoparticles (AuNPs) & Nanostars | Plasmonic enhancers for optical signals; excellent for functionalization with biomolecules [7] [74]. | SERS-based immunoassay for α-fetoprotein [7]. |
| Magnetic Beads (MBs) | Enable target pre-concentration and separation; reduce matrix effects; facilitate washing steps [15] [8]. | Electrochemical detection of S. typhimurium and L. monocytogenes [15]. |
| Covalent Organic Frameworks (COFs) | Crystalline porous materials with high surface area; serve as excellent scaffolds for immobilizing recognition elements or as signal amplifiers [8]. | Electrochemical and optical immunoassays [8]. |
| CRISPR-Cas9 Systems | Gene-editing tool used in bacterial biosensors to knockout genes for reducing non-specific responses, enhancing specificity [75]. | Engineering synthetic genetic circuits in bacterial biosensors [75]. |
| EDC/NHS Chemistry | Crosslinking chemistry for covalent immobilization of antibodies or other biomolecules onto sensor surfaces (e.g., COOH-functionalized) [7] [8]. | Antibody attachment in SERS and electrochemical immunosensors [7] [8]. |
The quantitative data presented in this guide leaves little room for doubt: advanced biosensors hold a definitive and substantial advantage over conventional methods like ELISA. The documented 15-fold improvement in speed and cost, coupled with orders-of-magnitude gains in sensitivity for specific targets, represents a paradigm shift for research and quality control in drug development [72] [74]. This transition from bulky, time-consuming lab assays to rapid, multiplexed, and portable sensing is more than an incremental improvement; it is a fundamental enabler for faster, more cost-effective therapeutic discovery and manufacturing. As biosensor technology continues to mature, its integration into bioprocessing and diagnostic workflows will be crucial for addressing global health challenges and accelerating the delivery of new treatments to patients.
In the biotech and pharmaceutical industries, the precise quantification of proteins is a critical, yet costly and time-consuming, component of drug development and manufacturing. For decades, the industry has relied on Enzyme-Linked Immunosorbent Assay (ELISA) tests to provide this essential quality control data. These tests, while precise, require hours of work by trained technicians and specialized equipment, making them prohibitively expensive. This high cost directly contributes to the soaring prices of pharmaceuticals and can even put crucial research testing out of reach for some [72].
The financial burden of drug development is immense. A 2025 RAND study analysis of 38 recently approved drugs found that the median direct research and development cost was $708 million, a figure that is significantly influenced by the expenses of lengthy development and manufacturing processes [76]. Within this framework, the labor-intensive nature of protein analysis accounts for a staggering more than 50 percent of the time and cost to develop new drugs [73]. It is against this backdrop that new biosensor technologies are emerging, promising not just incremental improvement, but a revolutionary leap in efficiency and cost-effectiveness for the industry.
Biosensors vs. ELISA: A Quantitative Performance Comparison
The core of this economic analysis lies in a direct performance comparison between conventional ELISA and advanced biosensor technology. For this comparison, we focus on the silicon nanowire biosensors developed by Advanced Silicon Group (ASG), as they represent a well-documented emerging technology with publicly available performance metrics [73] [72].
Table 1: Performance and Economic Comparison: ELISA vs. Silicon Nanowire Biosensor
| Parameter | Conventional ELISA | ASG Silicon Nanowire Biosensor | Improvement Factor |
|---|---|---|---|
| Assay Time | Hours [72] | < 15 minutes [72] | > 15x faster [72] [77] |
| Cost per Test | High (Baseline) | Dramatically lower [73] | > 15x lower cost [72] [77] |
| Measurement Type | Optical, requiring conversion [73] | Direct electrical measurement [73] | Simplified, quantitative readout |
| Multiplexing Capability | Limited | High (Multiple tests on a single chip) [73] | Enhanced data density |
| Sensitivity | High | Very High (Enhanced by nano-texturing) [73] | Superior for low-abundance targets |
The data summarized in Table 1 demonstrates that the biosensor technology outperforms the conventional method across every key metric. The most significant economic drivers are the dramatic reductions in time and cost. By slashing the assay time from hours to under 15 minutes, the biosensor accelerates critical path decision-making in drug development cycles [72]. Furthermore, the 15-fold reduction in cost per test directly addresses the largest cost center in bioprocessing, which is purification and quality control of proteins [73] [72].
Experimental Protocol: How the Nanowire Biosensor Achieves Its Performance
To understand the basis for this performance leap, it is essential to examine the underlying experimental methodology and operating principle of the silicon nanowire biosensor.
Biosensor Fabrication and Functionalization
The core of the sensor is a silicon nanowire, fabricated using established semiconductor industry processes, which allows for rapid scale-up and the production of thousands of sensors per lot [73]. This nanowire is functionalized with antibodies specific to a target protein, such as a host cell protein (HCP) that can be a toxic impurity in biologics [73] [72].
Measurement Workflow
The experimental protocol for using the biosensor is straightforward:
- Application: A small volume of the test solution (e.g., from a bioprocessing reactor) is placed on the sensor.
- Binding: Target proteins in the solution bind to the specific antibodies on the nanowire surface.
- Rinse: The sensor is rinsed to remove unbound material.
- Measurement: The sensor is inserted into a handheld testing system, and a photocurrent is applied [72].
- Detection: When a protein binds to the antibody, it introduces an electrical charge near the nanowire surface. This charge repels light carriers (electrons and holes) within the silicon, altering how easily they recombine. The system quantitatively measures this change in photocurrent, which is directly proportional to the concentration of the bound protein [72].
This methodology bypasses the multiple incubation and washing steps required by ELISA, and its direct electrical readout eliminates the need for optical measurement and signal conversion, which are key contributors to the speed and cost advantages [73].
Signaling Pathway and Experimental Workflow
The following diagram illustrates the logical workflow and the signal transduction pathway of the biosensor, from sample application to quantitative result.
The Researcher's Toolkit: Essential Reagent Solutions
The successful operation of a biosensor platform relies on a suite of specialized research reagents and materials. The table below details the key components for a typical antibody-based nanowire biosensor system.
Table 2: Key Research Reagent Solutions for Nanowire Biosensor Operation
| Reagent/Material | Function | Key Characteristic |
|---|---|---|
| Silicon Nanowire Chip | The solid-state transducer core that detects electrical changes. | Fabricated using semiconductor processes, enabling miniaturization and mass production [73]. |
| Protein-Specific Antibodies | The biological recognition element that provides specificity by binding to the target protein. | High affinity and selectivity are critical for sensor accuracy and sensitivity [73] [72]. |
| Functionalization Chemistry | Chemicals and protocols that immobilize antibodies onto the nanowire surface without damaging their function. | Ensures stable and oriented antibody attachment for optimal target binding [51]. |
| Buffer & Calibration Solutions | Aqueous matrices used to dilute samples, rinse sensors, and provide known-concentration standards for calibration. | Maintains consistent assay conditions and enables quantitative concentration measurement [72]. |
| Handheld Electronic Reader | The instrument that applies the photocurrent and measures the resulting electrical signal from the sensor. | Portable, designed for ease of use, and converts raw signal into a quantitative readout [72]. |
The economic argument for adopting advanced biosensor technology in drug development and manufacturing is compelling. The quantitative data demonstrates that silicon nanowire biosensors can reduce the time and cost of critical protein assays by more than a factor of 15 compared to the legacy ELISA standard [72] [77]. Given that protein analysis constitutes over half of bioprocessing costs, integrating this technology has the potential to shave hundreds of millions of dollars from the $708 million median cost of bringing a new drug to market [73] [76].
This dramatic cost reduction does more than just improve profit margins; it fundamentally lowers the barrier to innovation. It makes the development of drugs for rare diseases with smaller patient markets more financially viable and can accelerate the entire research pipeline, from discovery to production [72]. As the industry moves toward a future increasingly driven by data scientists and AI [78], the availability of rapid, low-cost, and multiplexed analytical tools like biosensors will be crucial. They provide the high-quality, real-time data necessary to build the predictive models and optimized processes that will define the next generation of pharmaceutical manufacturing.
The increasing demand for rapid, sensitive, and cost-effective diagnostic tools has intensified the need for rigorous comparison between conventional analytical techniques and emerging biosensor platforms. Performance metrics, particularly the limit of detection (LOD) and accuracy, serve as critical differentiators when evaluating these technologies for applications in clinical diagnostics, environmental monitoring, and food safety [21] [79]. Conventional methods like polymerase chain reaction (PCR), enzyme-linked immunosorbent assay (ELISA), and chromatography, while established as gold standards, often require specialized equipment, hours of processing, and trained staff [21]. In contrast, biosensors offer potential advantages in speed, cost, and portability, making them promising alternatives for point-of-care testing [72] [80].
This guide provides an objective, data-driven comparison of the performance metrics of conventional methods versus modern biosensor platforms. We frame this comparison within a cost-effectiveness analysis, examining not only the analytical capabilities but also the economic and operational factors that influence technology selection for researchers, scientists, and drug development professionals. By summarizing quantitative performance data and detailing experimental protocols, this guide aims to support informed decision-making in diagnostic strategy and resource allocation.
Performance Metrics Comparison: Biosensors vs. Conventional Methods
The analytical performance of a diagnostic platform is validated through its figures of merit, which include sensitivity, selectivity, limit of detection (LOD), repeatability, and reproducibility [81]. Sensitivity is defined as the slope of the analytical calibration curve, while LOD represents the smallest concentration of an analyte that can be reliably detected [81]. Selectivity is the ability of a method to distinguish the target analyte from interferents.
Table 1: Comparative Analytical Performance of Conventional Methods and Biosensors for Various Targets
| Analytical Platform | Target Analyte | Limit of Detection (LOD) | Key Performance Characteristics | References |
|---|---|---|---|---|
| Conventional: RT-PCR | SARS-CoV-2 RNA | Varies by assay | High sensitivity and specificity; requires specialized equipment, hours of processing, and trained staff. | [21] |
| Conventional: ELISA | Proteins (e.g., α-fetoprotein) | Varies by assay (e.g., 50-fold higher than gold-nanoparticle-amplified immunosensors) | High specificity; can be time-consuming and require lab infrastructure. | [21] [81] |
| Electrochemical Biosensor | DNA | 10 fM (with gold nanoparticle amplification) | Signal significantly enhanced with nanomaterial amplification. | [81] |
| Electrochemical Biosensor | Pathogens (e.g., S. typhimurium, L. monocytogenes) | Quantitative detection demonstrated | Utilizes cost-effective gold leaf electrodes (GLEs); rapid fabrication via laser ablation. | [15] |
| Optical Biosensor (SPR) | Thrombin | 0.1 aM (with dual-nanoparticle amplification) | 10-fold improvement in LOD compared to methods using single nanoparticles. | [81] |
| Microfluidic Immunosensor | α-fetoprotein | ~50-fold lower than conventional ELISA | Uses gold nanoparticles and enzymes for signal amplification. | [81] |
The data indicate that biosensors, particularly those incorporating nanomaterials for signal amplification, can achieve exceptionally low LODs, rivaling or even surpassing those of conventional methods [81]. For instance, a microfluidic immunosensor for α-fetoprotein demonstrated a 50-fold lower LOD compared to a standard ELISA [81]. Furthermore, advanced fabrication techniques, such as laser-ablated gold leaf electrodes, enable the production of highly sensitive, cost-effective electrochemical biosensors for pathogen detection [15].
Cost-Effectiveness Analysis Framework
Beyond analytical performance, a comprehensive comparison must consider economic factors. Cost-effectiveness analysis (CEA) is a fundamental tool for evaluating the societal value of health technologies, traditionally focusing on clinical outcomes and direct healthcare costs [82]. However, conventional CEA has limitations, as it can sometimes undervalue treatments for severe illnesses and may not capture the full societal value of innovative technologies [83] [82].
Generalized Risk-Adjusted Cost-Effectiveness (GRACE) and Generalized CEA (GCEA)
Novel frameworks like Generalized Risk-Adjusted Cost-Effectiveness (GRACE) and Generalized CEA (GCEA) have been developed to provide a more holistic assessment.
- GRACE: Provides a nondiscriminatory alternative to traditional CEA by accounting for how the value of health gains increases with the severity of the underlying illness [83]. An economic evaluation found that using GRACE to set value-based prices was approximately budget-neutral compared to traditional CEA, but it redistributed resources toward more severe, less prevalent illnesses [83].
- GCEA: This methodology expands traditional CEA by incorporating 15 novel value elements across four domains: uncertainty, dynamics, beneficiary, and additional factors [82]. This includes elements like the value of knowing, caregiver spillover effects, and productivity gains, which are often omitted from traditional analyses but are crucial for capturing the true societal value of diagnostic platforms [82].
Applying these frameworks to biosensors versus conventional methods would involve evaluating not just the upfront cost per test, but also the value of faster time-to-result (enabling quicker clinical decisions and potentially reducing transmission of infectious diseases), portability (enabling decentralized testing), and the broader economic impact of more accessible diagnostics [21] [82].
Table 2: Operational and Cost Comparison of Diagnostic Platforms
| Parameter | Conventional Methods (e.g., PCR, ELISA) | Advanced Biosensor Platforms |
|---|---|---|
| Assay Time | Hours to days [21] | Minutes to ~15 minutes [72] |
| Equipment Cost | High (specialized equipment) [21] [79] | Potentially low (portable, handheld systems) [72] |
| Personnel Requirement | Requires trained technicians [21] | Simplified; may not require specialized training [72] |
| Per-Test Cost | High (e.g., expensive reagents) | Promises significant reduction (e.g., 15x lower cost claimed) [72] |
| Key Value Drivers | Established gold standard, high accuracy | Speed, cost, portability, potential for point-of-care use |
Experimental Protocols for Performance Validation
To ensure the reliability and comparability of performance metrics, standardized experimental protocols are essential. Below are detailed methodologies for key experiments cited in this guide.
Fabrication and Testing of Cost-Effective Gold Leaf Electrodes (GLEs)
This protocol outlines the rapid manufacturing and electrochemical characterization of GLEs for biosensing applications, as described in [15].
Electrode Fabrication:
- Materials: Polyvinyl chloride (PVC) adhesive sheets, 24-karat gold leaves, laser ablation system.
- Procedure: Laminate a gold leaf foil onto a PVC sheet using a standard office laminator. Pattern the electrode geometry (e.g., working, counter, and reference electrodes) using a laser ablation system. This process allows for customizable designs with micro-level resolution [15].
Electrochemical Characterization:
- Materials: Phosphate buffered saline (PBS, pH 7.4), potassium ferricyanide (K₃[Fe(CN)₆]), potassium ferrocyanide (K₄[Fe(CN)₆]).
- Procedure:
- Prepare a 10 mM solution of the ferri/ferrocyanide redox couple in PBS.
- Perform Cyclic Voltammetry (CV) by scanning the potential of the GLE (e.g., from -0.1 to 0.6 V vs. a pseudo-reference) in the redox solution.
- Perform Electrochemical Impedance Spectroscopy (EIS) by applying a DC potential (e.g., the formal potential of the redox couple) with a small AC voltage amplitude over a specified frequency range.
- Data Analysis: The CV provides information on electron transfer kinetics. The EIS Nyquist plot is used to calculate charge transfer resistance (Rₑₜ), which indicates the efficiency of electron transfer at the electrode interface [15].
Biosensor Assembly and Pathogen Detection:
- Biorecognition Element: Magnetic beads (MBs) functionalized with specific antibodies or aptamers against the target pathogen (e.g., S. typhimurium).
- Assay Procedure: Incubate the GLE with the MB-bioconjugate and sample solution. Use an external magnet to concentrate the MB-bound complexes on the electrode surface. Measure the electrochemical signal (via CV or EIS) in the presence of the redox probe. The binding of the target pathogen alters the electrochemical signal, allowing for quantitative detection [15].
Signal Amplification Using Nanomaterials
This protocol details the use of gold nanoparticles to enhance the sensitivity of a DNA sensor, as reported in [81].
Sensor Preparation:
- Immobilize capture DNA probes onto an electrode surface.
- Hybridize the target DNA sequence with the capture probe.
Nanoparticle Amplification:
- Introduce gold nanoparticles (AuNPs) that are conjugated with reporter DNA sequences complementary to another region of the target DNA.
- The AuNPs bind to the target, forming a sandwich structure on the electrode surface.
Signal Transduction and Measurement:
- The AuNPs act as conduits for electron transfer and can be further used to deposit silver, leading to significant signal amplification.
- Measure the electrochemical current (e.g., differential pulse voltammetry). The magnitude of the current is proportional to the concentration of the target DNA [81].
Visualizing Workflows and Logical Frameworks
The diagrams below illustrate the core experimental and analytical concepts discussed in this guide.
Biosensor Fabrication and Pathogen Detection Workflow
Generalized CEA (GCEA) Value Assessment Framework
The Scientist's Toolkit: Essential Research Reagents and Materials
Table 3: Key Reagents and Materials for Biosensor Development and Validation
| Item | Function/Application | Examples / Key Characteristics |
|---|---|---|
| Bioreceptors | Molecular recognition element that binds the target analyte with high specificity. | Antibodies (for immunosensors), DNA/RNA aptamers (for aptasensors), enzymes [80] [79]. |
| Transducer Materials | Converts the biological binding event into a measurable signal. | Gold leaf electrodes [15], screen-printed carbon electrodes, field-effect transistors (FETs) [81]. |
| Signal Amplification Nanomaterials | Enhances the sensitivity and lowers the LOD of the biosensor. | Gold nanoparticles (AuNPs) [81], carbon nanotubes (CNTs) [81], magnetic beads (for preconcentration) [15]. |
| Electrochemical Redox Probes | Provides a measurable current in electrochemical biosensors. | Ferricyanide/ferrocyanide ([Fe(CN)₆]³⁻/⁴⁻) couple [15]. |
| Buffer Solutions | Maintains optimal pH and ionic strength for biorecognition and electrochemical activity. | Phosphate Buffered Saline (PBS) is commonly used [15]. |
Analyzing Return on Investment (ROI) for Research Labs and Pharmaceutical Companies
A critical challenge in pharmaceutical research and development (R&D) is balancing the immense cost of innovation with the resulting therapeutic and financial returns. This guide provides an objective comparison of how emerging biosensor technologies and conventional methods impact R&D efficiency and Return on Investment (ROI), framing the analysis within the context of cost-effectiveness for drug development.
Quantifying the R&D Investment Challenge
The foundation of any ROI analysis in pharma is understanding the scale of investment. Recent studies provide critical data on R&D costs, which serve as the baseline for evaluating the impact of any new technology.
Table 1: Pharmaceutical R&D Cost Benchmarks
| Cost Metric | Value | Context & Source |
|---|---|---|
| Average Direct R&D Cost per Drug | $369 million (mean) | Analysis of 38 FDA-approved drugs; average is skewed by high-cost outliers. [76] |
| Typical Direct R&D Cost per Drug | $150 million (median) | Midpoint cost from the same study; more representative of a typical drug. [76] |
| Full Cost per Asset (Incl. Capital) | $2.23 billion | Average for top 20 biopharma companies in 2024, includes cost of failures. [84] |
| Forecast Average Internal Rate of Return (IRR) | 5.9% | For top 20 biopharma companies in 2024, a key industry profitability metric. [84] |
Biosensors vs. Conventional Methods: A Performance and Cost Comparison
The core of this analysis is a direct, data-driven comparison between modern biosensors and the conventional methods they aim to augment or replace, with a focus on protein quantification—a ubiquitous task in drug development and biomanufacturing.
Table 2: Performance & Cost Comparison: Biosensors vs. Conventional Methods
| Feature | Advanced Biosensor (e.g., ASG's Silicon Nanowire) | Conventional Method (e.g., ELISA) | Traditional Mechanical Biosensor (e.g., Microcantilever) |
|---|---|---|---|
| Analysis Time | ~15 minutes [72] | ~45 minutes to several hours [72] | ~10-100 minutes [85] |
| Cost per Test | ~15x lower than ELISA [72] | High (Prohibitive for some research) [72] | Information Missing |
| Key Operational Principle | Antibody-functionalized silicon nanowires; photocurrent changes indicate protein binding. [72] | Enzyme-linked colorimetric reaction measured optically. [72] | Measures static deflection or dynamic frequency shift due to mass binding. [85] |
| Sensitivity (Limit of Detection) | High (Precise quantification of host cell proteins) [72] | High (Precise quantification) [72] | Ranges from 0.3 pM (dynamic mode) to 15 nM (static mode) [85] |
| Throughput & Multiplexing | Measures multiple proteins/molecules at once [72] | Typically single-plex or low-plex | Information Missing |
| Ease of Use | Handheld system; minimal training [72] | Requires trained technicians and specialized equipment [72] | Often requires complex optical alignment or specialized readout systems. [85] |
Experimental Protocols for Key Performance Data
The quantitative data in Table 2 is derived from established experimental procedures.
Protocol for Biosensor Performance (e.g., ASG Silicon Nanowire):
- Sensor Functionalization: The silicon nanowire sensor is coated with antibodies specific to the target protein (e.g., a host cell protein contaminant). [72]
- Sample Application: A small volume of the test solution (e.g., a drug purification sample) is placed onto the sensor. [72]
- Incubation & Binding: The solution remains on the sensor for a short period, allowing the target proteins to bind to the antibodies.
- Rinse: The sensor is rinsed to remove unbound molecules. [72]
- Measurement: The sensor is inserted into a handheld reader. The reader exposes the sensor to light, and the photocurrent generated by the silicon nanowire is measured. The binding of charged proteins alters the recombination of charge carriers (electrons and holes) in the silicon, resulting in a measurable change in photocurrent that is proportional to the protein concentration. [72]
Protocol for Conventional Method (e.g., ELISA):
- Coating: A plate is coated with a capture antibody.
- Blocking: The plate is treated with a protein solution (e.g., BSA) to block non-specific binding sites.
- Sample Incubation: The test sample is added, and any target antigen present binds to the capture antibody.
- Detection Antibody Incubation: A second, enzyme-linked antibody is added, which binds to the captured antigen.
- Substrate Addition: A substrate solution is added, which reacts with the enzyme to produce a colorimetric signal.
- Signal Measurement: The reaction is stopped, and the intensity of the color, which is proportional to the amount of antigen, is measured using a specialized plate reader. [72]
The Impact on R&D Workflow and Broader ROI
The advantages of advanced biosensors extend beyond a single test's speed and cost, influencing the entire R&D workflow and contributing to a higher overall ROI.
Diagram: Contrasting data workflows showing how biosensors can alleviate bottlenecks that hinder ROI.
The Hidden ROI: Data Automation and Scientist Efficiency
A significant, often unrealized ROI lies in automating the entire data workflow. In high-throughput labs, scientists can spend up to 10 hours per week manually processing experimental data. [86] Saving just 15 minutes per scientist per day can recover over 62,000 hours annually for an organization with 1,000 scientists. [86] Biosensors that integrate with digital systems and automated data pipelines eliminate this manual, error-prone work, leading to:
- Faster turnaround times from experiment to insight. [86]
- Higher data quality, with reduced human error and enforced reproducibility. [86]
- A foundation for AI/ML, as automated pipelines create the structured, interoperable data required for artificial intelligence and machine learning applications. [86]
- Increased scientist engagement, freeing highly skilled staff from repetitive tasks to focus on creative problem-solving and innovation. [86]
The Scientist's Toolkit: Essential Research Reagents and Materials
Table 3: Key Research Reagent Solutions for Biosensor-Based Assays
| Reagent/Material | Function in the Experiment |
|---|---|
| Silicon Nanowire Chip | The core transducer; its photoelectric properties change upon biomolecule binding, converting a biological event into an electrical signal. [72] |
| Functionalization Antibodies | Immobilized on the sensor surface to provide high specificity for capturing the target protein or analyte. [72] |
| Handheld Electronic Reader | The instrumentation that provides the light source, measures the photocurrent from the biosensor, and interprets the signal. [72] |
| Buffer Solutions | Used to dilute samples and rinse the sensor, maintaining a consistent chemical environment and removing non-specifically bound material. [72] |
| Reference Analytes | Proteins of known concentration used to calibrate the sensor and generate a standard curve for quantifying unknown samples. |
| Automated Data Analysis Platform | Software that automatically processes the raw sensor data, calculates concentrations, and generates reports, ensuring reproducibility and speed. [86] |
Conclusion
The comparative analysis unequivocally demonstrates that biosensors represent a cost-effective and technologically superior alternative to conventional methods like ELISA and PCR. By offering dramatic reductions in time and cost—exemplified by solutions that are 15 times faster and cheaper—alongside enhanced sensitivity and portability, biosensors are poised to accelerate drug discovery, democratize diagnostics, and expand analytical capabilities across industries. Future advancements will depend on overcoming regulatory and manufacturing challenges, deeper integration with AI and IoT for data analysis, and continued innovation in nanomaterials and multiplexing. The widespread adoption of biosensors will not only improve economic efficiency but also fundamentally enhance our ability to monitor health, ensure food safety, and manage diseases, marking a new era in biosensing technology.
References
- 1. Introduction to biosensors - PMC [https://pmc.ncbi.nlm.nih.gov/articles/PMC4986445/]
- 2. A Closer Look at Biosensors: A Practical Tutorial for ... [https://www.spectroscopyonline.com/view/a-closer-look-at-biosensors-a-practical-tutorial-for-spectroscopists]
- 3. Biosensor - an overview | ScienceDirect Topics [https://www.sciencedirect.com/topics/agricultural-and-biological-sciences/biosensor]
- 4. What is a Biosensor : Types & Its Applications [https://www.elprocus.com/what-is-a-biosensor-types-of-biosensors-and-applications/]
- 5. Insights into the performance-determining aspects of ... [https://pubs.rsc.org/en/content/articlehtml/2025/sd/d5sd00095e]
- 6. On the sensing performance improvement in SPR ... [https://www.nature.com/articles/s41598-025-14131-8]
- 7. Biosensors, Volume 15, Issue 9 (September 2025) [https://www.mdpi.com/2079-6374/15/9]
- 8. Biosensors, Volume 15, Issue 7 (July 2025) – 74 articles [https://www.mdpi.com/2079-6374/15/7]
- 9. Biosensors Market Size, Share & Analysis | Growth Report ... [https://www.fortunebusinessinsights.com/industry-reports/bio-sensors-market-100146]
- 10. Biosensors Market Size, Share & Trends Report 2030 [https://www.marketsandmarkets.com/Market-Reports/biosensors-market-798.html]
- 11. Biosensors Market Size & Share Report, 2025 – 2034 [https://www.gminsights.com/industry-analysis/biosensors-market]
- 12. Biosensors Market Size to Worth USD 61.29 Bn by 2034 [https://www.precedenceresearch.com/biosensors-market]
- 13. Biosensors Market Size to Reach USD 69.67 Billion By 2034 [https://www.biospace.com/press-releases/biosensors-market-size-to-reach-usd-69-67-billion-by-2034]
- 14. Biosensors Market Size Expected to Reach USD 68.72 ... [https://finance.yahoo.com/news/biosensors-market-size-expected-reach-150000678.html]
- 15. A Cost-Effective and Rapid Manufacturing Approach for ... [https://pmc.ncbi.nlm.nih.gov/articles/PMC11944730/]
- 16. Advances in Cost-Effective Chemosensors for Sustainable ... [https://www.mdpi.com/2227-9040/13/3/113]
- 17. Low-Cost Biosensor Technologies for Rapid Detection of ... [https://pmc.ncbi.nlm.nih.gov/articles/PMC11537281/]
- 18. A challenge in biosensors: Is it better to measure a photon ... [https://www.sciencedirect.com/science/article/abs/pii/S0956566320300907]
- 19. Creating a Reliable, Cost-Effective ELISA Simulation - PMC [https://pmc.ncbi.nlm.nih.gov/articles/PMC5640158/]
- 20. Why ELISAs Are Cost-Effective for Large-Scale Sample ... [https://www.arborassays.com/cost-effective-elisa-processing/?srsltid=AfmBOoooGlz8Cy8_jzkRhX2aJWYtoTdmDgwU5-gWHYMxUT31hL11S_Jk]
- 21. A comparison of conventional and advanced electroanalytical ... [https://pmc.ncbi.nlm.nih.gov/articles/PMC9270057/]
- 22. Quantitative or digital PCR? A comparative analysis for ... [https://www.sciencedirect.com/science/article/abs/pii/S0165993624001584]
- 23. Cost-Effectiveness Analysis of Rapid Test Compared to ... [https://pmc.ncbi.nlm.nih.gov/articles/PMC9448497/]
- 24. Industrial CT Scanner Cost [https://www.zeiss.com/metrology/us/explore/topics/industrial-ct-scanner-cost.html]
- 25. Cost-Effectiveness of Artificial Intelligence Support in ... [https://www.mdpi.com/2072-6694/14/7/1729]
- 26. Biosensors Market to Worth Over USD 75.84 Billion by 2033 | [https://www.globenewswire.com/news-release/2025/04/16/3062540/0/en/Biosensors-Market-to-Worth-Over-USD-75-84-Billion-by-2033-Astute-Analytica.html]
- 27. Wearable biosensors in modern healthcare: Emerging ... [https://www.sciencedirect.com/science/article/pii/S2666831925000888]
- 28. Biosensors, Volume 15, Issue 6 (June 2025) – 62 articles [https://www.mdpi.com/2079-6374/15/6]
- 29. Nanowire-Based Biosensors: From Growth to Applications [https://pmc.ncbi.nlm.nih.gov/articles/PMC6316191/]
- 30. Silicon-Based Biosensors: A Critical Review of ... [https://www.mdpi.com/2079-6374/15/2/119]
- 31. Silicon nanowires-based biosensors for the electrical ... [https://www.sciencedirect.com/science/article/abs/pii/S0956566322006650]
- 32. Electrochemical Nanobiosensors for Low-Cost Clinical ... [https://www.sciencedirect.com/science/article/pii/S1452398125002810]
- 33. Reshaping healthcare with wearable biosensors [https://www.nature.com/articles/s41598-022-26951-z]
- 34. Evolution of Wearable Devices with Real-Time Disease ... [https://pmc.ncbi.nlm.nih.gov/articles/PMC6631918/]
- 35. Advances in Wearable Biosensors for Healthcare [https://www.mdpi.com/2079-6374/14/11/560]
- 36. Recent Progress in Wearable Biosensors: From Healthcare ... [https://pmc.ncbi.nlm.nih.gov/articles/PMC7765261/]
- 37. Advancement of machine learning algorithms in biosensors [https://www.sciencedirect.com/science/article/abs/pii/S000989812500556X]
- 38. Wearable MOF biosensors: A new frontier in real-time ... [https://www.sciencedirect.com/science/article/abs/pii/S016599362500024X]
- 39. A cost-effective approach using generative AI and ... [https://www.nature.com/articles/s41598-025-01408-1]
- 40. Optical and Electrochemical Biosensors for Detection of ... [https://www.mdpi.com/2079-6374/15/7/460]
- 41. Recent advances of optical and electrochemical (bio) ... [https://www.sciencedirect.com/science/article/abs/pii/S1226086X25001698]
- 42. Biosensors Global Market Report 2025: Electrochemical [https://www.globenewswire.com/news-release/2025/04/21/3064484/28124/en/Biosensors-Global-Market-Report-2025-Electrochemical-Biosensors-Dominate-with-Over-70-Market-Share-in-2024.html]
- 43. Recent advances in electrochemical biosensors for ... [https://www.sciencedirect.com/science/article/pii/S2790676025000093]
- 44. High-performance electrochemical biosensor comprising ... [https://www.nature.com/articles/s42004-025-01703-y]
- 45. Emerging Biosensor Technologies for Stroke Biomarker ... [https://pmc.ncbi.nlm.nih.gov/articles/PMC12343203/]
- 46. Exploring Biosensors: Distinctive Features and Emerging ... [https://www.sciencedirect.com/science/article/abs/pii/S0003269725002325]
- 47. Advances in optical biosensors as alternative diagnostics ... [https://www.sciencedirect.com/science/article/pii/S2666053925000839]
- 48. Biosensors, Volume 15, Issue 8 (August 2025) – 85 articles [https://www.mdpi.com/2079-6374/15/8]
- 49. Biosensors, Volume 15, Issue 5 (May 2025) – 69 articles [https://www.mdpi.com/2079-6374/15/5]
- 50. Carbon quantum dots as emerging biosensors for food ... [https://www.sciencedirect.com/science/article/pii/S2772502225005608]
- 51. Recent trends and technical advancements in biosensors ... [https://www.sciencedirect.com/science/article/abs/pii/S2212429222001547]
- 52. Biosensors, Artificial Intelligence Biosensors, False Results ... [https://pmc.ncbi.nlm.nih.gov/articles/PMC12025796/]
- 53. Advances in MoS2-Based Biosensors: From Material ... [https://pmc.ncbi.nlm.nih.gov/articles/PMC12190200/]
- 54. Recent advances in biosensors based on the electrochemical ... [https://pubs.rsc.org/en/content/articlehtml/2025/an/d5an00235d]
- 55. Biosensors, Volume 15, Issue 11 (November 2025) [https://www.mdpi.com/2079-6374/15/11]
- 56. Advancing protein biosensors: redefining detection through ... [https://pubs.rsc.org/en/content/articlehtml/2025/ra/d4ra06791f]
- 57. Trends and new process analytical technologies in ... [https://www.sciencedirect.com/science/article/abs/pii/S037851732500794X]
- 58. 7 Manufacturing Industry Trends Driving Change in 2025 [https://www.riministreet.com/blog/7-manufacturing-industry-trends-driving-change-in-2025/]
- 59. A holistic pathway to biosensor translation - RSC Publishing [https://pubs.rsc.org/en/content/articlehtml/2024/sd/d4sd00088a]
- 60. Machine learning-based prediction and interpretation of ... [https://www.sciencedirect.com/science/article/abs/pii/S0026265X25030048]
- 61. A high-throughput fully automatic biosensing platform for ... [https://pmc.ncbi.nlm.nih.gov/articles/PMC9630290/]
- 62. Experimental and In Silico Studies on the Development of ... [https://pmc.ncbi.nlm.nih.gov/articles/PMC12109943/]
- 63. Biosensors in wearable medical devices: Regulatory ... [https://www.sciencedirect.com/science/article/abs/pii/S0003450925000380]
- 64. Navigating the Regulatory Landscape for Biosensors in ... [https://www.azosensors.com/article.aspx?ArticleID=3173]
- 65. Advances in cell-based biosensors: Transforming food ... [https://pmc.ncbi.nlm.nih.gov/articles/PMC11923814/]
- 66. Smart microfluidic devices integrated in electrochemical ... [https://link.springer.com/article/10.1007/s00216-025-06127-0]
- 67. Portable, facile microfluidic platform using a low-cost ... [https://www.sciencedirect.com/science/article/abs/pii/S0925400524017246]
- 68. a promising analytical tool for on-site detection of mycotoxins [https://www.nature.com/articles/s41538-025-00444-5]
- 69. Recent Advances in Micro- and Nano-Enhanced Intravascular ... [https://pmc.ncbi.nlm.nih.gov/articles/PMC12349352/]
- 70. Multiplexed proteomic biosensor platform for label-free real ... [https://www.nature.com/articles/s42003-025-07844-z]
- 71. Recent advancements in dual modality biosensors for ... [https://www.sciencedirect.com/science/article/abs/pii/S016599362500322X]
- 72. Startup's biosensor makes drug development and ... [https://news.mit.edu/2025/startup-biosensor-makes-drug-development-and-manufacturing-cheaper-0615]
- 73. Nanowire Biosensors Could Slash Drug Development Costs [https://www.asme.org/topics-resources/content/nanowire-biosensors-could-slash-drug-development-costs]
- 74. A concise overview of advancements in ultrasensitive ... [https://pmc.ncbi.nlm.nih.gov/articles/PMC10715268/]
- 75. Innovative applications and research advances of bacterial ... [https://pmc.ncbi.nlm.nih.gov/articles/PMC12055861/]
- 76. Typical Cost of Developing a New Drug Is Skewed by Few ... [https://www.rand.org/news/press/2025/01/07.html]
- 77. Startup's biosensor makes drug development and ... [https://lifeboat.com/blog/2025/06/startups-biosensor-makes-drug-development-and-manufacturing-cheaper]
- 78. The future of clinical trials and drug development: 2050 - PMC [https://pmc.ncbi.nlm.nih.gov/articles/PMC10259497/]
- 79. A Review on the Application of Biosensors for Monitoring ... [https://www.mdpi.com/1424-8220/25/16/4945]
- 80. Biosensors as diagnostic tools in clinical applications [https://www.sciencedirect.com/science/article/pii/S0304419X22000518]
- 81. Critical overview on the application of sensors and biosensors ... [https://pmc.ncbi.nlm.nih.gov/articles/PMC7112812/]
- 82. Generalized Cost-Effectiveness Analysis (GCEA) ... [https://globalforum.diaglobal.org/issue/april-2025/generalized-cost-effectiveness-analysis-gcea-framework-to-assess-the-value-of-innovative-therapies/]
- 83. Measuring the Budget Impact of Nondiscriminatory Cost- ... [https://pmc.ncbi.nlm.nih.gov/articles/PMC12413641/]
- 84. Measuring the return from pharmaceutical innovation 2025 [https://www.deloitte.com/ch/en/Industries/life-sciences-health-care/research/measuring-return-from-pharmaceutical-innovation.html]
- 85. Comparative advantages of mechanical biosensors - PMC [https://pmc.ncbi.nlm.nih.gov/articles/PMC3839312/]
- 86. Do The Math: The Unrealized ROI In Lab Automation [https://www.genedata.com/resources/learn/details/blog/do-the-math-the-unrealized-roi-in-lab-automation]