CGM Systems Methodology: Analytical Standards, Performance Validation, and Clinical Applications in Biomedical Research
This article provides a comprehensive examination of Continuous Glucose Monitoring (CGM) system methodology for researchers and drug development professionals.
CGM Systems Methodology: Analytical Standards, Performance Validation, and Clinical Applications in Biomedical Research
Abstract
This article provides a comprehensive examination of Continuous Glucose Monitoring (CGM) system methodology for researchers and drug development professionals. It addresses the critical lack of standardization in CGM performance assessment highlighted by recent IFCC guidelines and explores the complete methodological spectrum from foundational principles to advanced applications. The content covers analytical validation frameworks, accuracy metrics like MARD, comparative device performance, integration with artificial intelligence, and methodological considerations for clinical trials and biomarker development. Special emphasis is placed on troubleshooting common technical issues and optimizing CGM implementation for reliable data generation in research settings.
The Evolving Landscape of CGM Technology: Fundamental Principles and Standardization Initiatives
The Paradigm Shift from Intermittent to Continuous Glucose Monitoring in Clinical Research
The evaluation of glycemic control in clinical research has undergone a fundamental transformation, shifting from isolated snapshot measurements to continuous, dynamic profiling. This paradigm shift from intermittent methods like Self-Monitored Blood Glucose (SMBG) and periodic HbA1c measurements to Continuous Glucose Monitoring (CGM) represents a technological and methodological revolution in metabolic research. While HbA1c provides a valuable historical average of blood glucose over approximately three months, it reveals nothing about glycemic variability, hypoglycemic episodes, or postprandial excursions [1]. CGM technology, by capturing up to 288 glucose readings per day, provides a rich, high-resolution dataset that enables researchers to understand the complete glycemic phenotype of an intervention [2].
This transition is driven by growing recognition that glycemic variability—the oscillations between high and low glucose levels—constitutes an independent risk factor for diabetes-related complications, separate from chronic hyperglycemia measured by HbA1c [3]. The research community now acknowledges that comprehensive dysglycemia assessment must encompass three primary components: persistent hyperglycemia, hypoglycemia, and glycemic variability [3]. CGM's capacity to illuminate all three domains simultaneously makes it an indispensable tool for modern clinical trials in diabetes and metabolism.
Quantitative Evidence: Comparative Efficacy of Glucose Monitoring Modalities
CGM Versus Traditional Monitoring: Systematic Review Evidence
A comprehensive meta-analysis of 17 randomized controlled trials (n=1,860 participants) demonstrates the significant advantages of intermittently scanned CGM (isCGM) over SMBG in insulin-treated diabetes populations [3]. The evidence, summarized in Table 1, reveals statistically significant improvements in both glycemic control and patient-reported outcomes.
Table 1: Meta-Analysis Outcomes: isCGM vs. SMBG in Diabetes (17 RCTs, n=1,860)
| Outcome Measure | Population | Mean Difference (95% CI) | Certainty of Evidence (GRADE) | Clinical Significance |
|---|---|---|---|---|
| HbA1c Reduction (%) | T1DM & T2DM on insulin | -0.25% (-0.39 to -0.10) | Moderate | Statistically and clinically significant improvement |
| Patient Satisfaction (DTSQ) | T1DM & T2DM on insulin | +4.5 points (2.18 to 6.82) | Moderate | Meaningful improvement in treatment satisfaction |
| Time Below Range (<70 mg/dL) | T1DM & T2DM on insulin | -0.15% (-0.23 to -0.07) | Low | Reduction in hypoglycemia exposure |
| Time In Range (70-180 mg/dL) | T1DM & T2DM on insulin | +0.02% (-0.05 to 0.10) | Very Low | No definitive effect demonstrated |
| Device-Related Adverse Events | T1DM & T2DM on insulin | Relative Risk: 2.69 (1.5 to 4.81) | Moderate | Mostly mild cutaneous events |
The meta-regression within this analysis identified that intervention duration was a significant moderator of HbA1c reduction, suggesting that longer CGM exposure may yield greater benefits [3]. Importantly, while isCGM showed clear advantages over SMBG, a separate real-world study in a resource-limited population found that CGM-based regimens did not produce statistically superior HbA1c reductions compared to non-CGM care at 3-month follow-up, highlighting the role of contextual factors like insurance coverage, patient adoption, and provider training in determining real-world effectiveness [4].
Advanced CGM Systems: The Superiority of Real-Time Monitoring
For populations with suboptimal glycemic control despite basic CGM use, advancing to more sophisticated systems yields additional benefits. Research comparing real-time CGM (rtCGM) with isCGM demonstrates significant advantages for the former in high-risk scenarios, as detailed in Table 2.
Table 2: Switch Studies: rtCGM vs. isCGM in Suboptimally Controlled T1DM
| Glycemic Parameter | Switch from isCGM to rtCGM (6 Months) | Switch from isCGM to rtCGM (12 Months) | Clinical Target |
|---|---|---|---|
| Time in Range (TIR: 70-180 mg/dL) | +10.3 percentage points [1] | +5.0 percentage points [5] | >70% |
| Time Below Range (TBR: <70 mg/dL) | -5.5 percentage points [1] | -4.5 percentage points [5] | <4% |
| Glycemic Variability (%CV) | -6.8 percentage points [1] | -6.0 percentage points [5] | ≤36% |
The critical distinction between isCGM and rtCGM systems lies in their operational characteristics and alert capabilities. rtCGM systems provide continuous, automatic glucose transmissions to a display device and feature programmable hypoglycemia and hyperglycemia alarms [1]. This proactive alert system enables immediate corrective action, which is particularly valuable for patients with hypoglycemia unawareness or persistent glycemic excursions. The long-term study data confirms that switching from isCGM to rtCGM provides sustained benefits for at least one year, though some hyperglycemia reductions may attenuate over time, emphasizing the need for ongoing patient education and alarm management optimization [5].
Standardized CGM Metrics and Methodological Framework
Consensus Guidelines for CGM Data Interpretation
The International Consensus on Time in Range has established standardized clinical targets for CGM data interpretation, creating a unified framework for research and clinical practice [6]. These metrics provide a comprehensive picture of glycemic control that extends beyond HbA1c alone. The key metrics include:
- Time in Range (TIR): Percentage of readings between 70-180 mg/dL; primary efficacy endpoint
- Time Below Range (TBR): Percentage of readings <70 mg/dL (Level 1) and <54 mg/dL (Level 2); primary safety endpoint
- Time Above Range (TAR): Percentage of readings >180 mg/dL (Level 1) and >250 mg/dL (Level 2)
- Coefficient of Variation (%CV): Measure of glycemic variability; target ≤36%
- Glucose Management Indicator (GMI): Estimated HbA1c derived from mean CGM glucose
The correlation between TIR and HbA1c has been quantified, demonstrating that for every 10% increase in TIR, HbA1c decreases by approximately 0.4-0.5% [6]. This relationship provides researchers with complementary metrics for assessing intervention efficacy.
Data Sufficiency and Quality Standards
For robust CGM analysis in research settings, specific data collection standards must be maintained:
- Minimum wear time: 14 days of data are recommended [6]
- Data completeness: ≥70% of data from the recommended wear period [6]
- Sensor accuracy: Mean Absolute Relative Difference (MARD) <10% for outpatient use [2]
Recent advancements in CGM accuracy have been significant, with modern systems achieving MARD values of 7.9-9.5% in outpatient settings, though accuracy may decrease in critically ill populations (MARD 22.7-27.0%) [2]. The IFCC Working Group on CGM has developed comprehensive guidelines to standardize performance assessments, addressing previous challenges in comparing different CGM systems due to lack of standardization [7].
Experimental Protocols for CGM Implementation in Clinical Research
Protocol 1: Comparative Effectiveness Trial (CGM vs. Standard Care)
Objective: To evaluate the efficacy of CGM-based diabetes management versus standard care (SMBG) in improving glycemic control.
Population: Adults with T1DM or T2DM requiring intensive insulin therapy (multiple daily injections or insulin pump).
Study Design: Randomized, parallel-group, controlled trial with 6-month intervention period.
Methodology:
- Baseline period (2 weeks): All participants continue standard SMBG; baseline HbA1c measured
- Randomization: 1:1 to CGM group or SMBG group
- Intervention group:
- Use CGM system continuously
- Receive training on data interpretation and response to alerts
- Clinical decisions based on CGM metrics and patterns
- Control group:
- Continue SMBG at least 4 times daily
- Use glucose meters with memory function
- Clinical decisions based on glucose meter readings
- Outcome assessments at 3 and 6 months:
- Primary outcome: Change in HbA1c from baseline
- Secondary outcomes: TIR, TBR, TAR, %CV, patient satisfaction (DTSQ), hypoglycemia events
Statistical Considerations: Intention-to-treat analysis; sample size calculated to detect 0.3% difference in HbA1c with 80% power [3] [4].
Protocol 2: CGM in Critically Ill Patients (ICU Setting)
Objective: To assess the impact of CGM on glycemic control and clinical outcomes in critically ill patients with hyperglycemia.
Population: ICU patients with blood glucose >180 mg/dL; exclusion: contraindications for CGM use.
Study Design: Randomized, controlled, single-blind clinical trial.
Methodology:
- Sensor placement: Dexcom G7 CGM placed on upper arm or abdomen
- Randomization: 1:1 to experimental (CGM-guided management) or control (POC-G testing) group
- Experimental group:
- Glycemic management based on real-time CGM values
- POC-G testing only for calibration confirmation if values questionable
- Control group:
- Standard POC-G testing 3-6 times daily
- CGM blinded (values not visible to clinicians)
- Primary outcome: TIR (70-180 mg/dL) during ICU stay
- Secondary outcomes: TAR, TBR, frequency of POC-G measurements, incidence of hypoglycemia (<70 mg/dL), nursing workload, 90-day mortality [8]
Sample Size: 376 participants required to detect 15% difference in TIR (35% control vs. 50% experimental) [8].
The workflow for this protocol is standardized as follows:
Protocol 3: Technology Escalation in Suboptimally Controlled Patients
Objective: To evaluate the benefits of switching from isCGM to rtCGM in patients with suboptimal glycemic control.
Population: T1DM adults with HbA1c ≥8% and/or history of severe hypoglycemia despite isCGM use.
Study Design: Prospective, single-arm, switch study with 12-month follow-up.
Methodology:
- Run-in period (3 months): Collect baseline AGP data using current isCGM
- Switch intervention: Transition from isCGM to rtCGM with structured education
- Education component:
- Alarm threshold individualization
- Instruction on alarm response protocols
- Data interpretation training
- Data collection points: Baseline (M0), 3 months (M3), 6 months (M6), 12 months (M12)
- Outcomes:
Statistical Analysis: Paired t-tests or Wilcoxon signed-rank tests for within-group changes; linear mixed models for longitudinal analysis.
The Scientist's Toolkit: Essential Research Reagent Solutions
Table 3: Key Reagents and Materials for CGM Clinical Research
| Research Tool | Specification & Selection Criteria | Primary Research Application | Technical Considerations |
|---|---|---|---|
| rtCGM Systems (Dexcom G-series) | Real-time data transmission, customizable alerts, MARD <9% | Hypoglycemia prevention studies, intervention trials in high-risk populations | Requires smartphone compatibility; some models need calibration |
| isCGM Systems (FreeStyle Libre) | Scan-based data retrieval, 14-day wear, factory calibrated | Large-scale pragmatic trials, health economic studies, real-world evidence | No alert functionality; may underestimate hypoglycemia |
| Professional CGM | Blinded or unblinded options, clinic-based application | Short-term intervention studies, diagnostic assessment, mechanistic trials | Eliminates patient self-reporting bias; standardized wear period |
| AGP Report Software | Standardized output per International Consensus guidelines | Primary data analysis and visualization, pattern recognition | Cross-platform compatibility; data export capabilities for statistical analysis |
| CGM Data Platforms (LibreView, Dexcom CLARITY) | Cloud-based data aggregation, standardized metrics calculation | Multi-center trials, remote monitoring studies, decentralized trials | HIPAA compliance; API integration with electronic data capture systems |
| Reference Glucose Meters | FDA-cleared, CONNECTIVITY-enabled for automated data upload | CGM calibration (if required), adjunctive safety monitoring | Precision requirements per ISO 15197:2013 standards |
Analytical Framework and Data Interpretation Protocol
A standardized approach to CGM data analysis ensures consistent interpretation across research settings. The DATAA Model (Define, Assess, Trend, Action, Assess) provides a structured framework [6]:
Step 1: Data Sufficiency Verification
- Confirm ≥14 days of data with ≥70% completeness [6]
- Identify and document periods of non-wear or signal loss
Step 2: Pattern Analysis in Priority Sequence
- Hypoglycemia assessment: Identify TBR <70 mg/dL and <54 mg/dL; note timing and frequency
- Hyperglycemia assessment: Evaluate TAR >180 mg/dL and >250 mg/dL; correlate with meals, activities
- Glycemic variability: Calculate %CV; target ≤36% for stability [6]
Step 3: Ambulatory Glucose Profile Interpretation
- Analyze 24-hour glucose patterns using modal day display
- Identify recurring patterns (nocturnal hypoglycemia, postprandial spikes)
- Correlate with patient-reported events (meals, exercise, medication)
Step 4: Intervention Planning
- Prioritize addressing hypoglycemia first, then hyperglycemia
- Develop targeted interventions based on pattern timing
- Establish personalized alarm thresholds (for rtCGM studies)
Step 5: Statistical Analysis Plan
- Primary endpoints: TIR, TBR, HbA1c change
- Secondary endpoints: TAR, %CV, GMI, patient-reported outcomes
- Adjust for covariates: age, diabetes duration, baseline HbA1c, CGM wear time
The relationship between core CGM metrics follows a systematic interpretation framework:
The paradigm shift from intermittent to continuous glucose monitoring represents more than technological advancement—it constitutes a fundamental reorientation of glycemic assessment methodology in clinical research. The evidence demonstrates that CGM provides superior insights into glycemic control compared to isolated glucose measurements, with particular value in detecting hypoglycemia and glycemic variability that would otherwise remain occult.
Future research directions should focus on standardizing CGM performance assessments across different populations [7], establishing consensus endpoints for specific study designs, and developing robust analytical methods for the rich longitudinal data that CGM generates. As CGM technology continues to evolve toward over-the-counter availability [2] and enhanced accuracy, research methodologies must similarly advance to fully leverage these sophisticated tools for evaluating diabetes interventions and ultimately improving patient outcomes.
The integration of CGM into clinical research protocols demands meticulous attention to data quality standards, appropriate outcome selection, and standardized interpretation frameworks. When implemented according to these evidence-based protocols, CGM transforms from mere monitoring technology to a powerful research methodology capable of revealing comprehensive glycemic effects of therapeutic interventions.
Continuous Glucose Monitoring (CGM) systems represent a technological paradigm shift in diabetes management, enabling real-time tracking of glycemic trends through minimally invasive approaches. These systems form a critical component of modern diabetes care strategies and emerging artificial pancreas systems [9]. For researchers and development professionals, understanding the core architecture—comprising the sensor, transmitter, and data processing elements—is fundamental to advancing the technology, improving accuracy, and developing next-generation devices. This document details the technical specifications, operational methodologies, and experimental protocols central to CGM system research and development, framing this within the context of ongoing methodological research in the field.
Core CGM Technology Components
A CGM system is an integrated platform that continuously measures glucose levels, typically in the interstitial fluid, and relays this information to a display device for clinical or personal use [10]. The system's primary components work in concert to achieve this function.
Sensor Technology and Glucose Detection Methodologies
The sensor is the core analytical component, responsible for the primary glucose measurement. Its placement and operational principle define the system's invasiveness and underlying technology [9].
Table 1: Classification of CGM Systems by Invasiveness and Sensing Principle
| Category | Sensor Placement | Transduction Mechanisms | Key Characteristics |
|---|---|---|---|
| Totally Implantable (Invasive) | Fully implanted in the body [9] | Electrochemical, Optical [9] | Long-term monitoring; requires surgical procedures [9]. |
| Minimally Invasive | Subcutaneous insertion of needle-type sensor [9] [11] | Primarily electrochemical (enzymatic) [9] [11] | Measures glucose in interstitial fluid; most common commercial type (e.g., Dexcom G6, FreeStyle Libre) [12] [13]. |
| Non-Invasive | On the skin surface [9] | Optical (NIR Spectroscopy, Raman Spectroscopy) [14] | No skin penetration; high research focus for improved user comfort [14]. |
Glucose detection is predominantly achieved via electrochemical or optical methods. Electrochemical approaches are most prevalent in current commercial systems and are categorized by "generation" [9]:
- First-Generation Biosensors: Rely on the native oxygen co-substrate. Glucose oxidase (GOx) catalyzes glucose oxidation, producing hydrogen peroxide (H2O2), which is electrochemically detected at the working electrode [9].
- Second-Generation Biosensors: Utilize synthetic redox mediators to shuttle electrons from the reduced enzyme to the electrode, reducing oxygen dependence [9].
- Third-Generation Biosensors: Facilitate direct electron transfer between the enzyme's redox center and the electrode, eliminating the need for mediators [9].
- Non-Enzymatic Sensors: Employ nanostructured electrodes (e.g., Pt, Au) for the direct electrocatalytic oxidation of glucose [9].
Optical methods include affinity sensors using competitive binding (e.g., Concanavalin A with fluorescently labeled dextran) and direct spectroscopy techniques [9].
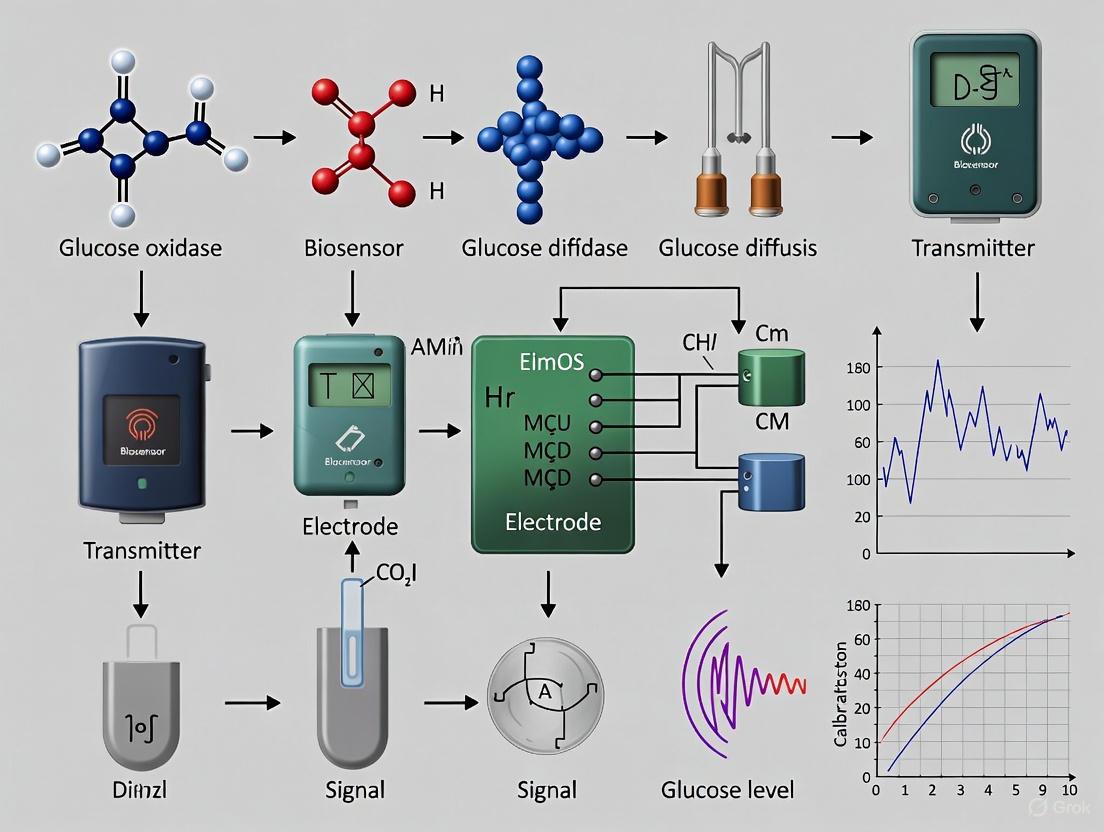
Figure 1: Electrochemical Glucose Sensing Pathways. This diagram illustrates the electron transfer pathways for 1st, 2nd, and 3rd generation enzymatic biosensors.
Transmitter and Data Communication Systems
The transmitter is a hardware component that wirelessly sends data from the sensor to a receiver or display device [10]. Research and development focus on optimizing this component for reliability, security, and power efficiency.
Key Communication Protocols and Security Measures:
- Radio Frequency (RF) Communication: Optimized protocols use proximity-triggered commands to segment data transmission, sending critical data (e.g., real-time glucose) immediately while delaying less urgent information to conserve power [15].
- Secure Pairing and Authentication: Methods include using identifier hash matching during pairing and periodic reauthentication with application key changes to prevent unauthorized access and eavesdropping [15]. Image recognition codes embedding device identifiers and PINs offer an intuitive near-field communication (NFC) connection method [15].
- Data Integrity Assurance: Sequential packet transmission with identifiers allows receiving terminals to identify and request missing data packets, ensuring reliable reception despite disconnections [15].
- Event-Based Adaptive Transmission: The CGM can transmit connection requests with event information (e.g., low glucose). The receiver then reconnects to receive data immediately, balancing power efficiency with responsiveness to critical events [15].
- Encrypted Data Management: Glucose data is encrypted for transmission and can be stored separately from access control data in cloud systems, enabling secure data backfilling for offline devices and explaining missed alarms [15].
Data Processing and Algorithmic Methodologies
Raw sensor signals are processed by algorithms to convert them into calibrated glucose values and generate actionable data trends and alerts [10]. A significant challenge in real-world data is ensuring quality before analysis.
Data Processing Algorithm for Duplication Errors: A 2025 study highlighted that CGM data warehouses often contain duplicated or time-shifted data from the same patient, compromising metric accuracy [16]. An algorithm was developed to automatically detect and resolve these errors.
Objective: To clean CGM data by removing duplicated measurements, ensuring accurate computation of glycemic metrics like Time in Range (TIR) and Coefficient of Variation (CV) [16]. Method: The algorithm processes data sequentially. Upon encountering a duplicated set of measurements (data points recorded at intervals shorter than the expected 5-minute frequency), it follows a stepwise logic to select a single value [16]:
- Exact Duplicates: Removes extra copies with identical timestamps and glucose values.
- Non-Exact Duplicates: References the preceding verified observation (
g1). It first attempts to match by a unique Device ID or Observation ID. If this fails, it matches by the expected time frequency. In the most ambiguous cases, it selects the glucose value closest tog1[16]. The selected value becomes the new reference for resolving subsequent duplicates [16].
Impact: Application of this algorithm on data from 2,038 individuals showed that 25.9% had duplication errors. Processing led to a higher magnitude of difference (crossing predefined clinical thresholds) in at least one CGM metric for 25.7% of the affected patients, with 11 individuals crossing clinically meaningful thresholds post-processing [16]. This underscores the necessity of systematic data cleaning for reliable research and clinical interpretation.
Figure 2: CGM Data Processing Workflow. Logic flow for an algorithm designed to identify and resolve duplicated CGM data points in large-scale datasets [16].
Experimental Protocols for CGM Evaluation
For researchers validating CGM performance, standardized experimental protocols are essential. The following outlines a methodology for assessing CGM accuracy and reliability in both clinical and real-world settings.
Protocol for Assessing CGM Accuracy and Reliability
This protocol is adapted from a published study comparing the performance of multiple CGM systems [11].
1. Objective: To assess the accuracy and reliability of CGM systems under highly standardized clinical research center (CRC) conditions and during real-life usage at home, including evaluation beyond the manufacturer-specified lifetime (MSL) [11].
2. Experimental Design:
- Type: Multinational, randomized, open-label trial.
- Participants: Patients with type 1 diabetes (e.g., n=20). Key inclusion: diagnosis >6 months, HbA1c <10%. Key exclusion: pregnancy, use of medications that impair glucose measurement (e.g., acetaminophen) [11].
- CGM Systems: Multiple contemporary CGM systems are compared simultaneously (e.g., Dexcom G4, Abbott Navigator I, Medtronic Enlite) [11].
- Calibration: All systems are calibrated according to manufacturers' specifications using the same blood glucose meter and test strip lot to minimize bias [11].
3. Procedures:
- CRC Phase (Standardized Assessment):
- Sensors are placed in the abdominal region.
- Patients undergo a standardized meal challenge designed to induce glycemic excursions. This involves a delayed and increased insulin dose to create a postprandial glucose peak followed by a nadir [11].
- Reference blood glucose is frequently measured using a laboratory analyzer (e.g., YSI 2300 STAT PLUS) every 5-15 minutes to capture rapid changes [11].
- Home Phase (Real-Life Assessment):
- Patients wear the CGM systems during daily life.
- They perform self-measurement of blood glucose (SMBG) at least five times per day (pre-/postprandial, pre-bed) in addition to any required calibration checks [11].
- Patients are instructed on how to reactivate sensors after MSL ends to assess longevity and accuracy beyond the recommended wear time. "End of functioning" is defined by a pre-specified accuracy threshold (e.g., MARD >25% on two consecutive days) [11].
4. Data Analysis:
- Primary Outcome: Mean Absolute Relative Difference (MARD) between CGM readings and reference values, calculated for all data pairs ≥15 minutes apart to ensure data point independence [11].
- Secondary Outcomes:
- MARD stratified by glycemic range (hypo-, eu-, hyperglycemic).
- MARD per day of use.
- Sensor longevity (median time until end of functioning).
- Clarke Error Grid Analysis (CEGA) can be incorporated to assess clinical accuracy [11].
- Statistical Analysis: Analysis of variance (ANOVA) to assess differences in accuracy between CGM systems. Kaplan-Meier analysis for sensor survival [11].
Table 2: Example Accuracy Metrics from a Comparative CGM Study [11]
| CGM System | Overall MARD in CRC (SD) | Overall MARD at Home (SD) | Median Time Until End of Functioning (Days) |
|---|---|---|---|
| System A (Navigator I) | 16.5% (14.3%) | 14.5% (16.7%) | 8.0 (IQR: 3.5) |
| System B (Dexcom G4) | 20.5% (18.2%) | 16.5% (18.8%) | 10.0 (IQR: 1.0) |
| System C (Medtronic Enlite) | 16.4% (15.6%) | 18.9% (23.6%) | 8.0 (IQR: 1.5) |
MARD: Mean Absolute Relative Difference; CRC: Clinical Research Center; IQR: Interquartile Range.
The Scientist's Toolkit: Research Reagent Solutions
Table 3: Essential Materials and Reagents for CGM Methodology Research
| Item | Function / Application in Research |
|---|---|
| Glucose Oxidase (GOx) | Core enzyme for most electrochemical biosensors; catalyzes the oxidation of β-D-glucose [9]. |
| Redox Mediators | e.g., Ferrocene derivatives, Osmium complexes; shuttle electrons in 2nd generation biosensors, reducing oxygen dependence [9]. |
| Nanostructured Electrodes | e.g., Platinum nanoforests, Gold nanoparticles; provide high surface area and electrocatalytic activity for non-enzymatic glucose sensing or enhanced H₂O₂ detection [9]. |
| Affinity Assay Components | Concanavalin A (receptor) and fluorescein-labeled dextran (competitor); for developing optical affinity-based glucose sensors [9]. |
| YSI 2300 STAT Plus Analyzer | Laboratory-grade instrument for measuring plasma glucose; serves as the primary reference method in clinical accuracy studies [11]. |
| Phosphate Buffered Saline (PBS) | Standard buffer for maintaining pH and ionic strength in in vitro sensor testing and calibration solutions. |
| Stabilizing Polymers | e.g., Polyurethanes, Hydrogels; used to entrap enzymes and mediators on the electrode surface, enhancing sensor stability and biocompatibility. |
The methodology underlying CGM systems is multifaceted, integrating principles from electrochemistry, wireless communication, and data science. For researchers, a deep understanding of the core components—from the molecular mechanisms of glucose sensing to the algorithms that clean and interpret complex real-world data—is crucial for driving innovation. The experimental protocols and technical overview provided here serve as a foundation for rigorous evaluation and development of CGM technologies, ultimately contributing to more accurate, reliable, and user-friendly tools for diabetes management and metabolic research. Future directions include the refinement of non-invasive sensing modalities, further miniaturization and power optimization, and the development of more sophisticated algorithms for predictive alerts and closed-loop system integration [14] [17].
Continuous Glucose Monitoring (CGM) systems have revolutionized diabetes management, providing dynamic glucose data that enables more informed therapeutic decisions for both type 1 and type 2 diabetes [18]. Despite their proven effectiveness in improving glycemic control—evidenced by glycosylated hemoglobin reductions of 0.25%–3.0% and time in range improvements of 15%–34%—the assessment of CGM analytical performance has been hindered by a critical lack of standardization [19] [18]. This standardization deficit poses significant challenges for the field, as the choice of study procedures and evaluation methods can substantially influence observed performance, complicating comparisons between CGM systems and confounding the interpretation of CGM metrics as research outcomes [19] [7]. The International Federation of Clinical Chemistry and Laboratory Medicine (IFCC) Working Group on CGM has therefore developed comprehensive guidelines to address these gaps, defining requirements for study design, comparator measurements, minimum accuracy standards, and performance characterization [19] [7].
Key Standardization Gaps Identified in Current CGM Methodology
Analytical and Metrological Challenges
The 2025 IFCC guideline highlights fundamental metrological challenges that undermine reliable CGM performance evaluation. A primary concern identified is the lack of traceability and standardization in comparator measurement processes [20]. Different comparator methods (capillary versus venous glucose measurements) have demonstrated biases of up to 8%, and comparator devices of the same brand can systematically differ by more than 5% [20]. This variability introduces substantial uncertainty into CGM accuracy assessments, as the reference itself lacks standardization. Additionally, current CGM performance evaluations employ diverse study designs, procedures, and data analysis methods, creating inconsistency in reported performance metrics [19]. This methodological heterogeneity impedes direct comparison between different CGM systems and confounds the interpretation of CGM data as endpoints in clinical research [19] [7].
Clinical and Physiological Variability Factors
Beyond analytical challenges, the IFCC guideline addresses clinical and physiological factors affecting CGM reproducibility and interpretation. The reproducibility of CGM results varies significantly across different patient populations, with inter-day reproducibility being greater for subjects with diabetes (ICC 0.46) than for normoglycemic subjects (ICC 0.30), suggesting the need for population-specific monitoring protocols [21]. This variability is further complicated by differences in individual physiological responses to food, which depend on factors such as gut microbiome composition, making universal modeling of CGM data exceptionally challenging [22]. The guidelines also note that current CGM evaluations often fail to adequately account for real-world use conditions, including skin-related complications, sensor insertion techniques, and individual physiological differences that affect sensor performance [18].
Quantitative Landscape of Current CGM Systems
Table 1: Performance Characteristics of Commercially Available CGM Systems
| CGM Sensor (Manufacturer) | Sensor Duration (days) | Glucose Range (mg/dL) | Warm-up Time (min) | MARD (%) | Calibration Required |
|---|---|---|---|---|---|
| FreeStyle Libre 2 (Abbott) | 14 | 40-500 | 60 | 9.2-9.7 | No |
| FreeStyle Libre 3 (Abbott) | 14 | 40-500 | 60 | 7.9-9.4 | No |
| Dexcom G7 (Dexcom) | 10 (with 12-hr grace period) | 40-400 | 30 | 8.2-9.1 | No (optional) |
| Medtronic Guardian 4 | 7 | 40-400 | 120 | 10.1-11.2 | No |
| Caresens Air (i-SENS)/Barozen Fit (Handok) | 15 | 40-500 | 120 | 9.4-10.42 | Yes (every 24 hr) |
Table 2: Clinical Efficacy Evidence for CGM Across Patient Populations
| Study Population | Treatment | Study Design | Key CGM Benefits |
|---|---|---|---|
| Adults with T1D [18] | MDI | RCT, 24 weeks | HbA1c reduction: 0.6% (7.7% vs. 8.2%) |
| Adolescents/young adults with T1D [18] | MDI, CSII | RCT, 26 weeks | HbA1c reduction: 0.37% (8.5% vs. 8.9%) |
| Elderly (>60 yr) with T1D [18] | MDI, CSII | RCT, 6 months | TBR <70 mg/dL reduction: 1.9% (2.7% vs. 4.9%) |
| Adults with T2D [18] | MDI | RCT, 6 months | HbA1c reduction: 0.3% (7.7% vs. 8.0%) |
| Adults with T2D [18] | Basal insulin | RCT, 8 months | HbA1c reduction: 0.4% (8.0% vs. 8.4%) |
| Adults with T2D [18] | OHA | RCT, 3 months | HbA1c reduction: 0.68% |
Experimental Protocols for Standardized CGM Performance Evaluation
Protocol 1: Comparator Measurement Collection for CGM Validation
Principle: Standardized collection of comparator measurement data is essential for reliable CGM performance evaluation. This protocol outlines procedures for obtaining reference measurements that minimize variability and bias [20].
Materials:
- Approved blood glucose monitoring system meeting ISO 15197:2013 standards
- Capillary blood collection supplies (lancets, test strips)
- Venous blood collection equipment (if applicable)
- Temperature-controlled centrifuge
- Certified reference material for retrospective bias correction
Procedure:
- Subject Preparation: Subjects should be in a stable metabolic state, with conditions documented (fasting, postprandial, exercise).
- Sample Collection:
- Collect capillary samples from fingertips following manufacturer instructions.
- For venous comparison, collect venous samples simultaneously with CGM readings.
- Document exact time of sample collection synchronized with CGM timestamp.
- Sample Processing:
- Process venous samples within 30 minutes of collection.
- Centrifuge at recommended speed and temperature.
- Analyze plasma/serum within stability window.
- Measurement:
- Perform duplicate measurements with comparator device.
- Include quality control samples with known concentrations.
- Record environmental conditions (temperature, humidity).
- Bias Correction:
- Analyze comparator device performance against higher-order reference materials.
- Apply retrospective correction to comparator values based on established bias.
Validation Parameters:
- Within-run and between-run imprecision (<5%)
- Bias verification against reference method
- Measurement uncertainty calculation
Protocol 2: Clinical Study Design for CGM Performance Assessment
Principle: This protocol standardizes clinical study design elements to ensure consistent CGM performance evaluation across different systems and populations [19].
Materials:
- CGM systems with identical manufacturing lot numbers
- Data collection forms (electronic or paper)
- Standardized meal challenges (liquid and mixed meals)
- Activity monitoring equipment
- Data management system with audit trail
Procedure:
- Subject Selection:
- Recruit representative population (age, diabetes type, BMI, ethnicity)
- Exclude subjects with conditions affecting sensor adhesion or glucose kinetics
- Obtain informed consent following ethical guidelines
- Sensor Deployment:
- Use trained healthcare professionals for sensor insertion
- Document insertion site characteristics (skin condition, adipose tissue)
- Record exact insertion time and sensor lot information
- Data Collection Period:
- Minimum 7-day wear period for adequate glucose excursion capture
- Include various daily conditions (exercise, sleep, meals)
- Document any adverse events or sensor issues
- Reference Measurements:
- Schedule comparator measurements at fasting, pre-prandial, and post-prandial states
- Include nocturnal measurements for hypoglycemia assessment
- Collect during stable and dynamic glucose periods
- Data Analysis:
- Align CGM and reference data using synchronized timestamps
- Calculate MARD, precision, and clinical consensus error grid analysis
- Perform statistical analysis with pre-specified endpoints
CGM Evaluation Workflow: Standardized process for CGM performance assessment from study design through reporting
The Scientist's Toolkit: Essential Research Reagents and Materials
Table 3: Essential Research Materials for CGM Standardization Studies
| Category | Specific Item | Research Function | Performance Specifications |
|---|---|---|---|
| Reference Systems | YSI 2300 STAT Plus Analyzer | Higher-order reference method for glucose quantification | CV <2%, traceable to NIST SRM |
| Certified Glucose Reference Materials | Calibration verification and bias assessment | NIST-traceable with stated uncertainty | |
| Clinical Supplies | Capillary Blood Collection System | Standardized self-monitored blood glucose samples | Meets ISO 15197:2013 requirements |
| Venous Blood Collection Tubes | Plasma/serum reference samples | Fluoride/oxalate for glucose stability | |
| Data Management | Data Synchronization Software | Temporal alignment of CGM and reference data | Precision ≤1 minute |
| CGM Data Extraction Tools | Raw data retrieval from manufacturer systems | Maintains data integrity and resolution | |
| Quality Control | Temperature Monitoring System | Environmental condition documentation | Continuous logging with 0.5°C accuracy |
| Protocol Deviation Tracking | Study procedure compliance monitoring | Automated alerts for critical deviations |
Advanced Methodologies: Modeling and Data Analysis Approaches
Minimal Model for CGM Data Analysis
Principle: Mathematical modeling of CGM data enables deeper understanding of glucose dynamics and personalized parameter estimation. The minimal model approach combines glucose-insulin dynamics with food absorption to interpret complex CGM time series [22].
Model Equations: The model adapts glucose-insulin dynamics with two-compartment food absorption:
Food digestion dynamics: [ \frac{dq{sto}}{dt} = -k{sto}q{sto} ] [ \frac{dq{gut}}{dt} = k{sto}q{sto} - k{gut}q{gut} ]
Where:
- ( q_{sto} ) = food quantity in stomach
- ( q_{gut} ) = food quantity in gut
- ( k_{sto} ) = stomach emptying rate constant
- ( k_{gut} ) = gut absorption rate constant
Parameter Estimation Protocol:
- Data Preprocessing:
- Smooth CGM data using functional data analysis techniques
- Identify meal events and corresponding glucose excursions
- Align temporal patterns across multiple days
- Initial Parameter Estimation:
- Estimate ( k{sto} ) and ( k{gut} ) from liquid meal responses
- Derive insulin sensitivity from fasting and postprandial measurements
- Calculate glucose effectiveness from glucose decay rates
- Model Personalization:
- Apply iterative optimization to minimize residuals
- Validate with hold-out data periods
- Calculate confidence intervals for parameter estimates
CGM Modeling Pipeline: Functional data analysis workflow from raw CGM data to validated physiological parameters
Functional Data Analysis for CGM Reproducibility Assessment
Principle: Functional Data Analysis (FDA) treats CGM time series as dynamic curves evolving over time, providing enhanced statistical power for assessing reproducibility and identifying patterns [21].
Protocol:
- Data Transformation:
- Convert discrete CGM values to continuous functional form
- Apply smoothing to reduce measurement noise
- Register curves to account for temporal misalignment
- Reproducibility Calculation:
- Compute functional intraclass correlation coefficients (ICCs)
- Estimate 95% confidence intervals using bootstrap methods
- Stratify by glycemic status (normoglycemic, prediabetic, diabetic)
- Pattern Identification:
- Perform functional principal component analysis
- Identify characteristic glucose curve shapes
- Correlate patterns with clinical and lifestyle factors
The 2025 IFCC Working Group guidelines represent a critical advancement toward standardized CGM evaluation, addressing fundamental gaps in performance assessment methodology. By establishing rigorous requirements for study design, comparator measurements, and analytical performance criteria, these guidelines enable more reliable comparison between CGM systems and enhance the validity of CGM metrics as research outcomes [19] [7]. Implementation of these standardized protocols will facilitate harmonized therapy outcomes and standards of care, ultimately benefiting both clinical practice and pharmaceutical development. Future directions should focus on validating these protocols across diverse populations, developing reference measurement systems specifically for CGM, and establishing interoperability standards for data integration across platforms and studies.
Traceability and Metrological Framework for CGM Measurements in Clinical Studies
The integration of Continuous Glucose Monitoring (CGM) into clinical research and therapeutic development necessitates a robust metrological framework to ensure measurement reliability, comparability, and traceability. CGM systems measure glucose concentrations in the interstitial fluid (ISF) of subcutaneous tissue, a compartment fundamentally different from the capillary or venous blood measured by traditional self-monitoring of blood glucose (SMBG) systems [23]. This distinction introduces unique methodological challenges, including physiological and technological time lags, matrix-specific measurement uncertainties, and the absence of an internationally accepted reference measurement procedure (RMP) for interstitial glucose [23]. The lack of standardization can lead to significant performance variations between different CGM systems and even between individual sensors of the same system, potentially compromising data integrity in clinical studies and leading to divergent therapy recommendations [23] [24].
A metrological framework establishes the foundation for traceability, defined as the property of a measurement result whereby it can be related to a stated reference through a documented unbroken chain of calibrations, each contributing to the measurement uncertainty [25]. For in vitro diagnostic medical devices like CGM systems, the international standard ISO 17511:2020 specifies the technical requirements for establishing metrological traceability to higher-order references [25]. The International Federation of Clinical Chemistry and Laboratory Medicine (IFCC) Working Group on CGM is actively addressing this gap by defining the measurand, establishing a traceability chain, and standardizing procedures and metrics for assessing the analytical performance of minimally invasive CGM systems [23]. This application note outlines the critical components of this framework and provides detailed protocols for its implementation in clinical research settings.
The Traceability Gap in CGM Systems
Defining the Measurand
The first step in establishing traceability is a clear definition of the measurand—the quantity intended to be measured. According to the International Vocabulary of Metrology (VIM), this encompasses the substance, unit, and matrix [23]. For CGM systems, this presents an immediate challenge, as the matrix is interstitial fluid, for which no higher-order RMPs or certified reference materials (CRMs) currently exist.
- Substance: Glucose in interstitial fluid.
- Unit: mmol/L or mg/dL.
- Matrix: Subcutaneous interstitial fluid.
This lack of a primary reference system for the intended matrix means that CGM systems cannot currently achieve metrological traceability in the strictest sense [23]. Instead, manufacturers typically establish traceability of their factory calibration algorithms to blood-based RMPs, such as the ID-LC/MS/MS method for glucose in plasma, creating an inherent methodological discontinuity [23]. This gap is a primary source of measurement uncertainty and a focal point for ongoing standardization efforts.
Current Limitations and Consequences
The absence of a unified traceability framework has direct consequences for clinical research:
- Result Variability: Performance differences between CGM systems from different manufacturers, and between sensors of the same system, can be substantial [23].
- Uncertainty in Decision-Making: Therapeutic decisions or research conclusions may vary depending on the CGM system used, affecting the reproducibility and generalizability of study findings [23].
- Inconsistent Performance Claims: Manufacturers use diverse methodologies and metrics (e.g., MARD calculated in different ways) to report accuracy, making cross-system comparisons challenging for researchers [24].
Standardized Experimental Protocols for CGM Performance Assessment
To ensure reliable and comparable data in clinical studies, researchers must adopt standardized protocols for verifying CGM performance. The following protocols are aligned with international consensus and regulatory guidance.
Protocol 1: Core Analytical Accuracy Assessment
This protocol evaluates the fundamental agreement between CGM readings and reference method values across the clinically relevant glucose range.
Objective: To determine the point accuracy of a CGM system against a validated reference method. Design: Prospective, controlled clinical study. Subjects: Minimum of 100 subjects, representative of the intended use population (e.g., including varying age, skin type, BMI). Sensor Sample Size: At least 100 sensors (preferably one per subject) [26] [24]. Duration: 7 to 14 days of sensor wear. Reference Method: Yellow Springs Instruments (YSI) glucose analyzer or equivalent clinical laboratory hexokinase method applied to venous or arterial blood samples [23]. Paired Measurements: A minimum of 400 paired data points (CGM vs. reference) should be collected per study, stratified across:
- Glycemic Ranges: <70 mg/dL (3.9 mmol/L), 70-180 mg/dL (3.9-10.0 mmol/L), and >180 mg/dL (10.0 mmol/L).
- Rates of Glucose Change: ≤1 mg/dL/min, 1-2 mg/dL/min, and >2 mg/dL/min [24].
Data Analysis & Acceptance Criteria: The collected data should be analyzed against the following performance thresholds, which synthesize international standards and expert consensus [26] [24].
Table 1: Standardized Accuracy Performance Thresholds for CGM Systems
| Metric | Glucose Concentration | Threshold Requirement | Regulatory Source |
|---|---|---|---|
| Agreement Rate | Overall | >87% within ±20% | FDA iCGM Special Controls [26] |
| <70 mg/dL (3.9 mmol/L) | >85% within ±15 mg/dL | FDA iCGM Special Controls [26] | |
| 70-180 mg/dL (3.9-10.0 mmol/L) | >70% within ±15% | FDA iCGM Special Controls [26] | |
| >180 mg/dL (10.0 mmol/L) | >80% within ±15% | FDA iCGM Special Controls [26] | |
| Consensus Error Grid | Overall | >99% in clinically acceptable zones (A+B) | ISO 15197:2013 [26] |
| Mean Absolute Relative Difference (MARD) | Overall | ≤10% is considered suitable for non-adjunctive use | Expert Consensus [23] |
Protocol 2: Clinical Agreement and Trend Analysis
This protocol assesses the CGM system's ability to accurately reflect dynamic glucose changes, which is critical for detecting postprandial excursions and impending hypoglycemia.
Objective: To evaluate the accuracy of glucose trend arrows and rates of change reported by the CGM system. Design: Frequently sampled reference measurements during periods of dynamic glucose change. Procedure:
- Induce controlled glucose changes using standardized meal tolerance tests or insulin challenges.
- Collect reference blood samples every 15 minutes during the dynamic phase.
- Record the CGM-reported trend arrow or rate-of-change value at each reference time point.
- Categorize paired data based on the reference rate of change: stable (≤1 mg/dL/min), rising (>1 mg/dL/min), or falling (<-1 mg/dL/min).
Data Analysis & Acceptance Criteria:
- Trend Arrow Accuracy: The direction (e.g., rising, falling, stable) indicated by the CGM should match the direction calculated from the reference values with >90% accuracy.
- Rate-of-Change Agreement: The correlation coefficient between CGM-reported rate-of-change and the reference rate-of-change should be >0.79 [24].
Analytical and Clinical Performance Metrics
A comprehensive CGM evaluation in clinical studies must move beyond point accuracy to include a suite of standardized metrics.
Table 2: Key CGM Metrics for Clinical Studies
| Metric Category | Specific Metric | Definition & Calculation | Clinical/Research Significance |
|---|---|---|---|
| Analytical Accuracy | Mean Absolute Relative Difference (MARD) | Average of the absolute values of relative differences between CGM and reference values. | Primary indicator of overall system accuracy; lower MARD indicates higher accuracy [26] [23]. |
| Consensus Error Grid | Analysis categorizing paired CGM-reference points into zones (A-E) based on clinical risk. | Assesses clinical accuracy and risk of outcome errors; >99% in Zones A+B is required [26]. | |
| Glycemic Control | Time in Range (TIR) | Percentage of CGM readings (or time) spent in target glucose range (70-180 mg/dL). | Correlates with HbA1c; a key efficacy endpoint in clinical trials [6]. |
| Time Below Range (TBR) | Percentage of readings/time <70 mg/dL (Level 1) and <54 mg/dL (Level 2). | Critical safety endpoint; identifies hypoglycemia risk [6]. | |
| Time Above Range (TAR) | Percentage of readings/time >180 mg/dL (Level 1) and >250 mg/dL (Level 2). | Indicator of hyperglycemia; used as an efficacy endpoint [6]. | |
| Glycemic Variability | Coefficient of Variation (CV) | (Standard Deviation / Mean Glucose) × 100%. | Measure of glucose stability; a CV ≤36% is considered stable [6]. |
| Glucose Management Indicator (GMI) | Formula-derived estimate of HbA1c from mean CGM glucose: GMI (%) = 3.31 + 0.02392 × [mean glucose in mg/dL]. | Provides an expected A1c value based on CGM data for outcome reporting [6]. |
Implementing the Traceability Framework: A Workflow for Researchers
The following workflow diagram and accompanying description provide a practical path for implementing metrological rigor in clinical studies involving CGM.
Figure 1: Workflow for Implementing CGM Traceability in Clinical Studies. This diagram outlines the key phases and actions required to ensure metrologically sound CGM data collection, from initial planning to final reporting.
The Researcher's Toolkit: Essential Materials and Reagents
Table 3: Essential Research Reagent Solutions for CGM Experiments
| Item | Function & Specification | Metrological Role |
|---|---|---|
| Certified Reference Material (CRM) for Glucose in Plasma | High-purity glucose material with certified concentration, traceable to SI units. | Serves as the highest available reference for calibrating the laboratory reference method (e.g., YSI), establishing the top of the traceability chain [25]. |
| Quality Control Materials | Commercially available quality control solutions at multiple concentration levels (low, mid, high). | Used to verify the daily precision and accuracy of the reference method throughout the study duration, ensuring its consistent performance [23]. |
| Standardized Buffer Solutions | For reconstitution of CRMs and QCs, as specified by the manufacturer. | Ensures that the matrix and osmolarity of control samples are consistent, preventing pre-analytical errors. |
| CGM Sensor & Receiver | The CGM system under investigation, used according to its Instructions for Use (IFU). | The device under test; its factory calibration must be documented as traceable to a higher-order method [23]. |
The establishment of a standardized traceability and metrological framework for CGM measurements is no longer a theoretical pursuit but a practical necessity for advancing diabetes research and drug development. By adopting the protocols, metrics, and workflows outlined in this document, researchers can significantly enhance the reliability, comparability, and clinical relevance of data generated in studies utilizing CGM technology. The ongoing work of standards organizations like the IFCC Working Group on CGM is critical to closing the existing metrological gaps and providing a fully realized international standard. Until then, the rigorous application of this proposed framework will ensure that CGM-derived endpoints in clinical trials are measured with the scientific rigor they demand.
The accuracy of Continuous Glucose Monitoring (CGM) systems is fundamentally governed by the physiological kinetics of glucose transport between the vascular and interstitial compartments and the measurement characteristics of the sensor technology itself. For researchers and drug development professionals, a precise understanding of these dynamics is critical for developing next-generation monitoring systems, refining algorithms for artificial pancreas systems, and accurately interpreting pharmacokinetic and pharmacodynamic data related to glucose metabolism. This document synthesizes current evidence on physiological and device-related lag times, presents standardized experimental protocols for their quantification, and provides visualization tools to conceptualize these complex processes.
Physiological Fundamentals and Quantitative Lag Analysis
Compartmental Glucose Kinetics
Glucose is transported from the blood capillary lumen to the interstitial fluid (ISF) via simple diffusion across a concentration gradient without an active transporter [27]. The dynamics between plasma glucose (G1) and interstitial glucose (G2) are frequently described using a two-compartment model, characterized by the equation:
dV₂G₂/dt = K₂₁V₁G₁ − (K₁₂ + K₀₂)V₂G₂
where K₁₂ represents the forward flux rate for glucose transport across the capillary, K₂₁ the reverse flux rate, K₀₂ the glucose uptake into the subcutaneous tissue, and V₁ and V₂ the volumes of the plasma and interstitial fluid compartments, respectively [27]. This model highlights how interstitial glucose levels are determined not only by diffusion rates but also by local blood flow, capillary permeability, and the metabolic rate of adjacent cells.
Direct Measurement of Physiological Time Lag
The intrinsic physiological lag has been directly measured using glucose tracer methodologies. A landmark study administered intravenous boluses of glucose tracers ([1-¹³C]glucose and [6,6-²H₂]glucose) to healthy, fasted subjects and simultaneously collected plasma and subcutaneous interstitial fluid via microdialysis [28].
Table 1: Direct Measurement of Physiological Glucose Transport Lag
| Tracer Type | Mean Time to Appearance in ISF (min) | Standard Error (min) | 95% CI Upper Limit for 75th Percentile (min) |
|---|---|---|---|
| [6,6-²H₂] Glucose | 5.4 | 0.6 | 6.8 (5.8 - 6.8) |
| [1-¹³C] Glucose | 6.2 | 1.2 | 9.8 (4.8 - 9.8) |
After accounting for catheter dead space and assay noise, the study concluded that the physiological delay of glucose transport from the vascular to the interstitial space is 5–6 minutes in the overnight fasted state in healthy adults [28]. This relatively short lag suggests that the intrinsic physiological delay should not be a major obstacle to sensor accuracy in overnight or fasting-state closed-loop systems.
Device-Intrinsic and Aggregate Lag Contributions
Beyond the physiological lag, the total latency observed in CGM readings includes a significant component intrinsic to the sensor device itself. In vitro testing of CGM systems reveals that the sensors exhibit their own response lag due to electrochemical reaction times and onboard signal processing filters [29] [30].
Table 2: Intrinsic Lag of a CGM System During Changing Glucose Concentrations (In Vitro)
| Rate of Glucose Change (mg/dL/hr) | Direction | Lag Time (t½) in Minutes |
|---|---|---|
| Slow (30) | Falling | 40.1 |
| Rising | 34.7 | |
| Moderate (90) | Falling | 13.6 |
| Rising | 10.6 | |
| Rapid (220) | Falling | 15.1 |
| Rising | 8.3 |
This intrinsic lag causes CGM readings to overestimate actual glucose levels during falling concentrations and underestimate them during rising concentrations [29]. The aggregate lag in a real-world setting is thus the summation of the physiological ISF-plasma delay, the electrochemical sensor delay, and the signal processing delay [31]. Studies using the Medtronic Guardian RT system have found that digital filtering alone can introduce delays similar to those previously attributed solely to ISF glucose equilibration, especially during rapid, unphysiological glucose changes [30].
Experimental Protocols for Lag Characterization
Protocol 1: Direct Physiological Lag Measurement via Tracer Kinetics
This protocol is designed for the direct in vivo measurement of the physiological glucose transport delay, as pioneered by [28].
Research Reagent Solutions
Table 3: Key Reagents for Tracer Kinetics Studies
| Reagent / Material | Function / Explanation |
|---|---|
| Stable Isotope Tracers ([1-¹³C] Glucose, [6,6-²H₂] Glucose) | To label glucose molecules without isotopic effects, allowing precise tracking of glucose transport kinetics between compartments. |
| Microdialysis System (e.g., CMA 63 catheters, CMA 107 pump) | To continuously sample and recover analytes from the subcutaneous interstitial fluid compartment for ex-vivo analysis. |
| Gas Chromatography–Mass Spectrometry (GC-MS) | To achieve high-precision measurement of tracer enrichment (Molar Ratio) in plasma and microdialysate samples. |
| Arterialized Venous Blood Sampling | Using the heated hand vein method to obtain blood samples that approximate arterial glucose concentrations. |
Methodology
- Subject Preparation: Admit healthy subjects after screening. Place them in an overnight fasted state to ensure glucose stability.
- Catheter Insertion & Stabilization: Insert four microdialysis catheters into the abdominal subcutaneous tissue. Perfuse them with a standard solution at a constant rate (e.g., ~1 µL/min) and allow at least 1 hour for the tissue response to stabilize.
- Tracer Administration & Sampling: Adminstrate an intravenous bolus of a glucose tracer (e.g., [1-¹³C] glucose) over 10 seconds.
- Timed Sample Collection: Collect sequential, timed samples of arterialized venous plasma and pooled microdialysate effluent simultaneously, starting before the bolus and continuing for the duration of the tracer's clearance.
- Sample Analysis: Analyze plasma and microdialysate samples using GC-MS to determine tracer enrichment (Molar Ratios).
- Data Analysis: Re-index sample collection times to account for catheter dead space transit time. Define detectable ISF appearance as an enrichment Molar Ratio >0.3% (three times the assay noise). Use time-to-event analysis (e.g., Kaplan-Meier curve) to estimate the time to detectable tracer levels in the ISF.
Protocol 2: In Vitro Characterization of CGM System Intrinsic Lag
This protocol assesses the lag and accuracy attributable solely to the CGM device, independent of physiology [29].
Methodology
- Sensor Calibration: Calibrate multiple CGM systems simultaneously in a stirred glucose solution (e.g., 144 mg/dL in Krebs bicarbonate buffer) at 37°C, as per manufacturer instructions.
- Generate Glucose Dynamics: Use a gradient maker and pump system to induce controlled, linear changes in glucose concentration at various physiologically relevant rates (e.g., 30, 90, and 220 mg/dL/hr) and including an instantaneous step change.
- Continuous Monitoring: Record CGM readings while the glucose concentration changes. Simultaneously, collect frequent small aliquots of the solution for reference glucose assay (e.g., via YSI analyzer or glucose oxidase method).
- Data Analysis: Compare CGM readings with reference glucose concentrations. Calculate intrinsic lag times (t₁/₄, t₁/₂, t₃/₄) as the time required for the CGM reading to achieve 25%, 50%, and 75% of the absolute change in the actual glucose concentration. Perform error grid analysis to assess clinical accuracy.
Visualization of Kinetics and Workflows
Two-Compartment Model of Glucose Kinetics
The following diagram illustrates the fundamental physiological model governing glucose movement from blood to the interstitial fluid and the subsequent signal pathway in a CGM system, incorporating the sources of measurement lag.
Experimental Workflow for Lag Characterization
This diagram outlines the core methodological workflow for dissecting the components of CGM measurement lag, from in vivo studies to in vitro validation.
Advanced Modeling and Lag Correction Strategies
To mitigate the impact of lag on CGM accuracy, advanced algorithmic approaches are employed. Wiener filtering has been demonstrated as an effective method for inverse filtering, correcting for time lag while simultaneously attenuating noise [31]. In one study, this approach reduced the error attributed to a 10-minute time delay by approximately 50% in the presence of noise [31]. Other approaches involve the use of physiological models to reconstruct blood glucose levels using CGM signals only, potentially personalizing parameters to an individual's glucose kinetics and reducing the need for frequent calibration [32]. The application of Kalman filters also provides a powerful framework for predicting glucose levels by estimating the system's state from noisy sensor data, thereby effectively reducing the perceived lag [31].
CGM Performance Assessment Framework: Metrics, Study Design, and Analytical Validation
The evaluation of Continuous Glucose Monitoring (CGM) systems relies on standardized metrics to quantify their analytical and clinical performance. Among these, the Mean Absolute Relative Difference (MARD) and Clinical Agreement Percentage serve as fundamental measures for researchers assessing device accuracy. These metrics provide complementary insights: MARD offers a single-value summary of overall numerical accuracy, while clinical agreement percentage indicates the proportion of measurements that would lead to safe treatment decisions. For drug development professionals utilizing CGM data as endpoints in clinical trials, understanding the calculation, interpretation, and limitations of these metrics is essential for proper study design and data validation. The reliability of these metrics is intrinsically linked to rigorous experimental methodologies, including appropriate reference measurement systems and controlled clinical conditions that reflect physiologically relevant glucose excursions [33] [26] [34].
Mean Absolute Relative Difference (MARD)
Definition and Calculation
The Mean Absolute Relative Difference (MARD) is a statistical parameter widely used to characterize the numerical accuracy of CGM systems. It represents the average of the absolute values of the relative differences between CGM readings and corresponding reference measurement values, expressed as a percentage [33] [26].
The mathematical calculation involves several steps. First, the Absolute Relative Difference (ARD) is computed for each paired measurement using the formula:
[ ARDk = 100\% \cdot \frac{|y{\text{CGM}}(tk) - y{\text{ref}}(tk)|}{y{\text{ref}}(t_k)} ]
where (y{\text{CGM}}(tk)) is the CGM value at time (tk), and (y{\text{ref}}(t_k)) is the reference measurement value at the same time point. The MARD is then calculated as the mean of all individual ARD values:
[ \text{MARD} = \frac{1}{N{\text{ref}}} \sum{k=1}^{N{\text{ref}}} ARDk ]
where (N_{\text{ref}}) is the total number of paired reference measurements [33].
Key Considerations and Limitations
While MARD provides a convenient single-value summary, its interpretation requires careful consideration of multiple confounding factors that can significantly influence the calculated value. These factors can be categorized as CGM system-inherent factors (including calibration procedures, sensor-to-sensor variation, and algorithmic smoothing filters) and non-inherent factors (including physiological time delays, glucose rate of change, reference measurement accuracy, and study design characteristics) [34].
A critical limitation of MARD is that it does not differentiate between positive and negative errors or between systematic and random errors. Furthermore, MARD values are highly dependent on the glucose range, with typically higher MARD observed during hypoglycemia compared to euglycemia or hyperglycemia. This was demonstrated in a study comparing four CGM systems, where MARD during hypoglycemia (ranging from 10.3% to 21.5%) differed substantially from MARD during euglycemia (ranging from 15.2% to 21.2%) [35].
The accuracy of the reference measurement system itself introduces uncertainty in MARD calculation. As reference systems have their own margin of error, this error propagates into the MARD value. With modern CGM systems achieving lower MARD values, the relative impact of reference measurement error becomes more significant [33].
Table 1: Advantages and Limitations of MARD
| Advantages | Limitations |
|---|---|
| Provides a single value summarizing analytical performance [34] | Does not distinguish between precision and bias [34] |
| Enables preliminary comparison between different CGM systems [34] | Highly dependent on study design and glucose distribution [33] |
| Widely used and recognized in the research community [34] | Does not reflect clinical risk of inaccurate measurements [36] |
| Calculation is relatively straightforward [33] | Poor indicator of performance during rapid glucose changes [34] |
| Useful for system algorithm development | Influenced by accuracy of the reference method itself [33] |
MARD Reliability Index (MRI)
To address the uncertainty in MARD values, a MARD Reliability Index (MRI) has been proposed. This index quantifies the reliability of a reported MARD value based on the number of paired points used in its calculation and the accuracy of the reference measurement system. The MRI is based on the statistical concept of confidence intervals, where a narrower confidence interval indicates greater reliability [33].
The relationship between sample size and MARD reliability is nonlinear. As shown in Figure 2 of PMC5375072, with 100 paired points, the 95% confidence interval for a MARD of 10% might span from 8.2% to 12%, whereas with 5,000 paired points, this interval would narrow significantly to between 9.8% and 10.4% [33]. This highlights the importance of adequate sample sizes in CGM accuracy studies to ensure precise MARD estimation.
Clinical Agreement Percentage
Definition and Calculation
Clinical Agreement Percentage, also referred to as agreement rate (AR), is a system accuracy metric that indicates the percentage of CGM values falling within specified clinical accuracy thresholds relative to reference values. Unlike MARD, which provides a continuous measure of average deviation, agreement rate offers a dichotomous assessment of whether measurements meet clinically acceptable accuracy standards [36] [37].
The calculation follows a two-threshold approach:
- For reference values <100 mg/dL (5.6 mmol/L): CGM values must be within ±15 mg/dL or ±20 mg/dL
- For reference values ≥100 mg/dL (5.6 mmol/L): CGM values must be within ±15% or ±20% [36] [37]
The formula for calculating overall agreement rate is:
[ \text{Agreement Rate} = \left( \frac{N{\text{within thresholds}}}{N{\text{total}}} \right) \times 100\% ]
where (N{\text{within thresholds}}) represents the number of CGM values meeting the specified accuracy thresholds, and (N{\text{total}}) represents the total number of paired measurements.
Clinical Significance and Interpretation
Agreement rate thresholds are designed to align with clinical risk categories. Measurements falling within these thresholds are considered to have minimal impact on treatment decisions, while those outside the thresholds may lead to clinically significant errors [36].
However, a limitation of this metric is that it typically combines Zones A and B of error grid analysis, potentially masking clinically relevant inaccuracies. As noted in a 2025 publication, "it makes little sense to call results in the B zone acceptable" when using the Diabetes Technology Society Error Grid, as Zone B represents benign errors that may still have clinical implications in certain contexts [36].
Regulatory bodies have established minimum requirements for agreement rates. The FDA's integrated CGM (iCGM) criteria require:
- >87% of values within ±20% for overall glucose concentrations
- >85% within ±15 mg/dL for values <70 mg/dL
- >70% within ±15% for values 70-180 mg/dL
- >80% within ±15% for values >180 mg/dL [26]
Comparative Analysis of Accuracy Metrics
Relationship Between MARD and Clinical Agreement
MARD and clinical agreement percentage provide complementary, not interchangeable, assessments of CGM performance. While both metrics aim to quantify accuracy, they approach this goal from different perspectives: MARD reflects the average magnitude of error, while agreement rate indicates the proportion of clinically acceptable measurements [26] [34].
Systems with lower MARD values typically demonstrate higher agreement rates, but this relationship is not perfectly linear due to different error distributions. A CGM system might have a favorable MARD but suboptimal agreement rate if it consistently makes small errors across many measurements rather than large errors on a few measurements.
Table 2: Performance Metrics of Contemporary CGM Systems (Adapted from PMC11795573)
| CGM System | MARD vs. YSI (%) | MARD vs. Hexokinase Lab Analyzer (%) | MARD vs. Capillary BGM (%) | Agreement Rate (±20/20%) |
|---|---|---|---|---|
| FreeStyle Libre 3 | 11.6 | 9.5 | 9.7 | Not Reported |
| Dexcom G7 | 12.0 | 9.9 | 10.1 | Not Reported |
| Medtronic Simplera | 11.6 | 13.9 | 16.6 | Not Reported |
This table illustrates how the same CGM system can demonstrate different MARD values depending on the reference method used, highlighting the importance of standardizing reference measurements when comparing devices [37].
Additional Accuracy Assessment Methods
Comprehensive CGM accuracy evaluation extends beyond MARD and agreement rate to include several complementary metrics:
- Error Grid Analysis: Provides clinical (rather than numerical) accuracy assessment by categorizing measurements into risk zones (A-E). The Diabetes Technology Society Error Grid is increasingly used, with emphasis on the percentage in Zone A (pZA) as the optimal metric for clinical acceptability [36] [35].
- Bias Analysis: Measures systematic deviation (mean relative difference) of CGM values from reference, indicating whether the system tends to read high or low [37].
- Rate Accuracy Assessment: Evaluates how well CGM systems track changing glucose levels using metrics like absolute R-deviation [35].
- Survival Analysis: Assesses sensor reliability and longevity through Kaplan-Meier analysis of sensor survival [37].
Experimental Protocols for Accuracy Assessment
Standardized Clinical Study Design
Robust assessment of CGM accuracy requires carefully controlled clinical studies with appropriate participant selection, reference measurement systems, and testing conditions. A recent (2025) head-to-head comparison study provides a exemplary methodology for comprehensive accuracy evaluation [37].
Diagram 1: CGM Accuracy Study Workflow
Participant Selection: Studies typically include 24+ adults with type 1 diabetes, excluding those with severe hypoglycemia in the previous 6 months, hypoglycemia unawareness, or HbA1c >10% [37].
Study Duration and Sensors: A 15-day study period accommodates assessment of different sensor lifetimes, with sensors worn in parallel according to manufacturers' instructions (e.g., FreeStyle Libre 3: 14 days, Dexcom G7: 10.5 days, Medtronic Simplera: 7 days) [37].
Reference Measurement Systems: Triangulation of reference methods strengthens accuracy assessment:
- YSI 2300 STAT PLUS laboratory analyzer (glucose oxidase-based method)
- COBAS INTEGRA 400 plus analyzer (hexokinase-based method)
- Contour Next blood glucose monitoring system (capillary, glucose dehydrogenase-based) [37]
All reference measurements should be performed in duplicate and averaged to improve precision [37].
Dynamic Glucose Excursion Protocol
To comprehensively assess CGM performance across clinically relevant conditions, structured glucose excursions should be induced during Frequent Sampling Periods (FSPs). A recently proposed protocol includes these phases [37]:
- Hyperglycemia Induction: Carbohydrate-rich breakfast followed by delayed insulin bolus
- Hypoglycemia Induction: Controlled insulin administration with mild exercise if needed
- Rapid Glucose Changes: Controlled descent into and recovery from hypoglycemia
- Stable Normoglycemia: Final stabilization in target range
This protocol ensures adequate data collection across all dynamic glucose regions, including various combinations of glucose levels (hypoglycemia, euglycemia, hyperglycemia) and rates of change (stable, falling, rising) [37].
Data Analysis Methodology
Data Pairing: CGM readings are paired with reference measurements based on temporal proximity, typically using the CGM value closest in time to each reference measurement with a maximum allowed time difference (e.g., ±5 minutes) [37].
Stratified Analysis: Accuracy metrics should be calculated separately for different glucose ranges:
- Hypoglycemia (<70 mg/dL or <3.9 mmol/L)
- Euglycemia (70-180 mg/dL or 3.9-10.0 mmol/L)
- Hyperglycemia (>180 mg/dL or >10.0 mmol/L) [35]
Additionally, analysis should consider different rates of glucose change and sensor wear time (day 1 vs. subsequent days) [37] [34].
Statistical Analysis: Report point estimates with measures of variability and precision (standard deviation, confidence intervals). For agreement rates, the lower one-sided bound of the 95% confidence interval should meet regulatory thresholds [26].
The Scientist's Toolkit: Essential Research Reagents and Materials
Table 3: Essential Materials for CGM Accuracy Studies
| Item | Specification/Example | Research Function |
|---|---|---|
| CGM Systems | Factory-calibrated personal CGM (e.g., FreeStyle Libre 3, Dexcom G7, Medtronic Simplera) | Test devices for accuracy assessment [37] |
| Laboratory Reference Analyzer | YSI 2300 STAT PLUS (glucose oxidase) or COBAS INTEGRA (hexokinase) | High-accuracy venous reference method [37] |
| Capillary Blood Glucose Monitor | Contour Next system | Capillary blood reference method; should meet ISO 15197:2013 standards [37] |
| Data Synchronization Solution | Master clock with synchronized device timing | Ensures precise temporal alignment of CGM and reference measurements [35] |
| Glucose Excursion Materials | Standardized carbohydrates, insulin, equipment for mild exercise | Induces controlled glycemic excursions across clinically relevant ranges [37] |
| Data Analysis Software | Custom scripts for MARD, agreement rate, error grid analysis | Calculates accuracy metrics from paired data sets [37] [35] |
MARD and clinical agreement percentage provide distinct but complementary insights into CGM system performance. MARD serves as a valuable measure of average numerical accuracy, while agreement rate indicates the proportion of clinically acceptable measurements. Both metrics are essential for comprehensive CGM characterization in research settings, particularly for drug development professionals utilizing CGM data as trial endpoints.
The reliability of these metrics depends heavily on rigorous experimental methodology, including appropriate reference measurement systems, controlled glucose excursions, adequate sample sizes, and stratified data analysis. Researchers should recognize that reported MARD values have inherent uncertainty quantified by the MARD Reliability Index, and should consider multiple accuracy metrics in conjunction to fully evaluate CGM performance.
Standardization of accuracy assessment protocols, as proposed by the IFCC Working Group on CGM, will facilitate more meaningful comparisons between devices and studies, ultimately advancing the field of glucose monitoring research and its applications in clinical trials and therapeutic development [7].
Continuous Glucose Monitoring (CGM) has transitioned from a specialized tool to a fundamental component of diabetes management and clinical trial methodology [18]. For researchers and drug development professionals, the integration of CGM into clinical trials demands careful consideration of methodological requirements, particularly concerning patient populations and study duration. This document outlines evidence-based protocols and application notes to guide the design of robust CGM clinical trials, framed within the broader context of CGM systems methodology research. The adoption of standardized approaches is crucial for generating reliable, comparable data that meets regulatory standards for diabetes therapeutics and digital health technologies [38].
Current CGM Technology Landscape
Understanding the available CGM systems is fundamental to trial design selection. The technical specifications of commercially available CGM devices directly influence data collection capabilities, participant burden, and ultimately, trial outcomes. The table below summarizes key characteristics of major CGM systems relevant for clinical trial applications.
Table 1: Technical Specifications of Selected Continuous Glucose Monitoring Systems
| CGM Sensor (Manufacturer) | Sensor Duration (Days) | Warm-up Time (Minutes) | Glucose Range (mg/dL) | Calibration Required | MARD (%) |
|---|---|---|---|---|---|
| FreeStyle Libre 3 (Abbott) | 14 | 60 | 40-500 | No | 7.9-9.4 [18] |
| Dexcom G7 (Dexcom) | 10 (+12-hr grace period) | 30 | 40-400 | No (Optional) | 8.2-9.1 [18] |
| Medtronic Guardian 4 (Medtronic) | 7 | 120 | 40-400 | No | 10.1-11.2 [18] |
| Caresens Air (i-SENS) | 15 | 120 | 40-500 | Yes (Every 24 hr) | 9.4-10.42 [18] |
MARD: Mean Absolute Relative Difference, a key metric for accuracy where lower values indicate higher accuracy.
The selection of a CGM system involves trade-offs between sensor duration, accuracy, and participant burden. For instance, while the Caresens Air offers an extended 15-day wear, it requires daily fingerstick calibration, which may increase participant burden and affect compliance [18]. In contrast, factory-calibrated systems like the Libre 3 and Dexcom G7 eliminate this requirement, potentially simplifying trial protocols. The Dexcom G7's 30-minute warm-up time is advantageous for capturing data more quickly after sensor placement, which is particularly valuable in shorter-duration studies or those with frequent monitoring periods [18].
Patient Population Considerations
Clinical trial design must account for how CGM performance and outcomes vary across different patient demographics and diabetes subtypes. The following workflow outlines the key decision points for defining patient population criteria in a CGM trial.
Population-Specific Methodological Notes
Diabetes Type and Treatment Regimen: CGM efficacy is established across diabetes types. Evidence shows HbA1c reductions of 0.6% in T1D on multiple daily injections (MDI) and 0.3-0.4% in T2D on basal insulin or oral agents [18]. For non-insulin T2D populations, CGM still provides significant educational value for lifestyle modification, with one study showing an HbA1c reduction of 0.68% [18]. Trial protocols should clearly define the treatment regimen and ensure it remains stable during the monitoring period to isolate the intervention's effect.
Age and Special Populations: Glycemic goals and CGM utilization patterns differ by age. Studies specifically designed for elderly populations (>60 years) have demonstrated CGM's effectiveness in reducing time spent in hypoglycemia (<70 mg/dL) by 1.9% [18]. Similarly, pediatric and adolescent trials require specific consideration of device burden and data interpretation. Pregnancy adds another layer of complexity, with CGM trials showing a modest but significant HbA1c reduction of 0.19% in pregnant individuals with T1D [18].
Socioeconomic and Disparity Considerations: Real-world analyses indicate that CGM uptake can be influenced by social vulnerability. One study found that CGM use was higher among non-Caucasian and non-English-speaking groups but declined with increasing Social Vulnerability Index (SVI) [39]. Trial designs must incorporate strategies to mitigate these disparities, such as providing language-appropriate materials and addressing barriers to technology access, to ensure representative recruitment and generalizable results.
Study Duration and Endpoint Selection
Appropriate study duration is critical for capturing meaningful glycemic data while considering practical trial constraints. The selection of endpoints should align with the study's duration and primary objectives.
Table 2: CGM Endpoints and Recommended Study Durations Based on Clinical Evidence
| Study Focus / Population | Primary Endpoint Examples | Secondary Endpoints | Supported Study Durations (from evidence) |
|---|---|---|---|
| Glycemic Efficacy (T1D) | HbA1c change, Time-in-Range (TIR) | Time Below Range (TBR), Glycemic Variability (CV) | 6 months [18] |
| Glycemic Efficacy (T2D) | HbA1c change, TIR | Time Above Range (TAR), Hypoglycemia Events | 3-8 months [18] |
| Safety Monitoring | TBR, Hypoglycemia Events | Hyperglycemia Events, Patient Symptoms | 2-4 weeks (for initial signal detection) [38] |
| Dietary Intervention | Mean Glucose, TIR, Glycemic Variability (CV) | HbA1c, Fructosamine | 5-week feeding periods (with CGM over 14 days) [40] |
| Long-term Outcomes | HbA1c sustainability, Complication rates | Healthcare utilization, Quality of Life | 12+ months [18] [39] |
Endpoint Selection Protocol
The consensus is moving beyond HbA1c as a sole endpoint. A comprehensive CGM trial should include a suite of complementary metrics [38]:
- Time-in-Range (TIR): The percentage of time glucose levels spend within the target range (typically 70-180 mg/dL). An increase of 5% (approximately 1.2 hours per day) is considered clinically meaningful.
- Time Below Range (TBR): Critical for safety assessment, particularly Level 2 hypoglycemia (<54 mg/dL). Reductions of 0.5-1.0% are clinically significant.
- Glycemic Variability (GV): Measured as Coefficient of Variation (CV). A CV of ≤36% is a recommended goal for stable control.
- HbA1c: Remains a validated long-term outcome, but should be interpreted alongside CGM metrics.
For exploratory or early-phase trials, CGM can provide rich data on glucose variability and time-in-range, while later-phase or registration trials may use CGM-derived endpoints alongside HbA1c or for specific safety monitoring, such as detecting asymptomatic hypoglycemia [41].
Experimental Protocol for a CGM Clinical Trial
The following section provides a detailed, actionable protocol for implementing CGM in a clinical trial setting, based on methodologies used in recent studies.
Protocol Workflow
The graphical workflow below maps the key stages of CGM implementation in a clinical trial, from initial planning to final data analysis.
Detailed Methodology
1. Pre-Study Planning and Device Selection
- Device Procurement and Validation: Secure devices and establish data transfer pathways with the vendor. For regulatory purposes, ensure the selected CGM system is approved for use in the trial's target regions [41].
- Define CGM Wear Schedule: Specify start and end dates for CGM wear periods. In controlled feeding studies like DASH4D, participants may wear a masked CGM for up to 14 days during specific intervention periods [40]. For longer trials, consider intermittent vs. continuous CGM use to balance data richness with participant burden and cost.
- Establish a Missing Data Protocol: Predefine the minimum data required for a participant's data to be included in the analysis (e.g., ≥70% of CGM data per wear period). Document reasons for data loss (sensor failure, non-wear, signal loss) [38].
2. Participant Training and Sensor Deployment
- Standardized Training: Develop and implement a uniform training program for all participants on sensor insertion, use, and troubleshooting. This is critical for minimizing user-related errors and data loss.
- Blinding Strategy: Determine if the CGM will be masked (blinded) or unmasked (unblinded). In a blinded setup, participants cannot see their real-time glucose values, which is useful for preventing behavior modification that could bias the intervention's effect.
- Concomitant Monitoring: Specify the use of Blood Glucose Monitoring (BGM). Protocol should mandate BGM verification when CGM readings do not match patient symptoms, or for calibration if using a device that requires it [41].
3. Data Collection and Integration with Clinical Outcomes
- Synchronized Data Collection: Use Electronic Clinical Outcome Assessment (eCOA) platforms to integrate CGM data with patient-reported outcomes. For example, trigger electronic symptom diaries when CGM detects hypoglycemic events to correlate biochemical data with patient experience [38] [40].
- Centralized Monitoring: Implement near-real-time data dashboards for the clinical team to monitor compliance, detect protocol deviations, and view data trends [41].
4. Data Acquisition and Processing
- Raw Data Acquisition: Work with the device vendor or use approved APIs to download raw glucose data (typically at 5-minute intervals) for all participants.
- Data Processing Pipeline: Develop a standardized pipeline to import data, align timestamps, and flag invalid readings (e.g., during sensor warm-up).
5. Quality Control and Endpoint Calculation
- Data Quality Assessment: Calculate the percentage of missing CGM data for each participant and wear period. One analysis found that 4.7-6% of CGM data points were missing in a clinical trial, with up to 16% missing on days of sensor change [38]. Exclude participants or wear periods that do not meet the pre-specified data quality threshold.
- Endpoint Calculation: Use consensus formulas to calculate key glycemic endpoints from the cleaned CGM data [38]. For example:
- Time-in-Range (TIR): (Number of readings 70–180 mg/dL / Total number of readings) × 100
- Glycemic Variability: Calculate the Coefficient of Variation (CV = [Standard Deviation / Mean Glucose] × 100)
The Scientist's Toolkit: Essential Reagents and Materials
The table below catalogues key materials and technological solutions required for implementing CGM in clinical trials.
Table 3: Research Reagent and Technology Solutions for CGM Trials
| Item Category | Specific Examples / Models | Function / Application in CGM Trials |
|---|---|---|
| CGM Systems | FreeStyle Libre 3, Dexcom G7, Medtronic Guardian 4 [18] | Primary data collection device for interstitial glucose measurements. Selection depends on accuracy (MARD), wear duration, and calibration needs. |
| Calibration Devices | FDA-cleared Blood Glucose Meter (BGM) & test strips | Required for verifying CGM readings when symptoms don't match data, or for devices that need calibration. Essential for safety [41]. |
| Data Integration Platform | Advanced eCOA Platforms (e.g., YPrime) [41] | Integrates CGM and BGM data; triggers symptom surveys from glucose values; provides centralized monitoring dashboards for clinical teams. |
| Telemetry & Data Transfer | Bluetooth-enabled smart devices, Cloud data hubs | Enables seamless, real-time or periodic upload of CGM data from the participant's home environment, reducing clinic visits. |
| Hypoglycemia Symptom Survey | Hypoglycaemia Symptom Rating Questionnaire (HypoSRQ) [40] | Validated instrument to collect real-time patient-reported outcomes during hypoglycemic events detected by CGM. |
| Clinical Data Management | REDCap (Research Electronic Data Capture) [40] | A secure, web-based platform for building and managing study databases and integrating with other data sources. |
The methodological integration of CGM into clinical trials requires a deliberate approach to patient population selection and study duration. By leveraging the specific protocols and evidence-based guidelines outlined in this document, researchers can design robust trials that effectively capture the comprehensive glycemic benefits of new therapies. Standardization in reporting CGM metrics, proactive management of data quality, and attention to socioeconomic disparities in technology utilization are paramount for generating credible, regulatory-grade evidence. As CGM technology continues to evolve, so too must the methodological frameworks for its application in clinical research, paving the way for more personalized and effective diabetes management strategies.
Defining Minimum Accuracy Requirements and Performance Characterization Protocols
Continuous Glucose Monitoring (CGM) systems have revolutionized diabetes management by providing real-time insights into glucose fluctuations, enabling proactive therapeutic decisions [2]. However, the analytical performance assessment of these systems has been hindered by a lack of standardization, complicating direct comparisons between devices and confounding the interpretation of research outcomes [7]. This application note establishes minimum accuracy requirements and detailed performance characterization protocols within a comprehensive framework for the clinical assessment of CGM systems, addressing a critical methodological need in diabetes technology research [7] [24].
Minimum Accuracy Requirements
Quantitative Accuracy Thresholds
CGM system accuracy must be evaluated against standardized metrics. The International Federation of Clinical Chemistry and Laboratory Medicine (IFCC) Working Group on CGM has developed guidelines defining minimum requirements, while the U.S. Food and Drug Administration (FDA) has established special controls for integrated CGM (iCGM) systems [7] [26]. These standards provide a foundational framework for regulatory approval and clinical validation.
Table 1: Minimum Accuracy Requirements for CGM Systems
| Glucose Concentration Range | ISO 15197:2013 (BGM) | FDA iCGM Requirements | Additional Consensus Requirements |
|---|---|---|---|
| Overall | ≥95% within ±15 mg/dL or ±15%* | >87% within ±20% | Reporting of MARD, Consensus Error Grid, and iCGM agreement rate recommended [24] |
| <70 mg/dL (Hypoglycemia) | Not specified | >85% within ±15 mg/dL; >98% within ±40 mg/dL; no value >180 mg/dL | Critical for patient safety; requires stringent validation [26] |
| 70-180 mg/dL | Not specified | >70% within ±15%; >99% within ±40% | Primary focus for time-in-range optimization [26] |
| >180 mg/dL (Hyperglycemia) | Not specified | >80% within ±15%; >99% within ±40%; no value <70 mg/dL | Important for hyperglycemia complication risk assessment [26] |
| Error Grid Analysis | ≥99% within consensus error grid zones A and B | Not explicitly specified, but clinical reliability is required | Consensus Error Grid analysis essential for evaluating clinical reliability [24] |
Note: *At least 95% of measured glucose values should be within either ±15 mg/dL of the averaged comparison values at glucose concentrations <100 mg/dL or within ±15% at glucose concentrations ≥100 mg/dL [26].
Key Accuracy Metrics and Definitions
- Mean Absolute Relative Difference (MARD): A widely used metric for CGM accuracy, calculated by averaging the absolute values of relative differences between CGM system results and corresponding reference method results [26]. Lower MARD values indicate higher accuracy.
- Consensus Error Grid Analysis: A method for assessing the clinical accuracy of glucose monitoring systems by analyzing the potential clinical impact of measurement errors, categorizing results into zones A (clinologically accurate), B (clinically acceptable), and beyond [26] [24].
- Agreement Rate: The percentage of CGM values falling within specified difference limits (e.g., ±15% or ±15 mg/dL) of reference values, as utilized in the iCGM Special Control performance requirements [24].
Performance Characterization Protocols
Clinical Study Design
Robust performance characterization requires carefully controlled clinical studies that reflect real-world usage conditions.
Table 2: Essential Protocol Components for CGM Performance Studies
| Protocol Component | Minimum Requirement / Recommendation | Rationale |
|---|---|---|
| Study Duration | Recommended 14 days or sensor lifetime [42] | Captures longitudinal performance and sensor drift over full lifespan. |
| Data Sufficiency | ≥70% CGM active wear time [43] [42] | Ensures data collected is representative of glycaemic patterns. |
| Participant Population | Diverse representation across age, diabetes type, ethnicity [24] | Ensures performance validity across intended user demographics. |
| Reference Method | Laboratory-grade glucose analyzer (YSI); capillary BGM may be used in home-testing settings [26] | Provides a reliable comparator for CGM accuracy determination. |
| Glucose Stratification | Ensured sampling across full glycemic range (<70, 70-180, >180 mg/dL) [26] [24] | Verifies accuracy during hypo-, normo-, and hyperglycemia. |
| Rate-of-Change Stratification | Reporting accuracy stratified by glucose rate of change (e.g., ≤1, 1–2, >2 mg/dL⁻¹ min⁻¹) [24] | Assesses sensor performance during rapid glycemic excursions. |
Experimental Workflow for CGM Performance Evaluation
The following diagram illustrates the sequential workflow for conducting a comprehensive CGM performance characterization study, from initial design to final analysis.
Data Analysis and Reporting
Upon successful data collection, a standardized set of core glycemic metrics must be calculated and reported to provide a complete picture of CGM performance and its clinical implications.
Table 3: Core Glycemic Metrics for CGM Performance Reporting
| Metric | Definition | Target | Clinical/Research Relevance |
|---|---|---|---|
| Time in Range (TIR) | % of time glucose is between 70 and 180 mg/dL (3.9-10.0 mmol/L) | ≥70% for most adults [43] | Strong predictor of long-term complication risk; primary efficacy endpoint. |
| Time Below Range (TBR) | % of time spent <70 mg/dL (<3.9 mmol/L) and <54 mg/dL (<3.0 mmol/L) | <4% (<70 mg/dL); <1% (<54 mg/dL) [43] | Key safety metric; assesses hypoglycemia exposure. |
| Time Above Range (TAR) | % of time spent >180 mg/dL (>10.0 mmol/L) and >250 mg/dL (>13.9 mmol/L) | <25% (>180 mg/dL); <5% (>250 mg/dL) [43] | Assesses hyperglycemia burden and long-term risks. |
| Mean Glucose | The average glucose value over the monitoring period. | Individualized | Provides a quick summary of overall control. |
| Glucose Management Indicator (GMI) | An estimate of A1C based on average CGM glucose. | Individualized | Helps bridge CGM data with lab A1C. |
| Coefficient of Variation (CV) | Measure of glucose variability (Standard Deviation / Mean Glucose). | ≤36% [43] | Predictor of hypoglycemia risk; indicates glucose stability. |
The Researcher's Toolkit
Essential Research Reagents and Materials
Table 4: Essential Materials and Reagents for CGM Performance Studies
| Item / Reagent Solution | Function / Application in CGM Research |
|---|---|
| Laboratory Glucose Analyzer (e.g., YSI) | High-precision reference instrument for obtaining ground-truth glucose measurements against which CGM accuracy is benchmarked [26]. |
| Venous/Capillary Blood Collection Kits | Collection of blood samples for immediate analysis by the reference method to generate paired data points with CGM readings. |
| Standardized Glucose Control Solutions | Quality control verification of both reference method and CGM system calibration and performance across specified measurement ranges. |
| Data Management & Statistical Software (e.g., SAS, R) | Processing of large CGM datasets, performing complex statistical analyses (e.g., MARD, error grid, ATE), and generating standardized reports like the AGP [4] [43]. |
| CGM Data Extraction & AGP Report Software | Downloading raw sensor data and generating the standardized Ambulatory Glucose Profile (AGP) report for visual and quantitative analysis [42]. |
Logical Framework for CGM Clinical Validation
The pathway from raw data to clinical conclusions involves multiple validation steps, as outlined in the following logical framework.
Standardizing CGM performance assessment through defined minimum accuracy requirements and rigorous characterization protocols is fundamental for advancing diabetes technology research. The frameworks and methodologies outlined herein, incorporating the latest guidelines from the IFCC, FDA iCGM criteria, and international consensus statements, provide researchers with the necessary tools to conduct reproducible and clinically relevant evaluations [7] [26] [24]. Adherence to these protocols will facilitate valid cross-system comparisons, enhance the reliability of CGM data in clinical trials, and ultimately accelerate the development of safer and more effective diabetes management technologies.
The clinical evaluation of Continuous Glucose Monitoring (CGM) systems relies on comparison against reference methods, making standardized comparator measurements fundamental to performance assessment. Lack of standardization in comparator selection and procedures introduces significant variability, complicating direct comparisons between CGM systems and confounding the interpretation of performance data [44]. The physiological differences between blood compartments and technical variations in measurement methodologies create systematic biases that can exceed 5-10%, substantially impacting the observed accuracy of CGM devices [44]. This document establishes detailed application notes and experimental protocols for comparator measurement standards, supporting robust CGM methodology research aligned with recommendations from the International Federation of Clinical Chemistry and Laboratory Medicine Working Group on CGM (IFCC WG-CGM) [44] [19].
Sample Origin and Handling Standards
Physiological Basis for Sample Type Selection
Glucose concentrations differ physiologically between blood compartments due to metabolic activity and diffusion dynamics. Capillary blood generally exhibits higher glucose concentrations than venous blood, with average differences of 5% to 10% depending on the rate of glucose change [44]. Venous blood typically shows lower concentrations due to tissue extraction of glucose. Arterialized-venous blood, obtained by applying heat to the drawing site to arterialize venous blood, provides values intermediate between capillary and venous concentrations [44]. One recent study demonstrated that the difference between capillary and venous glucose concentrations of +5.9% could be reduced to +4.2% through arm heat application [44].
Table 1: Comparative Analysis of Sample Origins for CGM Performance Studies
| Sample Origin | Advantages | Disadvantages | Typical Glucose Concentration Relationship |
|---|---|---|---|
| Capillary | • Aligns with self-monitoring of blood glucose (SMBG) practices• Lower risk adverse events• Feasible in all age groups• Enables immediate results with blood glucose monitoring systems (BGMS) | • Repeated sampling painful• Limited sample volume• Compliance with analytical performance specifications may require two-step correction | Highest (reference point) |
| Venous | • Sufficient sample volume for laboratory analyzers• Single stick with indwelling line• Standard for clinical diagnostics | • Requires trained healthcare professionals• Higher invasiveness risk• Not feasible in free-living settings• Results display delayed | 5-10% lower than capillary |
| Arterialized-Venous | • Better alignment with capillary than venous• Maintains venous access advantages | • Heating procedure not standardized• Requires additional resources• Participant immobilization and burden | 4-5% lower than capillary |
IFCC WG-CGM Recommendations
The majority of IFCC WG-CGM members recommend capillary samples as the preferred sample origin in CGM performance studies [44]. This preference prioritizes clinical alignment with self-monitoring of blood glucose (SMBG), which represents the primary verification method for CGM users in real-world settings. Factory-calibrated CGM systems still require users to perform SMBG for manual calibration, confirmation of extreme readings, symptom discrepancy assessment, and signal loss situations [44]. This alignment is considered more impactful for end-users than alignment with venous glucose concentrations used in diabetes diagnosis and healthcare settings.
Analytical Methodology for Comparator Measurements
Comparator Device Specifications
Comparator devices must meet defined analytical performance specifications for bias and imprecision to ensure reliable reference values [44]. Key considerations include:
- Traceability: Devices should demonstrate traceability to higher-order reference methods, such as isotope dilution mass spectrometry (IDMS) [44]
- Methodology: Documented analytical methodology (glucose oxidase, hexokinase) with known interferents
- Consumables: Specific consumable batches and reagent lots must be documented throughout studies
- Sample Compatibility: Method validation for the specific sample type (capillary, venous whole blood, plasma)
The complete description of a comparator measurement procedure must include: device type (laboratory analyzer, blood gas analyzer, handheld analyzer), brand, analytical methodology, traceability chain, consumable batches/reagent lots, and sample handling procedures [44].
Retrospective Bias Correction
Comparator bias can be reduced through retrospective correction of comparator values based on measurements with a method or materials of higher metrological order [44]. This process involves:
- Regular validation of comparator device accuracy against certified reference materials
- Establishment of a correction factor based on deviation from reference values
- Application of the correction factor to all comparator measurements
- Documentation of uncertainty introduced by the correction process
For blood glucose monitoring systems (BGMS) used as comparators, fulfilling analytical performance specifications may require a two-step correction process if higher-order reference materials cannot be used directly with the device [44].
Experimental Protocol for CGM Performance Studies
Sample Collection and Handling Protocol
Materials Required:
- Approved blood collection equipment (lancets, venipuncture supplies)
- Indwelling venous catheter (for venous/arterialized-venous sampling)
- Heating pad or chamber (for arterialized-venous sampling)
- Appropriate sample containers with glycolytic inhibitors
- Documented comparator device with sufficient test strips/reagents
Procedure:
- Participant Preparation: Standardize participant preparation including fasting status, medication use, and activity level before testing
- Sampling Site Preparation:
- For capillary samples: Clean fingerstick site with alcohol, allow to dry, use appropriate lancet
- For venous samples: Place indwelling intravenous catheter, ensure patency
- For arterialized-venous samples: Apply heating pad to arm/hand for minimum 10 minutes before sampling, maintain temperature throughout procedure
- Sample Collection:
- Collect samples at 15-minute intervals for 6-8 hours during beginning, middle, and end of sensor lifetime [44]
- Obtain sufficient sample volume for comparator device requirements (minimum 25 μL for many laboratory analyzers)
- For venous samples, discard initial 0.5-1 mL to clear line, then collect sample
- Sample Handling:
- Process samples according to comparator device specifications
- For plasma separation, centrifuge immediately at recommended conditions
- Analyze samples promptly or preserve according to stability specifications
- Documentation:
- Record exact sampling time relative to CGM readings
- Document sample appearance, handling issues, or deviations
- Record comparator device lot numbers, calibration status, and environmental conditions
Glucose Excursion Protocol
To ensure clinically relevant comparator data distribution, implement controlled glucose changes:
- Meal Challenge: Standardized meal consumption with macronutrient documentation
- Insulin Challenge: Controlled insulin administration under medical supervision (for hyperglycemic clamp)
- Exercise Challenge: Standardized physical activity to induce glucose changes
- Monitoring: Extend sampling during challenges to capture rapid glucose transitions
The resulting data should cover the clinically relevant concentration range (approximately 70-400 mg/dL) and rates of change (-3 to +3 mg/dL/min) [44].
Accuracy Assessment and Data Analysis
CGM Performance Metrics
The following metrics should be calculated for comprehensive CGM performance assessment:
- Mean Absolute Relative Difference (MARD): Primary accuracy metric
- Clarke Error Grid Analysis: Clinical accuracy assessment
- Rate-of-Change Analysis: Trend accuracy evaluation
- Hyperglycemia/Hypoglycemia Detection Accuracy: Sensitivity and specificity in critical ranges
Table 2: Manufacturer Trend Arrow Specifications and Clinical Implications
| Manufacturer | Rate of Change (mg/dL/min) | Trend Arrow Display | Projected 30-min Change (mg/dL) | Clinical Interpretation |
|---|---|---|---|---|
| Dexcom G6/G7 | <1 | → Horizontal | <30 | Stable |
| 1-2 | Single up | 30-60 | Moderate rise | |
| 2-3 | Double up | 60-90 | Rapid rise | |
| >3 | Triple up | >90 | Very rapid rise | |
| Medtronic 640G | 1-2 | Single up | 30-60 | Moderate rise |
| 2-3 | Double up | 60-90 | Rapid rise | |
| >3 | Triple up | >90 | Very rapid rise | |
| FreeStyle Libre | 1-2 | Single up | 30-60 | Moderate rise |
| >2 | Double up | >60 | Rapid rise | |
| Eversense | 0-1 | → Horizontal | <30 | Stable |
| 1-2 | Single up | 30-60 | Moderate rise | |
| >2 | Double up | >60 | Rapid rise |
Data adapted from Pleus et al. [45]
Comparator Alignment Considerations
Different CGM systems demonstrate varying alignment with blood compartments:
- Capillary-Aligned Systems: Dexcom G6/G7/One/One+, FreeStyle Libre 2 Plus/3 Plus, Accu-Chek SmartGuide [46]
- Venous-Aligned Systems: Medtronic Guardian 4 and Simplera [46]
- Mixed Alignment: Some systems may align between compartments
This alignment difference means the same Time in Range (TIR) percentage can represent different real glucose exposure on different CGM systems [46]. For accurate assessment, ensure CGM and reference method alignment to the same glucose compartment (both capillary or both venous-aligned).
Research Reagent Solutions and Materials
Table 3: Essential Research Materials for CGM Comparator Studies
| Item | Specification | Function/Application |
|---|---|---|
| Certified Reference Materials | NIST-traceable, clinically relevant concentrations | Establishing metrological traceability, validating comparator method accuracy |
| Glycolytic Inhibitors | Sodium fluoride/potassium oxalate mixtures | Preserving glucose concentration in samples before analysis |
| Control Materials | Multiple concentration levels covering measuring range | Daily verification of comparator method performance |
| Venous Access Supplies | Indwelling catheters, extension sets, flushing solutions | Obtaining repeated venous samples with minimal participant discomfort |
| Arterialization Equipment | Regulated heating pads, temperature monitors | Standardizing arterialized-venous sample collection |
| Capillary Blood Collection | Standardized lancets, capillary tubes | Consistent capillary sample collection volume and technique |
| Sample Containers | Appropriate volume, preservative type | Maintaining sample integrity during storage and transport |
Workflow Visualization
CGM Comparator Study Workflow
Blood-to-Interstitial Fluid Glucose Relationship
The integration of Continuous Glucose Monitoring (CGM) and Artificial Intelligence (AI) is revolutionizing diabetes research and therapeutic development. CGM devices provide high-frequency, temporal data on interstitial glucose levels, capturing glycemic variability and patterns that traditional point-in-time measurements (e.g., HbA1c, FPG) cannot [47]. Artificial Intelligence, particularly machine learning (ML) and deep learning (DL) models, leverages this dense data stream to move from descriptive monitoring to predictive analytics. This enables the forecasting of glycemic events, identification of pathophysiological subtypes, and optimization of intervention strategies, thereby providing a powerful methodology for precision medicine in diabetes [48] [49]. These applications are critical for researchers and drug development professionals aiming to define novel digital endpoints, stratify patient populations for clinical trials, and develop next-generation decision support tools.
Key Application Areas and Quantitative Evidence
Research into CGM-AI integration has yielded significant results across several predictive domains. The table below summarizes key findings and performance metrics from recent studies.
Table 1: Summary of Predictive Analytics Applications using CGM and AI
| Application Area | Key Findings/Model Performance | AI Model Used | Research Context |
|---|---|---|---|
| Glucose Prediction | RMSE of 19.49 ± 5.42 mg/dL for predicting current glucose without prior glucose trajectory data [50]. | Bidirectional LSTM with encoder-decoder architecture [50]. | Virtual CGM for scenarios with interrupted monitoring; uses life-log data (diet, activity) [50]. |
| Hypoglycemia Prediction | ROC-AUC: 0.88 (CI95: 0.77-0.94) for predicting TBR ≥1% on hemodialysis days [51]. | TabPFN (a transformer-based model) [51]. | Predicting level 1 hypoglycemia in high-risk patients with diabetes undergoing hemodialysis [51]. |
| Hyperglycemia Prediction | F1 score: 0.85 (CI95: 0.75-0.91); ROC-AUC: 0.87 (CI95: 0.78-0.93) for predicting TAR ≥10% [51]. | Logistic Regression [51]. | Predicting level 2 hyperglycemia in patients with diabetes undergoing hemodialysis [51]. |
| Metabolic Subtyping | Accuracy of ~90% for identifying subtypes of Type 2 diabetes (e.g., insulin resistance, beta-cell deficiency) from CGM data [52]. | Proprietary AI algorithm [52]. | Parsing physiological subtypes from CGM glucose patterns, enabling precise patient stratification [52]. |
Detailed Experimental Protocols
Protocol for a Virtual CGM and Glucose Level Inference
This protocol outlines the methodology for developing a deep learning model that infers glucose levels using life-log data, serving as a virtual CGM when physical device data is unavailable [50].
- Objective: To train a model that accurately infers current and future glucose levels based on life-log data (food intake, physical activity) without relying on prior glucose measurements during the inference step.
- Data Acquisition & Preprocessing:
- Subjects: Recruit adult subjects (>18 years) without a diabetes diagnosis. Example: n=171 healthy adults [50].
- CGM Data: Collect glucose measurements from a CGM device (e.g., Dexcom G7) at regular intervals (e.g., every 15 minutes) [50].
- Life-log Data: Collect via smartphone apps and smartwatches. Data includes:
- Dietary Intake: Manually entered food logs with details on calories, carbohydrates, sugar, fat, protein, and timestamps.
- Physical Activity: MET (Metabolic Equivalent of Task) values and step counts from wearables; exercise type and duration from manual logs.
- Data Wrangling: Synchronize CGM and life-log data timestamps. Handle missing data via imputation or exclusion. Extract subsequences using a sliding-window technique.
- Model Architecture & Training:
- Model: Implement a Bidirectional Long Short-Term Memory (LSTM) network with an encoder-decoder structure.
- Input Features: Temporal sequences of life-log data (nutrients, MET, steps, time of day).
- Output: Current or future predicted glucose value.
- Training: Use encoder's hidden state as a latent representation of the input sequence. The decoder uses this state to generate the glucose prediction. Employ correlation coefficient, Root Mean Squared Error (RMSE), and Mean Absolute Percentage Error (MAPE) as loss functions and performance metrics [50].
- Validation: Evaluate model performance on a held-out test set of sequences not used during training. Perform ablation studies to test the contribution of different input features (e.g., masking food or activity data) [50].
Protocol for Predicting Glycemic Excursions in Hemodialysis Patients
This protocol details the use of machine learning to predict significant hypo- and hyperglycemia within 24 hours of hemodialysis (HD) initiation, a period of high glycemic variability [51].
- Objective: To develop classification models that predict Time Above Range (TAR) ≥10% and Time Below Range (TBR) ≥1% on days of hemodialysis.
- Study Population: Patients with either type 1 or type 2 diabetes mellitus who are receiving chronic HD and are treated with insulin. Example: n=21 patients [51].
- Data Collection:
- CGM Data: Use a CGM system (e.g., Dexcom G6) to collect continuous glucose readings.
- Clinical Variables: Collect HbA1c levels and insulin dosages administered prior to dialysis.
- Modelling Framework:
- Segmentation: For each dialysis session, create a data instance where:
- Feature Segment: CGM-derived metrics (e.g., mean glucose, variability) and clinical data from the 24 hours preceding dialysis initiation.
- Prediction Segment: Glycemic outcome (TAR or TBR) calculated from the 24 hours following dialysis initiation.
- Feature Selection: Apply Recursive Feature Elimination with Cross-Validation (RFECV) to select the most predictive features.
- Model Training & Comparison: Train and compare multiple classification models, such as:
- Logistic Regression
- XGBoost (Extreme Gradient Boosting)
- TabPFN (a transformer model for tabular data)
- Hyperparameter Tuning: Optimize model parameters using a random search.
- Segmentation: For each dialysis session, create a data instance where:
- Evaluation: Assess model performance using F1 scores, ROC-AUC, and confidence intervals, with a focus on clinical utility for proactive intervention [51].
Visualization of Workflows
CGM-AI Research Workflow
This diagram illustrates the end-to-end pipeline for developing and applying CGM-AI predictive models in diabetes research.
Hemodialysis Day Prediction Logic
This diagram outlines the specific logic and data segmentation used to predict glycemic excursions on hemodialysis days.
The Scientist's Toolkit: Research Reagent Solutions
The following table lists essential materials, algorithms, and datasets required for conducting research in CGM and AI integration.
Table 2: Essential Research Tools for CGM and AI Integration Studies
| Item Name | Type | Function/Application in Research |
|---|---|---|
| Dexcom G6/G7 | CGM Device | Provides real-time, high-frequency interstitial glucose measurements for model training and validation. A standard data source in many clinical studies [50] [51]. |
| Bidirectional LSTM | Deep Learning Algorithm | A type of Recurrent Neural Network (RNN) ideal for capturing long-term, bidirectional dependencies in time-series data like CGM streams and life-logs [50] [48]. |
| XGBoost | Machine Learning Algorithm | A powerful gradient-boosting framework for tabular data, effective for classification and regression tasks, often used for feature importance analysis [51]. |
| TabPFN | Machine Learning Algorithm | A transformer-based model designed for tabular data that provides fast, high-quality predictions without hyperparameter tuning, useful for small to medium-sized datasets [51]. |
| Life-log Data | Dataset | Multimodal data encompassing dietary intake (nutrients, timing) and physical activity (METs, steps). Serves as a critical input for contextualizing glucose predictions and developing virtual CGM [50]. |
| SHAP (Shapley Additive Explanations) | Software Library | A method for interpreting the output of complex ML models, helping researchers understand which features (e.g., carbs, exercise) drive a specific prediction, thereby building trust and facilitating insight [48]. |
Optimizing CGM Data Quality: Technical Challenges, Interference Factors, and Mitigation Strategies
Continuous Glucose Monitoring (CGM) systems represent a significant technological advancement in the management of diabetes, providing real-time insights into glucose fluctuations by measuring levels in the interstitial fluid [53] [54]. For researchers and scientists engaged in the development and refinement of these systems, a deep understanding of their common failure modes is paramount. This document details prevalent technical failures, categorizing them into sensor performance issues and software design considerations. It provides structured data and experimental protocols to facilitate rigorous methodology research, supporting the creation of more robust and reliable CGM systems.
Sensor Performance Issues
The core of a CGM system is its biosensor, whose performance can be compromised by various biochemical, manufacturing, and user-induced factors.
Biochemical Interferences
A primary challenge for CGM sensors is achieving high specificity for glucose in the complex chemical environment of the interstitial fluid. Electrochemical sensors are susceptible to interference from substances that oxidize at similar potentials to the enzyme-generated signal [55].
Table 1: Common Biochemical Interferences in CGM Systems
| Interfering Substance | Example Sources | Impact on CGM Reading | Relevant CGM Systems | Mechanism |
|---|---|---|---|---|
| Acetaminophen [55] | Pain and fever medications (e.g., Tylenol) | Falsely elevated glucose readings [55] | Older Generation Systems (e.g., G5); modern systems have mitigation strategies [55] | Direct oxidation at the electrode surface [55] |
| Hydroxyurea [55] | Chemotherapy, sickle cell anemia treatments (e.g., Hydrea) | Falsely elevated glucose readings [55] | Dexcom G6 [55] | Identified via post-market surveillance; mechanism involves oxidation at the sensor [55] |
| Ascorbic Acid (Vitamin C) [55] | Dietary supplements, fruits, vegetables | Falsely elevated glucose readings [55] | Abbott FreeStyle Libre 2 [55] | Oxidation at the sensor electrode; a study showed a max. avg. deviation of +9.3 mg/dL after a 1g dose [55] |
Manufacturing and Validation Failures
Regulatory inspections have identified critical failures in manufacturing process controls and validation. A recent FDA warning letter to a leading CGM manufacturer highlights specific deficiencies [56].
Failure 1: Inadequate Monitoring and Control of Validated Processes
The (b)(4) functional acceptance testing for glucose sensors uses specific concentrations of glucose and acetaminophen to challenge the devices. However, procedures failed to adequately monitor and control these concentrations during production runs. For instance, glucose concentration in test dishes was not monitored throughout production, despite known risks of fluctuation from evaporation, carry-over, and spillage [56]. Furthermore, acetaminophen concentration was not monitored during manufacturing, and no acetaminophen bias monitoring was conducted for G7 devices [56].
Failure 2: Inadequate Process Validation
The validation of the (b)(4) test method itself was deficient. The test method validation documented results as pass/fail rather than recording measured results, failing to demonstrate the method's repeatability or reproducibility [56]. The firm also neglected to incorporate the known measurement uncertainty of the (b)(4) system into the acceptance criteria, risking the acceptance of nonconforming sensors [56].
Failure 3: Inadequate Design Inputs
Design control activities were not fully aligned with regulatory requirements. The design inputs did not clearly define all special controls for integrated CGM systems, such as manufacturing controls and acceptance criteria for the (b)(4) system for slope and Mean Absolute Relative Difference (MARD) [56]. There was also a failure to document design input requirements for the expected performance over the device's full 10.5-day lifetime [56].
Physiologic and User-Induced Errors
Compression Lows: This phenomenon occurs when a user applies direct pressure on the sensor site (e.g., by sleeping on it). The pressure affects the interstitial fluid dynamics, leading the sensor to report falsely low glucose readings [57].
Sensor Placement and Adhesion: Proper sensor function is highly dependent on correct insertion and secure adhesion for the entire wear period. User errors during insertion and issues with adhesive failure are two of the most common reasons for CGM data disruption [57].
Software Design Considerations
The software components of a CGM system, from the embedded algorithm to the user-facing application, are critical for transforming raw sensor data into clinically actionable information.
Data Analysis and Algorithmic Limitations
Over-reliance on Traditional Summary Statistics: Current clinical practice largely relies on traditional metrics like Time-in-Range (TIR), Glucose Management Indicator (GMI), and the coefficient of variation [58] [59]. While simple to understand, these metrics oversimplify complex, dynamic glucose patterns and lack the granularity to capture nuanced temporal trends or specific pathophysiologic phenotypes [58].
The Promise of Advanced Analytics: Emerging methodologies, termed "CGM Data Analysis 2.0," leverage Functional Data Analysis (FDA) and Artificial Intelligence/Machine Learning (AI/ML) [58].
- Functional Data Analysis treats the CGM data stream as a continuous mathematical function, enabling a more sophisticated analysis of temporal dynamics, such as differentiating weekday versus weekend patterns or identifying distinct postprandial phenotypes [58].
- AI/ML algorithms can predict future glycemic trends and, when integrated with other data streams (e.g., insulin dose, food intake), can power automated therapeutic interventions like closed-loop insulin delivery systems [58].
Table 2: Comparison of CGM Data Analysis Methods
| Method | Approach | Data Used | Purpose | Limitations |
|---|---|---|---|---|
| Traditional Statistics (CGM 1.0) [58] | Summary statistics and visual pattern analysis | Aggregated metrics (e.g., mean glucose, %TIR) | Identify obvious trends and patterns for clinical use | Oversimplifies dynamics; misses subtle patterns [58] |
| Functional Data Analysis [58] | Models the entire CGM time series as a random function | Each CGM trajectory as a continuous function | Quantify and model complex glucose dynamics | Requires statistical expertise; more complex to implement [58] |
| Machine Learning / AI (CGM 2.0) [58] | Predictive modeling using advanced algorithms | Large CGM datasets, often integrated with EHR, lifestyle, or genomic data | Predict glucose levels, classify metabolic subphenotypes, optimize therapy | Requires large datasets; potential issues with data privacy, model bias, and transparency [58] |
Data Integrity and Presentation Failures
Software-related failures can also manifest in data presentation and user interaction.
- Calibration Errors: User over-calibration of sensors, especially when based on inaccurate fingerstick values, can introduce errors rather than correct them, as the algorithm incorporates this "garbage" input [57].
- Configuration Errors: Users may incorrectly adjust target glucose ranges (e.g., setting an inappropriately narrow Time-in-Range), leading to misleading data summaries and excessive alerts [57].
- Data Gaps and Connectivity Issues: While less common with modern real-time CGMs, failures in Bluetooth connectivity or sensor communication can still result in significant data gaps, compromising the continuity of glucose monitoring [57].
Experimental Protocols for Failure Analysis
Protocol: In Vitro Interference Testing
Objective: To quantitatively assess the impact of known and potential interfering substances on CGM sensor accuracy.
Materials:
- Test CGM Sensors: Multiple lots of the CGM sensor to be evaluated.
- Reference Analyzer: A clinical-grade benchtop analyzer (e.g., Yellow Springs Instrument Life Sciences 2300 STAT Plus) [55].
- Glucose Solution Base: Prepared at multiple clinically relevant concentrations (e.g., hypoglycemic: 70 mg/dL, euglycemic: 100 mg/dL, hyperglycemic: 250 mg/dL).
- Interferent Stock Solutions: High-purity solutions of potential interferents (e.g., Acetaminophen, Ascorbic Acid, Hydroxyurea) [55].
- In Vitro Test Setup: A controlled environment (e.g., temperature-controlled bath) with fixtures to hold sensors and maintain solution homogeneity.
Methodology:
- Baseline Measurement: Immerse sensors in the glucose solution base without interferents. Record readings from both the CGM sensors and the reference analyzer every 5-10 minutes until stable.
- Introduction of Interferent: Spike the solution with the interferent stock to achieve a target plasma concentration, considering typical pharmacokinetics (e.g., a peak plasma concentration of ~10 µg/mL for a 500mg acetaminophen dose) [55].
- Continuous Monitoring: Continue simultaneous CGM and reference measurements for a period that covers the expected pharmacokinetic profile of the interferent (e.g., 4-6 hours).
- Data Analysis: Calculate the difference (bias) between the CGM reading and the reference value at each time point. The maximum average deviation observed after interferent introduction is a key metric [55].
Protocol: Test Method Validation for Manufacturing
Objective: To validate a manufacturing test method, ensuring it is capable of producing repeatable and reproducible results.
Materials:
- Sensors: A defined number of sensor units from a single production lot.
- Test Equipment: The manufacturing test system to be validated (e.g.,
(b)(4)system). - Operators: Multiple trained operators to perform the testing.
Methodology:
- Experimental Design: Employ a gage Repeatability and Reproducibility (gage R&R) study design. A minimum of
(b)(4)sensors should be tested by(b)(4)different operators, with each operator testing each sensor multiple times [56]. - Data Collection: Crucially, the raw, continuous output of the test must be recorded (e.g., the measured glucose slope value), not just a pass/fail result [56].
- Statistical Analysis: Analyze the data to quantify:
- Repeatability: The variation in measurements when one operator measures the same sensor multiple times.
- Reproducibility: The variation in measurements introduced by different operators.
- Overall Measurement System Variation: The combined repeatability and reproducibility error. This variation must be incorporated into the final product acceptance criteria to prevent the acceptance of nonconforming units [56].
Research Toolkit: Essential Reagents and Materials
Table 3: Key Research Reagent Solutions for CGM Failure Analysis
| Item | Function/Application in Research |
|---|---|
| Acetaminophen (High Purity) [55] | A positive control for electrochemical interference studies; used to test the efficacy of permselective membranes and algorithm-based mitigation strategies. |
| L-Ascorbic Acid (High Purity) [55] | A key interferent for assessing the specificity of the sensor's electrochemical system and for validating the selectivity of low-potential sensor designs. |
| Hydroxyurea (High Purity) [55] | A critical reagent for post-market surveillance studies and for investigating interference mechanisms identified through clinical observation. |
| Permselective Membranes [55] [54] | Research into advanced membrane materials (e.g., polyurethanes, Nafion) that block interferents based on size, charge, or hydrophilicity is a core area for improving sensor specificity [55] [54]. |
| Glucose Oxidase / Other Enzymes [54] | The fundamental biorecognition element. Research focuses on enzyme immobilization techniques, stability enhancement, and alternative enzymes to improve sensor lifetime and performance [54]. |
| Stabilized Glucose Solutions [56] | Used for in vitro calibration and accuracy testing of sensors under controlled conditions, free from physiological variables. |
Workflow and System Diagrams
CGM Sensor Interference Pathway
CGM Data Analysis Evolution
The analytical performance of continuous glucose monitoring (CGM) systems is paramount for diabetes management, particularly in research settings and drug development where precise glucose measurements inform study outcomes. A significant challenge in this domain involves measurement interferents—substances or physiological factors that can compromise CGM accuracy [60] [61]. Understanding these interferents is critical for researchers designing clinical trials, interpreting CGM-derived endpoints, and developing new pharmaceuticals that may interact with glucose sensing technologies. The issue is further complicated by polypharmacy, common in populations with type 2 diabetes, where multiple concomitant medications increase the risk of interference [60]. This application note synthesizes current knowledge on CGM interferents, providing researchers with standardized protocols for interference testing and frameworks for mitigating confounding effects in clinical studies.
CGM Technology Classifications and Interference Mechanisms
Continuous glucose monitors employ diverse sensing principles, each with distinct vulnerability profiles to interference. Categorizing these technologies is the first step in understanding potential interferents.
Minimally invasive electrochemical CGMs dominate the current market and can be classified into generations based on their electron transfer mechanism [61]. First-generation sensors typically rely on the detection of hydrogen peroxide produced by the glucose oxidase (GOx) enzyme reaction and are susceptible to electroactive substances that oxidize at a similar potential. Second-generation systems incorporate mediators to shuttle electrons, potentially reducing interference from some electroactive species but introducing vulnerability to substances affecting the mediator. Third-generation designs aim for direct electron transfer between the enzyme and electrode. Additionally, implantable optical CGMs, such as the Senseonics Eversense system, use a fluorescence-based mechanism involving a boronic acid-containing hydrogel, making them susceptible to optical interferences and substances affecting the hydrogel matrix [61].
The following diagram illustrates the core signaling pathways and interference points for the primary CGM sensor types.
A simplified view of the core signaling pathways and primary interference points (marked with red octagons) in major CGM types.
Key Interference Mechanisms
- Electrochemical Competition: Exogenous or endogenous electroactive species (e.g., acetaminophen, uric acid) can be oxidized at the electrode surface, generating a current that is indistinguishable from the glucose-derived signal, leading to false elevations in reported glucose values [60] [61].
- Enzyme Interaction: Substances that alter the kinetics of the glucose oxidase enzyme or compete with glucose for the enzyme's active site can directly impact the sensor's core measurement principle.
- Sensor Fouling/Passivation: Proteins, lipids, or other compounds can adsorb to the sensor membrane or electrode, progressively reducing sensitivity and signal amplitude over the sensor's wear period. This is a particular concern for long-term implantable sensors [60].
- Optical Interference: For fluorescent-based sensors, substances that absorb light at the excitation or emission wavelengths, or that quench fluorescence, can directly interfere with the optical signal [61].
- Physiological and Matrix Effects: Changes in interstitial fluid (ISF) composition—such as pH shifts, electrolyte imbalances (e.g., during diabetic ketoacidosis), or local inflammation at the sensor insertion site—can alter sensor performance independently of glucose concentration [60].
Established and Potential CGM Interferents
The following tables consolidate documented and potential interferents based on current literature and manufacturer disclosures. It is critical to note that interference effects are often CGM model-specific due to differences in sensor chemistry and membrane architecture.
Table 1: Exogenous Substances with Documented or Potential CGM Interference Effects
| Substance Class | Example Compounds | Reported Effect & Directionality | CGM Systems Affected (Examples) | Proposed Mechanism |
|---|---|---|---|---|
| Analgesics | Acetaminophen (Paracetamol) | False elevation of glucose readings [62]. Dose-dependent (>4g/day for Dexcom G6/G7; any dose for Medtronic Guardian) [62]. | Dexcom G4-G7, Medtronic Guardian 3/4 [62] | Electroactive interference; oxidation at electrode potential. |
| Acetylsalicylic Acid (Aspirin) & Metabolites (Salicylic Acid, Gentisic Acid) | Potential interference from metabolites [60]. | Various (model-specific) | Metabolites are electroactive; sensor fouling reported in vitro [60]. | |
| Immunosuppressants / Chemotherapeutics | Hydroxyurea | Documented interference [62]. | Dexcom G4-G7, Medtronic Guardian 3/4 [62] | Mechanism not fully elucidated; potential electrochemical interaction. |
| Dietary Supplements | Vitamin C (Ascorbic Acid) | False elevation of glucose readings at high doses (>500 mg/day for Libre 2/3; >1000 mg/day for Libre 2 Plus) [62]. | FreeStyle Libre 2, Libre 3, Libre 2 Plus [62] | Electroactive interference; oxidation at electrode potential. |
| L-Cysteine, Dithiothreitol | Apparent in vitro electrochemical fouling [60]. | Reported in vitro for G6 system [60] | Sulfhydryl groups may passivate electrode surfaces. | |
| Other Medications | Mesalazine, Isoascorbic Acid | Potential interference based on in vitro data [60]. | Various (model-specific) | Electroactive interference or fouling. |
Table 2: Endogenous Substances and Physiological Factors with Interference Potential
| Factor Category | Specific Factor | Impact on CGM Performance | Notes for Researchers |
|---|---|---|---|
| Endogenous Molecules | Uric Acid | Potential electroactive interference [60]. | Levels may fluctuate with renal function or diet. |
| Various Amino Acids (e.g., L-cysteine) | Potential fouling of electrode surfaces [60]. | — | |
| Metabolic States | Diabetic Ketoacidosis (DKA) | Significant changes in ISF pH and electrolyte balance may impact CGM performance [60]. | Confounding factor in studies involving metabolic crises. |
| Hypoxia / Ischemia | May affect glucose transport and sensor function. | — | |
| Local Tissue Response | Biofouling | Protein adsorption, tissue encapsulation, and immune responses can degrade signal over sensor wear period [60]. | A key variable in long-term sensor studies. |
| Insertion Trauma | Local inflammation can cause transient signal instability post-insertion. | Data from the first 24 hours is often less reliable [2]. | |
| Physiological Lag | Blood-to-Interstitium Glucose Kinetics | CGM readings lag behind blood glucose by 5-15 minutes, most pronounced during rapid glucose changes [62] [2]. | Critical to consider when correlating CGM with venous blood draws or clinical events. |
Experimental Protocols for Interference Assessment
Standardized methodologies are essential for robust evaluation of potential interferents in both development and research contexts. The following protocols outline in vitro and in vivo approaches.
In Vitro Screening Protocol for Potential Interferents
Objective: To rapidly screen substances for potential interference with CGM systems under controlled conditions, isolating the chemical effect from physiological variables.
Materials:
- Test CGM Systems: Multiple sensors from at least one production lot.
- Interferent Stock Solutions: Prepare high-purity compounds in surrogate ISF or specified buffer.
- Surrogate Interstitial Fluid: A solution matching key parameters of ISF (ionic strength, pH ~7.4, common electrolytes) [60].
- Glucose Stock Solution: For spiking to desired physiological levels (e.g., 80, 140, 250 mg/dL).
- Controlled Environment Chamber: To maintain stable temperature (e.g., 37°C) and humidity.
- Reference Analyzer: A laboratory-grade instrument (e.g., YSI) for validating solution glucose concentrations.
Methodology:
- Baseline Establishment: Immerse CGM sensors in surrogate ISF with a stable baseline glucose concentration (e.g., 100 mg/dL). Record sensor signals until stable.
- Interferent Challenge: Introduce the test substance at specified concentrations. Recommended test levels include:
- Maximum Therapeutic Level: Based on blood plasma concentrations.
- Supra-Therapeutic Level: e.g., 2-3x maximum therapeutic level to assess safety margin.
- Suggested High-End Concentrations: Refer to CLSI EP07 guidelines for initial targets [61].
- Data Collection: Continuously monitor and record CGM output for a defined period (e.g., 60-120 minutes) post-challenge.
- Control Measurement: Simultaneously test control solutions (surrogate ISF with identical glucose levels but no interferent).
- Data Analysis: Calculate the bias between the test (interferent-present) and control CGM values. Apply acceptance criteria such as those from ISO 15197, where a bias exceeding ±10 mg/dL at glucose <100 mg/dL or ±10% at glucose ≥100 mg/dL indicates significant interference [61].
- Sensor Fouling Assessment: For substances suspected of fouling, perform repeated challenges over an extended period (e.g., 7-10 days) to simulate cumulative in vivo effects [60].
Limitations: In vitro testing may not account for in vivo metabolism of the substance (e.g., prodrug conversion to an active interferent), protein binding, or pharmacokinetic differences between blood and ISF [60].
In Vivo Confirmation Study Protocol
Objective: To confirm interference observed in vitro and assess its clinical relevance in a human subject model, accounting for physiological complexities.
Study Design: Controlled, single-dose or short-course administration of the test substance to healthy volunteers or patients with diabetes wearing the CGM system of interest.
Methodology:
- Subject Preparation & Sensor Insertion: Insert CGM sensors according to manufacturer instructions in qualified subjects. Allow for a run-in period (e.g., 24 hours) for sensor stabilization.
- Baseline Period: Establish baseline CGM glucose and collect frequent venous blood samples for reference glucose measurement (e.g., every 15-30 minutes) over a stable period.
- Interferent Administration: Administer a single dose of the test substance. Dosing should be selected to achieve therapeutic or supra-therapeutic plasma levels.
- Pharmacokinetic Sampling: Collect serial blood samples to determine plasma concentrations of the test substance and its major metabolites over time.
- Paired Data Collection: Continue frequent paired CGM and reference blood glucose measurements throughout the study period, capturing the absorption, peak, and elimination phases of the test substance.
- Microdialysis (Optional): In a subset of subjects, employ in vivo microdialysis to directly measure the concentration of the test substance in the ISF, as significant differences from plasma concentrations can occur [60].
- Data Analysis: Use statistical methods (e.g., regression analysis, Clarke Error Grid) to compare CGM values with reference values. Correlate the magnitude of CGM error with the plasma/ISF concentration of the test substance.
The workflow for this comprehensive assessment is outlined below.
A proposed workflow for the comprehensive assessment of a substance's potential to interfere with CGM performance, integrating in vitro and in vivo phases.
The Scientist's Toolkit: Research Reagent Solutions
Table 3: Essential Materials for CGM Interference Research
| Item | Function/Application in Research |
|---|---|
| Surrogate Interstitial Fluid | A chemically defined medium for in vitro testing, mimicking the ionic composition and pH of native ISF, allowing for controlled interferent introduction without biological variability [60]. |
| Microdialysis System | For direct sampling of ISF in human or animal studies to quantify the pharmacokinetic profile of interferents in the target matrix of CGM devices, providing crucial data often missing from manufacturer studies [60]. |
| Reference Glucose Analyzer | A high-precision instrument (e.g., based on glucose oxidase or hexokinase methods) serving as the gold standard for validating glucose concentrations in both in vitro solutions and blood samples during in vivo studies. |
| Electrochemical Workstation | For characterizing bare electrode behavior and studying fundamental interferent interactions (e.g., passivation, oxidation potentials) independent of commercial CGM membranes and algorithms. |
| CLSI EP07 Guidelines | Provides a standardized framework for interference testing, including suggested concentrations for common interferents, helping to ensure study comparability and regulatory alignment [61]. |
The identification and management of CGM measurement interferents remain a critical, yet incompletely characterized, aspect of diabetes technology research. The current landscape is marked by model-specific vulnerabilities and a lack of standardized, comprehensive testing requirements specific to the ISF environment [60] [61]. For researchers and drug developers, a proactive approach is essential. This includes conducting rigorous pre-study interference screening for new chemical entities, carefully documenting concomitant medications in clinical trial populations, and implementing protocols for verifying unexpected CGM readings with reference methods.
Future progress hinges on collaborative efforts to establish standardized CGM assessment procedures, including metrological traceability and validated analytical performance metrics. The ongoing work by organizations like the IFCC and ISO to develop CGM-specific guidelines analogous to ISO 15197 for blood glucose monitoring is a pivotal step in this direction [61]. Until such standards are fully realized, the protocols and data summarized in this application note provide a foundational framework for designing robust studies and critically evaluating CGM data in the context of potential interference.
Strategies for Managing Sensor Accuracy Variability During Initial Warm-up Periods
The initial warm-up period following sensor insertion is a recognized source of accuracy variability in continuous glucose monitoring (CGM) systems. During this phase, which typically spans the first several hours to 24 hours, the sensor electrode equilibrates with the subcutaneous interstitial fluid, a process often accompanied by local micro-trauma and inflammation that can temporarily alter glucose bioavailability for detection [63]. This variability poses a significant challenge for clinical research and drug development, where precise and reliable glucose data are paramount. This document outlines standardized protocols for characterizing, managing, and mitigating warm-up period variability to enhance data quality in clinical trials and scientific studies.
Quantitative Characterization of Warm-up Variability
The following tables summarize the key quantitative findings on sensor accuracy and variability during the initial warm-up period, based on current literature.
Table 1: Trend Accuracy During and After Warm-up (Dexcom G6 in ICU Patients)
| Time Period | DTS-TAM Trend Risk Category (Mild-to-Moderate) | Number of Trend Pairs Analyzed |
|---|---|---|
| First 24 hours | 2.9% | Not Specified |
| Beyond 24 hours | 0.9% | Not Specified |
Source: Adapted from a 2025 study analyzing trend accuracy versus arterial blood gas measurements in critically ill patients [64].
Table 2: Within-Person Variability of CGM Metrics Over a 3-Month Period
| CGM Metric | Within-Person Coefficient of Variation (CVw) - Abbott Libre Pro | Within-Person Coefficient of Variation (CVw) - Dexcom G4 |
|---|---|---|
| Mean Glucose | 17.4% | 14.2% |
| Percent Time-in-Range | 20.1% | 18.6% |
Source: Data from a secondary analysis of the HYPNOS randomized clinical trial in adults with type 2 diabetes [65]. This demonstrates the inherent biological and sensor variability over time, which is often heightened during the initial warm-up.
Experimental Protocol for Characterizing Warm-up Accuracy
This protocol provides a methodology for quantifying the accuracy profile of a CGM sensor during its initial warm-up period in a clinical research setting.
Objective: To assess the point and trend accuracy of a CGM sensor during the first 24 hours post-insertion against a reference method.
3.1 Study Design
- Design: Prospective, single-arm, controlled study.
- Participants: Research subjects (with type 1 or type 2 diabetes, or normoglycemic, as required by the study objectives).
- CGM Device: The CGM system under investigation.
- Reference Method: Frequent venous or arterial blood sampling analyzed on a laboratory-grade glucose analyzer (e.g., YSI Stat Plus or blood gas analyzer). Capillary blood glucose testing with a calibrated, FDA-cleared blood glucose meter may be used as a supplementary reference.
3.2 Procedures
- Sensor Insertion: Insert the CGM sensor according to the manufacturer's instructions at Time T=0. Record the exact insertion time and location.
- Reference Sampling: Collect reference blood samples at the following schedule:
- T = 0, 15, 30, 45, 60, 75, 90, 105, 120 minutes post-insertion.
- Then hourly until T = 6 hours.
- Then at T = 12, 18, and 24 hours. At each sampling point, record the paired CGM glucose value. The time difference between the reference sample and the CGM reading should be minimized and documented.
- Data Collection: Collect all CGM data for the 24-hour period. Ensure the CGM device time is synchronized with the reference method timer.
3.3 Data Analysis
- Point Accuracy: Calculate the Mean Absolute Relative Difference (MARD) for the entire 24-hour period and for specific sub-periods (e.g., 0-6h, 6-12h, 12-24h).
- Clinical Accuracy: Analyze data using the Surveillance Error Grid (SEG) or Consensus Error Grid to assess clinical risk.
- Trend Accuracy: Analyze paired rate-of-change (ROC) data using the Rate Error Grid Analysis (R-EGA) and the Diabetes Technology Society Trend Accuracy Matrix (DTS-TAM) [64].
- Statistical Comparison: Compare MARD and other accuracy metrics between the sub-periods (e.g., 0-6h vs. 12-24h) using appropriate statistical tests (e.g., Wilcoxon signed-rank test) to determine if accuracy significantly improves after the warm-up phase.
Workflow Diagram
The following diagram illustrates the logical workflow of the experimental protocol for characterizing sensor warm-up accuracy.
Mitigation Strategies and Data Handling Protocols
Based on the characterized variability, the following mitigation strategies are recommended for clinical trials.
4.1 Sensor Data Handling in Clinical Trials
- Sensor Run-in Period: Consensus statements recommend excluding data from the first 24 hours after sensor insertion from the final analysis of primary and secondary endpoints to avoid the period of highest variability [63].
- Consistent Device Use: Employ the same CGM device model across all study participants in both intervention and control groups to ensure the warm-up bias is consistent and analyzable [63].
- Blinded CGM Use: In studies recruiting CGM-naive participants, the use of blinded CGM at specified data collection timepoints can prevent user behavior changes based on potentially less accurate early data, thereby more purely revealing the efficacy of the investigational product [63].
4.2 Protocol-Driven Sensor Management
- Pre-planned Sensor Replacement: Stagger sensor insertions such that the warm-up period for a new sensor occurs before a critical data collection visit. For example, insert a new sensor 24 hours prior to the start of a formal study observation period.
- Standardized Sensor Placement: Ensure consistent anatomic placement of sensors across all study participants, as location can influence performance.
- Documentation: Meticulously document all sensor insertion and removal times, as well as any sensor errors or signal dropouts during the warm-up period.
Mitigation Strategy Diagram
The following diagram outlines the logical relationship between the sources of warm-up error and the proposed mitigation strategies.
The Scientist's Toolkit: Research Reagent Solutions
Table 3: Essential Materials and Reagents for Warm-up Accuracy Studies
| Item | Function/Application in Protocol |
|---|---|
| CGM System under Investigation | The primary device whose warm-up characteristics are being quantified. Multiple lots should be used if possible. |
| Laboratory Glucose Analyzer (e.g., YSI 2300 STAT Plus) | Provides the high-precision reference method for blood glucose measurement against which CGM accuracy is judged. |
| Arterial or Venous Blood Sampling Kit | For obtaining the reference blood samples with minimal patient discomfort and contamination risk. |
| Certified Reference Materials for Glucose | Used for daily calibration and validation of the laboratory glucose analyzer to ensure reference data integrity. |
| Standardized Phlebotomy and Aseptic Technique Supplies | Ensures consistency and safety of the reference blood sampling procedure across all study participants. |
| Data Management Platform (e.g., Glooko, Tidepool) | Facilitates the standardized collection, aggregation, and blinded analysis of large volumes of CGM data from multiple subjects. |
Continuous Glucose Monitoring (CGM) systems have revolutionized diabetes management by providing real-time, dynamic glucose measurements, enabling both patients and healthcare providers to make more informed treatment decisions [47]. These systems generate vast amounts of continuous data through sensors that measure glucose levels in interstitial fluid, typically at 5-minute intervals, producing up to 288 readings daily [2]. However, the transition from carefully controlled clinical studies to real-world data collection and analysis has exposed significant challenges in data integrity, particularly concerning signal dropouts and compression artifacts that can compromise the reliability of glycemic metrics [16].
Signal dropouts refer to temporary interruptions in data acquisition, resulting in missing glucose values and gaps in the continuous glucose profile. These dropouts can occur due to various factors including sensor displacement, connectivity issues between transmitter and receiver, electromagnetic interference, or physiological factors affecting sensor function. Compression artifacts, on the other hand, manifest as distortions in the glucose signal that may arise from data processing algorithms, storage limitations, or transmission errors between system components. Both phenomena pose significant threats to data quality, potentially leading to inaccurate clinical decisions, flawed research conclusions, and inappropriate diabetes management strategies [16] [66].
The integrity of CGM data is particularly crucial for applications in drug development and clinical research, where precise glycemic measurements form the basis for evaluating therapeutic efficacy and safety. As CGM systems become increasingly integrated into large-scale electronic health record systems and research data warehouses, establishing robust protocols for identifying and addressing these data integrity issues has become a methodological priority [16]. This document outlines standardized approaches for detecting, quantifying, and mitigating signal dropouts and compression artifacts in CGM data, with specific focus on methodologies relevant to research and pharmaceutical development contexts.
Quantitative Characterization of Data Integrity Issues
Incidence and Impact of Data Anomalies
Recent studies have systematically quantified the prevalence and clinical impact of data integrity issues in real-world CGM datasets. A 2025 analysis of CGM data from 2,038 patients revealed that approximately 25.9% (n = 528) exhibited some form of data duplication or corruption, with an average of 129 anomalous observations per affected profile, representing nearly 11 hours of compromised data over a standard two-week monitoring period [16]. The table below summarizes the incidence rates of various data integrity issues identified in contemporary CGM research:
Table 1: Incidence and Characteristics of CGM Data Integrity Issues
| Issue Type | Prevalence | Average Observations Affected | Clinical Impact |
|---|---|---|---|
| Signal Dropouts | 15-20% of profiles [66] | 8-12% of expected values [48] | Gaps in glucose trends, missed hypoglycemic events |
| Compression Artifacts | 10-15% of profiles [66] | 5-8% of values [48] | Flattened peaks, distorted variability metrics |
| Duplication Errors | 25.9% of profiles [16] | 129 observations per profile [16] | Inaccurate glycemic variability assessment |
| Time-Shift Artifacts | 8-12% of profiles [16] | Varies by shift magnitude | Misalignment with behavioral data |
The clinical significance of these data integrity issues is substantial. Research has demonstrated that uncorrected data anomalies can lead to meaningful differences in key glycemic metrics, with 25.7% of affected patients showing significant differences in at least one primary metric (Time in Range, Coefficient of Variation, Glycemic Management Indicator, or glycemic episode counts) after data processing [16]. Perhaps more importantly, 11 patients in one study crossed clinically meaningful thresholds in one or more metrics after data correction, highlighting the potential for data integrity issues to directly impact clinical interpretation and decision-making [16].
Performance Metrics for Integrity Monitoring
The evaluation of data integrity protocols requires standardized metrics to quantify performance across different detection and correction methodologies. The following table outlines key performance indicators used in CGM data quality assessment:
Table 2: Performance Metrics for Data Integrity Assessment
| Metric | Calculation | Target Value | Clinical Relevance |
|---|---|---|---|
| Mean Absolute Relative Difference (MARD) | Average absolute difference between reference and CGM values, divided by reference [2] | 7.9-9.5% (outpatient) [2] | Overall system accuracy |
| Data Sufficiency | Percentage of expected values captured [16] | ≥70% over 14 days [16] | Reliability for clinical decisions |
| Gap Frequency | Number of data interruptions per day | <3 episodes/day [66] | Continuous monitoring capability |
| Pattern Consistency | Concordance between adjacent segments | ≥90% continuity [48] | Trend reliability |
| Clarke Error Grid A-Zone | Percentage points in clinically accurate zone [66] | ≥97% (ideal) [66] | Clinical decision safety |
Recent advances in noninvasive CGM systems have demonstrated the potential for high-fidelity data collection, with optimized systems achieving 97.0% Clarke Error Grid A-Zone accuracy and MARD values of 5.2% under stable physiological conditions [66]. However, performance variations linked to individual factors such as tissue properties and physical activity underscore the importance of context-specific data integrity protocols [66].
Experimental Protocols for Anomaly Detection
Signal Dropout Detection and Characterization
Objective: To identify, classify, and quantify signal dropout events in continuous glucose monitoring data.
Materials:
- CGM data stream (glucose values, timestamps, signal quality metrics)
- Reference glucose measurements (fingerstick, venous)
- Computational environment (Python, R, or MATLAB)
- Data visualization tools
Procedure:
- Data Preparation: Import raw CGM data with complete timestamps. Align to standardized 5-minute intervals, flagging missing values.
- Gap Identification: Scan the timestamp sequence to identify intervals exceeding the expected sampling frequency by >50%. Classify gaps by duration:
- Short dropout (1-2 missing values, 5-10 minutes)
- Medium dropout (3-6 missing values, 15-30 minutes)
- Extended dropout (>6 missing values, >30 minutes)
- Contextual Analysis: For each dropout event, record:
- Pre-dropout glucose value and trend direction
- Immediate post-recovery glucose value
- Rate of change preceding the event
- Signal quality indicators prior to dropout
- Pattern Recognition: Apply clustering algorithms to identify recurrent dropout patterns associated with specific conditions (nocturnal periods, physical activity, device-specific issues).
- Validation: Compare CGM values immediately before and after dropout with contemporaneous reference measurements to assess potential signal drift.
Analysis: Calculate dropout frequency by time of day, duration distribution, and association with glycemic states. Establish a dropout severity index incorporating frequency, duration, and clinical context.
The following workflow diagram illustrates the comprehensive signal dropout detection process:
Compression Artifact Identification Protocol
Objective: To detect and characterize compression artifacts resulting from data processing, storage, or transmission.
Materials:
- Raw and processed CGM data streams
- High-frequency reference data (when available)
- Spectral analysis tools
- Multimodal sensor data (acceleration, temperature, pressure) [66]
Procedure:
- Data Alignment: Synchronize raw and processed data streams using timestamps with millisecond precision.
- Residual Analysis: Calculate differences between raw and processed signals. Apply low-pass filtering to isolate compression artifacts from physiological variations.
- Spectral Analysis: Perform Fourier transformation on residual signals to identify high-frequency components indicative of compression algorithms.
- Pattern Analysis: Segment data into 2-hour epochs. Within each epoch:
- Calculate glucose velocity and acceleration
- Identify plateaus with coefficient of variation <2%
- Flag abrupt transitions with physiologically implausible rates of change (>4 mg/dL/min)
- Multimodal Correlation: Correlate potential artifacts with:
- Amplitude Analysis: Identify attenuation of peak postprandial responses (reduction >20% from expected).
Analysis: Quantify artifact prevalence by sensor lot, device type, and processing algorithm. Develop artifact severity score incorporating amplitude, duration, and clinical impact.
Research Reagent Solutions for CGM Methodology
The systematic investigation of CGM data integrity requires specialized computational tools and reference materials. The following table outlines essential resources for implementing the protocols described in this document:
Table 3: Essential Research Reagents and Computational Tools
| Reagent/Tool | Specifications | Application | Source Examples |
|---|---|---|---|
| CGM Data Parser | Support for multiple manufacturers (Dexcom, Medtronic, Abbott) | Raw data extraction and standardization | iglu R package [16] |
| Physiological Signal Simulator | Generative models of glucose dynamics with controlled anomalies | Method validation and sensitivity analysis | GRI Dynamical Simulator [48] |
| Multimodal Sensor Platform | Integrated temperature, pressure, and motion sensing [66] | Artifact discrimination from physiological signals | Custom NIR-based systems [66] |
| Reference Glucose Analyzer | YSI 2300 STAT Plus or equivalent | Validation of CGM accuracy during anomalous periods | Clinical laboratory systems |
| Anomaly Detection Library | Implementation of ensemble methods (isolation forest, autoencoders) | Automated identification of data integrity issues | Python Scikit-learn, TensorFlow [48] |
| Time-Series Analysis Suite | Dynamic time warping, wavelet transformation | Pattern recognition and artifact characterization | MATLAB Signal Processing Toolbox |
These research reagents form the foundation for implementing robust data integrity protocols in CGM research. The iglu R package, specifically referenced in recent methodological research, provides standardized implementations of consensus CGM metrics and data quality assessments [16]. Multimodal sensor platforms, incorporating temperature and pressure sensing capabilities, have demonstrated particular utility in discriminating genuine physiological signals from measurement artifacts [66].
Correction Methodologies for Compromised Data
Imputation Protocols for Signal Dropouts
Objective: To reconstruct missing CGM data segments using physiologically plausible values based on contextual patterns.
Method Selection Algorithm: The appropriate imputation method depends on dropout duration and physiological context. The following diagram illustrates the decision process for selecting optimal imputation strategies:
Protocol Details:
Short Dropout Imputation (5-30 minutes):
- Apply linear interpolation for gaps during stable periods (glucose rate of change <1 mg/dL/min)
- Use spline interpolation for gaps during dynamic periods
- Constrain imputed values to physiologically plausible ranges (40-400 mg/dL)
Medium Dropout Imputation (30-120 minutes):
- Implement pattern-matching from historical data:
- Extract 2-week historical data aligned by time of day
- Identify days with similar pre-dropout trajectories (DTW distance
- Calculate weighted average of candidate patterns
- Incorporate external covariates (meal records, insulin dosing, physical activity)
- Implement pattern-matching from historical data:
Extended Dropout Handling (>120 minutes):
- Flag segments as unreliable for metrics requiring continuous data
- Document gap duration and context for interpretation bias assessment
- Exclude from variability metrics while retaining for summary statistics
Validation: For each imputed segment, calculate reconstruction error against held-out data. Establish quality thresholds for imputation acceptance (RMSE <10 mg/dL for short gaps, <15 mg/dL for medium gaps).
Artifact Correction and Signal Reconstruction
Objective: To identify and correct compression artifacts while preserving legitimate physiological signals.
Procedure:
- Artifact Segmentation: Apply change point detection to identify abrupt transitions in signal characteristics.
- Multiscale Analysis: Decompose signal using wavelet transformation to isolate artifact components.
- Template Matching: Compare suspect segments against artifact libraries:
- Flatline patterns (variance <0.1 mg/dL² over >20 minutes)
- Staircase patterns (quantized values suggesting bit-depth reduction)
- Clipping artifacts (truncation at sensor limits)
- Adaptive Filtering: Implement Kalman filtering with artifact detection:
- Adjust measurement noise covariance during suspected artifacts
- Incorporate multimodal data (temperature, pressure) to confirm artifacts [66]
- Signal Reconstruction: Replace confirmed artifacts using:
- Contextual pattern matching (similar to dropout imputation)
- Physiological model projections (glucose-insulin models)
- Bayesian smoothing with informed priors
Validation Metrics:
- Clarke Error Grid analysis of corrected segments
- Preservation of physiological variability (coefficient of variation within expected ranges)
- Concordance with reference measurements when available
Integration with Research Data Pipelines
Quality Control Framework for CGM Data
Implementation of systematic data integrity protocols requires integration throughout the research data pipeline. The following quality control framework ensures consistent handling of signal dropouts and compression artifacts:
Automated Preprocessing:
- Raw data ingestion with checksum verification
- Timestamp alignment and gap identification
- Initial quality scoring based on signal completeness
Anomaly Detection Layer:
- Parallel execution of multiple detection algorithms
- Ensemble voting for artifact identification
- Confidence scoring for each flagged anomaly
Correction and Imputation:
- Context-aware imputation method selection
- Multimodal sensor fusion for artifact confirmation [66]
- Generation of both raw and processed data streams
Quality Reporting:
- Comprehensive data quality summary
- Annotation of corrected segments
- Export of processing metadata for audit purposes
Validation Against Clinical Endpoints
The ultimate validation of data integrity protocols lies in their ability to preserve clinically relevant information while removing technical artifacts. Protocol validation should include:
- Metric Stability: Assessment of key glycemic metrics (TIR, CV, GMI) before and after processing
- Event Preservation: Evaluation of hypoglycemia and hyperglycemia episode detection consistency
- Correlation with Biomarkers: Comparison of processed CGM data with concurrent HbA1c measurements
- Clinical Agreement: Concordance between processed CGM trends and clinician assessments
Recent research has demonstrated that systematic data processing can significantly impact clinical interpretation, with 11 patients in one study crossing clinically meaningful thresholds after data correction [16]. This underscores the critical importance of robust data integrity protocols in both research and clinical applications of CGM technology.
Continuous Glucose Monitoring (CGM) systems have transformed diabetes management for outpatient populations; however, their application in special populations such as critically ill adults and pediatric patients requires distinct methodological considerations. These populations present unique challenges including altered physiological states, fluid shifts, and the need for extreme glycemic precision to avoid catastrophic outcomes. This document outlines specific application notes and protocols for employing CGM in research involving critically ill and pediatric populations, framed within a broader thesis on CGM systems methodology.
Special Population Considerations
Critical Illness
In the intensive care unit (ICU), glycemic control is complicated by factors such as insulin resistance, stress-induced hyperglycemia, medication effects, and parenteral nutrition [67]. Critically ill patients often exhibit blood glucose levels >180 mg/dL, with hyperglycemia affecting 77.8–86.2% of ICU patients and correlating with heightened morbidity and mortality [67]. CGM implementation in ICUs must account for specific pathophysiological states:
- Physiological Confounders: Hypoperfusion, hypothermia, hypoxia, and vasopressor use can compromise CGM accuracy by altering the relationship between capillary blood glucose and interstitial fluid glucose [67].
- Clinical Workflow Integration: CGM serves as a complement to—not a replacement for—point-of-care glucose (POC-G) testing, particularly during sensor initiation and for calibration verification [67].
- Regulatory Status: Most CGM systems lack formal approval for inpatient use, though enforcement discretion during the COVID-19 pandemic permitted implementation to reduce staff exposure [67].
Pediatric Applications
Pediatric populations, especially young children and adolescents with new-onset type 1 diabetes (T1D), present distinct challenges:
- Compliance and Comfort: Pediatric patients often struggle with the frequent finger-prick tests required for self-monitoring of blood glucose (SMBG) [68]. CGM offers a less invasive alternative, potentially improving adherence and quality of life [68].
- DKA Management: Diabetic ketoacidosis (DKA) is a leading cause of Pediatric ICU (PICU) admission. Research demonstrates CGM's utility in detecting hypoglycemic episodes (16 episodes, with CGM detecting 14 versus capillary glucose detecting 2) and providing trend data during acute metabolic instability [69].
- Age-Specific Accuracy: Special consideration is needed for very young children (e.g., <2 years), where sensor use may be off-label and require individualized assessment [69].
Table 1: CGM Accuracy Metrics in Critical Care and Pediatric Settings
| Population | Study Design | Sample Size | MARD (%) | Clarke Error Grid (Zones A+B) | Key Findings |
|---|---|---|---|---|---|
| Critical Care | Scoping Review (20 studies) [67] | Varied | 9.3 - 20.6 | >98% | 30-71% reduction in POC-G measurements; Time in Range (TIR): 46.1-100% |
| Pediatric (DKA in PICU) | Retrospective Observational [69] | 19 | 14.5 | 89.1% | Capillary glucose values were significantly higher than interstitial values (p<0.001); CGM detected more hypoglycemic episodes |
Table 2: International Consensus Targets for CGM Metrics [70] [71]
| Glycemic Metric | Target Glucose Range | Consensus Goal | Clinical Interpretation |
|---|---|---|---|
| Time-in-Range (TIR) | 70–180 mg/dL (3.9–10.0 mmol/L) | >70% | Primary goal for glycemic control |
| Time-Below-Range (TBR) Level 1 | 54–69 mg/dL (3.0–3.8 mmol/L) | <4% | Increased risk for clinical hypoglycemia |
| Time-Below-Range (TBR) Level 2 | <54 mg/dL (<3.0 mmol/L) | <1% | Clinically significant hypoglycemia |
| Time-Above-Range (TAR) Level 1 | 181–250 mg/dL (10.1–13.9 mmol/L) | <25% | Hyperglycemia requiring attention |
| Time-Above-Range (TAR) Level 2 | >250 mg/dL (>13.9 mmol/L) | <5% | High hyperglycemia requiring intervention |
| Glycemic Variability | Coefficient of Variation (%CV) | ≤36% | Goal for stable glucose fluctuations |
Experimental Protocols
Protocol for CGM Implementation in the Pediatric ICU for DKA Management
Objective: To assess the feasibility, accuracy, and clinical utility of CGM in children admitted to the PICU with new-onset DKA as the initial presentation of T1D [69].
Materials:
- Factory-calibrated intermittently scanned CGM (isCGM) device (e.g., FreeStyle Libre 2).
- POC capillary blood glucose meter (e.g., Accu-Chek Performa).
- Data extraction and analysis software.
Methodology:
- Sensor Placement: Apply the CGM sensor to the patient's upper arm within two hours of PICU admission.
- Warm-Up Period: Allow for a 1-hour sensor warm-up and stabilization period as per manufacturer instructions.
- Alarm Configuration: Set predictive and indicative alarms for hypoglycemia (<80 mg/dL) and hyperglycemia (>200 mg/dL).
- Reference Glucose Measurements: Perform capillary glucose measurements per institutional DKA protocol. Record the timestamp for each measurement.
- Data Pairing: For accuracy analysis, pair POC capillary glucose values with CGM interstitial glucose measurements recorded within a ±5-minute window.
- Data Collection Period: Collect data for the duration of the PICU stay or a standardized period (e.g., first 48 hours).
- Data Analysis:
- Accuracy Assessment: Calculate the Mean Absolute Relative Difference (MARD) between paired CGM and POC values. Perform Clarke Error Grid (CEG) analysis to determine clinical accuracy.
- Hypoglycemia Detection: Compare the number and timing of hypoglycemic events detected by CGM versus standard capillary monitoring.
- Statistical Analysis: Use appropriate statistical tests (e.g., Wilcoxon signed-rank test) to compare glucose values from different methods.
Protocol for Assessing CGM Impact on Nursing Workload in the ICU
Objective: To evaluate the impact of CGM deployment on nursing workload, measured by the reduction in POC-G tests, in a general adult ICU population [67].
Materials:
- Real-time CGM (rtCGM) systems.
- Hospital's electronic health record (EHR) system for auditing POC-G test frequency.
- Data collection forms for workload assessment.
Methodology:
- Study Design: Prospective cohort study or a randomized controlled trial.
- Patient Recruitment: Recruit critically ill adult patients requiring glycemic monitoring.
- Sensor Placement & Calibration: Place rtCGM sensors per manufacturer's guidelines. Establish a protocol for periodic calibration with arterial or venous blood glucose if required by the device.
- Control Phase: For a defined period (e.g., first 24 hours), maintain standard care with frequent POC-G measurements as per ICU protocol. Record the number of tests.
- Intervention Phase: Implement CGM-guided monitoring. Define a protocol where CGM data is used for trend analysis and insulin titration, specifying when a CGM reading must be confirmed with a POC-G test (e.g., before critical insulin dose changes, during rapid glucose shifts).
- Data Collection:
- Record the total number of POC-G tests performed per patient during both control and intervention phases.
- Document nurse perception of workload via validated surveys.
- Outcome Measures:
- Primary: Percentage reduction in the mean number of daily POC-G tests.
- Secondary: Time in targeted glycemic range, incidence of hypoglycemic events, and nurse satisfaction.
Workflow Visualization
CGM Research Workflow for Special Populations
The Scientist's Toolkit: Research Reagent Solutions
Table 3: Essential Materials and Analytical Tools for CGM Research
| Item | Function/Description | Example Products/Software |
|---|---|---|
| rtCGM / isCGM Systems | Devices for continuous/intermittent glucose data collection from interstitial fluid. | FreeStyle Libre (isCGM), Dexcom (rtCGM) [69] [68] |
| Reference Glucose Meter | Provides point-of-care capillary glucose values for CGM accuracy validation. | Accu-Chek Performa [69] |
| Blood Gas Analyzer | Provides high-accuracy venous/arterial glucose measurements for sensor calibration in critical care. | Instrumentation laboratory GEM Premier 5000 [69] |
| AGP Report Software | Standardized platform for visualizing and interpreting CGM data, generating core metrics and graphs. | International Diabetes Center AGP report [72] [71] [63] |
| Statistical Analysis Package | Software for calculating accuracy metrics (MARD) and performing statistical comparisons. | IBM SPSS Statistics, R Studio [69] |
| Clarke Error Grid Analysis Tool | Method for assessing the clinical accuracy of CGM readings against a reference method. | Custom scripts or specialized clinical software [69] [67] |
Comparative CGM Performance Analysis: Validation Frameworks and Device-Specific Capabilities
Continuous Glucose Monitoring (CGM) systems have revolutionized diabetes management by providing real-time interstitial glucose readings, enabling precise glycemic control. For researchers and pharmaceutical developers evaluating these technologies, the Mean Absolute Relative Difference (MARD) has emerged as the primary metric for assessing sensor accuracy [33]. This technical note provides a comparative analysis of MARD performance across leading CGM systems and outlines standardized experimental protocols for head-to-head device evaluation, contextualized within CGM methodology research.
A critical methodological consideration is that MARD values are not intrinsic properties of CGM devices alone but are strongly influenced by clinical study design, including the choice of reference measurement system and the number of paired points collected [33]. This analysis incorporates the most recent head-to-head comparative studies to deliver evidence-based insights for the research community.
Quantitative MARD Performance Comparison
Table 1 summarizes the accuracy data, expressed as MARD, for current-generation CGM systems from recent comparative studies and manufacturer-reported data.
Table 1: Comparative MARD Values for Leading CGM Systems
| CGM System | Reported MARD (%) | Reference Method | Study/Source Context |
|---|---|---|---|
| Dexcom G7 | 8.2% (Adults) [73] | Not Specified | Manufacturer Data |
| 12.0% [37] | YSI 2300 (Venous) | 2025 Head-to-Head Study | |
| 9.9% [37] | Cobas Integra (Venous) | 2025 Head-to-Head Study | |
| 10.1% [37] | Contour Next (Capillary) | 2025 Head-to-Head Study | |
| Abbott FreeStyle Libre 3 | ~8.9% [73] | Not Specified | Independent Analysis |
| 11.6% [37] | YSI 2300 (Venous) | 2025 Head-to-Head Study | |
| 9.5% [37] | Cobas Integra (Venous) | 2025 Head-to-Head Study | |
| 9.7% [37] | Contour Next (Capillary) | 2025 Head-to-Head Study | |
| Medtronic Simplera | 11.6% [37] | YSI 2300 (Venous) | 2025 Head-to-Head Study |
| 13.9% [37] | Cobas Integra (Venous) | 2025 Head-to-Head Study | |
| 16.6% [37] | Contour Next (Capillary) | 2025 Head-to-Head Study | |
| Eversense 365 | 8.8% [73] | Not Specified | Manufacturer Data |
| Dexcom G6 | 9.0% (Adults) [73] | Not Specified | Manufacturer Data |
Performance Across Glycemic Ranges
A 2025 prospective, interventional study by the Institute for Diabetes Technology Ulm provides critical insights into context-dependent performance [37]. The study found that while FreeStyle Libre 3 and Dexcom G7 showed better accuracy in normoglycemic and hyperglycemic ranges, Medtronic Simplera performed better in the hypoglycemic range [37]. This highlights the importance of evaluating MARD across the entire glycemic spectrum, as a single overall MARD value can obscure clinically relevant performance differences in extreme glucose ranges critical for patient safety.
Understanding MARD as a Metric
Definition and Calculation
MARD is calculated as the mean of the absolute values of the relative differences between paired CGM and reference measurements [33]:
[ \text{MARD} = \frac{1}{N{\text{ref}}} \sum{k=1}^{N{\text{ref}}} \left( 100\% \cdot \frac{|y{\text{CGM}}(tk) - y{\text{ref}}(tk)|}{y{\text{ref}}(t_k)} \right) ]
Where (y{\text{CGM}}) is the CGM reading, (y{\text{ref}}) is the reference value, and (N_{\text{ref}}) is the number of reference measurements [33].
Key Methodological Considerations
The reliability of a reported MARD value depends significantly on study design factors. The MARD Reliability Index (MRI) has been proposed to quantify this uncertainty [33].
Diagram 1: Key factors influencing reported MARD. The confidence interval for a computed MARD value is affected by the accuracy of the reference system and the number of paired points used in the calculation [33].
Experimental Protocols for CGM Comparison
Standardized Head-to-Head Evaluation Protocol
Based on methodologies from recent rigorous comparisons, the following protocol is recommended for CGM performance evaluation:
4.1.1 Study Population and Design
- Participants: 20-30 adult participants with type 1 diabetes provides sufficient statistical power [37] [74].
- Study Duration: 14-15 days accommodates sensor lifetimes and allows for multiple testing periods [37].
- Parallel Wear: All CGM systems are worn simultaneously by each participant to enable paired data collection under identical physiological conditions [37] [74].
4.1.2 Comparator Methods and Testing Sessions
- Employ multiple reference methods: laboratory analyzers (YSI 2300, Cobas Integra) and capillary blood glucose (Contour Next) [37].
- Conduct Frequent Sampling Periods (FSPs) during days 2, 5, and 15 with comparator measurements every 15 minutes over 7-hour sessions [37].
- Implement glucose manipulation procedures to ensure data collection across clinically relevant glycemic situations (hyperglycemia, hypoglycemia, rapid glucose excursions) [37].
4.1.3 Data Analysis
- Pair CGM readings with reference values within a ±5-minute window [37].
- Calculate MARD, relative bias, and agreement rate (percentage within ±20 mg/dL or ±20% of reference) [37].
- Analyze clinical accuracy using Error Grid analysis (Clarke or Diabetes Technology Society Error Grid) [37].
Diagram 2: CGM performance study workflow. The protocol includes both free-living periods and controlled frequent sampling sessions with glucose manipulation to ensure data across glycemic ranges [37].
Key Technical Considerations
- Sensor Lot Variability: Source sensors from regular distribution channels when possible to ensure representativeness of commercial products [37].
- Warm-up Periods: Account for different sensor initialization times (30 minutes for Dexcom G7 to 2 hours for Medtronic Guardian Connect) in data analysis [75].
- Wear Time Consistency: Align assessment periods to account for different sensor lifetimes (7-15 days across systems) [75] [37].
The Scientist's Toolkit: Essential Research Reagents
Table 2: Key Materials and Methods for CGM Performance Studies
| Category | Specific Product/System | Research Application & Rationale |
|---|---|---|
| CGM Systems | FreeStyle Libre 3, Dexcom G7, Medtronic Simplera/Guardian 4 | Current-generation factory-calibrated systems representing market leaders. |
| Laboratory Reference Analyzers | YSI 2300 STAT PLUS (Glucose Oxidase), Cobas Integra 400 plus (Hexokinase) | High-accuracy laboratory methods serving as primary reference standards. |
| Capillary Reference Meters | Contour Next (Glucose Dehydrogenase) | Representative of high-accuracy point-of-care glucose monitoring. |
| Data Analysis Tools | Continuous Glucose Deviation Interval and Variability Analysis (CG-DIVA), Error Grid Analysis | Specialized software for comprehensive CGM data assessment and clinical accuracy evaluation. |
| Glucose Manipulation Protocol | Carbohydrate-rich meal + delayed insulin bolus | Standardized procedure for inducing transient hyperglycemia and hypoglycemia with rapid glucose changes. |
Impact on Derived Glycemic Metrics
Beyond point accuracy, CGM system choice directly impacts clinically essential glycemic metrics. A 2025 comparative analysis found that the apparent glucose profile was influenced by the CGM system used, resulting in substantially different glycemic metrics including time in range (TIR) [74]. These discrepancies were significant enough to lead to different therapeutic recommendations for the same patient depending on which CGM system was used [74]. This has profound implications for clinical trial design and endpoint selection in drug development studies utilizing CGM-derived outcomes.
For researchers designing studies involving glucose monitoring, MARD serves as a crucial but complex metric requiring careful interpretation. The most recent head-to-head evidence indicates that while FreeStyle Libre 3 and Dexcom G7 generally show higher overall accuracy compared to Medtronic Simplera, performance varies by glycemic range and reference method [37]. The choice of comparator method significantly influences reported MARD values, with variations of up to 3-5% possible depending on the reference standard used [37].
Methodological rigor in CGM performance studies requires standardized protocols incorporating multiple reference methods, controlled glucose excursions, and analysis across all glycemic ranges. Future CGM evaluation should move beyond singular MARD comparisons to embrace multi-dimensional assessment frameworks that capture accuracy, consistency, and clinical utility across diverse use cases and patient populations.
The analytical validation of continuous glucose monitoring (CGM) systems represents a critical methodology for establishing their reliability, accuracy, and safety in both clinical research and routine diabetes management. For researchers and drug development professionals, validation protocols must evolve in parallel with technological advancements. The CGM market is experiencing significant global momentum, projected to grow from USD 4.97 billion in 2024 to USD 9.93 billion by 2034, at a compound annual growth rate (CAGR) of 7.22% [14]. This growth is largely driven by innovations in extended-wear and implantable technologies that address limitations of conventional short-term devices.
Recent developments highlight a paradigm shift toward minimally invasive and long-duration monitoring solutions. Glucotrack is advancing a fully implantable CGM designed for three years of continuous operation, measuring glucose directly from blood rather than interstitial fluid, thereby eliminating the physiological lag time inherent in conventional systems [76]. Similarly, Senseonics' Eversense 365, the first year-long CGM, received integrated CGM (iCGM) clearance, enabling interoperability with automated insulin delivery systems [76]. These technologies present unique validation challenges that extend beyond traditional accuracy metrics to encompass long-term biocompatibility, signal stability, and in vivo performance consistency.
This document establishes standardized application notes and experimental protocols for the analytical validation of extended-wear and implantable CGM systems, providing a rigorous framework for researchers developing next-generation glucose monitoring technologies.
Technology Landscape and Classification
Next-generation CGM systems can be categorized by their operational duration, measurement approach, and technological characteristics. The table below summarizes the key differentiating features of emerging platforms compared to traditional systems.
Table 1: Classification and Characteristics of Next-Generation CGM Technologies
| Technology Type | Wear Duration | Measurement Principle | Key Examples | Technical Differentiators |
|---|---|---|---|---|
| Extended-Wear Implantables | 1-3 years | Direct blood glucose sensing via fully implanted sensor | Glucotrack implantable CGM [76], Senseonics Eversense 365 [76] | No on-body component; eliminates physiological lag (5-15 minutes) associated with interstitial fluid measurement |
| Non-Invasive Systems | 7-14 days | Electromagnetic sensing, spectroscopy (NIR, Raman) without skin penetration | Biolinq Shine wearable biosensor [76] | Needle-free microsensor array placed 20x more shallowly than conventional CGMs; FDA de novo clearance in 2025 |
| Advanced Interoperable CGMs | 10-15 days | Subcutaneous filament with iCGM designation | Dexcom G7 (15-day), Medtronic Instinct (Abbott-based) [76] | Meet iCGM Special Control requirements for integration with automated insulin delivery systems |
The analytical validation requirements for these technologies vary significantly based on their operational mechanisms. Implantable systems like Glucotrack's three-year monitor require validation protocols that address long-term biofouling, sensor drift, and encapsulation effects [76]. Non-invasive technologies such as Biolinq's Shine sensor necessitate different reference standards, as they bypass both blood and interstitial fluid compartments entirely [76]. Furthermore, the regulatory landscape is evolving, with the FDA establishing iCGM special controls that define minimum accuracy benchmarks for interoperable devices [77].
Core Analytical Validation Metrics and Standards
A standardized validation framework is essential for cross-platform comparison and regulatory approval. The Latin American consensus statement on CGM standardization (2025) provides comprehensive metrics for evaluating device performance, emphasizing multidimensional assessment beyond simple point accuracy [77].
Table 2: Core Analytical Validation Metrics for Extended-Wear and Implantable CGM Systems
| Validation Category | Specific Metrics | Performance Threshold | Testing Requirements |
|---|---|---|---|
| Accuracy | Mean Absolute Relative Difference (MARD) | ≤10% overall; stricter thresholds for hypoglycemia (<70 mg/dL) | Stratified by glucose range (hypo-, normo-, hyperglycemia) and rates of change (≤1, 1–2, >2 mg/dL/min) [77] |
| Clinical Accuracy | Consensus Error Grid Analysis | >99% in clinically acceptable zones (A+B) | Evaluation against reference method (YSI or blood glucose analyzer) [77] |
| Precision | Agreement Rate | >70% within 15/15%, >80% within 20/20% of reference | Multiple devices tested under identical conditions throughout sensor lifespan |
| Long-Term Stability | Signal Degradation Rate | <0.5% per month for implantable sensors | Continuous testing over claimed device lifespan with periodic accuracy assessments |
| Dynamic Response | Response Time to Glucose Excursions | <5 minutes for blood-sensing implants; <15 minutes for interstitial | Controlled glucose challenges with frequent reference measurements |
Manufacturers must demonstrate accuracy through standardized metrics including MARD, consensus error grid analysis, and agreement rates established by iCGM Special Control requirements [77]. For implantable technologies like Glucotrack's three-year device, validation must confirm sustained accuracy throughout the entire sensor lifespan, requiring longitudinal studies with periodic in-clinic testing [76]. The physiological lag time between blood and interstitial glucose (typically 5-15 minutes), a significant confounder in traditional CGM accuracy, is eliminated in blood-sensing implantables, necessitating revised validation approaches that account for this fundamental methodological difference [2] [76].
Experimental Protocols for Analytical Validation
Protocol 1: Comprehensive Accuracy Assessment
Objective: To evaluate the point and trend accuracy of extended-wear and implantable CGM systems across the entire glycemic range.
Materials:
- Test CGM systems (minimum of 10 devices from 3 different manufacturing lots)
- Reference blood glucose analyzer (YSI 2300 STAT Plus or equivalent)
- Venous blood sampling system
- Standardized glucose challenges solutions (dextrose 20%, insulin protocol)
Methodology:
- Participant Selection: Enroll subjects representing diverse phenotypes (age, BMI, skin type) with equal distribution across glycemic states: hypoglycemic (<70 mg/dL), normoglycemic (70-180 mg/dL), and hyperglycemic (>180 mg/dL) [77].
- Sensor Placement: Implant sensors according to manufacturer specifications by trained clinicians.
- Clamp Procedure: Conduct glucose clamps to stabilize at target concentrations (50-400 mg/dL). Maintain each plateau for 45 minutes to ensure equilibrium between blood and interstitial compartments where applicable.
- Reference Sampling: Collect venous blood samples every 15 minutes during stable periods and every 5 minutes during transitions. Analyze immediately with reference method.
- Data Collection: Record CGM values timestamped to correspond with reference measurements.
- Analysis: Calculate MARD overall and stratified by glycemic range. Perform consensus error grid analysis and determine agreement rates.
Validation Timeline: For implantable technologies with multi-year duration, implement a tiered testing approach with intensive initial testing (first 14 days), followed by weekly in-clinic assessments for the first 3 months, and monthly evaluations thereafter for the device's claimed lifespan [76].
Protocol 2: Dynamic Response and Lag Time Characterization
Objective: To quantify system response time to rapid glucose changes, a critical metric for closed-loop applications.
Materials:
- Automated glycemic clamp system
- Intravenous dextrose (20%) and insulin infusion protocols
- High-frequency reference sampling system
Methodology:
- Baseline Stabilization: Maintain subjects at euglycemic level (100-120 mg/dL) for 30 minutes.
- Ramp Induction: Administer intravenous dextrose to induce rapid glucose rise (2-3 mg/dL/min).
- Peak and Decline: After reaching target (200-220 mg/dL), initiate insulin infusion to drive glucose decline (1-2 mg/dL/min).
- High-Frequency Sampling: Collect reference blood samples every 2-3 minutes during transitions.
- Time Alignment: Precisely synchronize CGM and reference data timestamps.
- Analysis: Calculate time delay between reference and CGM profiles using cross-correlation analysis. Determine rate-of-change accuracy by comparing CGM-derived trends to reference values.
This protocol is particularly crucial for validating claims of "lag-free" monitoring in blood-sensing implantables like Glucotrack's device [76].
Protocol 3: Long-Term Stability Assessment
Objective: To evaluate signal stability, calibration drift, and biofouling effects in extended-wear and implantable sensors.
Materials:
- Long-term study cohort with periodic in-clinic assessments
- Reference glucose monitoring system for comparison
- Explanation and histology capabilities for implantables
Methodology:
- Longitudinal Design: Enroll subjects for the entire claimed sensor duration (e.g., 1 year for Eversense 365, 3 years for Glucotrack).
- Periodic Assessments: Schedule in-clinic evaluations weekly for the first month, then monthly thereafter.
- Comparative Accuracy: During each visit, conduct a 4-hour controlled meal test with frequent reference measurements.
- Signal Quality Metrics: Monitor impedance, sensitivity loss, and noise patterns.
- Explanatory Analysis: For implantables, perform histological examination of tissue encapsulation upon explanation.
This protocol directly addresses the unique challenges of extended-wear technologies, where tissue-sensor interface changes over time can significantly impact performance [76].
Diagram Title: Extended-Wear CGM Validation Workflow
Advanced Analytical Approaches
Glucodensity and Functional Data Analysis
Beyond traditional point accuracy metrics, functional data analysis approaches like glucodensity provide a more comprehensive characterization of CGM performance. Glucodensity transforms discrete glucose time series into continuous density functions, capturing both distributional and dynamic aspects of glycemic control [78]. Recent research demonstrates that incorporating glucose velocity and acceleration into the glucodensity framework increases predictive power for long-term outcomes, with a 20% improvement in R² for forecasting HbA1c and fasting plasma glucose at 5- and 8-year horizons compared to traditional metrics alone [78].
For analytical validation, glucodensity profiles enable researchers to compare the entire distribution of CGM values against reference measurements, rather than relying on discrete point comparisons. This approach is particularly valuable for assessing how well a CGM system captures glycemic variability patterns, which may be missed by traditional MARD calculations.
AI-Enhanced Validation Protocols
Artificial intelligence methodologies are transforming CGM validation approaches. Machine learning algorithms can identify subtle patterns in high-resolution CGM data that correlate with long-term accuracy degradation in extended-wear devices [47]. Deep learning models trained on multi-modal data (glucose values, sensor electrical characteristics, subject metadata) can predict sensor failure before accuracy deteriorates to clinically unacceptable levels [47].
For implantable technologies, AI algorithms can differentiate between physiological signal attenuation and true sensor degradation, enabling more sophisticated endpoint analysis in long-term validation studies. These approaches are particularly valuable for assessing the clinical reliability of systems intended for multi-year use, where traditional validation methods may miss gradual performance decline patterns.
Research Reagent Solutions and Materials
Table 3: Essential Research Reagents and Materials for CGM Analytical Validation
| Reagent/Material | Specification | Application in Validation | Key Considerations |
|---|---|---|---|
| Reference Glucose Analyzer | YSI 2300 STAT Plus or equivalent with CV <2% | Gold-standard reference for all accuracy assessments | Requires regular calibration and participation in proficiency testing programs |
| Glucose Clamp Solutions | Sterile dextrose (20%), insulin protocols | Creating controlled glycemic conditions across physiological range | Concentration must be verified analytically; prepared aseptically |
| Sensor Insertion Kits | Manufacturer-specific insertion devices | Standardized sensor placement for consistency | Training required to minimize placement variability between operators |
| Data Acquisition System | Custom software for timestamp synchronization | Precise alignment of CGM and reference values | Minimum time resolution of 1 second; automated synchronization protocols |
| Quality Control Materials | Known glucose concentrations in physiological range | Daily verification of reference analyzer performance | Should span entire measuring range (40-400 mg/dL) |
| Tissue Fixatives | 10% neutral buffered formalin, paraffin embedding | Histological analysis of tissue-sensor interface | Required for implantable device biocompatibility assessment |
The analytical validation of extended-wear and implantable CGM technologies requires sophisticated methodologies that address their unique technical characteristics and intended use durations. Standardized protocols must encompass not only traditional accuracy metrics but also long-term stability, dynamic response, and biocompatibility assessments. The framework presented here provides researchers and drug development professionals with comprehensive tools for rigorously evaluating these next-generation systems, ensuring they meet the stringent requirements for both regulatory approval and clinical implementation. As CGM technology continues to evolve toward longer wear durations and less invasive designs, validation methodologies must similarly advance, incorporating functional data analysis and artificial intelligence approaches to fully characterize device performance.
Performance Evaluation in Outpatient Versus Inpatient Research Settings
Continuous Glucose Monitoring (CGM) systems have revolutionized glycemic management across the care continuum, yet their performance evaluation differs significantly between outpatient and inpatient research settings. These environments present distinct challenges—from controlled home settings to highly complex hospital conditions—requiring tailored methodological approaches. Performance requirements extend beyond the traditional mean absolute relative difference (MARD) to encompass safety, workflow integration, and clinical outcome measures [79]. This article outlines standardized protocols and application notes for evaluating CGM systems in both environments, providing researchers with structured frameworks for generating comparable, high-quality evidence.
The fundamental distinction between settings lies in their primary objectives: outpatient studies typically focus on long-term glycemic control and patient self-management, while inpatient research emphasizes rapid detection of dysglycemia and integration into clinical workflows [80] [79]. Critically ill inpatients often exhibit physiological variables such as altered tissue perfusion, edema, and medication interference that may affect CGM performance differently than in stable outpatients [8]. Understanding these divergences is essential for designing appropriate evaluation protocols.
Outpatient CGM Performance Evaluation
Core Performance Metrics and Analytical Protocols
Outpatient CGM evaluation requires a multidimensional approach that captures both analytical performance and clinical utility. The International Federation of Clinical Chemistry and Laboratory Medicine (IFCC) Working Group on CGM has developed comprehensive guidelines to standardize performance assessment, emphasizing the need for consistent study designs, comparator measurements, and accuracy thresholds [7].
Table 1: Primary Accuracy Metrics for Outpatient CGM Evaluation
| Metric | Definition | Acceptance Threshold | Clinical Significance |
|---|---|---|---|
| MARD | Mean Absolute Relative Difference between CGM and reference glucose | <10% [8] | Overall analytical accuracy |
| TIR | Percentage of time in target range (70-180 mg/dL) | >70% for most patients [80] | Directly linked to long-term outcomes |
| TBR | Percentage of time below range (<70 mg/dL) | <4% [80] | Safety indicator (hypoglycemia risk) |
| TAR | Percentage of time above range (>180 mg/dL) | <25% [80] | Hyperglycemia exposure |
| Consensus Error Grid | Clinical accuracy analysis | >99% in zones A+B [24] | Clinical risk assessment |
Beyond these core metrics, contemporary research emphasizes the importance of evaluating Glycemic Risk Index (GRI), Surveillance Error Grid (SEG), and Precision Absolute Relative Difference (PARD) to better capture clinical risk and short-term glucose variations [79]. These composite indices address MARD's limitations in characterizing the timing, direction, and clinical consequences of measurement errors, which is particularly important for automated insulin delivery systems where inaccuracies may lead to inappropriate dosing [79].
Experimental Protocol: Pharmacist-Led CGM Intervention in Primary Care
Study Design: A 12-week prospective cohort study comparing CGM-guided management versus standard self-monitoring of blood glucose (SMBG) in adults with type 2 diabetes and HbA1c ≥8% [81].
Participants: 40 adults with type 2 diabetes randomized to intervention (CGM + pharmacist support) or control (SMBG only) groups. Key exclusion criteria include CGM use within previous 6 months, pregnancy, hypoglycemia requiring third-party assistance, or systemic steroid use [81].
Intervention Protocol:
- Device: FreeStyle Libre 2 CGM system
- Sensor Application: Applied to posterior upper arm following manufacturer instructions
- Pharmacist Visits: 5 structured visits over 12 weeks (baseline, week 2, 4, 6, and 12)
- Education Component: Structured diabetes self-management education and support aligned with 2022 National Standards
- Data Collection: HbA1c at baseline and 12 weeks, CGM-derived metrics (TIR, TBR, TAR), Summary of Diabetes Self-Care Activities measure, and safety endpoints [81]
Outcome Measures:
- Primary: Between-group difference in HbA1c change from baseline to 12 weeks
- Secondary: CGM metric changes, health behavior modifications, safety outcomes
- Statistical Analysis: Multivariable regression adjusting for potential confounders
Figure 1: Outpatient CGM Study Workflow for Type 2 Diabetes
Inpatient CGM Performance Evaluation
Specialized Considerations for Hospital Settings
Inpatient CGM evaluation must account for unique clinical scenarios including critical illness, medication interference, and rapid glucose fluctuations. Current evidence supports CGM use in hospitals as an adjunct to point-of-care (POC) glucose testing, with particular value in detecting nocturnal hypoglycemia and reducing nursing workload [82] [80].
A simulation study comparing flash glucose monitoring (FreeStyle Libre) to traditional finger-prick testing demonstrated significant efficiency advantages: sensor scanning required 26.4±11.5 seconds versus 132.8±37 seconds for finger-prick testing, saving approximately 106 seconds per glucose check. For a typical inpatient requiring 20 readings, this translates to 34.2 minutes saved per patient [82]. Healthcare staff strongly preferred CGM, citing benefits in workflow efficiency, patient comfort, and infection control [82].
Table 2: Inpatient CGM Performance Targets (ICU Setting)
| Parameter | Target | Evidence Level |
|---|---|---|
| MARD | <15% (acceptable) [8] | Multiple ICU studies |
| Time in Range (70-180 mg/dL) | >50% [8] | Critically ill patients |
| Time Below Range (<70 mg/dL) | <1% [8] | Critical care consensus |
| Clarke Error Grid (zones A+B) | >98% [8] | Regulatory guidance |
| Point-of-care test reduction | ~71% reduction [8] | COVID-19 era studies |
Experimental Protocol: Randomized Controlled Trial in Intensive Care
Study Design: Prospective, controlled, randomized, single-blind clinical trial in intensive care unit (ICU) setting [8].
Participants: 376 critically ill adults with glucose levels >180 mg/dL (10 mmol/L), excluding pregnant patients, those with skin conditions/allergies preventing sensor application, and end-of-life patients [8].
Intervention Protocol:
- Device: Dexcom G7 CGM systems
- Sensor Placement: Upper arm or abdomen following manufacturer instructions
- Randomization: 1:1 allocation to experimental (CGM-guided) or control (POC-glucose guided) groups
- Blinding: Patients blinded to group assignment; control group uses blinded CGM
- Nurse Training: Comprehensive education on sensor insertion, configuration, and protocol adherence
- Reference Measurements: POC glucose testing per ICU protocol (3-6 measurements daily)
- Data Collection: Continuous glucose values, POC glucose measurements, insulin administration, adverse events [8]
Primary Outcome: Time in Range (TIR) 70-180 mg/dL Secondary Outcomes: Time above range (>180 mg/dL), time below range (<70 mg/dL), frequency of POC measurements, hypoglycemia incidence, mortality at 90 days post-ICU discharge [8]
Statistical Analysis: Kolmogorov-Smirnov test for normality assessment, appropriate parametric/non-parametric tests based on data distribution, with p<0.05 considered significant.
Figure 2: Inpatient ICU CGM Trial Protocol
Comparative Analysis: Outpatient vs. Inpatient Evaluation
Table 3: Key Differences in CGM Performance Evaluation Across Settings
| Evaluation Dimension | Outpatient Setting | Inpatient Setting |
|---|---|---|
| Primary Study Objectives | Long-term glycemic control, patient behavior, quality of life [81] | Hypoglycemia prevention, workflow efficiency, nurse burden [82] [8] |
| Key Performance Metrics | TIR, HbA1c correlation, patient-reported outcomes [81] [80] | TIR, nursing time savings, POC test reduction [82] [8] |
| Reference Standard | Laboratory venous glucose, SMBG with approved meters [7] | Point-of-care glucose testing, arterial/venous blood samples [8] |
| Study Duration | Weeks to months (e.g., 12 weeks) [81] | Days to weeks (until ICU discharge) [8] |
| Population Considerations | Stable chronic conditions, diverse age ranges [81] | Critical illness, altered perfusion, medication interference [8] |
| Regulatory Status | FDA-approved for personal use [80] | Investigational (not FDA-approved for inpatient use) [8] |
| Data Interpretation Challenges | Lifestyle factors, sensor adherence [83] | Medication interference, physiological lag in critically ill [8] |
The Scientist's Toolkit: Essential Research Reagents and Materials
Table 4: Essential Materials for CGM Performance Research
| Item | Specification | Research Application |
|---|---|---|
| CGM Systems | Factory-calibrated models (e.g., FreeStyle Libre 2/3, Dexcom G7) [81] [8] | Primary intervention device; ensure consistent model across study population |
| Reference Glucose Meters | FDA-cleared blood glucose meters with appropriate test strips | Gold-standard comparison for CGM accuracy assessment |
| Data Download Software | Manufacturer-specific (e.g, LibreView, Dexcom CLARITY) | Standardized data extraction and ambulatory glucose profile generation |
| Statistical Analysis Tools | Python (Pandas, SciPy, Statsmodels) or R packages [82] | Performance metric calculation, statistical testing, data visualization |
| Clinical Data Collection Forms | Standardized case report forms | Capture demographics, medications, comorbidities, adverse events |
| Sensor Application Supplies | Medical-grade adhesive, skin preparation | Ensure proper sensor attachment and longevity |
| Educational Materials | Standardized instruction protocols | Consistent patient training across study sites |
The performance evaluation of CGM systems requires carefully tailored approaches that address the distinct challenges of outpatient and inpatient environments. Outpatient studies benefit from longer durations that capture real-world behavior and glycemic patterns, while inpatient research must prioritize rapid detection of dysglycemia and workflow integration. Both settings are moving beyond traditional MARD-based evaluation toward multidimensional frameworks encompassing safety, performance, usability, and equity [79].
Standardized protocols—such as those presented here—enable reproducible, comparable research across institutions. The evolving regulatory landscape, including emerging consensus on standardized metrics [24] [7], will further strengthen evidence quality. Researchers should select evaluation methodologies that align with their specific clinical question while maintaining rigor through predefined endpoints, appropriate statistical power, and comprehensive reporting of both analytical and clinical outcomes.
Comparative Analysis of CGM Integration with Automated Insulin Delivery Systems
Automated Insulin Delivery (AID) systems represent a transformative technological advancement in diabetes management, integrating three core components: a continuous glucose monitor (CGM), an insulin pump, and a control algorithm that automatically adjusts insulin delivery based on real-time glucose levels [84]. These systems, also known as hybrid closed-loop systems, have fundamentally changed treatment paradigms for people with diabetes (PWD) by reducing the cognitive burden of constant glucose management while improving clinical outcomes [85]. The integration between CGM technology and insulin delivery algorithms forms the critical foundation of these systems, enabling responsive and personalized insulin modulation with minimal user intervention. This analysis examines the current landscape of AID systems with particular focus on their CGM integration methodologies, performance characteristics, and implementation protocols relevant to research and clinical applications.
The evolution from open-loop to hybrid closed-loop systems marks a significant milestone in diabetes technology [86]. While early systems required manual glucose testing and insulin dosing, contemporary AID systems automate background (basal) insulin delivery and can provide automatic correction boluses in response to hyperglycemia [84]. However, as hybrid systems, they still require user input for meal announcements, making the quality and reliability of CGM data absolutely essential for optimal system performance [86] [85]. The interface between CGM systems and AID algorithms represents an active area of research and development, with ongoing efforts to enhance interoperability, accuracy, and user experience.
Current AID Systems and CGM Integration Landscape
Commercial AID Systems and Their CGM Partnerships
The current AID landscape in the United States features five principal systems, each with distinct CGM integration approaches and algorithmic strategies [84]. These systems differ in their form factors, user interaction models, and compatibility with various CGM technologies, creating a diverse ecosystem for patients and researchers alike.
Table 1: Commercial AID Systems and CGM Integration Capabilities
| AID System | Manufacturer | CGM Integrations | Unique Algorithm Features | Form Factor |
|---|---|---|---|---|
| Tandem Control-IQ+ | Tandem Diabetes Care | Dexcom G6, Dexcom G7, Abbott FreeStyle Libre 2 Plus (t:slim X2) [84] | AutoBolus for predicted hyperglycemia, Sleep and Exercise activity modes [84] | Tubed pump (t:slim X2 or Mobi) [84] |
| Medtronic MiniMed 780G | Medtronic | Guardian 4 Sensor; Simplera Sync (coming soon), Abbott FreeStyle Libre (future) [84] | Meal Detection technology, target as low as 100 mg/dL [84] | Tubed pump [84] |
| Insulet Omnipod 5 | Insulet | Dexcom G6, Dexcom G7, Abbott FreeStyle Libre 2 Plus [84] | SmartAdjust adaptive learning algorithm, tubeless design [84] | Tubeless patch pump [84] |
| Beta Bionics iLet | Beta Bionics | Dexcom G6, Dexcom G7, Abbott FreeStyle Libre 3 Plus [84] | Weight-based initialization, no carb counting (meal announcement only) [84] | Tubed pump [84] |
| Sequel twiist | Sequel | Abbott FreeStyle Libre 3 Plus; Eversense 365 (expected 2025) [84] | Tidepool Loop algorithm, emoji-based adjustments [84] | Tubed pump [84] |
The interoperability between AID systems and CGM technologies has become increasingly important as the field evolves. Recent partnerships between device manufacturers, such as the collaboration between Medtronic and Abbott, signal a movement toward greater user choice and system flexibility [84]. This cross-compatibility enables users to select CGM systems that best meet their individual needs while maintaining AID functionality, potentially improving adoption and long-term engagement.
Performance Metrics and Clinical Outcomes
Recent meta-analyses of randomized controlled trials have quantified the efficacy of AID systems across various demographic groups, with particular focus on pediatric and adolescent populations [87]. The consolidated data from 11 trials involving 901 participants demonstrates consistent improvements in key glycemic metrics compared to standard care approaches.
Table 2: AID System Efficacy Outcomes from Meta-Analysis of 11 RCTs (n=901)
| Glycemic Metric | Baseline Values | Post-AID Intervention | Mean Difference | Clinical Significance |
|---|---|---|---|---|
| Time in Range (TIR) | 51% (mean) [87] | 62.5% | +11.5% (95% CI: 9.3%-13.7%) [87] | Clinically meaningful improvement [87] |
| HbA1c | 8.4% (mean) [87] | ~8.0% | -0.41% (95% CI: -0.58% to -0.25%) [87] | Statistically significant reduction [87] |
| Nighttime TIR | Not specified | Not specified | +19.7% (95% CI: 17.0%-22.4%) [87] | Most pronounced improvement [87] |
| Hypoglycemia (<3.9 mmol/L) | Not specified | Not specified | -0.32% (95% CI: -0.60% to -0.03%) [87] | Significant reduction without increasing adverse events [87] |
| Hyperglycemia (>10 mmol/L) | Not specified | Not specified | -10.8% (95% CI: -14.4% to -7.2%) [87] | Significant reduction [87] |
The data reveals that AID systems produce particularly robust improvements during nighttime hours, with nighttime TIR increasing by 19.7% compared to control regimens [87]. This finding suggests that automated algorithms may effectively mitigate nocturnal hypoglycemia and dawn phenomenon fluctuations that often challenge manual management approaches. Importantly, these glycemic improvements occurred without increasing adverse events, supporting the safety profile of current AID technologies [87].
Technical Protocols for AID Research and Implementation
CARES Framework for AID System Analysis
The CARES framework, developed through NIDDK-funded AID research, provides a structured approach for evaluating and comparing AID systems across five critical domains [85]. This methodological framework offers researchers and clinicians a standardized template for assessing technical and operational characteristics that influence system performance and usability.
Table 3: CARES Framework for AID System Analysis
| Domain | Key Evaluation Questions | Application in Research Protocols |
|---|---|---|
| Calculate | How does the algorithm calculate insulin delivery? Which components are automated? [85] | Document basal modulation approach, correction bolus logic, meal detection capabilities |
| Adjust | Which parameters can users adjust during automation? [85] | Identify fixed vs. customizable settings (carb ratios, insulin action time, basal rates) |
| Revert | When does the system default to open-loop? When should users manually revert? [85] | Define failure scenarios, manual override protocols, situations requiring open-loop operation |
| Educate | What are key education points for optimal system use? [85] | Develop standardized training materials, trouble-shooting guides, advanced feature education |
| Sensor/Share | What are the characteristics of the integrated CGM? How is data shared? [85] | Specify CGM accuracy metrics, lag time, connectivity options, remote monitoring capabilities |
Implementation of the CARES framework in research settings ensures consistent evaluation methodology across different AID platforms, facilitating more meaningful comparisons and aggregate analyses. The framework particularly emphasizes the importance of understanding algorithm-specific characteristics and their implications for clinical use [85].
Experimental Protocol for AID System Performance Evaluation
Objective: To evaluate the efficacy and safety of AID systems in outpatient settings over prolonged periods (≥6 months) with specific attention to CGM integration performance.
Population: Youth aged 6-18 years with type 1 diabetes; baseline HbA1c 8.4% ± 1.1%; baseline TIR 51% ± 9% [87]. Similar protocols can be adapted for adult populations.
Intervention Protocol:
- System Initiation: Conduct device initialization according to manufacturer specifications with weight-based settings or previous pump parameters as appropriate [84]
- CGM Correlation: Verify CGM accuracy against capillary glucose measurements during initialization phase (first 24-48 hours)
- Algorithm Learning Period: Allow 2-4 weeks for adaptive algorithms to establish personalization patterns [84]
- Outpatient Monitoring: Implement continuous remote data monitoring with standardized alert protocols for clinical staff
Control Group Methodology:
- Utilize sensor-augmented pump therapy or multiple daily injections with CGM [87]
- Match contact time with intervention group
- Implement blinded CGM collection for objective outcome assessment
Primary Outcome Measures:
- Time in Range (TIR): 3.9-10.0 mmol/L (70-180 mg/dL) [87]
- HbA1c change from baseline [87]
- Nocturnal vs. daytime TIR stratification [87]
Secondary Outcome Measures:
- Time in hypoglycemia (<3.9 mmol/L) and hyperglycemia (>10.0 mmol/L) [87]
- Glucose variability (coefficient of variation)
- Patient-reported outcomes (quality of life, diabetes distress, sleep quality) [85]
- System usability and satisfaction metrics
Data Collection Schedule:
- Baseline: HbA1c, CGM data (2-week collection), quality of life questionnaires
- Monthly: CGM data download, adverse event assessment
- Endpoint (6 months): HbA1c, CGM data (2-week collection), quality of life questionnaires
Statistical Considerations:
- Power calculation based on TIR difference of ≥5% as clinically meaningful
- Intention-to-treat analysis with multiple imputation for missing data
- Adjustment for potential confounding variables (age, diabetes duration, baseline HbA1c)
Visualization of CGM-AID Integration Workflow
CGM-AID System Integration and Data Flow
CGM AID Data Flow - This diagram illustrates the continuous feedback loop that characterizes automated insulin delivery systems, highlighting the critical integration points between CGM data, algorithmic processing, and insulin delivery.
Human-Machine Interaction in AID Systems
Human Machine Interaction - This visualization depicts the complex interaction between users and AID systems, emphasizing the "interface zone" where human decision-making meets automated algorithm functions [85].
Research Reagents and Technical Toolkit
Essential Materials for AID Research
Table 4: Research Reagent Solutions for AID Investigations
| Reagent/Category | Function/Application | Examples/Specifications |
|---|---|---|
| Continuous Glucose Monitors | Provide real-time interstitial glucose measurements for algorithm input [84] | Dexcom G6/G7, Abbott FreeStyle Libre 2 Plus/3, Medtronic Guardian 4, Eversense 365 (implantable) [84] |
| Insulin Pump Systems | Deliver precise subcutaneous insulin doses as commanded by control algorithm [84] | Tandem t:slim X2/Mobi, Medtronic 780G pump, Insulet Omnipod 5, Beta Bionics iLet, Sequel twiist [84] |
| Control Algorithms | Process CGM data and calculate appropriate insulin dosing [84] | Proprietary algorithms (Control-IQ, SmartAdjust, Meal Detection); Open-source (Tidepool Loop) [84] |
| Data Sharing Platforms | Enable remote monitoring and data collection for research purposes [86] [85] | Manufacturer cloud platforms (Dexcom Clarity, Tandem t:connect), Tidepool, custom research interfaces |
| Reference Glucose Meters | Provide calibrated measurements for CGM accuracy assessment [87] | FDA-cleared blood glucose meters with established accuracy standards |
| Standardized Meal Challenges | Assess postprandial algorithm performance under controlled conditions [85] | Fixed carbohydrate content meals, mixed-macronutrient composition |
| Quality of Life Metrics | Quantify patient-reported outcomes and user experience [85] [87] | Validated questionnaires (Diabetes Distress Scale, WHO-5 Well-Being Index, system satisfaction surveys) |
| Glycemic Variability Analysis Tools | Calculate secondary endpoints beyond TIR and HbA1c [87] | Coefficient of variation, mean amplitude of glycemic excursions, glucose management indicator |
Discussion and Future Directions
The integration of CGM technology with automated insulin delivery systems represents a remarkable advancement in diabetes care, with robust evidence supporting improved glycemic outcomes across diverse patient populations [87]. However, several challenges and opportunities for enhancement remain as this technology continues to evolve.
Implementation Challenges and Disparities
Despite demonstrated efficacy, significant disparities exist in AID access and utilization. Racial and ethnic minority groups have been substantially underrepresented in the pivotal clinical trials that supported regulatory approval of AID systems [85]. This limited representation during development stages may result in devices that do not fully consider the needs and preferences of diverse populations, potentially exacerbating healthcare disparities [85]. Additionally, factors such as cost, insurance coverage variations, and healthcare professional biases contribute to uneven uptake of these technologies [85]. Future research must prioritize inclusive recruitment strategies and examine implementation barriers across different socioeconomic and demographic groups.
The human-machine interaction paradigm in AID systems presents another complex implementation challenge. While AID systems generally reduce diabetes management burden and improve quality of life for many users, issues such as alarm fatigue, device visibility, and trust in automated algorithms can impact user experience and adherence [85]. Developing standardized approaches to assess and address these psychosocial factors is essential for optimizing real-world AID utilization.
Emerging Innovations and Research Priorities
The next generation of AID systems is evolving toward more fully automated solutions with reduced user input requirements. Key areas of development include:
- Multi-hormonal Systems: Investigation of dual-hormone AID systems delivering both insulin and glucagon to more precisely manage glycemic extremes [84]
- Advanced Meal Detection: Enhancement of algorithm capabilities to automatically detect and respond to meals without manual announcements [84]
- Interoperability Standards: Development of universal communication protocols to enable mixing of different manufacturers' CGMs and pumps [84]
- Adaptive Personalization: Implementation of machine learning approaches that continuously refine algorithm parameters based on individual response patterns [84]
- Integration with Adjunctive Therapies: Exploration of AID system coordination with other diabetes technologies such as non-invasive glucose monitoring and smart pens [88]
Research methodologies must also evolve to keep pace with technological advancements. There is a critical need for more comprehensive assessment of patient-reported outcomes and quality of life measures in AID research [87]. Additionally, study designs should incorporate longer follow-up periods to evaluate sustained efficacy and safety, and include more diverse populations to ensure equitable benefit across all demographic groups [85] [87].
The integration of continuous glucose monitoring with automated insulin delivery systems has transformed diabetes management, offering improved glycemic control, reduced hypoglycemia risk, and enhanced quality of life for many users. Current evidence demonstrates that these systems significantly increase time in range while reducing HbA1c, with particularly pronounced benefits during overnight periods [87]. The evolving landscape of AID technologies features increasingly sophisticated algorithms and expanding CGM compatibility, providing more options for personalized diabetes management.
Future progress in AID development will require continued collaboration across multiple stakeholders, including people with diabetes, clinicians, researchers, device manufacturers, and regulatory bodies [85]. Prioritizing inclusive design, addressing implementation barriers, and focusing on the holistic user experience will be essential for maximizing the potential of these transformative technologies. As AID systems become more advanced and accessible, they hold promise for further reducing the burden of diabetes management while improving clinical outcomes across diverse patient populations.
Validation of Over-the-Counter CGM Systems for Research Applications
The recent regulatory clearance of over-the-counter (OTC) continuous glucose monitoring (CGM) systems represents a transformative development in diabetes research methodology [89] [2]. These devices potentially offer unprecedented access to longitudinal glucose data across diverse populations, including healthy, prediabetic, and type 2 diabetic individuals outside traditional clinical settings. This application note provides a structured framework for validating OTC CGM systems for scientific research, establishing minimum performance standards, experimental protocols for accuracy verification, and analytical methodologies for exploiting the high temporal resolution of CGM data in research applications. Proper validation is essential to ensure data quality and reliability for clinical studies, drug development, and personalized nutrition research.
Over-the-counter CGM systems have emerged as a significant milestone in glucose monitoring technology, transitioning from prescription-only medical devices to accessible health tools [89] [2]. The FDA's clearance of the first OTC CGM in 2024 has fundamentally altered the accessibility landscape, allowing research participants to directly purchase and use these systems without physician involvement or insurance barriers [2]. This regulatory shift potentially enables researchers to conduct larger, more ecologically valid studies of glucose metabolism across diverse populations.
Unlike prescription CGM systems intended for non-adjunctive use (replacing fingerstick tests for insulin dosing), OTC systems are currently positioned for lifestyle management, providing trend data to help users understand how diet, exercise, and other factors affect glucose patterns [2]. For research applications, this distinction is crucial—while OTC CGM systems offer remarkable opportunities for population-scale studies, their validation for scientific purposes requires rigorous assessment of analytical performance, especially when used in populations beyond their intended use case.
Modern CGM systems, including OTC models, measure glucose concentration in interstitial fluid rather than blood, creating a physiological lag of 5-20 minutes between blood and interstitial glucose levels due to the time required for glucose to diffuse from capillaries into the interstitial space [90] [26]. This fundamental physiological difference must be accounted for in research protocols, particularly when studying rapid glucose fluctuations.
Performance Standards and Regulatory Framework
Established Accuracy Metrics for CGM Systems
The research community has developed several standardized metrics to evaluate CGM performance, with Mean Absolute Relative Difference (MARD) representing the most widely adopted measure of CGM accuracy [26]. MARD calculates the average absolute percentage difference between CGM readings and reference blood glucose values, with lower values indicating better accuracy. Modern CGM systems typically achieve MARD values of 7.9-13.6% in outpatient settings [89] [2]. However, MARD has limitations as a sole metric and should be interpreted alongside additional accuracy measures.
Table 1: Standard Accuracy Metrics for CGM Validation
| Metric | Calculation | Interpretation | Optimal Values |
|---|---|---|---|
| MARD | Average of |(CGM - Reference)/Reference| × 100% | Overall accuracy measure | <10% (Excellent) 10-15% (Good) >15% (Concerning) |
| Consensus Error Grid | Categorization of point accuracy into risk zones (A-E) | Clinical accuracy assessment | >99% in Zones A+B |
| ISO 15197:2013 | Percentage within ±15mg/dL (<100 mg/dL) or ±15% (≥100 mg/dL) | Standard for BGM systems | ≥95% of results |
| iCGM Special Controls | Multiple thresholds across glycemic ranges | FDA standards for integrated systems | Varies by glucose range [91] |
The International Organization for Standardization (ISO) 15197:2013 standard, while developed for blood glucose monitoring systems, provides a useful framework for evaluating point accuracy [26]. This standard requires that ≥95% of results fall within ±15 mg/dL of reference values at glucose concentrations <100 mg/dL or within ±15% at concentrations ≥100 mg/dL [26].
FDA iCGM Special Controls for Research-Grade Systems
For research requiring the highest accuracy standards, particularly studies interfacing with automated insulin delivery systems or serving as primary endpoints in clinical trials, the FDA's "integrated CGM" (iCGM) special controls represent the current regulatory gold standard [91]. These standards establish stringent accuracy requirements across the glycemic range:
Table 2: FDA iCGM Special Control Accuracy Requirements [91]
| Glucose Range | Accuracy Requirement | Threshold |
|---|---|---|
| <70 mg/dL | % within ±15 mg/dL | >85% (lower 95% confidence bound) |
| 70-180 mg/dL | % within ±15% | >70% (lower 95% confidence bound) |
| >180 mg/dL | % within ±15% | >80% (lower 95% confidence bound) |
| All ranges | % within ±20% | >87% (lower 95% confidence bound) |
| <70 mg/dL | % within ±40 mg/dL | >98% (lower 95% confidence bound) |
| 70-180 mg/dL | % within ±40% | >99% (lower 95% confidence bound) |
| >180 mg/dL | % within ±40% | >99% (lower 95% confidence bound) |
Additional iCGM requirements include limits on rate-of-change errors (≤1% significant directional discrepancies) and cross-over errors (no CGM values <70 mg/dL when reference >180 mg/dL and vice versa) [91]. While OTC systems may not meet all iCGM requirements, these standards provide an optimal target for research validation.
Experimental Validation Protocols
Laboratory Accuracy Validation Protocol
Purpose: To establish analytical accuracy of OTC CGM systems against reference methods under controlled conditions.
Materials:
- OTC CGM systems (minimum 3 lots, 10 sensors per lot)
- Reference glucose analyzer (YSI 2300 STAT Plus or equivalent)
- Capillary blood sampling supplies
- Controlled conditions facility
- Data collection forms/electronic capture
Procedure:
- Participant Selection: Recruit 30-40 participants representing the intended study population (healthy, prediabetic, or diabetic)
- Sensor Application: Apply CGM sensors according to manufacturer instructions at approved sites (abdomen, arm)
- Clamp Procedure: Conduct glucose clamps to achieve stable glucose levels at multiple points (hypoglycemic, euglycemic, hyperglycemic)
- Parallel Sampling: Collect capillary blood samples at 15-minute intervals for 48 hours for reference measurement
- Data Collection: Record paired CGM and reference values, noting sensor age and wear conditions
- Statistical Analysis: Calculate MARD, consensus error grid distribution, and percentage within ISO 15197:2013 limits
Acceptance Criteria: Research-grade systems should demonstrate MARD <10%, >95% consensus error grid Zone A, and >70% values within iCGM ±15%/15mg/dL thresholds [26] [91].
Real-World Reliability Assessment Protocol
Purpose: To evaluate OTC CGM performance in free-living conditions relevant to observational studies.
Materials:
- OTC CGM systems
- Capillary blood glucose meter with data storage
- Activity/sleep logs
- Mobile data collection platform
Procedure:
- Study Design: Deploy paired CGM systems (n=50-100 participants) for 14-day wear period
- Fingerstick Correlation: Program 4-7 daily fingerstick tests at varying times (fasting, postprandial, nocturnal)
- Contextual Data Collection: Log meals, exercise, sleep, and potential interferents
- Data Integrity Monitoring: Track sensor failures, signal dropouts, and early termination
- Comparative Analysis: Calculate day-wise MARD, time-in-range concordance, and trend accuracy
Analysis Methods:
- Point Accuracy: MARD, bias, and precision calculations against capillary references
- Trend Accuracy: Rate-of-change comparison between consecutive CGM values and reference measurements
- Clinical Agreement: Consensus error grid analysis stratified by meal, exercise, and sleep periods
- Reliability Metrics: Percentage of sensors completing wear period, data availability gaps
Table 3: Essential Materials for CGM Validation Research
| Category | Specific Items | Research Application |
|---|---|---|
| Reference Systems | YSI 2300 STAT Plus, Yellow Springs Instruments | Laboratory reference standard for glucose measurement |
| Capillary BGM | Contour Next, FreeStyle Lite | Field reference method with established accuracy |
| Data Logging | Electronic diaries, Mobile apps | Contextual data capture (meals, activity, symptoms) |
| Analysis Software | R, Python with custom packages, MATLAB | Statistical analysis and glucose metric calculation |
| Clamp Equipment | Infusion pumps, Glucose assays | Controlled glycemic manipulation for accuracy testing |
Advanced Analytical Approaches for CGM Data
Beyond MARD: Novel Metrics for Research Applications
While MARD provides valuable summary accuracy information, exploiting the full potential of CGM data requires advanced analytical approaches. The emerging concept of "glucodensity" functional profiles represents a significant methodological advancement, capturing the complete distribution of glucose values rather than relying on summary statistics [78].
Glucodensity Analysis:
- Transforms CGM time series into continuous density functions
- Captures distributional characteristics beyond traditional metrics
- Enables functional data analysis approaches for longitudinal studies
- Demonstrates >20% improvement in predicting long-term HbA1c compared to traditional metrics [78]
Dynamic Glucose Measures:
- Glucose Velocity: Rate of change (mg/dL per minute)
- Glucose Acceleration: Change in velocity over time
- Glycemic Excursion Patterns: Timing, magnitude, and shape of glucose fluctuations
These advanced metrics are particularly valuable for nutritional studies, drug development, and early metabolic dysfunction detection, where traditional metrics may overlook important dynamic aspects of glucose homeostasis [78] [92].
Concordance Testing for Paired Device Deployment
Research applications frequently deploy multiple CGM systems simultaneously to compare interventions or validate new technologies. The ZOE PREDICT trial demonstrated strong concordance between simultaneously worn CGM devices, with intra-brand coefficient of variation (CV) of 3.7-4.1% for postprandial glucose response (glucoseiAUC0-2h) [92].
Protocol for Concordance Assessment:
- Apply paired CGM systems (same brand or different brands) to participants
- Collect standardized meal response data and free-living glucose profiles
- Calculate correlation of incremental area under the curve (glucoseiAUC0-2h)
- Assess within-subject meal ranking consistency using Kendall τ rank correlation
- Evaluate time-in-range concordance using CV of paired measurements
Acceptable performance includes intra-brand CV <5% for glucoseiAUC0-2h and Kendall τ >0.8 for meal ranking consistency [92].
Research Applications and Implementation Guidelines
Specific Research Use Cases
Personalized Nutrition Studies:
- Use OTC CGM to characterize individual glycemic responses to foods
- Leverage high within-person consistency (Kendall τ = 0.9) for meal ranking
- Deploy for 10-14 days to capture habitual dietary responses
- Combine with dietary logging for meal composition analysis
Drug Development Applications:
- Utilize CGM as primary endpoint for metabolic drug trials
- Capture glucose variability effects beyond HbA1c
- Employ iCGM-grade systems for closed-loop intervention studies
- Use glucodensity profiles for comprehensive outcome assessment
Population Health Research:
- Leverage OTC accessibility for large-scale epidemiological studies
- Establish normative CGM data in healthy populations
- Identify early metabolic dysfunction through dynamic patterns
- Monitor glycemic impacts of environmental and lifestyle factors
Practical Implementation Framework
Regulatory Compliance:
- Document validation results against established metrics
- Maintain device-specific performance characteristics
- Implement data security protocols for wireless transmission
- Establish IRB-approved participant training materials
Data Quality Assurance:
- Implement automated data quality checks for signal artifacts
- Establish protocols for handling sensor dropouts and failures
- Create standardized calibration procedures if required
- Develop criteria for sensor data inclusion/exclusion
Analytical Reporting:
- Report MARD stratified by glucose ranges and rates of change
- Include consensus error grid analysis for clinical relevance
- Document proportion of data meeting iCGM thresholds
- Provide reliability metrics (sensor survival, data completeness)
OTC CGM systems represent a powerful methodological tool for contemporary diabetes and metabolism research when appropriately validated. By implementing structured validation protocols against established accuracy standards, researchers can leverage the accessibility of OTC systems while ensuring scientific rigor. The combination of traditional accuracy metrics with advanced functional data analysis approaches enables comprehensive characterization of glucose metabolism across diverse populations and study designs. As CGM technology continues to evolve, maintaining rigorous validation standards will be essential for generating reliable, reproducible scientific evidence from these transformative devices.
Conclusion
The methodological framework for CGM systems is rapidly evolving, with significant advancements in standardization through initiatives like the IFCC Working Group guidelines. The integration of CGM with artificial intelligence represents a transformative frontier for predictive analytics and personalized intervention strategies in diabetes research. Future directions should focus on establishing universal performance standards, validating CGM-derived biomarkers for regulatory endpoints, and expanding applications into prediabetes and metabolic health research. For drug development professionals, these methodological refinements offer enhanced capabilities for monitoring therapeutic efficacy and safety in clinical trials, ultimately accelerating the development of next-generation diabetes therapies. The continued collaboration between clinical chemists, regulatory bodies, and pharmaceutical researchers will be crucial for harmonizing CGM methodology across the research continuum.
References
- 1. Impact of Switching from Intermittently Scanned to Real ... [https://pmc.ncbi.nlm.nih.gov/articles/PMC7994425/]
- 2. Continuous Glucose Monitoring in 2025: Complete Guide ... [https://alternativemedicalcareofarizona.com/2025/11/05/continuous-glucose-monitoring-in-2025-complete-guide-to-cgm-technology-accuracy-and-integration-with-holistic-diabetes-care/]
- 3. Efficacy of intermittently scanned continuous glucose ... [https://pmc.ncbi.nlm.nih.gov/articles/PMC12399012/]
- 4. Evaluation of a Continuous Glucose Monitoring Based ... [https://pmc.ncbi.nlm.nih.gov/articles/PMC12579156/]
- 5. Benefits of a Switch from Intermittently Scanned ... [https://www.mdpi.com/1424-8220/21/18/6131]
- 6. CGM l Interpreting Patient Data l danatech [https://www.adces.org/education/danatech/glucose-monitoring/continuous-glucose-monitors-(cgm)/cgms-in-professional-practice/interpreting-cgm-patient-data]
- 7. A proposed guideline by the IFCC Working Group on CGM [https://www.sciencedirect.com/science/article/pii/S0009898125006072]
- 8. Clinical trial protocol for continuous glucose monitoring in ... [https://pmc.ncbi.nlm.nih.gov/articles/PMC12096265/]
- 9. Technologies for Continuous Glucose Monitoring: Current ... [https://pmc.ncbi.nlm.nih.gov/articles/PMC3005068/]
- 10. Continuous Glucose Monitoring (CGM): What It Is [https://my.clevelandclinic.org/health/articles/continuous-glucose-monitoring-cgm]
- 11. Accuracy and Reliability of Continuous Glucose Monitoring ... [https://pmc.ncbi.nlm.nih.gov/articles/PMC3746288/]
- 12. Dexcom G6 CGM System | No Fingersticks, No Scanning [https://www.dexcom.com/en-us/g6-cgm-system]
- 13. Safety Information | The FreeStyle Libre System [https://www.freestyle.abbott/us-en/safety-information.html]
- 14. State of the Global CGM Market: 2025 [https://sequenex.com/state-of-the-global-cgm-market/]
- 15. Secure Data Exchange in Glucose Monitors - XRAY - GreyB [https://xray.greyb.com/glucose-monitoring/establishing-connections-between-devices]
- 16. A Processing Algorithm to Address Real-World Data ... [https://pmc.ncbi.nlm.nih.gov/articles/PMC11843558/]
- 17. The CGMs Coming In 2025 & Beyond You Need To Know ... [https://www.diabetech.info/p/the-cgms-coming-in-2025-beyond-you-need-to-know-about]
- 18. Advances in Continuous Glucose Monitoring: Clinical ... [https://pmc.ncbi.nlm.nih.gov/articles/PMC12061739/]
- 19. A proposed guideline by the IFCC Working Group on CGM [https://pubmed.ncbi.nlm.nih.gov/41253217/]
- 20. Recommendations on the Collection of Comparator ... [https://pubmed.ncbi.nlm.nih.gov/41098226/]
- 21. Reproducibility of continuous glucose monitoring results ... [https://www.nature.com/articles/s41598-023-40949-1]
- 22. A Minimal Model Approach for Analyzing Continuous ... [https://www.frontiersin.org/journals/physiology/articles/10.3389/fphys.2018.00673/full]
- 23. Standardization process of continuous glucose monitoring [https://www.sciencedirect.com/science/article/abs/pii/S0009898120305933]
- 24. Consensus statement on standardizing CGM evaluation ... [https://dmsjournal.biomedcentral.com/articles/10.1186/s13098-025-01851-0]
- 25. ISO 17511:2020 - In vitro diagnostic medical devices [https://www.iso.org/standard/69984.html]
- 26. Measures of Accuracy for Continuous Glucose Monitoring ... [https://pmc.ncbi.nlm.nih.gov/articles/PMC6501529/]
- 27. A Tale of Two Compartments: Interstitial Versus Blood ... [https://pmc.ncbi.nlm.nih.gov/articles/PMC2903977/]
- 28. Time Lag of Glucose From Intravascular to Interstitial ... [https://pmc.ncbi.nlm.nih.gov/articles/PMC3837059/]
- 29. Contribution of an Intrinsic Lag of Continuous Glucose ... [https://pmc.ncbi.nlm.nih.gov/articles/PMC3005050/]
- 30. Putative Delays in Interstitial Fluid (ISF) Glucose Kinetics ... [https://pmc.ncbi.nlm.nih.gov/articles/PMC2769670/]
- 31. Interstitial fluid glucose time-lag correction for real ... [https://www.sciencedirect.com/science/article/abs/pii/S1746809412000687]
- 32. Physiological reconstruction of blood glucose level using ... [https://www.nature.com/articles/s41598-022-09884-5]
- 33. Significance and Reliability of MARD for the Accuracy ... [https://pmc.ncbi.nlm.nih.gov/articles/PMC5375072/]
- 34. Benefits and Limitations of MARD as a Performance ... [https://pmc.ncbi.nlm.nih.gov/articles/PMC7189145/]
- 35. Comparison of the Numerical and Clinical Accuracy of Four ... [https://pmc.ncbi.nlm.nih.gov/articles/PMC4607511/]
- 36. Continuous Glucose Monitor Agreement Rates [https://pmc.ncbi.nlm.nih.gov/articles/PMC12021857/]
- 37. Performance of Three Continuous Glucose Monitoring ... [https://pmc.ncbi.nlm.nih.gov/articles/PMC11795573/]
- 38. Considerations for use of Continuous Glucose Monitoring ... [https://pubmed.ncbi.nlm.nih.gov/41204045/]
- 39. Continuous Glucose Monitoring (CGM) use in patients with ... [https://www.sciencedirect.com/science/article/pii/S2666970625000228]
- 40. Design of the Continuous Glucose Monitoring (CGM) Study ... [https://www.sciencedirect.com/science/article/abs/pii/S1551714425000394]
- 41. Navigating CGM and BGM Decisions in GLP-1 Clinical Trials [https://www.appliedclinicaltrialsonline.com/view/fingerstick-cgm-bgm-glp1-clinical-trials]
- 42. Interpreting Continuous Glucose Monitoring (CGM) Data [https://ade.adea.com.au/interpreting-continuous-glucose-monitoring-cgm-data/]
- 43. Core Glycemic Metrics Explained. TIR, TBR, TAR, GMI, CV, ... [https://www.adces.org/education/danatech/glucose-monitoring/continuous-glucose-monitors-(cgm)/glycemic-metrics--an-overview]
- 44. Recommendations on the Collection of Comparator ... [https://pmc.ncbi.nlm.nih.gov/articles/PMC12519613/]
- 45. Therapy Adjustments Based on Trend Arrows Using ... [https://pmc.ncbi.nlm.nih.gov/articles/PMC6610609/]
- 46. Mastering CGM 10 Top Tips [https://theglucoseneverlies.com/mastering-cgm-10-top/]
- 47. Continuous glucose monitoring combined with artificial ... [https://pmc.ncbi.nlm.nih.gov/articles/PMC12146165/]
- 48. Integration of artificial intelligence and wearable ... [https://www.nature.com/articles/s41746-025-02036-9]
- 49. Artificial intelligence in diabetes care: from predictive ... [https://www.frontiersin.org/journals/endocrinology/articles/10.3389/fendo.2025.1620132/full]
- 50. A deep learning framework for virtual continuous glucose ... [https://www.nature.com/articles/s41598-025-01367-7]
- 51. Development of Machine Learning Models to Predict ... [https://www.medrxiv.org/content/10.1101/2025.10.24.25338707v1.full]
- 52. Researchers use AI to help predict and identify subtypes of ... [https://med.stanford.edu/news/all-news/2025/01/type-2-diabetes.html]
- 53. How Home Use CGM System Works — In One Simple Flow ( 2025 ) [https://www.linkedin.com/pulse/how-home-use-cgm-system-works-one-simple-flow-2025-neurofex-systems-uadme]
- 54. A systematic review of continuous glucose monitoring ... [https://www.sciencedirect.com/science/article/pii/S2666053925000797]
- 55. Interferences With CGM Systems: Practical Relevance? [https://pmc.ncbi.nlm.nih.gov/articles/PMC8861798/]
- 56. Dexcom, Inc. MARCS-CMS 700835 — March 04, 2025 [https://www.fda.gov/inspections-compliance-enforcement-and-criminal-investigations/warning-letters/dexcom-inc-700835-03042025]
- 57. CGM User, Device Errors Pharmacists Should Understand [https://www.drugtopics.com/view/cgm-user-device-errors-pharmacists-should-understand-apha-2025]
- 58. CGM Data Analysis 2.0: Functional Data Pattern Recognition ... [https://pmc.ncbi.nlm.nih.gov/articles/PMC12356821/]
- 59. Statistical Tools to Analyze Continuous Glucose Monitor Data [https://pmc.ncbi.nlm.nih.gov/articles/PMC2903980/]
- 60. The Impact of Interfering Substances on Continuous ... [https://pmc.ncbi.nlm.nih.gov/articles/PMC12535586/]
- 61. Classification of Continuous Glucose Monitoring Devices ... [https://pmc.ncbi.nlm.nih.gov/articles/PMC12614895/]
- 62. CGM Interfering Substances Cheat Sheet [https://diabetesed.net/cgm-interfering-substances-cheat-sheet/]
- 63. Continuous glucose monitoring and metrics for clinical trials [https://www.sciencedirect.com/science/article/abs/pii/S2213858722003199]
- 64. Accuracy of Glucose Trends by Subcutaneous Continuous ... [https://pmc.ncbi.nlm.nih.gov/articles/PMC12289614/]
- 65. Within-person and between-sensor variability in ... [https://pmc.ncbi.nlm.nih.gov/articles/PMC9898170/]
- 66. Noninvasive Continuous Glucose Monitoring Using ... [https://pmc.ncbi.nlm.nih.gov/articles/PMC12292979/]
- 67. The use of continuous glucose monitoring: A scoping ... [https://www.sciencedirect.com/science/article/abs/pii/S113023992500029X]
- 68. Health Technology Assessment of Continuous Glucose ... [https://pmc.ncbi.nlm.nih.gov/articles/PMC12384686/]
- 69. Feasibility of continuous glucose monitoring in children ... [https://pmc.ncbi.nlm.nih.gov/articles/PMC12356713/]
- 70. Clinical Targets for Continuous Glucose Monitoring Data ... [https://pmc.ncbi.nlm.nih.gov/articles/PMC6973648/]
- 71. Using continuous glucose monitoring data in daily clinical ... [https://www.ccjm.org/content/91/10/611]
- 72. More Green, Less Red: How Color Standardization May ... [https://pmc.ncbi.nlm.nih.gov/articles/PMC8875060/]
- 73. 5 Best Continuous Glucose Monitors for 2025 [https://www.type1strong.org/blog-post/5-best-continuous-glucose-monitors-for-2025]
- 74. A Comparative Analysis of Glycemic Metrics Derived From ... [https://pubmed.ncbi.nlm.nih.gov/40198142/]
- 75. CGM Device Comparison [https://pro.aace.com/cgm/toolkit/cgm-device-comparison]
- 76. The top CGM stories of 2025 [https://www.drugdeliverybusiness.com/the-top-cgm-stories-of-2025/]
- 77. Consensus statement on standardizing CGM evaluation ... [https://pmc.ncbi.nlm.nih.gov/articles/PMC12278652/]
- 78. Glucodensity functional profiles outperform traditional ... [https://www.nature.com/articles/s41598-025-18119-2]
- 79. Rethinking Continuous Glucose Monitoring (CGM) Evaluation ... [https://pmc.ncbi.nlm.nih.gov/articles/PMC12401530/]
- 80. Continuous Glucose Monitoring in the Hospital Setting [https://www.uspharmacist.com/article/continuous-glucose-monitoring-in-the-hospital-setting]
- 81. JMIR Research Protocols - Impact of Pharmacist-Led Continuous... [https://www.researchprotocols.org/2025/1/e67014]
- 82. Comparing glucose monitoring methods: efficiency insights ... [https://pmc.ncbi.nlm.nih.gov/articles/PMC12170324/]
- 83. Continuous Glucose Monitoring under standardised conditions... [https://journals.plos.org/digitalhealth/article?id=10.1371/journal.pdig.0001087]
- 84. Automated Insulin Delivery Systems: A Complete Guide [https://tcoyd.org/2025/04/automated-insulin-delivery-systems-comparison/]
- 85. Practical Considerations and Implementation of Automated ... [https://pmc.ncbi.nlm.nih.gov/articles/PMC12213529/]
- 86. Looking at Automated Insulin Delivery Systems 2025 [https://childrenwithdiabetes.com/clinical-director/looking-at-automated-insulin-delivery-systems-2025/]
- 87. Automated Insulin Delivery Systems and Glucose ... [https://pmc.ncbi.nlm.nih.gov/articles/PMC12418225/]
- 88. Research updates from EASD 2025 [https://www.breakthrought1d.org/news-and-updates/research-updates-from-easd-2025/]
- 89. Transformative Advances in Continuous Glucose ... [https://pmc.ncbi.nlm.nih.gov/articles/PMC12007415/]
- 90. The Need for Performance Standards for Continuous ... [https://pmc.ncbi.nlm.nih.gov/articles/PMC2769611/]
- 91. 21 CFR 862.1355 -- Integrated continuous glucose ... [https://www.ecfr.gov/current/title-21/chapter-I/subchapter-H/part-862/subpart-B/section-862.1355]
- 92. Validity of continuous glucose monitoring for categorizing ... [https://www.sciencedirect.com/science/article/pii/S0002916522002829]