Conductometric Biosensors: Principles, Biomedical Applications, and Future Outlook for Drug Development
This article provides a comprehensive exploration of conductometric biosensors, a key category of electrochemical biosensors that measure changes in electrical conductivity.
Conductometric Biosensors: Principles, Biomedical Applications, and Future Outlook for Drug Development
Abstract
This article provides a comprehensive exploration of conductometric biosensors, a key category of electrochemical biosensors that measure changes in electrical conductivity. Tailored for researchers, scientists, and drug development professionals, it covers the foundational principles of how biological recognition events are transduced into quantifiable electrical signals. The scope extends to detailed methodologies, material selection, and cutting-edge applications in biomedical analysis, including pathogen detection and therapeutic monitoring. It further addresses critical challenges in sensor design, such as optimizing sensitivity and ensuring reproducibility, and offers a comparative analysis with other biosensor transduction methods. By synthesizing recent advancements and practical implementation strategies, this review serves as a vital resource for developing next-generation diagnostic and monitoring tools.
The Building Blocks of Conductometric Biosensors: Core Principles and Components
Defining Conductometric Biosensors within the Electrochemical Biosensor Family
Conductometric biosensors represent a distinct class of electrochemical biosensors that measure changes in the electrical conductivity of a solution resulting from biochemical reactions [1] [2]. These devices belong to the broader family of electrochemical biosensors but are characterized by their unique transduction mechanism, which detects variations in ionic composition between two electrodes within an electrochemical cell [3] [4]. Unlike other electrochemical biosensors that may measure potential (potentiometric) or current (amperometric), conductometric devices specifically monitor the electrical conductivity of the solution, which alters as enzymatic or other biorecognition processes consume or produce charged species [1]. This technical guide examines the fundamental principles, design configurations, and experimental implementations of conductometric biosensors within the context of ongoing research aimed at enhancing their sensitivity, selectivity, and applicability across biomedical and environmental domains.
The significance of conductometric biosensors within the electrochemical family stems from their several inherent advantages. These biosensors can be produced through inexpensive thin-film standard technology, require no reference electrode, and their differential measurement mode effectively cancels out many interferences [1]. Furthermore, their transducers are not light sensitive, and the required driving voltage can be sufficiently low to significantly decrease power consumption [1]. The versatility of these sensors enables determination of a large spectrum of compounds across different application fields, from environmental pollutant detection to medical diagnostics [5] [2].
Fundamental Principles and Theoretical Framework
Basis of Conductometric Measurement
The operational principle of conductometric biosensors relies on the measurement of electrolytic conductivity changes in a solution resulting from biochemical reactions that alter the ionic composition [1] [2]. When enzymatic reactions occur, they typically involve the consumption or production of charged species, leading to a global change in the ionic composition within the tested sample and consequently modifying its electrical conductivity [1]. The conductivity (S) of an electrolyte solution can be mathematically expressed as:
S = F × Σzi × ci × ui
where F is Faraday's constant, zi is the charge number of ion i, ci is the concentration of ion i, and ui is the mobility of ion i [1]. This relationship demonstrates that the overall conductivity depends on both the concentration and mobility of all ions present in the solution.
The fundamental mechanism involves applying an alternating potential to electrodes immersed in the solution, generating an electrical field that induces ordered movement of ions [1]. Cations migrate toward the cathode while anions move toward the anode, with the resulting current proportional to the solution's conductivity. In conductometric biosensors, the biological recognition element (enzyme, antibody, whole cell) is immobilized near the electrodes, and when the target analyte interacts with this bioreceptor, the resulting biochemical reaction alters the local ionic environment, producing a measurable change in conductivity [2].
Ion Mobility and Conductivity Relationships
The conductivity of electrolyte solutions is directly influenced by ion mobility, which varies significantly among different ions. Table 1 presents the mobility values of selected ions in aqueous solutions at infinite dilution and 25°C, illustrating the substantial variation that informs sensor design and interpretation [1].
Table 1: Ion Mobility in Aqueous Solutions at 25°C
| Cation | Mobility (Ohm⁻¹cm²) | Anion | Mobility (Ohm⁻¹cm²) |
|---|---|---|---|
| H⁺ | 349.8 | OH⁻ | 198.3 |
| NH₄⁺ | 73.6 | Cl⁻ | 76.4 |
| K⁺ | 73.5 | NO₃⁻ | 71.5 |
| Na⁺ | 50.1 | CH₃CO₂⁻ | 40.9 |
| Li⁺ | 38.7 | H₂PO₄⁻ | 36.0 |
The data reveals that H⁺ and OH⁻ ions exhibit exceptionally high mobility compared to other ions, which explains why reactions producing or consuming these ions typically generate strong conductometric signals [1]. This principle is frequently exploited in enzyme-based conductometric biosensors where enzymatic reactions alter local pH conditions, thereby significantly changing solution conductivity.
Transducer Design and Configuration
Interdigitated Electrode Structures
The heart of a conductometric biosensor is its transducer, with most researchers agreeing that an interdigitated structure represents the optimal design [1]. These interdigitated electrodes (IDEs), also referred to as interdigitated microelectrodes, typically consist of two comb-like electrode structures fabricated on an insulating substrate with finger widths and gaps ranging from micrometers to nanometers [1]. This configuration creates a distributed sensing volume with enhanced sensitivity for monitoring surface and bulk conductivity changes.
The key advantage of interdigitated electrodes lies in their extensive effective electrode area within a compact footprint, which maximizes sensitivity while enabling miniaturization [1]. Additionally, the planar nature of IDEs makes them compatible with standard microfabrication processes, facilitating cost-effective mass production [1]. The alternating current passed between these finger electrodes primarily samples the solution volume near the electrode surface, making them particularly responsive to localized biochemical reactions occurring in their immediate vicinity.
Differential Measurement Schemes
A critical innovation in conductometric biosensor design is the implementation of differential measurement schemes using paired transducers [1]. This approach involves fabricating two nearly identical interdigitated electrode structures in close proximity: one serving as the working transducer with immobilized biological recognition elements, and the other as a reference transducer without biological components or with inactivated elements.
Table 2: Advantages of Differential Measurement Configuration
| Feature | Benefit |
|---|---|
| Background Conductivity Compensation | Cancels effects of variable background electrolyte levels |
| Temperature Variation Compensation | Minimizes drift from temperature-dependent conductivity changes |
| Common-Mode Interference Rejection | Reduces noise from electromagnetic interference and other external factors |
| Enhanced Signal-to-Noise Ratio | Improves detection limits and measurement precision |
The differential measurement approach significantly enhances sensor performance by compensating for changes in background conductivity, temperature variations, and other environmental factors that would otherwise interfere with accurate analyte quantification [1]. This configuration allows researchers to distinguish the specific biochemical response from nonspecific conductivity changes, substantially improving measurement reliability, especially in complex sample matrices like biological fluids or environmental samples [1].
Experimental Protocols and Methodologies
Standard Conductometric Measurement Setup
A typical experimental setup for conductometric biosensor measurements consists of several key components arranged in a specific configuration to ensure accurate and reproducible results. The following protocol describes a standardized approach based on established methodologies in the field [6]:
Sensor Preparation: The conductometric transducer, typically featuring interdigitated electrodes, is connected to a holder, and an initial baseline is established in buffer solution.
Instrument Connection: The portable conductometry device (e.g., MXP-3) is connected to the electrical supply network via an adapter, to the sensor block with appropriate wiring, and to a personal computer with specialized data acquisition software.
Measurement Parameters: An alternating current of frequency 37 kHz and amplitude 14 mV is typically applied to minimize electrode polarization and Faradaic processes [6].
Sample Introduction: The tested substance is added to the working cell containing the conductometric transducer, either as a bolus addition or through continuous flow.
Response Recording: The conductometric responses are recorded in real-time on a personal computer screen, monitoring changes in conductivity relative to the established baseline.
This experimental configuration enables precise monitoring of conductivity changes resulting from biochemical reactions, with the differential measurement approach effectively compensating for nonspecific variations in the sample matrix [1] [6].
Essential Research Reagent Solutions
Successful implementation of conductometric biosensor experiments requires several key reagent solutions and materials, each serving specific functions in the sensing system:
Table 3: Essential Research Reagent Solutions for Conductometric Biosensors
| Reagent/Material | Function | Application Notes |
|---|---|---|
| Interdigitated Microelectrodes | Conductometric transduction | Typically fabricated on silicon or glass substrates with thin-film metallization |
| Immobilized Bioreceptors | Biological recognition elements | Enzymes, antibodies, aptamers, or whole cells specific to target analyte |
| High Resistivity Silicon (HR-Si) Substrate | Minimizes substrate parasitic conduction | Enhances sensitivity by reducing background signal [5] |
| Buffer Solutions | Maintain constant pH and ionic background | Essential for distinguishing specific signals from background variations |
| Cross-linking Reagents | Stabilize immobilized bioreceptors | Glutaraldehyde, EDC/NHS commonly used for enzyme immobilization |
Recent research has demonstrated the versatility of conductometric sensors based on high resistivity silicon wafers (HR-Si), which can be functionalized with both natural and synthetic antibodies for detecting various biomarkers [5]. These sensors have shown selective and rapid detection (10 min sample incubation and <1 min reading time) in both phosphate buffer saline and saliva media, with detection limits lower than reported healthy levels for targeted biomarkers [5].
Comparative Analysis Within the Electrochemical Biosensor Family
Conductometric biosensors occupy a distinctive position within the broader electrochemical biosensor family, which includes potentiometric, amperometric, and impedimetric devices [7] [3]. While all electrochemical biosensors transform biological interactions into measurable electrical signals, they differ significantly in their transduction mechanisms and operational requirements.
Potentiometric biosensors measure the potential difference at an electrode-electrolyte interface under conditions of zero current flow, typically using ion-selective membranes or field-effect transistors [7]. Amperometric biosensors apply a constant potential and measure the resulting current from redox reactions, while impedimetric sensors analyze the frequency-dependent resistance and capacitance of the electrochemical cell [3]. In contrast, conductometric biosensors directly monitor the ability of the solution to conduct electrical current, which changes as biochemical reactions alter ionic composition [1] [2].
The principal advantage of conductometric biosensors over these other electrochemical platforms includes their simplicity of design, as they require no reference electrode [1]. Additionally, they can operate with low driving voltages, reducing power consumption, and their planar electrode structures are highly amenable to miniaturization and mass production using standard thin-film technologies [1]. However, conductometric biosensors can be more susceptible to interference from variable background conductivity in complex samples compared to other electrochemical techniques, though this limitation is effectively mitigated through differential measurement schemes [1].
Visualization of Core Concepts
Conductometric Biosensor Architecture and Operational Principle
The following diagram illustrates the fundamental architecture and working principle of a conductometric biosensor system, highlighting the key components and the biochemical processes that generate the measurable signal.
This architecture demonstrates how the biological recognition element, typically immobilized on or near the interdigitated electrodes, interacts with the target analyte in the sample solution. This interaction triggers a biochemical reaction that alters the local ionic environment, changing the electrical conductivity between the electrode fingers, which is then transduced into a measurable electrical signal.
Differential Measurement Configuration
The differential measurement scheme represents a crucial innovation in conductometric biosensor design, enabling significant improvements in measurement accuracy and interference rejection. The following diagram illustrates this configuration and its operational logic.
This differential configuration effectively cancels common-mode interferences by subtracting the reference signal (containing only nonspecific effects) from the working sensor signal (containing both specific biochemical response and nonspecific effects), resulting in a clean measurement specific to the target analyte [1]. This approach significantly enhances sensor performance in real-world applications where background conductivity variations and temperature fluctuations would otherwise compromise measurement accuracy.
Conductometric biosensors represent a vital subgroup within the electrochemical biosensor family, characterized by their measurement of solution conductivity changes resulting from biochemical reactions. Their unique advantages, including simple design without reference electrodes, compatibility with miniaturization, low power operation, and cost-effective manufacturability, position them as promising platforms for diverse applications ranging from environmental monitoring to medical diagnostics. The implementation of interdigitated electrode structures with differential measurement schemes has addressed earlier limitations related to background interference, substantially enhancing their real-world applicability. As research continues to advance these technologies through novel materials, improved bioreceptor immobilization strategies, and system integration, conductometric biosensors are poised to make increasingly significant contributions to analytical science, particularly in point-of-care testing and continuous monitoring applications where their fundamental characteristics offer distinct advantages over alternative sensing methodologies.
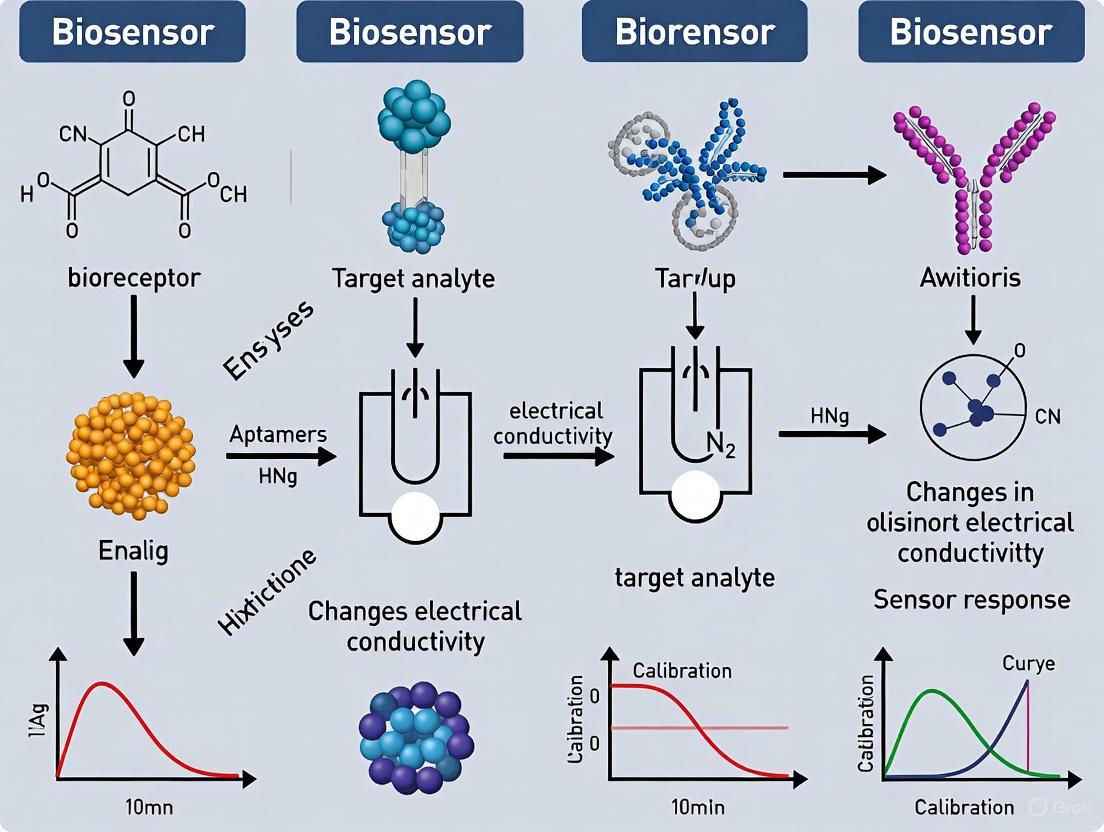
The bioreceptor layer is the cornerstone of any biosensor, serving as the primary element responsible for the specific recognition of the target analyte. This biological or bio-mimetic component dictates the sensor's selectivity by interacting with a specific molecule in a complex sample. In conductometric biosensors, this specific binding event or catalytic reaction induces a change in the electrical conductivity (or resistivity) of the solution between electrodes, which is subsequently transduced into a measurable electrical signal [3] [8]. The performance, reliability, and applicability of the biosensor are fundamentally governed by the properties of the immobilized bioreceptor. The strategic design of this layer from scratch enables a versatile platform technology that can be adapted for various related applications, from personalized healthcare to environmental monitoring [3]. This guide provides an in-depth technical examination of the primary bioreceptors—enzymes, antibodies, aptamers, and whole cells—within the specific context of developing advanced conductometric biosensing platforms for research and drug development.
Classification and Properties of Bioreceptors
Bioreceptors can be broadly classified based on their biological origin and mechanism of action. The selection of an appropriate bioreceptor is paramount and depends on factors such as the required specificity, sensitivity, stability, and the nature of the target analyte [9]. Commonly used bioreceptors include catalytic elements like enzymes and whole cells, which consume the analyte, and affinity-based elements like antibodies and aptamers, which bind to the target without consuming it. Advances in biotechnology have further enabled the engineering of these bioreceptors to enhance their stability and functionality, expanding the possibilities for biosensor applications [9]. The following sections detail the characteristics, advantages, and limitations of each major bioreceptor type.
Table 1: Comparative Analysis of Major Bioreceptor Types
| Bioreceptor | Molecular Target | Binding Mechanism | Key Advantages | Primary Limitations |
|---|---|---|---|---|
| Enzymes | Substrates, Inhibitors | Catalytic Reaction | High turnover number, reusable, amplifies signal | Limited target scope, stability dependent on environment |
| Antibodies | Antigens (Proteins, etc.) | Affinity Binding | Exceptional specificity, wide range of targets | Large size (~150-170 kDa), irreversible denaturation, batch-to-batch variation [10] |
| Aptamers | Ions, small molecules, proteins, cells | Affinity Binding | Small size (5-15 kDa), in vitro selection, reversible denaturation, modifiable [10] | Susceptibility of RNA aptamers to nucleases [10] |
| Whole Cells | Toxins, Nutrients, Effectors | Varies (Uptake, Metabolism) | Provides functional/toxicity data, maintains native environment | Long response time, lower specificity, complex maintenance |
Enzymes
Enzymes are biocatalysts that accelerate specific biochemical reactions. In conductometric biosensors, the enzymatic reaction often involves the consumption or production of ionic species, leading to a local change in the solution's conductivity. A classic example is the detection of glucose using glucose oxidase, which produces gluconic acid and hydrogen peroxide, altering ionic strength [8]. The key advantage of enzymes is their catalytic nature, which amplifies the signal as a single enzyme molecule can process numerous substrate molecules. However, their application is limited to targets that are enzyme substrates, inhibitors, or co-factors, and their activity is highly dependent on environmental conditions such as pH and temperature.
Antibodies
Antibodies are immunoglobulins produced by the immune system that bind to a specific antigen with high affinity. Their exceptional specificity makes them ideal for detecting pathogens, cancer biomarkers, and hormones [10]. In conductometric immunosensors, the formation of an antibody-antigen complex on the transducer surface can alter the ionic distribution or block the electrical double layer, resulting in a measurable conductivity change. The primary drawbacks of antibodies include their relatively large molecular size, which can limit spatial density on the sensor surface, and their susceptibility to irreversible denaturation under non-physiological conditions, leading to limited shelf life [10]. Furthermore, production requires animal hosts, which is costly, time-consuming, and raises ethical considerations [10].
Aptamers
Aptamers are short, single-stranded DNA or RNA oligonucleotides selected in vitro through the Systematic Evolution of Ligands by EXponential enrichment (SELEX) process to bind specific targets with high affinity [10]. They are often called "chemical antibodies" but possess several distinct advantages. Their small molecular weight (5-15 kDa) allows for high surface density on sensors [10]. They can be selected for a vast range of targets, including non-immunogenic molecules. Crucially, their denaturation is reversible, granting them a longer shelf life and robustness. They are chemically synthesized, ensuring low batch-to-batch variation and reduced production costs [10]. A significant limitation, particularly for RNA aptamers, is their susceptibility to degradation by nucleases in biological fluids, though this can be mitigated by chemical modification [10].
Whole Cells
Whole cells, including bacteria, yeast, and mammalian cells, serve as versatile bioreceptors that respond to analytes based on their metabolic or regulatory pathways. They are particularly valuable in environmental monitoring for detecting general toxicity, biological oxygen demand, and in drug discovery for assessing the functional effects of compounds on cellular processes [9]. Whole-cell biosensors provide functional information about analyte bioavailability and physiological effect, which molecular biosensors cannot. However, they typically have longer response times, lower specificity compared to molecular receptors, and require stringent conditions to maintain viability, making them more suited for laboratory than point-of-care applications.
Experimental Protocols for Bioreceptor Immobilization and Characterization
The reliable performance of a conductometric biosensor hinges on the stable and functional immobilization of the bioreceptor onto the transducer surface. The following protocols outline standard methodologies for modifying electrode surfaces and characterizing the resulting bioreceptor layers.
Protocol: Immobilization of Aptamers on a Gold Electrode
This protocol is widely used for creating robust DNA-based aptasensors [3].
- Electrode Pretreatment: Clean the gold electrode surfaces via mechanical polishing with alumina slurry (progressively from 1.0 µm to 0.05 µm), followed by sonication in ethanol and deionized water for 5 minutes each. Electrochemically clean by performing cyclic voltammetry (CV) in 0.5 M H₂SO₄ from 0 V to 1.6 V until a stable CV profile is obtained.
- Thiol Modification: Incubate the pretreated gold electrodes with a 1 µM solution of thiol-terminated aptamer in Tris-EDTA (TE) buffer (pH 7.4) for 16 hours at room temperature. This forms a self-assembled monolayer (SAM) via a strong Au-S bond.
- Backfilling: Rinse the electrode gently with TE buffer to remove physically adsorbed aptamers. To minimize non-specific adsorption and passivate uncovered gold sites, incubate the electrode in a 1 mM solution of 6-mercapto-1-hexanol (MCH) for 1 hour.
- Storage: The functionalized electrode should be rinsed thoroughly with the measurement buffer and can be stored at 4°C until use.
Protocol: Characterization via Electrochemical Impedance Spectroscopy (EIS)
EIS is a powerful, non-destructive method to monitor the step-wise modification of the electrode surface and the binding events [3].
- Setup: Perform EIS in a solution containing 5 mM K₃[Fe(CN)₆]/K₄[Fe(CN)₆] (1:1) in 0.1 M KCl, using a standard three-electrode system (functionalized electrode as working electrode, Pt counter electrode, and Ag/AgCl reference electrode).
- Measurement Parameters: Apply a DC potential equal to the open circuit potential with a 10 mV AC voltage perturbation across a frequency range of 0.1 Hz to 100 kHz.
- Data Analysis: Fit the obtained Nyquist plots to a modified Randles equivalent circuit. The charge transfer resistance (Rₑₜ) is the most critical parameter. A successful aptamer immobilization will increase Rₑₜ compared to a bare electrode. Subsequent binding of the target analyte will further increase Rₑₜ, which can be correlated to the analyte concentration.
Signaling Pathways and Experimental Workflows
The following diagrams illustrate the logical workflow for bioreceptor development and the signal transduction mechanism in a typical conductometric biosensor.
Diagram 1: Biosensor Development Workflow
Diagram 2: Conductometric Signal Transduction
The Scientist's Toolkit: Essential Research Reagents
The development and fabrication of conductometric biosensors require a suite of specialized reagents and materials. The following table details key components for a typical research setup.
Table 2: Essential Research Reagents for Conductometric Biosensor Development
| Reagent / Material | Function / Application | Technical Notes |
|---|---|---|
| Thiol-terminated DNA Aptamers | Bioreceptor for specific target; forms self-assembled monolayer on Au. | Enables covalent immobilization on gold electrodes; 3' or 5' modification available. |
| 6-Mercapto-1-hexanol (MCH) | Passivating agent for gold surfaces. | Reduces non-specific adsorption and orientates immobilized aptamers. |
| N-Hydroxysuccinimide (NHS) / EDC | Crosslinker chemistry for carboxyl-amine coupling. | For immobilizing proteins (antibodies, enzymes) on carbon or modified metal surfaces. |
| Glutaraldehyde | Crosslinker for amine-rich surfaces. | Used for creating stable networks for enzyme or antibody immobilization. |
| Nafion | Cation-exchange polymer membrane. | Used to entrap bioreceptors and repel interfering anions (e.g., ascorbate). |
| Potassium Ferri/Ferrocyanide | Redox probe for EIS characterization. | [Fe(CN)₆]³⁻/⁴⁻ used to monitor electrode surface modification and binding events. |
| Phosphate Buffered Saline (PBS) | Standard measurement and dilution buffer. | Maintains physiological pH and ionic strength; critical for consistent measurements. |
| Nanomaterials (Graphene, CNTs, AuNPs) | Signal-enhancing transducer modifiers. | Increase effective surface area and improve electron transfer kinetics [3] [8]. |
This technical guide examines the fundamental transduction mechanisms in conductometric biosensors, focusing on how biological binding events modulate ionic strength and electrical conductivity to generate quantifiable signals. We explore the principles of charge-carrier dynamics in various media, detailing experimental protocols for measuring these parameters and presenting quantitative data on sensor performance. Framed within broader conductometric biosensor research, this whitepaper provides researchers and drug development professionals with methodologies for designing and optimizing sensitivity, selectivity, and stability in biosensing platforms across medical diagnostics, environmental monitoring, and pharmaceutical applications.
Conductometric biosensors represent a significant class of analytical devices that translate biological recognition events into measurable electrical signals based on changes in a solution's ability to conduct electrical current. The fundamental principle underpinning these sensors is that biological binding events—such as antigen-antibody interactions, enzyme-substrate reactions, or receptor-ligand engagements—alter the ionic composition within the sensing environment, thereby modulating its electrical conductivity [4] [11]. These changes occur because biological interactions often involve charged species; binding events can release or consume ions, change local pH, or modify the mobility of charge carriers, all of which directly impact ionic strength and conductivity [12].
The significance of this transduction mechanism lies in its directness and simplicity. Unlike optical or thermal biosensors that require secondary signal conversion, conductometric sensors directly measure the electrical property changes resulting from biological interactions [13]. This direct measurement approach facilitates miniaturization, enables real-time monitoring, and reduces instrumentation complexity. When biological recognition elements (bioreceptors) such as enzymes, antibodies, DNA, or cells interact with their target analytes, the subsequent biochemical reactions or binding events alter the ionic environment in one of several ways: by generating or consuming ionic species, changing the mobility of existing ions, or modifying the double-layer structure at electrode interfaces [14] [11]. These alterations manifest as measurable changes in the solution's electrical conductivity, providing a quantitative relationship between the target analyte concentration and the electrical output signal.
Within the broader context of biosensor research, understanding these ionic strength and conductivity modulation mechanisms is crucial for advancing sensor design, particularly for applications requiring high sensitivity, miniaturization, or operation in complex biological matrices. The evolution of conductometric biosensors has been accelerated by developments in soft ionic materials [15], microfluidic technologies [16], and nanomaterial-based signal amplification strategies [17], all of which leverage the fundamental principles discussed in this whitepaper.
Fundamental Principles of Ionic Strength and Conductivity Modulation
Ionic Strength as a Determinant of Electrostatic Interactions
Ionic strength (I) represents the effective concentration of ions in solution that actively participate in electrostatic interactions, mathematically defined as I = ½Σcizi², where ci is the molar concentration of ion i and zi is its charge number [12]. This parameter critically influences biosensor function because it determines the degree of electrostatic screening between charged species, directly affecting biological binding affinities and reaction rates. In biosensing applications, the ionic strength governs the Debye length—the characteristic distance over which electrostatic potentials persist in solution—which in turn influences the sensing range and sensitivity, particularly for surface-based detection systems [12].
The ionic strength fundamentally affects electrostatic interactions in biological systems through several mechanisms. First, it screens charged groups on biomolecules, reducing their effective interaction distances. Second, it influences the stability of hydrogen bonds and salt bridges that stabilize protein structures and complex formations. Third, it modulates the activity coefficients of ions and charged macromolecules, affecting their thermodynamic activity and binding behavior [12]. These effects collectively mean that changes in ionic strength directly impact the electrical double layer structure at electrode-solution interfaces, which is critical for conductometric sensing.
Biological Binding-Induced Conductivity Changes
Biological recognition events alter conductivity through multiple mechanisms that affect either ion concentration or mobility. Enzyme-catalyzed reactions often consume or produce ionic species; for instance, urease generates ammonium and bicarbonate ions from urea, increasing solution conductivity [11]. Similarly, oxidase enzymes produce acidic products that dissociate into ions, while hydrolysis reactions can generate or consume protons. Antibody-antigen binding may cause conformational changes that expose or bury charged groups, or form immune complexes that either trap or release counterions [14]. DNA hybridization often releases sequestered counterions from the phosphate backbone into solution as single strands become double-stranded, increasing local ionic strength [11].
These binding-induced changes follow predictable patterns based on the specific biological interaction. For instance, the binding of glucose to boronic acid-functionalized surfaces donates electrons to graphene, increasing its carrier density and thereby altering its optical conductivity—a principle exploited in highly sensitive detection platforms [18]. Similarly, the immobilization of pyrene derivatives via π-π interactions introduces hole carriers into graphene, modifying its electrical characteristics [18]. The magnitude of these conductivity changes depends on factors including the charge density of the participating species, the extent of the binding event, and the solution conditions that govern ion activities.
Table 1: Fundamental Parameters in Conductometric Biosensing
| Parameter | Definition | Impact on Biosensing | Typical Range in Biological Systems |
|---|---|---|---|
| Ionic Strength (I) | Effective ion concentration: I = ½Σcizi² | Determines Debye length, binding affinity, and signal-to-noise ratio | 0.05-0.25 M (intracellular) [12] |
| Electrical Conductivity (σ) | Measure of a material's ability to conduct electric current: σ = Σ(ziFμici) | Directly measured output signal in conductometric biosensors | 1-5 S/m (physiological buffers) |
| Charge Carrier Mobility (μ) | Drift velocity of ions per unit electric field | Affects conductivity independent of ion concentration | 5-8 × 10⁻⁸ m²/V·s (small ions in water) |
| Debye Length (λD) | Characteristic screening length for electrostatic interactions | Determines sensing depth and surface potential influence | 0.7-1.0 nm (physiological buffer) |
Experimental Methodologies for Investigating Ionic Strength and Conductivity Changes
FRET-Based Ionic Strength Sensing in Biological Environments
Förster Resonance Energy Transfer (FRET)-based probes provide a powerful methodology for quantifying ionic strength changes in biological systems, including living cells. This approach utilizes genetically encoded protein sensors consisting of positively and negatively charged α-helices with FRET pair fluorescent proteins (mCerulean3 and mCitrine) attached at their termini [12]. The underlying principle is that electrostatic attraction between the oppositely charged helices brings the FRET pair closer together at low ionic strength, increasing FRET efficiency, while higher ionic strength screens this attraction, decreasing FRET efficiency [12].
The experimental protocol involves several key steps. First, researchers design charged helices with amino acids arranged in i+5 spacing to ensure uniform charge distribution around the helix circumference, preventing charged patches and specific metal ion chelation [12]. Common configurations include lysine-glutamate (KE), arginine-glutamate (RE), and arginine-aspartate (RD) pairs. These sensors are then expressed in target cells, such as HEK293 mammalian cells, and imaged using scanning confocal microscopy with excitation at 405 nm (for mCerulean3) and emission collection at 450-505 nm (mCerulean3) and 505-750 nm (mCitrine) [12]. The FRET ratio (mCitrine/mCerulean3 after background subtraction) provides a quantitative measure of ionic strength, which can be calibrated in cells using external potassium concentration titrations in the presence of ionophores (valinomycin plus nigericin) to equilibrate ions across membranes [12].
This methodology has demonstrated the capability to detect ionic strength changes with precision better than 10 mM in living cells and has revealed dynamic ionic strength variations during osmotic stress responses [12]. When applying this technique, researchers must control for potential confounding factors including macromolecular crowding, pH below 7.0, temperature fluctuations, and specific ion effects that may follow Hofmeister series behavior [12].
Microfluidic-Based Ionic Strength and pH Sensing
Microfluidic platforms offer an alternative approach for measuring ionic strength and pH changes in solution-based assays, particularly useful for analyzing small sample volumes with rapid response times. One innovative design employs 3D-printed microfluidic devices that leverage laminar flow and diffusion phenomena at the microscale to simultaneously determine ionic strength and pH [16]. The working principle exploits the inverse relationship between ionic strength and ion diffusion coefficients—higher ionic strength reduces diffusion rates due to increased electrostatic damping.
The experimental workflow begins with fabricating the microfluidic device using 3D printing technology, creating channels with precise dimensions that ensure laminar flow characteristics [16]. The device features separate inlets for sample and reference solutions that merge into a single channel where lateral diffusion occurs. For pH determination, researchers incorporate pH-sensitive dyes (like bromocresol purple) and analyze color changes using image analysis techniques. For ionic strength measurement, they quantify the diffusion width of ions from sample streams into reference streams, with narrower diffusion zones indicating higher ionic strength [16].
Key protocol steps include: (1) Introducing the sample solution and reference buffer simultaneously at controlled flow rates; (2) Allowing sufficient residence time for diffusion across the laminar interface; (3) Capturing images of the diffusion zone; (4) Measuring diffusion width computationally; and (5) Referencing against calibration curves generated with standard solutions [16]. This methodology has demonstrated sensitivity to ionic strength differences of 0.1 M and pH variations of 0.25 units in non-buffered solutions like wine, making it particularly valuable for food industry applications and remote sensing [16]. The approach offers advantages including minimal reagent consumption, rapid analysis (minutes), portability, and user-friendly operation without requiring sophisticated instrumentation.
Hybrid Metasurface Sensors for Ultrasensitive Detection
Advanced sensing platforms utilizing hybrid metasurfaces combine metallic nano-antennas with conductive materials like graphene to detect minute conductivity changes resulting from molecular binding events. These sensors operate on the principle that molecular doping alters the charge carrier density in materials like graphene, which in turn modifies its optical conductivity and shifts plasmonic resonance frequencies [18]. This approach provides exceptional sensitivity for detecting low-molecular-weight analytes that produce negligible refractive index changes.
The experimental protocol involves several sophisticated steps. First, researchers fabricate hybrid metasurfaces consisting of gold nanorod antenna arrays covered with monolayer graphene, atop a platinum mirror with a silicon dioxide spacer [18]. The graphene is functionalized with specific bioreceptors such as boronic acid for glucose detection. When target molecules bind to these receptors, they donate or accept electrons from the graphene, changing its carrier density [18]. This alteration modifies the graphene's optical conductivity, shifting the plasmonic resonance frequency (ωr) measurable via mid-infrared spectroscopy. Researchers have employed this method to detect glucose at concentrations as low as 200 pM (36 pg/mL) by monitoring these resonance shifts [18].
Critical considerations for this methodology include controlling the graphene quality, optimizing nano-antenna dimensions for maximum electric field enhancement, and functionalizing the graphene surface with appropriate bioreceptors while maintaining its electronic properties. The technique's exceptional sensitivity stems from its reliance on carrier density changes rather than mass loading, making it particularly effective for small molecule detection where traditional quartz crystal microbalances or surface plasmon resonance show limited response [18].
Table 2: Comparison of Methodologies for Investigating Ionic Strength and Conductivity Changes
| Methodology | Detection Principle | Sensitivity | Applications | Key Advantages |
|---|---|---|---|---|
| FRET-Based Sensing [12] | Electrostatic attraction between charged helices affects FRET efficiency | <10 mM ionic strength precision | Intracellular ionic strength monitoring | Genetically encodable, subcellular resolution, live-cell compatible |
| Microfluidic Diffusion [16] | Inverse relationship between ionic strength and ion diffusion rate | 0.1 M ionic strength difference | Solution analysis (food, environmental samples) | Portable, cost-effective, simultaneous pH and ionic strength measurement |
| Hybrid Metasurface Sensors [18] | Molecular doping alters graphene carrier density, shifting plasmon resonance | 200 pM glucose | Ultrasensitive small molecule detection | Exceptional sensitivity for low-MW analytes, fingerprinting capability |
| Conducting Polymer Sensors [17] | Biological binding alters polymer conductivity | Varies with polymer and transducer design | Medical diagnostics, environmental monitoring | Tunable properties, signal amplification, versatile functionalization |
Research Reagent Solutions and Materials
The experimental approaches described require specialized materials and reagents optimized for investigating ionic strength and conductivity changes in biological contexts. The following table summarizes key research reagent solutions essential for implementing these methodologies.
Table 3: Essential Research Reagents for Ionic Strength and Conductivity Biosensing
| Reagent/Material | Function/Application | Specific Examples | Key Characteristics |
|---|---|---|---|
| FRET Ionic Strength Probes [12] | Genetically encoded sensors for intracellular ionic strength | KE, RE, RD probes with mCerulean3/mCitrine | Charge-complementary helices, pH stability >7.0, Hofmeister series sensitivity |
| Ionophores for Calibration [12] | Equilibrate ions across membranes for intracellular calibration | Valinomycin + Nigericin combination | K+/H+ exchange, enables clamping of intracellular ion concentrations |
| Functionalized Pyrene Derivatives [18] | Graphene doping via π-π stacking for conductivity modulation | Amino-pyrene (AP), Boronic acid-pyrene (BAP) | Molecular weights: 217-246 g/mol, introduce hole carriers into graphene |
| Conducting Polymers [17] | Transducer materials for signal amplification in biosensors | Polyaniline (PANI), Polypyrrole (PPY), PEDOT | Tunable conductivity, biocompatibility, versatile functionalization |
| Microfluidic Chip Materials [16] | Miniaturized platforms for diffusion-based ionic strength sensing | 3D-printed photopolymer resins | Laminar flow characteristics, diffusion-optimized channel designs |
| Hybrid Metasurface Components [18] | Plasmonic enhancement for conductivity-based detection | Au nanorod arrays, monolayer graphene, Pt mirror | High quality factor resonance, electric field confinement in nanogaps |
Data Interpretation and Analytical Considerations
Quantifying Ionic Strength and Conductivity Relationships
Interpreting data from conductometric biosensing experiments requires understanding the quantitative relationship between biological binding events and the resulting changes in ionic strength and conductivity. For FRET-based intracellular sensors, the calibration curve generated using ionophores provides a direct conversion between FRET ratio (mCitrine/mCerulean3 emission ratio) and ionic strength values [12]. Researchers have established that these sensors can detect ionic strength values comparable to approximately 110-130 mM in HEK293 cells, corresponding to physiological monovalent ion concentrations [12]. The sensitivity follows a nonlinear relationship, with the highest responsiveness occurring between 0-300 mM KCl, making these probes ideal for physiological ranges.
For microfluidic diffusion-based measurements, the diffusion width exhibits an inverse relationship with ionic strength—higher ionic strength solutions produce narrower diffusion zones due to reduced ion mobility [16]. The calibration involves measuring diffusion widths of standard solutions with known ionic strengths and fitting these data to establish a reference curve. In practical applications, researchers have reported diffusion widths of 416.34 µm for 1.0 M tartaric acid compared to significantly wider diffusion for 0.1 M solutions, enabling quantitative determination of unknown samples through interpolation [16].
In hybrid metasurface sensors, the plasmonic resonance shift (∆ωr) relates directly to the change in graphene carrier density (∆n) induced by molecular binding [18]. Experimental data demonstrate that carrier doping-induced shifts can be approximately 12 times greater than shifts caused by local refractive index changes for sub-nanometer analytes, highlighting the dominance of conductivity mechanisms in detection sensitivity [18]. This relationship allows quantification of bound analytes based on the magnitude of resonance shift, with studies showing measurable blue-shifts of 23-46 cm⁻¹ for molecular doping producing carrier density changes of (2.3-4.1)×10¹² cm⁻² [18].
Addressing Measurement Challenges and Limitations
Several technical challenges require consideration when interpreting ionic strength and conductivity data. FRET-based measurements may be confounded by factors including macromolecular crowding, pH variations below 7.0, temperature sensitivity at low salt concentrations, and specific ion effects that follow Hofmeister series behavior [12]. The RD (arginine-aspartate) probe configuration shows the least deviation from ideal behavior due to its lower salt-bridge strength, making it preferable for applications where ion-specific effects are concern [12].
Microfluidic approaches face challenges related to surface adsorption of analytes, contamination in field applications, and flow rate variations that affect diffusion measurements. These limitations can be mitigated through surface treatments, incorporating reference channels, and implementing precise flow control systems [16].
Hybrid metasurface sensors, while exceptionally sensitive, require careful control of graphene quality and functionalization procedures. Degradation of carrier mobility in graphene does not significantly affect the quality factor of hybrid metasurfaces, providing operational stability, but non-specific binding must be controlled through appropriate surface passivation strategies [18]. Additionally, these systems require sophisticated optical instrumentation for readout, potentially limiting their point-of-care applications.
The transduction mechanisms linking biological binding events to changes in ionic strength and conductivity provide powerful foundations for diverse biosensing platforms. The methodologies detailed in this whitepaper—from FRET-based intracellular probes to microfluidic diffusion sensors and hybrid metasurface platforms—demonstrate the versatility of conductometric approaches across biological research, diagnostic applications, and drug development. The quantitative relationships between molecular interactions and electrical signals enable researchers to design increasingly sensitive and specific detection systems, particularly as advancements in nanomaterials and microfabrication continue to enhance measurement capabilities.
Future research directions will likely focus on improving the specificity of conductivity-based detection in complex biological matrices, developing multimodal sensing platforms that combine conductometric with other transduction mechanisms, and creating miniaturized systems for continuous monitoring applications. The integration of artificial intelligence with biosensing data analysis holds particular promise for extracting subtle patterns from conductivity measurements that correlate with specific biological states or disease conditions [14]. As these technologies mature, conductometric biosensors based on ionic strength and conductivity modulation will play an increasingly prominent role in personalized medicine, environmental monitoring, and fundamental biological research.
The performance of conductometric biosensors, which transduce biochemical events into measurable changes in electrical conductivity, is fundamentally governed by the intricate design of their core components. These biosensors represent a crucial segment of electrochemical biosensors, which are defined as analytical devices that convert a biological response into a quantifiable and processable signal [19]. Within this domain, the interface where biology meets electronics—specifically the electrode design, surface chemistry, and strategy for immobilizing biological recognition elements—determines critical analytical parameters such as sensitivity, selectivity, stability, and reproducibility [19] [20]. This guide provides an in-depth technical examination of these foundational elements, framed within contemporary research on conductometric biosensors. It details how strategic engineering at the nanoscale, combined with advanced functionalization and immobilization protocols, can overcome historical limitations and unlock new levels of performance for researchers and drug development professionals.
Electrode Design and Materials
The electrode system forms the physical backbone of any conductometric biosensor, serving as the primary transducer. Its design, material composition, and architecture directly influence the efficiency of signal acquisition and the overall signal-to-noise ratio.
Fundamental Electrode Configuration
A standard electrochemical biosensor requires a three-electrode system: a working electrode where the biorecognition event occurs and the signal is generated, a counter (or auxiliary) electrode to complete the electrical circuit, and a reference electrode (e.g., Ag/AgCl) to maintain a stable, known potential [19]. In conductometric measurements, the focus is on monitoring the change in electrical conductivity between two electrodes, often the working and counter electrodes, within the sensing layer or solution resulting from a biochemical reaction.
Advanced Materials for Enhanced Performance
The choice of electrode material is paramount. Recent research has heavily focused on using nanomaterials to enhance electrode performance due to their large surface-to-volume ratios, exceptional electrical conductivity, and tunable surface chemistry [21] [22].
- Carbon-Based Materials: These are widely used due to their excellent mechanical stability, good conductivity, and broad potential window.
- Carbon Nanotubes (CNTs): Both single-walled (SWCNTs) and multi-walled (MWCNTs) varieties offer remarkable electrical conductivity and a large surface area for enzyme immobilization, which can significantly increase the signal response [21]. Their delocalized π-orbitals facilitate electron-transfer reactions of biological molecules [21].
- Graphene and Derivatives: Graphene provides a higher specific surface area than CNTs, along with fast electron transfer and good mechanical flexibility [21]. Graphene oxide (GO) and reduced GO (rGO) offer easier surface modification and improved hydrophilicity, enhancing their usability in biosensors [21].
- Metallic Nanoparticles: Gold nanoparticles (AuNPs) are frequently incorporated due to their excellent conductivity, biocompatibility, and ability to facilitate electron transfer between the redox center of proteins and the electrode surface [20] [22]. They can be used to functionalize electrode surfaces, increasing the effective surface area and improving the loading of biorecognition elements.
- Conducting Polymers: Polymers like polypyrrole and polyaniline can be electrodeposited onto electrodes, providing a versatile matrix for the entrapment of enzymes. Their conductivity can be modulated by biochemical reactions, making them suitable for conductometric transduction [20].
- Screen-Printed Electrodes (SPEs): These have gained prominence for developing portable, disposable biosensors. SPEs allow for mass production, miniaturization, and customization of electrode designs and materials, making them ideal for point-of-care testing [23].
Table 1: Key Electrode Materials and Their Properties
| Material | Advantages | Limitations | Key Role in Conductometric Biosensors |
|---|---|---|---|
| Carbon Nanotubes (CNTs) | High electrical conductivity, large surface area, mechanical stability [21] | Can form irreversible agglomerates; may require functionalization for biocompatibility [21] | Enhances electron transfer; increases immobilization capacity; amplifies conductivity signal. |
| Graphene/rGO | Very high surface area, fast electron transfer, good biocompatibility [21] | Graphene has low solubility in water; can restack [21] | Provides a highly conductive 2D platform; improves sensitivity. |
| Gold Nanoparticles (AuNPs) | Excellent conductivity, high biocompatibility, tunable surface chemistry [20] [22] | Can be costly; stability can be an issue in some formulations | Acts as an electron wire; increases effective electrode surface area. |
| Conducting Polymers | Easy deposition, biocompatible matrix for entrapment, tunable conductivity [20] | Conductivity can be dependent on pH and ionic strength | Serves as a versatile immobilization matrix; its conductivity change is the basis for detection. |
Surface Chemistry and Functionalization
Surface chemistry governs the modification of the electrode surface to create an optimal interface for the stable and oriented attachment of biorecognition elements while minimizing non-specific binding.
The Role of Surface Chemistry
A well-designed interface ensures that bioreceptors such as enzymes, antibodies, or nucleic acids are immobilized in a manner that preserves their biological activity and allows for accessible binding sites [22]. The physicochemical properties of the interface—including hydrophobicity, surface charge, and the presence of specific functional groups—dictate the density, orientation, and stability of the immobilized layer [19] [22]. Furthermore, effective surface functionalization is critical for preventing the non-specific adsorption of interferents from complex samples like blood or serum, which can severely compromise sensor accuracy [21] [22].
Key Functionalization Strategies
Several chemical strategies are employed to tailor the electrode surface:
- Covalent Immobilization: This method creates stable, irreversible bonds between functional groups on the electrode surface (e.g., -COOH, -NH₂) and complementary groups on the biomolecule. Cross-linkers like glutaraldehyde (GLA) or carbodiimide (e.g., EDC) are commonly used to form these robust linkages [20] [23]. This approach reduces enzyme leakage and enhances operational stability.
- Self-Assembled Monolayers (SAMs): Alkanethiols on gold surfaces are a classic example. SAMs form highly ordered, reproducible layers that provide precise control over surface properties and can be engineered to present specific terminal functional groups for the oriented immobilization of biomolecules [19] [22].
- Non-Covalent Functionalization: This includes adsorption via van der Waals forces, electrostatic interactions, or π-π stacking (particularly for carbon-based materials like CNTs and graphene) [22]. While simpler, this method can lead to less stable immobilization and random orientation of the bioreceptor [20].
- Use of Nanomaterials as Functionalization Agents: Nanomaterials themselves are a key part of surface engineering. They can be functionalized with specific groups (e.g., COOH-functionalized MWCNTs) to improve their solubility and affinity for biomolecules, thereby creating a superior 3D scaffold for immobilization compared to flat 2D surfaces [23] [24].
Diagram 1: Surface functionalization workflow for biosensors.
Immobilization Strategies for Bioreceptors
Immobilization is a critical step that fixes the biological recognition element (e.g., enzyme, antibody, DNA) onto the functionalized transducer surface. The chosen method profoundly affects the biosensor's activity, stability, and specificity [20].
There are five principal methods for immobilizing bioreceptors, each with distinct advantages and drawbacks [20].
- Adsorption: The simplest method, relying on weak bonds (Van der Waals, electrostatic). It is easy to perform without modifying the support but suffers from potential enzyme leakage and random orientation [20].
- Entrapment: The enzyme is confined within a porous 3D matrix (e.g., polymer, silica gel, carbon paste). This protects the enzyme but can introduce diffusion barriers for the substrate and analyte [20].
- Cross-linking: Biomolecules are linked to each other or to an inert protein (like Bovine Serum Albumin - BSA) using bifunctional agents like glutaraldehyde. This creates a stable layer but can cause activity loss due to harsh chemical conditions and rigidification of the enzyme [20] [23].
- Covalent Binding: Enzymes are attached via strong covalent bonds to an activated support. This method offers high stability and prevents leakage, but requires surface functionalization and may involve modification of the enzyme, potentially affecting its active site [20].
- Affinity Immobilization: Utilizes highly specific biological interactions (e.g., avidin-biotin, lectin-carbohydrate, antibody-Fc). This strategy allows for controlled, oriented immobilization, which often results in higher activity and stability by preserving the enzyme's active site [20].
Advanced and Emerging Immobilization Approaches
Recent advances focus on combining methods and leveraging new technologies to overcome traditional limitations.
- Nanomaterial-Enhanced Immobilization: The integration of nanomaterials has revolutionized immobilization. Their high surface area allows for a greater loading of enzymes, while their catalytic and conductive properties can enhance signal transduction [25] [21]. For instance, enzymes immobilized on MWCNTs often exhibit improved electron transfer and stability [21].
- Inkjet Printing for Immobilization: This contactless, automated technique enables the precise deposition of enzyme and cross-linker (e.g., GLA) inks onto screen-printed electrodes. It overcomes the low reproducibility and "coffee ring effect" associated with traditional drop-casting, facilitating mass production of uniform biosensors with high performance [23].
- 3D Immobilization Platforms: Using materials like hydrogels, metal-organic frameworks (MOFs), or 3D graphene foam significantly increases the binding surface area for capture probes compared to traditional 2D surfaces. This enhances the sensitivity and capture efficiency of the biosensor, which is crucial for detecting low-abundance analytes like viruses [24].
Table 2: Comparison of Core Immobilization Strategies
| Method | Principle | Advantages | Disadvantages | Impact on Biosensor Performance |
|---|---|---|---|---|
| Adsorption | Physical adherence via weak forces [20] | Simple, fast, no chemical modification [20] | Weak binding, enzyme leakage, random orientation [20] | Low stability and reproducibility; suitable for short-term use. |
| Entrapment | Encapsulation in a porous matrix [20] | Mild conditions, protects enzyme [20] | Diffusion limitations, matrix wear, possible leakage [20] | Can lead to longer response times; stability depends on matrix. |
| Cross-Linking | Chemical bonds between enzyme molecules [20] [23] | Stable, high enzyme loading [23] | Can denature enzyme, reduced activity [20] | High stability but potential loss of sensitivity. |
| Covalent | Chemical bonds to activated support [20] | Very stable, no leakage, controlled density [20] | Complex procedure, possible enzyme denaturation [20] | Excellent long-term stability and reproducibility. |
| Affinity | Specific bio-interactions (e.g., avidin-biotin) [20] | Oriented immobilization, high activity retention [20] | Requires genetic/modification of bioreceptor, costly [20] | High sensitivity and specificity due to optimal orientation. |
Experimental Protocols and Methodologies
This section provides detailed methodologies for key experiments cited in the literature, offering a practical guide for researchers.
Protocol: Enzyme Immobilization via Cross-linking with Inkjet Printing
This protocol, adapted from [23], details the fabrication of a reagentless enzyme biosensor with high reproducibility.
Ink Formulation:
- Enzyme Ink: Prepare a solution containing the enzyme (e.g., Pyruvate Oxidase, PyOD), its necessary cofactors (Thiamine Pyrophosphate - TPP, Flavin Adenine Dinucleotide - FAD), and functionalized multi-wall carbon nanotubes (MWCNTs) in a suitable buffer (e.g., citrate buffer). Add a surfactant like Triton X-100 (0.1% v/v) to adjust surface tension and prevent nozzle clogging.
- Cross-linking Ink: Prepare a solution of glutaraldehyde (GLA) in deionized water.
- Protective Layer Ink: Prepare a solution of Nafion (e.g., 0.5% w/w) in a solvent mixture.
Printing Process (using a piezoelectric inkjet printer, e.g., Fujifilm DMP-2831):
- Step 1: Print Enzyme Layer: Deposit the enzyme ink directly onto the working electrode of a screen-printed electrode (SPE). The number of print passes determines the enzyme loading.
- Step 2: Print Cross-linking Layer: Immediately deposit the GLA ink over the enzyme layer. This initiates the cross-linking reaction, anchoring the enzyme layer to the electrode.
- Step 3: Print Protective Layer: Deposit the Nafion ink over the cross-linked layer. This membrane reduces fouling and interference from large molecules in complex samples.
- Dry the functionalized electrode at room temperature.
Characterization:
- Electrochemical: Use Cyclic Voltammetry (CV) and Electrochemical Impedance Spectroscopy (EIS) in a standard redox probe (e.g., [Fe(CN)₆]³⁻/⁴⁻) to confirm successful immobilization and characterize electron transfer properties.
- Morphological: Use Scanning Electron Microscopy (SEM) to observe the uniformity of the printed layers and the integration of MWCNTs.
Protocol: Functionalization of Carbon Nanotubes (MWCNTs)
This is a common pre-requisite step for improving the biocompatibility and dispersibility of CNTs [23].
- Acid Treatment: Soak raw MWCNTs in hydrochloric acid for 24 hours to remove metal catalysts.
- Washing: Centrifuge the mixture, discard the supernatant, and rinse the pellet with deionized water until neutral pH.
- Oxidation: Add the cleaned MWCNTs to a 3:1 (v/v) mixture of sulfuric acid (H₂SO₄) and nitric acid (HNO₃). Heat and stir at 50°C for 24 hours. This process introduces carboxylic acid (-COOH) groups onto the CNT surface.
- Neutralization: Dilute the mixture with distilled water and centrifuge. Wash the functionalized MWCNTs repeatedly with distilled water until the supernatant reaches a neutral pH.
- Drying: Dry the resulting COOH-functionalized MWCNTs in a vacuum oven at 50°C overnight. The product can be stored dry at room temperature.
The Scientist's Toolkit: Essential Research Reagents
Table 3: Key Reagent Solutions for Biosensor Development
| Reagent/Material | Function/Description | Example Application |
|---|---|---|
| Screen-Printed Electrodes (SPEs) | Disposable, miniaturized platforms with a three-electrode system (Carbon working, carbon counter, Ag/AgCl reference) [23]. | Foundation for portable, mass-producible biosensors. |
| Functionalized MWCNTs | Carbon nanotubes with -COOH groups for better dispersion in aqueous solutions and covalent attachment of biomolecules [23]. | Enhancing electrode conductivity and providing a 3D scaffold for enzyme immobilization. |
| Glutaraldehyde (GLA) | A bifunctional cross-linker that forms Schiff base bonds with amine groups on enzymes and other proteins [20] [23]. | Creating stable, cross-linked enzyme layers on electrode surfaces. |
| Bovine Serum Albumin (BSA) | An inert protein used in combination with cross-linkers to form a robust mixed protein matrix, reducing enzyme denaturation [20] [23]. | Used in cross-linking protocols to improve enzyme loading and stability. |
| Nafion | A perfluorosulfonated ionomer; acts as a permselective membrane [23]. | Coated as a protective layer to repel negatively charged interferents (e.g., ascorbic acid, uric acid) in biological samples. |
| EDC (1-Ethyl-3-(3-dimethylaminopropyl)carbodiimide) | A carbodiimide cross-linker used for activating carboxyl groups for covalent bonding to primary amines [21]. | Standard reagent for covalent immobilization of biomolecules on carboxylated surfaces. |
| Potassium Ferricyanide (K₃[Fe(CN)₆]) | A redox probe used in electrochemical characterization [23]. | Used in CV and EIS to evaluate the electron transfer properties and integrity of the modified electrode surface. |
The relentless pursuit of higher performance in conductometric biosensors hinges on the synergistic optimization of electrode design, surface chemistry, and immobilization strategies. The transition from conventional materials and simple adsorption to sophisticated nanomaterial-based architectures and oriented affinity immobilization represents a paradigm shift in the field. By carefully selecting electrode materials like CNTs and graphene, applying precise surface functionalization techniques such as SAMs, and implementing advanced immobilization protocols including inkjet printing and 3D scaffolding, researchers can systematically engineer biosensor interfaces. This integrated approach directly addresses the core challenges of sensitivity, specificity, and stability, paving the way for the next generation of robust, reliable, and commercially viable conductometric biosensors for advanced research and clinical diagnostics.
Conductometric biosensors are a class of electrochemical biosensors that measure the change in electrical conductivity of a solution resulting from a biochemical reaction. These devices typically consist of a biological recognition element (such as an enzyme, antibody, or whole cell) immobilized onto a transducer, most often a pair of interdigitated electrodes. When the target analyte interacts with the biological element, it triggers a reaction that alters the ionic composition within the sample solution, leading to a measurable change in conductivity between the electrodes [26] [14]. This transduction principle offers several distinct advantages that make conductometric biosensors particularly attractive for a wide range of applications, from medical diagnostics to environmental monitoring.
The fundamental operation of conductometric biosensors relies on electrochemical processes at the electrode-solution interface. Unlike other electrochemical techniques that require reference electrodes, conductometric measurements use alternating current (AC) to minimize faradaic processes and electrode polarization, allowing for direct monitoring of ionic species changes. This review explores the core advantages of this biosensor platform—simplicity, low-cost fabrication, and miniaturization potential—within the broader context of biosensor fundamentals and their implications for research and commercial development.
Fundamental Advantages
Simplicity of Design and Operation
The operational principle of conductometric biosensors is remarkably straightforward, contributing significantly to their practicality and reliability. The core mechanism involves measuring conductance changes in solution without complex instrumentation or sophisticated procedural requirements.
Instrumentation Simplicity: Conductometric biosensors utilize a simple two-electrode system, typically in an interdigitated arrangement, which operates without the need for a reference electrode—a requirement for many other electrochemical techniques like potentiometry and amperometry. This elimination simplifies both the sensor design and the associated electronic instrumentation [26]. The measurement involves applying a small amplitude AC voltage across the electrodes and monitoring the resulting current, which is directly related to the solution's ionic conductivity.
Measurement Protocol: The typical measurement workflow is simple and can be largely automated, making these sensors suitable for use by non-specialists. The process generally involves applying a sample to the sensor, allowing a brief incubation period for the biochemical reaction to occur, and recording the conductivity change. This simplicity facilitates rapid analysis and minimizes user-induced errors, which is particularly advantageous in point-of-care settings [26] [14].
Signal Processing: The output signal from conductometric transducers is typically easy to process and interpret. Since the signal is directly related to ionic concentration changes, complex data transformation or advanced signal processing algorithms are often unnecessary for basic operation, though they may be applied for enhanced performance in sophisticated implementations.
Low-Cost Fabrication
The economic advantages of conductometric biosensors make them particularly suitable for widespread deployment and disposable applications, addressing a critical need in resource-limited settings.
Materials and Manufacturing: The fabrication of conductometric transducers primarily uses well-established, cost-effective materials and processes. Metallic electrodes (such as gold, platinum, or less expensive alternatives like carbon) are deposited on inexpensive substrates (e.g., glass, silicon, or polymers) using standard microfabrication techniques like screen-printing, photolithography, or inkjet printing [26] [27]. These processes are highly scalable and compatible with mass production, significantly reducing per-unit costs compared to more complex transducer platforms.
Comparative Cost Analysis:
Table: Cost Comparison of Biosensor Transduction Techniques
| Transduction Method | Typical Electrode Configuration | Reference Electrode Required | Approximate Fabrication Complexity | Suitable for Disposable Use |
|---|---|---|---|---|
| Conductometric | Two-electrode (interdigitated) | No | Low | Yes |
| Amperometric | Three-electrode system | Yes | Medium | Limited |
| Potentiometric | Two-electrode system | Yes | Medium | Limited |
| Impedimetric | Two- or three-electrode | Sometimes | Medium-High | Limited |
Economic Accessibility: The low-cost nature of conductometric biosensors extends beyond fabrication to encompass operational expenses. Minimal sample preparation, small reagent volumes, and simple instrumentation collectively contribute to reduced overall costs per test. This economic advantage is crucial for applications requiring frequent monitoring, such as glucose tracking for diabetes management or environmental water quality assessment [28] [27].
Suitability for Miniaturization and Integration
The structural and operational characteristics of conductometric biosensors make them exceptionally amenable to miniaturization, offering significant benefits for portable and implantable applications.
Inherent Miniaturization Compatibility: The interdigitated electrode design, fundamental to most conductometric biosensors, can be fabricated with feature sizes reaching micrometer scales using standard photolithographic techniques without compromising functionality. As electrode gaps and widths decrease, the sensitivity often increases due to higher field density and more efficient charge collection, enabling highly sensitive detection in miniaturized formats [26].
Portable System Integration: Miniaturized conductometric sensors can be seamlessly integrated with compact electronics for signal processing, data display, and wireless communication, enabling the development of complete lab-on-a-chip systems. This integration potential has led to their incorporation into various portable diagnostic devices for point-of-care testing, environmental monitoring in the field, and wearable health tracking systems [28] [27].
Multi-analyte Capability: The simple electrode structures of conductometric transducers facilitate the design of sensor arrays on a single chip for simultaneous detection of multiple analytes. By immobilizing different biological recognition elements on adjacent electrode pairs, multiplexed detection can be achieved without significant increase in device complexity or cost—a challenging feat with many other transduction methods [26].
Experimental Methodologies in Conductometric Biosensing
Standard Fabrication Protocols
The construction of conductometric biosensors follows well-established procedures that balance performance with manufacturability.
Electrode Fabrication:
- Substrate Preparation: Begin with thorough cleaning of the substrate (typically glass, silicon, or ceramic) using piranha solution (3:1 H₂SO₄:H₂O₂) followed by rinsing with deionized water and drying under nitrogen stream.
- Photolithographic Patterning: Apply positive photoresist via spin coating (3000 rpm, 30 seconds), soft bake (90°C, 60 seconds), expose through interdigitated electrode mask, and develop in appropriate developer solution.
- Metal Deposition: Deposit adhesion layer (chromium or titanium, 10-20 nm) followed by electrode metal (gold or platinum, 100-200 nm) using thermal or electron-beam evaporation.
- Lift-off Process: Submerge in acetone with ultrasonic agitation to remove excess metal, leaving the interdigitated electrode pattern, then rinse with isopropanol and dry.
- Insulation Layer: Apply SU-8 or silicon nitride passivation layer with openings only at electrode contacts and sensing area using photolithographic patterning.
Alternative fabrication methods include screen-printing of electrode patterns using conductive carbon or polymer inks, which offers even lower production costs suitable for disposable sensors, though with potentially larger feature sizes.
Biorecognition Element Immobilization:
- Surface Functionalization: Treat electrode surface with oxygen plasma (100 W, 1 minute) to create hydroxyl groups, then immerse in 2% (v/v) (3-aminopropyl)triethoxysilane (APTES) in acetone for 2 hours at room temperature to create amine-functionalized surface.
- Cross-linking: Incubate aminated surface with 2.5% glutaraldehyde in phosphate buffer (0.1 M, pH 7.4) for 1 hour at room temperature.
- Enzyme Immobilization: Apply biological recognition element (e.g., enzyme solution at optimal concentration in appropriate buffer) and incubate for 12-16 hours at 4°C.
- Stabilization: Rinse with immobilization buffer to remove unbound molecules, then treat with stabilizing agents (e.g., BSA, trehalose) as needed for the specific biological element.
Measurement Procedures
Standardized protocols ensure consistent and reliable biosensor performance across different applications and users.
Sensor Calibration:
- Baseline Establishment: Immerse sensor in appropriate buffer solution (e.g., 10 mM PBS, pH 7.4) and apply measurement voltage (typically 10-50 mV AC at 1-10 kHz).
- Signal Stabilization: Monitor output until stable baseline is established (typically 5-10 minutes).
- Standard Addition: Introduce known concentrations of standard analyte solutions in increasing order, allowing signal stabilization between additions (typically 2-5 minutes per concentration).
- Calibration Curve: Plot conductance change (ΔG) versus analyte concentration and fit with appropriate regression model (typically linear for limited ranges).
Sample Analysis:
- Sample Preparation: Process real samples (blood, urine, water, etc.) with appropriate minimal preparation (filtration, dilution, pH adjustment).
- Measurement: Apply prepared sample to sensor and record conductance change over time.
- Quantification: Compare sample response to calibration curve to determine analyte concentration.
- Regeneration: For reusable sensors, implement regeneration protocol (e.g., brief rinse with mild detergent or low-pH buffer) followed by re-equilibration in measurement buffer.
Quality Control Measures:
- Include control standards with each measurement batch
- Perform replicate measurements (typically n=3)
- Monitor electrode integrity through baseline stability and response to standard solutions
- Implement temperature compensation through integrated temperature sensors or mathematical correction
Case Study: L-Arginine Conductometric Biosensor
A recent innovative example demonstrating the advantages of conductometric biosensors is a hybrid organic/inorganic system developed for L-arginine detection [26]. This biosensor exemplifies how the fundamental benefits of this platform can be leveraged to create high-performance analytical devices.
Sensor Design and Mechanism
The L-arginine biosensor employs a sophisticated yet cost-effective design incorporating both enzymatic and inorganic recognition elements:
Biochemical Pathway:
- Enzymatic Conversion: L-arginine is first hydrolyzed by arginase to produce urea and L-ornithine.
- Urea Hydrolysis: The generated urea is then hydrolyzed by urease in the presence of water and hydrogen ions to produce ammonium (NH₄⁺) and bicarbonate (HCO₃⁻) ions.
- Ion Exchange: The ammonium ions participate in an exchange process with sodium ions residing in the framework of the clinoptilolite zeolite.
Signal Generation: The entire process results in a net change in ionic species in the solution near the electrode surface, altering the conductivity in proportion to the original L-arginine concentration. The incorporation of clinoptilolite zeolite enhances selectivity by specifically capturing ammonium ions, reducing interference from other ionic species in complex samples.
Performance Characteristics
The L-arginine biosensor demonstrates excellent analytical performance, validating the advantages of the conductometric platform:
Table: Performance Metrics of the L-Arginine Conductometric Biosensor
| Parameter | Value | Experimental Conditions |
|---|---|---|
| Sensitivity | 9.61 ± 0.01 μS/mM | In optimal buffer solution, 25°C |
| Limit of Detection | 5 μM | Based on 3σ of blank signal |
| Linear Range | 0–280 μM | R² = 0.998 |
| Dynamic Range | 0–15 mM | Covers physiological concentrations |
| Response Time | <3 minutes | Time to 95% of final signal |
| Operational Stability | >30 measurements | <5% sensitivity loss |
| Storage Stability | >4 weeks at 4°C | In dry conditions |
Experimental Protocol for L-Arginine Detection
Biosensor Construction:
- Electrode Preparation: Fabricate gold interdigitated electrodes (finger width/spacing: 10 μm) on glass substrate using photolithography and lift-off process.
- Zeolite Modification: Deposit primary layer of clinoptilolite zeolite (particle size: 2-5 μm) suspended in ethanol (1 mg/mL) by drop-casting (5 μL) and dry at 40°C for 1 hour.
- Enzyme Immobilization: Co-immobilize arginase (80 U/mg) and urease (20 U/mg) in bovine serum albumin (BSA) matrix cross-linked with glutaraldehyde (0.25% v/v) as secondary layer.
- Curing: Allow biosensor to cure at 4°C for 24 hours before use.
Measurement Procedure:
- Initialization: Equilibrate biosensor in 5 mM Tris-HCl buffer (pH 7.4) containing 0.1 mM MnCl₂ (essential for arginase activity) for 10 minutes.
- Baseline Recording: Apply AC voltage (20 mV, 10 kHz) and record baseline conductance for 2 minutes until stable.
- Sample Introduction: Introduce L-arginine standard or prepared sample solution (50 μL) to measurement cell containing 2 mL buffer.
- Signal Monitoring: Record conductance change for 5 minutes, noting maximum response.
- Regeneration: Rinse sensor with measurement buffer between measurements to restore baseline.
Optimization Parameters:
- pH Optimum: 7.0-7.5 (Tris-HCl buffer)
- Temperature Optimum: 25-30°C
- Ionic Strength: Maintain below 20 mM to maximize sensitivity
- Buffer Capacity: Optimized to 5 mM to balance pH stability and sensitivity
The Scientist's Toolkit: Essential Research Reagents and Materials
Successful development of conductometric biosensors requires specific materials and reagents carefully selected for their functional properties.
Table: Essential Research Reagents for Conductometric Biosensor Development
| Reagent/Material | Function/Application | Representative Examples |
|---|---|---|
| Electrode Materials | Signal transduction; provides surface for biorecognition element immobilization | Gold, platinum, carbon, indium tin oxide (ITO) |
| Biological Recognition Elements | Specific interaction with target analyte | Enzymes, antibodies, aptamers, whole cells |
| Immobilization Matrices | Stabilization and retention of biological elements on transducer surface | Chitosan, BSA-glutaraldehyde, sol-gels, polymers |
| Cross-linking Agents | Covalent attachment of biological elements to electrode surface | Glutaraldehyde, EDC-NHS, APTES |
| Ion-Selective Materials | Enhancement of selectivity through preferential ion exchange or binding | Clinoptilolite zeolite, ionophores, crown ethers |
| Substrate Materials | Mechanical support for electrode structures | Glass, silicon, PET, PDMS |
| Buffer Components | Maintenance of optimal pH and ionic environment for biological element activity | Phosphates, Tris, HEPES, with specific cofactors |
Technological Integration and Advanced Applications
The fundamental advantages of conductometric biosensors enable their integration with emerging technologies and application in novel settings.
Hybrid Sensing Platforms
Recent research demonstrates innovative combinations of conductometric sensing with other detection modalities to create enhanced biosensing platforms:
Dual-Mode Detection Systems: A graphene-quantum dot hybrid biosensor demonstrates how conductometric measurements can be coupled with optical detection (time-resolved photoluminescence) for correlated electrical and optical responses to analyte concentration. This dual-mode approach provides built-in verification capability, enhancing detection reliability for critical applications [29].
Nanomaterial-Enhanced Conductometric Sensors: Integration of nanomaterials such as graphene, carbon nanotubes, and metal nanoparticles significantly boosts conductometric biosensor performance. These materials increase effective surface area for biorecognition element immobilization, enhance electron transfer kinetics, and can contribute to signal amplification, enabling ultrasensitive detection down to femtomolar levels for certain applications [29] [28].
Point-of-Care and Wearable Applications
The miniaturization potential and simplicity of conductometric biosensors make them ideal for decentralized testing applications:
Point-of-Care Medical Diagnostics: The global biosensors market, valued at USD 32.3 billion in 2024, is projected to reach USD 68.5 billion by 2034, with point-of-care testing representing a dominant segment [28]. Conductometric biosensors contribute significantly to this growth through devices for glucose monitoring, cardiac biomarker detection, infectious disease testing, and coagulation monitoring.
Wearable Health Monitoring: Wearable biosensors represent the fastest-growing segment in the biosensor market, with conductometric principles being applied in continuous monitoring patches for metabolites, electrolytes, and other physiological biomarkers. The low-power requirements and miniaturization capability of conductometric sensors make them particularly suitable for these applications [27] [30].
Visualizing Conductometric Biosensor Principles
The following diagrams illustrate the fundamental working principles and experimental workflow for conductometric biosensors, highlighting their simplicity and effectiveness.
Conductometric biosensors represent a powerful analytical platform that successfully balances performance with practical implementation requirements. Their inherent simplicity, cost-effective fabrication, and excellent miniaturization potential position them as ideal candidates for addressing the growing need for decentralized testing across healthcare, environmental monitoring, food safety, and bioprocess control. The case study of the L-arginine biosensor demonstrates how these fundamental advantages can be leveraged to create sophisticated analytical devices with compelling performance characteristics.
Future developments in conductometric biosensing will likely focus on enhancing multiplexing capabilities, integrating with artificial intelligence for advanced data analysis, improving stability for long-term implantation, and further reducing costs through innovative manufacturing approaches. As materials science and biotechnology continue to advance, conductometric biosensors will play an increasingly important role in the transition toward personalized medicine, connected health, and sustainable environmental management. Their unique combination of technical advantages ensures they will remain a vital tool in the analytical sciences for the foreseeable future.
Fabrication and Real-World Biomedical Applications in Drug Development
Conductometric biosensors are a class of electrochemical biosensors that measure the change in electrical conductivity of a solution resulting from biochemical reactions. These devices have gained significant attention in biosensing research due to their several inherent advantages: they do not require a reference electrode, operate at low-amplitude alternating voltage which prevents Faraday processes on electrodes, are insensitive to light, and can be easily miniaturized and integrated using inexpensive thin-film standard technology [31]. The fundamental principle of conductometric biosensing relies on monitoring conductivity changes in a sample solution via the production or consumption of charged species during biological recognition events [31]. This measurement principle, combined with advancements in microfluidic integration and nanomaterials, has positioned conductometric biosensors as powerful tools for applications ranging from biomedical diagnostics to environmental monitoring [32] [31].
The evolution of biosensor technology began with the pioneering work of Leland Charles Clark Jr. in 1962, who first conceived the idea of integrating a bioreceptor with a transducer device [32]. Since then, biosensors have progressed through three generations of development, with current research focusing on miniaturization, point-of-care applications, and enhanced sensitivity through nanomaterial integration. Conductometric biosensors represent an important segment of this evolution, particularly for their simplicity and cost-effectiveness compared to other electrochemical sensing platforms [31]. This technical guide provides a comprehensive framework for the fabrication of conductometric biosensors, with particular emphasis on the critical steps from substrate functionalization to bioreceptor immobilization, framed within the context of advanced biosensing research.
Fundamental Principles and Design Considerations
Core Components of Conductometric Biosensors
All biosensors, including conductometric types, consist of several essential components: (i) an analyte, (ii) biological recognition material, (iii) a transducer, (iv) an electronic module, and (v) a display unit [32]. In conductometric biosensors, when the tested material is introduced into an electrolytic solution, its constituents are recognized by biological elements such as enzymes, antibodies, or whole cells. This biorecognition event creates a signal through interaction between the analyte and biological components, while the transducer transforms this biochemical signal into a measurable change in electrical conductivity [32] [31].
The biological recognition element can be classified as either catalytic or non-catalytic. Catalytic biosensors utilize biological components such as enzymes, tissues, whole cells, or bacteria where the interaction with the analyte results in a biochemical reaction product. In contrast, non-catalytic biosensors employ elements like nucleic acids, antibodies, and cell receptors where the analyte is irreversibly coupled to the receptor without producing new biochemical reaction products [32]. For conductometric biosensors, enzymatic systems are particularly common, where the enzymatic reaction leads to changes in ionic composition that directly affect solution conductivity [31] [33].
Design Advantages and Limitations
The design advantages of conductometric biosensors make them particularly attractive for research and commercial development. Their operation at low-amplitude alternating voltage prevents undesirable Faraday processes on electrodes and reduces polarization effects [31]. The simplicity of the transducer design without the need for a reference electrode enables easier miniaturization and integration into portable systems [31]. Furthermore, their insensitivity to light eliminates the need for light shielding in various applications.
However, conductometric biosensors also face certain limitations that must be addressed through careful fabrication and design. They can be susceptible to interference from non-specific ionic changes in the sample matrix, requiring effective surface blocking strategies [34]. The sensitivity may be limited by the intrinsic conductivity of the sample solution, necessitating optimal buffer selection [31]. Despite these challenges, proper fabrication protocols can effectively mitigate these limitations, making conductometric biosensors highly competitive for a wide range of sensing applications.
Table 1: Comparison of Biosensor Transduction Mechanisms
| Transduction Method | Principle of Operation | Advantages | Limitations |
|---|---|---|---|
| Conductometric | Measures change in solution conductivity due to ionic product formation | Simple electronics, no reference electrode needed, easily miniaturized | Susceptible to non-specific ionic interference |
| Amperometric | Measures current from redox reactions at constant potential | High sensitivity, wide linear range | Requires reference electrode, surface fouling issues |
| Potentiometric | Measures potential difference at electrode-solution interface | Wide concentration range, simple instrumentation | Slow response time, reference electrode required |
| Optical | Measures light absorption, emission, or refractive index changes | High sensitivity, multiplexing capability | Complex instrumentation, potential photobleaching |
Substrate Selection and Functionalization
Substrate Material Selection
The foundation of any conductometric biosensor is the substrate material, which must provide mechanical support, electrical insulation, and compatibility with subsequent fabrication steps. Common substrate materials include soda lime glass, silicon, ceramics, and various polymers such as polycarbonate [35] [36]. The selection criteria for substrate materials encompass several factors: thermal stability to withstand processing temperatures, chemical resistance to etching solutions and solvents, surface smoothness for uniform film deposition, and cost-effectiveness for scalable production [35] [36].
Recent advancements have introduced innovative substrate materials and configurations. For instance, polycarbonate track-etched (PCTE) membranes have been employed as nano-sieve platforms, offering high porosity and uniform pore distribution ideal for biosensing applications [35]. These membranes can be integrated with electrode systems to create platforms where biological recognition events partially block nanosieve pores, resulting in measurable changes in ionic current [35]. The choice of substrate material significantly influences the overall sensor performance, including sensitivity, stability, and reproducibility.
Surface Functionalization Techniques
Surface functionalization is a critical step that creates reactive groups on the substrate surface for subsequent bioreceptor immobilization. For conductometric biosensors, this process must introduce functional groups that facilitate robust attachment of biological recognition elements while maintaining their activity and orientation. Among various functionalization approaches, silanization with 3-aminopropyltriethoxysilane (APTES) has emerged as a widely adopted method due to its ability to form stable amine-terminated monolayers on oxide surfaces [36].
A recent systematic study compared three APTES functionalization methods—ethanol-based, methanol-based, and vapor-phase—for optical cavity-based biosensors, providing valuable insights applicable to conductometric systems [36]. The methanol-based protocol (0.095% APTES) demonstrated superior performance, yielding a threefold improvement in the limit of detection compared to other methods [36]. This enhancement was attributed to the formation of a more uniform APTES layer, which facilitates higher density and more oriented immobilization of bioreceptor molecules.
Table 2: Comparison of APTES Functionalization Methods
| Functionalization Method | Protocol Details | Advantages | Limitations | Optimal Applications |
|---|---|---|---|---|
| Ethanol-based | 2% APTES in ethanol, 5 min incubation | Rapid processing, simple protocol | Potential multilayer formation | Routine applications where highest sensitivity not required |
| Methanol-based | 0.095% APTES in methanol, optimized incubation | Uniform monolayer, enhanced sensitivity | Requires precise concentration control | High-sensitivity detection applications |
| Vapor-phase | APTES vapor deposition under vacuum | Ultra-thin layers, minimal solvent use | Complex setup, longer processing time | Applications requiring minimal surface roughness |
The functionalization process begins with thorough substrate cleaning to remove organic and particulate contaminants. This typically involves sequential sonication in acetone, isopropanol, and deionized water, followed by oxygen plasma treatment to activate the surface by generating hydroxyl groups [36]. For the methanol-based APTES functionalization, substrates are immersed in a 0.095% APTES solution in methanol for a controlled duration, followed by rinsing with methanol and curing at elevated temperatures (100-120°C) to promote covalent bonding [36]. The quality of the functionalized surface can be characterized through contact angle measurements, atomic force microscopy (AFM), and X-ray photoelectron spectroscopy (XPS) to ensure uniform coverage and appropriate surface energy for subsequent immobilization steps.
Electrode Fabrication and Nanomaterial Integration
Electrode Design and Material Selection
Conductometric biosensors utilize interdigitated electrode arrays (IDEs) to measure changes in solution conductivity. The design parameters of these electrodes, including finger width, spacing, and number of pairs, significantly influence sensor sensitivity and overall performance [31]. Preferable electrode materials include noble metals such as gold, platinum, and silver, as well as carbon-based materials like screen-printed carbon electrodes (SPCEs) [35] [33]. Gold offers excellent conductivity and chemical stability but comes at higher cost, while silver provides high conductivity at lower cost but may suffer from oxidation issues. Carbon-based electrodes present a cost-effective alternative with wide potential windows and minimal electrochemical background interference [33].
Fabrication techniques for electrode patterning encompass various methods depending on the required resolution and production scale. Photolithography combined with metal etching offers high precision for research and development purposes, while screen printing provides a cost-effective solution for mass production of disposable sensors [33]. Sputter deposition enables controlled thin-film deposition with excellent uniformity, making it suitable for both laboratory and industrial-scale production [36]. The selection of fabrication technique involves trade-offs between resolution, cost, throughput, and material compatibility.
Nanomaterial Enhancement Strategies
Integration of nanomaterials into conductometric biosensors has revolutionized their performance by enhancing surface area, improving electron transfer kinetics, and providing versatile platforms for bioreceptor immobilization. Recent research has demonstrated the effectiveness of various nanomaterials in biosensing applications:
Graphene and its derivatives offer exceptional electrical conductivity, high surface area, and versatile functionalization chemistry [34]. Graphene oxide (GO) possesses abundant oxygen-containing functional groups that enable covalent and non-covalent modifications for enhanced specificity and stability [34]. Reduced graphene oxide (rGO) balances conductivity with functionalization capability, making it particularly suitable for conductometric transduction [34].
Metal nanoparticles, including gold and silver nanoparticles, provide high surface-to-volume ratios and facilitate electron transfer between biorecognition elements and electrode surfaces [24]. These nanoparticles can be synthesized in various sizes and shapes to optimize their functional properties and can be integrated into biosensors through methods such as electrodeposition, drop-casting, or in-situ reduction [24].
Three-dimensional structured materials such as metal-organic frameworks (MOFs), covalent organic frameworks (COFs), and porous hydrogels have gained recent attention for their ability to significantly expand the binding surface area for biorecognition probes [24]. These materials provide enhanced probe loading capacity and can optimize signal transduction mechanisms, leading to improved sensitivity and detection limits [24].
The integration of nanomaterials typically occurs after electrode fabrication and before bioreceptor immobilization. For graphene-based materials, common integration methods include drop-casting of dispersions, electrophoretic deposition, or in-situ reduction of graphene oxide on the electrode surface [34]. Metal nanoparticles are often incorporated through electrodeposition, chemical reduction, or self-assembly techniques [24]. Three-dimensional frameworks may be grown directly on the electrode surface through solvothermal methods or applied as pre-formed suspensions [24].
Bioreceptor Immobilization Techniques
Immobilization Chemistry and Strategies
Bioreceptor immobilization is arguably the most critical step in biosensor fabrication, as it directly determines the analytical performance through specificity, sensitivity, and stability. The immobilization process must preserve the biological activity of the recognition element while providing stable attachment under operational conditions. Various immobilization strategies have been developed, each with distinct advantages and limitations:
Physical adsorption relies on non-covalent interactions such as van der Waals forces, hydrophobic interactions, and hydrogen bonding. This method offers simplicity and minimal impact on bioreceptor activity but may suffer from leaching and random orientation [34].
Covalent immobilization involves the formation of stable covalent bonds between functional groups on the bioreceptor and the activated substrate surface. Common approaches include EDC-NHS chemistry for creating amide bonds between carboxylic acids and amines, glutaraldehyde cross-linking for amine-containing surfaces, and silane chemistry for hydroxyl-rich surfaces [35] [34]. Covalent immobilization provides excellent stability but requires careful optimization to maintain bioreceptor activity.
Affinity-based immobilization utilizes specific biological interactions such as biotin-streptavidin binding, protein A/G for antibody orientation, or His-tag chelation for recombinant proteins [35]. This approach offers controlled orientation and enhanced binding capacity but introduces additional complexity and cost. A recent study comparing traditional covalent immobilization with protein-G mediated antibody immobilization demonstrated significantly improved detection limits for the affinity-based approach, achieving femtomolar sensitivity for SARS-CoV-2 detection [35].
Entrapment within matrices involves encapsulating bioreceptors within polymeric networks such as hydrogels, sol-gels, or conducting polymers. This method preserves biological activity and allows high loading densities but may introduce diffusion limitations [24]. Alginate, chitosan, and polyvinyl alcohol (PVA) are commonly used entrapment matrices for conductometric biosensors [33].
Orientation and Activity Optimization
The orientation of immobilized bioreceptors significantly influences biosensor performance by affecting binding site accessibility and molecular recognition efficiency. For antibody-based sensors, proper orientation with antigen-binding regions exposed to the solution is crucial for optimal detection capability [35]. Several strategies have been developed to control bioreceptor orientation:
Site-directed immobilization utilizes specific functional groups or tags introduced through genetic engineering or chemical modification to guide oriented attachment [35]. For instance, introducing cysteine residues at specific positions allows directed immobilization through thiol-gold chemistry.
Protein A/G mediated immobilization takes advantage of the natural affinity between these bacterial proteins and the Fc region of antibodies, ensuring proper orientation with antigen-binding sites available for target capture [35]. Research has demonstrated that protein-G mediated antibody immobilization can improve detection limits by up to three orders of magnitude compared to random covalent attachment [35].
DNA-directed immobilization uses complementary oligonucleotide tags on both the bioreceptor and substrate surface to achieve specific and oriented assembly through DNA hybridization [24]. This approach provides precise spatial control and is particularly valuable for multiplexed detection platforms.
Following immobilization, a crucial blocking step is necessary to passivate any remaining reactive sites on the sensor surface to minimize non-specific binding [34]. Common blocking agents include bovine serum albumin (BSA), casein, and synthetic polymers such as polyethylene glycol (PEG) or Pluronic surfactants [34]. The effectiveness of blocking directly impacts signal-to-noise ratio and overall sensor reliability, particularly in complex sample matrices.
Experimental Protocols and Performance Characterization
Detailed Fabrication Protocol for Enzymatic Conductometric Biosensor
Based on the literature survey, the following step-by-step protocol outlines the fabrication of a conductometric biosensor for uric acid detection, adaptable to various analyte systems [33]:
Materials Required:
- Screen-printed carbon electrodes (SPCE)
- Nata de coco membrane as immobilization matrix
- Uricase enzyme (optimized concentration: 18 μg/mL)
- Glutaraldehyde (2.5% in phosphate buffer) as crosslinker
- Bovine serum albumin (BSA) for blocking
- Phosphate buffer (pH 8.0) for optimal enzyme activity
Step-by-Step Procedure:
Substrate Preparation: Clean SPCE surfaces by rinsing with deionized water and drying under nitrogen stream.
Membrane Functionalization:
- Prepare nata de coco membrane with thickness of 5 μm.
- Activate membrane surface through oxygen plasma treatment (100 W, 1 minute).
Enzyme Immobilization:
- Prepare uricase solution at optimized concentration of 18 μg/mL in phosphate buffer (pH 8.0).
- Apply enzyme solution to activated membrane surface (10 μL per electrode).
- Crosslink with 2.5% glutaraldehyde vapor for 30 minutes at room temperature.
- Rinse thoroughly with phosphate buffer to remove unbound enzyme.
Sensor Assembly:
- Attach enzyme-loaded membrane to SPCE surface.
- Secure with inert encapsulation layer, leaving detection area exposed.
Blocking Step:
- Incubate sensor with 1% BSA solution for 1 hour to minimize non-specific binding.
- Rinse with buffer to remove excess blocking agent.
Storage: Store fabricated sensors in dry condition at 4°C until use.
Performance Optimization Parameters:
- Optimal enzyme concentration: 18 μg/mL
- Ideal membrane thickness: 5 μm
- Optimal pH: 8.0
- Linear detection range: 0–1.2 ppm uric acid
- Sensitivity: 7.74 μS/ppm
Performance Characterization and Validation
Comprehensive characterization is essential to validate biosensor performance and reliability. Key performance metrics include:
Sensitivity quantifies the sensor response per unit change in analyte concentration. For the uric acid biosensor described above, sensitivity was reported as 7.74 μS/ppm [33]. Sensitivity determination involves measuring conductivity changes across a series of standard analyte solutions with known concentrations.
Limit of Detection (LOD) represents the lowest analyte concentration that can be reliably distinguished from background signal. Recent advancements in functionalization and immobilization strategies have progressively lowered LOD values across biosensing platforms, with reports of femtomolar detection for optimized systems [35] [36].
Selectivity evaluates sensor performance in the presence of potential interferents. This is typically assessed by challenging the sensor with structurally similar compounds or molecules commonly found in the sample matrix. For the uric acid biosensor, selectivity against common interferents like ascorbic acid, glucose, and urea should be demonstrated [33].
Stability and Reproducibility determine operational lifetime and measurement reliability. Stability testing involves monitoring sensor response over time under storage and operational conditions, while reproducibility assesses response variability across multiple sensor batches [33].
Table 3: Troubleshooting Common Fabrication Issues
| Problem | Potential Causes | Solutions | Preventive Measures |
|---|---|---|---|
| High Background Signal | Incomplete blocking, non-specific binding | Optimize blocking agent concentration and incubation time | Implement multi-step blocking with different agents |
| Low Sensitivity | Poor bioreceptor activity, inadequate immobilization | Check bioreceptor viability, optimize immobilization pH | Use activity assays for quality control, test different immobilization methods |
| Signal Drift | Unstable immobilization, matrix effects | Enhance cross-linking, implement reference electrode | Include stabilization period in measurement protocol |
| Poor Reproducibility | Inconsistent surface functionalization | Standardize cleaning and activation procedures | Implement quality control checks after each fabrication step |
The Scientist's Toolkit: Essential Research Reagents and Materials
Successful fabrication of conductometric biosensors requires careful selection and application of various research reagents and materials. The following table summarizes essential components and their functions in the fabrication process:
Table 4: Essential Research Reagents for Biosensor Fabrication
| Reagent/Material | Function | Application Notes | Key References |
|---|---|---|---|
| APTES | Surface functionalization to introduce amine groups | Optimal concentration: 0.095% in methanol for uniform layers | [36] |
| Graphene Oxide | Nanomaterial enhancer for increased surface area | Patternable features, electron transfer properties | [35] [34] |
| EDC/NHS Chemistry | Covalent immobilization through carbodiimide crosslinking | Activates carboxyl groups for amide bond formation | [35] |
| Glutaraldehyde | Crosslinking agent for amine-rich surfaces | Typically used at 2.5% concentration for enzyme immobilization | [33] |
| Bovine Serum Albumin | Blocking agent to reduce non-specific binding | Effective at 1% concentration with 1 hour incubation | [34] [36] |
| Nata de Coco Membrane | Biocompatible immobilization matrix | Optimal thickness: 5 μm for enzymatic biosensors | [33] |
| Protein A/G | Affinity-based immobilization for antibody orientation | Improves detection limits by ensuring proper orientation | [35] |
The fabrication of conductometric biosensors represents a sophisticated interplay between materials science, surface chemistry, and biological recognition. This comprehensive guide has detailed the critical steps from substrate functionalization to bioreceptor immobilization, emphasizing optimized protocols and troubleshooting strategies based on current literature. The field continues to evolve rapidly, with several emerging trends shaping future development:
Advanced nanomaterials with tailored properties are expanding the capabilities of conductometric biosensors. Particularly, the integration of three-dimensional structured materials such as metal-organic frameworks and covalent organic frameworks provides enhanced surface area and specific binding environments that significantly improve sensor performance [24].
Multiplexed detection platforms that enable simultaneous measurement of multiple analytes are gaining prominence for comprehensive diagnostic applications. Graphene-based sensors, with their tunable surface chemistry, are particularly amenable to array-based configurations and simultaneous detection of multiple biomarkers [34].
Point-of-care integration is driving miniaturization and automation efforts, with microfluidic systems playing an increasingly important role in sample handling and reagent delivery [32]. The combination of conductometric transduction with microfluidics creates powerful platforms for portable, low-cost diagnostic devices suitable for resource-limited settings.
As these advancements continue to mature, the fabrication protocols outlined in this guide provide a solid foundation for developing next-generation conductometric biosensors with enhanced sensitivity, specificity, and reliability for diverse applications in healthcare, environmental monitoring, and biotechnology.
In the evolving field of conductometric biosensors, signal amplification is a cornerstone for achieving high sensitivity and low limits of detection. The integration of nanomaterials has revolutionized this domain by providing enhanced surface areas, superior electrical properties, and versatile functionalization capabilities. Among these, graphene and metal nanoparticles (MNPs) stand out for their unique and complementary properties. This technical guide delves into the fundamental roles these nanomaterials play in enhancing signal amplification, focusing on their application within conductometric biosensors. It provides a detailed examination of their properties, underlying mechanisms, and practical experimental protocols, serving as a foundational resource for researchers and scientists engaged in advanced biosensing and drug development.
Fundamental Properties of Amplifying Nanomaterials
The exceptional performance of graphene and metal nanoparticles in biosensing stems from their intrinsic physicochemical properties. Graphene, a single layer of sp²-hybridized carbon atoms arranged in a hexagonal lattice, possesses a high surface-to-volume ratio, exceptional electrical conductivity, and remarkable mechanical strength [34]. Its delocalized π-electron system facilitates efficient electron transfer, which is crucial for electrochemical signal transduction. Furthermore, its tunable surface chemistry allows for diverse functionalization pathways, enabling the immobilization of various biorecognition elements [34] [37].
Derivatives of graphene, such as graphene oxide (GO) and reduced graphene oxide (rGO), further expand its utility. These materials contain abundant oxygen-containing functional groups, which enable covalent and non-covalent modifications for enhanced specificity and stability in sensing applications [34].
Metal Nanoparticles (MNPs), particularly those of noble metals like gold (Au), silver (Ag), and platinum (Pt), exhibit unique properties at the nanoscale. Their high surface area enhances the immobilization of bioreceptors, and they possess excellent abilities for reaction catalysis and electron transfer, leading to significant signal amplification [38] [39]. A key property of MNPs is their localized surface plasmon resonance (LSPR), which leads to strong light-matter interactions useful in optical sensing and can also influence electrochemical behavior [40]. Their biocompatibility ensures that biological recognition elements retain their functionality upon conjugation [38].
Table 1: Key Properties of Graphene and Metal Nanoparticles for Signal Amplification
| Nanomaterial | Core Properties | Impact on Biosensing Performance |
|---|---|---|
| Graphene | High surface area (~2630 m²/g), exceptional electron mobility (>15,000 cm²/V·s), strong mechanical strength [34]. | Increased bioreceptor loading, rapid electron transfer, enhanced sensitivity, robust device platforms. |
| Graphene Oxide (GO) | Abundant oxygen-containing functional groups (e.g., epoxy, hydroxyl, carboxyl) [34]. | Facilitates covalent biofunctionalization, improved dispersibility in solvents. |
| Gold Nanoparticles | Biocompatibility, strong LSPR, efficient "electron wire" behavior, catalytic activity [38] [39]. | Enhanced signal transduction, label-free detection, catalytic amplification of signals. |
| Silver Nanoparticles | Intense LSPR, high electrical conductivity, antimicrobial properties [38] [41]. | Signal quenching in FRET-based assays, electrode modification for conductivity enhancement. |
| Platinum Nanoparticles | Superior electrocatalytic properties (e.g., towards H₂O₂ reduction) [38]. | Amplification of electrochemical signals in enzymatic biosensors. |
Signal Amplification Mechanisms in Conductometric Biosensors
Conductometric biosensors transduce a biological recognition event into a measurable change in electrical conductivity. Nanomaterials amplify this signal through several sophisticated mechanisms.
Enhanced Electron Transfer
Both graphene and MNPs act as efficient "electron wires," minimizing the electron transfer distance between the redox center of a bioreceptor (e.g., an enzyme) and the transducer surface. Graphene's high carrier mobility allows for rapid electron transport, while MNPs facilitate direct electron tunneling, leading to a more pronounced change in conductivity upon analyte binding [34] [38].
Catalytic Amplification
MNPs, particularly Pt and Au, exhibit catalytic properties that can be harnessed for signal amplification. For instance, Pt nanoparticles can catalyze the reduction of hydrogen peroxide (H₂O₂), a common byproduct of oxidase-based enzymatic reactions. This catalytic cycle generates a significant number of charge carriers, thereby greatly amplifying the primary conductivity signal [38].
Increased Surface Area and Biomolecule Loading
The high surface area-to-volume ratio of both graphene and MNPs allows for a higher density of immobilized biorecognition elements (enzymes, antibodies, aptamers). This increased loading capacity directly translates to a greater number of binding events per unit area, resulting in a larger measurable signal change for a given analyte concentration [34] [38].
Plasmon-Enhanced Effects
While more prominent in optical sensors, the LSPR of MNPs can also influence conductometric sensing. Changes in the local dielectric environment due to analyte binding can alter the charge distribution around the nanoparticles, which can be transduced into a measurable change in conductivity, especially in hybrid nanomaterial systems [40].
The following diagram illustrates the synergistic interplay of these mechanisms in a typical nanomaterial-enhanced conductometric biosensor.
Signal Amplification Pathway
Experimental Protocols for Nanomaterial-Enhanced Biosensors
This section provides detailed methodologies for fabricating and characterizing conductometric biosensors utilizing graphene and metal nanoparticles.
Protocol 1: Fabrication of a Graphene-Based Conductometric Sensor
Objective: To construct a conductometric biosensor with graphene as the primary transduction layer.
Materials:
- Graphene Dispersion: Aqueous dispersion of graphene oxide (GO) or reduced graphene oxide (rGO).
- Substrate: Interdigitated microelectrodes (IDEs) on SiO₂/Si or flexible polymer.
- Bioreceptor: Target-specific enzyme (e.g., Glucose Oxidase), antibody, or aptamer.
- Linker Molecules: (3-Aminopropyl)triethoxysilane (APTES) or 1-Ethyl-3-(3-dimethylaminopropyl)carbodiimide (EDC)/N-Hydroxysuccinimide (NHS).
- Buffers: Phosphate Buffered Saline (PBS), deionized water.
Procedure:
- Electrode Pre-treatment: Clean IDEs with acetone and ethanol via sonication for 10 minutes each, followed by oxygen plasma treatment to activate the surface.
- Graphene Film Deposition: Drop-cast or spin-coat the graphene dispersion onto the IDEs. For rGO, perform in-situ chemical or thermal reduction.
- Surface Functionalization:
- Covalent: Incubate the graphene/IDE with APTES to introduce amine groups. Subsequently, activate carboxylic groups on the graphene surface using EDC/NHS chemistry.
- Non-covalent: Utilize π-π stacking by incubating with a pyrene-based linker molecule.
- Bioreceptor Immobilization: Incubate the functionalized surface with the bioreceptor solution (e.g., 1 mg/mL in PBS) for 2 hours at room temperature.
- Blocking: Treat the surface with a blocking agent (e.g., 1% BSA) for 1 hour to passivate any non-specific binding sites.
- Washing & Storage: Rinse thoroughly with PBS and deionized water. Store at 4°C until use.
Characterization: Use Raman spectroscopy to confirm graphene quality, scanning electron microscopy (SEM) to inspect surface morphology, and electrochemical impedance spectroscopy (EIS) to verify successful immobilization steps.
Protocol 2: Integrating Metal Nanoparticles for Signal Enhancement
Objective: To decorate a graphene-based sensor with metal nanoparticles to boost catalytic activity and electron transfer.
Materials:
- Metal Salt Precursors: Hydrogen tetrachloroaurate (for AuNPs), silver nitrate (for AgNPs).
- Reducing Agents: Sodium citrate, sodium borohydride.
- Stabilizing Agents: Trisodium citrate, polyvinylpyrrolidone (PVP).
- Fabricated Sensor: The graphene-based conductometric sensor from Protocol 1.
Procedure (In-situ Synthesis of AuNPs on Graphene):
- Activation: Place the graphene/IDE sensor in a solution of poly(diallyldimethylammonium chloride) (PDDA) to create a positively charged surface.
- Synthesis: Immerse the activated sensor in a growth solution containing 0.5 mM HAuCl₄ and 0.5 mM trisodium citrate.
- Reduction: Gently add an ice-cold solution of 0.1 M NaBH₄ under constant stirring. The color change on the electrode surface indicates the formation of AuNPs.
- Stabilization: Incubate for 1 hour, then rinse thoroughly with deionized water to remove loosely bound nanoparticles.
- Bioreceptor Immobilization: Proceed with bioreceptor immobilization on the MNP-graphene hybrid surface as described in Protocol 1, Step 4.
Characterization: Use UV-Vis spectroscopy to confirm LSPR peaks of MNPs, transmission electron microscopy (TEM) to determine nanoparticle size and distribution, and cyclic voltammetry (CV) to demonstrate enhanced electrocatalytic current.
Quantitative Performance Comparison
The efficacy of nanomaterial integration is quantitatively demonstrated by the enhanced sensitivity and lower detection limits of the resulting biosensors. The following table summarizes performance metrics from recent studies.
Table 2: Performance Metrics of Nanomaterial-Enhanced Biosensors
| Nanomaterial Platform | Target Analyte | Detection Principle | Sensitivity | Limit of Detection (LOD) | Reference |
|---|---|---|---|---|---|
| Porous Au/PANI/Pt NP Composite | Glucose | Electrochemical (Amperometry) | 95.12 ± 2.54 µA mM⁻¹ cm⁻² | Not Specified | [42] |
| Au-Ag Nanostars | α-Fetoprotein (AFP) | Surface-Enhanced Raman Scattering (SERS) | Not Specified | 16.73 ng/mL | [42] |
| Graphene LSPR Sensor | Carcinoembryonic Antigen (CEA) | Refractometric (LSPR) | 4.3 THz/RIU | 0.001 (Figure of Merit) | [40] |
| ML-Optimized Graphene Sensor | Breast Cancer Biomarkers | Refractometric (Plasmonic) | 1785 nm/RIU | Not Specified | [43] |
The Scientist's Toolkit: Essential Research Reagents
Successful development of nanomaterial-enhanced biosensors relies on a suite of key reagents and materials.
Table 3: Essential Research Reagents and Their Functions
| Reagent/Material | Function in Biosensor Development |
|---|---|
| Graphene Oxide (GO) Dispersion | Starting material for creating conductive graphene films; oxygen functional groups facilitate easy functionalization. |
| EDC/NHS Crosslinker Kit | Activates carboxyl groups on graphene or MNPs for covalent conjugation to amine-containing biomolecules (antibodies, enzymes). |
| (3-Aminopropyl)triethoxysilane (APTES) | Silane coupling agent used to introduce amine functional groups onto substrate surfaces (e.g., SiO₂). |
| Chloroauric Acid (HAuCl₄) | Standard precursor salt for the synthesis of gold nanoparticles (AuNPs). |
| Polyvinylpyrrolidone (PVP) | A stabilizing and capping agent used in nanoparticle synthesis to control growth and prevent aggregation. |
| Bovine Serum Albumin (BSA) | Used as a blocking agent to passivate unreacted sites on the sensor surface, minimizing non-specific binding. |
| Phosphate Buffered Saline (PBS) | Universal buffer for maintaining physiological pH during bioreceptor immobilization and binding assays. |
| Interdigitated Electrodes (IDEs) | The transducer platform; their micro-scale structure is ideal for sensitive conductometric measurements. |
Graphene and metal nanoparticles have indelibly transformed the landscape of conductometric biosensors. Their distinct yet synergistic properties—ranging from superior electrical conductivity and catalytic activity to high surface area and versatile chemistry—provide powerful tools for significant signal amplification. This guide has outlined the fundamental principles, detailed experimental protocols, and key performance metrics that underpin their application. As research progresses, the integration of these nanomaterials with emerging technologies like machine learning for sensor optimization [43] and the development of wearable formats [44] will further solidify their role in enabling the next generation of highly sensitive, specific, and deployable biosensors for advanced diagnostics and drug development.
Detection of Disease Biomarkers and Pathogens for Clinical Diagnostics
Conductometric biosensors are a class of electrochemical biosensors that measure the change in electrical conductivity of a solution resulting from biochemical reactions. These devices belong to the broader family of electrochemical biosensors, which are increasingly important in clinical diagnostics due to their high sensitivity, low cost, simplicity, reliability, quick response, and compatibility with point-of-care (POC) applications [45]. The fundamental principle involves the measurement of ionic strength variations caused by enzymatic reactions or specific binding events between biorecognition elements and target analytes, which subsequently alters the conductivity between two electrodes [46].
The significance of conductometric biosensors has grown substantially within clinical diagnostics, particularly for detecting disease biomarkers and pathogens. Their operational simplicity, minimal power requirements, and compatibility with miniaturized systems make them exceptionally suitable for developing portable diagnostic devices for resource-limited settings [45] [46]. The ongoing COVID-19 pandemic has further emphasized the urgent need for rapid, accurate, and affordable diagnostic tools, accelerating innovation in this field [45].
Fundamental Principles and Components
Working Principle
The core operating mechanism of conductometric biosensors relies on monitoring changes in the electrical conductivity of a solution between two electrodes, typically interdigitated electrodes (IDEs). These changes occur when biological recognition events, such as enzyme-substrate reactions or antibody-antigen binding, alter the ionic composition of the solution [46]. When an alternating current (AC) or voltage is applied, these biosensors detect changes in the reactive and resistive properties of the electrode surface, generating an electrical signal corresponding to the biological interaction [45].
For enzymatic biosensors, the catalytic conversion of substrates into products often results in either consumption or generation of charged species, thereby modifying the overall conductivity of the test solution. This change in conductivity is directly proportional to the analyte concentration and can be precisely quantified using appropriate signal processing electronics [46].
Biosensor Architecture
A standard conductometric biosensor consists of three fundamental components, consistent with most biosensor platforms:
Biorecognition Element: This biological receptor selectively binds to the target analyte. Common elements include enzymes, antibodies, nucleic acids, aptamers, or whole cells. In conductometric biosensors, enzymes are frequently employed due to their catalytic activity that generates measurable conductivity changes [45] [46].
Transducer: In conductometric systems, the transducer comprises interdigitated electrodes that convert the biochemical signal into an electrical signal. The electrode design significantly influences sensitivity, with nanomaterial-modified electrodes offering enhanced performance due to increased surface area and improved electron transfer properties [45] [46].
Signal Processor: This electronic component measures and processes the conductivity changes, converting them into quantifiable data. Modern systems often integrate advanced data processing capabilities, including machine learning algorithms for enhanced signal interpretation and noise reduction [45] [47].
Table 1: Core Components of Conductometric Biosensors
| Component | Function | Common Materials/Examples |
|---|---|---|
| Biorecognition Element | Selective binding to target analyte | Enzymes, antibodies, aptamers, nucleic acids |
| Transducer | Converts biological event to electrical signal | Interdigitated electrodes (gold, platinum, carbon) |
| Signal Processor | Measures and interprets conductivity changes | Potentiostats, custom electronics with data analysis algorithms |
Visualizing Conductometric Biosensor Architecture
The following diagram illustrates the fundamental architecture and working principle of a conductometric biosensor system:
Biosensor Architecture and Signal Pathway
Experimental Framework and Methodologies
Bioreceptor Immobilization Techniques
Effective immobilization of the biorecognition element onto the transducer surface is critical for biosensor performance. The immobilization method directly impacts sensor sensitivity, stability, and reproducibility by influencing bioreceptor orientation, activity, and density [45] [46].
Cross-linking with Glutaraldehyde: This method creates stable covalent bonds between enzyme molecules and the electrode surface. The standard protocol involves: (1) Cleaning and functionalizing the electrode surface; (2) incubating with the enzyme solution; (3) applying glutaraldehyde solution (typically 2.5% v/v) to form cross-links; (4) rinsing thoroughly to remove unbound enzyme and excess cross-linker. Optimal enzyme concentration and immobilization time must be determined empirically for each system [46].
Physical Adsorption: This simpler approach relies on non-covalent interactions (electrostatic, hydrophobic, van der Waals) between the bioreceptor and electrode surface. While easier to implement, it may result in less stable immobilization and potential leakage of the bioreceptor over time [45].
Covalent Binding via Gold-Thiol Interactions: For gold electrodes, thiol-modified aptamers or proteins can form self-assembled monolayers through strong Au-S bonds. This method provides well-oriented, stable immobilization with controlled surface density [45].
Biosensor Optimization and Characterization
Comprehensive optimization and characterization are essential for developing reliable conductometric biosensors. Key parameters requiring systematic investigation include:
pH Optimization: Enzyme activity is highly dependent on pH. The optimal pH should be determined by measuring biosensor response across a physiologically relevant pH range (typically pH 5-9) using appropriate buffer systems [46].
Ionic Strength Effects: Since conductometric detection relies on ionic content, buffer ionic strength significantly influences sensitivity. High ionic strength can mask analyte-specific conductivity changes, while very low ionic strength may insufficiently support biochemical reactions [46].
Temperature Dependence: Enzymatic activity and binding kinetics are temperature-dependent. The operational temperature should be optimized for maximum signal-to-noise ratio, typically between 25-37°C for clinical applications [46].
Storage Stability: Evaluating different storage conditions (e.g., dry at -18°C, wet at 4°C) determines the biosensor's shelf life. Properly immobilized biosensors typically maintain stability for several weeks to months [46].
Detection Protocol Workflow
A standardized detection protocol ensures reproducible biosensor performance:
Experimental Detection Workflow
Performance Analysis and Applications
Analytical Performance Metrics
Rigorous characterization of analytical performance is essential for validating conductometric biosensors. Key metrics include:
Sensitivity: The magnitude of conductivity change per unit concentration of analyte, typically reported as μS/μM or μS/(ng/mL). Enhanced sensitivity can be achieved through nanomaterial-modified electrodes that increase effective surface area [46] [48].
Limit of Detection (LOD): The lowest analyte concentration that produces a signal statistically distinguishable from background noise, calculated using the formula LOD = 3σ/S, where σ is the standard deviation of the blank signal and S is the sensitivity [45]. State-of-the-art conductometric biosensors achieve LODs in the micromolar to nanomolar range for various analytes [46].
Selectivity: The biosensor's ability to respond exclusively to the target analyte in the presence of potential interferents. Selectivity is typically evaluated by challenging the biosensor with structurally similar compounds or molecules commonly found in clinical samples [46].
Response Time: The duration required to reach 95% of the maximum signal following sample introduction. Conductometric biosensors typically exhibit rapid response times ranging from seconds to a few minutes, significantly faster than many conventional diagnostic methods [46].
Linear Range: The concentration interval over which the biosensor response shows linear correlation with analyte concentration. This determines the practical utility for analyzing clinical samples with varying analyte concentrations [46].
Table 2: Performance Characteristics of Representative Conductometric Biosensors
| Target Analyte | Biorecognition Element | Linear Range | Limit of Detection | Response Time | Application Reference |
|---|---|---|---|---|---|
| L-arginine | Arginine deiminase | 20–750 μM | 2 μM | 1–1.5 min | [46] |
| Pathogenic Bacteria | Bacteriophages | 10¹–10⁵ CFU/mL | 10 CFU/mL | <30 min | [49] |
| SARS-CoV-2 Spike Protein | Truncated ACE2 | 0.1–100 nM | 0.05 nM | ~5 min | [50] |
Applications in Pathogen Detection
Conductometric biosensors have demonstrated significant utility in detecting bacterial pathogens, a critical application in clinical diagnostics and food safety. Recent innovations include:
Bacteriophage-Based Sensors: These utilize bacteriophages (viruses that infect bacteria) as highly specific biorecognition elements. The binding of phages to their bacterial hosts triggers conductivity changes, enabling rapid detection without cultural enrichment. Graphene-bacteriophage hybrid nanomaterials have shown particular promise, offering enhanced sensitivity and specificity for pathogens like Salmonella and E. coli [49].
Whole-Cell Detection Systems: Microorganism-based biosensors employ engineered bacterial cells as sensing elements. These systems can detect cobalt contamination in food production chains, demonstrating the versatility of biological recognition elements beyond traditional enzymes and antibodies [51].
Multiplexed Pathogen Detection: Advanced conductometric platforms now enable simultaneous detection of multiple pathogens through array-based approaches or sequential analysis, significantly improving diagnostic efficiency during outbreaks of unknown etiology [52].
Applications in Biomarker Detection
Conductometric biosensors are increasingly applied to detect disease-specific biomarkers, enabling early diagnosis and monitoring of various pathological conditions:
Metabolic Biomarkers: Enzymatic biosensors targeting metabolites like L-arginine provide valuable tools for monitoring metabolic disorders. The arginine deiminase-based biosensor exemplifies this application, with demonstrated efficacy in analyzing dietary supplements and potential for clinical sample analysis [46].
Neurological Disorder Biomarkers: Recent advances include biosensors for detecting protein biomarkers associated with neurodegenerative diseases like Alzheimer's. While often employing electrochemical rather than purely conductometric transduction, these platforms share similar design principles and immobilization strategies [49].
Inflammatory Markers: Implantable conductometric biosensors are being developed for continuous monitoring of inflammatory cytokines like IL-6, enabling early detection of conditions such as sepsis. These systems represent the convergence of conductometric sensing with minimally invasive monitoring technologies [53].
Advanced Integration and Future Perspectives
Integration with Artificial Intelligence
The integration of artificial intelligence (AI) and machine learning (ML) algorithms is transforming conductometric biosensing capabilities:
Enhanced Signal Processing: ML techniques, including noise filtering, anomaly detection, and data imputation, significantly improve signal-to-noise ratio and detection reliability, particularly in complex clinical matrices [53] [47].
Predictive Analytics: AI algorithms can identify subtle patterns in conductometric data that correlate with disease progression or treatment response, enabling predictive diagnostics and personalized medicine approaches [53].
Multi-analyte Pattern Recognition: Advanced pattern recognition algorithms facilitate interpretation of complex signals from multiplexed biosensors, allowing simultaneous monitoring of multiple biomarkers for comprehensive diagnostic assessment [47].
Nanomaterial Enhancement
Nanomaterials play a crucial role in enhancing conductometric biosensor performance:
Gold Nanostructures: 3D gold nano/microislands (NMIs) and gold nanoparticles (AuNPs) significantly increase the active surface area of electrodes, leading to substantial improvements in biosensor performance [45].
Carbon Nanomaterials: Graphene and carbon nanotubes offer unique physical structures and exceptional electrical properties that enhance electron transfer kinetics and provide higher sensitivity [45] [49].
Metal Oxide Nanostructures: Zinc oxide (ZnO) nanostructures serve as effective surface layers due to their high isoelectric point and strong binding affinity toward biomolecules, facilitating improved bioreceptor immobilization [45].
Emerging Form Factors
Next-generation conductometric biosensors are evolving beyond traditional benchtop platforms:
Wearable Biosensors: Skin-adherent patches incorporating conductometric sensors enable continuous monitoring of biomarkers in sweat, offering non-invasive assessment of physiological status and early infection detection [53].
Implantable Systems: Miniaturized conductometric sensors can be implanted for long-term monitoring of biochemical parameters, providing real-time data for managing chronic conditions and detecting infectious processes [53].
Point-of-Care Devices: Integrated systems combining conductometric detection with microfluidics and wireless connectivity enable rapid, decentralized testing in resource-limited settings, expanding access to advanced diagnostics [45] [53].
The Scientist's Toolkit: Essential Research Reagents
Table 3: Key Research Reagent Solutions for Conductometric Biosensor Development
| Reagent/Category | Function/Purpose | Specific Examples |
|---|---|---|
| Biorecognition Elements | Target-specific molecular recognition | Recombinant arginine deiminase [46], bacteriophages [49], truncated ACE2 [50] |
| Immobilization Chemicals | Secure bioreceptors to transducer surface | Glutaraldehyde (cross-linker) [46], thiol modifiers (for gold-thiol chemistry) [45] |
| Electrode Materials | Serve as conductometric transducers | Interdigitated gold electrodes [46], graphene foam [49], carbon nanotube composites [45] |
| Nanomaterial Enhancers | Increase sensitivity and surface area | Gold nanoparticles [45], graphene [49], metal oxide nanostructures [45] |
| Buffer Components | Maintain optimal biochemical conditions | PBS, HEPES, Tris buffers with optimized ionic strength and pH [46] |
| Signal Processing Tools | Data acquisition and analysis | Machine learning algorithms (noise filtering, pattern recognition) [53] [47], potentiostats [45] |
Conductometric biosensors represent a rapidly advancing field with significant potential to transform clinical diagnostics. Their unique combination of sensitivity, simplicity, and cost-effectiveness positions them as ideal platforms for detecting disease biomarkers and pathogens across diverse healthcare settings. Ongoing innovations in bioreceptor engineering, nanomaterial integration, and artificial intelligence are continuously expanding their capabilities and applications. As these technologies mature and overcome remaining challenges related to standardization and regulatory approval, conductometric biosensors are poised to play an increasingly vital role in global health security, personalized medicine, and point-of-care diagnostics, ultimately improving patient outcomes through rapid, accurate, and accessible disease detection.
Applications in Therapeutic Drug Monitoring and Pharmacokinetic Studies
Therapeutic Drug Monitoring (TDM) represents a critical methodology in clinical pharmacology for individualizing drug therapy by measuring drug concentrations in biological fluids to optimize dosage regimens. Traditional TDM has relied on techniques such as high-performance liquid chromatography (HPLC) and immunoassays, which, while sensitive and specific, require specialized laboratories, trained personnel, and are often incapable of providing real-time monitoring results [54] [55] [56]. These limitations have prompted the development of advanced biosensing technologies that can overcome these challenges, with conductometric biosensors emerging as particularly promising tools due to their miniaturization potential, cost-effectiveness, and suitability for point-of-care testing [1] [4].
Conductometric biosensors belong to the broader category of electrochemical biosensors that measure changes in the electrical conductivity of a solution resulting from biochemical reactions involving the target analyte [1] [4]. These devices typically consist of a biological recognition element (such as enzymes, antibodies, or aptamers) immobilized on a transducer surface, which in the case of conductometric sensors, is typically composed of thin-film interdigitated electrodes [1]. When the target analyte interacts with the biological recognition element, it triggers a reaction that alters the ionic composition within the microenvironment of the transducer, leading to measurable changes in electrical conductivity that correlate with analyte concentration [1].
The integration of conductometric biosensors into TDM and pharmacokinetic studies offers transformative potential for personalized medicine. These devices enable rapid, continuous monitoring of drug levels, facilitating real-time dosage adjustments that are particularly crucial for medications with narrow therapeutic windows, such as anti-epileptics, antibiotics, and chemotherapeutic agents [54] [55]. This review comprehensively examines the fundamental principles, current applications, methodological protocols, and future directions of conductometric biosensing technology within the context of TDM and pharmacokinetic research.
Fundamentals of Conductometric Biosensing
Basic Principles and Measurement Techniques
Conductometric biosensors operate on the principle of detecting changes in the electrical conductivity of an electrolyte solution resulting from enzymatic or affinity-based biorecognition events. The conductivity of liquids arises from the dissociation of dissolved substances into ions, whose migration under an applied electrical field generates a measurable current [1]. According to Ohm's law, the conductivity (S) of an electrolyte solution depends on ion concentration (ci) and mobility (ui), as described by the equation: S = FΣziciui, where F is Faraday's constant and zi represents the charge number of each ionic species [1].
Conductometric transducers typically employ interdigitated electrode structures, which offer significant advantages for biosensing applications. These advantages include suitability for miniaturization using inexpensive thin-film technology, elimination of the need for a reference electrode, low power consumption due to operable low driving voltages, and insensitivity to light interference [1]. Additionally, the differential measurement schemes commonly employed in conductometric biosensors effectively compensate for background conductivity variations, temperature fluctuations, and other environmental factors that could otherwise compromise measurement accuracy [1].
The fundamental mechanism involves monitoring conductivity changes resulting from biochemical reactions that either consume or produce ionic species. For instance, enzyme-catalyzed reactions often involve the conversion of electrically neutral substrates into ionic products or vice versa, thereby altering the local ionic composition and consequently the electrical conductivity within the measurement region [1]. This change in conductivity is directly proportional to the analyte concentration, enabling quantitative determination of the target substance.
Design Considerations and Transducer Configuration
The design of conductometric biosensors requires careful consideration of multiple factors to optimize performance characteristics such as sensitivity, selectivity, and stability. The interdigitated electrode structure represents the most prevalent transducer configuration, with optimal performance dependent on geometric parameters including electrode width, spacing between digits, and number of digit pairs [1]. These parameters collectively determine the baseline resistance and the sensitivity to conductivity changes in the sample solution.
Table 1: Key Advantages of Conductometric Biosensors for TDM Applications
| Advantage | Technical Basis | Impact on TDM Applications |
|---|---|---|
| Miniaturization capability | Thin-film electrode fabrication using standard technology | Enables development of portable, point-of-care devices for bedside monitoring |
| Reference electrode elimination | Differential measurement mode | Simplifies sensor design and reduces manufacturing costs |
| Low power consumption | Operable with low driving voltages (<50 mV) | Facilitates development of wearable and implantable monitoring devices |
| Background interference compensation | Differential measurement between active and reference sensors | Improves accuracy in complex biological matrices like blood and serum |
| Wide applicability | Compatibility with various biorecognition elements (enzymes, antibodies, aptamers) | Versatile platform for monitoring different drug classes |
| Light insensitivity | Non-optical transduction principle | Enables operation in various lighting conditions without signal interference |
Immobilization of the biological recognition element onto the transducer surface represents a critical step in biosensor fabrication. Common immobilization techniques include physical adsorption, covalent bonding, cross-linking, and entrapment within polymer matrices [4]. The selection of an appropriate immobilization strategy must balance considerations of bioreceptor stability, activity retention, and minimization of non-specific binding effects that could compromise measurement accuracy.
For TDM applications, where samples typically exhibit high and variable background conductivity (e.g., blood, serum, urine), differential measurement approaches are particularly advantageous [1]. This configuration typically incorporates both an active sensor (with immobilized biorecognition element) and a reference sensor (without biorecognition element or with inactivated element), allowing for continuous compensation of background conductivity variations and non-specific binding effects.
Figure 1: Fundamental signaling pathway of conductometric biosensors for drug detection. The process begins with sample introduction, followed by specific biorecognition, ionic changes, and finally electrical signal transduction.
Current Applications in Therapeutic Drug Monitoring
Conductometric Biosensors for Specific Drug Classes
The application of conductometric biosensors in TDM has shown significant promise across multiple drug classes, particularly those with narrow therapeutic indices where precise concentration monitoring is clinically essential. While the search results specifically detail optical and electrochemical biosensors for various drugs, the principles can be extrapolated to conductometric approaches with appropriate modification.
Antibiotics represent a major application area for biosensing technologies in TDM. Drugs such as aminoglycosides, glycopeptides, and colistin require careful monitoring due to their concentration-dependent efficacy and potential for nephro- and ototoxicity [54] [55]. Traditional monitoring of these antibiotics involves cumbersome methods with significant time delays, whereas conductometric biosensors offer the potential for rapid, bedside determination of drug concentrations. For instance, β-lactam antibiotics have been detected using electrochemical biosensors with immobilized β-lactamase enzymes, which catalyze the hydrolysis of the β-lactam ring, producing ionic products that alter solution conductivity [56].
Anti-epileptic drugs (e.g., phenytoin, valproic acid, carbamazepine) constitute another significant category where conductometric biosensing technology shows considerable promise. These medications typically exhibit narrow therapeutic windows and significant interindividual pharmacokinetic variability, necessitating frequent monitoring to maintain therapeutic efficacy while avoiding adverse effects [54] [55]. Biosensors for anti-epileptic drugs often employ specific enzymes or antibodies as recognition elements, with the binding or catalytic event generating measurable conductivity changes proportional to drug concentration.
Chemotherapeutic agents with haematotoxic profiles, such as methotrexate, paclitaxel, and capecitabine, are strong candidates for conductometric biosensor development [55]. These drugs require precise dosing to maximize antitumor efficacy while minimizing severe side effects. For example, methotrexate monitoring has been achieved using optical biosensors with immobilized dihydrofolate reductase, a principle that could be adapted to conductometric platforms [56]. Similarly, biosensors for paclitaxel have employed DNA-based recognition elements, taking advantage of drug-DNA interactions that could potentially generate conductivity changes [56].
Quantitative Performance of Various Biosensor Platforms
Table 2: Performance Characteristics of Representative Biosensors for Therapeutic Drug Monitoring
| Target Drug | Biosensor Type | Recognition Element | Detection Limit | Sample Matrix | Reference |
|---|---|---|---|---|---|
| Infliximab | Fiber optic SPR | Anti-IFX antibody | <2 ng/mL | Dried blood spots | [56] |
| Digoxin | LSPR-based nanobiosensor | Anti-digoxin antibody | 2 ng/mL | PBS solution | [56] |
| Methotrexate | Colorimetric plasmonic | Human dihydrofolate reductase | 5 nM | PBS | [56] |
| Taxol | Electrochemical pencil graphite | ds-DNA | 8×10^(-8) M | Urine, blood serum | [56] |
| Tenofovir | Electrochemical FET-based | TFV-aptamer | 1.2 nM | PBS buffer | [56] |
| Beta-lactam antibiotics | Electrochemical microneedle | β-lactamase | 6.8 μM | PBS under human skin | [56] |
| Levodopa | Electrochemical wearable | Tyrosinase enzyme | 1 μM | Sweat solution | [56] |
| Phenytoin | Piezoresistive microcantilever | Capture antibody | 9.5 μg/mL | Deionized water | [56] |
While Table 2 primarily features non-conductometric biosensors, it illustrates the impressive sensitivity and specificity achievable with various biosensing platforms, providing performance benchmarks for conductometric sensor development. The detection limits reported for these sensors generally fall within clinically relevant concentration ranges, demonstrating the feasibility of biosensor technology for TDM applications.
Notably, the integration of conductometric biosensors into wearable formats represents a particularly promising development for continuous TDM. For instance, wearable sweat bands incorporating enzymatic biosensors have successfully demonstrated levodopa monitoring with detection limits of 1 μM, a principle that could be adapted to conductometric transduction [56]. Similarly, hollow microneedle-based biosensors have enabled transdermal monitoring of levodopa and beta-lactam antibiotics in interstitial fluid, offering a minimally invasive approach to continuous drug level monitoring [56].
Experimental Protocols and Methodologies
Fabrication of Conductometric Transducers
The fabrication of interdigitated electrodes for conductometric biosensing typically employs thin-film standard technology, which enables cost-effective production while ensuring consistency and reproducibility across devices [1]. A representative protocol involves the following steps:
Substrate Preparation: Clean glass or silicon wafers with standard piranha solution (3:1 H₂SO₄:H₂O₂) followed by rinsing with deionized water and nitrogen drying.
Photolithographic Patterning: Deposit a positive photoresist (e.g., AZ 5214) via spin coating at 3000 rpm for 30 seconds, followed by soft baking at 95°C for 60 seconds. Expose the photoresist to UV light through a photomask containing the interdigitated electrode pattern, then develop in AZ 726 developer for 45-60 seconds.
Metal Deposition: Deposit a 10 nm chromium adhesion layer followed by a 100 nm gold layer using thermal or electron-beam evaporation techniques.
Lift-off Process: Immerse the patterned wafer in acetone with gentle agitation to remove excess metal, leaving the interdigitated electrode structure. Rinse with isopropanol and deionized water, then dry with nitrogen.
Insulation Layer Application: Apply a silicon nitride or SU-8 epoxy passivation layer to define the active sensing area while insulating the contact pads.
The completed interdigitated electrodes typically feature digit widths and spacings ranging from 2-20 μm, with the specific dimensions optimized according to the target application and required sensitivity [1].
Bioreceptor Immobilization Procedures
The immobilization of biological recognition elements onto the transducer surface represents a critical step that significantly influences biosensor performance. While specific protocols vary depending on the bioreceptor type, a generalized enzyme immobilization procedure includes:
Materials Required:
- Conductometric transducers with gold interdigitated electrodes
- Enzyme solution (1-5 mg/mL in appropriate buffer)
- Cross-linking agents (e.g., glutaraldehyde, EDC/NHS)
- Thiol-based self-assembled monolayer (SAM) compounds (e.g., 11-mercaptoundecanoic acid)
- Blocking agents (e.g., bovine serum albumin, ethanolamine)
- Appropriate buffer solutions (e.g., phosphate buffer, HEPES)
Procedure:
Electrode Pretreatment: Clean electrodes via oxygen plasma treatment for 2 minutes at 100 W to remove organic contaminants and enhance surface reactivity.
SAM Formation: Immerse transducers in 10 mM 11-mercaptoundecanoic acid solution in ethanol for 12-16 hours at room temperature to form a self-assembled monolayer.
Activation: Rinse with ethanol and deionized water, then activate the carboxyl termini by incubating in a solution containing 75 mM N-hydroxysuccinimide (NHS) and 30 mM N-(3-dimethylaminopropyl)-N'-ethylcarbodiimide hydrochloride (EDC) for 30 minutes.
Enzyme Immobilization: Incubate activated electrodes in enzyme solution (1-5 mg/mL in 10 mM phosphate buffer, pH 7.4) for 2 hours at room temperature or overnight at 4°C.
Quenching and Blocking: Treat with 1 M ethanolamine (pH 8.5) for 30 minutes to quench unreacted sites, followed by incubation with 1% bovine serum albumin for 60 minutes to minimize non-specific binding.
Storage: Rinse thoroughly with appropriate buffer and store at 4°C until use.
For antibody-based biosensors, Protein A or G may be incorporated into the SAM to provide oriented immobilization, thereby enhancing antigen-binding capacity and assay sensitivity [4].
Measurement Protocols and Data Analysis
Conductometric measurements for TDM applications typically employ a differential measurement approach to compensate for non-specific background effects:
Instrument Setup: Connect the conductometric biosensor to an impedance analyzer or custom-built conductometric measurement system. Apply a low-amplitude AC excitation signal (typically 10-50 mV) at frequencies ranging from 10 Hz to 100 kHz.
Baseline Establishment: Equilibrate both active and reference sensors in appropriate buffer (e.g., phosphate-buffered saline, pH 7.4) until stable baseline readings are obtained (typically 5-10 minutes).
Sample Introduction: Introduce sample containing the target drug analyte to both active and reference sensors while continuously monitoring conductivity.
Signal Recording: Record the differential conductivity signal (active minus reference) at predetermined time intervals until signal stabilization occurs.
Calibration: Construct a calibration curve using standard solutions with known drug concentrations, typically covering the clinically relevant range.
Data Analysis: Calculate unknown drug concentrations from the calibration curve using appropriate regression models (e.g., linear, logarithmic, or four-parameter logistic).
Figure 2: Experimental workflow for conductometric biosensor development and application in TDM, encompassing fabrication, bioreceptor immobilization, measurement, and data analysis stages.
Essential Research Reagents and Materials
The development and implementation of conductometric biosensors for TDM applications requires numerous specialized reagents and materials. The following table summarizes key components essential for successful biosensor fabrication and operation:
Table 3: Essential Research Reagent Solutions for Conductometric Biosensor Development
| Category | Specific Examples | Function/Purpose | Technical Considerations |
|---|---|---|---|
| Transducer Materials | Gold, chromium, silicon wafers, glass substrates | Forms the conductometric sensing platform | Gold provides excellent conductivity; chromium enhances adhesion; silicon/glass offer stable substrates |
| Biorecognition Elements | Specific enzymes, antibodies, aptamers, whole cells | Provides molecular recognition for target drug compounds | Selection depends on drug properties; enzymes offer catalytic amplification; antibodies provide high specificity |
| Immobilization Reagents | 11-mercaptoundecanoic acid, glutaraldehyde, EDC/NHS, Protein A/G | Anchors biorecognition elements to transducer surface | SAM formation provides ordered interfaces; cross-linkers stabilize immobilized biomolecules |
| Blocking Agents | Bovine serum albumin, casein, ethanolamine, Tween-20 | Reduces non-specific binding | Minimizes background signal; improves signal-to-noise ratio |
| Buffer Systems | Phosphate buffer, HEPES, Tris, carbonate buffer | Maintains optimal pH and ionic conditions | Preserves bioreceptor activity; optimizes biochemical reactions |
| Signal Enhancement Reagents | Redox mediators, nanoparticles, conducting polymers | Amplifies conductivity changes | Enhances sensitivity; lowers detection limits |
| Calibration Standards | Drug reference standards, internal standards | Enables quantitative measurement | Establishes calibration curves; ensures measurement accuracy |
The selection of appropriate biorecognition elements represents a particularly critical consideration in biosensor development. Enzymatic recognition elements offer the advantage of catalytic amplification, potentially enhancing sensitivity, while antibody-based systems provide exceptional specificity through immunochemical recognition [1] [4]. More recently, aptamer-based recognition elements have gained prominence due to their superior stability, reproducibility, and ease of modification compared to protein-based receptors [56].
Buffer composition significantly influences biosensor performance, with optimal ionic strength representing a crucial balance between maintaining adequate baseline conductivity and preserving bioreceptor activity. Additionally, proper selection of blocking agents proves essential for minimizing non-specific binding effects, particularly when analyzing complex biological matrices such as blood, serum, or urine [1] [4].
Future Perspectives and Research Directions
The field of conductometric biosensing for TDM and pharmacokinetic studies continues to evolve rapidly, with several promising research directions emerging. The integration of conductometric biosensors with wearable technology represents a particularly significant advancement, enabling continuous, real-time monitoring of drug concentrations [54] [56]. Such systems would facilitate truly personalized dosing regimens adjusted according to individual metabolic variations, potentially revolutionizing medication management for drugs with narrow therapeutic indices.
The development of multi-analyte conductometric biosensors constitutes another important research direction. Such systems would enable simultaneous monitoring of parent drugs and their metabolites or multiple drugs administered as part of combination therapies, providing comprehensive pharmacokinetic profiles [54]. This capability would be especially valuable in contexts such as cancer chemotherapy, antimicrobial therapy, and treatment of chronic conditions requiring multiple medications, where complex drug interactions significantly impact therapeutic outcomes.
The incorporation of conductometric biosensors into closed-loop systems, or "artificial pancreases" for drug delivery, represents a transformative future application [54]. Such systems would continuously monitor drug concentrations and automatically adjust infusion rates to maintain target concentrations, minimizing the risks of both subtherapeutic dosing and toxic accumulation. While significant technical challenges remain, particularly regarding sensor stability and biocompatibility for implantable applications, preliminary research demonstrates the feasibility of this approach.
Emerging materials science innovations promise to address current limitations in conductometric biosensing technology. The integration of nanomaterials such as graphene, carbon nanotubes, and metal nanoparticles offers opportunities for enhanced sensitivity through increased surface area and improved electrical properties [56]. Similarly, the development of novel polymer matrices and membrane systems may improve biosensor stability and biocompatibility, particularly for implantable or wearable applications.
The marriage of conductometric biosensors with digital health technologies and artificial intelligence represents another promising frontier [56]. Such integration would enable not only continuous drug monitoring but also sophisticated data analysis, pattern recognition, and predictive modeling of pharmacokinetic profiles, potentially identifying optimal dosing regimens based on individual patient characteristics and response patterns.
Finally, the ongoing miniaturization of conductometric biosensing systems, potentially incorporating microfluidic sample handling and preparation, will further enhance their utility for point-of-care testing and patient self-monitoring [54] [1]. These developments promise to make therapeutic drug monitoring more accessible, convenient, and cost-effective, potentially expanding its application beyond traditional hospital settings to outpatient and even home-based care environments.
The field of conductometric biosensors is undergoing a revolutionary transformation, driven by the convergence of wearable patches, implantable sensors, and lab-on-a-chip (LoC) integration. These emerging formats are pushing the boundaries of what's possible in continuous, real-time biochemical monitoring, enabling unprecedented capabilities in personalized medicine and decentralized healthcare. Conductometric biosensors, which transduce biological recognition events into measurable changes in electrical conductivity, are particularly well-suited for these platforms due to their inherent miniaturization potential, low power requirements, and compatibility with microfabrication processes [57]. This technical guide examines the fundamental principles, current advancements, and methodological approaches for developing these integrated systems within the broader context of conductometric biosensing research.
The integration of these technologies aligns with the emerging paradigm of Healthcare 5.0, which emphasizes smart, predictive, and personalized healthcare through continuous physiological monitoring and real-time data analytics [58]. For researchers and drug development professionals, understanding these platforms is crucial for developing next-generation diagnostic and monitoring systems that can provide comprehensive insights into patient physiology and therapeutic responses outside traditional clinical settings.
Technological Foundations and Current Landscape
Wearable Microfluidic Patches
Wearable patches represent a non-invasive approach to continuous biomarker monitoring, typically interfacing with easily accessible biofluids like sweat. These systems combine soft microfluidics with various sensing modalities to create conformable, skin-integrated platforms.
Design Architecture: A typical wearable microfluidic patch consists of multiple layers: an adhesive layer for skin attachment, a polydimethylsiloxane (PDMS) substrate, microfluidic channels for fluid handling, a biosensor layer, and a top protective layer [59]. The microfluidic components enable precise fluid management, including sweat collection, transport, and sometimes sequential analysis through capillary forces or passive pumping mechanisms.
Sensing Modalities: While colorimetric and optical sensing have been widely implemented, conductometric approaches are gaining traction for their quantitative capabilities and electronic integration potential. Recent innovations include fully integrated wireless patches for monitoring hormones like estradiol in sweat using aptamer-based electrochemical sensors with gold nanoparticle-MXene electrodes, achieving detection in the picomolar range [59]. Similarly, flexible wearable immunosensors integrating Ti3C2Tx MXene with laser-burned graphene on PDMS have demonstrated sensitive detection of cortisol in sweat with limits of detection reaching 88 pM [59].
Implantable Biosensing Systems
Implantable sensors provide access to more direct and stable biomarker sources, enabling clinical-grade monitoring for chronic disease management. These devices can be categorized based on their sensing principles and target applications.
Table 1: Classification of Implantable Biosensors by Sensing Mechanism [60] [58]
| Sensor Type | Transduction Principle | Measured Parameters | Key Applications |
|---|---|---|---|
| Biophysical Sensors | Physical parameter measurement | Pressure, temperature, electrical signals | Orthopedics (bone healing), cardiology (heart rhythm), urology (bladder pressure) |
| Electrochemical Sensors | Electron transfer from biochemical reactions | Glucose, neurotransmitters, hormones, ions | Continuous glucose monitoring, neurochemical monitoring (dopamine, acetylcholine) |
| Optical Sensors | Light-based detection mechanisms | Oxygen saturation, pH, specific biomarkers | Tissue oxygen sensing, infection detection through pH changes |
| Piezoelectric Sensors | Mechanical stress to electrical signals | Pressure, mass changes | Cardiac pacemakers, urological pressure monitoring |
Key Design Considerations: Developing effective implantable sensors requires addressing multiple engineering challenges. Biocompatibility is paramount, as devices must function within the hostile physiological environment without provoking immune responses or inflammation [60]. Material selection and biocompatible coatings are critical strategies. Power supply represents another significant challenge, with research focusing on energy-efficient designs, bio-batteries, and wireless power transfer technologies, such as specialized glasses developed to recharge ocular implants [60]. Long-term stability must address issues of biofouling, signal drift, and mechanical stress through advanced materials and calibration techniques [60].
Lab-on-Chip Integration
LoC technology integrates multiple laboratory functions onto a single micro-scale platform, enabling complex analyses from minimal sample volumes. When combined with wearable and implantable formats, LoC systems provide complete "sample-to-answer" solutions in miniaturized form factors [57].
Microfluidic Foundations: The core of LoC technology lies in microfluidics, which enables precise manipulation of fluids at the microscale. This control allows for created spatial and temporal gradients of temperature, concentration, and other reaction parameters essential for biological assays [57]. Advanced materials including PDMS, polymethylmethacrylate (PMMA), hydrogels, and smart textiles enable flexibility and biocompatibility [59].
System Integration: Modern LoC platforms integrate microfluidic handling with biosensing components, electronics for signal processing, and wireless communication modules (Bluetooth Low Energy, NFC, RFID) for data transmission [57]. This integration supports real-time health monitoring and data-driven decision-making, forming the foundation for closed-loop therapeutic systems.
Experimental Methodologies and Protocols
Fabrication Techniques for Soft Microfluidic Systems
Developing advanced biosensing platforms requires specialized fabrication approaches that accommodate flexibility, miniaturization, and biocompatibility.
Soft Lithography: This remains a fundamental technique for creating microfluidic channels in elastomers like PDMS. The process begins with creating a silicon master mold through photolithography. PDMS pre-polymer is then poured over the mold and cured, resulting in a replica containing the desired microchannel architecture. The PDMS layer can be plasma-treated and bonded to other surfaces to form enclosed fluidic networks [59].
Additive Manufacturing: 3D printing has emerged as a versatile approach for rapid prototyping of microfluidic systems. Techniques like stereolithography and digital light processing can create complex channel geometries with feature sizes down to tens of micrometers. Multi-material printing enables integration of rigid and flexible components within unified architectures [57].
Laser Cutting and Micromachining: For creating precise features in polymer films and substrates, laser cutting systems offer high precision and rapid processing. This technique is particularly valuable for producing layered microfluidic systems with incorporated electrodes for conductometric sensing [59].
Conductometric Biosensor Development
The core of these integrated systems lies in the development of sensitive and selective conductometric biosensors.
Electrode Fabrication: Microfabricated electrodes form the foundation of conductometric biosensors. Interdigitated electrode (IDE) arrays are particularly effective due to their enhanced sensitivity. Fabrication typically begins with cleanroom processes including photolithography, metal deposition (gold, platinum, or carbon-based materials), and lift-off processes to define electrode patterns [57]. Flexible substrates require specialized adhesion layers and stress-engineering to maintain conductivity under mechanical deformation.
Surface Functionalization: Electrode surfaces must be modified with biological recognition elements to impart specificity. Common approaches include:
- Self-Assembled Monolayers (SAMs): Thiol-based SAMs on gold electrodes provide well-defined chemical interfaces for subsequent immobilization.
- Polymer Films: Conducting polymers like PEDOT:PSS or polyaniline can be electrodeposited to enhance sensitivity and provide functional groups for biomolecule attachment.
- Nanomaterial Integration: Nanostructures including graphene, MXenes, gold nanoparticles, and carbon nanotubes significantly increase surface area and enhance conductivity [59]. These can be incorporated through drop-casting, electrochemical deposition, or in-situ synthesis.
Biorecognition Element Immobilization: The final functionalization step involves attaching specific biorecognition elements to the modified electrode surface. Enzymes, antibodies, or aptamers can be immobilized through covalent coupling, affinity interactions, or entrapment within polymer matrices. The choice of immobilization method significantly impacts sensor stability, sensitivity, and shelf life.
System Integration and Validation
Multimodal Sensing Integration: Advanced platforms often incorporate multiple sensing modalities to enhance reliability and information content. Integration strategies must address potential cross-talk between different sensor types through careful layout design, shielding, and signal processing approaches [59].
Wireless Electronics Integration: Flexible hybrid electronics (FHE) enable signal conditioning, processing, and wireless transmission while maintaining mechanical compatibility with soft microfluidic systems. Miniaturized components are interconnected with stretchable conductors to accommodate deformation [57].
Validation Protocols: Comprehensive performance characterization is essential before biological testing. This includes:
- In Vitro Calibration: Testing with standard solutions across the expected concentration range to establish sensitivity, linear range, limit of detection, and response time.
- Selectivity Assessment: Challenging sensors with potentially interfering compounds to quantify selectivity.
- Stability Testing: Evaluating performance over time and under various storage conditions.
- Mechanical Reliability: For wearable systems, testing under repeated bending and stretching to ensure operational robustness.
Table 2: Essential Research Reagent Solutions for Conductometric Biosensor Development [59]
| Reagent/Material | Function | Application Examples |
|---|---|---|
| Polydimethylsiloxane (PDMS) | Flexible substrate and microfluidic channels | Creating soft, skin-conformable patches and implantable sensor housings |
| PEDOT:PSS | Conductive polymer for electrode fabrication | Transducing layer in organic electrochemical transistors, enhancing signal transduction |
| MXenes (Ti3C2Tx) | 2D conductive nanomaterial | Electrode modification to increase surface area and enhance sensitivity |
| Gold Nanoparticles | Nanostructured electrode material | Enhancing electron transfer and providing surface for bioreceptor immobilization |
| Specific Aptamers | Biorecognition elements | Molecular recognition of targets like cortisol, estradiol with high specificity |
| Molecularly Imprinted Polymers (MIPs) | Synthetic biorecognition elements | Artificial antibody mimics for stable, cost-effective recognition layers |
Implementation Considerations and Analytical Workflows
Data Processing and Analysis
The complex data streams from integrated biosensing platforms require sophisticated processing approaches to extract meaningful physiological information.
Signal Processing Workflows: Raw conductometric data typically requires multiple processing steps including filtering to remove noise (often from motion artifacts), baseline correction, and feature extraction. Machine learning approaches are increasingly employed for pattern recognition and artifact rejection [61].
Multianalyte Data Fusion: For systems with multiple sensing capabilities, data fusion algorithms integrate information from different sensors to enhance accuracy and provide more comprehensive physiological profiles. Artificial intelligence algorithms facilitate noise filtering, pattern recognition, multibiomarker identification, and predictive diagnostics across different sensor systems [61].
The following diagram illustrates a generalized experimental workflow for developing and validating integrated conductometric biosensing systems:
Performance Metrics and Benchmarking
Rigorous performance characterization is essential for evaluating and comparing integrated biosensing systems. Key metrics include:
Analytical Performance:
- Sensitivity: Change in output signal per unit change in analyte concentration, typically reported in μS/mM or derived units.
- Limit of Detection (LOD): Lowest analyte concentration that can be reliably distinguished from background noise, typically calculated as three times the standard deviation of the blank signal.
- Dynamic Range: The concentration range over which the sensor provides a quantifiable response.
- Selectivity: Ability to distinguish target analyte from potential interferents, often expressed as selectivity coefficients.
Operational Characteristics:
- Response Time: Time required to reach a defined percentage (typically 90% or 95%) of the final steady-state response after analyte exposure.
- Stability: Operational lifetime and signal drift characteristics under continuous operation.
- Reproducibility: Consistency between different sensor batches or fabrication runs.
For wearable sweat sensors, performance validation against established analytical techniques like liquid chromatography-tandem mass spectrometry (LC-MS/MS) or enzyme-linked immunosorbent assay (ELISA) is essential to establish clinical correlation [59].
Future Directions and Research Opportunities
The field of integrated wearable and implantable biosensors continues to evolve rapidly, with several promising research directions emerging:
Advanced Materials Development: Next-generation systems will leverage novel nanomaterials with enhanced electrical and mechanical properties. Graphene derivatives, MXenes, and other two-dimensional materials offer exceptional electrical conductivity and large surface areas ideal for conductometric sensing [59]. Self-healing materials represent another frontier, potentially extending device lifetime by autonomously repairing mechanical damage.
Closed-Loop Therapeutic Systems: Integration of sensing and actuation capabilities will enable autonomous closed-loop systems that not only monitor biomarkers but also deliver therapies in response. Examples include glucose sensors integrated with insulin pumps for diabetes management and neural activity monitors coupled with stimulation for neurological disorders [62] [58].
AI-Enhanced Biosensing: Artificial intelligence and machine learning are transforming biosensor data processing, enabling predictive analytics, personalized calibration, and enhanced accuracy through pattern recognition [61]. The convergence of LoC platforms with Internet of Things (IoT) technologies and AI algorithms is paving the way for smart biosensing systems that can interpret and respond to physiological changes dynamically [57].
Energy Harvesting Solutions: Addressing the power challenge in long-term implants, research focuses on innovative energy harvesting approaches including biofuel cells that generate electricity from physiological glucose, triboelectric nanogenerators that harvest mechanical energy from body movements, and wireless power transfer technologies [60] [57].
The following diagram illustrates the system architecture and signal pathway for an integrated conductometric biosensing platform:
The integration of wearable patches, implantable sensors, and lab-on-a-chip technologies represents a paradigm shift in conductometric biosensing research. These platforms enable continuous, real-time monitoring of biochemical parameters with unprecedented temporal resolution and convenience. For researchers and drug development professionals, understanding the principles, fabrication methodologies, and implementation considerations of these systems is essential for advancing personalized medicine and decentralized healthcare.
While significant progress has been made in materials science, sensor design, and system integration, challenges remain in achieving long-term stability, ensuring reliable performance in diverse physiological conditions, and navigating regulatory pathways. Future advancements will likely focus on enhancing biocompatibility, developing more robust calibration approaches, and creating truly autonomous systems capable of closed-loop monitoring and intervention.
As these technologies continue to mature, they hold the potential to transform healthcare from episodic and reactive to continuous and proactive, ultimately improving patient outcomes and reducing healthcare costs. The convergence of conductometric biosensing with artificial intelligence, advanced materials, and wireless technologies will undoubtedly yield even more sophisticated and capable systems in the coming years.
Overcoming Practical Challenges: Strategies for Enhanced Sensitivity and Stability
Addressing Non-Specific Binding and Matrix Effects in Complex Samples
Biosensors are analytical devices that integrate a biological recognition element (bioreceptor) with a physicochemical transducer to detect a specific analyte [11]. The core components of any biosensor include the bioreceptor (e.g., enzyme, antibody, aptamer), which specifically binds the target; the transducer (optical, electrochemical, mechanical) that converts the biological interaction into a measurable signal; and the electronic system that processes and displays the results [11]. Conductometric biosensors represent a specific class of electrochemical biosensors that measure the change in electrical conductivity of a solution resulting from enzymatic or affinity reactions [4] [63].
A paramount challenge confounding biosensor technology, particularly when transitioning from controlled laboratory settings to real-world applications, is maintaining performance in complex biological samples. Two interrelated phenomena are primarily responsible for this challenge:
- Non-specific binding (NSB): The adsorption of non-target molecules (foulants) from the sample matrix onto the biosensing interface [64].
- Matrix effects: The interference caused by the sample matrix itself, which can alter the sensor's response due to variations in pH, ionic strength, temperature, or autofluorescence, independent of the target analyte's concentration [65].
These issues are especially acute for conductometric biosensors, where the signal is based on ionic species movement. Variations in the sample's ionic composition can severely distort the analytical readout [63]. Furthermore, NSB can foul the transducer surface, limiting analyte access to the bioreceptor, degrading signal stability, and ultimately compromising the sensor's selectivity, sensitivity, and accuracy [66] [64]. Overcoming these hurdles is a critical research focus for enabling the use of conductometric and other biosensors in clinical diagnostics, environmental monitoring, and food safety.
Mechanisms of Interference and Their Impact on Biosensor Performance
Fundamental Mechanisms of Non-Specific Binding
NSB occurs through physicochemical interactions between the biosensor surface and the myriad of proteins, lipids, and other molecules present in complex samples like serum, urine, or sputum [64]. The primary forces driving NSB include:
- Electrostatic Interactions: Attractive forces between charged functional groups on the sensor surface and oppositely charged molecules in the sample.
- Hydrophobic Interactions: The association of non-polar regions on the sensor surface with hydrophobic domains of proteins or lipids to minimize contact with the aqueous environment.
- Hydrogen Bonding: Dipole-dipole interactions between hydrogen bond donors and acceptors on the surface and sample constituents.
- van der Waals Forces: Weak, short-range forces arising from induced electrical interactions between adjacent atoms or molecules [66] [64].
The impact of these interactions is magnified in samples such as blood serum, which contains a high concentration of proteins like albumin that are notorious for nonspecific adsorption [66].
Consequences of Matrix Effects
Matrix effects introduce error through distinct pathways, particularly affecting transducers that rely on charge or optical properties:
- Debye Screening: In electrochemical and conductometric sensors, the ions in a high-strength buffer (like physiological saline) can form a shielding layer around charged analytes or the sensor surface. This screen severely dampens the electrical signal, making detection of the target analyte difficult without extensive sample dilution or desalting [65].
- Optical Interference: In fluorescent or colorimetric detection, the autofluorescence or inherent color of a complex sample can generate a high background signal, obscuring the specific signal from the target binding event [65].
- pH and Temperature Fluctuations: Changes in pH can alter the charge state of both the bioreceptor and the analyte, affecting their binding affinity. Temperature variations can cause signal drift in mechanically sensitive transducers like microcantilevers [65].
The following diagram illustrates how these mechanisms impact different types of biosensors.
Experimental Strategies and Methodologies
A multi-pronged experimental approach is essential to mitigate NSB and matrix effects. The following workflow outlines a systematic strategy for developing robust biosensors for complex samples.
Reference Control Strategies for Signal Correction
A cornerstone technique for addressing NSB, particularly in label-free biosensors like SPR or photonic microring resonators, is the use of a reference (negative control) channel. The signal from this control channel is subtracted from the active sensing channel to isolate the specific binding signal [66]. However, the choice of reference probe is critical and must be optimized on a case-by-case basis.
A systematic, FDA-inspired framework for selecting the optimal reference control was recently reported [66]. The study evaluated a panel of potential reference probes paired with capture antibodies for interleukin-17A (IL-17A) and C-reactive protein (CRP) on photonic ring resonator sensors. The results demonstrated that while isotype-matching to the capture antibody is a common tactic, it does not always yield the best performance.
Table 1: Evaluation of Reference Control Probes for Two Different Analytes [66]
| Analyte | Candidate Reference Control Probe | Performance Score | Key Finding |
|---|---|---|---|
| IL-17A | Bovine Serum Albumin (BSA) | 83% | Best performing reference for IL-17A |
| Mouse IgG1 Isotype Control | 75% | Close second | |
| CRP | Rat IgG1 Isotype Control | 95% | Best performing reference for CRP |
| Anti-FITC | 89% | Second highest score |
This research underscores that the optimal reference control is highly dependent on the specific assay and analyte, and a systematic evaluation is necessary to avoid over- or under-correction of the real binding response [66].
Detailed Experimental Protocol: Optimization of a Conductometric Biosensor
The development and optimization of a conductometric monoenzyme biosensor for L-arginine in dietary supplements provides a clear, transferable protocol for mitigating matrix effects [63]. The key steps involve meticulous optimization of the working buffer and immobilization conditions to maximize sensitivity and minimize interference.
Table 2: Key Optimization Parameters for a Conductometric L-Arginine Biosensor [63]
| Parameter | Optimization Goal | Established Optimal Condition | Impact on Performance |
|---|---|---|---|
| Buffer pH | Maximize enzymatic activity & signal | pH 6.2 | Ensures peak enzyme (arginine deiminase) efficiency |
| Buffer Capacity | Stabilize pH during reaction | 5 mM Phosphate Buffer | Prevents local pH shifts that distort conductometric signal |
| Ionic Strength | Minimize background conductivity | 5 mM Phosphate Buffer | Reduces competing ionic signals, enhancing signal-to-noise |
| Temperature | Accelerate reaction rate | 39.5 °C | Increases sensor response speed without denaturing enzyme |
| Enzyme Load | Balance sensitivity and stability | Determined empirically | Optimizes the number of active biorecognition sites |
Protocol Workflow:
- Bioreceptor Immobilization: The recombinant arginine deiminase (ADI) enzyme is immobilized on the interdigitated electrodes of the conductometric transducer via cross-linking with glutaraldehyde. The concentration of the enzyme solution and the immobilization time must be optimized to create a stable and active enzyme layer [63].
- Buffer System Optimization: The biosensor's response is tested in a range of buffer solutions varying in pH, ionic strength, and buffer capacity. The signal response to a standard arginine solution is measured to identify the condition that yields the highest sensitivity and lowest background. The optimal buffer reported was a 5 mM phosphate buffer at pH 6.2 [63].
- Analytical Characterization: Under optimized buffer conditions, the biosensor's performance is characterized:
- Linear Range: 2.5 - 750 µM of L-arginine.
- Limit of Detection (LOD): 2 µM.
- Response Time: 1 - 1.5 minutes [63].
- Validation with Real Samples: The concentration of arginine in dietary supplement samples is determined using the standard addition method to account for matrix effects. The results are validated against a reference method, such as ion-exchange chromatography, to ensure accuracy [63].
The Scientist's Toolkit: Research Reagent Solutions
Successful implementation of the aforementioned strategies requires a set of key reagents and materials. The following table details essential components for developing biosensors resistant to NSB and matrix effects.
Table 3: Essential Reagents for Mitigating NSB and Matrix Effects
| Reagent / Material | Function | Example Applications |
|---|---|---|
| Antifouling Polymers (PEG, Zwitterions) | Forms a hydrophilic, neutral brush layer that repels proteins via steric repulsion and hydration [64]. | Coating for electrochemical and SPR sensors to reduce NSB from serum [64]. |
| Blocking Proteins (BSA, Casein) | Saturates unused binding sites on the sensor surface to prevent non-specific adsorption of proteins [66] [67]. | Standard blocking agent in immunosensors and paper-based biosensors [66] [67]. |
| Isotype Control Antibodies | Serves as a matched reference probe that accounts for non-specific interactions of the antibody Fc region [66]. | Reference channel in label-free immunosensors for specific signal correction [66]. |
| Surfactants (Tween-20) | Reduces hydrophobic and electrostatic interactions between proteins and the sensor surface [64]. | Additive in washing and running buffers (e.g., PBS-T) for immunoassays [66]. |
| Cross-linkers (Glutaraldehyde) | Covalently immobilizes bioreceptors (enzymes, antibodies) onto transducer surfaces, creating a stable sensing layer [63]. | Enzyme immobilization for conductometric and other biosensors [63]. |
| Magnetic Nanoparticles | Magnetic tags for detection that are immune to optical interference and Debye screening, enabling matrix-insensitive sensing [65]. | Tags in sandwich assays for direct detection in serum, urine, and saliva using GMR sensors [65]. |
Advanced and Emerging Solutions
Innovative Sensing Platforms
Beyond surface chemistry and protocol optimization, several advanced sensing platforms inherently resist matrix effects:
- Magnetic Nanosensing (GMR Sensors): This technology uses giant magnetoresistive (GMR) sensors to detect the binding of magnetic nanoparticle tags to a captured analyte. Since biological matrices have no detectable magnetic background, the platform is virtually matrix-insensitive. It has demonstrated attomolar sensitivity and a wide linear dynamic range across diverse media, including serum, urine, saliva, and cell lysates, without requiring sample desalting [65].
- Coupled Electrochemical-Surface Plasmon Resonance (EC-SPR): Combining these two transduction methods provides complementary data, allowing researchers to distinguish between specific binding and non-specific adsorption in real-time. This is invaluable for evaluating the efficacy of new antifouling coatings and understanding interfacial events [64].
- Paper Microfluidics: Paper-based biosensors can mitigate matrix effects by filtering out particulates and sequestering interfering molecules within the fiber network. A paper biosensor for detecting pyocyanin in sputum incorporated a mild enzymatic liquefaction step, which reduced sample viscosity and heterogeneity without harsh chemicals, enabling rapid analysis at the bedside [67].
Future Directions
The field is moving toward more intelligent and integrated solutions. Future strategies include:
- High-Throughput Screening of new antifouling material libraries.
- Machine Learning-Assisted Evaluation of NSA and coating performance, enabling predictive design of robust surfaces [64].
- Development of Universal Functionalization Strategies that combine high bioreceptor density with superior antifouling properties, particularly for multi-modal platforms like EC-SPR biosensors [64].
Addressing non-specific binding and matrix effects is a non-negotiable prerequisite for the successful translation of conductometric and other biosensors from research laboratories into practical applications. A systematic approach is required, combining surface engineering with antifouling coatings, rigorous experimental optimization of assay conditions, and strategic signal correction using validated reference controls. As research in advanced materials and multi-modal sensing platforms progresses, the next generation of biosensors will become increasingly robust, reliable, and capable of functioning accurately in the most complex biological samples.
Improving Sensor Stability and Reproducibility through Advanced Immobilization Techniques
In conductometric biosensor research, the stability and reproducibility of the device are paramount for reliable analytical performance. These biosensors, which measure changes in electrical conductivity resulting from biological recognition events, are particularly susceptible to signal drift and performance degradation when biorecognition elements are inadequately immobilized. Stability in biosensors refers to the ability to maintain signal output over time and is critically influenced by the immobilization technique employed [68]. The fundamental challenge lies in securely anchoring biological recognition elements (such as enzymes, antibodies, or nucleic acids) to the transducer surface while preserving their biological activity and orientation.
Recent advancements in nanomaterials and three-dimensional (3D) immobilization scaffolds have demonstrated significant potential for enhancing biosensor performance. The integration of 3D structured materials expands the available binding surface area for biorecognition probes and optimizes signal transduction mechanisms, directly addressing limitations in traditional two-dimensional approaches [24]. For conductometric biosensors specifically, the choice of immobilization matrix directly impacts electron transfer efficiency, signal-to-noise ratio, and operational lifetime—factors that ultimately determine the viability of these devices for point-of-care diagnostics and environmental monitoring applications.
Fundamental Principles of Biorecognition Element Immobilization
Bioreceptor-Transducer Interface Dynamics
The immobilization of biorecognition elements constitutes a critical juncture in biosensor construction, forming the interface where biological recognition is transduced into a measurable electrical signal. In conductometric biosensors, this interface must facilitate both efficient biological binding and charge transfer. The immobilization matrix serves multiple simultaneous functions: it must provide stable anchoring for biological elements, maintain their conformational integrity and activity, permit adequate analyte diffusion, and enable efficient conduction of electrical signals [69].
The stability of a biosensor is profoundly affected by the immobilization technique employed. According to recent bibliometric analyses of research trends, keywords such as "reduced graphene oxide," "direct electron transfer," and "chemically modified electrode" form dominant clusters in stability-focused research, highlighting the interconnected nature of material selection and immobilization strategies [68]. Optimal immobilization approaches must address several competing demands: providing strong attachment without denaturing sensitive biological components, offering sufficient accessibility for target analytes while minimizing non-specific binding, and creating a stable chemical environment that preserves biological activity throughout the sensor's operational lifespan.
Impact of Immobilization on Sensor Performance Metrics
The method employed for immobilizing biorecognition elements directly influences key biosensor performance parameters, including sensitivity, selectivity, response time, and—most critically for this discussion—stability and reproducibility. Stability in biosensors can be categorized into three distinct aspects: shelf stability (retention of activity during storage), operational stability (retention of activity during use), and reproducibility (consistency between different sensor batches or units) [68].
A conductometric biosensor platform developed for point-of-care use demonstrated how optimized immobilization can achieve coefficient of variation (CV) values below 10% for reproducibility, meeting stringent Clinical and Laboratory Standards Institute (CLSI) guidelines [70]. The researchers accomplished this through carefully calibrated semiconductor manufacturing technology (SMT) production settings for electrodes combined with a streptavidin biomediator featuring a specialized glycine-tryptophan (GW) linker to optimize bioreceptor orientation. This approach highlights how immobilization technique innovations can directly address reproducibility challenges in biosensor manufacturing.
Advanced Materials for Enhanced Immobilization Matrices
Nanomaterial-Enhanced Surfaces
The integration of nanomaterials into immobilization matrices has revolutionized the stability and sensitivity of conductometric biosensors. These materials provide high surface-to-volume ratios, favorable electrical properties, and versatile functionalization chemistry that collectively enhance bioreceptor loading and stability.
Table 1: Nanomaterials for Advanced Immobilization in Conductometric Biosensors
| Material Class | Specific Examples | Key Properties | Impact on Stability |
|---|---|---|---|
| Carbon Nanomaterials | Reduced graphene oxide, Carbon nanotubes | High electrical conductivity, Large surface area, π-π stacking interactions | Improves electron transfer efficiency, Increases bioreceptor loading capacity [71] [68] |
| Metallic Nanoparticles | Gold nanoparticles, Silver nanoparticles, Platinum nanoparticles | High conductivity, Surface plasmon resonance, Easy functionalization | Enhances signal transduction, Enables stable thiol-based immobilization [42] [71] |
| Conductive Polymers | Polyaniline, Polypyrrole, Polythiophene | Tunable conductivity, Redox activity, Mechanical flexibility | Provides 3D porous matrix, Protects biological element activity [72] [73] |
| Framework Materials | Metal-organic frameworks (MOFs), Covalent organic frameworks (COFs) | Ultrahigh porosity, Crystalline structure, Designable functionality | Creates organized immobilization environments, Enhances storage stability [24] |
Three-Dimensional Immobilization Architectures
The transition from two-dimensional to three-dimensional immobilization scaffolds represents a paradigm shift in conductometric biosensor design. 3D structures provide significantly increased surface area for bioreceptor attachment while creating a more biomimetic environment that helps maintain biological activity. Research on electrochemical biosensors for influenza virus detection has demonstrated that 3D surfaces provide more binding sites than traditional two-dimensional surface coatings, directly enhancing sensitivity and specificity [24].
Several strategic approaches have emerged for creating effective 3D immobilization matrices:
- Porous hydrogel matrices provide high water content and tunable mechanical properties that closely mimic biological environments, preserving the native conformation and activity of immobilized bioreceptors.
- Layer-by-layer assemblies enable precise control over immobilization density and orientation through alternating deposition of complementary polymers or nanomaterials.
- Electrodeposited nanostructures allow direct growth of conductive materials on electrode surfaces, creating highly porous 3D networks ideal for conductometric transduction.
- Composite matrices combine multiple material classes to leverage synergistic benefits, such as graphene-polymer hybrids that offer both high conductivity and enhanced biocompatibility.
These 3D architectures not only increase bioreceptor loading capacity but also create protected microenvironments that shield biological elements from denaturing conditions, thereby significantly extending operational stability.
Experimental Protocols for Immobilization Technique Evaluation
Standardized Testing Methodologies
Rigorous evaluation of immobilization technique efficacy requires standardized experimental protocols that quantitatively assess stability and reproducibility parameters. The following methodology outlines a comprehensive approach for evaluating advanced immobilization strategies in conductometric biosensors:
Accelerated Aging Protocol:
- Prepare multiple sensor batches (n ≥ 5) using the immobilization technique under investigation
- Subject sensors to elevated temperature stress (e.g., 37°C) while monitoring signal baseline stability
- Measure response to standard analyte concentrations at predetermined intervals (0, 24, 48, 72, 96 hours)
- Calculate signal decay rate and time to 50% initial activity (half-life)
Operational Stability Assessment:
- Conduct repeated measurements (n ≥ 10) of standard analyte concentration using the same sensor unit
- Perform regeneration between measurements if applicable to the sensor design
- Calculate coefficient of variation (CV) for repeated measurements
- Monitor signal drift during continuous operation over typical usage duration
Batch-to-Batch Reproducibility Evaluation:
- Fabricate multiple sensor batches (n ≥ 3) on different days using identical protocols
- Characterize response to standard analyte concentrations across all batches
- Calculate inter-batch CV for key parameters (sensitivity, response time, baseline signal)
A recent study on potentiometric nitrate sensors demonstrated how systematic long-term regression line analysis can quantify stability performance, with optimized sensors showing minimal, nearly parallel shifts between calibration curves over three months [72].
Immobilization Workflow Visualization
The following diagram illustrates a comprehensive experimental workflow for developing and evaluating advanced immobilization techniques, integrating material synthesis, bioreceptor immobilization, and stability assessment:
Quantitative Analysis of Immobilization Technique Performance
Comparative Performance Metrics
Systematic evaluation of different immobilization approaches reveals significant variations in stability and reproducibility performance. The following table summarizes quantitative data from recent studies investigating advanced immobilization techniques for biosensing applications:
Table 2: Stability and Reproducibility Performance of Advanced Immobilization Techniques
| Immobilization Technique | Bioreceptor Type | Stability Performance | Reproducibility (CV) | Reference Application |
|---|---|---|---|---|
| Electropolymerized Polypyrrole | Antibodies | Minimal signal loss after 30 days dry storage | ±3 mg/L in real samples | Potentiometric nitrate sensor [72] |
| Streptavidin-Biotin with GW Linker | Various | Meets CLSI guidelines for POC use | <10% inter-batch CV | General biosensor platform [70] |
| 3D Graphene Oxide Composite | Oligonucleotides | 94% activity retention after 100 cycles | 5.2% signal variation | Influenza detection [24] |
| Gold Nanoparticle-Polyaniline | Antibodies | Stable signal for 10 minutes operation | Specific to target even with interferents | Foodborne pathogen detection [73] |
| Reduced Graphene Oxide with AuNPs | Enzymes | 80% initial activity after 30 days | <8% response variation | Amperometric biosensor [68] |
Impact of Material Properties on Stability
The performance of immobilization techniques is intrinsically linked to the material properties of the matrix. Analysis of recent research reveals several key correlations:
- Conductivity enhancement directly correlates with signal-to-noise ratio improvements, with nanocomposite materials typically achieving 3-5x enhancement compared to conventional materials.
- Surface area-to-volume ratio influences bioreceptor loading capacity, with 3D nanostructures typically providing 10-100x increased surface area compared to planar surfaces.
- Pore size distribution affects analyte diffusion kinetics, with optimal performance observed when pore size exceeds analyte size by at least 2x while maintaining structural stability.
- Functional group density determines immobilization efficiency, with the highest stability achieved when functional group density exceeds bioreceptor footprint requirements by 3-5x to ensure multipoint attachment.
Recent research on polydopamine-based coatings highlights how materials that emulate natural adhesion properties can provide exceptional biocompatibility and versatility while being prepared through environmentally friendly procedures [42]. These biomimetic approaches represent a promising direction for immobilization techniques that simultaneously optimize both stability and biocompatibility.
Implementation Guidelines and Research Reagent Solutions
Essential Research Reagents for Advanced Immobilization
Successful implementation of advanced immobilization techniques requires carefully selected reagents and materials. The following table catalogues essential research reagent solutions for developing stable conductometric biosensors:
Table 3: Essential Research Reagent Solutions for Advanced Immobilization
| Reagent Category | Specific Examples | Function in Immobilization | Implementation Considerations |
|---|---|---|---|
| Conductive Polymers | Polypyrrole, Polyaniline, PEDOT:PSS | Form 3D immobilization matrices with inherent conductivity | Electropolymerization parameters significantly impact morphology and stability [72] [73] |
| Crosslinking Agents | Glutaraldehyde, EDC/NHS, GMBS | Create covalent bonds between bioreceptors and functionalized surfaces | Concentration and reaction time must be optimized to avoid activity loss [69] [70] |
| Bioaffinity Pairs | Streptavidin-Biotin, Protein A/G-IgG | Provide oriented immobilization with minimal activity loss | Binding kinetics and dissociation constants affect long-term stability [70] |
| Nanomaterial Inks | Graphene oxide, AuNPs, CNTs | Create high-surface-area conductive networks for immobilization | Dispersion stability and deposition method determine final film properties [71] [24] |
| Membrane Substrates | Nitrocellulose, PVDF, Nylon | Provide mechanical support with defined flow characteristics | Pore size, protein binding capacity, and wicking rate affect assay performance [69] |
Optimization Strategies for Maximum Stability
Based on systematic analysis of recent research, the following optimization strategies are recommended for enhancing stability and reproducibility through immobilization techniques:
- Controlled orientation of bioreceptors using affinity-based approaches (e.g., Fc-specific antibody binding) typically provides 2-3x stability improvement compared to random orientation.
- Multipoint attachment strategies using crosslinkers with appropriate spacer arms reduce conformational freedom and denaturation risks, extending operational stability by 40-60%.
- Hierarchical porosity designs that combine macropores for efficient mass transport with mesopores for high surface area demonstrate superior performance in complex matrices.
- Stabilizing additives including sugars, polyols, and polymers in the immobilization matrix can protect biological elements from dehydration and conformational stress.
A critical finding from recent research is that the combination of optimized semiconductor manufacturing technology for electrode production with improved streptavidin biomediator containing a specialized GW linker can produce biosensors that meet stringent Clinical and Laboratory Standards Institute (CLSI) guidelines for point-of-care use [70]. This demonstrates that comprehensive approach addressing both electrode fabrication and biological element immobilization is essential for achieving optimal stability and reproducibility.
Advanced immobilization techniques represent a cornerstone strategy for enhancing the stability and reproducibility of conductometric biosensors. The integration of nanomaterials, three-dimensional architectures, and oriented immobilization approaches has demonstrated significant improvements in sensor longevity and reliability. As research in this field progresses, several emerging trends show particular promise for further advancements: the development of stimulus-responsive immobilization matrices that enable sensor regeneration, the integration of machine learning approaches to optimize immobilization parameters, and the creation of multi-functional composites that combine complementary material properties.
The systematic implementation of the protocols and materials outlined in this technical guide provides a pathway for researchers to develop conductometric biosensors with enhanced performance characteristics. By focusing on the critical interface between biological recognition elements and transducer surfaces, and leveraging the latest advancements in immobilization science, the next generation of biosensors will achieve the reliability standards required for demanding applications in clinical diagnostics, environmental monitoring, and food safety testing.
Conductometric biosensors represent a class of electrochemical biosensors that measure the change in electrical conductivity of a solution resulting from enzymatic or biological reactions [31]. These devices transduce biochemical signals into measurable electrical outputs by monitoring ionic species produced or consumed during biological recognition events [74]. The operational principle relies on applying a low-amplitude alternating voltage between electrodes and measuring the resulting change in solution conductivity, which offers several distinct advantages: they do not require a reference electrode, are insensitive to light, prevent Faraday processes on electrodes, and can be easily miniaturized and integrated using standard thin-film technology [31]. The performance and accuracy of these biosensors are profoundly influenced by external assay conditions, particularly buffer composition, pH, and temperature, which directly impact biological component activity, stability, and overall sensor response.
The fundamental mechanism of conductometric biosensing involves biochemical reactions that alter the ionic composition of the solution between electrodes. For enzyme-based systems, substrate conversion typically produces or consumes ionic species, changing the solution's electrical conductivity proportionally to analyte concentration [75]. This measurement principle makes the signal highly dependent on the chemical environment, as buffer ions directly participate in charge transport. Optimal assay conditions must therefore balance biological activity with electrical measurement fidelity, creating a complex optimization landscape for researchers developing these analytical platforms. This technical guide examines the critical parameters affecting conductometric biosensor performance and provides evidence-based protocols for establishing optimal assay conditions within the broader context of biosensor research fundamentals.
Fundamental Principles of Conductometric Biosensing
Operational Mechanism and Transduction Principles
Conductometric biosensors function by detecting changes in the electrical conductivity of a solution between two electrodes when a specific biological recognition event occurs. The transduction mechanism relies on the production or consumption of ionic species during biochemical reactions, which alters the ionic strength and subsequently the electrical conductivity of the measured solution [31]. When an alternating current voltage is applied across electrodes immersed in the sample solution, the resulting current flow is proportional to the concentration of ions present. As the biological recognition element (typically an enzyme, antibody, or whole cell) interacts with its target analyte, biochemical reactions generate or consume charged species, modifying the solution's overall conductivity [74].
The biological recognition element is immobilized on or near the conductometric transducer, which consists of paired metal electrodes fabricated using thin-film technologies. When substrates specific to the biological element are present, catalytic or binding reactions occur, leading to metabolic conversions that alter ionic composition. For example, enzyme-based conductometric biosensors often utilize hydrolytic reactions where electrically neutral substrates are converted into charged products, or redox reactions that consume or produce ionic species [75]. The measured parameter is the change in conductance (G) between the electrodes, calculated as G = 1/R = I/V, where R is resistance, I is current, and V is the applied AC voltage. This change in conductance correlates directly with analyte concentration, enabling quantitative detection.
Key Advantages and Technical Challenges
Conductometric biosensors offer several compelling advantages that make them attractive for various applications. Their simple electrode design requires no reference electrode, significantly simplifying device fabrication and miniaturization [31] [74]. The use of low-amplitude alternating voltage minimizes electrode polarization and Faraday processes, enhancing measurement stability. These devices demonstrate remarkable sensitivity, with recent developments achieving detection limits as low as 0.1 fM for specific biomarkers [74] [29]. Additionally, conductometric transducers are compatible with microfabrication techniques, enabling mass production of inexpensive, disposable sensors for point-of-care applications [74].
Despite these advantages, conductometric biosensors face specific challenges that necessitate careful optimization of assay conditions. Their inherent sensitivity to ionic strength makes them vulnerable to interference from buffer composition fluctuations and environmental ions [75]. The biological recognition elements exhibit temperature and pH-dependent activity profiles that directly impact sensor response and linear range [76]. Non-specific binding events and matrix effects in complex samples can generate false signals, while enzyme inactivation or receptor degradation during operation affects long-term stability [3]. These limitations highlight the critical importance of systematic optimization of buffer composition, pH, and temperature control to maximize sensor performance, selectivity, and operational lifespan.
Critical Assay Parameters and Their Optimization
The performance of conductometric biosensors is governed by three interdependent assay parameters that collectively determine sensor sensitivity, stability, and accuracy. Understanding and optimizing these parameters is essential for developing robust biosensing systems capable of reliable operation across various applications.
Buffer Composition and Ionic Strength Effects
Buffer composition profoundly influences conductometric biosensor performance through multiple mechanisms. The buffer ions themselves contribute to the baseline conductivity, with different ions exhibiting varying molar conductivities that affect signal-to-noise ratios [75]. Optimal buffer systems must provide sufficient buffering capacity at the biological element's optimal pH while minimizing background conductivity. Research indicates that low-conductivity buffers like histidine or HEPES often outperform high-conductivity phosphate buffers in certain applications, despite phosphate's excellent buffering capacity in the physiological range [75].
Ionic strength represents a particularly critical parameter, as it directly governs electrode double-layer thickness and ion migration rates. High ionic strength compresses the double layer, potentially reducing sensitivity, while very low ionic strength may insufficiently screen surface charges, leading to non-linear responses [75]. Buffer capacity must be sufficient to maintain stable pH throughout the measurement period, especially in enzyme-based systems where reactions may produce or consume protons. Additionally, specific buffer components can act as enzyme stabilizers or inhibitors, while chelating agents may be necessary to remove heavy metal impurities that interfere with biological activity [76].
pH Optimization for Biological Activity
The pH of the assay medium dramatically influences biosensor performance by modulating the activity of biological recognition elements. Enzymes exhibit characteristic bell-shaped activity profiles versus pH, with optima typically between pH 5.0 and 8.0 depending on the specific enzyme and its source [76]. This pH dependence stems from ionization changes in active site residues and substrate molecules that affect binding and catalysis. Extremes of pH can induce irreversible denaturation of biological components, permanently degrading sensor performance.
For conductometric transduction specifically, pH also affects the ionization state of reaction products, potentially converting between charged and unformed species with significantly different contributions to conductivity. This effect means the apparent pH optimum for overall sensor response may differ from the pH optimum of the biological element alone [76]. Optimal pH must therefore be determined empirically for each biosensor configuration, balancing biological activity with transduction efficiency. Recent studies on urinary biomarker detection using conductometric biosensors established optimal performance at physiological pH (7.0-7.4) for clinical applications [74].
Temperature Control and Thermal Effects
Temperature represents a critical parameter through its influence on both biochemical reaction kinetics and physical transport processes. Enzyme-catalyzed reactions typically exhibit Arrhenius-type behavior, with rates increasing exponentially with temperature until a critical point where thermal denaturation causes rapid activity loss [76]. This transition often occurs between 45-60°C for most enzymes, though some biological elements tolerate higher temperatures. The temperature coefficient (Q₁₀) for enzyme-based biosensors typically ranges from 1.5 to 2.5, meaning a 10°C temperature increase approximately doubles the reaction rate.
Beyond biological effects, temperature directly impacts conductivity measurements through its influence on ion mobility, with conductivity typically increasing 1-3% per °C [76]. This intrinsic temperature dependence necessitates precise thermal control during measurements or incorporation of temperature compensation algorithms. Optimal operating temperatures must balance several competing factors: higher temperatures accelerate response times but may compromise biological element stability and increase baseline conductivity, while lower temperatures enhance stability but slow response. Most conductometric biosensors operate between 25-37°C, with clinical applications favoring physiological temperature [74] [76].
Table 1: Optimal Assay Conditions for Different Conductometric Biosensor Applications
| Application Domain | Optimal pH Range | Optimal Temperature Range | Recommended Buffer System | Key Considerations |
|---|---|---|---|---|
| Clinical Diagnostics (Urinary Biomarkers) [74] | 7.0 - 7.4 | 25 - 37°C | Phosphate Buffered Saline | Maintain physiological compatibility; minimal sample pretreatment |
| Carbohydrate Detection (Maltose, Lactose, Glucose) [75] | 6.5 - 7.5 | 25 - 30°C | Low-conductivity organic buffers (HEPES, Histidine) | Minimize background conductivity; buffer capacity for proton-consuming reactions |
| Environmental Monitoring (Pesticides, Toxins) [77] | 7.0 - 8.0 | 20 - 25°C | Phosphate or Tris buffers | Stability for field deployment; interference rejection from environmental ions |
| Biomedical Research (Dopamine Detection) [76] | 6.8 - 7.2 | 30 - 37°C | Phosphate buffer with antioxidant additives | Prevent analyte oxidation; maintain enzyme (PPO) stability |
Table 2: Effects of Buffer Composition on Conductometric Biosensor Performance [75] [76]
| Buffer Component | Conductivity Contribution | Optimal pH Range | Advantages | Limitations |
|---|---|---|---|---|
| Phosphate | High | 6.0 - 8.0 | Excellent buffering capacity; physiological relevance | High background conductivity; precipitation with divalent cations |
| HEPES | Moderate | 6.8 - 8.2 | Low conductivity; cell culture compatibility | Cost; potential radical formation under light |
| Histidine | Low | 5.5 - 7.0 | Very low background conductivity; metal chelation | Narrow buffering range; limited solubility |
| Tris | Moderate | 7.0 - 9.0 | Wide availability; effective in alkaline range | Temperature-dependent pKa; interference with some enzymes |
Experimental Protocols for Parameter Optimization
Systematic optimization of assay conditions follows a structured experimental approach that isolates individual parameters while monitoring key performance metrics. The following protocols provide detailed methodologies for establishing optimal conditions for conductometric biosensor operation.
Buffer Composition and Ionic Strength Optimization Protocol
This protocol establishes the optimal buffer composition and ionic strength for conductometric biosensor operation, maximizing signal-to-noise ratio while maintaining biological activity.
Materials Required:
- Conductometric biosensor with immobilized biological element
- Potentiostat or custom conductometric measurement system
- Target analyte at known concentrations
- Buffer components of interest (phosphate, HEPES, Tris, histidine, etc.)
- Inert salt for ionic strength adjustment (KCl, NaCl)
- pH meter with temperature compensation
- Thermostatic control system
Procedure:
- Prepare a series of buffer solutions at identical pH but varying composition, covering a range of expected optimal conditions based on the biological element's known characteristics.
- Adjust all buffers to the same ionic strength using an inert salt like KCl to isolate composition effects from ionic strength effects.
- Immerse the conductometric biosensor in each buffer solution and allow temperature equilibration (typically 5-10 minutes).
- Measure and record the baseline conductivity for each buffer system.
- Introduce a standardized concentration of target analyte and record the conductivity change over time until stabilization.
- Calculate the response magnitude (ΔG) and signal-to-noise ratio (SNR) for each buffer system.
- Repeat steps 3-6 with varying ionic strength (10-200 mM) using the optimal buffer composition identified in previous steps.
- Plot response magnitude and SNR against ionic strength to identify the optimal range.
Data Analysis: The optimal buffer composition demonstrates high response magnitude, minimal baseline drift, and maximal SNR. Typically, low-conductivity buffers like histidine or HEPES outperform high-conductivity phosphate buffers despite the latter's superior buffering capacity in the physiological range [75]. Optimal ionic strength generally falls between 20-100 mM, balancing sufficient ionic screening against excessive background conductivity.
pH Profile Determination Protocol
This protocol characterizes the pH dependence of biosensor response, identifying the optimal pH for maximum sensitivity and defining the operational pH range.
Materials Required:
- Conductometric biosensor with immobilized biological element
- Potentiostat or custom conductometric measurement system
- Target analyte at known concentrations
- Universal buffer system or series of overlapping buffers covering pH 4.0-9.0
- pH meter with temperature compensation
- Thermostatic control system
Procedure:
- Prepare buffer solutions spanning the expected pH range (typically 4.0-9.0 in 0.5 pH unit increments).
- Adjust all buffers to identical ionic strength using an inert salt.
- Immerse the biosensor in the first buffer solution and allow temperature and pH equilibration (5-10 minutes).
- Measure baseline conductivity.
- Introduce a standardized analyte concentration and record the conductivity change until stabilization.
- Rinse the biosensor thoroughly with the next buffer solution to prevent carry-over.
- Repeat steps 3-6 for all pH values in the test series.
- Normalize responses to the maximum value observed to generate a pH activity profile.
Data Analysis: The pH profile typically displays a bell-shaped curve reflecting the ionization states of critical residues in the biological recognition element [76]. The pH optimum is identified as the point of maximum response, while the operational range spans pH values where response exceeds 80% of maximum. For continuous monitoring applications, select a pH with relatively flat response (broad optimum) to minimize sensitivity to minor pH fluctuations.
Temperature Optimization and Characterization Protocol
This protocol determines the temperature dependence of biosensor response, identifying the optimal operating temperature and characterizing thermal effects on sensor stability.
Materials Required:
- Conductometric biosensor with immobilized biological element
- Potentiostat or custom conductometric measurement system
- Target analyte at known concentrations
- Optimal buffer system identified from previous protocols
- Precision thermostatic control system (±0.1°C)
- Temperature sensor for verification
Procedure:
- Prepare the optimal buffer solution and equilibrate to the lowest test temperature.
- Immerse the biosensor and allow temperature equilibration (5-10 minutes).
- Measure baseline conductivity.
- Introduce a standardized analyte concentration and record the conductivity change until stabilization.
- Increase temperature by 2-5°C increments and repeat steps 2-4 until evidence of thermal denaturation appears (typically 45-60°C).
- For stability assessment, maintain the biosensor at elevated temperatures for extended periods while periodically measuring response to a standard analyte concentration.
- Calculate the temperature coefficient (Q₁₀) from the Arrhenius plot of log(response) versus 1/T.
Data Analysis: The optimal operating temperature balances rapid response with acceptable stability loss [76]. For most applications, temperatures between 25-37°C provide the best compromise. The temperature coefficient (Q₁₀) typically falls between 1.5-2.5 for enzyme-based systems. If the intrinsic temperature dependence of conductivity interferes with measurements, develop a temperature compensation algorithm based on the characterized temperature response.
The Scientist's Toolkit: Essential Research Reagents and Materials
Successful development and optimization of conductometric biosensors requires careful selection of reagents and materials that maintain biological activity while enabling precise electrical measurements. The following table details essential components for conductometric biosensor research.
Table 3: Essential Research Reagents and Materials for Conductometric Biosensor Development
| Category/Item | Specification | Function/Purpose | Technical Considerations |
|---|---|---|---|
| Biological Elements | |||
| Enzymes (Oxidases, Dehydrogenases) | High purity, specific activity >100 U/mg | Biological recognition; target-specific catalysis | Select enzymes producing/consuming ionic species; check pH/temperature stability |
| Antibodies/Aptamers | High affinity (KD < 10⁻⁹ M), minimal cross-reactivity | Specific molecular recognition for non-catalytic sensors | Orientation-controlled immobilization preserves binding capacity |
| Whole Cells/Tissues | Defined metabolic activity, genetic stability | Complex pathway integration; environmental sensing | Membrane integrity critical; longer lifetime but slower response |
| Buffer Components | |||
| HEPES | ≥99.5% purity, low heavy metal content | Low-conductivity buffering at physiological pH | Avoid photo-induced radical formation; suitable for most enzyme systems |
| Phosphate Salts | Analytical grade, anhydrous | Physiological buffering; excellent capacity | High background conductivity; precipitate with divalent cations |
| Tris Buffer | Molecular biology grade | Effective alkaline buffering | Significant temperature-dependent pKa shift (ΔpKa ≈ -0.03/°C) |
| Immobilization Materials | |||
| Glutaraldehyde | 25% aqueous solution, electron microscopy grade | Crosslinking agent for enzyme stabilization | Optimize concentration (typically 0.1-2.0%) to balance activity and stability |
| BSA | Fraction V, protease-free | Carrier protein to stabilize immobilized enzymes | Inert matrix component; may increase non-specific binding |
| Nafion | Perfluorinated ionomer solution | Permselective membrane to exclude interferents | Cation-exchanger properties may affect ionic measurements |
| Electrode Materials | |||
| Gold Electrodes | ≥99.99% purity, patterned thin films | High conductivity; facile surface modification | Require cleaning (piranha solution) and characterization (CV) |
| ITO Coated Glass | Surface resistivity 5-15 Ω/sq | Transparent conductor for optical monitoring | Fragile; limited temperature stability |
| Measurement Accessories | |||
| Potentiostat/Galvanostat | Frequency range: 10 Hz-1 MHz, current resolution: <1 pA | Precise AC signal application and current measurement | Must support low-amplitude AC measurements with phase detection |
| Thermostatic Chamber | Stability: ±0.1°C, Range: 4-80°C | Temperature control during characterization and operation | Uniform heating/cooling prevents thermal gradients across electrode |
| Microfluidic Flow Cells | PDMS, PMMA, or glass constructs | Controlled sample delivery; minimal dead volume | Material compatibility with biological elements and detection chemistry |
Advanced Considerations and Future Directions
As conductometric biosensor technology evolves, several emerging trends and advanced considerations are shaping optimization strategies. The integration of nanomaterials—particularly zero-dimensional quantum dots, one-dimensional nanowires, and two-dimensional graphene—has dramatically enhanced sensitivity through increased surface area and novel charge transfer mechanisms [48] [29]. These nanomaterials can facilitate direct electron transfer in third-generation biosensor designs while providing versatile platforms for biological element immobilization.
Machine learning approaches are increasingly applied to multivariable optimization problems, efficiently navigating complex parameter spaces that challenge traditional one-variable-at-a-time methodologies [3]. Artificial intelligence algorithms can model non-linear interactions between buffer composition, pH, and temperature, predicting optimal conditions while reducing experimental workload. Additionally, multi-analyte detection systems require sophisticated optimization strategies that balance competing requirements for different biological elements within a single device [75].
Future developments focus on creating increasingly robust biosensing systems capable of reliable operation in complex real-world environments. This includes designs with built-in temperature and pH compensation, regenerative biological elements for extended operational lifetime, and integrated reference sensors for drift correction [3]. The successful translation of conductometric biosensors from laboratory demonstrations to commercial products hinges on these advanced optimization strategies that ensure reliability across diverse application scenarios from clinical diagnostics to environmental monitoring.
Mitigating Signal Drift and Ensuring Long-Term Operational Stability
Signal drift, the gradual deviation of a biosensor's baseline or sensitivity from its initial calibrated state, presents a fundamental challenge in the development of reliable conductometric biosensors. These devices, which transduce biochemical reactions into measurable changes in electrical conductivity, are prized for their advantages: they do not require a reference electrode, operate at low-amplitude alternating voltage to prevent Faraday processes, are insensitive to light, and can be easily miniaturized and integrated using standard thin-film technology [31]. However, their long-term operational stability is often compromised by signal drift, which can arise from a complex interplay of physical, chemical, and biological factors. For researchers and drug development professionals, understanding and mitigating this drift is not merely an engineering refinement but a critical prerequisite for the deployment of these sensors in continuous monitoring applications, closed-loop therapeutic systems, and dependable point-of-care diagnostics. This guide synthesizes the fundamental principles of drift mechanisms and presents the latest, experimentally-validated strategies to ensure sensor reliability, with a specific focus on the unique considerations of conductometric transduction systems.
Fundamental Mechanisms of Signal Drift
Signal drift in biosensors is not a singular phenomenon but rather the culmination of multiple, often simultaneous, degradation pathways. A comprehensive understanding of these core mechanisms is the first step toward developing effective mitigation strategies.
Biofouling: This refers to the non-specific adsorption of proteins, cells, or other biological components onto the sensor's active surface. In conductometric sensors, this fouling layer can insulate the electrodes, alter the local ionic environment, and impede the diffusion of the target analyte to the biorecognition element. Recent research has pinpointed that in electrochemical aptamer-based sensors placed in whole blood, the drift is predominantly caused by blood proteins with a molecular weight greater than 100 kDa, rather than blood cells [78]. This fouling leads to a progressive loss of signal intensity over time.
Biorecognition Element Degradation: The stability of the biological component (e.g., enzyme, antibody, DNA aptamer) is paramount. These molecules can denature, decompose, or leach from the sensor surface. Enzymes may lose activity under operational temperatures or due to reactive chemical species. Nucleic acid-based elements, such as aptamers, are susceptible to nuclease-mediated degradation in biological fluids, leading to a reduction in the number of available binding sites and a consequent decay in sensor response [79] [78].
Material Instabilities: The physical components of the biosensor itself are not inert. In flexible or stretchable sensors—highly desirable for conformal on-skin or implantable use—mechanical stressors like bending, compression, and stretching can induce microcracks in conductive materials or alter the electrical properties of organic semiconductors, causing significant signal artefacts [80]. Furthermore, bias stress instability in transistor-based sensors is a well-documented source of threshold voltage shift, which manifests as drift [80].
Environmental Fluctuations: Variations in temperature and pH can profoundly affect the sensor's output. Temperature changes influence the kinetics of biochemical reactions, the conductivity of the solution, and the properties of sensor materials. Even minor fluctuations within a physiologically relevant range (e.g., 25°C to 40°C) can introduce substantial drift if not compensated for [80].
The table below summarizes these primary drift mechanisms and their direct impact on sensor signal.
Table 1: Core Mechanisms of Signal Drift in Conductometric Biosensors
| Drift Mechanism | Primary Cause | Effect on Sensor Signal |
|---|---|---|
| Biofouling | Non-specific adsorption of proteins/cells [78] | Insulates electrodes, reduces signal amplitude, increases impedance |
| Biorecognition Degradation | Denaturation, leaching, or enzymatic degradation [79] [78] | Reduces sensitivity and selectivity over time |
| Material Instability | Mechanical stress (stretching, bending), bias voltage stress [80] | Creates artefacts, shifts baseline, alters transducer properties |
| Environmental Variation | Changes in temperature or pH [80] | Alters reaction kinetics and background conductivity, causing baseline drift |
Experimentally-Validated Mitigation Strategies
Addressing signal drift requires a multi-faceted approach that combines novel sensor designs, advanced materials, and strategic signal processing. The following strategies represent the current state-of-the-art, supported by robust experimental evidence.
Differential Sensing and Signal Subtraction
A powerful method to reject common-mode noise and drift is the use of a reference channel. A prominent example is the skin-like, drift-free biosensor platform based on stretchable diode-connected organic field-effect transistors (OFETs) [80]. This design employs capacitive coupling and the subtraction of interference signals using two extended gates: one functionalized with the target bioreceptor (e.g., cortisol aptamer) and an identical one functionalized with a reference (non-target-specific) bioreceptor. Both gates experience the same environmental and material-based interferents (e.g., strain, temperature, bias stress). By electronically subtracting the reference signal from the target signal, the platform can isolate the specific analyte response. This method has been shown to reduce signal distortion by up to two orders of magnitude compared to a single, unconnected OFET, even under 100% uniaxial strain, 50 mN compression, and temperature variations from 25°C to 40°C [80].
Advanced Materials and Surface Engineering
The interface between the sensor and the biological environment is a critical battlefield for drift mitigation.
- Anti-Biofouling Coatings: The application of molecular-weight-selective hydrogels or polymer films has proven highly effective. These coatings act as physical barriers, blocking large fouling agents (like the >100 kDa proteins identified as primary culprits [78]) while allowing smaller target analytes to pass through. Polyacrylamide hydrogels, for example, have been successfully used to protect implantable aptamer-based sensors, significantly extending their functional lifetime by minimizing non-specific adsorption [80].
- Stable Bioreceptor Immobilization: Enhancing the attachment of bioreceptors to the transducer surface prevents leaching and preserves function. This can be achieved through robust covalent chemistry or by using multi-point attachment strategies that stabilize the 3D structure of proteins or nucleic acids. For nucleic acid-based sensors, refining thiol-based monolayer chemistries on electrode surfaces is a key area of development for improving long-term stability [79].
- Intrinsically Stretchable Materials: To combat drift induced by mechanical deformation, researchers are developing new intrinsically soft electronic materials. These include topological supramolecular networks and fluorinated elastomers that maintain their electrical properties even when stretched, suppressing strain-induced artefacts at the source [80].
Drift Compensation via Molecular Design and Fluidics
- Aptamer Engineering: For affinity-based sensors, the stability of the molecular recognition element itself can be engineered. Selecting aptamers with high chemical stability or modifying their backbone (e.g., using 2'-O-methyl or LNA nucleotides) can dramatically increase their resistance to nuclease degradation in complex biofluids [81].
- Precision Microfluidics: In laboratory settings and potentially in wearable systems, precise control over the fluidic environment is crucial. Automated microfluidic syringe pumps, such as the LSPone system, enable stable delivery of samples and buffers, minimizing flow-rate-induced fluctuations and enabling consistent sensor conditioning. This precise fluid management is instrumental in isolating and studying signal decay mechanisms over multi-day experiments [81].
The following diagram illustrates the workflow of a differential sensing experiment that incorporates several of these drift-mitigation strategies.
Diagram 1: Workflow for differential sensing to mitigate signal drift.
Quantitative Analysis of Drift Reduction Performance
Evaluating the efficacy of any drift mitigation strategy requires quantitative metrics. The following table compiles performance data from key studies, demonstrating the improvements achieved by the methods discussed above.
Table 2: Quantitative Drift Reduction Performance of Advanced Strategies
| Mitigation Strategy | Sensor Platform | Test Conditions | Performance Outcome | Source |
|---|---|---|---|---|
| Differential Sensing | Diode-connected OFET with extended gates | Uniaxial strain (100%), Compression (50 mN), Temperature (25–40°C) | Signal distortion reduced by up to 100x (2 orders of magnitude) | [80] |
| Anti-Biofouling Hydrogel | Electrochemical Aptamer-Based (EAB) Sensor | Undiluted whole blood at body temperature | Significant extension of functional lifetime; drift dominated by protein fouling mitigated | [80] [78] |
| Molecular-Weight-Selective Film | Electrochemical Aptamer-Based (EAB) Sensor | In vitro in serum and plasma | Successful mitigation of drift caused by proteins >100 kDa | [78] |
| Strain-Ignoring Circuit Design | Intrinsically Stretchable Transistors & Circuits | Mechanical deformation (30% strain) | Stable electrical performance with <10% variation, suppressing strain-induced artefacts | [80] |
Essential Reagents and Materials for Implementation
Translating these strategies from published research into a laboratory setting requires a specific toolkit. The following table details key reagents and materials essential for implementing the described drift-mitigation protocols.
Table 3: Research Reagent Solutions for Drift Mitigation Experiments
| Reagent / Material | Function / Purpose | Example Application in Drift Studies |
|---|---|---|
| Extended Gate Electrodes (Gold, Carbon) | Functionalization with target and reference bioreceptors; enables differential signal measurement. | Core component in capacitive coupling drift cancellation designs [80]. |
| Molecular-Weight-Selective Hydrogel (e.g., Polyacrylamide) | Anti-biofouling barrier; blocks large proteins while permitting analyte diffusion. | Coating for implantable sensors to reduce fouling-induced drift in vivo [80]. |
| Stretchable Conductor (e.g., PEDOT:PSS with surfactants, Carbon Nanotube composites) | Creates robust electrical interconnects and electrodes that resist signal artefacts under strain. | Fabrication of stretchable OFETs and conductometric sensors for on-skin wearables [80]. |
| Microfluidic Syringe Pump System (e.g., LSPone) | Provides precise, automated fluid handling for consistent sample delivery and sensor conditioning. | Used in continuous monitoring experiments to maintain stable flow and study long-term drift [81]. |
| Stable Bioreceptors (e.g., engineered DNA aptamers) | Provides the specific molecular recognition element with enhanced resistance to degradation. | Key for improving the operational stability of affinity-based sensors in biological fluids [79] [81]. |
Detailed Experimental Protocol for Drift Compensation
This section provides a step-by-step methodology for implementing and validating the differential sensing approach, a cornerstone technique for drift compensation, in a conductometric biosensor platform. The protocol is adapted from the seminal work on skin-like, drift-free biosensors [80].
Objective: To fabricate and characterize a differential conductometric biosensor with extended gates for cortisol detection, and to quantify its drift suppression capability under mechanical and thermal stress.
Materials and Equipment:
- Fabrication: Equipment for thin-film deposition (e.g., sputterer, evaporator), spin coater, photolithography setup.
- Substrates and Chemicals: Flexible substrate (e.g., polyimide), stretchable semiconductor polymer (e.g., DPP-TT), gate dielectric, gold/titanium evaporation targets, cortisol-specific DNA aptamer, reference molecule (e.g., scrambled DNA sequence), self-assembled monolayer (SAM) reagents (e.g., 6-mercapto-1-hexanol).
- Characterization: Semiconductor parameter analyzer, programmable temperature chamber, custom-built strain/stress jig, microfluidic flow cell, buffer solutions (PBS, artificial sweat).
Procedure:
Fabrication of Stretchable OFET Array:
- Pattern source and drain electrodes on the flexible substrate using a combination of photolithography and metal evaporation/lift-off.
- Deposit a layer of intrinsically stretchable semiconductor polymer via spin-coating, followed by annealing.
- Deposit and pattern a gate dielectric layer uniformly over the channel region.
- The result is an array of multiple, identical OFETs.
Functionalization of Extended Gates:
- Fabricate two separate gold extended-gate electrodes.
- Immerse one electrode (Target Gate) in a solution containing thiol-modified cortisol aptamers to form a SAM. Passivate with 6-mercapto-1-hexanol to minimize non-specific binding.
- Immerse the second electrode (Reference Gate) in a solution of a thiol-modified non-specific DNA sequence, followed by identical passivation.
- Connect the Target Gate to one OFET and the Reference Gate to a second, identical OFET in the array, configuring both in a diode-connected topology.
System Calibration:
- Place the sensor in a flow cell and connect it to the characterization equipment.
- Perfuse known concentrations of cortisol in buffer (e.g., 0.1 nM to 100 nM) across the sensor under zero-strain and room temperature (25°C) conditions.
- Record the drain current (Id) for both the target and reference OFETs simultaneously.
- Establish a calibration curve by plotting the differential signal (Idtarget - Idreference) against the logarithm of cortisol concentration.
Drift Testing and Validation:
- Thermal Drift Test: Set the sensor to a fixed, low cortisol concentration (or blank buffer). Increase the environmental temperature from 25°C to 40°C over 60 minutes. Record the output of both the individual channels and the differential signal.
- Mechanical Drift Test: Under a constant analyte concentration, apply uniaxial strain to the sensor substrate up to 30% (or as high as 100% for limit testing). Monitor the signal outputs throughout the strain application and release cycles.
- Long-Term Stability Test: Continuously operate the sensor in a relevant matrix (e.g., artificial sweat) at body temperature (37°C) for 24-72 hours, periodically introducing calibration standards to track any change in sensitivity and baseline.
Data Analysis:
- Calculate the drift rate (e.g., % signal change per hour or pA/min) for the target channel alone and for the differential signal during the stability test.
- For the thermal and mechanical tests, calculate the signal distortion as the maximum percentage deviation from the baseline reading. Compare the distortion of the target channel versus the differential channel to quantify the improvement factor.
The logical relationship between the sensor design, the interfering stimuli, and the final drift-corrected readout is encapsulated in the following diagram.
Diagram 2: Logical flow of differential drift compensation.
The pursuit of long-term operational stability in conductometric biosensors is a multi-disciplinary challenge that demands a holistic approach. As evidenced by the latest research, a combination of innovative transducer design—exemplified by the differential, diode-connected OFET—with advanced material science and meticulous control of the bio-interface offers a powerful pathway to significant drift reduction. The integration of molecularly-selective anti-fouling barriers and engineered stable bioreceptors further enhances sensor longevity in complex biological environments. For the research and drug development community, the adoption of these strategies is essential for transitioning conductometric biosensors from promising laboratory prototypes into robust, reliable tools for continuous health monitoring, personalized medicine, and advanced pharmaceutical research. The future of the field lies in the continued refinement of these mitigation techniques and their seamless integration into fully packaged, user-friendly diagnostic and therapeutic systems.
Leveraging Machine Learning for Data Analysis and Performance Optimization
Conductometric biosensors have emerged as powerful analytical tools in modern bioanalysis, particularly for environmental monitoring and medical diagnostics. These devices operate by measuring changes in the ionic composition of a solution resulting from biochemical reactions, typically using thin-film interdigitated electrodes [1]. Compared to other transducer types, conductometric biosensors offer significant advantages: they can be produced via inexpensive thin-film technology, require no reference electrode, are insensitive to light, and can operate with low power consumption [1]. However, these sensors traditionally faced challenges with selectivity in complex media and required sophisticated data interpretation.
The integration of machine learning (ML) has fundamentally transformed conductometric biosensing by introducing intelligent data processing capabilities that enhance analytical performance. ML-enhanced biosensors represent a paradigm shift, enabling devices to efficiently process complex data, extract actionable insights, and improve accuracy in detection tasks [82]. This technical guide explores the fundamental principles, implementation methodologies, and optimization strategies for leveraging machine learning in conductometric biosensor research, providing researchers and drug development professionals with a comprehensive framework for advanced biosensing applications.
Fundamentals of Conductometric Biosensors
Working Principles and Transducer Design
Conductometric biosensors function based on the principle that most enzymatic reactions involve consumption or production of charged species, leading to measurable changes in the ionic composition and thus the conductivity of the tested sample [1]. The conductivity (S) of an electrolyte solution can be mathematically represented as:
S = FΣzᵢcᵢuᵢ
Where F is Faraday's constant, zᵢ is the charge number, cᵢ is the ion concentration, and uᵢ is the ion mobility [1]. This relationship demonstrates how biochemical reactions that alter ion concentration directly affect the measurable conductivity.
The most common transducer design for conductometric biosensors employs interdigitated electrodes (IDEs), which are particularly suitable for miniaturization and large-scale production using inexpensive thin-film technology [1]. A key advantage of conductometric transducers is their compatibility with differential measurement schemes, which compensate for background conductivity variations, temperature fluctuations, and other interfering factors, thereby significantly improving measurement accuracy [1].
Applications and Performance Characteristics
Conductometric biosensors have demonstrated versatile applications across multiple domains. In environmental monitoring, they enable detection of pesticides, herbicides, and heavy metal ions based on enzyme inhibition principles [1]. Recent advancements have extended their application to medical diagnostics, with platforms developed for rapid, selective detection of inflammatory and cardiac biomarkers in saliva, including interleukin-6, C-reactive protein, and cardiac troponin I [5]. These medical biosensors achieve detection limits lower than reported healthy levels in saliva with rapid response times (10-minute sample incubation and <1-minute reading time) [5].
Table 1: Performance Characteristics of Conductometric Biosensors for Different Analytes
| Analyte Category | Specific Analytes | Detection Principle | Key Performance Metrics |
|---|---|---|---|
| Environmental Pollutants | Pesticides, Herbicides | Enzyme inhibition | Sensitivity in ppb/ppt range [1] |
| Heavy Metal Ions | Pb²⁺, Cd²⁺, Hg²⁺ | Enzyme inhibition | Low detection limits [1] |
| Cardiac Biomarkers | cTnI, BNP, NT-proBNP | Antibody-antigen interaction | LOD < healthy levels in saliva [5] |
| Inflammatory Biomarkers | IL-6, CRP | Antibody-antigen interaction | 10 min incubation, <1 min reading [5] |
Machine Learning Integration in Biosensing
Machine Learning Fundamentals for Biosensor Data
Machine learning encompasses computational methods that enable algorithms to learn patterns and relationships directly from data without explicit programming [83]. For biosensing applications, ML algorithms are primarily categorized into:
- Supervised Learning: Utilizes labeled datasets to train models for classification (discrete outputs) or regression (continuous outputs) tasks [82]. Common algorithms include Support Vector Machines (SVM), decision trees, and ensemble methods [83].
- Unsupervised Learning: Discovers inherent patterns and structures in unlabeled data through clustering and dimensionality reduction techniques [83].
- Deep Learning: Employs multi-layered neural networks to model complex, non-linear relationships in high-dimensional data [82].
The selection of appropriate ML algorithms depends on signal characteristics and specific use cases, with different techniques offering distinct advantages for various data processing stages including dimensionality reduction, feature extraction, anomaly detection, classification, and prediction [82].
ML-Enhanced Data Processing Workflow
The standard workflow for machine learning integration in conductometric biosensing follows a systematic pipeline from raw data acquisition to actionable insights. This process transforms complex, multi-dimensional biosensor data into reliable analytical results.
Diagram 1: ML-Enhanced Data Processing Workflow
The workflow begins with raw conductometric signal acquisition, typically comprising time-series conductivity measurements with potential noise interference. Signal preprocessing follows, addressing noise reduction, baseline correction, and signal normalization to enhance data quality [82]. The feature extraction stage identifies and quantifies relevant characteristics from the preprocessed signals, which may include reaction rates, amplitude changes, kinetic parameters, or spectral features [83]. The ML model processing stage applies optimized algorithms to interpret the features and generate predictive outputs. Finally, the system delivers analytical results such as analyte identification, concentration quantification, or diagnostic classifications [82].
Experimental Protocols and Implementation
Conductometric Measurement Setup
Implementing conductometric biosensing with ML integration requires specific instrumentation and configuration. A standardized experimental setup includes:
- Instrumentation: The portable conductometry device MXP-3 serves as an effective measurement instrument, operating at 37 kHz frequency with 14 mV amplitude [6].
- Sensor Configuration: The sensor block consists of a differential conductometric transducer, holder, and support, positioned above a magnetic stirrer for solution mixing [6].
- Data Acquisition: The conductometric transducer is connected to a holder to establish an initial baseline before adding the test substance to the working cell [6].
- Computer Interface: The device connects to a personal computer with specialized software for response recording and data visualization [6].
This differential measurement approach compensates for background conductivity variations and temperature influences, significantly enhancing measurement accuracy [1]. The miniaturized interdigitated electrode configuration enables sensitive detection in small sample volumes, making it suitable for precious biological samples [1] [5].
Machine Learning Implementation Protocol
Successful ML integration requires meticulous attention to data quality, algorithm selection, and model validation:
- Data Collection and Preparation: Acquire conductometric response data across expected analyte concentration ranges. Ensure sufficient sample size (typically hundreds to thousands of measurements) representing all anticipated conditions [83].
- Feature Engineering: Extract relevant features from conductometric response curves, including initial reaction rates, steady-state signals, curve shapes, and kinetic parameters [82].
- Algorithm Selection: Choose ML algorithms based on specific analytical goals:
- Model Training and Validation: Implement k-fold cross-validation to assess model performance and prevent overfitting. Use separate training, validation, and test datasets to ensure generalizability [83].
- Performance Evaluation: Quantify model performance using metrics appropriate to the task:
Table 2: Machine Learning Algorithms for Biosensor Applications
| Algorithm Category | Specific Algorithms | Biosensor Applications | Advantages | Performance Metrics |
|---|---|---|---|---|
| Regression Methods | Least Squares, LASSO, Elastic-Net, Bayesian Ridge | Concentration quantification, Parameter prediction | Fast processing, High accuracy (R² > 0.99) [84] | R² score, MAE, MSE [84] |
| Classification Methods | SVM, Decision Trees, K-Nearest Neighbors | Disease diagnosis, Analyte identification | Handles high-dimensional data [83] | Accuracy, Precision, Recall [82] |
| Deep Learning | Neural Networks, Convolutional Neural Networks | Complex pattern recognition, Multi-analyte detection | Automatic feature extraction [82] | Task-specific metrics [82] |
Performance Optimization Strategies
Algorithm Optimization for Enhanced Sensitivity
Optimizing ML algorithms significantly enhances biosensor performance parameters including sensitivity, specificity, and detection limits. For conductometric biosensors, several optimization approaches have demonstrated effectiveness:
- Regularization Techniques: Methods like LASSO (Least Absolute Shrinkage and Selection Operator) and Elastic-Net improve model generalizability by preventing overfitting, particularly valuable with high-dimensional data from sensor arrays [84]. LASSO regression minimizes the objective function: Min(½n_samples‖Y−Xβ‖₂² + λ‖β‖₁) where λ ≥ 0 is the regularization parameter [84].
- Ensemble Methods: Combining multiple models through bagging, boosting, or stacking enhances prediction accuracy and robustness, particularly for complex biological samples with interfering substances [83].
- Feature Selection: Identifying and retaining only the most informative features improves model performance, reduces computational requirements, and enhances interpretability [82].
Implementation of these optimization strategies has demonstrated substantial improvements in biosensor systems, with reported prediction R² scores exceeding 0.99 and design error rates below 3% for optimized optical biosensors [84]. Similar enhancements are achievable for conductometric platforms through appropriate algorithm selection and tuning.
Experimental Design for Data Quality
The foundation of effective ML integration is high-quality, representative training data. Optimized experimental design includes:
- Comprehensive Calibration: Collect data across the entire dynamic range of expected analyte concentrations with appropriate replication [83].
- Interference Modeling: Include potential interferents and matrix effects during training data collection to enhance model robustness in real-world applications [82].
- Temporal Sampling: Capture appropriate temporal resolution for kinetic measurements, ensuring sufficient data points to characterize reaction profiles [1].
- Environmental Control: Document and vary environmental factors (temperature, pH) to build models that compensate for these variables [1].
The relationship between experimental parameters and ML optimization creates a virtuous cycle of improvement, where initial models inform refined experimental designs that generate higher-quality data for subsequent model training.
Diagram 2: ML-Driven Biosensor Optimization Cycle
Research Reagent Solutions and Materials
Successful implementation of ML-enhanced conductometric biosensing requires specific materials and reagents optimized for the platform's requirements.
Table 3: Essential Research Reagent Solutions for Conductometric Biosensors
| Material/Reagent | Function/Application | Specifications/Alternatives |
|---|---|---|
| Interdigitated Electrodes | Signal transduction | High-resistivity silicon wafers; gold or platinum electrodes [5] |
| Biological Recognition Elements | Analyte binding | Enzymes, antibodies, aptamers, whole cells [1] [85] |
| Immobilization Matrices | Bioreceptor attachment | Polymers, sol-gels, self-assembled monolayers [1] |
| Buffer Systems | Maintain optimal pH | Phosphate buffer saline (PBS) with controlled ionic strength [5] |
| Standard Solutions | Calibration and validation | Certified reference materials for target analytes [1] |
| Signal Processing Software | Data analysis | Custom algorithms in Python/R with ML libraries [82] |
The integration of machine learning with conductometric biosensors represents a significant advancement in analytical technology, enabling unprecedented capabilities in detection sensitivity, specificity, and operational efficiency. This synergy addresses fundamental challenges in traditional biosensing, including signal interpretation in complex matrices, multi-analyte detection, and real-time data processing [82]. As both fields continue to evolve, several emerging trends promise further enhancements:
Future developments will likely focus on adaptive learning systems that continuously improve with ongoing use, multiplexed detection platforms for simultaneous multi-analyte monitoring, and explainable AI approaches that provide transparent reasoning for analytical decisions [82]. Additionally, the integration of conductometric biosensors with wearable platforms and Internet of Things (IoT) systems will enable continuous health monitoring and real-time environmental sensing [82]. These advancements, coupled with ongoing improvements in ML algorithms and sensor materials, will further establish conductometric biosensors as indispensable tools in diagnostic medicine, environmental monitoring, and drug development applications.
For researchers implementing these systems, success depends on maintaining rigorous data collection protocols, thoughtful algorithm selection matched to specific analytical challenges, and continuous validation against reference methods. The interdisciplinary collaboration between electrochemistry, materials science, and data science will drive the next generation of intelligent biosensing platforms.
Benchmarking Performance: Validation Protocols and Comparative Analysis with Other Biosensor Types
The performance and reliability of conductometric biosensors, and biosensors in general, are quantitatively assessed using a set of standardized validation metrics. Among these, the Limit of Detection (LOD), sensitivity, and dynamic range are paramount, providing critical information about the sensor's capabilities and limitations [86] [71]. Proper characterization of these parameters is not merely an academic exercise but a fundamental requirement for the translation of biosensing technology from research laboratories to real-world applications in clinical diagnostics, environmental monitoring, and food safety [86] [4]. Confusion or inconsistent calculation of these metrics, particularly the LOD, remains a significant challenge in the scientific literature, often hindering the meaningful comparison of different biosensing platforms [86]. This guide establishes a clear, standardized framework for determining and reporting these core metrics, with a specific focus on their context within the fundamentals of conductometric biosensors research.
Defining the Core Metrics
Limit of Detection (LOD)
The Limit of Detection (LOD) is defined as the lowest concentration of an analyte that an analytical method can reliably distinguish from a blank sample containing no analyte [86]. It is a fundamental measure of a biosensor's ability to detect trace amounts of a target substance. The LOD is expressed in units of concentration and is strongly related to the probabilities of false positives (α) and false negatives (β) [86].
The LOD is derived from the signal of blank measurements. Following IUPAC guidelines, it can be calculated as:
LOD = yB + k * sB [86]
where y_B is the mean of the blank signal, s_B is the standard deviation of the blank signal, and k is a numerical factor chosen based on the desired confidence level. A common convention is to use k=3, which corresponds to a confidence level of approximately 99.86% if the blank signal follows a normal distribution [86].
To convert this signal LOD into a concentration, the analytical sensitivity (slope of the calibration curve, a) is used: CLOD = k * sB / a [86]
Sensitivity
In the context of biosensors, sensitivity has two related but distinct definitions:
- Analytical Sensitivity: This refers to the slope of the calibration curve (the change in sensor response per unit change in analyte concentration). A steeper slope indicates a greater change in signal for a given change in concentration, which is a key factor in achieving a low LOD [86].
- Detection Sensitivity: This is the ability of the biosensor to detect low concentrations of an analyte, often colloquially used interchangeably with achieving a low LOD. For conductometric biosensors, this can be optimized by altering the physical design of the sensor, such as reducing the gap between interdigitated electrodes to enhance the electric field and signal response [87].
Dynamic Range
The dynamic range (or measuring interval) is the concentration range over which the biosensor provides a quantifiable response. It is bounded at the lower end by the LOD and at the upper end by signal saturation, where the sensor's response no longer changes significantly with increasing analyte concentration [86] [88]. A wide dynamic range is crucial for applications where analyte concentrations can vary over several orders of magnitude, such as in clinical samples. Research continues to develop strategies to extend the dynamic range of biosensors, for example, through the directed evolution of transcription factors [88] or the use of allosteric DNA probes with varying affinities in nanochannel sensors [89].
Table 1: Summary of Core Biosensor Validation Metrics
| Metric | Definition | Key Formula(s) | Significance |
|---|---|---|---|
| Limit of Detection (LOD) | The lowest analyte concentration reliably distinguished from a blank. | ( C{LOD} = \frac{k \cdot sB}{a} ) | Determines the capability for trace-level detection. |
| Sensitivity | The change in sensor response per unit change in analyte concentration. | ( a = \frac{\Delta y}{\Delta C} ) (slope of calibration curve) | Defines the sensor's resolution between different concentration levels. |
| Dynamic Range | The span of concentrations from the LOD to the point of signal saturation. | N/A | Critical for applications where analyte concentration varies widely. |
Experimental Protocols for Metric Determination
General Workflow for Calibration and Validation
A rigorous approach to experiment design is essential for accurate determination of validation metrics. The following protocol outlines the key steps.
Detailed Methodologies
Sensor Preparation and Functionalization
The protocol for sensor surface functionalization is critical for performance. An optimized protocol for an optical biosensor, which highlights the importance of this step, used the following [36]:
- Cleaning: Substrates are rigorously cleaned with acetone, isopropanol (IPA), and deionized water, then dried with nitrogen.
- APTES Functionalization: A uniform aminopropyltriethoxysilane (APTES) layer is deposited to create a linker layer for subsequent bioreceptor immobilization. A methanol-based protocol (0.095% APTES) was found to yield a superior monolayer, leading to a threefold improvement in LOD compared to ethanol-based or vapor-phase methods [36].
- Bioreceptor Immobilization: Receptor molecules (e.g., antibodies, aptamers) are covalently attached to the amine-functionalized surface. For a model streptavidin assay, the surface is biotinylated using sulfo-NHS-biotin chemistry [36].
Calibration Curve Construction
The calibration curve is the cornerstone for calculating all validation metrics [86].
- Sample Preparation: Prepare a dilution series of the analyte standard, typically spanning at least five concentrations to establish linearity. It is recommended to use a minimum of five concentration levels [86].
- Measurement: For each concentration level, perform
nindependent replicate measurements (n≥ 3 is common) to account for variability. - Data Analysis: For each concentration, calculate the mean response
ȳ_iand standard deviations_i[86]. - Linear Regression: Plot the mean sensor response (
y) against the analyte concentration (C) and perform a linear regression to obtain the calibration function:y = aC + b, whereais the slope (sensitivity) andbis the y-intercept [86].
Blank Measurement for LOD
To determine the LOD, a separate set of measurements is required:
- Replicate Blank Measurements: Perform
n_Bindependent replicate measurements (e.g.,n_B≥ 10) on a sample containing zero analyte (blank) [86]. - Calculate Mean and Standard Deviation: Compute the mean blank signal
y_Band, most importantly, the standard deviation of the blank signal,s_B, using Equation (4) from the introduction [86].
Calculation of Metrics from Experimental Data
Step-by-Step Calculation
With the experimental data collected, the validation metrics can be quantitatively determined.
- Calculate Sensitivity (a): The sensitivity
ais directly obtained as the slope from the linear regression of the calibration curve (y = aC + b) [86]. - Determine LOD:
- From the blank replicate measurements, calculate the standard deviation,
s_B. - Select a
kfactor. For many applications,k=3is used, which corresponds to a theoretical confidence level of 99.86% for a normal distribution [86]. It is crucial to note that withk=3, the actual probabilities of false positives and false negatives are about 6.7% each if the LOD is set as the critical value [86]. - Apply the formula:
C_LOD = k * s_B / a[86].
- From the blank replicate measurements, calculate the standard deviation,
- Define Dynamic Range: The dynamic range is reported as the interval from the experimentally determined LOD to the upper limit of quantification (ULOQ). The ULOQ is the highest concentration at which the calibration curve remains linear and the sensor response can be quantified with acceptable accuracy and precision [86] [88].
Worked Example and Data Presentation
Assuming a calibration curve with a slope of a = 50 nA/(nM) and a blank standard deviation of s_B = 0.45 nA, the LOD calculation with k=3 would be:
C_LOD = 3 * 0.45 nA / 50 nA/nM = 0.027 nM
If the calibration curve is linear from this LOD up to a concentration of 100 nM, the dynamic range is reported as 0.027 nM - 100 nM.
Table 2: Example Calculation of Biosensor Metrics from Experimental Data
| Parameter | Symbol | Example Value | Source |
|---|---|---|---|
| Slope of Calibration Curve | a |
50 nA/nM | Linear Regression |
| Standard Deviation of Blank | s_B |
0.45 nA | 10 Replicate Measurements |
| Chosen K-factor | k |
3 | Common Convention |
| Calculated LOD | C_LOD |
0.027 nM | Calculation: (3*0.45)/50 |
| Upper Limit of Linear Range | ULOQ | 100 nM | Visual inspection of calibration curve |
| Reported Dynamic Range | N/A | 0.027 nM - 100 nM | From LOD to ULOQ |
Advanced Considerations and Optimization Strategies
Extending the Dynamic Range
A common limitation of biosensors is a restricted dynamic range. Advanced strategies are being developed to programmably tune this parameter:
- Allosteric DNA Probes: Research on nanochannel biosensors for miRNA detection has demonstrated that using tunable triblock DNA probes with varying affinities for the target can dramatically extend the dynamic range. One study reported an initial 81-fold range that was expanded to 10,900-fold by combining probes with different affinities [89].
- Directed Evolution of Biological Components: For transcription factor-based biosensors, modifying the biorecognition element itself can be highly effective. For an l-carnitine biosensor, a Functional Diversity-Oriented Volume-Conservative Substitution Strategy was applied to the transcription factor CaiF. This yielded a variant with a 1000-fold wider concentration response range and a 3.3-fold higher output signal [88].
Optimization of the Limit of Detection
The LOD can be optimized through both physical sensor design and surface chemistry:
- Electrode Geometry: For impedimetric biosensors using interdigitated electrodes (IDEs), finite element analysis and experimental validation show that reducing the gap between electrodes enhances sensitivity and lowers the LOD. A design with a 3 μm gap could detect a target at 50 ng/mL, a concentration undetectable by designs with 4 μm or 5 μm gaps [87].
- Surface Functionalization: The uniformity and quality of the receptor immobilization layer directly impact signal noise and strength. Optimizing the protocol for depositing silane layers like APTES (e.g., using a methanol-based method over an ethanol-based one) was shown to improve the LOD of an optical biosensor by a factor of three [36].
Table 3: Optimization Strategies for Biosensor Performance
| Strategy | Target Metric | Mechanism of Action | Reported Outcome |
|---|---|---|---|
| Reduced Electrode Gap [87] | LOD / Sensitivity | Enhances electric field density and interaction with analyte. | Detection of 50 ng/mL mAb with 3 μm gap vs. non-detection with 4-5 μm gaps. |
| Optimized APTES Monolayer [36] | LOD | Creates a more uniform, stable surface for bioreceptor attachment, reducing noise. | Threefold improvement in LOD (27 ng/mL) for streptavidin detection. |
| Tunable DNA Probes [89] | Dynamic Range | Uses multiple probes with different affinities to cover a wider concentration span. | Extended dynamic range by 10,900-fold for miRNA detection. |
| Directed Evolution of Transcription Factor [88] | Dynamic Range / Signal | Alters the binding protein's affinity and operational response range. | 1000-fold wider dynamic range and 3.3-fold higher signal output. |
The Scientist's Toolkit: Essential Research Reagents and Materials
The following table details key reagents and materials commonly used in the development and validation of conductometric and other biosensors, as derived from the cited experimental protocols.
Table 4: Essential Research Reagents and Materials for Biosensor Development
| Item | Function / Application | Example from Literature |
|---|---|---|
| 3-Aminopropyltriethoxysilane (APTES) | Silane coupling agent for surface functionalization; provides amine groups for covalent attachment of bioreceptors. | Used to functionalize optical biosensor surface for streptavidin detection [36]. |
| Sulfo-NHS-Biotin | Biotinylation reagent; reacts with amine groups on the sensor surface or proteins to enable immobilization via streptavidin-biotin interaction. | Used to biotinylate the APTES-functionalized surface [36]. |
| Bovine Serum Albumin (BSA) | Blocking agent; used to passivate unused surface areas to minimize non-specific binding of analyte. | A common reagent to reduce background noise in biosensing assays [36]. |
| Interdigitated Electrodes (IDEs) | Transducer platform for conductometric/impedimetric biosensors; electrode gap is a critical design parameter. | Optimized for COVID-19 antibody detection by varying gap to 3 μm, 4 μm, and 5 μm [87]. |
| Allosteric DNA Probes / Aptamers | Synthetic bioreceptors with engineered binding properties; can be designed for specific targets and tuned for affinity. | Used as tunable triblock probes to program the dynamic range of a nanochannel miRNA sensor [89]. |
| Transcription Factors (e.g., CaiF) | Biological recognition elements for specific metabolites; can be engineered to alter sensor performance. | Modified via directed evolution to create an l-carnitine biosensor with a vastly expanded dynamic range [88]. |
Cross-Validation with Gold-Standard Methods like HPLC and Mass Spectrometry
For researchers developing conductometric biosensors, cross-validation against established gold-standard methods is a critical step in demonstrating analytical credibility. Conductometric biosensors, which measure changes in electrical conductivity resulting from biochemical reactions, offer advantages of miniaturization, cost-effectiveness, and real-time monitoring [4]. However, to gain acceptance in pharmaceutical development and clinical applications, their performance must be rigorously validated against reference techniques such as High-Performance Liquid Chromatography (HPLC) and Mass Spectrometry (MS) [90]. This process verifies that the biosensor provides comparable accuracy, precision, and reliability to these well-characterized analytical platforms.
Liquid chromatography coupled with tandem mass spectrometry (HPLC-MS/MS) represents one of the most powerful analytical techniques for quantitative bioanalysis, providing exceptional sensitivity, selectivity, and the ability to identify chemical structures through characteristic fragmentation patterns [91]. In pharmaceutical contexts, HPLC-MS/MS is extensively employed for drug metabolism and pharmacokinetic studies, enabling researchers to track parent drugs and their metabolites in complex biological matrices with high specificity [91]. When validating conductometric biosensors, cross-referencing with HPLC-MS/MS provides definitive confirmation of analyte identity and concentration, establishing the necessary confidence in biosensor measurements for critical decision-making in drug development.
Fundamentals of Cross-Validation Design
Key Analytical Parameters for Method Comparison
Effective cross-validation requires systematic assessment of multiple analytical performance characteristics between the novel biosensor and reference methods. The table below outlines essential parameters that should be evaluated during comparative studies.
Table 1: Key Analytical Parameters for Cross-Validation Studies
| Parameter | Description | Importance in Biosensor Validation |
|---|---|---|
| Sensitivity/Limit of Detection (LOD) | Lowest analyte concentration detectable | Determines the biosensor's utility for trace analysis [11] |
| Linear Range | Concentration interval where response is proportional to analyte | Defines the operational working range for quantitative analysis [11] |
| Selectivity/Specificity | Ability to measure analyte accurately in presence of interferences | Confirms biosensor's recognition element specificity [11] |
| Precision | Closeness of agreement between repeated measurements | Assesses analytical reproducibility and random error [11] |
| Accuracy | Closeness of measured value to true value | Establishes measurement correctness against reference method [90] |
Experimental Design Considerations
Well-designed cross-validation studies must account for several critical factors to ensure meaningful results. Sample preparation procedures require careful optimization, as the same processed samples should typically be analyzed by both the conductometric biosensor and HPLC-MS methods to enable direct comparison [91]. For biosensors targeting macromolecules or cellular analytes, appropriate sample homogenization, deproteination, and extraction steps are essential to maintain analyte integrity while minimizing matrix effects [91].
The complexity of the biological matrix significantly impacts method performance. Conductometric biosensors, like other analytical platforms, may experience signal suppression or enhancement from matrix components [4]. Cross-validation studies should therefore evaluate both spiked samples in biological matrices and authentic samples from in vivo or in vitro studies. For pharmaceutical applications, this includes relevant matrices such as blood plasma, urine, bile, and tissue homogenates [91].
Technical Principles of HPLC-MS/MS
HPLC-MS/MS combines the superior separation capabilities of liquid chromatography with the exquisite detection sensitivity and structural elucidation power of tandem mass spectrometry. In pharmaceutical analysis, reversed-phase HPLC is predominantly employed, where the relationship between metabolic structural changes and corresponding shifts in retention behavior provides valuable supporting information for metabolite identification [91].
The mass spectrometric detection typically employs atmospheric pressure ionization (API) sources, which effectively ionize analytes for subsequent mass analysis. The first fundamental step in interpreting mass spectra is determining molecular weight based on protonated molecules [M+H]⁺ observed in positive-ion full-scan mass spectra [91]. Tandem mass spectrometry (MS/MS) further enables structural characterization through collision-induced dissociation, generating characteristic fragment ions that provide structural fingerprints for confident analyte identification [91].
HPLC-MS/MS Experimental Protocol for Metabolite Detection
Sample Preparation:
- Biomatrix Sampling: Collect biological samples (plasma, urine, tissue homogenates) with appropriate stabilization.
- Internal Standard Addition: Add a suitable internal standard early in the process to account for variability.
- Deproteination: Precipitate proteins using organic solvents (e.g., acetonitrile or methanol) followed by centrifugation.
- Extraction: Employ liquid-liquid or solid-phase extraction to isolate analytes from interfering matrix components.
- Reconstitution: Redissolve extracted samples in mobile phase compatible with HPLC separation [91].
HPLC Separation:
- Column Selection: Use reversed-phase C18 columns (e.g., 2.1 × 150 mm, 3.5 µm) for most applications.
- Mobile Phase: Employ gradient elution with water-acetonitrile or water-methanol mixtures, often with 0.1% formic acid or ammonium acetate modifiers.
- Flow Rate: Optimize between 0.2-0.5 mL/min for adequate separation and MS compatibility.
- Column Temperature: Maintain at 30-40°C for retention time stability.
- Injection Volume: Typically 5-20 µL, depending on sensitivity requirements [91].
Mass Spectrometric Detection:
- Ionization Source: Utilize electrospray ionization (ESI) or atmospheric pressure chemical ionization (APCI) in positive or negative mode.
- Mass Analysis: Operate triple quadrupole instruments in multiple reaction monitoring (MRM) mode for optimal sensitivity.
- Optimization: Determine optimal precursor-product ion transitions, collision energies, and declustering potentials for each analyte.
- Data Acquisition: Monitor specific MRM transitions with dwell times sufficient for adequate data points across chromatographic peaks [91].
Conductometric Biosensors: Principles and Experimental Protocols
Fundamentals of Conductometric Sensing
Conductometric biosensors belong to the broader category of electrochemical biosensors that transduce biological recognition events into measurable electrical signals [4]. These devices typically incorporate a biological recognition element (enzyme, antibody, nucleic acid, or cell) immobilized on a transducer surface that measures changes in ionic conductivity between electrodes [4]. When the target analyte interacts with the biological recognition element, it catalyzes a reaction that alters the ionic composition of the solution, thereby changing the electrical conductivity between electrodes, which is measured as the analytical signal.
The fundamental components of a conductometric biosensor include:
- Bioreceptor: Biological recognition element that specifically binds to the target analyte
- Transducer: Electrode system that converts the biochemical interaction into a measurable electrical signal
- Electronics: Signal processing circuitry that conditions, amplifies, and processes the electrical signal
- Display: User interface that presents the final output in an interpretable format [11]
Conductometric Biosensor Experimental Protocol
Biosensor Fabrication:
- Electrode Design: Fabricate interdigitated microelectrodes (10-100 µm gaps) on silicon or glass substrates using photolithography.
- Surface Functionalization: Clean electrode surfaces with oxygen plasma, then functionalize with (3-aminopropyl)triethoxysilane (APTES) to introduce amine groups.
- Bioreceptor Immobilization: Covalently immobilize biological recognition elements (e.g., enzymes, antibodies) using cross-linkers such as glutaraldehyde.
- Blocking: Treat non-specific binding sites with bovine serum albumin (BSA) or other blocking agents.
- Storage: Store prepared biosensors in appropriate buffers at 4°C until use [4].
Measurement Procedure:
- Baseline Establishment: Immerse biosensor in measurement buffer (low ionic strength preferred) and apply a small AC voltage (10-100 mV, 1-10 kHz) while recording baseline conductivity.
- Sample Introduction: Introduce sample containing target analyte to the measurement chamber.
- Signal Monitoring: Record conductivity changes in real-time until signal stabilizes.
- Regeneration: For reusable biosensors, regenerate sensing surface with appropriate regeneration buffer (e.g., glycine-HCl for pH elution).
- Calibration: Perform measurements with standard solutions to establish calibration curves [4].
Table 2: Research Reagent Solutions for Biosensor Cross-Validation Studies
| Reagent/Category | Specific Examples | Function/Purpose |
|---|---|---|
| Biological Recognition Elements | Enzymes (glucose oxidase, urease), antibodies, aptamers, whole cells | Specifically bind target analyte to initiate sensing mechanism [11] |
| Immobilization Materials | Glutaraldehyde, APTES, Nafion, polypyrrole, graphene | Secure bioreceptor to transducer surface while maintaining bioactivity [92] |
| Signal Amplification Agents | Gold nanoparticles, enzymatic labels (HRP), redox mediators | Enhance detection sensitivity through signal amplification [93] |
| Sample Preparation Reagents | β-glucuronidase/arylsulfatase, phosphate buffer, organic solvents | Process complex samples to improve analyte accessibility [91] |
Integrated Cross-Validation Workflow
A systematic approach to cross-validation ensures comprehensive assessment of conductometric biosensor performance against HPLC-MS reference methods. The following workflow diagram illustrates the integrated process from method development through data correlation.
Diagram 1: Cross-Validation Workflow
Data Correlation and Statistical Analysis
Following simultaneous analysis by both techniques, statistical correlation of the resulting data sets confirms analytical agreement. Linear regression analysis of biosensor responses (y-axis) versus HPLC-MS/MS concentrations (x-axis) should ideally yield a slope of 1.00 with a high coefficient of determination (R² > 0.98) [90]. Bland-Altman analysis further quantifies the bias between methods and establishes limits of agreement, identifying any concentration-dependent discrepancies [94].
For conductometric biosensors intended for pharmaceutical applications, additional validation parameters should include:
- Intra-day and inter-day precision (CV < 15%)
- Accuracy assessments (85-115% recovery of known concentrations)
- Robustness testing under varied physiological conditions (pH, temperature, ionic strength)
- Stability studies evaluating biosensor performance over time [11]
Case Study: Biosensor Validation in Pharmaceutical Research
To illustrate practical implementation, consider validating a conductometric biosensor for therapeutic drug monitoring. The biosensor incorporates an antibody recognition element specific to the target drug molecule, with signal transduction based on conductivity changes following antigen-antibody binding.
Cross-Validation Experiment:
- Sample Set: Prepare drug-spiked human plasma samples across the therapeutic range (e.g., 0.1-100 µM) with six concentration levels and five replicates per level.
- Sample Processing: Split each sample for parallel analysis - one portion for direct biosensor measurement (with minimal dilution) and another for HPLC-MS/MS analysis following protein precipitation and solid-phase extraction.
- Data Collection: Acquire measurements using both methods in randomized order to avoid systematic bias.
- Data Analysis: Perform statistical comparison as described in Section 5.1.
Table 3: Exemplary Cross-Validation Data for a Theoretical Anticancer Drug
| Spiked Concentration (µM) | Biosensor Mean (µM) | HPLC-MS/MS Mean (µM) | Relative Difference (%) |
|---|---|---|---|
| 0.10 | 0.11 | 0.09 | +22.2 |
| 1.00 | 0.95 | 1.03 | -7.8 |
| 10.00 | 9.87 | 10.12 | -2.5 |
| 50.00 | 48.52 | 49.85 | -2.7 |
| 100.00 | 102.31 | 101.72 | +0.6 |
The data demonstrates excellent agreement at clinically relevant concentrations (>1 µM), with slightly higher variability at the lower limit of quantification. This level of performance validation would support application of the biosensor for therapeutic drug monitoring, where rapid results enable dosage adjustments in near real-time compared to batch-based HPLC-MS/MS analysis.
Advanced Topics: Machine Learning in Biosensor Validation
Emerging approaches leverage machine learning (ML) to enhance biosensor data analysis and validation. ML algorithms can compensate for analytical variability and improve correlation with reference methods. Studies have demonstrated that decision tree regressors, Gaussian process regression, and artificial neural networks can achieve exceptional predictive accuracy (R² = 1.00, RMSE ≈ 0.1465) for biosensor responses when properly trained on appropriate datasets [92].
Feature importance analysis further reveals that parameters such as bioreceptor amount, pH, and analyte concentration typically account for >60% of predictive variance in biosensor performance [92]. These insights guide optimization of conductometric biosensors to enhance agreement with gold-standard methods while reducing development time and costs through predictive modeling rather than purely empirical optimization.
Cross-validation against HPLC and mass spectrometry remains essential for establishing the credibility of conductometric biosensors in pharmaceutical research and drug development. Through rigorous experimental design, appropriate statistical analysis, and understanding of both technological platforms, researchers can effectively demonstrate that novel biosensing approaches deliver comparable performance to established gold-standard methods. This validation pathway enables adoption of conductometric biosensors for applications requiring rapid analysis, point-of-care testing, and real-time monitoring while maintaining the analytical rigor demanded by regulatory standards.
Electrochemical biosensors represent a cornerstone of modern analytical science, merging the specificity of biological recognition with the sensitivity of electrochemical transducers. These devices are classified based on their underlying transduction principle: amperometric sensors measure current, potentiometric sensors measure potential, and conductometric sensors measure conductivity. The selection of an appropriate transduction mechanism is paramount in biosensor design, as it directly influences key performance parameters including sensitivity, selectivity, detection limit, and suitability for miniaturization or in-field application. This analysis provides a technical comparison of these three principal electrochemical biosensing techniques, contextualized within fundamental conductometric biosensor research.
The growing significance of these tools, particularly in point-of-care diagnostics and environmental monitoring, is driving a market projected to maintain a robust Compound Annual Growth Rate (CAGR) of 8.7% from 2025 to 2033 [95]. This growth is fueled by continuous innovation focusing on miniaturization, enhanced sensitivity via nanomaterials, and the development of wearable and self-powered devices [95] [96]. Understanding the core characteristics, advantages, and limitations of each transducing method is therefore critical for researchers and drug development professionals aiming to design next-generation biosensing platforms.
Fundamental Principles and Comparative Analysis
The operational principles of amperometric, potentiometric, and conductometric biosensors are rooted in distinct electrochemical phenomena. A thorough grasp of these fundamentals is essential for selecting the optimal sensing strategy for a given application.
Amperometric biosensors operate by applying a constant potential to a working electrode versus a reference electrode and measuring the resulting current generated from the electrochemical oxidation or reduction of an electroactive species [97] [98]. This current is directly proportional to the concentration of the target analyte. A classic and extensively investigated example is the glucose biosensor, where the enzyme glucose oxidase (GOx) catalyzes the oxidation of glucose, producing hydrogen peroxide. The subsequent oxidation of H₂O₂ at the electrode surface generates a measurable current [97]. A key advancement in this field is the development of third-generation biosensors where the enzyme and a mediator are directly immobilized on the transducer, enabling direct electron transfer and negating the reliance on diffusive reaction products [97].
Potentiometric biosensors, in contrast, measure the accumulation of a charge potential at the surface of an ion-selective electrode (ISE) relative to a reference electrode under conditions of negligible current flow [96] [99]. The measured potential is logarithmically related to the activity of the target ion via the Nernst equation. These sensors often employ ion-selective membranes to confer specificity. Recent trends include their integration into field-effect transistors (FETs), known as BioFETs, where the binding of an analyte to a biorecognition element on the gate electrode alters the charge distribution in the underlying semiconductor, modulating its conductance [96]. This configuration allows for incredibly high sensitivities, sometimes down to the attomolar range [96].
Conductometric biosensors function by monitoring changes in the ionic strength (conductivity) of a solution resulting from a biochemical reaction [1]. Most enzymatic reactions involve the consumption or production of charged species, leading to a net change in the ionic composition within a microvolume adjacent to the transducer. The transducer typically consists of a pair of closely spaced, interdigitated electrodes. A key advantage of this method is the use of a differential measuring scheme, which employs a working sensor and a reference sensor. This setup effectively compensates for fluctuations in background conductivity, temperature variations, and other non-specific effects, thereby enhancing measurement accuracy and reliability [1].
Table 1: Comparative Analysis of Biosensor Transduction Principles
| Characteristic | Amperometric | Potentiometric | Conductometric |
|---|---|---|---|
| Measured Quantity | Current (A) [98] | Potential (V) [99] | Conductance (S) / Impedance [1] |
| Applied Potential | Constant [98] | Zero (or negligible) current [96] | AC voltage (to prevent electrolysis) [1] |
| Relationship to [Analyte] | Linear, proportional [98] | Logarithmic (Nernstian) [99] | Linear, proportional [1] |
| Key Principle | Redox current from electroactive species [97] | Change in charge distribution at membrane [96] | Change in ionic composition of medium [1] |
| Reference Electrode | Required [97] | Required [99] | Not required [1] |
| Inherent Sensitivity | High | Very High (e.g., BioFETs) [96] | Moderate |
| Ease of Miniaturization | High | High (insensitive to size) [96] | Very High (inexpensive thin-film tech) [1] |
Experimental Protocols for Biosensor Development
The development of robust biosensors requires meticulous experimental protocols. Below are detailed methodologies for each type, highlighting critical steps from electrode fabrication to data analysis.
Fabrication of an Amperometric Glucose Biosensor
Objective: To construct a third-generation amperometric biosensor for the detection of glucose via direct electron transfer.
- Electrode Pretreatment: Clean and polish a glassy carbon or gold working electrode with alumina slurry (e.g., 0.05 µm) to a mirror finish. Perform electrochemical activation in a suitable electrolyte (e.g., H₂SO₄) via cyclic voltammetry.
- Nanomaterial Modification: Deposit a layer of functionalized multi-walled carbon nanotubes (MWCNTs) or graphene oxide onto the electrode surface to enhance the electroactive surface area and facilitate electron transfer. This can be achieved by drop-casting.
- Enzyme Immobilization: Co-immobilize Glucose Oxidase (GOx) and a redox mediator (e.g., a ferrocene derivative) onto the nanostructured surface. This can be accomplished through:
- Entrapment in a Polymer Matrix: Mix GOx and mediator within a Nafion or chitosan solution and drop-cast onto the electrode.
- Electropolymerization: Immerse the electrode in a solution containing the monomer (e.g., m-phenylenediamine), GOx, and mediator. Apply a cyclic potential to electropolymerize the monomer, entrapping the enzyme and mediator within the resulting polymer film [97].
- Sensor Assembly: Integrate the modified working electrode with a Pt counter electrode and an Ag/AgCl reference electrode into a three-electrode cell system.
- Amperometric Measurement: Place the sensor in a stirred buffer solution. Apply a constant optimal potential (e.g., +0.7 V vs. Ag/AgCl for H₂O₂ oxidation). Upon stabilization of the background current, inject aliquots of glucose standard solution. Record the steady-state current response after each addition.
- Data Analysis: Plot the steady-state current (µA) against glucose concentration (mM) to generate a calibration curve. The linear range, sensitivity (slope of the curve), and limit of detection (LOD) can be determined from this data.
Fabrication of a Potentiometric Urea Biosensor with ISE
Objective: To develop a solid-contact ion-selective electrode (SC-ISE) for urea detection based on enzymatic hydrolysis and pH change.
- Solid-Contact Preparation: A conductive solid-contact layer is first applied to a solid substrate (e.g., a glassy carbon electrode). This layer, which acts as an ion-to-electron transducer, can be made from a conducting polymer like poly(3,4-ethylenedioxythiophene) (PEDOT) or a carbon nanomaterial (e.g., graphene, MWCNTs) [99].
- Ion-Selective Membrane (ISM) Formulation: Prepare the ISM cocktail containing:
- Polymer Matrix: High molecular weight Polyvinyl chloride (PVC).
- Plasticizer: e.g., 2-Nitrophenyl octyl ether (NPOE).
- Ionophore: A nonactin-based ionophore for NH₄⁺.
- Ion Exchanger: Potassium tetrakis(4-chlorophenyl)borate.
- Membrane Casting: Drop-cast the prepared ISM cocktail onto the solid-contact layer and allow the solvent to evaporate, forming a thin, uniform membrane.
- Enzyme Immobilization: Immobilize the enzyme Urease on top of the ISM. This can be done by cross-linking a urease solution with Bovine Serum Albumin (BSA) and glutaraldehyde, forming a gel layer over the membrane.
- Potentiometric Measurement: Condition the biosensor in a mild buffer. Connect the SC-ISE and a separate, stable reference electrode (e.g., Ag/AgCl) to a high-impedance potentiometer. Measure the potential (EMF) in a series of standard urea solutions with gentle stirring.
- Data Analysis: Plot the measured EMF (mV) versus the logarithm of the urea concentration. The slope of the linear region should be close to the Nernstian value (~59 mV/decade for NH₄⁺). The LOD and dynamic range can be derived from this calibration plot.
Fabrication of a Conductometric Urease Microbiosensor
Objective: To create a miniaturized, differential conductometric biosensor for urea detection using interdigitated electrodes (IDEs).
- IDE Transducer Fabrication: Utilize standard thin-film photolithography to fabricate pairs of gold or platinum IDEs on an insulating substrate (e.g., glass or silicon/silicon oxide). The fingers should be closely spaced (e.g., 5-10 µm) to maximize sensitivity to surface conductivity changes [1].
- Differential Setup: Use two identical IDE structures on the same chip. One will serve as the working transducer, and the other as the reference.
- Enzyme Immobilization: Functionalize the working IDE with Urease. A common method is cross-linking: apply a solution of Urease, BSA, and glutaraldehyde onto the working IDE surface. The reference IDE should be coated with inactivated urease (e.g., heat-denatured) or just BSA and glutaraldehyde, to account for non-specific conductivity changes.
- Measurement System: Connect both IDEs to an impedance analyzer or a custom circuit capable of measuring conductance at a low-amplitude AC voltage (e.g., 10-50 mV, 1-10 kHz). Using an AC signal is crucial to prevent electrode polarization and electrolysis [1].
- Conductometric Measurement: Immerse the sensor chip in a weakly buffered or low-ionic-strength solution (to maximize the relative change in conductivity). The solution must be stirred to ensure homogeneity. The conductance is continuously monitored for both IDEs. Inject urea standards. The enzymatic hydrolysis of urea (CO(NH₂)₂ + H₂O → 2NH₄⁺ + CO₃²⁻) produces ionic species, increasing the conductivity at the working IDE.
- Data Analysis: The signal is the differential conductance (Gworking - Greference). Plot this differential signal against urea concentration to obtain a linear calibration curve from which sensitivity and LOD are calculated.
Visualization of Biosensor Operational Principles
The following diagrams illustrate the core working mechanisms and experimental setups for each biosensor type.
Amperometric Biosensor Principle
Potentiometric Biosensor Principle
Conductometric Differential Measurement
The Researcher's Toolkit: Essential Reagents and Materials
The development and fabrication of electrochemical biosensors rely on a suite of specialized reagents and materials. The following table details key components and their functions in a typical biosensor experiment.
Table 2: Essential Research Reagents and Materials for Biosensor Development
| Category | Item | Primary Function in Biosensors |
|---|---|---|
| Biorecognition Elements | Enzymes (e.g., Glucose Oxidase, Urease) | Catalyze specific reactions with the target analyte, providing high selectivity [97] [1]. |
| Antibodies, Aptamers | Bind specifically to target proteins or molecules, used in immunosensors and aptasensors [96]. | |
| Electrode Materials | Gold, Platinum, Glassy Carbon | Serve as the base transducer material for working electrodes due to their excellent conductivity and electrochemical stability. |
| Silver/Silver Chloride (Ag/AgCl) | The standard material for stable reference electrodes [99]. | |
| Nanomaterials | Carbon Nanotubes (CNTs), Graphene Oxide | Enhance electrode surface area, facilitate electron transfer, and improve sensor sensitivity [97] [99]. |
| Gold Nanoparticles, Metal Oxides (e.g., ZnO) | Used for signal amplification and as a matrix for immobilizing biorecognition elements [96] [99]. | |
| Immobilization Matrices | Nafion, Chitosan, PVC | Polymers used to entrap and stabilize biorecognition elements on the transducer surface [97] [96] [99]. |
| Self-Assembled Monolayers (SAMs) | Provide a well-defined, ordered layer for covalent attachment of biomolecules [96]. | |
| Electrochemical Reagents | Redox Mediators (e.g., Ferrocene) | Shuttle electrons between the biorecognition element and the electrode surface, crucial for many amperometric sensors [97]. |
| Ionophores (e.g., Valinomycin for K⁺) | Selective ion carriers embedded in polymeric membranes for potentiometric ion-selective electrodes [99]. | |
| Fabrication | Photoresist, Silicon Wafers | Essential materials for the photolithographic fabrication of miniaturized transducers, especially interdigitated electrodes (IDEs) for conductometric sensors [1]. |
This comparative analysis delineates the distinct operational territories of amperometric, potentiometric, and conductometric biosensors. The choice of transduction method is not a matter of superiority but of application-specific suitability. Amperometric sensors excel where high sensitivity for electroactive species is required, as evidenced by their dominance in glucose monitoring. Potentiometric sensors offer exceptional detection limits for ions and are rapidly advancing through FET-based platforms, making them ideal for ultrasensitive detection of a wide range of biomarkers. Conductometric sensors, with their simple design, ease of miniaturization, and inherent compatibility with differential measurements, present a powerful and often underutilized tool for label-free detection, particularly in environmental monitoring and toxicity assessment where cost and portability are critical.
The future of biosensing lies in the convergence of these technologies with emerging trends such as wearable and self-powered devices [96] [100], the integration of artificial intelligence for data analysis [95], and the continued exploitation of novel nanomaterials to push the boundaries of sensitivity and specificity. For researchers focusing on the fundamentals of conductometric biosensors, the path forward involves leveraging its unique advantages—simplicity and miniaturization—while addressing challenges related to signal stability in complex matrices, thereby solidifying its role in the expanding ecosystem of electrochemical sensing platforms.
Biosensors are analytical devices that integrate a biological recognition element with a transducer to convert a biological response into a quantifiable electrical signal [11] [101]. The performance and applicability of a biosensor are fundamentally dictated by its transduction mechanism. This review provides a comparative analysis of two prominent biosensor categories: conductometric biosensors, which are a subset of electrochemical sensors, and optical biosensors, with a focus on Surface Plasmon Resonance (SPR) and fluorescence-based techniques. The selection of an appropriate sensing modality is critical for researchers and drug development professionals, as it impacts sensitivity, cost, complexity, and suitability for specific applications, from point-of-care diagnostics to real-time biomolecular interaction analysis.
Fundamental Principles and Mechanisms
Conductometric Biosensors
Conductometric biosensors measure the change in the electrical conductivity (or its inverse, resistivity) of a solution resulting from a biochemical reaction [101]. The core principle involves monitoring the ionic strength variation within the sample medium when a biorecognition event occurs. Typically, an alternating current (AC) voltage is applied across two inert metal electrodes immersed in the test solution, and the resulting current, which is proportional to the solution's conductivity, is measured.
The biological recognition element, such as an enzyme, is immobilized on or near the electrode surface. When the target analyte (e.g., urea, glucose, pesticides) interacts with the bioreceptor, it catalyzes a reaction that produces or consumes ionic species. For instance, the enzymatic hydrolysis of urea by urease produces ammonium and bicarbonate ions, thereby increasing the local ionic strength and electrical conductivity of the solution [101]. This change in conductance is measured and correlated to the analyte concentration.
Optical Biosensors: SPR and Fluorescence
Surface Plasmon Resonance (SPR) Biosensors exploit an optical phenomenon that occurs at the interface between a metal (typically gold or silver) and a dielectric medium (e.g., a buffer solution) [102] [103] [104]. When polarized light strikes this interface under conditions of total internal reflection, it can excite a charge-density wave called a surface plasmon polariton. This excitation leads to a sharp dip in the intensity of the reflected light at a specific resonance angle, which is exquisitely sensitive to the refractive index at the metal surface. When biomolecules (such as proteins or DNA) bind to a ligand immobilized on the metal film, the local refractive index changes, causing a shift in the resonance angle. This shift is monitored in real-time, allowing for label-free detection and kinetic analysis of biomolecular interactions [103] [104].
Fluorescence-Based Biosensors rely on the detection of light emitted by a fluorophore when it returns to its ground state after being excited by a specific wavelength of light [102]. The biorecognition event is transduced into a measurable fluorescent signal through various mechanisms:
- Fluorescence Resonance Energy Transfer (FRET): A non-radiative energy transfer from an excited donor fluorophore to a nearby acceptor molecule. Binding-induced changes in proximity modulate the efficiency of this transfer, leading to a change in the donor or acceptor emission intensity [8].
- Quenching/De-quenching: The fluorescence signal is suppressed (quenched) or restored (de-quenched) upon analyte binding.
- Intensity and Lifetime Changes: The binding event directly alters the intensity or the fluorescence lifetime of the reporter molecule.
These sensors are known for their high sensitivity and capability for multiplexing [101].
Comparative Performance Analysis
The table below summarizes the key characteristics of conductometric, SPR, and fluorescence biosensors to facilitate a direct comparison.
Table 1: Comparative Analysis of Biosensor Transduction Mechanisms
| Feature | Conductometric Biosensors | SPR Biosensors | Fluorescence Biosensors |
|---|---|---|---|
| Transduction Principle | Measurement of solution conductivity changes due to ionic activity [101] | Measurement of refractive index changes at a metal-dielectric interface [102] [104] | Measurement of photon emission from excited fluorophores [102] |
| Label Requirement | Label-free | Label-free [104] | Requires fluorescent labels [101] |
| Sensitivity | Moderate | High (can detect fg/mL) [105] [103] | Very High (single-molecule level possible) [101] |
| Real-time Monitoring | Limited | Excellent (kinetics in real-time) [104] | Good |
| Multiplexing Capability | Low | Moderate | High [101] |
| Throughput | Low | Moderate | High |
| Sample Matrix Effect | High (susceptible to ionic interference) [101] | Low to Moderate | Moderate (can have autofluorescence) |
| Complexity & Cost | Low | High | Moderate to High |
| Primary Applications | Environmental monitoring, simple metabolite detection [101] | Biomolecular interaction analysis, kinetic studies, clinical diagnostics [103] [104] | High-throughput screening, cellular imaging, DNA sequencing [101] |
Experimental Protocols
Generic Protocol for a Conductometric Urea Biosensor
This protocol outlines the development and measurement process for a typical enzyme-based conductometric biosensor [101].
1. Bioreceptor Immobilization:
- Electrode Fabrication: Pattern two identical interdigitated electrodes (IDEs) on an insulating substrate (e.g., glass or silicon) using photolithography. Gold or platinum is commonly used for its chemical inertness.
- Surface Functionalization: Clean the IDEs with oxygen plasma. Immerse the electrodes in a solution of (3-aminopropyl)triethoxysilane (APTES) to create an amine-functionalized surface.
- Enzyme Immobilization: Activate the aminated surface with glutaraldehyde. Then, incubate the electrode in a phosphate buffer solution containing the enzyme urease (e.g., 5 mg/mL) for several hours. The glutaraldehyde crosslinks the enzyme to the surface. Rinse thoroughly with buffer to remove any physically adsorbed enzyme.
2. Measurement Setup:
- Connect the IDE to an impedance analyzer or a custom circuit capable of applying a small AC voltage (e.g., 10-50 mV) over a frequency range (e.g., 100 Hz to 1 MHz).
- Place the sensor in a measurement cell with a fixed volume of buffer.
3. Data Acquisition and Analysis:
- Introduce the urea sample of known concentration into the cell.
- Monitor the change in conductance (G) over time. The rate of conductance change or the steady-state conductance value is proportional to the urea concentration.
- Construct a calibration curve by measuring the response to a series of standard urea solutions.
Generic Protocol for an SPR-based Immunosensor
This protocol describes a standard sandwich immunoassay for detecting a target antigen, such as a cancer biomarker, using an SPR biosensor [103] [104].
1. Sensor Surface Functionalization:
- Use a commercial SPR sensor chip with a gold film.
- Inject a solution of carboxymethylated dextran to form a hydrogel matrix on the gold surface.
- Activate the carboxyl groups on the dextran layer with a mixture of N-ethyl-N'-(3-dimethylaminopropyl)carbodiimide (EDC) and N-hydroxysuccinimide (NHS).
- Immobilize the capture antibody (e.g., 10-100 µg/mL in sodium acetate buffer, pH 4.5-5.5) onto the activated surface via amine coupling. Block any remaining active esters with ethanolamine.
2. Binding Kinetics Measurement:
- Use a continuous flow of running buffer (e.g., HBS-EP, pH 7.4) to maintain a stable baseline.
- Inject a series of concentrations of the antigen (analyte) over the sensor surface for a set contact time (e.g., 3-5 minutes).
- Monitor the SPR angle shift (in Resonance Units, RU) in real-time during the association phase.
- Switch back to running buffer to initiate the dissociation phase and monitor the signal decrease.
- Regenerate the surface for the next cycle by injecting a mild regeneration solution (e.g., 10 mM glycine-HCl, pH 2.0) to remove bound analyte without damaging the immobilized antibody.
3. Data Analysis:
- Process the sensorgrams by subtracting signals from a reference flow cell.
- Fit the resulting binding curves globally to a 1:1 Langmuir binding model using the sensor's software to determine the association rate constant (ka), dissociation rate constant (kd), and equilibrium dissociation constant (KD).
Signaling Pathways and Workflows
The following diagrams illustrate the fundamental operational principles of each biosensor type.
Conductometric Biosensor Workflow
Diagram 1: Conductometric biosensor signal transduction pathway.
SPR Biosensor Workflow
Diagram 2: SPR biosensor signal transduction pathway.
The Scientist's Toolkit: Essential Research Reagents
The table below lists key reagents and materials required for developing and operating the biosensors discussed, based on the protocols above.
Table 2: Essential Research Reagents for Biosensor Development
| Reagent/Material | Function/Description | Example Use Case |
|---|---|---|
| Interdigitated Electrodes (IDEs) | Transducer element; paired microelectrodes to measure solution conductivity [101] | Core sensing element in conductometric biosensors. |
| Urease Enzyme | Biorecognition element; catalyzes hydrolysis of urea into ions [101] | Detection of urea in conductometric biosensors. |
| (3-Aminopropyl)triethoxysilane (APTES) | Silane coupling agent; provides surface amine groups for biomolecule immobilization [101] | Functionalizing electrode surfaces in conductometric and other electrochemical biosensors. |
| Glutaraldehyde | Crosslinking agent; links amine-containing biomolecules to aminated surfaces [101] | Immobilizing enzymes or antibodies on sensor surfaces. |
| SPR Sensor Chip (Gold Film) | Optical transducer; thin gold layer on glass substrate where plasmon resonance occurs [104] | Core component of any SPR biosensor system. |
| Capture Antibody | Biorecognition element; specifically binds to target analyte (antigen) [103] | Immobilized on SPR chip or fluorescent assay plates for specific detection. |
| N-ethyl-N'-(3-dimethylaminopropyl)carbodiimide (EDC) | Carboxyl group activator; forms active O-acylisourea intermediate for coupling with amines. | Used with NHS for covalent immobilization of biomolecules on carboxymethylated dextran SPR chips. |
| N-hydroxysuccinimide (NHS) | Stabilizer; reacts with EDC-activated carboxyls to form a more stable amine-reactive NHS ester. | Used with EDC for covalent immobilization of biomolecules on carboxymethylated dextran SPR chips. |
| Fluorescent Dye/Label (e.g., Cyanine, FITC) | Signal reporter; emits light at a specific wavelength upon excitation. | Labeling antibodies or DNA probes in fluorescence-based assays. |
Conductometric and optical (SPR, fluorescence) biosensors offer distinct advantages and limitations, making them suitable for different application niches. Conductometric biosensors provide a low-cost, simple platform ideal for detecting analytes involved in net ionic changes, particularly in resource-limited settings. In contrast, SPR biosensors excel in providing rich, label-free data on biomolecular interactions in real-time, which is invaluable for basic research and drug development. Fluorescence biosensors offer unparalleled sensitivity and multiplexing capabilities, making them the workhorse for high-throughput screening and clinical diagnostics. The choice between these technologies is a trade-off between sensitivity, cost, operational complexity, and the specific information required (e.g., simple concentration vs. binding kinetics). Future advancements will likely involve the integration of these transduction methods with microfluidics, nanotechnology, and artificial intelligence to create more powerful, miniaturized, and intelligent sensing systems [105].
Evaluating Cost-Effectiveness, Multiplexing Capability, and Suitability for Point-of-Care Use
Biosensors have emerged as transformative analytical tools that integrate a biological recognition element with a physicochemical transducer to provide quantitative or semi-quantitative analytical information [4]. Within this diverse field, conductometric biosensors represent a specific technological approach that detects changes in the ionic composition of a solution resulting from biochemical reactions [1]. The fundamental principle involves measuring electrical conductivity or resistivity changes between two electrodes when a biological recognition event occurs in the sensing environment. These sensors have gained increasing attention due to their simplicity of design, compatibility with miniaturization, and cost-effectiveness for mass production [1] [45].
The evaluation of conductometric biosensors through the critical lenses of cost-effectiveness, multiplexing capability, and point-of-care suitability provides a structured framework for assessing their potential in real-world applications. This technical review examines these three interconnected domains to establish a comprehensive understanding of how conductometric biosensing platforms can be engineered to address pressing diagnostic needs across healthcare, environmental monitoring, and food safety sectors. By synthesizing recent technological advances with fundamental operational principles, this analysis aims to provide researchers and development professionals with strategic insights for optimizing conductometric biosensor design and implementation.
Technology Fundamentals and Working Principles
Basic Components and Operational Mechanism
Conductometric biosensors belong to the broader category of electrochemical biosensors but are distinguished by their specific transduction method. These systems typically consist of two metal electrodes separated by a certain distance and a biological recognition element immobilized between them [1]. The operational principle is based on monitoring changes in the ionic strength of the solution between the electrodes resulting from biochemical reactions. When an alternating current (AC) voltage is applied, the resulting current flow depends on the ionic composition within the measurement chamber [1].
The fundamental mechanism can be described by the following relationship. The conductance (G) of an electrolyte solution is given by: [G = F \times Σ(zi \times ci \times ui)] where F is Faraday's constant, and for each ion i, zi is the charge number, ci is the concentration, and ui is the mobility [1]. Bio-recognition events that alter any of these parameters, particularly ion concentration (c_i), will produce a measurable change in conductance.
Transducer Design and Material Considerations
The interdigitated electrode structure represents the most common and effective design for conductometric transducers [1]. This configuration consists of two comb-like electrode structures facing each other with digits interlocked but not touching. This design maximizes the electrode surface area and creates an extended sensing region with efficient field lines for sensitivity enhancement.
Table 1: Key Advantages of Conductometric Biosensors
| Feature | Technical Advantage | Application Benefit |
|---|---|---|
| Miniaturization Potential | Thin-film electrodes suitable for microfabrication | Enables portable, handheld devices |
| Reference Electrode Elimination | No need for reference electrode compared to other electrochemical methods | Simplifies device architecture and reduces costs |
| Low Power Operation | Driving voltage can be very low (e.g., 10-100 mV) | Ideal for battery-powered portable devices |
| Differential Measurement Compatibility | Background conductivity and temperature effects can be compensated | Improves accuracy in complex real-world samples |
| Material Simplicity | Standard metal electrodes (gold, platinum, carbon) without special coatings | Reduces manufacturing complexity and cost |
The electrode material selection balances conductivity, biocompatibility, and fabrication costs. Gold is frequently used due to its excellent conductivity and well-established surface functionalization chemistry, though carbon-based materials and platinum represent alternatives with different cost-benefit trade-offs [1] [3].
Cost-Effectiveness Analysis
Manufacturing and Implementation Economics
The economic evaluation of conductometric biosensors reveals significant advantages over alternative sensing platforms. The manufacturing process leverages standard thin-film technology, which is well-established in the microelectronics industry, enabling high-volume production at low unit costs [1]. This technological approach eliminates the need for expensive noble metals or complex optical components that characterize many alternative biosensing platforms.
When deployed in point-of-care settings, conductometric biosensors demonstrate compelling economic benefits through reduced reagent consumption facilitated by microfluidic integration and elimination of sophisticated laboratory instrumentation [106]. The operational costs are further minimized by the technology's compatibility with low-power electronics, enabling operation from battery sources in resource-limited environments where reliable electricity may be unavailable.
Table 2: Cost Structure Analysis for Biosensor Technologies
| Cost Component | Conductometric Biosensors | Optical Biosensors (e.g., SPR) | Traditional Laboratory Methods |
|---|---|---|---|
| Transducer Fabrication | Low-cost (standard lithography) | High-cost (precision optics, gold films) | N/A (instrument-based) |
| Instrumentation | Simple circuitry, low power | Complex optical alignment, lasers | Bulky, expensive equipment |
| Consumables | Minimal reagent requirements | Specialized flow cells, coupling fluids | High reagent volumes |
| Personnel Requirements | Minimal training needed | Technical expertise required | Professional laboratory staff |
| Throughput vs. Cost Trade-off | Suitable for decentralized testing | Centralized, high-throughput | Batch processing, high overhead |
The broader biosensors market context underscores the economic potential of cost-effective platforms. With the global biosensors market projected to grow from USD 31.8 billion in 2025 to USD 76.2 billion by 2035 at a CAGR of 9.1%, electrochemical biosensors currently dominate with a 71.1% revenue share, due largely to their established role in delivering "precise, reproducible measurements" with "cost advantages relative to optical and piezoelectric alternatives" [107].
Lifecycle and Total Cost of Ownership Considerations
A comprehensive cost-effectiveness assessment must extend beyond initial manufacturing expenses to encompass the total ownership costs. Conductometric biosensors exhibit advantages across multiple dimensions of lifecycle costs. Their robust physical design without delicate optical components enhances durability and reduces failure rates in field deployments. The minimal sample preparation requirements decrease the need for ancillary equipment and consumables, while the rapid measurement capabilities increase testing throughput without proportional cost increases [106] [45].
In clinical diagnostics applications, the economic analysis must also incorporate the cost of mistreatment resulting from diagnostic errors. The high specificity and sensitivity of modern conductometric biosensors help minimize false positives and negatives, reducing unnecessary treatments and clinical follow-up expenses [106]. This economic benefit is particularly pronounced in antimicrobial resistance management, where rapid conductometric testing can guide appropriate antibiotic selection, improving patient outcomes while containing healthcare costs.
Multiplexing Capabilities
Technological Approaches for Multianalyte Detection
Multiplexing capability represents a critical performance parameter that significantly enhances diagnostic efficiency by enabling simultaneous detection of multiple analytes in a single assay [108]. Conductometric biosensors achieve multiplexing through several strategic approaches:
Spatial multiplexing involves patterning multiple distinct biological recognition elements (e.g., antibodies, aptamers, enzymes) at different physical locations on the sensor surface, with each location corresponding to a specific analyte [108]. This approach typically employs arrays of interdigitated electrode pairs, each functionalized with different receptors and connected to independent measurement channels. The fabrication challenge lies in ensuring precise deposition of different biorecognition elements without cross-contamination while maintaining consistent sensor-to-sensor performance.
Temporal multiplexing utilizes differences in reaction kinetics between various biological recognition events to distinguish between multiple analytes, potentially reducing the physical sensor footprint. However, this approach introduces computational complexity in signal deconvolution and may require more sophisticated data processing algorithms, including machine learning techniques for pattern recognition [45].
Conceptual multiplexing represents an advanced approach where the combined pattern of responses from multiple sensing elements generates a diagnostic signature rather than simply reporting individual analyte concentrations [108]. This strategy is particularly valuable for complex diagnostic scenarios where disease states correlate with patterns across multiple biomarkers rather than individual analyte thresholds.
Implementation Considerations and Limitations
While multiplexing enhances diagnostic efficiency, several technical challenges must be addressed. Cross-talk between adjacent sensing elements can compromise measurement accuracy, necessitating careful sensor design with adequate spatial separation or implementation of differential measurement schemes [1] [108]. Variations in immobilization efficiency across different recognition elements can lead to inconsistent sensor responses, requiring optimized and standardized functionalization protocols.
The inherent nonspecificity of conductivity measurements presents a fundamental challenge for multiplexed detection, as conductivity changes alone do not inherently identify the specific ions or charged species responsible. This limitation is typically addressed through specificity engineering at the biorecognition level—using highly specific biological receptors for each target—combined with differential measurement schemes that compensate for background conductivity variations [1].
Figure 1: Multiplexing Strategies for Conductometric Biosensors
Suitability for Point-of-Care Applications
Compliance with ASSURED Criteria
The World Health Organization has established the ASSURED criteria (Affordable, Sensitive, Specific, User-friendly, Rapid and robust, Equipment-free, and Deliverable to end-users) as a benchmark for ideal point-of-care diagnostics [45]. Conductometric biosensors demonstrate strong alignment with these requirements:
Affordability is achieved through the economic advantages previously discussed, including low-cost manufacturing and minimal reagent requirements. Sensitivity continues to improve with nanotechnology integration, with modern conductometric biosensors achieving detection limits comparable to more complex laboratory methods for many analytes [45] [3]. Specificity is engineered through the selection of highly specific biological recognition elements, including antibodies, aptamers, or molecularly imprinted polymers, with cross-reactivity minimized through surface chemistry optimization [45].
The user-friendly nature of conductometric biosensors is enhanced by their minimal sample preparation requirements and straightforward operation. Most systems require only simple sample application, with the measurement occurring automatically. Rapid and robust performance is inherent to the technology, with most assays completed within minutes rather than hours, and the solid-state design providing resistance to mechanical shock and environmental variations [106] [45].
While not completely equipment-free, conductometric systems require only minimal electronic instrumentation that can be packaged in compact, portable formats. Finally, the deliverability to end-users is facilitated by the stability of the biosensor components, with many systems maintaining performance during storage and transportation without stringent refrigeration requirements [106].
Implementation in Resource-Limited Settings
The application of conductometric biosensors in low-resource environments represents a particularly compelling use case [106]. These settings impose additional constraints including limited refrigeration for reagent storage, unreliable power supplies, minimal technical expertise among users, and challenging environmental conditions. Conductometric biosensors address these constraints through ambient temperature stability, low power requirements, simplified operational protocols, and robust packaging.
In infectious disease management, conductometric biosensors have demonstrated potential for detecting pathogens including malaria, HIV, and influenza [45] [24]. The rapid detection capability enables timely treatment initiation while reducing unnecessary antibiotic prescriptions—a critical factor in addressing antimicrobial resistance. During the COVID-19 pandemic, the value of rapid, decentralized testing became particularly evident, accelerating development of conductometric and other electrochemical biosensing platforms for respiratory virus detection [45] [109].
Experimental Protocols and Methodologies
Standard Fabrication and Functionalization Protocol
A representative protocol for developing a multiplexed conductometric biosensor for pathogen detection illustrates the key technical considerations:
Electrode Fabrication:
- Clean substrate (glass, silicon, or ceramic) using oxygen plasma treatment for 5-10 minutes
- Deposit adhesion layer (chromium or titanium) via sputtering or evaporation (10-20 nm thickness)
- Deposit electrode metal (gold or platinum) to 100-200 nm thickness using the same method
- Pattern interdigitated electrode structures using photolithography and wet or dry etching
- Typical digit width: 5-20 µm
- Typical gap between digits: 5-20 µm
- Number of digit pairs: 10-50
- Insulate contact pads while leaving sensing region exposed
Surface Functionalization:
- Clean electrode surface with oxygen plasma or piranha solution (Caution: highly corrosive)
- Modify surface with self-assembled monolayers (e.g., thiol compounds for gold surfaces)
- Activate surface using EDC/NHS or similar chemistry for biomolecule attachment
- Immobilize biological recognition elements (antibodies, aptamers, enzymes) via spotting or microfluidic patterning
- Block nonspecific binding sites with BSA, casein, or other blocking agents
- Validate immobilization efficiency using electrochemical impedance spectroscopy or equivalent method
Measurement and Data Analysis Protocol
Sample Preparation and Measurement:
- Prepare standards/samples in appropriate buffer with consistent ionic strength
- Apply 50-100 µL sample to sensor surface, ensuring complete coverage of electrode area
- Apply low-amplitude AC voltage (10-50 mV) at frequency 10 Hz-100 kHz
- Monitor conductance changes over time (typically 2-10 minutes)
- Rinse with measurement buffer between samples for reusable sensors
- Perform triplicate measurements for each sample
Data Analysis:
- Record baseline conductance (G₀) before analyte addition
- Measure maximum conductance change (ΔG) or initial rate of conductance change
- Normalize signals to account for sensor-to-sensor variation
- Generate calibration curve from standard concentrations
- Calculate unknown concentrations from calibration curve
- For multiplexed sensors, deconvolute signals using predetermined response patterns
Table 3: Essential Research Reagent Solutions
| Reagent Category | Specific Examples | Function in Biosensor Development |
|---|---|---|
| Electrode Materials | Gold, platinum, carbon inks | Form the conductive transducer elements |
| Surface Modification | Thiol compounds (e.g., 11-MUA), silanes | Create functional groups for biomolecule attachment |
| Crosslinkers | EDC, NHS, glutaraldehyde | Covalently conjugate biological recognition elements |
| Biological Receptors | Antibodies, aptamers, enzymes | Provide molecular recognition specificity |
| Blocking Agents | BSA, casein, ethanolamine | Reduce nonspecific binding |
| Signal Amplification | Enzyme-labeled conjugates, nanoparticles | Enhance detection sensitivity |
Future Perspectives and Research Directions
The evolution of conductometric biosensing platforms continues to address existing limitations while expanding application boundaries. Several promising research directions are shaping the next generation of these devices:
Nanomaterial Integration represents a powerful strategy for enhancing sensor performance. Nanostructured materials including graphene, carbon nanotubes, and metal nanoparticles increase the effective electrode surface area, improving sensitivity and lowering detection limits [45] [3]. These materials also facilitate novel signal amplification approaches and can enhance the stability of immobilized biological recognition elements.
Advanced Manufacturing Techniques including screen printing, inkjet printing, and roll-to-roll processing enable high-volume, low-cost production of disposable electrode arrays [107]. These approaches facilitate custom sensor design for specific applications while maintaining manufacturing economies of scale. The integration of conductometric sensors with microfluidic systems enables automated sample processing with minimal user intervention, a critical requirement for effective point-of-care deployment.
Artificial Intelligence and Data Analytics integration addresses the interpretation challenges associated with complex sample matrices and multiplexed detection [45]. Machine learning algorithms can identify patterns in conductometric response data that correlate with specific diagnostic outcomes, potentially enabling more sophisticated analysis than simple concentration measurements.
Novel Biorecognition Elements including engineered aptamers, peptide ligands, and molecularly imprinted polymers offer alternatives to traditional antibodies with potential advantages in stability, cost, and customization [45]. These next-generation recognition elements may expand the range of detectable analytes while improving sensor shelf-life in challenging environmental conditions.
Figure 2: Future Research Directions for Conductometric Biosensors
Conductometric biosensors represent a maturing technology platform that effectively balances performance, cost, and practical implementation requirements. Their inherent compatibility with miniaturization, low-power operation, and mass manufacturing positions them as compelling solutions for decentralized testing applications across healthcare, environmental monitoring, and food safety sectors.
The ongoing integration of nanomaterials, advanced manufacturing methods, and artificial intelligence continues to address historical limitations while expanding application possibilities. For researchers and development professionals, the strategic optimization of conductometric biosensors requires careful attention to the interrelationships between cost-effectiveness, multiplexing capability, and point-of-care suitability—rather than treating these as separate design considerations.
As the global biosensors market continues its robust growth, conductometric platforms are positioned to play an increasingly significant role in the evolving diagnostics landscape. Their particular combination of technical performance and economic accessibility makes them especially valuable for applications in resource-limited settings, where they can deliver sophisticated analytical capabilities without requiring complex infrastructure or highly trained personnel. Through continued interdisciplinary collaboration between materials science, electronics engineering, biochemistry, and data analytics, conductometric biosensors will continue to evolve toward increasingly sophisticated, accessible, and impactful diagnostic solutions.
Conclusion
Conductometric biosensors represent a powerful and versatile analytical platform with significant potential to advance biomedical research and drug development. Their core strengths lie in their direct transduction mechanism, operational simplicity, and compatibility with miniaturized, cost-effective systems. While challenges related to sensitivity in complex matrices and sensor-to-sensor reproducibility persist, ongoing innovations in nanotechnology, surface chemistry, and data analytics through machine learning are providing robust solutions. The future of this technology points toward the creation of highly integrated, intelligent systems. For drug development professionals, this translates to the prospect of closed-loop, biosensor-integrated drug delivery systems for personalized therapy, sophisticated tools for real-time biomarker monitoring in clinical trials, and robust, deployable sensors for environmental and food safety monitoring within the pharmaceutical supply chain. Continued interdisciplinary collaboration is essential to translate these promising laboratory prototypes into validated, commercially viable tools that can improve health outcomes.
References
- 1. Conductometric Microbiosensors for Environmental ... [https://pmc.ncbi.nlm.nih.gov/articles/PMC3673432/]
- 2. Conductometric Biosensors - (Biomedical Engineering II) [https://fiveable.me/key-terms/biomedical-engineering-ii/conductometric-biosensors]
- 3. Electrochemical Biosensors: A Prospective Insight to ... [https://www.sciencedirect.com/science/article/abs/pii/S2451910325001358]
- 4. Fundamentals of bio-electrochemical sensing [https://www.sciencedirect.com/science/article/pii/S266682112300073X]
- 5. Versatile conductometric biosensors for rapid and selective ... [https://www.sciencedirect.com/science/article/pii/S0956566324005219]
- 6. Scheme of Experimental Setup for Conductometric ... [https://bio-protocol.org/exchange/minidetail?id=511289&type=30]
- 7. Electrochemical Sensors and Biosensors - PMC [https://pmc.ncbi.nlm.nih.gov/articles/PMC3264821/]
- 8. Advancing protein biosensors: redefining detection through ... [https://pubs.rsc.org/en/content/articlehtml/2025/ra/d4ra06791f]
- 9. Selection of bioreceptors for nanobiosensors [https://www.sciencedirect.com/science/article/abs/pii/B9780443330308000019]
- 10. Nucleic Acid Aptamer-Based Biosensors: A Review - PMC [https://pmc.ncbi.nlm.nih.gov/articles/PMC10741014/]
- 11. Introduction to biosensors - PMC [https://pmc.ncbi.nlm.nih.gov/articles/PMC4986445/]
- 12. Ionic Strength Sensing in Living Cells - PMC [https://pmc.ncbi.nlm.nih.gov/articles/PMC5653947/]
- 13. Transducer Technologies for Biosensors and Their ... [https://www.mdpi.com/2079-6374/12/6/385]
- 14. Biosensors, Artificial Intelligence Biosensors, False Results ... [https://pmc.ncbi.nlm.nih.gov/articles/PMC12025796/]
- 15. Bio-Inspired Ionic Sensors: Transforming Natural Mechanisms ... [https://pmc.ncbi.nlm.nih.gov/articles/PMC11904071/]
- 16. Portable 3D-printed sensor to measure ionic strength and ... [https://www.sciencedirect.com/science/article/abs/pii/S0308814620324456]
- 17. Conducting polymers in biosensing: A review [https://www.sciencedirect.com/science/article/pii/S2667022424001865]
- 18. Optical conductivity-based ultrasensitive mid-infrared ... [https://www.nature.com/articles/s41377-018-0066-1]
- 19. Electrochemical Biosensors - Sensor Principles and ... [https://pmc.ncbi.nlm.nih.gov/articles/PMC3663003/]
- 20. Immobilization strategies to develop enzymatic biosensors [https://www.sciencedirect.com/science/article/abs/pii/S073497501100156X]
- 21. Electrochemical biosensors: perspective on functional ... [https://pmc.ncbi.nlm.nih.gov/articles/PMC7001310/]
- 22. AI-Enhanced Surface Functionalization in Biosensors [https://www.sciencedirect.com/science/article/abs/pii/S0165993625003887]
- 23. Enzyme Immobilization by Inkjet Printing on Reagentless ... [https://www.mdpi.com/2079-6374/14/4/168]
- 24. Electrochemical biosensors based on the 3D immobilization of ... [https://pubs.rsc.org/en/content/articlehtml/2025/ra/d5ra03744a]
- 25. Immobilization of Enzyme Electrochemical Biosensors and ... [https://pmc.ncbi.nlm.nih.gov/articles/PMC10526424/]
- 26. A novel conductometric biosensor based on hybrid organic ... [https://www.sciencedirect.com/science/article/abs/pii/S1567539425000805]
- 27. Biosensor Market Size, Growth, Share & Industry Trends ... [https://www.mordorintelligence.com/industry-reports/biosensor-market]
- 28. Biosensors Market Size & Share Report, 2025 – 2034 [https://www.gminsights.com/industry-analysis/biosensors-market]
- 29. Biosensors, Volume 15, Issue 5 (May 2025) – 69 articles [https://www.mdpi.com/2079-6374/15/5]
- 30. Biosensors Market Size to Reach USD 69.67 Billion By 2034 [https://www.biospace.com/press-releases/biosensors-market-size-to-reach-usd-69-67-billion-by-2034]
- 31. sciencedirect.com/science/article/pii/B9780857095015500064 [https://www.sciencedirect.com/science/article/pii/B9780857095015500064]
- 32. Biosensors and Microfluidic Biosensors: From Fabrication ... [https://pmc.ncbi.nlm.nih.gov/articles/PMC9313327/]
- 33. (PDF) The Development of Conductometric for... Biosensor [https://www.academia.edu/144718442/The_Development_of_Conductometric_Biosensor_for_Determination_of_Uric_Acid_Concentration_in_Human_Serum_Using_Screen_Printed_Carbon_Electrode_Spce_Nata_De_Coco]
- 34. Graphene-Based Biosensors: Enabling the Next Generation of ... [https://pmc.ncbi.nlm.nih.gov/articles/PMC12467994/]
- 35. Design and fabrication of an electrochemical nano ... [https://www.sciencedirect.com/science/article/pii/S2590137025001220]
- 36. Improvement of the optical cavity-based biosensor's limit ... [https://www.nature.com/articles/s41598-025-92151-0]
- 37. Recent advances in graphene-based electrochemical ... [https://www.sciencedirect.com/science/article/pii/S2451910325000961]
- 38. Noble metal nanoparticles in biosensors: recent studies ... [https://pmc.ncbi.nlm.nih.gov/articles/PMC5766271/]
- 39. Disposable biosensors based on metal nanoparticles [https://www.sciencedirect.com/science/article/pii/S2666351122000146]
- 40. Graphene-based LSPR sensors enable polarization ... [https://www.nature.com/articles/s41598-025-17108-9]
- 41. Metal Nanoparticles' Biological Activity and Pharmaceutical ... [https://www.mdpi.com/1424-8247/18/10/1537]
- 42. Biosensors, Volume 15, Issue 9 (September 2025) [https://www.mdpi.com/2079-6374/15/9]
- 43. Enhancement and optimization of a graphene-based ... [https://www.nature.com/articles/s41598-025-20570-0]
- 44. Exploring Biosensors: Distinctive Features and Emerging ... [https://www.sciencedirect.com/science/article/abs/pii/S0003269725002325]
- 45. Point-of-care biosensors for infectious disease diagnosis [https://pubs.rsc.org/en/content/articlehtml/2025/ra/d5ra03897a?page=search]
- 46. Novel highly sensitive conductometric biosensor based on ... [https://www.sciencedirect.com/science/article/pii/S0925400522006657]
- 47. Integration of Artificial Intelligence in Biosensors for Enhanced ... [https://pmc.ncbi.nlm.nih.gov/articles/PMC12564411/]
- 48. Recent advances in nanomaterial-based optical ... [https://www.sciencedirect.com/science/article/pii/S2095177925001662]
- 49. Biosensors, Volume 15, Issue 7 (July 2025) – 74 articles [https://www.mdpi.com/2079-6374/15/7]
- 50. An Experimental Framework for Developing Point-of-Need ... [https://pmc.ncbi.nlm.nih.gov/articles/PMC9688365/]
- 51. Biosensors, Volume 15, Issue 11 (November 2025) [https://www.mdpi.com/2079-6374/15/11]
- 52. Research Progress on Multiplexed Pathogen Detection ... [https://pmc.ncbi.nlm.nih.gov/articles/PMC12191064/]
- 53. Next-generation biosensors for infectious disease ... [https://www.sciencedirect.com/science/article/abs/pii/S1877117325000766]
- 54. Emerging therapeutic drug monitoring technologies [https://pmc.ncbi.nlm.nih.gov/articles/PMC10965556/]
- 55. Optical Biosensors for Therapeutic Drug Monitoring [https://www.mdpi.com/2079-6374/9/4/132]
- 56. Biosensors for therapeutic drug monitoring: a review. [https://f1000research.com/articles/12-171]
- 57. Biochips on the Move: Emerging Trends in Wearable and ... [https://www.mdpi.com/2079-9292/14/16/3224]
- 58. Current state of the art and future directions for implantable ... [https://pmc.ncbi.nlm.nih.gov/articles/PMC10539032/]
- 59. Biomedical sensing applications of soft, wearable ... [https://www.oaepublish.com/articles/ss.2025.45]
- 60. Implantable biosensors: Advancements and applications [https://www.sciencedirect.com/science/article/pii/S1877117325000870]
- 61. Wearable Smart Sensors Integration with AI and Machine ... [https://www.sciencedirect.com/science/article/pii/S2590137025001384]
- 62. Wearable and implantable microfluidic technologies for ... [https://pubs.rsc.org/en/content/articlelanding/2025/lc/d5lc00525f]
- 63. Adaptation of Conductometric Monoenzyme Biosensor for ... [https://pubmed.ncbi.nlm.nih.gov/39066069/]
- 64. Promising Solutions to Address the Non-Specific ... [https://www.mdpi.com/2227-9040/13/3/92]
- 65. Matrix-insensitive protein assays push the limits of ... [https://pmc.ncbi.nlm.nih.gov/articles/PMC4165514/]
- 66. Everything's under Control: Maximizing Biosensor ... [https://pmc.ncbi.nlm.nih.gov/articles/PMC11840803/]
- 67. A paper biosensor for overcoming matrix effects interfering ... [https://link.springer.com/article/10.1007/s00604-023-06017-1]
- 68. Stability in biosensors derived from domain map analysis of ... [https://pmc.ncbi.nlm.nih.gov/articles/PMC11077358/]
- 69. Review Biosensors and lateral flow immunoassays [https://www.sciencedirect.com/science/article/abs/pii/S0009898125001512]
- 70. Improving the reproducibility, accuracy, and stability of an ... [https://www.sciencedirect.com/science/article/abs/pii/S0956566320301081]
- 71. A Review on Biosensors and Recent Development of ... [https://pmc.ncbi.nlm.nih.gov/articles/PMC7915135/]
- 72. Stability and reproducibility study for the development of ... [https://www.sciencedirect.com/science/article/pii/S2666831925001572]
- 73. A conductometric biosensor for biosecurity [https://www.sciencedirect.com/science/article/abs/pii/S0956566303000204]
- 74. for Quick Detection of Urinary Biomarkers... Conductometric Biosensor [https://pubmed.ncbi.nlm.nih.gov/41123392/]
- 75. (PDF) Development of conductometric array for... biosensor [https://www.academia.edu/33504070/Development_of_conductometric_biosensor_array_for_simultaneous_determination_of_maltose_lactose_sucrose_and_glucose]
- 76. Soft Computing Techniques in Modelling the Influence of pH and... [https://www.intechopen.com/chapters/6801]
- 77. Chapter 9 - Conductometric Enzyme Biosensors ... [https://www.oreilly.com/library/view/electrochemical-biosensors/9789814411462/chapter-67.html]
- 78. On the Blood Components Contributing to the Drift of Electrochemical... [https://pubmed.ncbi.nlm.nih.gov/40591816/]
- 79. The challenge of long-term stability for nucleic acid-based ... [https://www.sciencedirect.com/science/article/pii/S2451910321002167]
- 80. Skin-like drift -free biosensors with stretchable... | Nature Electronics [https://www.nature.com/articles/s41928-025-01465-4?error=cookies_not_supported&code=7f2c2646-ab30-4dac-a554-a83c09cea940]
- 81. New research in continuous biosensing: Long-term stability [https://amf.ch/new-research-in-continuous-biosensing-long-term-stability/]
- 82. Advancement of machine learning algorithms in biosensors [https://www.sciencedirect.com/science/article/abs/pii/S000989812500556X]
- 83. Machine learning assisted biosensing technology [https://pmc.ncbi.nlm.nih.gov/articles/PMC10831501/]
- 84. Machine Learning Algorithms for Prediction of Optical ... [https://pmc.ncbi.nlm.nih.gov/articles/PMC10302917/]
- 85. Conductometric biosensors - ScienceDirect [https://www.sciencedirect.com/science/article/abs/pii/B9780857095015500064]
- 86. On the Determination of Uncertainty and Limit of Detection in ... [https://pmc.ncbi.nlm.nih.gov/articles/PMC6068557/]
- 87. Sensitivity studies and optimization of an impedance- ... [https://www.sciencedirect.com/science/article/pii/S2590137024000438]
- 88. Extending dynamic and operational range of the biosensor ... [https://www.sciencedirect.com/science/article/pii/S2405805X25000596]
- 89. Programming the Dynamic Range of Nanochannel ... [https://pubmed.ncbi.nlm.nih.gov/39494980/]
- 90. Validation of biosensors [https://www.sciencedirect.com/science/article/abs/pii/B9780443153808000059]
- 91. High-performance liquid chromatography–tandem mass spectrometry in the identification and determination of phase I and phase II drug metabolites - PMC [https://pmc.ncbi.nlm.nih.gov/articles/PMC2359828/]
- 92. Machine learning-based prediction and interpretation of ... [https://www.sciencedirect.com/science/article/abs/pii/S0026265X25030048]
- 93. Methods gold standard in clinic millifluidics multiplexed ... [https://www.sciencedirect.com/science/article/pii/S0956566323006437]
- 94. Consumer-grade biosensor validation for examining stress ... [https://pubmed.ncbi.nlm.nih.gov/32489016/]
- 95. Electrochemical Biosensors Insightful Analysis: Trends, ... [https://www.archivemarketresearch.com/reports/electrochemical-biosensors-176203]
- 96. Recent Advances in Potentiometric Biosensing - PMC [https://pmc.ncbi.nlm.nih.gov/articles/PMC8162913/]
- 97. Amperometric Biosensor - an overview [https://www.sciencedirect.com/topics/nursing-and-health-professions/amperometric-biosensor]
- 98. Amperometric Biosensors - (Biomedical Engineering II) [https://fiveable.me/key-terms/biomedical-engineering-ii/amperometric-biosensors]
- 99. New trends in potentiometric sensors: From design to ... [https://www.sciencedirect.com/science/article/abs/pii/S0039914025001092]
- 100. Electrochemical-Based Biosensors 2025-2033 Overview [https://www.datainsightsmarket.com/reports/electrochemical-based-biosensors-914193]
- 101. A Closer Look at Biosensors: A Practical Tutorial for ... [https://www.spectroscopyonline.com/view/a-closer-look-at-biosensors-a-practical-tutorial-for-spectroscopists]
- 102. Microfluidic preparation of optical sensors for biomedical ... [https://pmc.ncbi.nlm.nih.gov/articles/PMC11235902/]
- 103. On the sensing performance improvement in SPR ... [https://www.nature.com/articles/s41598-025-14131-8]
- 104. Nanoplasmonic Biosensors: A Comprehensive Overview ... [https://pmc.ncbi.nlm.nih.gov/articles/PMC12067471/]
- 105. Recent advances in biosensors: structure, principles ... [https://www.sciencedirect.com/science/article/abs/pii/S1046202325001665]
- 106. Assessing the Potential Deployment of Biosensors for Point-of ... [https://pmc.ncbi.nlm.nih.gov/articles/PMC6316672/]
- 107. Biosensors Market Size & Demand Forecast 2025-2035 [https://www.futuremarketinsights.com/reports/biosensors-market]
- 108. Multiplexed lateral flow biosensors: Technological ... [https://www.sciencedirect.com/science/article/abs/pii/S0956566316302962]
- 109. Recent advances and challenges of biosensing in point-of ... [https://pmc.ncbi.nlm.nih.gov/articles/PMC8424413/]