Cross-Reactivity Assessment in Immunosensors and Aptasensors: Strategies, Challenges, and Future Directions
This article provides a comprehensive analysis of cross-reactivity, a critical performance parameter for biosensors used in biomedical research and clinical diagnostics.
Cross-Reactivity Assessment in Immunosensors and Aptasensors: Strategies, Challenges, and Future Directions
Abstract
This article provides a comprehensive analysis of cross-reactivity, a critical performance parameter for biosensors used in biomedical research and clinical diagnostics. Aimed at researchers, scientists, and drug development professionals, it explores the fundamental principles of antibody and aptamer interactions that underpin specificity in immunosensors and aptasensors. The scope spans from foundational concepts and methodological applications to advanced troubleshooting and rigorous validation protocols. By comparing the intrinsic factors and extrinsic optimization strategies that influence cross-reactivity in both sensor types, this review serves as a practical guide for the development of highly specific diagnostic tools, ultimately aiming to reduce false positives and enhance diagnostic accuracy.
Understanding Cross-Reactivity: Fundamental Concepts in Biorecognition
Cross-reactivity presents a fundamental challenge in the development of biosensors for diagnostic, environmental, and pharmaceutical applications. This phenomenon occurs when a biosensor's recognition element (e.g., an antibody or aptamer) binds not only to its intended target analyte but also to structurally similar molecules, potentially leading to false-positive results and inaccurate quantification [1] [2]. For researchers and drug development professionals, understanding and minimizing cross-reactivity is crucial for developing reliable assays. The ideal scenario for any biosensor would be complete specificity for a single target with no cross-reactivity to structurally related analogs, thus guaranteeing accurate determination and avoiding false positives [3]. However, this ideal is rarely achieved in practice, as recognition elements often exhibit varying affinities for molecules sharing similar epitopes or structural motifs.
The clinical and analytical consequences of cross-reactivity can be significant. In diagnostic applications, cross-reactivity can lead to misdiagnosis or inaccurate disease monitoring. In food safety testing, it can result in false detections of antibiotic residues or other contaminants [3]. For pharmaceutical development, cross-reactivity with unintended targets can compromise drug safety profiles. Consequently, characterizing cross-reactivity has become an essential step in biosensor validation, requiring sophisticated experimental designs and careful interpretation of binding data across related compound panels [1] [2].
Comparative Analysis: Immunosensors vs. Aptasensors
Biosensors are primarily classified based on their biorecognition elements, with immunosensors (using antibodies) and aptasensors (using nucleic acid aptamers) representing two prominent technologies with distinct cross-reactivity profiles.
Fundamental Differences and Cross-Reactivity Mechanisms
Table 1: Fundamental Characteristics of Immunosensors and Aptasensors
| Characteristic | Immunosensors | Aptasensors |
|---|---|---|
| Recognition Element | Antibodies (proteins) | Single-stranded DNA or RNA oligonucleotides |
| Production Process | Biological (in vivo) | Chemical (in vitro SELEX) |
| Binding Affinity | High (typically nM range) [3] | Variable (nM to μM range) [3] |
| Specificity Mechanism | Epitope recognition based on structural complementarity | 3D structure formation with target binding pockets |
| Cross-Reactivity Origin | Recognition of similar epitopes on related molecules [1] | Structural similarity between target and non-target molecules |
| Typical Cross-Reactivity | Often significant with close structural analogs [3] | Can be minimized through counter-selection [3] |
Immunosensors utilize antibodies as recognition elements, which are proteins produced by the immune system. Their cross-reactivity stems from the structural flexibility of antibody binding sites, which may accommodate molecules sharing similar molecular features with the target antigen [1]. This becomes particularly problematic when screening for small molecules like antibiotics, where antibodies may exhibit significant cross-reactivity with structurally related compounds [3]. For instance, immunosensors for sulfamethazine (SMZ) typically show high cross-reactivity with sulfamerazine (SMR), which differs by only one methyl group [3].
Aptasensors employ aptamers—single-stranded DNA or RNA molecules selected through Systematic Evolution of Ligands by Exponential Enrichment (SELEX)—as recognition elements [4] [3]. A key advantage of aptamer selection is the intentional incorporation of counter-selection steps, where potential aptamers that bind to structurally similar non-target molecules are deliberately discarded [3]. This process enables the development of aptamers with exceptional specificity, capable of differentiating between molecules differing by only a single functional group [3].
Quantitative Performance Comparison
Table 2: Experimental Cross-Reactivity Data for Antibiotics Detection
| Detection Platform | Target Analyte | Primary Cross-Reactant | Cross-Reactivity | LOD | Reference |
|---|---|---|---|---|---|
| Immunosensor | Sulfamethazine (SMZ) | Sulfamerazine (SMR) | 20-60% [3] | ~1 ng/mL | [3] |
| Immunosensor | Sulfonamides | Various sulfonamides | High (varies by assay format) [1] | - | [1] |
| Aptasensor | Sulfamethazine (SMZ) | 27 tested sulfonamides | Negligible (0%) [3] | 0.92 ng/mL | [3] |
| Multiplex Aptasensor | Imidacloprid | Other neonicotinoids | Minimal (excellent selectivity) [5] | 0.01 ng/mL | [5] |
The comparative data reveal a significant advantage for aptasensors in applications requiring high specificity. The chemiluminescence aptasensor for SMZ demonstrated negligible cross-reactivity with 27 tested sulfonamides, a level of specificity described as "impossible to achieve" with corresponding antibody-based approaches [3]. Similarly, a reduced graphene oxide-based electrochemical aptasensor for multiplex detection of neonicotinoid pesticides (imidacloprid, thiamethoxam, and clothianidin) showed excellent selectivity for all three analytes with minimal cross-reactivity [5].
Experimental Protocols for Cross-Reactivity Assessment
Standard Cross-Reactivity Determination Protocol
The most widely accepted method for quantifying cross-reactivity in competitive assay formats involves comparing the concentration of target analyte and cross-reactant required to produce the same analytical signal [1]. The standard protocol follows these steps:
Dose-Response Curves: Generate complete dose-response curves for both the target analyte and potential cross-reactants under identical assay conditions.
IC50 Determination: Calculate the concentration causing 50% inhibition of the detected signal (IC50) for both the target and cross-reactant.
Cross-Reactivity Calculation: Apply the formula: Cross-reactivity (CR) = [IC50(target analyte) / IC50(tested cross-reactant)] × 100% [1]
Validation: Test cross-reactivity against a comprehensive panel of structurally related compounds to fully characterize assay specificity.
This protocol applies to various biosensing platforms, including enzyme immunoassays, fluorescence polarization immunoassays, and electrochemical sensors [1]. The concentrations of immunoreactants and assay conditions significantly influence cross-reactivity measurements, with assays requiring lower reagent concentrations typically demonstrating higher specificity [1].
SELEX with Counter-Selection for High-Specificity Aptamer Development
The exceptional specificity of aptamers is achieved through intentional selection strategies during the SELEX process:
Library Preparation: Begin with a large library of random single-stranded DNA or RNA sequences (typically 10^14-10^15 different molecules) [4].
Target Immobilization: Immobilize the target molecule on solid supports such as magnetic beads (MB-SELEX) [3].
Positive Selection: Incubate the library with the immobilized target, retaining bound sequences.
Counter-Selection: Critically, incubate the enriched pool with non-target structural analogs to remove cross-reactive sequences [3].
Amplification: PCR amplify the specific binders for the next selection round.
Iteration: Repeat steps 3-5 for 8-15 rounds with increasing selection stringency.
Cloning and Sequencing: Identify individual aptamer sequences for characterization.
Affinity and Specificity Testing: Determine dissociation constants (Kd) and cross-reactivity profiles of selected aptamers [3].
This method yielded SMZ-specific aptamers with Kd values in the nanomolar range (79-274 nM) and negligible cross-reactivity with 27 other sulfonamides [3]. Molecular simulation and docking studies can further clarify the binding mechanism and explain the observed specificity at the structural level [3].
Technological Approaches to Minimize Cross-Reactivity
Assay Format and Condition Optimization
Cross-reactivity is not an intrinsic, fixed property of recognition elements but can be modulated by assay design and conditions [1]. Several strategies can enhance specificity:
Reagent Concentration Modulation: Implementing assays with sensitive detection and low concentrations of antibodies and competing antigens typically results in lower cross-reactivities and higher specificity [1]. Shifting to lower reagent concentrations can decrease cross-reactivities by up to five-fold [1].
Assay Format Selection: Different immunoassay formats (e.g., enzyme immunoassay vs. fluorescence polarization immunoassay) exhibit varying cross-reactivity profiles even when using the same antibodies [1].
Kinetic vs. Equilibrium Measurements: Varying the ratio of immunoreactants' concentrations and shifting from kinetic to equilibrium modes of antigen-antibody reaction can influence cross-reactivity measurements [1].
Heterologous Assay Designs: Using different antigen derivatives in analysis than those used in immunization can narrow specificity spectra in competitive immunoassays [1].
Emerging Technologies and Advanced Materials
Novel biosensing platforms and nanomaterials are providing new avenues for addressing cross-reactivity challenges:
Multiplexed Aptasensors: Advanced platforms like the reduced graphene oxide-based electrochemical aptasensor enable simultaneous detection of multiple analytes (imidacloprid, thiamethoxam, and clothianidin) with high specificity for each target, addressing a key limitation of traditional methods [5].
AI-Optimized Biosensors: Integration of artificial intelligence with electrochemical aptasensors has demonstrated significant improvements in specificity, increasing from 70-80% to 90-98% while reducing false positives and negatives from 15-20% to 5-10% [6].
High-Throughput Platforms: Technologies like the Sensor-Integrated Proteome On Chip (SPOC) enable large-scale kinetic screening of thousands of protein interactions with real-time label-free analysis, facilitating comprehensive cross-reactivity assessment during development [7].
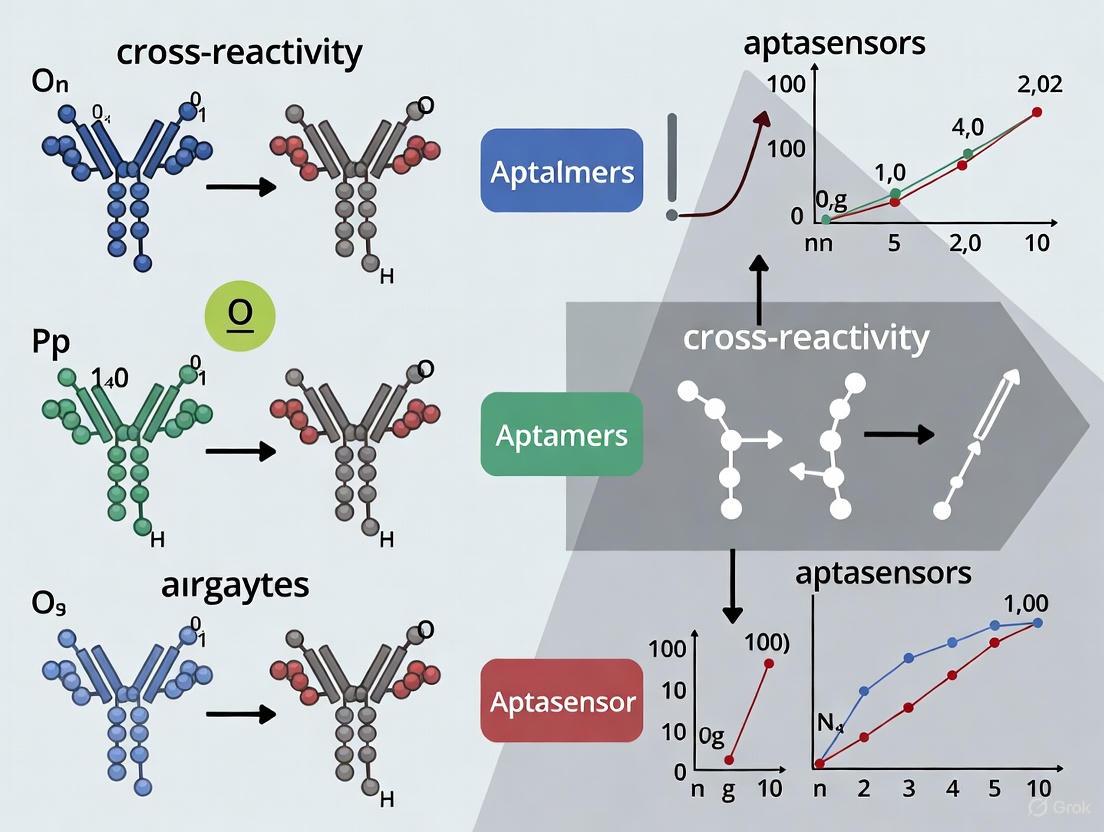
Visualization: Cross-Reactivity Mechanisms and Assessment
This diagram illustrates the fundamental differences in how immunosensors and aptasensors handle structurally similar molecules, along with the SELEX process that enables high-specificity aptamer development through intentional counter-selection against non-target analogs.
The Scientist's Toolkit: Essential Research Reagents
Table 3: Key Research Reagents for Cross-Reactivity Studies
| Reagent / Material | Function in Cross-Reactivity Assessment | Application Notes |
|---|---|---|
| Structural Analogs | Panel of compounds similar to target for specificity testing | Essential for comprehensive cross-reactivity profiling; should include closest structural relatives [3] |
| Magnetic Beads (MB) | Immobilization support for SELEX targets | Used in MB-SELEX for aptamer selection; enable efficient separation of bound/unbound sequences [3] |
| Cross-linking Reagents | Covalent attachment of capture agents to sensor surfaces | BS3 and other homobifunctional crosslinkers used for antibody/aptamer immobilization [8] |
| Aminopropyltriethoxysilane (APTES) | Surface silanization for biosensor functionalization | Creates amine-reactive surfaces for subsequent biomolecule immobilization [8] |
| Reduced Graphene Oxide | Nanomaterial for enhanced electrochemical sensing | Increases surface area and electron transfer in electrochemical aptasensors [5] |
| Screen-Printed Electrodes | Disposable platforms for electrochemical detection | Enable cost-effective, portable biosensing; ideal for field-deployable sensors [5] |
| IVTT Lysate Systems | Cell-free protein expression for proteomic arrays | Enable in situ protein production for high-throughput interaction screening [7] |
Cross-reactivity remains a critical parameter in biosensor validation, with significant implications for diagnostic accuracy, regulatory compliance, and clinical decision-making. While immunosensors continue to play important roles in analytical applications, aptasensors offer distinct advantages in specificity through programmable selection processes and counter-selection strategies. The experimental data clearly demonstrate that aptasensors can achieve specificity levels that are challenging for antibody-based platforms, particularly for small molecule targets [3].
Future directions in addressing cross-reactivity challenges include the integration of artificial intelligence for biosensor optimization [6], development of multiplexed platforms for comprehensive specificity profiling [5] [7], and advancement of high-throughput methods for kinetic characterization of binding interactions [7]. As these technologies mature, researchers and drug development professionals will have increasingly powerful tools to ensure biosensor specificity while maintaining sensitivity, ultimately leading to more reliable analytical outcomes across diverse applications.
The development of robust immunosensors and emerging aptasensors is fundamentally shaped by the molecular recognition events between a bioreceptor and its target. For antibodies, these events are governed by the precise structural complementarity at the paratope-epitope interface. While high specificity is the goal, the inherent structural flexibility of antibodies and the existence of similar epitopes on different antigens can lead to cross-binding, a significant concern in diagnostic and therapeutic development [9]. Cross-binding can result in false positives in diagnostics or off-target effects in therapeutics, underscoring the need for rigorous early-stage assessment. Conversely, for aptasensors, cross-reactivity presents a similar challenge, though the synthetic nature and smaller size of aptamers offer distinct advantages and mechanisms for mitigation [10]. This guide objectively compares the experimental approaches and technologies used to quantify and mitigate cross-binding, providing researchers with a framework for evaluating the developability of their chosen bioreceptors.
Quantitative Comparison of Cross-Binding Assays and Performance
A critical step in biosensor development is the application of high-throughput assays to profile the cross-interaction propensity of candidate antibodies. The data below summarize key performance metrics of established assays and their correlation with downstream outcomes, providing a basis for comparison.
Table 1: Key Assays for Profiling Antibody Cross-Binding Propensity
| Assay Name | Principle of Measurement | Key Measurable Outputs | Reported Correlation with In Vivo Clearance |
|---|---|---|---|
| Poly-Specificity Reagent (PSR) Binding [11] | Measures binding to a diverse mixture of non-cognate antigens (e.g., soluble membrane proteins) via ELISA or flow cytometry. | Median Fluorescence Intensity (MFI) | Strongest rank-order correlation (Spearman's ρ = 0.72); High predictive accuracy via ROC analysis [11]. |
| Cross-Interaction Chromatography (CIC) [11] | Evaluates weak cross-interaction by measuring retention time on a column coupled with human serum polyclonal antibodies. | Retention Time (minutes) | Significant rank-order correlation with mouse clearance rates [11]. |
| Affinity Capture Self-Interaction Nanoparticle Spectroscopy (AC-SINS) [11] | Detects self-association propensity by measuring plasmon wavelength shift of gold nanoparticles upon antibody clustering. | Δλmax (nanometers) | Forms a self-correlated cluster but did not directly correlate with clearance in a 16-mAb case study [11]. |
| Clone Self-Interaction Biolayer Interferometry (CSI-BLI) [11] | Real-time observation of mAb self-association and dissociation using BLI. | Binding Response (nm) | Correlated with other self-interaction assays but not with mouse clearance rate [11]. |
Table 2: Aptamer vs. Antibody: A Bioreceptor Comparison [10]
| Feature | Aptamers | Antibodies |
|---|---|---|
| Nature | Short ssDNA or RNA oligonucleotides | Large protein molecules (~150 kDa) |
| Production | Fully synthetic via SELEX | Biological (immunization, hybridoma, cell culture) |
| Development Time | Weeks | Months |
| Batch Consistency | High (chemical synthesis) | Variable (biological expression) |
| Stability | Stable to pH, heat; reversible folding | Sensitive to temperature, pH; irreversible denaturation |
| Immunogenicity | Very Low | May trigger immune responses |
| Target Range | Proteins, small molecules, ions, non-immunogenic targets | Mostly proteins and larger antigens |
| Tissue Penetration | Better (small size) | Limited (large size) |
Detailed Experimental Protocols for Assessing Cross-Binding
Protocol 1: Poly-Specificity Reagent (PSR) Binding Assay
The PSR assay is a high-throughput method to predict promiscuous cross-reactivity early in the discovery phase [11].
- PSR Preparation: A polyspecificity reagent is created, often comprising a cocktail of soluble membrane proteins (SMP) or other diverse non-cognate proteins to mimic a complex biological environment.
- Immobilization: The PSR is immobilized onto a solid support, such as an ELISA plate or the surface of a yeast cell.
- Antibody Incubation: The candidate monoclonal antibody (mAb) is added and allowed to bind. The mAb can be directly labeled or detected using a labeled secondary antibody.
- Signal Measurement: Binding is quantified via median fluorescence intensity (MFI) in a flow cytometry setup or by colorimetric/chemiluminescent readout in ELISA.
- Data Interpretation: A high MFI value indicates a "sticky" antibody with a high propensity for non-specific cross-binding. A cutoff value (e.g., MFI of 500) can be established to classify high- and low-risk candidates, with high-binders showing strong correlation to faster serum clearance in vivo [11].
Protocol 2: Cross-Interaction Chromatography (CIC)
CIC assesses weak cross-interactions under flowing conditions, predicting solubility issues [11].
- Column Preparation: A chromatography column is packed with a resin coupled to human serum polyclonal antibodies or other complex protein mixtures.
- Sample Injection: The candidate mAb is injected into the column using an HPLC system.
- Chromatographic Run: The mAb is eluted with an appropriate buffer, and its retention time is precisely measured.
- Data Interpretation: Late elution time indicates strong non-specific interaction with the immobilized proteins on the column. This prolonged retention is a key indicator of poor developability and has shown a significant correlation with faster clearance in mouse models [11].
Protocol 3: High-Throughput Kinetics Analysis with Surface Plasmon Resonance (SPR)
Modern SPR systems like the Carterra LSA enable simultaneous kinetic screening of hundreds of interactions, moving beyond single-characterization analyses [12].
- Sample Expression: Candidate antibodies (e.g., Fab fragments) are expressed in a high-throughput system, such as Brevibacillus in 96-well plates.
- Immobilization: Antibodies from culture supernatants are captured in a multiplexed array on a sensor chip functionalized with nitrilotriacetic acid (NTA) for his-tagged proteins.
- Kinetic Injection: The antigen(s) of interest are flowed over the chip at multiple concentrations in a serial dilution.
- Data Analysis: The instrument measures association and dissociation in real-time, calculating the association rate constant (
k_on), dissociation rate constant (k_off), and equilibrium dissociation constant (K_D). - Cross-Reactivity Screening: This system can efficiently profile an antibody's binding kinetics not only against the intended target but also against related off-target proteins (e.g., mouse vs. human homologs), identifying variants with undesired cross-binding or improved cross-reactivity for translational research [12].
Protocol 4: SELEX and Post-SELEX Optimization for Aptamers
For aptasensors, minimizing cross-binding is engineered during the selection and optimization process [10].
- Library Incubation: A vast library of single-stranded DNA or RNA sequences (10^13–10^15 different molecules) is incubated with the target molecule.
- Partitioning: Target-bound sequences are separated from unbound sequences. Techniques like Capillary Electrophoresis (CE-SELEX) are highly efficient, separating complexes based on migration rates under a high-voltage electric field [10].
- Amplification: The bound sequences are amplified by PCR (for DNA) or RT-PCR (for RNA) to create an enriched pool for the next selection round.
- Counter-Selection: To reduce cross-binding, the library is pre-incubated with non-target molecules (e.g., structural analogs or sample matrix components) to remove sequences that bind non-specifically. This step is crucial for enhancing specificity.
- Post-SELEX Truncation: After selection, the full-length aptamer can be computationally and experimentally analyzed to identify the minimal functional sequence. This truncation often improves specificity and reduces synthesis cost without compromising affinity [10].
Workflow Visualization for Cross-Binding Assessment
The following diagram illustrates the integrated experimental workflow for evaluating antibody and aptamer cross-binding, from initial screening to structural analysis.
The Scientist's Toolkit: Essential Research Reagents and Technologies
Successful assessment of cross-binding relies on a suite of specialized reagents and platforms.
Table 3: Key Research Reagent Solutions for Cross-Binding Analysis
| Reagent / Technology | Function in Cross-Binding Assessment |
|---|---|
| Poly-Specificity Reagent (PSR) [11] | A complex protein mixture used as a surrogate for non-specific interactions; high binding predicts poor developability. |
| Brevibacillus Expression System [12] | Enables high-throughput secretory expression of Fab antibodies in 96-well format for parallel kinetic and sequence analysis. |
| Carterra LSA SPR Platform [12] | A high-throughput SPR instrument capable of simultaneously immobilizing and measuring kinetics for up to 384 antibodies in a single run. |
| HRP-Streptavidin Conjugates | Common detection module for biotin-labeled aptamers in ELISA-style assays and lateral flow aptasensors. |
| Nitrilotriacetic Acid (NTA) Sensor Chip [12] | Used for his-tagged protein immobilization in SPR, enabling capture-based kinetics screening from crude supernatants. |
| Graphene Oxide (GO) [13] | A 2D nanomaterial used in fluorescent aptasensors; it quenches fluorophore-labeled aptamers and protects them from nuclease digestion. |
| RosettaDock Software [14] | A computational cross-docking suite for predicting antibody-antigen complex structures and discriminating cognate from non-cognate binders. |
| CRISPR-Cas12a System [13] | Integrated into aptasensors for signal amplification; upon target binding, Cas12a's collateral cleavage activity produces a fluorescent signal. |
The strategic assessment of cross-binding is a cornerstone of developing reliable biosensors. Experimental data demonstrates that high-throughput assays like PSR binding and CIC provide powerful, correlative predictions of in vivo antibody behavior, specifically clearance rates. The integration of advanced technologies such as high-throughput SPR and computational docking offers unprecedented depth in profiling kinetic parameters and structural determinants of cross-reactivity. For aptasensors, the SELEX process inherently incorporates counter-selection and post-SELEX optimization to engineer high specificity. By leveraging the comparative data and detailed protocols outlined in this guide, researchers can make informed, data-driven decisions to select and optimize lead bioreceptors, ultimately de-risking the path from laboratory discovery to a successful commercial biosensor.
The accuracy of a diagnostic test or the efficacy of a therapeutic agent is fundamentally governed by the specificity of its recognition element. For decades, antibodies have been the gold standard in molecular recognition, yet their inherent cross-reactivity with structurally similar molecules often compromises result accuracy. In recent years, nucleic acid aptamers have emerged as powerful alternatives, with their unique folding and recognition principles offering a pathway to unprecedented specificity. This guide provides a objective comparison between these two classes of recognition elements, focusing on their performance in scenarios demanding high specificity, with particular emphasis on cross-reactivity assessment in biosensor research.
Aptamers are single-stranded DNA or RNA oligonucleotides that bind to specific targets with high affinity and specificity through their unique three-dimensional structures [10]. Their binding to target molecules occurs through various forces, including van der Waals forces, hydrogen bonding, and electrostatic interactions [10]. Unlike antibodies, which are large protein molecules (~150 kDa) produced biologically, aptamers are typically short (20-80 nucleotides), fully synthetic molecules with better stability, lower production costs, and minimal batch-to-batch variability [10] [15]. Most significantly, the SELEX (Systematic Evolution of Ligands by Exponential Enrichment) process used for aptamer selection incorporates intentional counter-selection steps against non-target analogs, enabling the identification of receptors capable of distinguishing between molecules differing by only a single functional group [3].
Table 1: Fundamental Characteristics of Aptamers and Antibodies
| Feature | Aptamers | Antibodies |
|---|---|---|
| Nature | Short ssDNA or RNA oligonucleotides | Large protein molecules (~150 kDa) |
| Production | Fully synthetic via SELEX | Biological (immunization and cell culture) |
| Development Time | Weeks | Months |
| Batch Consistency | High (chemical synthesis) | Variable (biological expression) |
| Size | Small (5-15 kDa) | Large (~150 kDa) |
| Target Range | Proteins, small molecules, ions, non-immunogenic targets | Mostly proteins and larger antigens |
| Stability | Stable to pH, heat; reversible folding | Sensitive to temperature, pH; irreversible denaturation |
| Modification | Easily and precisely modified | Modifications more limited and complex |
| Immunogenicity | Very low | May trigger immune responses |
| Specificity Engineering | Counter-SELEX enables discrimination of closely related analogs | Limited by immunological recognition |
Structural Foundations: How Folding Governs Specificity
Aptamer Folding and Binding Mechanisms
The exceptional specificity of aptamers originates from their ability to fold into defined three-dimensional structures that create complementary binding surfaces for their targets. This folding is characterized by the formation of secondary structure elements including hairpins, inner loops, pseudoknots, bulges, and G-quadruplexes [10]. The resulting three-dimensional conformation allows aptamers to adapt to target molecules of various sizes through distinct mechanisms. When binding small molecules, the aptamer typically wraps around and covers the target surface. For larger targets like proteins, aptamers form adaptive structures that fit into clefts and gaps on the target surface [10]. This flexible recognition mechanism stands in contrast to the more constrained paratope-epitope interaction of antibodies, contributing to the ability of aptamers to recognize subtle structural differences among target analogs.
The folding and stability of aptamer structures are influenced by environmental conditions, particularly the presence of monovalent or divalent cations in buffer solutions that can significantly reduce non-specific binding [10]. This environmental sensitivity represents both a challenge and an opportunity—while requiring optimized conditions for consistent performance, it also enables fine-tuning of aptamer specificity for particular applications through controlled buffer conditions.
Antibody Binding Structure
Antibodies recognize their targets through complementarity-determining regions (CDRs) within the Fab portion of the molecule, which form a binding pocket for specific epitopes on the antigen. While this system provides high affinity in many cases, the structural constraints of the immunoglobulin fold limit the ability to distinguish between closely related small molecules that share similar epitopes. This fundamental limitation manifests practically in the significant cross-reactivity observed with antibody-based sensors for small molecule targets, particularly problematic in applications like antibiotic residue detection in food samples [3].
Direct Performance Comparison: Experimental Specificity Data
Case Study: Sulfamethazine Detection
A compelling example of the specificity advantage of aptamers comes from the detection of sulfamethazine (SMZ), an antibiotic where accurate monitoring requires discrimination from numerous structurally similar sulfonamides. Researchers developed a chemiluminescence aptasensor using aptamers selected with an intentional counter-selection against other sulfonamides [3]. The results demonstrated remarkable specificity: the aptasensor achieved detection of SMZ with negligible cross-reactivity across 27 tested sulfonamides, a level of discrimination described as "impossible to achieve" with antibodies [3].
Table 2: Experimental Cross-Reactivity Comparison for Sulfamethazine Detection
| Parameter | Aptamer-Based Sensor | Typical Antibody-Based Sensors |
|---|---|---|
| Detection Limit | 0.92 ng/mL | Variable (typically similar sensitivity) |
| Cross-Reactive Compounds | 0 out of 27 sulfonamides | Multiple, especially sulfamerazine (SMR) |
| Differentiation Capability | Distinguishes single methyl group differences | High cross-reactivity with analogs sharing similar epitopes |
| Specificity Control in Production | Counter-SELEX during selection | Limited by immunological recognition |
| Recognition Element Affinity | Kd = 79-274 nM (nanomolar range) | Typically nanomolar affinity |
The fundamental difference lies in the production process: while antibody generation relies on biological immune responses that naturally recognize common structural motifs, the SELEX process allows for intentional counterselection against non-target analogs, actively eliminating candidates that cross-react with similar structures [3]. This systematic approach to specificity engineering enables aptamers to achieve discrimination between molecules differing by only a methyl group, a challenge that remains problematic for antibody-based approaches [3].
Broader Specificity Comparisons Across Targets
The specificity advantages extend beyond small molecules to complex targets. Aptamers selected against cellular targets demonstrate the ability to distinguish between closely related cell types based on subtle differences in surface marker expression [16]. Furthermore, in the detection of marine biotoxins, aptamers have shown the capability to distinguish chiral molecules and analogs with minimal structural differences, a level of specificity rarely achieved by antibodies [17]. This high specificity persists across various detection platforms, including colorimetric, fluorescence, electrochemical, and plasmonic aptasensors [18] [19].
Methodologies: Experimental Protocols for Specificity Assessment
Aptamer Selection with Specificity Engineering
The SELEX process can be modified to prioritize specificity through several methodological approaches:
MB-SELEX with Counter-Selection:
- Immobilization: Covalently conjugate the target molecule to magnetic beads using appropriate coupling chemistry (e.g., HATU for amine coupling) [3].
- Positive Selection: Incubate the random ssDNA library (typically 10-100 nmoles) with target-conjugated beads in selection buffer (e.g., HEPES with MgCl₂) for 30-60 minutes at controlled temperature [3].
- Washing: Remove unbound sequences with multiple buffer washes under increasingly stringent conditions.
- Elution: Heat elution (70-95°C) or competitive elution with free target to recover bound sequences.
- Counter-Selection: Incubate eluted sequences with beads conjugated to structural analogs (e.g., other sulfonamides for SMZ selection) and collect the unbound fraction [3].
- Amplification: PCR amplification of counter-selected pool using biotinylated or labeled primers for strand separation.
- Iteration: Typically 8-15 rounds with increasing stringency and alternating counter-selection targets.
Critical Parameters for Specificity:
- Counter-Selection Timing: Introduce counter-selection after 2-3 initial rounds to eliminate cross-reactive binders early [3].
- Stringency Control: Gradually decrease target concentration (from μM to nM) and increase wash stringency in later rounds.
- Analog Selection: Use the most structurally similar analogs for counter-selection to force discrimination of minimal differences.
Cross-Reactivity Testing Protocol
To objectively compare specificity between aptamer and antibody-based sensors:
- Sample Preparation: Prepare serial dilutions of primary target and structurally related analogs in relevant matrix (buffer, serum, milk, etc.).
- Dose-Response Curves: For each compound, measure sensor response across a concentration range (typically 0.1-100× KD value).
- Cross-Reactivity Calculation: Determine IC50 values for each compound and calculate % cross-reactivity as (IC50 target / IC50 analog) × 100%.
- Statistical Analysis: Perform replicates (n≥3) to establish significance of discrimination capability.
This protocol revealed that while antibody-based sensors for SMZ showed significant cross-reactivity with sulfamerazine (differing by one methyl group), aptamer-based sensors achieved negligible cross-reactivity across 27 sulfonamides [3].
Visualization: Specificity Engineering in Aptamer Development
Diagram 1: Specificity Engineering in SELEX. The SELEX process intentionally incorporates counter-selection rounds where potential aptamers binding to structural analogs are systematically discarded, enabling isolation of sequences with exceptional specificity.
The Scientist's Toolkit: Essential Reagents for Specificity Research
Table 3: Essential Research Reagents for Specificity Assessment
| Reagent/Material | Function in Specificity Research | Application Notes |
|---|---|---|
| Structural Analogs | Counter-selection during SELEX; cross-reactivity testing | Critical for specificity engineering; purity essential |
| Magnetic Beads (Streptavidin/Carboxyl) | Target immobilization for SELEX | Enable efficient partitioning; various sizes available |
| HATU Coupling Reagent | Immobilization of small molecules on beads | Enables high coupling ratio for amine-containing targets |
| Modified Primers (Biotin/FAM) | Library amplification and detection | Biotin for bead separation; FAM for fluorescence detection |
| HEPES Buffer with Mg²⁺ | Folding buffer for aptamers | Divalent cations often crucial for proper aptamer structure |
| SPR/Chip Surfaces | Real-time binding kinetics measurement | Gold standard for affinity/specificity characterization |
| Next-Generation Sequencing | High-throughput pool characterization | Identifies enriched motifs; enables machine learning approaches |
The experimental evidence clearly demonstrates that while antibodies remain excellent recognition elements for many applications, aptamers offer distinct advantages in scenarios demanding exceptional specificity toward small molecules or the ability to discriminate between closely related structural analogs. The key differentiator lies in the production process: SELEX enables systematic engineering of specificity through counter-selection, while antibody production remains constrained by the biological immune response.
For researchers developing sensors for targets with many structural analogs (e.g., antibiotics, toxins, neurotransmitters) or requiring minimal cross-reactivity, aptamers provide a compelling alternative. The emerging integration of machine learning approaches with aptamer development further enhances this specificity advantage, enabling in silico prediction and refinement of aptamer sequences to optimize target discrimination [20]. As the field advances, the strategic selection between these recognition elements should be guided by the specific specificity requirements of the application, with aptamers representing the superior choice for the most challenging discrimination tasks.
Cross-reactivity, the binding of a recognition element to non-target molecules with structural similarities to the intended target, is a critical parameter in the development of sensitive and specific detection assays. This comparative analysis examines the inherent cross-reactivity profiles of antibodies and aptamers, two fundamental classes of binding reagents. Through evaluation of their respective development paradigms, structural characteristics, and experimental performances, this guide provides researchers with a structured framework for selecting appropriate reagents based on assay specificity requirements. Evidence from direct comparative studies indicates that while both reagents can exhibit cross-reactivity, the in vitro selection process of aptamers offers distinct advantages for engineering precise specificity profiles, particularly for challenging targets like small molecules and toxic compounds.
In the realms of diagnostics, therapeutics, and basic research, the accuracy of molecular detection hinges on the specificity of the binding reagents employed. Cross-reactivity occurs when a binding reagent, such as an antibody or aptamer, interacts with off-target analytes that share structural epitopes with the primary target [1]. This phenomenon can lead to false-positive signals, reduced assay sensitivity, and inaccurate research or clinical conclusions [1]. For researchers developing immunosensors (utilizing antibodies) or aptasensors (utilizing aptamers), understanding the inherent cross-reactivity profiles of these reagents is paramount.
The structural basis for cross-reactivity differs between antibodies and aptamers. Antibodies, developed in vivo, recognize specific epitopes on antigens, but conserved epitopes across related proteins or species can lead to cross-reactivity [21]. A single amino acid variation within a binding epitope can significantly alter binding affinity, though identical sequences do not guarantee cross-reactivity, as demonstrated in studies of ophthalmic antibody drugs [21]. Aptamers, selected in vitro through the Systematic Evolution of Ligands by EXponential enrichment (SELEX) process, form specific three-dimensional structures that bind their targets. Their selection process can be strategically designed to discriminate between closely related molecules by incorporating counter-selection steps against non-targets [21] [22].
This guide provides an objective comparison of antibody and aptamer cross-reactivity, supported by experimental data and methodological protocols, to inform reagent selection in sensor research and drug development.
Fundamental Differences Impacting Cross-Reactivity
The foundational differences in the origin, development, and physicochemical properties of antibodies and aptamers directly influence their propensity for cross-reactivity.
Origin and Development Paradigm
The development process is a primary factor dictating the specificity landscape of a binding reagent.
- Antibody Development (In Vivo): Traditional monoclonal antibody production requires immunization of a host animal, triggering a complex biological immune response [21]. This process inherently selects for antibodies that bind immunogenic epitopes under physiological conditions. Consequently, it is difficult to generate antibodies against non-immunogenic targets, such as small molecules (<600 Daltons) or highly toxic compounds, as they will not elicit a robust immune response [21]. The in vivo environment limits direct control over the fine specificity of the resulting antibodies.
- Aptamer Development (In Vitro): Aptamers are developed entirely in vitro via the SELEX process [22] [23]. This involves iterative rounds of selection against a target, amplification of binding sequences, and, crucially, counter-selection against non-targets. This allows researchers to actively shape the specificity profile by discarding aptamers that bind to structurally similar, non-target compounds [21]. The process can be performed under non-physiological conditions (e.g., specific pH, temperature, or buffer compositions), further enabling the selection of aptamers with tailored performance characteristics [21].
Structural and Physical Properties
The molecular structure of these reagents affects their interaction with targets.
- Size: A typical IgG antibody is large (~150-170 kDa), whereas an aptamer is significantly smaller (~12-30 kDa) [21] [22]. This size difference influences steric hindrance and access to sterically constrained epitopes.
- Stability and Renaturation: Antibodies are proteins susceptible to irreversible denaturation under harsh conditions (e.g., high temperature, extreme pH) [21] [22]. Once denatured, they typically cannot regain function. In contrast, aptamers are nucleic acid-based and can often be renatured after denaturation by reverting to permissive conditions, allowing for reagent reuse and more stringent elution protocols in assays [22].
Table 1: Fundamental Characteristics of Antibodies and Aptamers
| Characteristic | Antibodies | Aptamers | Impact on Cross-Reactivity |
|---|---|---|---|
| Development Process | In vivo (Immune system) | In vitro (SELEX) | SELEX allows for positive/negative selection to enhance specificity [21]. |
| Development Time | ~4-6 months [21] | ~1-3 months [21] | Faster iteration for specificity optimization. |
| Minimum Target Size | ≥ 600 Daltons [21] | ≥ 60 Daltons [21] | Aptamers can be developed for small molecules, reducing need for cross-reactive assays. |
| Stability | Sensitive to heat/pH; irreversible denaturation [21] | Stable at ambient temperature; can be refolded if denatured [21] [22] | Enables use of harsh conditions to eliminate weak, cross-reactive binding. |
| Production | Biological (cell culture); risk of batch-to-batch variation [21] | Chemical synthesis; high batch-to-batch consistency [21] [22] | Consistent specificity across production lots. |
Experimental Data and Performance Comparison
Direct comparative studies and specific investigations highlight the practical implications of these fundamental differences on assay performance.
Evidence from Comparative Studies
A head-to-head comparison of aptamer-based (SOMAscan) and antibody-based (immunoassay) platforms for quantifying biomarkers in chronic kidney disease patients revealed variable correlations, dependent on the specific analyte [24]. For instance, out of eight immune biomarkers analyzed, four (IL-8, TNFRSF1B, TNFRSF1A, and suPAR) showed non-negligible to strong correlations (r = 0.23 to 0.93) between the two methods, while others (IFN-γ, IL-10, TNF-α) showed negligible correlation (r < 0.1) [24]. This suggests that the specificity and cross-reactivity profiles are target-dependent, and the choice of platform can significantly influence the resulting data.
Control and Modulation of Cross-Reactivity
Research demonstrates that cross-reactivity is not an immutable, intrinsic property of the binding reagent but can be modulated by assay conditions.
- For Antibodies: A study on immunoassays for sulfonamides and fluoroquinolones demonstrated that the cross-reactivity of the same antibodies could be altered by changing the assay format and reagent concentrations [1]. Assays with sensitive detection (utilizing low concentrations of antibodies and competing antigens) exhibited lower cross-reactivity and were more specific than assays requiring high reagent concentrations [1]. This indicates that careful optimization of immunoassay conditions can help mitigate undesirable cross-reactivity.
- For Aptamers: The evolutionary selection process of aptamers can be directly harnessed to engineer cross-reactivity profiles. A study successfully developed a sensor array from a pool of DNA sequences to achieve perfect classification of four different steroids [25]. The individual sensors were selected under pressure to interact with all four steroids, demonstrating that aptamer cross-reactivity can be intentionally optimized for applications requiring class-specific detection (e.g., detecting a family of related contaminants) rather than analyte-specific detection [25].
Table 2: Experimental Comparison of Cross-Reactivity Performance
| Aspect | Antibodies | Aptamers | Experimental Support |
|---|---|---|---|
| Specificity Control | Limited by immunogenicity; optimized via assay conditions [1]. | Directly engineered during SELEX via counter-selection [21]. | Selection against non-targets yields highly selective aptamers [21]. |
| Class vs. Analyte Specificity | Primarily analyte-specific; cross-reactivity can be an issue. | Can be designed for either class- or analyte-specificity [25]. | Sensor array built to discriminate steroid classes [25]. |
| Interference | Susceptible to heterophilic antibodies, HAMA, rheumatoid factor [21]. | No interference from endogenous antibodies [21]. | Eliminates a major source of false positives in clinical samples [21]. |
| Correlation with Alternate Platforms | Variable, analyte-dependent correlation with aptamer-based measurements [24]. | Strong correlation with immunoassays for some, but not all, targets [24]. | IL-8, TNFRSF1B showed strong correlation (r>0.9); TNF-α showed no correlation [24]. |
Methodological Protocols for Assessing Cross-Reactivity
Standardized experimental protocols are essential for rigorously evaluating the cross-reactivity of any binding reagent.
Standard Cross-Reactivity Testing
The established method for quantifying cross-reactivity in competitive assay formats (common for small molecule detection) uses the following formula [1]: Cross-reactivity (CR) = [IC₅₀ (Target Analyte) / IC₅₀ (Tested Cross-Reactant)] × 100% The IC₅₀ is the concentration of the analyte that causes a 50% reduction in the maximum assay signal. A lower CR percentage indicates higher specificity for the target over the cross-reactant.
Protocol: SELEX for High-Specificity Aptamers
The following methodology, adapted from a study selecting aptamers against an antibody target, minimizes non-specific binding and enhances specificity [26].
- Target Immobilization: Adsorb the target protein (e.g., 10 µg/mL in carbonate buffer) to the surface of a PCR tube for 1-2 hours at room temperature.
- Negative Selection (Counter-Selection): To eliminate non-specific binders, incubate the random ssDNA library (e.g., a 25-70 nt degenerate sequence flanked by primer sites) with a non-target surface or a mixture of related non-target proteins. Collect the unbound sequences.
- Positive Selection: Incubate the pre-cleared library with the immobilized target. Wash thoroughly to remove weakly bound or unbound sequences.
- Elution and Amplification: Elute specifically bound sequences. This can be achieved through denaturation (e.g., in the first PCR cycle) or competitive elution with the free target. Amplify the eluted sequences via PCR (for DNA aptamers) or RT-PCR (for RNA aptamers) to create a new, enriched library for the next round.
- Stringency Increase: Repeat steps 2-4 for 10-15 rounds, progressively increasing stringency by reducing incubation time, increasing wash stringency, and/or reducing target concentration.
- Characterization: Clone and sequence the final pool. Characterize individual aptamer candidates using techniques like fluorescence quenching, ELISA, and surface plasmon resonance (SPR) to determine affinity (Kd) and specificity [26].
Figure 1: The SELEX workflow for selecting high-specificity aptamers. Key steps like negative selection (counter-selection) are critical for minimizing cross-reactivity [22] [26] [23].
Protocol: Modifying Immunoassay Conditions to Reduce Cross-Reactivity
As demonstrated in [1], the cross-reactivity of an antibody can be optimized for the assay context.
- Reagent Concentration Titration: Implement a checkerboard titration of the capture and detection antibodies. Using the lowest possible concentrations of these reagents that still yield a robust signal can significantly improve specificity and reduce cross-reactivity [1].
- Assay Format Comparison: If possible, test the same antibody pair in different assay formats (e.g., ELISA vs. fluorescence polarization immunoassay). More sensitive formats that operate at lower reagent concentrations may inherently exhibit lower cross-reactivity [1].
- Kinetic vs. Equilibrium Measurements: The degree of cross-reactivity can vary between kinetic and equilibrium phases of the antigen-antibody reaction. Monitoring the assay signal at different time points can reveal optimal readout times for discriminating the target from cross-reactants [1].
Figure 2: A workflow for modulating antibody cross-reactivity through assay condition optimization. Shifting to lower reagent concentrations and more sensitive formats reduces cross-reactivity [1].
The Scientist's Toolkit: Key Research Reagent Solutions
The following table details essential materials and their functions for researchers working in this field.
Table 3: Essential Research Reagents for Cross-Reactivity Assessment
| Reagent / Material | Function in Research and Development |
|---|---|
| Oligonucleotide Library | A synthetic pool of random-sequence ssDNA or RNA (typically 10^14-10^15 diversity) serving as the starting point for SELEX [22] [23]. |
| SELEX Counter-Targets | Structurally related non-target molecules used during negative selection to purge cross-reactive aptamers from the library [21]. |
| Immobilization Supports | Solid surfaces (e.g., PCR tubes, beads, chips) for immobilizing the target during SELEX or for assay development (ELASA, biosensors) [22] [26]. |
| Modified Nucleotides | Chemically altered nucleotides (e.g., SOMAmers) that introduce hydrophobic moieties, expanding the structural diversity and target range of aptamers, particularly for proteins [23] [24]. |
| Hapten-Carrier Conjugates | Conjugates of small molecules (haptens) to immunogenic carrier proteins, essential for generating antibodies against non-immunogenic targets [21]. |
| Anti-Animal Antibodies | Secondary antibodies used in immunoassays; a source of interference (e.g., HAMA) that can mimic cross-reactivity in clinical samples [21]. |
| Reference Cross-Reactants | Purified, structurally analogous compounds to the primary target, essential for empirical measurement of cross-reactivity percentages [1]. |
The choice between antibodies and aptamers involves a careful consideration of their inherent cross-reactivity profiles, guided by the specific application needs.
- Aptamers offer a superior level of control over specificity from the outset of development. The in vitro SELEX process, particularly with counter-selection, allows for the direct engineering of high-specificity binders, even for challenging targets like small molecules and toxins [21] [22]. Their chemical nature and small size also avoid common interference issues from endogenous antibodies [21].
- Antibodies remain powerful reagents, especially for in vivo applications where their longer circulating half-life can be beneficial. However, their in vivo production limits target scope and can make obtaining highly specific clones against conserved epitopes challenging [21]. While cross-reactivity can be mitigated through careful assay optimization [1], it is not as programmable as with aptamers.
Concluding Guidance for Researchers
For research and diagnostic applications where discriminating between highly homologous targets is critical (e.g., specific hormone isoforms, phosphorylated proteins, or specific drug metabolites), aptamers present a compelling choice due to the programmability of their specificity. Their lower cost, higher batch-to-batch consistency, and stability further support their use in standardized assays and biosensors [21] [22] [23].
For applications where the target is highly immunogenic and a class-specific response is acceptable, or where established, high-quality antibody reagents already exist, antibodies remain a viable option. However, researchers must rigorously validate antibodies for cross-reactivity within their specific assay system, acknowledging that this profile is not fixed but can vary with experimental conditions [1].
In conclusion, while both molecular recognition elements can exhibit cross-reactivity, the in vitro evolution of aptamers provides a more direct and controllable path to achieving high specificity, making them increasingly advantageous for the next generation of precise molecular detection tools.
The Impact of Cross-Reactivity on Diagnostic Accuracy and False Positives
Cross-reactivity represents a fundamental challenge in the development of precise diagnostic biosensors, directly impacting their accuracy and potential for generating false-positive results. This phenomenon occurs when a biorecognition element binds not only to its intended target but also to structurally similar molecules, leading to erroneous signals and compromised diagnostic reliability. In clinical and research settings, false positives stemming from cross-reactivity can trigger unnecessary treatments, patient anxiety, and increased healthcare costs, while false negatives may allow diseases to go undetected.
The selection between immunosensors (utilizing antibodies) and aptasensors (utilizing nucleic acid aptamers) represents a critical decision point in diagnostic development, with significant implications for cross-reactivity profiles. Antibodies, with their complex protein structures and biological origins, interact with targets through diverse molecular forces, while aptamers, as synthetically produced oligonucleotides, employ distinct binding mechanisms influenced by their three-dimensional folding. This guide objectively compares the cross-reactivity performance of these two prominent biosensing platforms, providing researchers with experimental data and methodological frameworks to inform their diagnostic development strategies.
Fundamental Differences Between Immunosensors and Aptasensors
Immunosensors and aptasensors differ fundamentally in their biorecognition elements, which directly influences their susceptibility to cross-reactivity. Antibodies are relatively large (∼150 kDa for whole IgG) Y-shaped proteins produced by the immune system, recognizing targets through their antigen-binding fragments [15]. Their binding interfaces are formed by complementarity-determining regions (CDRs) that create complex surfaces for molecular interaction. In contrast, aptamers are single-stranded DNA or RNA oligonucleotides (typically 15–100 bases) that fold into specific three-dimensional structures capable of binding targets with high specificity and affinity [27] [28]. These fundamental differences in composition, size, and origin establish distinct cross-reactivity profiles for each platform.
Table 1: Fundamental Characteristics of Antibodies and Aptamers
| Characteristic | Antibodies (Immunosensors) | Aptamers (Aptasensors) |
|---|---|---|
| Molecular Type | Proteins (IgG) | Single-stranded DNA or RNA |
| Size | ∼150 kDa (whole antibody) | 5–25 kDa |
| Production Method | Biological systems (hybridomas/animal hosts) | Chemical synthesis (SELEX in vitro) |
| Binding Mechanism | Surface complementarity via CDR regions | 3D structure folding & molecular affinity |
| Stability | Sensitive to temperature, prone to denaturation | Thermally stable, reversible denaturation |
| Modification | Limited, through protein engineering | Highly flexible (chemical modifications) |
| Cost & Reproducibility | Variable batch-to-batch, higher production costs | Excellent batch consistency, lower costs |
The production methodologies further differentiate these recognition elements. Antibodies are typically generated through biological systems, which can introduce variability between batches and limit the ability to fine-tune their specificity post-production [15]. Aptamers are developed through the Systematic Evolution of Ligands by Exponential Enrichment (SELEX) process, an in vitro selection technique that allows for precise control over selection conditions and target epitopes [28]. This synthetic production offers opportunities to manipulate cross-reactivity profiles by adjusting selection parameters, counter-selection steps, and using computational approaches to guide aptamer design [28].
Comparative Analysis of Cross-Reactivity Performance
Experimental Evidence from Diagnostic Applications
Direct comparisons of immunosensor and aptasensor performance reveal significant differences in cross-reactivity profiles across various diagnostic targets. In therapeutic drug monitoring, for instance, immunosensors for sulfonamide antibiotics demonstrate cross-reactivity patterns that vary substantially depending on assay format and reagent concentrations, with changes in reagent ratios altering cross-reactivity by up to five-fold [1]. This concentration-dependent cross-reactivity behavior represents a critical consideration for researchers optimizing immunoassay conditions.
A comprehensive review of electrochemical biosensors for small molecule detection revealed that immunosensors generally achieve limits of detection (LOD) two to three orders of magnitude lower than aptasensors for the same targets, attributed primarily to the superior binding affinities of high-quality antibodies [29]. However, this enhanced sensitivity does not necessarily correlate with improved specificity, as antibodies may exhibit broader cross-reactivity with structurally related compounds. For example, in sulfonamide and fluoroquinolone detection, immunoassay cross-reactivity profiles were demonstrably modulated by simply shifting reagent concentrations or transitioning between equilibrium and kinetic measurement modes [1].
Viral detection platforms further highlight these trade-offs. SPR-based aptasensors for virus detection have demonstrated promising performance with a pooled sensitivity of 1.89 (95% CI: 1.29, 2.78) across multiple studies, indicating robust detection capabilities despite potential cross-reactivity challenges in complex samples [27]. The synthetic nature of aptamers enables strategic selection approaches like Toggle-SELEX, which intentionally cycles between related targets to generate either highly specific or broadly cross-reactive aptamers depending on diagnostic needs [28].
Quantitative Comparison of Cross-Reactivity Performance
Table 2: Experimental Cross-Reactivity Comparison for Selected Targets
| Target Compound | Biosensor Platform | Cross-Reactivity Profile | Key Structural Analogs with Cross-Reactivity | Limit of Detection |
|---|---|---|---|---|
| Tetracycline | Immunosensor | High variability (5-fold changes with conditions) | Multiple tetracycline antibiotics | 6 pg/mL (13 pM) |
| Tetracycline | Aptasensor | More consistent across platforms | Primarily oxytetracycline | 0.3 nM (0.1 ng/mL) |
| Sulfonamides | Immunosensor (FPIA/EIA) | Concentration-dependent (up to 5-fold difference) | Various sulfonamide antibiotics | nM range |
| Ochratoxin A | Immunosensor | Lower LOD, broader cross-reactivity | Ochratoxin B & other mycotoxins | ~1 ng·mL−1 |
| Ochratoxin A | Aptasensor | Higher LOD, narrower cross-reactivity | Limited structural analogs | ~nM range |
| Dengue Virus | Aptasensor (Electrochemical) | Minimal cross-reactivity with CHIKV | Chikungunya virus (tested) | 0.1 μg/mL |
The data reveal that immunosensors generally achieve lower detection limits but often with more variable cross-reactivity that is highly dependent on assay conditions. Aptasensors typically show more consistent cross-reactivity profiles across different platforms but may sacrifice some sensitivity. The synthetic production of aptamers enables more predictable cross-reactivity behavior, while antibodies offer superior affinity in optimized conditions but with greater variability between assay formats.
Methodological Approaches to Assess and Minimize Cross-Reactivity
Standard Experimental Protocols for Cross-Reactivity Assessment
Establishing standardized protocols for cross-reactivity evaluation is essential for meaningful comparison between biosensing platforms. The widely accepted approach involves measuring the response of the biosensor to both the target analyte and potential cross-reactants, calculating cross-reactivity as the ratio of concentrations causing equivalent signals [1]. For competitive assay formats, this is typically determined using the IC50 values:
Cross-reactivity (CR) = IC50(target analyte)/IC50(tested cross-reactant) × 100% [1]
Rigorous cross-reactivity assessment should include:
- Selection of Structurally Related Compounds: Testing analogs with highest structural similarity to the target
- Dose-Response Curves: Generating full concentration-response curves for each compound
- Matrix Effects Evaluation: Testing in sample matrices identical to intended application
- Cross-Platform Validation: Comparing performance across different sensor configurations
For immunosensors, particular attention should be paid to reagent concentrations, as studies demonstrate that simply shifting to lower antibody and antigen concentrations can significantly reduce cross-reactivity [1]. This concentration-dependent effect stems from the differential impact on high-affinity versus low-affinity subpopulations of antibodies and their relative contributions to signal generation.
Strategic Selection of Biorecognition Elements
The selection process for both antibodies and aptamers offers opportunities to manage cross-reactivity. For antibodies, recombinant fragments (scFv, Fab') with molecular weights of 30–50 kDa allow for more dense immobilization and potentially improved specificity compared to whole antibodies (150 kDa) [15]. Oriented immobilization techniques using protein A/G, Fc-specific binding, or engineered tags (e.g., Avi-Tag, polyhistidine) can enhance binding site accessibility and reduce non-specific interactions [15].
For aptamers, advanced SELEX methodologies provide powerful tools for cross-reactivity control:
- Counter-Selection: Including negative selection steps against common cross-reactants
- Toggle-SELEX: Alternating between related targets to generate either specific or cross-reactive aptamers [28]
- Capture-SELEX: Particularly effective for small molecules, selecting for structure-switching aptamers with enhanced specificity [28]
- In Silico Maturation: Computational modeling of aptamer-target interactions to refine specificity before synthesis [28]
The Scientist's Toolkit: Essential Research Reagents and Materials
Table 3: Key Research Reagent Solutions for Cross-Reactivity Studies
| Reagent/Material | Function in Cross-Reactivity Assessment | Application Notes |
|---|---|---|
| Structural Analogs | Serve as cross-reactivity probes | Select compounds with incremental structural changes |
| Reference Standards | Provide benchmark for specificity comparison | Use certified reference materials when available |
| Surface Chemistry Kits | Enable controlled immobilization | Thiol-based for gold, amine-reactive for other surfaces |
| Magnetic Beads | Facilitate separation in SELEX/sandwich assays | Streptavidin-coated for biotinylated capture probes |
| Signal Amplification Reagents | Enhance detection sensitivity | Enzymatic (HRP), nanomaterial-based, or catalytic |
| Blocking Buffers | Reduce non-specific binding | BSA, casein, or specialized commercial formulations |
| Regeneration Solutions | Allow biosensor surface reuse | Mild acids/bases or specific elution buffers |
Effective cross-reactivity management requires appropriate surface immobilization strategies. For immunosensors, oriented immobilization using protein A/G or fragment-based approaches (e.g., Fab' thiol coupling) significantly improves antigen accessibility compared to random adsorption [15]. For aptasensors, thiol-gold chemistry remains predominant, but hybrid approaches incorporating mixed self-assembled monolayers (SAMs) can further reduce non-specific binding [30]. Recent advances in computational modeling of both antibody-paratope and aptamer folding interactions have enabled more predictive approaches to cross-reactivity management before experimental validation [28].
Cross-reactivity remains an inescapable consideration in biosensor development, with both immunosensors and aptasensors offering distinct advantages and limitations. Immunosensors generally provide superior sensitivity and established validation protocols but exhibit more variable cross-reactivity that is highly dependent on assay conditions. Aptasensors offer more consistent cross-reactivity profiles, greater engineering flexibility, and the ability to strategically design specificity during the selection process, though sometimes at the cost of ultimate sensitivity.
The choice between these platforms should be guided by the specific diagnostic application. For targets requiring ultra-sensitive detection in controlled environments, immunosensors may be preferable. For applications demanding consistent performance across multiple sites or testing platforms, or when targeting molecules that poorly immunize animals, aptasensors offer significant advantages. Emerging approaches that combine both recognition elements in hybrid designs may ultimately provide the optimal balance of sensitivity and specificity, leveraging the strengths of both platforms while mitigating their respective limitations related to cross-reactivity and false positives.
Methodologies and Real-World Applications in Specificity Assessment
Cross-reactivity is a fundamental performance parameter in immunoassays, defined as the ability of an antibody to bind with structurally similar compounds other than its primary target analyte [1]. For researchers and drug development professionals, accurately measuring cross-reactivity is crucial because it determines an assay's specificity and selectivity, indicating whether it can detect a single compound with high precision or a class of related molecules [31] [1]. In competitive immunoassays, cross-reactivity is typically calculated as the ratio of the half-maximal inhibition concentration (IC50) of the target analyte to the IC50 of the cross-reactant, expressed as a percentage: CR = IC50(target analyte)/IC50(tested cross-reactant) × 100% [1].
The significance of cross-reactivity extends beyond being an undesirable property to avoid. Strategic exploitation of cross-reactivity can transform immunoassays, enabling them to function similarly to selective arrays for detecting a range of analytes, thus improving diagnostic capabilities and surveillance [31]. However, cross-reactivity is not a fixed parameter determined solely by antibody characteristics but is significantly influenced by assay format, reagent concentrations, and experimental conditions [1]. This guide provides an objective comparison of three principal techniques—ELISA, FPIA, and SPR—for measuring cross-reactivity, supported by experimental data and methodological protocols to inform selection for specific research applications in immunosensors and aptasensors.
Comparative Analysis of Technical Principles
The fundamental principles of ELISA, FPIA, and SPR dictate their respective capabilities and limitations in cross-reactivity assessment. ELISA operates on the principle of detecting antigen-antibody interactions using enzyme-labelled conjugates and substrates that generate measurable color changes [32]. It exists in multiple formats—direct, indirect, and competitive—with the competitive format being particularly relevant for cross-reactivity testing of small molecules [32] [33]. As a heterogeneous assay, ELISA requires multiple washing and separation steps, which can preferentially remove low-affinity binders, potentially affecting cross-reactivity profiles [34].
FPIA is a homogeneous competitive immunoassay that measures changes in fluorescence polarization when a fluorescently-labeled tracer bound to an antibody experiences rotational diffusion changes upon binding [35]. The key advantage of FPIA lies in its homogenous format, requiring no separation steps, making it particularly suitable for detecting low-affinity interactions that might be lost during ELISA washing procedures [35]. The technique is highly dependent on tracer design, with spacer length between the fluorescein label and antigen significantly affecting assay sensitivity and specificity [35].
SPR represents a label-free detection methodology that measures real-time changes in refractive index at a sensor surface where biomolecular interactions occur [34]. This technique provides direct observation of binding events without requiring secondary labels, enabling determination of both binding affinity (KD) and kinetics (ka, kd) [34]. The ability to monitor interactions in real-time offers distinct advantages for characterizing cross-reactive binding, as the kinetic parameters can reveal important details about the nature of cross-reactive interactions that endpoint assays like ELISA might miss [36] [34].
Table 1: Fundamental Characteristics of ELISA, FPIA, and SPR
| Parameter | ELISA | FPIA | SPR |
|---|---|---|---|
| Principle | Enzyme-based colorimetric detection | Fluorescence polarization changes | Refractive index changes |
| Assay Format | Heterogeneous (requires separation) | Homogeneous (no separation) | Heterogeneous (surface-bound) |
| Measurement Type | End-point | Equilibrium | Real-time kinetics |
| Label Requirement | Yes (enzyme-conjugate) | Yes (fluorescent tracer) | Label-free |
| Throughput | High (96/384-well plates) | Medium to High | Low to Medium (multiple flow cells) |
| Low-Affinity Interaction Detection | Limited (washed away) | Excellent | Excellent |
Figure 1: Fundamental Detection Principles Across Immunoassay Platforms - This diagram illustrates how competitive binding between antigens and cross-reactants is translated into measurable signals through different physical principles in ELISA, FPIA, and SPR platforms.
Experimental Data and Performance Comparison
Quantitative comparison of ELISA, FPIA, and SPR reveals significant differences in sensitivity, specificity, and cross-reactivity profiles. A study comparing ELISA and SPR for detecting anti-drug antibodies demonstrated that SPR identified a positivity rate of 4%, compared to only 0.3% by ELISA, with SPR consistently showing higher sensitivity in detecting low-affinity interactions [34]. This enhanced sensitivity for low-affinity binders makes SPR particularly valuable for comprehensive cross-reactivity profiling.
Experimental data from pesticide detection illustrates notable sensitivity differences. In clothianidin detection, a noncompetitive phage ELISA (P-ELISA) demonstrated exceptional sensitivity with a half saturation concentration (SC50) of 0.45 ± 0.02 ng/mL, significantly lower than competitive P-ELISA (IC50 of 3.83 ± 0.23 ng/mL) [33]. The noncompetitive format also showed superior specificity with no cross-reactivity with analogs like imidaclothiz, nitenpyram, and imidacloprid, whereas competitive P-ELISA showed 2.6–18.2% cross-reactivity with these compounds [33].
FPIA has demonstrated excellent performance in real-sample analysis. A recently developed FPIA for 2,4-dichlorophenoxyacetic acid (2,4-D) detection achieved detection limits of 8 ng/mL and 0.4 ng/mL in juice and water samples, respectively, with recovery rates of 95-120% in spiked samples [35]. The entire assay required only 20 minutes, significantly faster than traditional ELISA methods [35].
Table 2: Experimental Performance Comparison Across Applications
| Application Target | Assay Format | Sensitivity (LOD/IC50) | Cross-Reactivity Profile | Reference |
|---|---|---|---|---|
| Deoxynivalenol (DON) in Wheat | SPR | Matrix effects too high for reliable use | Not determinable due to interference | [36] |
| Deoxynivalenol (DON) in Wheat | ELISA | LOD: 233 μg/kg (wheat), 458 μg/kg (wheat dust) | Linear correlation (r=0.889) between wheat and dust | [36] |
| Clothianidin Pesticide | Competitive P-ELISA | IC50: 3.83 ± 0.23 ng/mL | 2.6-18.2% cross-reactivity with analogs | [33] |
| Clothianidin Pesticide | Noncompetitive P-ELISA | SC50: 0.45 ± 0.02 ng/mL | No cross-reactivity with analogs | [33] |
| 2,4-D Herbicide | FPIA | LOD: 0.4 ng/mL (water), 8 ng/mL (juice) | Not specified; recovery: 95-120% | [35] |
| Anti-Drug Antibodies | SPR | 4% positivity rate | Enhanced detection of low-affinity interactions | [34] |
| Anti-Drug Antibodies | ELISA | 0.3% positivity rate | Limited detection of low-affinity interactions | [34] |
Matrix effects present significant challenges in cross-reactivity assessment, particularly for SPR. In DON screening, SPR demonstrated substantial matrix interference from wheat and wheat dust, making the method unreliable without extensive sample cleanup [36]. In contrast, ELISA and BLI methods were successfully validated according to Commission Regulation 519/2014/EC and Commission Decision 2002/657/EC criteria, demonstrating better matrix tolerance [36].
The impact of assay format on cross-reactivity is further evidenced by research showing that cross-reactivity is not an intrinsic antibody property but varies significantly with assay format and reagent concentrations [1]. Studies with sulfonamides and fluoroquinolones demonstrated that shifting to lower reagent concentrations decreased cross-reactivities by up to five-fold, enabling modulation of immunodetection selectivity without changing binding reactants [1].
Methodologies and Experimental Protocols
ELISA Protocol for Cross-Reactivity Assessment
The standard protocol for competitive ELISA involves several critical steps. First, microplate coating is performed by adsorbing a known antigen (or antibody) to the solid phase, typically using 96-well polystyrene plates [32]. After overnight incubation at 4°C or 1-2 hours at 37°C, plates are washed with PBS-Tween buffer to remove unbound components [32]. A blocking step follows using proteins like BSA or casein to prevent nonspecific binding [32].
For the competitive reaction, a mixture of sample (or standard) and specific antibody is added to the wells and incubated for 1-2 hours at room temperature [32] [33]. After washing, an enzyme-labeled secondary antibody (e.g., horseradish peroxidase or alkaline phosphatase conjugate) is added for detection [32]. Following another wash, a chromogenic substrate (e.g., TMB for peroxidase or pNPP for phosphatase) is added, and the reaction is stopped after optimal color development [32]. The absorbance is measured at appropriate wavelengths (e.g., 450 nm for TMB), and data are analyzed by plotting a standard curve of absorbance versus analyte concentration to determine IC50 values for cross-reactivity calculation [32] [33].
FPIA Protocol for Cross-Reactivity Assessment
FPIA implementation begins with tracer preparation, where the target analyte is conjugated to a fluorescent dye (e.g., fluorescein) with carefully optimized spacer length [35]. The assay is performed by mixing fixed concentrations of antibody and tracer with varying concentrations of analyte or cross-reactants in appropriate buffers [35]. After a brief incubation period (typically 5-20 minutes), the fluorescence polarization is measured using a specialized reader [35].
The polarization values (mP units) are plotted against analyte concentration to generate a standard curve [35]. For cross-reactivity determination, the same procedure is repeated with structural analogs, and IC50 values are calculated for each compound [1]. Cross-reactivity percentages are then determined using the standard formula: (IC50 target analyte / IC50 cross-reactant) × 100% [1]. Sample preparation for FPIA typically involves simple dilution in buffer, though complex matrices may require additional cleanup [35].
SPR Protocol for Cross-Reactivity Assessment
SPR analysis begins with sensor surface preparation, typically involving immobilization of the ligand (antibody or antigen) onto the sensor chip surface using covalent coupling methods (e.g., amine coupling) or affinity capture (e.g., protein A/G) [34]. Proper surface regeneration optimization is critical for reusable sensor chips [34].
For kinetic analysis, analyte solutions at various concentrations are injected over the sensor surface at a constant flow rate, followed by buffer flow to monitor dissociation [34]. The real-time binding response is recorded as resonance units (RU) versus time, generating sensorgrams for both target analyte and cross-reactants [34]. Data are fitted to appropriate binding models to determine kinetic parameters (ka, kd) and affinity constants (KD) [34]. Cross-reactivity assessment in SPR can be based on either kinetic parameters or response levels at fixed analyte concentrations compared to the primary target [36].
Figure 2: Cross-Reactivity Assessment Workflow Comparison - This flowchart illustrates the generalized experimental workflow for cross-reactivity assessment, highlighting the critical divergence points between ELISA, FPIA, and SPR methodologies, particularly regarding separation requirements and detection mechanisms.
Research Reagent Solutions and Essential Materials
Successful cross-reactivity assessment requires careful selection of reagents and materials optimized for each platform. The following table details essential components for each methodology.
Table 3: Essential Research Reagents and Materials for Cross-Reactivity Studies
| Category | ELISA | FPIA | SPR |
|---|---|---|---|
| Solid Phase/Platform | 96-well microplates (polystyrene, polyvinyl) [32] | - | Sensor chips (gold surface, carboxymethyl dextran) [34] |
| Detection Labels | Enzyme conjugates (HRP, AP), chromogenic substrates (TMB, pNPP) [32] | Fluorescent tracers (fluorescein derivatives), polarized light detection [35] | Label-free; relies on refractive index changes [34] |
| Immobilization Chemistry | Passive adsorption, covalent coupling | - | Amine coupling, thiol chemistry, affinity capture (protein A/G) [34] |
| Buffer Systems | Coating buffer (carbonate/bicarbonate), PBS/TBS washing buffer, blocking solutions (BSA, casein) [32] | Phosphate or borate buffers with potential additives to reduce matrix effects [35] | HBS-EP running buffer (HEPES with EDTA and surfactant) [34] |
| Critical Equipment | Microplate washer, microplate reader (450 nm) [32] | Fluorescence polarization reader [35] | SPR instrument with fluidics system and temperature control [34] |
| Regeneration Solutions | - | - | Glycine-HCl (low pH), NaOH solutions for surface regeneration [34] |
Antibody selection represents perhaps the most critical reagent consideration across all platforms. Both monoclonal and polyclonal antibodies can be used, with monoclonal antibodies generally providing higher specificity due to their single-epitope recognition, while polyclonal antibodies may exhibit broader cross-reactivity patterns [15]. Antibody fragments such as Fab, Fab', scFv, and scAb offer advantages for SPR due to their smaller size, enabling higher density immobilization and potentially improved sensitivity [15].
For tracer development in FPIA, the spacer length between the fluorophore and antigen significantly influences assay performance, with longer spacers (e.g., four CH2 groups in 2,4-D-BDF) often providing better sensitivity than shorter spacers (e.g., one CH2 group in 2,4-D-GAF) [35]. In SPR, proper surface functionalization is crucial, with oriented immobilization approaches (e.g., using protein A/G or site-specific chemistry) typically providing superior results compared to random orientation [15].
The comparative analysis of ELISA, FPIA, and SPR for cross-reactivity assessment reveals distinct advantages and limitations for each platform. ELISA remains the most accessible and cost-effective method, with well-established protocols and high throughput capabilities, though it may lack sensitivity for low-affinity interactions and requires multiple processing steps [32] [34]. FPIA offers significant advantages in speed and simplicity with its homogeneous format, making it ideal for rapid screening applications, though it requires specialized tracer development and instrumentation [35]. SPR provides the most comprehensive characterization through real-time kinetic monitoring and label-free detection, enabling detailed mechanistic understanding of cross-reactive interactions, though it has higher instrumentation costs and greater technical complexity [34].
The selection of an appropriate platform for cross-reactivity assessment should consider specific research objectives, with ELISA suitable for high-throughput screening, FPIA ideal for rapid analysis of limited sample numbers, and SPR most valuable when detailed kinetic characterization is required. Importantly, cross-reactivity should not be viewed solely as an assay limitation but as a modifiable parameter that can be strategically exploited or minimized through careful assay design and optimization [31] [1]. As immunoassay technologies continue to evolve, the integration of these platforms with emerging approaches like aptamer-based detection and multiplexed analysis will further enhance cross-reactivity assessment capabilities for biosensor research and development [15].
Leveraging SELEX with Counter-Selection for High-Specificity Aptamer Development
The pursuit of high-specificity binding molecules is a cornerstone of modern diagnostics and therapeutic development. For decades, antibodies have served as the gold standard biorecognition elements in immunosensors, prized for their innate ability to bind targets with high affinity and specificity [15]. However, this traditional paradigm faces significant challenges, particularly concerning cross-reactivity—the unwanted binding to non-target molecules with structural similarities to the primary target [31]. In clinical and environmental diagnostics, such cross-reactivity can lead to false positives, reduced accuracy, and compromised decision-making [37].
Aptamers, often termed "chemical antibodies," have emerged as powerful alternatives to traditional antibodies. These short, single-stranded DNA or RNA oligonucleotides are developed through Systematic Evolution of Ligands by Exponential Enrichment (SELEX) [38] [15]. Their unique value proposition lies in their synthetic origin, thermal stability, low cost, and amenability to chemical modification [38] [19]. Most importantly, the SELEX process can be strategically engineered with counter-selection steps specifically designed to minimize cross-reactivity and enhance target specificity [38] [39]. This methodological refinement addresses a critical need in biosensing: the reliable detection of target molecules in complex samples where structurally similar interferents are present.
This review comprehensively compares the performance of counter-selection-enhanced SELEX against traditional antibody-based approaches, with a specific focus on cross-reactivity management. We provide experimental data and protocols to guide researchers in developing high-specificity aptamers for demanding applications in diagnostics, drug development, and environmental monitoring.
Cross-Reactivity Assessment in Immunosensors vs. Aptasensors
The Fundamental Differences in Generation and Structure
The fundamental differences in how antibodies and aptamers are generated and structured underpin their distinct cross-reactivity profiles.
Antibodies are biological proteins produced by the immune systems of living hosts. Their production is constrained by immunogenicity, limiting the range of targets they can effectively recognize [38]. The in vivo generation process is lengthy, often requiring ~6 months or longer [38]. While antibodies exhibit remarkable specificity, their cross-reactivity is an inherent biological phenomenon. This characteristic is sometimes leveraged in selective arrays but remains a significant drawback for applications requiring precise, single-target recognition [31].
Aptamers, in contrast, are identified entirely in vitro through the SELEX process, typically requiring only ~2–8 weeks [38]. They are synthetic molecules that fold into specific three-dimensional structures, enabling selective binding. A key advantage is their ability to be generated against a broader range of targets, including non-immunogenic and toxic molecules [38]. The SELEX process itself provides a powerful mechanism to actively shape specificity through strategic selection pressures.
Strategic Use of Counter-Selection in SELEX
Counter-selection is a powerful SELEX modification designed to eliminate cross-reactive sequences and enhance specificity. This process involves incubating the oligonucleotide library with non-target molecules (counter-targets) that are structurally similar to the primary target. Sequences binding to these counter-targets are discarded, thereby negatively selecting for cross-reactivity and enriching the pool for sequences specific to the target of interest [38] [37].
- Integration in Workflow: Counter-selection can be performed between selection rounds or specifically in the final few rounds of SELEX [38]. The concentration of the counter target should match that of the positive target to ensure effective competition [38].
- Objective: The primary goal is to remove aptamer candidates that recognize epitopes or structural motifs common to both the target and non-target molecules, thereby purifying the pool towards high-specificity binders.
The following workflow diagram illustrates how counter-selection is integrated into the SELEX process, specifically using the Capture-SELEX method, to generate high-specificity aptamers.
Comparative Performance Data: Aptamers vs. Antibodies
The theoretical advantages of aptamers are substantiated by experimental data comparing their affinity, specificity, and operational performance against antibodies. The table below summarizes key performance metrics from published studies.
Table 1: Comparative Performance of Aptamers and Antibodies in Biosensing
| Parameter | Aptamers (with Counter-Selection) | Traditional Antibodies | Experimental Context & Citation |
|---|---|---|---|
| Affinity (KD) | Nanomolar to picomolar range (e.g., 64 nM for DTX-1 aptamer [40]; tens of nM for CspZ aptamers [37]) | Nanomolar to picomolar range | Binding characterization via BLI/SPR [37] [40]. |
| Specificity/ Cross-Reactivity | Can distinguish between closely related analogs (e.g., DTX-1 vs. Okadaic Acid [40]) | Often exhibits cross-reactivity with analogs, viewed as a limitation but sometimes leveraged in arrays [31] | Specificity validated against structural analogs [31] [40]. |
| Development Time | ~2–8 weeks [38] | ~6 months or longer [38] | In vitro vs. in vivo generation process [38]. |
| Stability | Thermally stable; can undergo repeated denaturation/renaturation [38] [37] | Sensitive to temperature and pH; irreversible denaturation [38] | Long-term storage and handling [37]. |
| Production Cost | Low; chemical synthesis, no batch variability [15] [37] | High; biological production, significant batch-to-batch variability [15] | Large-scale production considerations [15]. |
| Modification | Easy chemical modification with functional groups (biotin, fluorescein, etc.) [38] [40] | Complex conjugation; modification can impair binding [38] | Suitability for sensor immobilization and labeling [38]. |
Case Study: High-Affinity, High-Specificity Aptamer for DTX-1
A compelling example of counter-selection's power comes from the development of an aptamer against Dinophysistoxin-1 (DTX-1), a potent marine toxin. Researchers employed magnetic bead-based SELEX with counter-selection against structural analogs like Okadaic Acid (OA) [40].
- Result: The selected aptamer exhibited a high affinity (KD of 64 nM) for DTX-1 and demonstrated minimal cross-reactivity with OA, a molecule with a very similar structure [40]. This high specificity was critical for developing a biolayer interferometry (BLI) biosensor that could detect DTX-1 without interference from the more common OA.
- Comparison: The study noted that antibody-based ELISA for this toxin family often suffers from severe cross-reactivity because antibodies are typically directed against the common phosphatase inhibitor structure, making it difficult to distinguish between different toxin analogs [40]. This case highlights how counter-SELEX can solve a specific problem that challenges antibody-based methods.
Case Study: Aptamers for Lyme Borreliosis Diagnosis
In another study, researchers used a cross-over SELEX process (combining FluMag-SELEX and cell-SELEX) to generate DNA aptamers against the CspZ protein of Borrelia burgdorferi, the bacterium causing Lyme disease [37].
- Result: The selected aptamers showed KD values ranging from tens of nanomolar to micromolar, with the best candidates (Apta9 and Apta10) able to specifically recognize the whole bacterium [37]. The process was designed to select for aptamers binding to epitopes accessible on the bacterial surface in their native conformation, enhancing diagnostic utility.
- Context: This addresses a key limitation of standard serological tests for Lyme disease, which have low sensitivity in early stages and can produce false positives due to cross-reactivity with other bacteria [37]. The aptamer-based approach aims for a more direct and specific detection method.
Experimental Protocols for Key Methodologies
Protocol: Capture-SELEX with Counter-Selection for Small Molecules
Capture-SELEX is particularly effective for selecting aptamers against small molecules, which are difficult to immobilize directly [38] [39]. The following protocol is adapted from established procedures.
- Library Design: Use a ssDNA library featuring a central random region (e.g., 40 nucleotides) flanked by fixed primer binding sites. The library must include a docking sequence complementary to a biotinylated capture oligonucleotide [38] [39].
- Hybridization and Immobilization: Hybridize the ssDNA library with the biotinylated capture oligonucleotide. Immobilize the resulting duplex onto streptavidin-coated magnetic beads (SA-MBs). Wash to remove unbound sequences [38].
- Counter-Selection (Negative Selection): Incubate the immobilized library with a solution containing the counter-target (e.g., a structural analog of the primary target). Collect and discard all sequences that elute during this step, as they represent binders to the non-target molecule [38] [37].
- Positive Selection: Incubate the remaining bead-bound library with the primary target. Sequences that undergo a conformational change upon target binding, disrupting their hybridization with the capture probe, will be eluted from the beads. Collect this eluate [38] [39].
- Amplification and Regeneration: Amplify the eluted ssDNA by PCR. Regenerate the ssDNA pool for the next selection round. Methods include:
- Monitoring and Sequencing: Monitor enrichment over 8-20 rounds. Clone and sequence the final pool (e.g., via Sanger or Next-Generation Sequencing) to identify candidate aptamer families [38].
Protocol: Cross-Over SELEX for Protein and Cell Targets
This protocol is adapted from the successful selection of aptamers against the Borrelia CspZ protein and whole bacteria [37].
- Target Immobilization: Immobilize the recombinant protein target (e.g., His-tagged or GST-fused CspZ) onto magnetic beads. Use different protein tags in alternating rounds to avoid selecting for tag-specific aptamers [37].
- FluMag-SELEX Rounds: Perform initial selection rounds using the immobilized protein. Include counter-selection steps with bare beads or non-target proteins to remove non-specific binders [37].
- Cell-SELEX Round: Introduce a round of selection using whole bacterial cells expressing the target protein in its native conformation on the surface. This enriches for aptamers recognizing accessible epitopes [37].
- Affinity and Specificity Characterization:
The Scientist's Toolkit: Essential Research Reagents
Successful implementation of high-specificity SELEX requires a set of core reagents and materials. The following table details essential components for setting up a SELEX experiment with counter-selection.
Table 2: Key Research Reagent Solutions for SELEX with Counter-Selection
| Reagent / Material | Function and Importance in SELEX | Example Specifications / Notes |
|---|---|---|
| ssDNA Initial Library | The starting pool of ~10^14-10^15 random sequences from which aptamers are selected. | Typically 60-80 nt with a central random region; critical for initial diversity [38] [37]. |
| Biotinylated Capture Oligo | In Capture-SELEX, hybridizes with the library's docking site for immobilization on solid support. | Must be complementary to the library's fixed region; HPLC-purified [38] [39]. |
| Streptavidin Magnetic Beads | Solid support for immobilizing the biotinylated library or target proteins. Enables rapid separation via magnetic rack. | e.g., Dynabeads [37] [40]; bead size and coating consistency are important. |
| Target Molecule | The molecule against which high-affinity, specific aptamers are to be selected. | High purity is essential. For small molecules, a functional group for potential immobilization is helpful. |
| Counter-Target Molecules | Structurally similar non-target molecules used for negative selection to eliminate cross-reactive binders. | e.g., For a toxin like DTX-1, Okadaic Acid is a key counter-target [40]. |
| PCR Reagents | Enzymes and nucleotides for amplifying the enriched pool after each selection round. | Use high-fidelity polymerases to minimize mutations (e.g., GoTaq Hot Start Master Mix [37]). |
| Binding/Wash Buffers | Define the selection environment (pH, ionic strength, divalent cations) which influences aptamer folding and binding. | Often contain Tris-HCl, NaCl, and MgCl₂; composition may be optimized [37] [40]. |
The strategic integration of counter-selection into the SELEX process represents a significant advancement in the generation of high-specificity molecular recognition elements. As the comparative data and case studies demonstrate, aptamers developed through these refined methods can achieve affinities rivaling antibodies while offering superior specificity in discriminating between closely related analogs. This directly addresses the pervasive challenge of cross-reactivity that complicates both immunosensor applications and traditional aptamer selection.
The in vitro nature of SELEX, combined with the power of counter-selection, provides researchers with a programmable and controllable tool to "teach" an oligonucleotide pool what not to bind, thereby actively purifying for the desired target specificity. While antibodies remain vital tools, the documented advantages of aptamers—including faster development, lower cost, superior stability, and ease of modification—make them increasingly compelling for developing next-generation biosensors [38] [15] [19]. The provided experimental protocols and reagent toolkit offer a foundation for researchers in diagnostics and drug development to leverage these techniques, potentially unlocking new capabilities in sensitive and reliable detection across complex clinical and environmental samples.
Sulfamethazine (SMZ) is a widely used sulfonamide antibiotic in livestock farming for treating bacterial infections. However, its overuse leads to residues in animal-derived foods, which can accumulate in the human body through the food chain, causing allergic reactions, toxic responses, and contributing to antibiotic resistance. Regulatory bodies in the European Union, United States, and China have established a maximum residue limit (MRL) of 100 μg/kg for SMZ in food products [41] [42]. The critical challenge in monitoring SMZ residues lies in achieving highly specific detection amidst structurally similar sulfonamide compounds and other antibiotics that may be present in complex food matrices. This case study examines how aptasensor technology, particularly fluorescent-based platforms, addresses the persistent challenge of cross-reactivity that has limited traditional immunoassays, providing researchers with a powerful tool for accurate antibiotic residue analysis.
Experimental Protocol: Fe₃O₄/Au/g-C₃N₄ Fluorescent Aptasensor Construction
Materials and Reagents
- Aptamer Probe: FAM-labeled SMZ1S aptamer (5′-CGTTAGACG-3′; Kd = 24.6 nM) synthesized by Sangon Biotech [41]
- Nanocomposite Synthesis: Fe₃O₄/Au/g-C₃N4 prepared through hydrothermal synthesis [41]
- Binding Buffer: 100 mM NaCl, 2 mM MgCl₂, 20 mM Tris-HCl, 1 mM CaCl₂, 5 mM KCl, and 0.02% Tween 20 (pH 7.6) [41]
- SMZ Standards: SMZ and other antibiotic standards purchased from Sigma-Aldrich [41]
Sensor Preparation and Detection Procedure
Nanocomposite Blocking: 1 mL of 1 mg/mL Fe₃O₄/Au/g-C₃N₄ was sonicated for 30 minutes, then incubated with 10 μL of 1 mg/mL PEG 20,000 for 12 hours at 4°C to block nonspecific binding sites [41]
Aptamer-Target Incubation: 199 μL of 100 nM FAM-SMZ1S was incubated with 1 μL of SMZ standard at varying concentrations (0-100 ng/mL) for 30 minutes at 25°C in the dark [41]
Fluorescence Quenching: 60 μL of 1 mg/mL Fe₃O₄/Au/g-C₃N₄ was added to the mixture and incubated for 5 minutes [41]
Magnetic Separation: The supernatant was collected by magnetic separation [41]
Fluorescence Measurement: Fluorescence intensity was measured at λex = 492 nm and λem = 518 nm using Varioskan LUX [41]
Data Analysis: The standard curve was constructed based on fluorescence intensity versus SMZ concentration, with LOD calculated as 3 SD/slope [41]
Table 1: Key Performance Metrics of the Fe₃O₄/Au/g-C₃N₄ Fluorescent Aptasensor
| Parameter | Specification | Experimental Value |
|---|---|---|
| Detection Principle | Fluorescence quenching | FRET-based |
| Linear Range | 1–100 ng/mL | 1–100 ng/mL |
| Limit of Detection (LOD) | 0.16 ng/mL | 0.16 ng/mL |
| Recovery Rate | Accuracy in real samples | 91.6–106.8% |
| Coefficient of Variation | Precision of measurement | 2.8–13.4% |
| Correlation with HPLC | Validation with standard method | R² ≥ 0.9153 |
Comparative Performance Analysis
Cross-Reactivity Assessment
A critical component of specificity evaluation involved testing the aptasensor against structurally similar compounds. The selectivity assay demonstrated minimal cross-reactivity with other sulfonamides (sulfanilamide, sulfameter, sulfadiazine, sulfamethoxypyridazine) and commonly used antibiotics (chloramphenicol, kanamycin, chlortetracycline) at 100 ng/mL concentration [41]. Molecular dynamics simulations revealed the structural basis for this high specificity, showing stable binding configurations between the SMZ1S aptamer and SMZ with significantly lower root mean square deviation (RMSD) values compared to other antibiotics [41].
Table 2: Cross-Reactivity Profile of SMZ Aptasensor Against Structural Analogs
| Compound Tested | Chemical Class | Relative Response | Implication for Specificity |
|---|---|---|---|
| Sulfamethazine (SMZ) | Sulfonamide | 100% | Target compound |
| Sulfanilamide | Sulfonamide | Minimal signal | High specificity maintained |
| Sulfameter | Sulfonamide | Minimal signal | High specificity maintained |
| Sulfadiazine | Sulfonamide | Minimal signal | High specificity maintained |
| Chloramphenicol | Amphenicol | Minimal signal | No cross-reactivity |
| Kanamycin | Aminoglycoside | Minimal signal | No cross-reactivity |
| Chlortetracycline | Tetracycline | Minimal signal | No cross-reactivity |
Comparison with Alternative Detection Platforms
The fluorescent aptasensor performance shows distinct advantages and characteristics when compared with other sensor architectures and conventional methods for SMZ detection.
Table 3: Performance Comparison Across SMZ Detection Platforms
| Detection Method | Principle | LOD | Linear Range | Cross-Reactivity | Sample Matrix |
|---|---|---|---|---|---|
| Fe₃O₄/Au/g-C₃N₄ Aptasensor [41] | Fluorescence quenching | 0.16 ng/mL | 1-100 ng/mL | Minimal | Milk, egg, honey, swine tissue |
| MnO₂ Aptasensor [43] | Fluorescence quenching | 3.25 ng/mL | 5-40 ng/mL | Not specified | Soil, water, egg, beef |
| MIP/CNT/MoS₂-CoNi Sensor [42] | Electrochemical | 0.033 μM (~8.6 ng/mL) | 0.1-800 μM | Not specified | Meat samples |
| Direct Competitive ELISA [44] | Immunoassay | 10 ng/g | Not specified | Cross-reactivity with sulfamerazine | Pork tissues |
| HPLC [41] | Chromatography | Reference method | Reference method | High separation | Multiple food matrices |
Visualization of Aptasensor Working Principle
Fluorescence Quenching Mechanism
Diagram 1: Fluorescence Quenching and Recovery Mechanism - The working principle of the Fe₃O₄/Au/g-C₃N₄ aptasensor showing the fluorescence "turn-on" response upon SMZ binding.
The Scientist's Toolkit: Essential Research Reagents
Table 4: Key Research Reagents for Aptasensor Development
| Reagent / Material | Function / Role | Specification / Notes |
|---|---|---|
| SMZ1S Aptamer [41] | Recognition element | 5′-CGTTAGACG-3′; Kd = 24.6 nM |
| Fe₃O₄/Au/g-C₃N₄ [41] | Fluorescence quencher & platform | Magnetic separation, π-π stacking with aptamer |
| FAM Fluorescent Dye [41] | Signal reporter | Covalently linked to aptamer; λex=492nm, λem=518nm |
| PEG 20,000 [41] | Blocking agent | Reduces nonspecific binding on nanocomposite |
| Tris-HCl Buffer [41] | Binding buffer | Optimal pH 7.6 with divalent cations (Mg²⁺, Ca²⁺) |
| SAs16-1 Aptamer [45] | Broad-spectrum detection | 5′-AGGGCTTCAACGGCAC-3′; detects multiple sulfonamides |
Discussion: Implications for Cross-Reactivity Assessment in Sensor Research
The exceptional specificity of the SMZ aptasensor, achieving minimal cross-reactivity with structurally similar sulfonamides, demonstrates a significant advancement over traditional antibody-based assays. Where polyclonal antibodies in ELISA formats showed notable cross-reactivity with sulfamerazine [44], the SMZ1S aptamer maintains discrimination between closely related analogs. This performance highlights a key advantage of aptamer-based recognition: the ability to fine-tune specificity through SELEX optimization and post-selection modification.
The integration of molecular dynamics simulations provides a structural rationale for the observed specificity, offering researchers a powerful tool for predicting and understanding cross-reactivity patterns [41]. This computational approach enables rational design of aptamer sequences to minimize unwanted cross-reactions while maintaining high affinity for the target analyte—a crucial consideration in complex matrices where multiple structurally related compounds may coexist.
Furthermore, the platform's versatility allows for adaptation to broad-spectrum detection when desired. Research has demonstrated that through strategic aptamer engineering, sensors can be designed to detect multiple sulfonamides simultaneously using broad-spectrum aptamers like SAs16-1 [45], providing flexibility depending on monitoring objectives. This case study illustrates how aptasensor technology effectively addresses the cross-reactivity challenges that have historically limited immunosensor applications in antibiotic residue monitoring.
The Fe₃O₄/Au/g-C₃N₄ fluorescent aptasensor represents a significant advancement in SMZ detection technology, combining exceptional sensitivity (LOD 0.16 ng/mL) with remarkable specificity in complex food matrices. The platform's minimal cross-reactivity with structurally similar sulfonamides and other antibiotic classes addresses a fundamental challenge in residue analysis, while its performance correlates strongly with reference HPLC methods (R² ≥ 0.9153). The integration of molecular dynamics simulations provides researchers with valuable insights into the structural basis of aptamer-target interactions, enabling rational design approaches to optimize specificity. As antibiotic resistance continues to pose global health challenges, such precise detection technologies play an increasingly vital role in monitoring veterinary drug residues and safeguarding the food supply.
The strategic tuning of antibody selectivity is a cornerstone in the development of robust immunoassays and immunosensors. For researchers and drug development professionals, the ability to precisely control whether an antibody recognizes a single analyte or a class of structurally related compounds is crucial for applications ranging from environmental monitoring to clinical diagnostics. This capability directly impacts the assay's utility, determining if it is suited for targeted quantification or broad-spectrum screening. This case study examines the systematic comparison of immunization strategies—single-sulfonamide immunogen, designed-hapten immunogen, and multi-immunogen approaches—for generating monoclonal antibodies (mAbs) against sulfonamides (SAs), a class of veterinary antimicrobials [46]. The findings provide a framework for rationally engineering immunoassay selectivity through controlled immunization and assay condition optimization.
Strategic Comparison of Immunization Methods
The pursuit of broad-specificity antibodies necessitates a deliberate choice of immunization strategy. Each method presents a distinct approach to educating the immune system, with significant implications for the resulting antibody profile.
- Single-Sulfonamide Immunogen Strategy: This conventional approach involves immunizing with a hapten derived from a single sulfonamide (e.g., sulfadiazine, sulfamethazine) conjugated to a carrier protein. It aims to produce antibodies with high specificity for the immunizing compound. However, its major limitation is often restricted cross-reactivity, resulting in a narrow detection profile across the SA family [46].
- Designed-Hapten Immunogen Strategy: This rational design approach uses computationally designed haptens that mimic the common core structure of the target analyte class—in this case, the 4-amino-benzenesulfonamide moiety of SAs. The hapten is engineered to expose this shared structure to the immune system, thereby promoting the selection of B-cells producing antibodies that recognize this common epitope. Haptens may feature modified N1 positions with pyrimidine, pyridine, or phenyl rings to direct the immune response toward conserved regions [46].
- Multi-Immunogen Strategy: This "mixed" or "sequential" immunization strategy simultaneously presents the immune system with a diverse set of epitopes by administering a mixture of immunogens derived from different SAs. This study employed a mixture of seven different single-sulfonamide immunogens. This method presents a broader array of antigenic structures, potentially stimulating a polyclonal response that favors the expansion of B-cell clones producing antibodies with paratopes capable of accommodating structural variations within the analyte class [46].
Table 1: Comparison of Immunization Strategies for Generating Broad-Specificity mAbs against Sulfonamides
| Immunization Strategy | Number of Immunogens | Key Principle | Resulting mAb Characteristics | Key Finding |
|---|---|---|---|---|
| Single-Sulfonamide Immunogen | 7 different individual immunogens | Exposure to a single, specific SA structure | High specificity to the immunogen; limited cross-reactivity to other SAs | Produced mAbs with narrow recognition profiles [46] |
| Designed-Hapten Immunogen | 5 designed haptens | Rational hapten design to expose common core structure | Variable broad-specificity; success depends on hapten design accuracy | Yielded mAbs with moderate broad-specificity [46] |
| Multi-Immunogen | 1 mixture of 7 SA immunogens | Simultaneous exposure to multiple, diverse SA structures | Superior broad-specificity; identified up to 25 different SAs | The most effective strategy for generating broad-specificity mAbs [46] |
Experimental Protocols for Cross-Reactivity Assessment
A critical phase following antibody production is the thorough evaluation of cross-reactivity. The following protocols detail the key steps for characterizing antibody selectivity and understanding the molecular basis of recognition.
Antibody Characterization and Cross-Reactivity Profiling
This protocol outlines the process for determining the spectrum of analytes recognized by the produced mAbs [46].
- Hybridoma Generation and mAb Production: Following immunization of BALB/c mice with the respective immunogen strategies, spleen cells are fused with myeloma cells to generate hybridomas. Stable clones are expanded for mAb production.
- Checkerboard Immunoassay: A checkerboard assay is performed to determine the optimal working concentrations of the mAb and heterologous coating antigens. This involves titrating both components to identify the condition that provides the maximum signal-to-noise ratio.
- Cross-Reactivity Analysis:
- Procedure: Competitive indirect enzyme-linked immunosorbent assays (ciELISAs) are set up. Microtiter plates are coated with a heterologous SA-protein conjugate.
- Measurement: A fixed concentration of mAb is pre-incubated with a series of concentrations of individual sulfonamides (30 different SAs were tested in the study) before being added to the coated wells.
- Calculation: The half-maximal inhibitory concentration (IC₅₀) is calculated for each SA. Cross-reactivity (CR) is then determined using the formula: CR (%) = (IC₅₀ of the target SA / IC₅₀ of the heterologous SA) × 100%.
Computational Simulation of Antibody-Antigen Interaction
Molecular modeling provides insights into the structural mechanisms governing selectivity [46].
- Molecular Conformation Analysis: The three-dimensional structures of the 30 sulfonamides are built. Their lowest energy conformations are calculated using computational chemistry software (e.g., Gaussian) to understand their stable spatial geometry.
- Electrostatic Potential Mapping: The electrostatic potential surfaces of the sulfonamides are generated and analyzed. This helps identify regions of positive, negative, and neutral charge that could influence binding interactions.
- Molecular Docking:
- Modeling: The three-dimensional structure of the Fab fragment of the broad-specificity mAb is modeled based on its amino acid sequence.
- Docking Simulation: Each sulfonamide is computationally docked into the predicted antigen-binding site (paratope) of the mAb model.
- Interaction Analysis: The resulting docking poses are analyzed to identify key interactions, such as hydrogen bonds, hydrophobic contacts, and van der Waals forces. The specific contact residues in the paratope are identified.
Performance Data and Molecular Insights
Rigorous characterization revealed clear performance differences between the antibodies generated by the various strategies and provided a molecular-level explanation for their selectivity.
Table 2: Performance of Broad-Specificity mAbs from Different Immunization Strategies in Lateral Flow Immunoassay (LFIA)
| mAb Source | Number of SAs Detected | Application in Food Samples | Recovery Rate (%) | Coefficient of Variation (%) |
|---|---|---|---|---|
| Multi-Immunogen Strategy | Up to 25 | Chicken and Pork | 86.1 - 105.1 | 2.1 - 10.9 |
| Designed-Hapten Strategy | Information not specified | Not reported in study | Not reported in study | Not reported in study |
| Single-Immunogen Strategy | Information not specified | Not reported in study | Not reported in study | Not reported in study |
The molecular docking studies revealed a critical insight: the –SO₂NH– moiety of the sulfonamides was identified as the key binding site for the broad-specificity mAbs obtained from the multi-immunogen strategy [46]. This group is common to all sulfonamides, explaining the wide cross-reactivity. The mAbs' paratopes were found to form stable interactions, primarily hydrogen bonds and van der Waals forces, with this conserved functional group, while accommodating the variable N1 substituents of different SAs.
Strategic Workflow for Antibody Generation
The Scientist's Toolkit: Essential Research Reagents
The following reagents and materials are fundamental for experiments aimed at tuning antibody selectivity and developing related immunosensors.
Table 3: Key Research Reagent Solutions for Immunoassay Development
| Reagent/Material | Function in Experiment | Specific Example from Research |
|---|---|---|
| Hapten-Carrier Protein Conjugates | Serve as immunogens (for immunization) and coating antigens (for assay development). Key for defining selectivity. | Bovine serum albumin (BSA) or ovalbumin (OVA) conjugated to single SAs or designed haptens [46]. |
| Monoclonal Antibodies (mAbs) | The primary biorecognition element whose selectivity is being tuned. | mAbs produced from hybridomas derived from mice immunized with different strategies [46]. |
| Chromatographic Materials & Assay Substrates | Solid supports for assay development, particularly for rapid tests. | Nitrocellulose membrane, conjugate pad, sample pad, and absorbent pad used in Lateral Flow Immunoassays (LFIAs) [46]. |
| Electrochemical Sensor Substrates | Transducer platform for converting molecular recognition into a quantifiable electrical signal. | Screen-printed electrodes coated with reduced graphene oxide (rGO) for aptasensor development [5]. |
| Aptamers | Single-stranded DNA or RNA molecules as alternative biorecognition elements; offer high stability and tunability. | Truncated imidacloprid-specific aptamer used in a multiplexed electrochemical biosensor for neonicotinoids [5]. |
Implications for Immunosensor and Aptasensor Research
The principles demonstrated in this case study extend directly into the broader field of biosensing, particularly for immunosensors and the emerging domain of aptasensors. The core challenge of engineering selectivity is universal.
- Rational Design of Biorecognition Elements: Just as hapten design dictates antibody selectivity, the in vitro selection of aptamers can be steered to generate receptors with predefined breadth of specificity. For food allergen detection, aptamers selected against conserved protein epitopes can facilitate the development of broad-specificity aptasensors [47].
- Multiplexing and High-Throughput Screening: The multi-immunogen strategy's success parallels efforts in aptasensor development. Integrating multiple aptamers on a single sensor platform, such as an electrochemical biosensor using reduced graphene oxide, enables the simultaneous detection of several analytes like imidacloprid, thiamethoxam, and clothianidin [5].
- Sensor Surface Chemistry and Assay Conditions: The choice of a heterologous coating antigen in an immunoassay is a powerful tool to fine-tune selectivity post-production. Similarly, in aptasensors, the method of immobilization of the aptamer on the transducer surface and the composition of the assay buffer can significantly influence binding affinity and specificity, allowing for further optimization of the sensor's performance [5].
Molecular Basis of Broad-Specificity Recognition
This case study demonstrates that antibody selectivity is not an immutable property but a tunable parameter that can be systematically engineered. The multi-immunogen strategy proved superior for generating antibodies with broad-specificity against sulfonamides, a finding explained by molecular interactions with the common –SO₂NH– moiety. These principles provide a validated roadmap for researchers to design immunoassays and biosensors with tailored selectivity, whether the goal is to monitor multiple drug residues in food safety or to develop clinical diagnostics for complex biomarkers. The continuous integration of computational design, high-throughput screening, and sophisticated assay optimization will further empower scientists to precisely control biorecognition events for a wide range of applications.
Biosensors are analytical devices that integrate a biological recognition element with a transducer to produce a measurable signal proportional to the concentration of a target analyte. The selection and integration of the biorecognition element—the component that confers specificity to the sensing platform—is arguably the most critical design consideration. For decades, antibodies have served as the gold standard biorecognition element in immunosensors, capitalizing on their exquisite natural specificity. However, the past fifteen years have witnessed the rise of aptamers—synthetic oligonucleotides selected in vitro—as compelling alternatives, leading to the development of aptasensors [15].
This guide provides a comparative analysis of these two dominant biosensor platforms, with a particular emphasis on their performance in the critical area of cross-reactivity. Cross-reactivity, wherein a biorecognition element binds to non-target molecules structurally similar to the intended analyte, is a paramount concern in complex matrices like clinical samples or food extracts. The ability to distinguish between closely related compounds directly impacts the reliability and false-positive rate of a diagnostic or monitoring assay [48]. We will objectively compare the theoretical strengths and weaknesses of each platform and supplement this with experimental data and methodologies from recent, relevant studies to aid researchers in selecting the optimal technology for their specific application.
Biorecognition Elements: Antibodies vs. Aptamers
Immunosensors and Antibodies
Immunosensors employ antibodies or their derivatives (e.g., Fab', scFv) as capture probes. These proteins, produced by the immune system, bind to specific epitopes on antigens with high affinity. A significant design factor is the orientation and immobilization of the antibody on the transducer surface, as random conjugation can block antigen-binding sites. Strategies for oriented immobilization include using protein A/G, coupling via carbohydrate moieties in the Fc region, or employing recombinant fragments with engineered tags (e.g., polyhistidine, AviTag) [15].
Table 1: Key Characteristics of Antibodies and Aptamers
| Characteristic | Antibodies (Immunosensors) | Aptamers (Aptasensors) |
|---|---|---|
| Nature | Proteins (IgG ~150 kDa) | Single-stranded DNA or RNA (10-30 kDa) |
| Production | In vivo (animals) or recombinant | In vitro (SELEX process) |
| Stability | Sensitive to temperature, pH; limited shelf-life | Thermally stable; can be denatured and renatured |
| Modification | Limited sites; can affect functionality | Easily synthesized with functional groups (e.g., thiol, amine, biotin) |
| Target Range | Primarily immunogenic molecules | Ions, small molecules, proteins, cells |
| Immobilization | Can require complex chemistry for orientation | Simple, controllable covalent attachment or affinity binding |
Aptasensors and Aptamers
Aptamers are single-stranded DNA or RNA oligonucleotides selected through the Systematic Evolution of Ligands by EXponential enrichment (SELEX) process. They fold into defined three-dimensional structures (e.g., stems, loops, G-quadruplexes) that bind their targets with high specificity and affinity. Their synthetic nature and smaller size offer distinct advantages, including ease of chemical modification for surface immobilization and superior stability across a range of temperatures and conditions [15] [49].
Comparative Analysis: Theoretical and Experimental Perspectives
Theoretical advantages must be validated through experimental performance. The following section compares both platforms using data from recent studies on relevant biomarkers and contaminants.
Performance in Detecting a Small Molecule: Aflatoxin B1
A 2025 study directly compared an aptasensor and an immunosensor for detecting aflatoxin B1 (AFB1), a potent carcinogen, using the same silver-coated porous silicon (Ag-pSi) SERS substrate. This controlled setup provides an excellent basis for comparison [50].
Table 2: Experimental Comparison for Aflatoxin B1 (AFB1) Detection [50]
| Performance Metric | Aptasensor | Immunosensor |
|---|---|---|
| Detection Principle | SERS (4-ATP labeled Ag-pSi) | SERS (4-ATP labeled Ag-pSi) |
| Linear Range | 0.2 - 200 ppb | 0.2 - 200 ppb |
| Limit of Detection (LOD) | 0.0085 ppb | 0.0110 ppb |
| Enhancement Factor | 7.39 × 10⁷ | 7.39 × 10⁷ |
| Reusability | 7 regeneration cycles | 1 regeneration cycle |
| Accuracy in Food Matrices | Equivalent to HPLC; superior anti-interference | Equivalent to HPLC |
Key Findings: Both sensors showed high sensitivity and excellent correlation with standard HPLC methods. However, the aptasensor demonstrated a significant practical advantage in reusability, withstanding seven regeneration cycles without performance loss, compared to just one cycle for the immunosensor. This highlights the aptamer's superior structural robustness and resistance to denaturation under harsh regeneration conditions [50].
Performance in Detecting a Protein Biomarker: Prostate-Specific Antigen (PSA)
A 2018 study compared label-free aptasensors and immunosensors for detecting PSA, a key cancer biomarker, using graphene quantum dots-gold nanorods (GQDs-AuNRs) modified screen-printed electrodes [49].
Table 3: Experimental Comparison for Prostate-Specific Antigen (PSA) Detection [49]
| Performance Metric | Aptasensor | Immunosensor |
|---|---|---|
| Detection Principle | Electrochemical (GQDs-AuNRs/SPE) | Electrochemical (GQDs-AuNRs/SPE) |
| Techniques Used | CV, DPV, EIS | CV, DPV, EIS |
| Limit of Detection (LOD) | 0.14 ng mL⁻¹ | 0.14 ng mL⁻¹ |
| Performance in Real Samples | Acceptable results | Acceptable results |
| Noted Advantages | Better stability, simplicity, cost-effectiveness | High selectivity |
Key Findings: In this configuration, both platforms achieved an identical and clinically relevant LOD of 0.14 ng mL⁻¹. The study concluded that the aptasensor offered advantages in terms of better stability, simplicity, and cost-effectiveness, while the immunosensor leveraged the well-established selectivity of monoclonal antibodies. This demonstrates that for some protein targets, both biorecognition elements can deliver equivalent analytical performance [49].
Cross-Reactivity Assessment: Fundamentals and Protocols
Cross-reactivity occurs when a biorecognition element binds to analogues of the primary target. Assessment is typically performed using reciprocal inhibition assays, which are more reliable than direct binding tests [48].
Theoretical Framework and Quantification
Cross-reactivity can be symmetric (both allergens can sensitize and inhibit each other) or asymmetric (the primary allergen inhibits binding to the cross-reactive one much more effectively than vice versa). For example, in Northern Europe, birch pollen allergen (Bet v 1) completely inhibits IgE binding to apple allergen (Mal d 1), but Mal d 1 only partially inhibits binding to Bet v 1 [48].
Quantitative parameters from inhibition assays include:
- Fraction of cross-reactive IgE: The proportion of antibodies that recognize both allergens.
- Relative affinity: The difference in binding strength between the primary and cross-reactive allergen.
Detailed Experimental Protocol: Inhibition Assay
This protocol is adapted from methods used to assess allergen cross-reactivity and can be applied to evaluate both immunosensors and aptasensors [48].
Objective: To quantify the cross-reactivity between a primary antigen (Ag1) and a potential cross-reactant (Ag2).
Materials:
- Purified primary antigen (Ag1)
- Purified cross-reactant (Ag2)
- Serum pool containing specific antibodies or purified biorecognition elements (aptamers/antibodies)
- Solid phase (e.g., microtiter plate, sensor chip) coated with Ag1 or Ag2
- Washing buffers (e.g., PBS-Tween)
- Detection system (e.g., enzyme-conjugated secondary antibody, labeled streptavidin)
- Signal substrate (e.g., chromogenic, chemiluminescent)
- Plate reader or appropriate biosensor detector
Procedure:
- Immobilization: Coat separate solid phases with a fixed, optimal concentration of Ag1 and Ag2.
- Inhibition Setup: Pre-incubate a fixed dilution of the serum/recognition element with a series of increasing concentrations (e.g., 0, 0.1, 1, 10, 100 μg/mL) of:
- The homologous inhibitor (Ag1 on Ag1 plates; Ag2 on Ag2 plates).
- The heterologous inhibitor (Ag1 on Ag2 plates; Ag2 on Ag1 plates).
- Include a buffer-only control for maximum signal.
- Binding Reaction: Transfer the pre-incubated mixtures to the corresponding coated solid phases and allow binding to proceed.
- Washing and Detection: Wash away unbound material. Add the detection reagent (e.g., enzyme-conjugated anti-human IgG for serum) and incubate. After further washing, add the substrate and measure the signal.
- Data Analysis: Plot the signal against the logarithm of the inhibitor concentration. Calculate the percent inhibition for each point. The degree of cross-reactivity is assessed by comparing the heterologous and homologous inhibition curves. A significantly less potent heterologous inhibition indicates partial cross-reactivity.
The Scientist's Toolkit: Essential Research Reagents
The following table details key reagents and their functions in developing and evaluating biosensors, based on the cited studies.
Table 4: Essential Research Reagents for Biosensor Development
| Reagent / Material | Function in Biosensor Development | Example Use Case |
|---|---|---|
| Gold Nanoparticles (AuNPs) | Plasmonic transducer; platform for bioconjugation; signal amplification. | SERS-based immunoassay for α-fetoprotein [51]; Cross-reactive aptasensors [52]. |
| Screen-Printed Electrodes (SPEs) | Low-cost, disposable electrochemical transducer platform. | Label-free PSA detection [49]. |
| Graphene Quantum Dots (GQDs) | Nanomaterial enhancing electron transfer; high surface area for immobilization. | Component of GQDs-AuNRs nanocomposite for PSA sensor [49]. |
| 4-Aminothiophenol (4-ATP) | Raman reporter molecule for SERS-based detection. | Label for SERS-based AFB1 aptasensor and immunosensor [50]. |
| Porous Silicon (pSi) | High-surface-area substrate for impregnation with noble metals. | Used as Ag-pSi scaffold for enhanced SERS signal [50]. |
| Chitosan (CH) | Biocompatible polymer for film formation; prevents nanomaterial aggregation. | Matrix for GQDs-AuNRs composite on SPEs [49]. |
| Protein A / Protein G | Affinity proteins for oriented immobilization of antibodies via Fc region. | Used for controlled antibody attachment in immunosensors [15] [50]. |
Both immunosensors and aptasensors are powerful analytical platforms capable of achieving high sensitivity and specificity. The choice between them depends heavily on the specific application requirements.
- Choose Immunosensors when working with well-characterized antibody-antigen pairs, especially for protein targets, and when the established robustness of immunoassays is a priority. However, be mindful of potential limitations in stability, cost, and customizability.
- Choose Aptasensors for targets where high stability, reusability, and lower production costs are critical. They are particularly advantageous for small molecules and in scenarios requiring customized chemical modification or operation in harsh conditions.
Critically, the assessment of cross-reactivity is not merely a regulatory checkbox but a fundamental validation of biosensor specificity. The experimental frameworks and comparative data presented herein provide researchers with a foundation for selecting, developing, and validating the optimal biosensor platform for their specific diagnostic or monitoring challenge.
Troubleshooting and Strategic Optimization for Enhanced Specificity
In the fields of diagnostic medicine, food safety, and environmental monitoring, the accuracy of analytical results is paramount. Cross-reactivity, a phenomenon where a biorecognition element (e.g., an antibody or aptamer) binds not only to its intended target but also to structurally similar molecules, represents a significant source of false positives and compromised data integrity [1]. For researchers and drug development professionals, understanding and mitigating cross-reactivity is crucial for developing reliable assays. A common misconception is that cross-reactivity is an intrinsic and fixed property of the antibodies or aptamers used [1]. However, emerging evidence indicates that the assay format and the concentration of reagents are equally critical, and sometimes dominant, factors in determining the selectivity of an analytical system [1].
This guide objectively compares the performance of two primary bioreceptors—antibodies and aptamers—across various assay formats, focusing on their propensity for cross-reactivity. We summarize experimental data and detail methodologies to provide a clear framework for selecting and optimizing biorecognition elements to minimize analytical errors.
Bioreceptor Pitfalls: A Head-to-Head Comparison
The choice between antibodies and aptamers is fundamental to assay design. The table below compares their key characteristics that influence cross-reactivity.
Table 1: Fundamental Comparison of Antibodies and Aptamers
| Characteristic | Antibodies (Immunosensors) | Aptamers (Aptasensors) |
|---|---|---|
| Biochemical Nature | Proteins (Immunoglobulins) [29] | Short, single-stranded DNA or RNA [53] [19] |
| Production Process | In vivo (Animal immune systems) [53] | In vitro (SELEX process) [53] [19] |
| Stability | Sensitive to temperature; can denature [29] | High thermal stability; can undergo reversible denaturation [19] [54] |
| Modification | Difficult and costly to chemically modify [53] | Easy to chemically synthesize and modify [53] [55] |
| Target Epitopes | Primarily surface epitopes of proteins [53] | Can target a wider range, including small molecules and non-immunogenic targets [29] [55] |
| Affinity & Sensitivity | Generally very high affinity; immunosensors often achieve 2-3 orders of magnitude lower limits of detection (LOD) than aptasensors for the same target [29]. | High affinity, but LODs for aptasensors are typically higher than for immunosensors in direct comparisons [29]. |
| Specificity & Cross-Reactivity Risk | High specificity but can be susceptible to cross-reactivity with homologous proteins [1]. | Can be highly specific; cross-reactivity can be minimized during the SELEX selection process [19]. |
Experimental Evidence: Antibody vs. Aptamer Performance
Quantitative data from the literature highlights the practical performance differences between these bioreceptors. For instance, in the detection of the antibiotic tetracycline, a label-free electrochemical aptasensor demonstrated a limit of detection (LOD) of 1 nM [29]. In contrast, a highly optimized electrochemical immunosensor for the same class of antibiotics achieved a remarkably lower LOD of 13 pM, showcasing the superior affinity often attainable with antibodies [29]. However, this high affinity does not automatically confer superior specificity. One study directly comparing dual-system aptasensors and immunosensors found that the aptasensor generally showed higher sensitivity, stability, and reproducibility in comparable settings [53].
Assay Format Pitfalls: Beyond the Bioreceptor
The belief that cross-reactivity is solely determined by the bioreceptor is a critical pitfall. Research confirms that cross-reactivity is "not an intrinsic characteristic of antibodies but can vary for different formats of competitive immunoassays using the same antibodies" [1]. The following diagram illustrates how the choice of assay format and conditions creates a funnel that either exacerbates or mitigates cross-reactivity risks.
The Impact of Reagent Concentration and Assay Conditions
Mathematical modeling and experimental confirmation have demonstrated that assays requiring sensitive detection and, accordingly, implemented with low concentrations of antibodies and competing antigens are characterized by lower cross-reactivities and are, thus, more specific [1]. Conversely, formats that require high concentrations of markers and interacting reagents exhibit higher cross-reactivity, making them more "class-specific" rather than "analyte-specific" [1]. This effect was experimentally confirmed in a comparison of an enzyme immunoassay (EIA) and a fluorescence polarization immunoassay (FPIA) for sulfonamides and fluoroquinolones, where shifting to lower reagent concentrations decreased cross-reactivities by up to five-fold [1].
Furthermore, the composition of the reaction medium (e.g., pH, ionic strength, presence of denaturants like urea) can dramatically alter the three-dimensional structure of both the target and the bioreceptor, thereby influencing binding affinity and specificity in a poorly predictable manner [1].
Experimental Protocols for Cross-Reactivity Assessment
To ensure the reliability of any biosensing platform, a standardized assessment of cross-reactivity is mandatory. The following section outlines key experimental protocols cited in the literature.
- Coat the microtiter plate wells with a known concentration of the target antigen (or a conjugate).
- Block any remaining protein-binding sites on the plate with an inert protein (e.g., Bovine Serum Albumin).
- Incubate simultaneously:
- A fixed, low concentration of the specific primary antibody.
- A series of dilutions of the target analyte (for the standard curve).
- Separate dilutions of potential cross-reactants (structurally similar molecules).
- Wash the plate to remove unbound antibodies.
- Add an enzyme-labeled secondary antibody (e.g., HRP-anti-IgG) specific to the primary antibody.
- Wash again to remove unbound secondary antibodies.
- Add a substrate for the enzyme. The enzymatic reaction produces a measurable signal (e.g., color, fluorescence).
- Calculate Cross-Reactivity (CR):
- Generate a dose-response curve for both the target analyte and each cross-reactant.
- Determine the concentration that causes a 50% inhibition of the maximum signal (IC50) for each.
- Calculate CR using the formula: CR (%) = [IC50 (target analyte) / IC50 (cross-reactant)] × 100% [1].
- Immobilize the thiol- or amino-modified aptamer onto a functionalized electrode surface (e.g., gold screen-printed electrode).
- Block the electrode surface to minimize non-specific adsorption.
- Baseline Measurement: Immerse the functionalized electrode in an electrolyte solution containing a redox probe (e.g., [Fe(CN)₆]³⁻/⁴⁻) and measure the electrochemical signal (e.g., via Electrochemical Impedance Spectroscopy (EIS) or Cyclic Voltammetry (CV)).
- Incubate the electrode with the target protein. The binding event causes a change in the electrode interface, altering the electrochemical signal.
- Signal Measurement: Measure the signal again in the same redox probe solution. The signal change (e.g., increase in charge transfer resistance, Rct, in EIS) is proportional to the target concentration.
- Cross-Reactivity Test: Repeat steps 3-5 with non-target proteins, especially structurally homologous ones, at the same or higher concentrations. A significant signal change with a non-target protein indicates potential cross-reactivity.
Quantitative Cross-Reactivity Data from Literature
The following table compiles experimental data from various studies to illustrate how cross-reactivity manifests with different targets and assay formats.
Table 2: Experimental Cross-Reactivity Data from Biosensor Studies
| Target Analyte | Cross-Reactant | Bioreceptor & Assay Format | Cross-Reactivity (CR) | Key Finding | Source |
|---|---|---|---|---|---|
| Sulfonamides | Various Sulfonamides | Antibody; FPIA vs. EIA | CR varied up to 5-fold | Assay format and reagent concentration dramatically altered CR without changing the antibody. | [1] |
| Tetracycline | Oxytetracycline | DNA Aptamer; Electrochemical Sensor | KD = 11 nM | Demonstrates the high intrinsic specificity an aptamer can achieve for a small molecule. | [29] |
| Fumonisin B1 (FB1) | N/A | Various Optical & Electrochemical Aptasensors | LOD as low as 0.003 ng/L (Fluorescence) | Highlights the extremely high sensitivity possible with optimized aptasensors, reducing false positives from non-targets. | [55] |
| Cow's Milk Allergens | Homologous milk proteins from different species | Immunosensors / Aptasensors | Risk of cross-reactivity due to homologous proteins | A key pitfall in food safety: assays must distinguish between species-specific allergens. | [56] |
| Viral Proteins | Non-target viruses | SPR Aptasensors | High specificity reported in meta-analysis | The sandwich assay format in SPR aptasensors improves specificity for large targets like whole viruses. | [54] |
The Scientist's Toolkit: Key Research Reagent Solutions
Selecting the right materials is the first step in designing a specific assay. Below is a table of essential reagents and their functions in mitigating cross-reactivity.
Table 3: Essential Research Reagents for Cross-Reactivity Management
| Reagent / Material | Function in Assay Development | Role in Mitigating Cross-Reactivity | |
|---|---|---|---|
| Monoclonal Antibodies | A homogeneous population of antibodies binding a single epitope. | Reduces the chance of cross-reaction from a polyclonal serum that contains antibodies to multiple, sometimes non-specific, epitopes. | [57] |
| Modified Aptamers | Aptamers with chemical groups (e.g., 2'-F, 2'-O-methyl in RNA) or specific secondary structures. | Enhances stability against nucleases and allows for optimized 3D structure for superior target discrimination. | [19] [55] |
| Screen-Printed Electrodes (SPEs) | Disposable, miniaturized electrochemical cells. | Allow for standardized, reproducible testing and easy modification with nanomaterials to boost signal-to-noise ratio. | [58] |
| Nanomaterials (e.g., Graphene, AuNPs) | Used for electrode modification and signal amplification. | Increase surface area and improve electron transfer, allowing work at lower analyte concentrations, which can enhance specificity. | [53] [58] |
| Heterologous Antigens | An antigen derivative used in assay that is different from the one used for immunization. | In competitive immunoassays, this can narrow the spectrum of selectivity by ensuring only a subset of high-affinity antibodies are involved. | [1] |
| Magnetic Beads (MBs) | Microbeads used for immobilizing bioreceptors. | Facilitate efficient separation of bound and unbound molecules in heterogeneous assays, reducing non-specific signal. | [29] |
Cross-reactivity is a multifaceted challenge rooted in both the intrinsic properties of bioreceptors and the extrinsic design of the assay format. While antibodies often provide unrivalled affinity, aptamers offer advantages in stability and manufacturability that can be leveraged to create highly specific sensors. The critical insight for researchers is that cross-reactivity is a tunable parameter. By carefully selecting bioreceptors, employing low reagent concentrations, optimizing assay conditions, and utilizing sophisticated formats like heterogeneous sandwich assays, it is possible to design analytical systems that are precisely tailored for either high specificity for a single compound or broad reactivity for a class of analytes. A deep understanding of these pitfalls and solutions is fundamental to advancing the development of reliable biosensors for critical applications in drug development and clinical diagnostics.
Immunosensors are analytical devices that combine the high specificity of antibody-antigen interactions with a transducer to produce a measurable signal. Their performance is critically dependent on two key optimization parameters: the concentration of immunoreagents (antibodies, antigens) and the kinetics of the assay. These factors directly influence fundamental analytical characteristics, including sensitivity, limit of detection, and crucially, cross-reactivity. Cross-reactivity, the degree to which an immunosensor responds to structurally similar compounds other than the target analyte, is a pivotal parameter in assessing assay specificity. In the broader context of biosensor research, understanding and controlling cross-reactivity is essential for developing reliable diagnostic tools, particularly for applications in clinical diagnostics, environmental monitoring, and food safety where distinguishing between closely related molecules is paramount. This guide provides a comparative analysis of how strategic optimization of reagent concentration and assay kinetics can be leveraged to control immunosensor performance, with a specific focus on managing cross-reactivity.
Experimental Protocols for Optimization
Optimizing Reagent Concentrations Using Experimental Design
The optimization of reagent concentrations is a critical step in immunosensor development. The Box-Behnken experimental design, a response surface methodology, provides a systematic and efficient approach to this process. The following protocol, adapted from the optimization of an electrochemical immunosensor for the epithelial sodium channel (ENaC) protein, details the procedure [59].
- Objective: To determine the optimal combination of anti-ENaC concentration, glutaraldehyde incubation time, and anti-ENaC incubation time that maximizes the immunosensor's current response.
- Materials:
- Screen-printed carbon electrode (SPCE)
- Gold nanoparticles (AuNPs)
- Cysteamine
- Glutaraldehyde
- Anti-ENaC antibody
- ENaC protein (antigen)
- Phosphate buffered saline (PBS), pH 7.4
- Potentiostat with electrochemical impedance spectroscopy (EIS) capability
- Procedure:
- Electrode Modification: Modify the SPCE surface with AuNPs to enhance the electroactive surface area and biocompatibility.
- Self-Assembled Monolayer (SAM) Formation: Immerse the AuNP-modified SPCE in a cysteamine solution. Cysteamine forms a SAM via its thiol group, presenting free amine groups on the surface.
- Cross-linking: Incubate the electrode with glutaraldehyde. Its aldehyde groups covalently bind to the amine groups of cysteamine.
- Antibody Immobilization: Attach the anti-ENaC antibody to the glutaraldehyde-activated surface via its free amine groups.
- Experimental Design: Configure the Box-Behnken design with three factors (anti-ENaC concentration, glutaraldehyde incubation time, anti-ENaC incubation time) at three levels (-1, 0, +1). This typically requires 15 experimental runs.
- Data Acquisition: For each experimental run, measure the electrochemical response (e.g., charge transfer resistance from EIS) after exposing the immunosensor to a fixed concentration of ENaC protein.
- Data Analysis: Fit the obtained data to a second-order polynomial model to identify the individual and interactive effects of the three factors on the sensor response. The model is expressed as: Y = β₀ + β₁A + β₂B + β₃C + β₁₂AB + β₁₃AC + β₂₃BC + β₁₁A² + β₂₂B² + β₃₃C² where Y is the predicted response, A, B, C are the factors, β₀ is a constant, β₁-β₃ are linear coefficients, β₁₂-β₂₃ are interaction coefficients, and β₁₁-β₃₃ are squared coefficients.
- Validation: Confirm the optimal conditions predicted by the model (e.g., 2.5 μg/mL anti-ENaC, 30 min glutaraldehyde incubation, 90 min anti-ENaC incubation) by comparing the predicted and experimental sensor response [59].
Enhancing Assay Kinetics via Nanotexture and Mixing
Assay kinetics, governed by the mass transport and binding efficiency of antigens to immobilized antibodies, can be significantly enhanced through surface engineering and fluid dynamics [60].
- Objective: To investigate the effects of nanotextured surfaces and solution mixing on the kinetics of antigen-antibody binding in a non-flow system.
- Materials:
- Silicon substrates (flat and nanotextured)
- Specific antibody and antigen
- Buffer solutions
- Equipment for surface characterization (e.g., SEM)
- A method for quantifying bound antigen (e.g., fluorescence microscopy, ELISA)
- Procedure:
- Surface Preparation: Create nanotextured silicon surfaces using appropriate etching techniques (e.g., chemical, plasma). Characterize the topography using scanning electron microscopy (SEM).
- Antibody Immobilization: Immobilize the same concentration of specific antibodies onto both flat and nanotextured silicon surfaces using a consistent method (e.g., physical adsorption, covalent chemistry).
- Antigen Binding Experiment:
- Expose both functionalized surfaces to a solution containing the target antigen under two conditions: mixed (via gentle stirring or agitation) and static (no mixing).
- Perform the experiment for varying time intervals to establish binding kinetics.
- Data Collection: At each time point, quantify the amount of antigen bound to the surface.
- Data Analysis: Use a transport-reaction model to extract kinetic parameters (e.g., effective diffusivity, dissociation constant). Compare the maximum antigen capture, capture efficiency, and time to reach equilibrium between the four scenarios: flat/static, flat/mixed, nanotextured/static, nanotextured/mixed [60].
The workflow for this experimental approach is summarized in the following diagram:
Diagram 1: Experimental workflow for enhancing immunosensor kinetics through surface engineering and mixing.
Comparative Performance Data
Impact of Reagent Concentration on Cross-Reactivity
The concentration of immunoreagents is not merely a parameter to be optimized for sensitivity but is a powerful tool for modulating immunosensor selectivity. Theoretical modeling and experimental data confirm that assays performed with lower concentrations of antibodies and competing antigens are characterized by lower cross-reactivities and are thus more specific [1].
Table 1: Impact of Reagent Concentration on Cross-Reactivity in Competitive Immunoassays [1]
| Target Analyte Class | Assay Format | Reagent Concentration Regime | Effect on Cross-Reactivity | Experimental Finding |
|---|---|---|---|---|
| Sulfonamides | Fluorescence Polarization Immunoassay (FPIA) | High | Higher cross-reactivity (less specific) | Detects multiple similar compounds |
| Sulfonamides | Enzyme-Linked Immunosorbent Assay (ELISA) | Low | Lower cross-reactivity (more specific) | Up to 5-fold reduction in cross-reactivity compared to FPIA |
| Fluoroquinolones | Fluorescence Polarization Immunoassay (FPIA) | High | Higher cross-reactivity (less specific) | Broader class recognition |
| Fluoroquinolones | Enzyme-Linked Immunosorbent Assay (ELISA) | Low | Lower cross-reactivity (more specific) | Enhanced specificity for target analyte |
This phenomenon occurs because at lower reagent concentrations, the assay's outcome becomes more dependent on the affinity constant (Kd) of the antibody-antigen interaction. High-affine binding events are favored, making the sensor more discriminatory against cross-reactants, which typically bind with lower affinity [1].
Comparative Limits of Detection: Immunosensors vs. Aptasensors
While immunosensors are well-established, aptasensors, which use nucleic acid aptamers as recognition elements, have emerged as promising alternatives. A direct comparison for Low-Density Lipoprotein (LDL) detection reveals their respective performances.
Table 2: Comparison of Electrochemical Immunosensor and Aptasensor for LDL Detection [61]
| Parameter | Electrochemical Immunosensor | Electrochemical Aptasensor |
|---|---|---|
| Bioreceptor | Anti-apolipoprotein B-100 antibody | ssDNA aptamer (specific for LDL) |
| Immobilization | Covalent attachment to 4-ATP/Au electrode | Thiol-based self-assembly on Au electrode |
| Linear Range | 0.01 ng/mL to 1.0 ng/mL | 0.01 ng/mL to 1.0 ng/mL |
| Limit of Detection (LOD) | 0.31 ng/mL | 0.25 ng/mL |
| Selectivity | Good selectivity against HSA, HDL, MDA-LDL | Slightly better selectivity against HSA, HDL, MDA-LDL |
| Key Advantage | High specificity of antibodies | Robustness, lower cost, easier modification |
This data indicates that for a specific target like LDL, both platforms can achieve comparable sensitivity. The choice between them may then depend on secondary factors such as cost, stability, and ease of fabrication, where aptamers often hold an advantage [15] [61].
Signal Enhancement Strategies for Improved Sensitivity
Various signal enhancement strategies can push the limits of detection (LOD) for immunosensors to remarkable levels, as demonstrated in the detection of antibiotics.
Table 3: Signal Enhancement Strategies in Electrochemical Immunosensors for Antibiotics [29]
| Target Antibiotic | Transduction Scheme | Enhancement Strategy | Achieved Limit of Detection (LOD) |
|---|---|---|---|
| Ciprofloxacin | Impedimetric (EIS) | Antibody displacement assay | ~1 pg/mL (3 pM) |
| Ofloxacin | Amperometric | Gold nanoclusters/Polypyrrole electrode + HRP enzyme | ~30 pg/mL (0.1 nM) |
| Tetracycline | Amperometric | Platinum nanoparticles/Graphene nanosheets | ~6 pg/mL (13 pM) |
| Sulfonamides | Amperometric | Magnetic beads (MBs) + HRP enzyme | ~1 μg/L (6 nM) |
These strategies often outperform classical enzymatic amplification alone, highlighting the importance of nanomaterial integration and innovative assay design [29].
The Scientist's Toolkit: Key Research Reagent Solutions
The development and optimization of immunosensors rely on a core set of reagents and materials. The following table details essential items and their functions in a typical research workflow.
Table 4: Essential Research Reagents and Materials for Immunosensor Development
| Reagent / Material | Function and Role in Development | Example Use-Case |
|---|---|---|
| Screen-Printed Electrodes (SPCEs) | Low-cost, disposable, mass-producible transducer platform; enables miniaturization and on-site testing. | Used as the base electrode in electrochemical immunosensors for ENaC and organophosphates [59] [62]. |
| Gold Nanoparticles (AuNPs) | Enhance electroactive surface area, facilitate electron transfer, and provide a biocompatible surface for biomolecule immobilization. | Modifying SPCEs to improve antibody loading and stability for ENaC detection [59]. |
| Cysteamine / Glutaraldehyde | Form a cross-linking layer for covalent antibody immobilization. Cysteamine provides -NH₂ groups, glutaraldehyde links them to antibody -NH₂ groups. | Standard chemistry for oriented immobilization of anti-ENaC antibodies on AuNP-modified surfaces [59]. |
| Bovine Serum Albumin (BSA) | Used as a blocking agent to cover non-specific binding sites on the sensor surface, reducing background noise and improving selectivity. | Blocking step in COVID-19 and LDL immunosensors to prevent non-specific adsorption [63] [61]. |
| Electrochemical Redox Probes | Molecules like [Fe(CN)₆]³⁻/⁴⁻ act as reporters of the electrode surface status. Binding events that hinder electron transfer are measured as a change in current or impedance. | Label-free detection of LDL and other targets in buffer solutions using square-wave voltammetry or EIS [61]. |
| Magnetic Beads (MBs) | Act as a mobile solid support for antibodies, enabling efficient separation, concentration of target analytes, and integration of enzymatic labels for signal amplification. | Used in sandwich-style immunosensors for sulfonamide antibiotics to pre-concentrate the analyte [29]. |
Cross-Reactivity Assessment in Immunosensor and Aptasensor Research
The fundamental mechanisms governing cross-reactivity differ between immunosensors and aptasensors, primarily due to the distinct nature of their biorecognition elements. Antibodies are proteins that bind to epitopes on antigens, while aptamers are oligonucleotides that fold into 3D structures to encapsulate their targets. This difference influences how each technology is optimized to minimize unwanted cross-reactions. The following diagram illustrates the key factors and optimization paths for controlling cross-reactivity in both platforms.
Diagram 2: Pathways for managing cross-reactivity in immunosensors versus aptasensors.
For immunosensors, cross-reactivity is not an immutable property of the antibody but an integral parameter sensitive to the conditions of the analysis [1]. As detailed in the experimental data, shifting to lower concentrations of immunoreagents is a primary and powerful strategy to enhance specificity. In contrast, for aptasensors, cross-reactivity is more directly tied to the aptamer's intrinsic structure and the rigor of its selection process (SELEX). Optimization, therefore, focuses on selecting aptamers with minimal off-target binding during the initial discovery phase or through post-SELEX engineering [15] [13]. This distinction is critical for researchers when planning their development strategy: immunosensor selectivity can be fine-tuned via assay biochemistry, while aptasensor selectivity must be largely built-in during bioreceptor design.
Post-SELEX optimization has emerged as a critical phase in aptamer development, addressing the limitations of sequences derived directly from Systematic Evolution of Ligands by Exponential Enrichment (SELEX). While SELEX efficiently identifies potential aptamer candidates, the resulting sequences often contain redundant nucleotides that do not contribute to target binding and may even impair affinity, stability, or specificity [64] [65]. Post-SELEX optimization encompasses a suite of strategies, primarily truncation and in silico refinement, aimed at transforming raw SELEX outputs into functionally superior aptamers with enhanced performance characteristics for diagnostic and therapeutic applications [65] [66].
The necessity for these optimization techniques stems from several practical challenges. Full-length aptamers selected via SELEX typically range from 60 to 100 nucleotides, including constant primer-binding regions essential for amplification during selection [67]. However, these primer regions can interfere with proper folding or target interaction in final applications. More critically, longer sequences increase production costs and elevate the risk of nonspecific binding or structural instability [20] [67]. Within these lengthy sequences, the actual target-binding domain often comprises a much smaller functional region, sometimes as brief as 15-40 nucleotides [64]. Identifying and isolating this minimal functional domain while preserving or even enhancing binding affinity represents the fundamental objective of post-SELEX optimization.
Framed within the broader context of cross-reactivity assessment in biosensor research, these optimization strategies take on additional significance. Well-optimized aptamers with precisely defined binding interfaces demonstrate superior specificity, reducing false-positive signals in complex samples—a crucial advantage for diagnostic applications [68] [69]. This guide provides a comprehensive comparison of contemporary truncation and in silico refinement methodologies, supported by experimental data and detailed protocols, to assist researchers in selecting appropriate optimization strategies for their specific applications.
Methodological Approaches to Aptamer Optimization
Predictive Computational Modeling
Predictive computational modeling leverages machine learning (ML) and artificial intelligence to forecast aptamer behavior and binding affinity based on sequence and structural features. This approach represents a paradigm shift from traditional experimental screening toward data-driven aptamer refinement [20].
In a landmark study, a machine learning-guided particle display (MLPD) methodology was developed to efficiently explore the aptamer fitness landscape [20]. The researchers trained neural network models on experimental data from particle display screening, where aptamer libraries were partitioned based on affinity thresholds. The trained model could then predict high-affinity aptamers from experimental candidates at a rate 11-fold higher than random perturbation and generated novel, high-affinity aptamers more effectively than physical screening alone [20]. This approach also facilitated the design of truncated aptamers that were 70% shorter yet exhibited higher binding affinity (1.5 nM) than the best experimental candidate [20].
Table 1: Performance Metrics of Machine Learning-Guided Aptamer Optimization
| Metric | Traditional SELEX | ML-Guided Optimization | Improvement Factor |
|---|---|---|---|
| Rate of high-affinity aptamer identification | Baseline | 11-fold higher | 11x [20] |
| Truncation efficiency | Manual process | Automated identification of minimal functional sequences | Significant time reduction [64] |
| Novel aptamer generation | Limited to library diversity | De novo prediction from sequence space | Higher rate than experimental screening alone [20] |
| Binding affinity after truncation | Often decreased | Maintained or improved (e.g., 1.5 nM) | Enhanced performance [20] |
The ML workflow typically involves several key steps: initial library sequencing and affinity measurement, neural network training on sequence-activity relationships, in silico mutation and selection of optimized sequences, and experimental validation of top candidates [20]. This methodology effectively navigates the vast sequence space beyond practical experimental constraints, enabling exploration of approximately 10^23 theoretical sequences for a typical 40-mer aptamer—far exceeding the ~10^15 diversity limit of physical libraries [20].
Structure-Guided Truncation Techniques
Structure-guided truncation relies on computational predictions of secondary and tertiary structure to identify core binding domains within full-length aptamers. This approach eliminates nucleotides not essential for maintaining the functional three-dimensional conformation, resulting in minimized aptamers with improved characteristics [64] [67].
A documented workflow for structure-guided truncation begins with predicting secondary structure using tools like Mfold or UNAFold, which identify stable structural motifs such as hairpins, bulges, G-quadruplexes, and inner loops [70]. The most thermodynamically stable structure (lowest free energy) is selected for further analysis. Subsequently, tertiary structure modeling is performed using specialized software such as 3dRNA or Vfold, which generate three-dimensional atomic coordinates [70]. For DNA aptamers, conversion from RNA modeling may be necessary by substituting uracil (U) with thymine (T) and changing the pentose sugar from ribose to deoxyribose [70].
Molecular docking simulations then predict how the truncated aptamer interacts with its target protein. Tools like HDOCK or AutoDock simulate binding interactions and calculate binding energy scores [70]. The final step involves experimental validation of the top truncated candidates to confirm maintained or improved affinity and specificity compared to the original full-length aptamer [67].
Table 2: Experimental Results of Structure-Guided Aptamer Truncation
| Application | Original Length | Optimized Length | Binding Affinity (Kd) | Key Findings |
|---|---|---|---|---|
| Okadaic acid detection [67] | 63 nucleotides | 31 nucleotides | Not specified | Maintained high binding affinity; simplified sensor fabrication |
| Giardia intestinalis cyst protein [71] | Not specified | Not specified | 7.98 nM (best candidate) | High specificity with minimal cross-reactivity |
| NGAL biomarker [20] | ~40 nucleotides | ~12 nucleotides (70% shorter) | 1.5 nM | Improved binding affinity after truncation |
| Leptospira detection [70] | Not specified | Not specified | Predicted interactions | Identified key binding residues through in silico analysis |
This structured approach to truncation has demonstrated remarkable success across various applications. For instance, researchers optimizing an aptamer for okadaic acid detection successfully truncated a 63-nucleotide sequence to a 31-nucleotide variant while maintaining high binding affinity [67]. Similarly, in silico analysis of Leptospira-specific aptamers identified key binding residues crucial for interaction with target proteins, enabling precise modifications for improved diagnostic accuracy [70].
Experimental Validation and Cross-Reactivity Assessment
Experimental validation remains an indispensable component of aptamer optimization, serving as the ultimate verification of computational predictions and ensuring functional performance in real-world conditions. This phase typically involves affinity measurements, specificity testing, and biosensor integration [71] [69].
The validation process generally employs techniques such as surface plasmon resonance (SPR), enzyme-linked aptamer assays (ELAA), or electrochemical methods to quantify binding affinity and kinetics [70] [71]. For instance, in developing aptamers against Giardia intestinalis cyst protein, researchers used SPR to measure dissociation constants (Kd), identifying three sequences with low Kd values of 7.98, 21.02, and 21.86 nM [71]. The highest-affinity aptamer (7.98 nM) was subsequently integrated into a label-free electrochemical biosensor, demonstrating a wide detection range from 0.1 pg mL^-1 to 1000 ng mL^-1 with a remarkably low detection limit of 0.0026 pg mL^-1 [71].
Cross-reactivity assessment forms a critical aspect of validation, particularly for diagnostic applications where specificity is paramount. This involves testing optimized aptamers against structurally similar molecules or non-target proteins that might be present in sample matrices [68] [69]. In the case of the Giardia intestinalis cyst protein aptasensor, selectivity studies confirmed insignificant cross-reactivity against bovine serum albumin and globulin, and no reactivity against G. intestinalis trophozoite recombinant protein—demonstrating the exquisite specificity achievable through proper optimization [71].
Diagram 1: Workflow for Integrated Aptamer Optimization combining computational and experimental approaches
Comparative Performance Analysis of Optimization Methods
Integrated Computational-Experimental Workflows
Integrated computational-experimental workflows represent the most advanced approach to aptamer optimization, synergistically combining in silico predictions with empirical validation. This methodology leverages the strengths of both computational efficiency and experimental reliability [67].
A prime example of this integrated approach demonstrated the optimization of an electrochemical aptasensor for okadaic acid detection [67]. Researchers employed molecular docking simulations to strategically truncate a 63-nucleotide aptamer to a highly efficient 31-nucleotide variant while confirming maintained binding affinity. The computationally guided design also informed surface immobilization chemistry, resulting in a sensor with a detection limit of 2.5 nM and a remarkably short assay time of 5 minutes. When validated in complex food matrices (spiked mussel samples), the optimized aptasensor achieved excellent recovery rates of 82-103%, demonstrating practical utility in real-world scenarios [67].
The integration of machine learning with experimental data further enhances this approach. As demonstrated in the MLPD methodology, the iterative cycle of experimental data generation, model training, in silico sequence optimization, and experimental validation creates a virtuous cycle of improvement [20]. This enables researchers to efficiently explore sequence spaces orders of magnitude larger than possible through physical screening alone, significantly accelerating the optimization timeline while improving success rates [20].
Cross-Reactivity Management in Optimized Aptamers
Cross-reactivity management represents a critical consideration in aptamer optimization, particularly for diagnostic applications where specificity directly impacts clinical utility. Optimized aptamers must distinguish between target and non-target molecules in complex biological samples [68] [69].
Cross-reactive aptamers, while potentially problematic in some contexts, can be strategically employed in certain applications. For instance, researchers developing a sensing array for identifying the origin of toad venom intentionally selected cross-reactive aptamers that exhibited distinct binding profiles for different bufadienolides [68]. These aptamers served as recognition elements in a fluorescent sensing array that distinguished toad venom from different origins with 98.7% accuracy, demonstrating how controlled cross-reactivity can be harnessed for discriminatory purposes rather than viewed solely as a limitation [68].
For most diagnostic applications, however, minimizing cross-reactivity remains paramount. Research on aptamers targeting Mycobacterium tuberculosis and SARS-CoV-2 antigens demonstrated excellent specificity in both buffer and human serum [69]. The optimized aptasensor achieved detection limits of 0.053 pg/mL for MPT64 (M. tuberculosis biomarker) and 0.319 pg/mL for S-glycoprotein (SARS-CoV-2) in buffer, with minimal cross-reactivity against related coronavirus proteins or other potential interferents [69]. This high specificity underscores how comprehensive optimization and validation can yield aptamers with exceptional discriminatory capabilities.
Table 3: Cross-Reactivity Assessment of Optimized Aptasensors in Diagnostic Applications
| Target Pathogen | Non-Target Molecules Tested | Cross-Reactivity Level | Detection Limit | Reference |
|---|---|---|---|---|
| Giardia intestinalis cyst protein [71] | BSA, globulin, G. intestinalis trophozoite protein | Insignificant | 0.0026 pg mL^-1 | [71] |
| Mycobacterium tuberculosis & SARS-CoV-2 [69] | MPXV A29 protein, MERS-CoV S glycoprotein | Minimal | 0.053-1.421 pg/mL | [69] |
| Escherichia coli [72] | S. aureus, MRSA | High specificity | 5.9 × 10^3 CFU/mL | [72] |
| Toad Venom bufadienolides [68] | Various regional bufadienolides | Controlled cross-reactivity for discrimination | N/A (98.7% accuracy) | [68] |
Essential Research Reagent Solutions
Successful implementation of aptamer optimization protocols requires specific reagents and computational tools. The following table summarizes key resources referenced in the studies reviewed:
Table 4: Essential Research Reagent Solutions for Aptamer Optimization
| Reagent/Tool | Specific Example | Application in Optimization | Reference |
|---|---|---|---|
| Structure Prediction | Mfold web server | Predicting secondary structure and identifying stable motifs | [70] |
| Tertiary Modeling | 3dRNA | Generating 3D atomic coordinates of aptamer structures | [70] |
| Molecular Docking | HDOCK server | Simulating aptamer-target interactions and binding energy | [70] |
| Affinity Measurement | Surface Plasmon Resonance | Quantifying binding constants (Kd) of optimized aptamers | [71] |
| Electrochemical Validation | Electrochemical Impedance Spectroscopy | Label-free detection of aptamer-target binding | [69] |
| Machine Learning Framework | Custom Neural Network Models | Predicting sequence-activity relationships for optimization | [20] |
| Sensor Substrate | Screen-printed gold electrodes | Platform for electrochemical aptasensor development | [69] |
Diagram 2: Methodological relationships in aptamer optimization showing how computational and experimental approaches interact to produce application outcomes
Post-SELEX optimization through truncation and in silico refinement has transformed aptamer development, enabling the creation of refined molecular recognition elements with enhanced properties. The integrated approach combining computational predictions with experimental validation emerges as the most effective strategy, leveraging the strengths of both methodologies while mitigating their individual limitations.
As computational power increases and algorithms become more sophisticated, the role of in silico methods in aptamer optimization will undoubtedly expand. However, rigorous experimental validation remains essential, particularly for assessing cross-reactivity in complex matrices. The continuing refinement of these optimization techniques promises to accelerate the development of high-performance aptasensors for diverse applications in diagnostics, therapeutics, and environmental monitoring.
Surface Functionalization and Immobilization Techniques for Oriented Probe Display
The performance of biosensors, including immunosensors and aptasensors, is critically dependent on the effective immobilization of their biological recognition elements. Oriented immobilization has emerged as a fundamental strategy to enhance key analytical metrics such as sensitivity, specificity, and limit of detection. This approach ensures that probe molecules, such as antibodies or aptamers, are presented on the sensor surface in a uniform configuration that maximizes the availability of their binding sites. The control over molecular orientation stands in stark contrast to traditional random immobilization methods, which often lead to heterogeneous probe display and can sterically hinder a significant proportion of binding sites. Within the context of cross-reactivity assessment, proper orientation becomes even more crucial, as it promotes consistent and specific binding interactions, thereby reducing non-specific signals and improving the reliability of cross-reactivity profiling between different analytes. This guide provides a comprehensive comparison of surface functionalization strategies, with a specific focus on their impact on oriented probe display and the subsequent implications for biosensor performance, particularly in the accurate evaluation of cross-reactivity patterns.
The Critical Importance of Oriented Immobilization
Antibodies and other probe molecules possess distinct structural domains with specific functions. For instance, an immunoglobulin G (IgG) antibody is a Y-shaped molecule approximately 142 × 85 × 45 ų in size, with antigen-binding sites located at the ends of its two Fab arms [73]. When immobilized randomly via physical adsorption or through common functional groups present throughout its structure (e.g., amine groups on lysine residues), the antibody can assume multiple unfavorable orientations. These include side-on binding or even Fab-down orientations where the binding sites are obstructed by the surface [74]. It has been reported that as few as 10–20% of randomly physisorbed antibodies retain their antigen-binding function [75].
Table 1: Impact of Immobilization Strategy on Antibody Functionality
| Immobilization Approach | Key Characteristics | Estimated Functional Antibody Population | Primary Limitation |
|---|---|---|---|
| Physical Adsorption | Random orientation via hydrophobic/electrostatic interactions | 10–20% [75] | Susceptible to denaturation and desorption |
| Random Covalent | Non-selective coupling via amine, carboxyl, or thiol groups | ~25% [75] | Binding sites often sterically hindered |
| Oriented Immobilization | Site-specific attachment, typically via Fc region | Significantly higher than random methods [75] [76] | Requires more complex surface chemistry or affinity systems |
The consequences of random orientation are particularly pronounced in the assessment of cross-reactivity. A heterogeneously oriented probe layer can yield inconsistent binding affinities for both the primary target and cross-reactive analytes, leading to unreliable cross-reactivity profiles. Proper orientation ensures that all probe molecules present their binding sites consistently, which is a prerequisite for obtaining reproducible and quantitatively accurate cross-reactivity data [31] [1].
Established Methods for Oriented Immobilization
Several well-established strategies enable the controlled, oriented immobilization of probes onto sensor surfaces. These can be broadly categorized into affinity-based methods, covalent coupling strategies, and enzyme-mediated techniques.
Affinity-Based Methods
This approach utilizes natural biological interactions to direct the orientation of the probe molecule.
- Protein A/Protein G: These bacterial proteins bind with high affinity to the Fc region of antibodies. Surfaces functionalized with Protein A or G capture antibodies through their Fc domain, thereby orienting the Fab antigen-binding regions away from the surface [74] [15]. The binding affinity, however, varies among antibody species and subclasses, and the interaction is reversible, which can lead to antibody loss under certain conditions [75].
- Biotin–Streptavidin: This is one of the strongest non-covalent interactions in nature. Antibodies can be biotinylated, typically on their Fc region, and then immobilized on streptavidin-coated surfaces. The site of biotinylation is critical; random biotinylation on lysine residues can still lead to improper orientation [75] [15].
- His-Tag/NTA Chelation: Recombinantly expressed antibodies or fragments can be engineered with a polyhistidine tag (His-tag). This tag coordinates with metal ions (e.g., Ni²⁺, Co²⁺) chelated by nitrilotriacetic acid (NTA) on the surface, providing a defined, oriented attachment [75] [73].
Covalent and Enzyme-Mediated Methods
These methods form stable, oriented bonds between the probe and the surface.
- Site-Specific Chemical Coupling: This involves targeting unique functional groups in specific regions of the antibody. For example, hingedisulfide bonds can be reduced to generate free thiols, which can then be covalently coupled to maleimide-functionalized surfaces. This approach is often used with Fab' fragments [15] [73].
- Enzyme-Mediated Conjugation: Microbial transglutaminase (mTG) is an enzyme that catalyzes the formation of an amide bond between a specific glutamine residue (Q295) in the antibody Fc region and an amine-functionalized substrate. This allows for site-specific biotinylation or direct coupling to amine-presenting surfaces, ensuring Fc-specific orientation without the need for protein engineering [75].
The following diagram illustrates the workflow of a key enzyme-mediated method for oriented antibody immobilization.
Comparative Performance Data
The choice of immobilization strategy has a direct and quantifiable impact on biosensor performance. The following table summarizes experimental data from key studies comparing oriented and random methods.
Table 2: Experimental Comparison of Immobilization Techniques
| Immobilization Technique | Probe/Target | Key Performance Metric | Result (Oriented vs. Random) | Reference & Context |
|---|---|---|---|---|
| mTG-mediated Biotinylation (Fc-specific) vs. NHS-Biotin (Random lysine) | Anti-HRP Antibody / HRP | Antigen Binding Capacity | 3-fold improvement [75] | Site-specificity restricted to heavy chain vs. biotinylation on heavy and light chains. |
| Assay Sensitivity | 3-fold improvement [75] | |||
| Detection Limit | 3-fold improvement [75] | |||
| Protein G-Mediated Immobilization | Model Immunoassay | Antigen-Binding Activity | >200-fold improvement vs. random amine coupling [15] | Achieved using recombinant antibodies with Avi-Tag for biotinylation. |
| scFv with Polyarginine Tag (Electrostatic) vs. Fab (Random) | scFv / Rabbit IgG | Detection Signal | 42-fold improvement [15] | Oriented immobilization on negatively charged surfaces. |
| Stepwise Covalent on Heterofunctional Support | Full-length IgG / Various | General Performance | High orientation controllability and cost-effectiveness [76] | Noncovalent adsorption for orientation is fixed by subsequent covalent bond. |
Detailed Experimental Protocol: mTG-Mediated Oriented Immobilization
To illustrate a modern oriented immobilization strategy, below is a detailed protocol based on the enzyme-mediated approach using microbial transglutaminase, as described in the search results [75].
Materials and Reagents
- Antibody: Rat anti-horseradish peroxidase (anti-HRP) monoclonal antibody (or other IgG of interest).
- Enzyme: Microbial transglutaminase (mTG).
- Biotin Reagent: NH₂-PEG₄-Biotin (aminopolyethylene glycolbiotin) for site-specific conjugation. For random biotinylation control: NHS-PEG₄-Biotin.
- Solid Support: Streptavidin-coated clear 96-well plates or streptavidin-functionalized sensor chips.
- Buffers: Phosphate-buffered saline (PBS), Trisbuffered saline (TBS).
- Detection Reagents: Horseradish peroxidase (HRP), Streptavidin-HRP, 1-Step Ultra TMB-Blotting solution (or similar chromogenic substrate).
Procedure
Site-Specific Biotinylation:
- Prepare the antibody solution (e.g., 1 mg/mL) in a suitable buffer (e.g., PBS).
- Add a 40-fold molar excess of NH₂-PEG₄-Biotin to the antibody solution.
- Initiate the conjugation reaction by adding mTG enzyme to the mixture.
- Incubate the reaction mixture at 37°C for a defined period (e.g., 2-4 hours).
- Purify the biotinylated antibody from excess biotin reagent using desalting columns or dialysis.
Control Preparation (Random Biotinylation):
- For a control sample, biotinylate the same antibody using an amine-reactive biotin reagent (NHS-PEG₄-Biotin) according to the manufacturer's protocol, which targets lysine residues randomly distributed across the antibody.
- Purify the randomly biotinylated antibody.
Immobilization:
- Dilute the site-specifically and randomly biotinylated antibodies to the same concentration in an appropriate buffer.
- Add the antibody solutions to separate wells of a streptavidin-coated 96-well plate.
- Incubate for 1-2 hours at room temperature to allow for immobilization.
- Wash the wells thoroughly with buffer containing a mild detergent (e.g., PBS with 0.05% Tween-20) to remove unbound antibodies.
Antigen Binding Assay:
- Add a serial dilution of the antigen (HRP) to the wells.
- Incubate to allow binding, then wash to remove unbound antigen.
- For colorimetric quantification, add a chromogenic substrate (e.g., TMB). The reaction is directly catalyzed by the bound HRP antigen.
- Measure the absorbance and calculate the antigen-binding capacity, sensitivity, and detection limit for both immobilization strategies.
The Scientist's Toolkit: Essential Research Reagents
Table 3: Key Reagents for Oriented Immobilization Protocols
| Reagent | Function in Experiment | Example from Literature |
|---|---|---|
| Microbial Transglutaminase (mTG) | Enzyme for site-specific biotinylation of glutamine Q295 in antibody Fc region. | Zedira (Catalog #T300) [75] |
| NH₂-PEG₄-Biotin | Biotin analogue with a spacer arm; amine group serves as substrate for mTG. | BroadPharm [75] |
| NHS-PEG₄-Biotin | Amine-reactive biotinylation reagent for generating random immobilization controls. | Thermo Fisher Scientific EZ-Link Kit [75] |
| Streptavidin-Coated Plates | Solid support for immobilizing biotinylated antibodies. | Thermo Fisher Scientific [75] |
| Protein A, Protein G | Affinity ligands pre-immobilized on surfaces to capture antibodies via Fc region. | Magne Protein G Beads (Promega) [75] |
| Biotinylated Protein G | reagent that binds antibody Fc and presents a biotin for capture on streptavidin surfaces. | Thermo Fisher Scientific (Catalog #29988) [75] |
The strategic selection of surface functionalization and immobilization techniques is paramount for developing high-performance biosensors. As the experimental data unequivocally demonstrates, oriented immobilization consistently outperforms random methods, leading to significant enhancements in antigen-binding capacity, assay sensitivity, and detection limits. For researchers focused on cross-reactivity assessment, employing oriented probe display is not merely an optimization step but a critical requirement. It ensures that cross-reactivity profiles are generated from a uniform population of correctly presented probes, thereby yielding data that accurately reflects true molecular recognition events rather than artifacts of heterogeneous surface attachment. While methods like protein A/G immobilization are well-established, newer chemo-enzymatic strategies, such as those utilizing microbial transglutaminase, offer powerful, antibody-independent alternatives for achieving superior site-specific orientation. The consistent application of these oriented display techniques will be a cornerstone in the advancement of reliable and reproducible immunosensor and aptasensor research.
In the realm of biosensing, the specific recognition event between a capture probe (such as an antibody or aptamer) and its target is only one part of the detection equation. The physicochemical environment in which this binding occurs—dictated by the buffer composition and reaction conditions—profoundly influences biosensor performance, particularly its specificity and cross-reactivity [1]. Cross-reactivity, often viewed as an undesirable property where a biorecognition element binds to structurally similar non-target analytes, is not merely an intrinsic characteristic of the antibody or aptamer itself [31] [1]. Instead, it is an integral parameter that can be modulated by external factors, including pH, ionic strength, and the concentrations of reagents used in the assay [1]. For researchers, scientists, and drug development professionals, mastering this modulation is essential for developing assays that are either highly specific for a single compound or broadly responsive to a class of related molecules, depending on the diagnostic need.
This guide objectively compares how buffer composition and reaction conditions fine-tune the assay environment to minimize or exploit cross-reactivity in immunosensors and aptasensors. We will summarize supporting experimental data, provide detailed methodologies, and outline the key reagents that form the scientist's toolkit for optimizing these critical parameters.
Cross-Reactivity in Immunosensors vs. Aptasensors: A Fundamental Comparison
The fundamental differences in the structure and origin of antibodies and aptamers lead to distinct behaviors and control mechanisms for cross-reactivity.
Immunosensors and Antibody Cross-reactivity: Antibodies are proteins produced by an immune response, engineered to recognize a specific epitope on an antigen [31]. Their cross-reactivity stems from the ability of their binding site to accommodate antigens with similar structural motifs. Traditionally, this is seen as a limitation. However, strategic use of cross-reactive antibodies in sensor arrays can be powerful, mimicking the function of chemical olfaction systems to distinguish complex samples through pattern recognition [31]. Research confirms that cross-reactivity is not an immutable property of an antibody but can be varied for different immunoassay formats using the same antibodies [1]. For instance, shifting to lower concentrations of immunoreagents can decrease cross-reactivities by up to five-fold, making an assay more specific [1].
Aptasensors and Aptamer Specificity: Aptamers are single-stranded DNA or RNA oligonucleotides selected in vitro via SELEX (Systematic Evolution of Ligands by EXponential Enrichment) to bind a specific target [15] [77]. Their three-dimensional binding structure is highly dependent on the surrounding environment. Factors like cation concentration (especially Mg²⁺) and pH are critical for maintaining the aptamer's folded, active conformation, and slight alterations can significantly impact both affinity and specificity [55]. The ability to denature and renature aptamers multiple times offers a unique avenue for controlling their binding behavior that is not available with antibodies [49].
Table 1: Fundamental Comparison of Cross-Reactivity Drivers
| Feature | Immunosensors (Antibodies) | Aptasensors (Aptamers) |
|---|---|---|
| Origin of Cross-reactivity | Structural similarity of non-target epitopes to the target epitope. | Instability of 3D conformation; non-specific interactions with the oligonucleotide backbone. |
| Primary Environmental Sensitivity | pH, ionic strength, and presence of organic solvents that can denature the protein. | Divalent cation concentration (Mg²⁺), pH, and ionic strength that stabilize the 3D structure. |
| Typical Strategy for Minimization | Using monoclonal antibodies; optimizing reagent concentrations and incubation times [1]. | Counter-selection during SELEX; post-SELEX optimization of buffer conditions; chemical modification. |
| Potential for Strategic Use | Can be used in cross-reactive arrays for pattern-based detection of analyte classes [31]. | Can be engineered for multi-target recognition, though this is less commonly exploited than with antibodies. |
Experimental Data and Protocols for Cross-Reactivity Assessment
Key Experimental Findings from the Literature
Experimental studies consistently demonstrate that cross-reactivity is a tunable parameter. One pivotal study mathematically modeled and experimentally verified that the cross-reactivity of an immunoassay can be modulated by simply changing the concentrations of the immunoreagents [1]. Implementing assays with sensitive detection methods that require low concentrations of antibodies and competing antigens results in lower cross-reactivities and higher specificity. This effect was demonstrated for sulfonamides and fluoroquinolones, showing that the same antibodies could yield different selectivity profiles in an enzyme immunoassay versus a fluorescence polarization immunoassay [1].
Furthermore, a direct comparative study of a prostate-specific antigen (PSA) aptasensor and immunosensor built on the same graphene quantum dots-gold nanorods (GQDs-AuNRs) modified screen-printed electrodes revealed comparable sensitivity, with a limit of detection (LOD) of 0.14 ng mL⁻¹ for both sensors [49]. However, the aptasensor showed advantages in better stability, simplicity, and cost-effectiveness, attributes that are influenced by the more robust operational conditions tolerated by nucleic acids compared to proteins [49].
Detailed Protocol: Modulating Cross-Reactivity in a Competitive Immunoassay
The following protocol, adapted from research on immunoassays for sulfonamides and fluoroquinolones, outlines how to experimentally determine and modulate cross-reactivity [1].
Objective: To determine the cross-reactivity (CR) of an immunoassay for a target analyte and its cross-reactants and to investigate the effect of reagent concentration on CR.
Materials:
- Purified monoclonal or polyclonal antibody against the target analyte.
- Target analyte and structurally related cross-reactants (high-purity standards).
- Enzyme- or fluorescently-labeled antigen (tracer).
- Coating buffer (e.g., carbonate-bicarbonate buffer, pH 9.6).
- Assay buffer (e.g., phosphate-buffered saline, PBS, with additives like BSA).
- Washing buffer (e.g., PBS with Tween 20).
- Appropriate substrate solution (for enzyme labels) or plate reader (for fluorescent labels).
Method:
- Plate Coating: Immobilize the appropriate antigen or antibody onto a microtiter plate based on your competitive assay format. Incubate overnight, then wash and block any non-specific binding sites.
- Preparation of Calibration Curves:
- Prepare a serial dilution of the target analyte in assay buffer.
- Prepare similar serial dilutions for each cross-reactant to be tested.
- Assay Procedure (Competitive Format):
- Add a fixed, constant concentration of the labeled tracer to each well.
- Add the prepared analyte or cross-reactant dilutions to the respective wells. Include a control well with no inhibitor (maximum signal) and a well with a large excess of inhibitor (non-specific binding).
- Add a fixed, constant concentration of the primary antibody to each well. The concentration of the antibody and tracer are the critical parameters to be varied.
- Incubate for a defined period (e.g., 1 hour at 37°C). The incubation time can be adjusted to probe kinetic vs. equilibrium conditions [1].
- Wash the plate thoroughly to remove unbound reagents.
- Add substrate (for ELISA) and measure the signal, or directly measure fluorescence.
- Data Analysis:
- Calculate the percentage of bound signal for each standard concentration:
(Signal / Maximum Signal) × 100. - Plot the percentage of bound signal versus the logarithm of the analyte/cross-reactant concentration.
- Fit a four-parameter logistic curve to the data.
- Determine the IC₅₀ value (the concentration that causes a 50% inhibition of the maximum signal) for the target analyte and each cross-reactant.
- Calculate the cross-reactivity (CR) for each cross-reactant as:
CR (%) = [IC₅₀ (target analyte) / IC₅₀ (cross-reactant)] × 100.
- Calculate the percentage of bound signal for each standard concentration:
Modulation Experiment:
- Repeat the entire assay using a 10-fold lower concentration of the antibody and labeled tracer.
- Compare the CR values obtained under the high and low reagent concentration conditions. The lower concentration condition is expected to yield lower CR values, indicating higher specificity [1].
Workflow Diagram: Cross-Reactivity Assessment
The following diagram illustrates the logical workflow and key decision points in the experimental process of assessing and fine-tuning cross-reactivity, as described in the protocol.
Diagram Title: Cross-Reactivity Fine-Tuning Workflow
The Scientist's Toolkit: Essential Reagents for Environmental Control
Successful fine-tuning of the assay environment relies on a set of key reagents. The following table details essential solutions and their specific functions in managing cross-reactivity for both immunosensors and aptasensors.
Table 2: Key Research Reagent Solutions for Assay Optimization
| Reagent Solution | Composition & Function | Role in Controlling Cross-Reactivity |
|---|---|---|
| Immobilization Buffers | Carbonate-bicarbonate buffer (pH 9.6) for passive adsorption; PBS with maleimide or streptavidin coatings for oriented immobilization [15]. | Correct orientation of capture probes minimizes steric hindrance and maximizes target accessibility, reducing non-specific binding and improving specificity. |
| Assay/Incubation Buffers | Phosphate-Buffered Saline (PBS) or Tris-based buffers, often with additives like BSA (0.1-1%) and Tween 20 (0.05%) [1]. | Maintains stable pH and ionic strength. Carrier proteins (BSA) block non-specific sites, and surfactants (Tween) reduce hydrophobic interactions, lowering background and cross-reactivity. |
| Cation Solutions | MgCl₂ or CaCl₂ solutions, typically used in the 1-10 mM range for aptasensors [55]. | Critical for aptasensors. Divalent cations stabilize the aptamer's 3D G-quadruplex or other structures. Optimization is key to ensuring correct folding and high-specificity binding. |
| Regeneration Buffers | Low-pH glycine buffer (pH 2.0-3.0) or high-pH solutions; solutions with ionic denaturants [77]. | Allows for sensor reuse by stripping bound analyte without permanently damaging the capture probe. Harsher conditions are generally tolerated better by aptamers than antibodies [49] [77]. |
| Blocking Solutions | Proteins (BSA, casein, gelatin) or synthetic polymers (PEI, PVP) in assay buffer. | Saturates any remaining reactive sites on the sensor surface after probe immobilization, which is a critical step for minimizing non-specific signal and false positives. |
The pursuit of a perfectly specific biosensor is a nuanced endeavor. As the evidence shows, cross-reactivity is not a fixed flaw but a malleable characteristic of both immunosensors and aptasensors. For the researcher, this provides a powerful toolkit. By moving beyond a simple search for the "best" antibody or aptamer and focusing instead on systematically fine-tuning the buffer composition and reaction conditions, it is possible to deliberately shape the assay's selectivity profile. Whether the goal is to achieve the pinpoint accuracy needed for a specific clinical biomarker or the broad-based detection of an entire class of environmental contaminants, mastery over the assay environment is the key to success.
Validation Protocols and Comparative Analysis of Sensor Performance
Establishing Standardized Validation Protocols for Cross-Reactivity Assessment
In the evolving landscape of biosensor technology, cross-reactivity remains a pivotal parameter determining analytical specificity and clinical utility. For both immunosensors and aptasensors, cross-reactivity assessment provides the fundamental metric for distinguishing target molecules from structurally similar interferents in complex matrices. This parameter is formally defined as the measure of a biosensor's response to non-target analogs relative to its response to the primary analyte, typically calculated as the ratio of half-maximal inhibitory concentrations (IC50) expressed as a percentage: Cross-reactivity (CR) = IC50(target analyte)/IC50(tested cross-reactant) × 100% [1].
The establishment of standardized validation protocols for cross-reactivity assessment represents an urgent need in biosensor development, as this characteristic directly impacts diagnostic accuracy, especially in applications requiring precise molecular discrimination. While immunosensors have long been the gold standard in bio-recognition, aptasensors are emerging as promising alternatives with distinct advantages and challenges in cross-reactivity profiles. This guide provides a comprehensive comparison of these technologies, supported by experimental data and standardized methodologies to facilitate rigorous cross-reactivity assessment.
Theoretical Foundations of Cross-Reactivity
Fundamental Principles and Calculation Methods
Cross-reactivity in biosensing originates from the fundamental molecular recognition event, where bioreceptors (antibodies or aptamers) interact not only with their intended targets but also with structurally similar compounds. This phenomenon is particularly consequential in clinical diagnostics, food safety testing, and environmental monitoring, where the accurate identification of specific molecules among complex mixtures is paramount [1].
The cross-reactivity percentage provides a quantitative measure of specificity, with lower values indicating higher specificity. Importantly, cross-reactivity is not an immutable property of the biological recognition element itself but is significantly influenced by assay conditions and format. Research has demonstrated that cross-reactivity can vary for different formats of competitive immunoassays using the same antibodies, with assays employing sensitive detection markers and low concentrations of reagents demonstrating up to five-fold lower cross-reactivity (indicating higher specificity) than those requiring high concentrations of markers [1].
Factors Influencing Cross-Reactivity Profiles
Multiple factors contribute to the cross-reactivity profiles of biosensors, including the structural flexibility of the recognition element, assay format, reaction conditions, and transducer mechanism. For immunosensors, the architecture of the antibody paratope and the nature of epitope presentation significantly influence cross-binding tendencies. Similarly, for aptasensors, the three-dimensional conformation stability and nucleotide composition dictate discriminatory capabilities [15] [78].
Environmental parameters including pH, ionic strength, temperature, and presence of denaturing agents can radically alter cross-reactivity patterns by modifying the structural integrity of biological recognition elements or altering their binding affinities [1]. Additionally, the orientation and density of immobilization on sensor surfaces profoundly impact accessibility and functionality of receptors, thereby influencing both sensitivity and cross-reactivity [15].
Comparative Analysis: Immunosensors vs. Aptasensors
Fundamental Characteristics and Recognition Mechanisms
Table 1: Fundamental Characteristics of Immunosensors and Aptasensors
| Parameter | Immunosensors | Aptasensors |
|---|---|---|
| Recognition Element | Antibodies (whole mAbs, Fab fragments, scFv) | Single-stranded DNA or RNA oligonucleotides |
| Molecular Size | ~150 kDa (whole mAbs); ~25-50 kDa (fragments) | 20-80 nucleotides (~-6-25 kDa) |
| Production Process | Biological (animal immunization/hybridoma/ recombinant) | Chemical (SELEX in vitro selection) |
| Binding Affinity | nM to pM range | nM to pM range |
| Target Range | Primarily immunogenic molecules | Broad (ions, small molecules, proteins, cells) |
| Binding Mechanism | Epitope-paratope interaction | 3D structure complementarity |
| Development Timeline | Months to years | Weeks to months |
Immunosensors employ antibodies as recognition elements, which are complex proteins produced by the immune system with naturally evolved binding capabilities. These can include whole monoclonal antibodies (mAbs, ~150 kDa) or smaller fragments such as antigen-binding fragments (Fab, ~50 kDa), single-chain variable fragments (scFv, ~30 kDa), and single-chain antibodies (scAb, ~40 kDa) [15]. The smaller size of antibody fragments enables more dense immobilization on sensor surfaces, potentially enhancing sensitivity.
Aptasensors utilize synthetic single-stranded DNA or RNA oligonucleotides (typically 20-80 nucleotides) that fold into specific three-dimensional structures capable of binding diverse targets with high affinity and specificity [19]. These aptamers are developed through Systematic Evolution of Ligands by Exponential Enrichment (SELEX), an iterative in vitro selection process that does not require animal hosts [15] [19].
Performance Comparison in Cross-Reactivity Assessment
Table 2: Experimental Cross-Reactivity Comparison for LDL Detection
| Parameter | Immunosensor for LDL [61] | Aptasensor for LDL [61] |
|---|---|---|
| Linear Range | 0.01 - 1.0 ng/mL | 0.01 - 1.0 ng/mL |
| Limit of Detection | 0.31 ng/mL | 0.25 ng/mL |
| Cross-reactivity with HDL | Moderate | Lower |
| Cross-reactivity with HSA | Moderate | Lower |
| Cross-reactivity with MDA-LDL | Moderate | Lower |
| Matrix Effects in Serum | Present | Negligible |
Table 3: Prostate Specific Antigen (PSA) Detection Comparison
| Parameter | PSA Immunosensor [49] | PSA Aptasensor [49] |
|---|---|---|
| Platform | GQDs-AuNRs modified screen-printed electrodes | GQDs-AuNRs modified screen-printed electrodes |
| Limit of Detection | 0.14 ng/mL | 0.14 ng/mL |
| Linear Range | Clinically relevant range | Clinically relevant range |
| Stability | Moderate | Better |
| Cost | Higher | Lower |
| Simplicity | Moderate | Higher |
Experimental comparisons reveal nuanced differences in cross-reactivity profiles between these platforms. In the case of low-density lipoprotein (LDL) detection, the aptasensor demonstrated superior selectivity toward potential interferents including human serum albumin (HSA), high-density lipoprotein (HDL), and malondialdehyde-modified LDL (MDA-LDL) [61]. Both platforms showed comparable linear ranges (0.01-1.0 ng/mL), with the aptasensor exhibiting a marginally better limit of detection (0.25 ng/mL vs. 0.31 ng/mL for the immunosensor).
For PSA detection, both platforms achieved identical detection limits (0.14 ng/mL) when implemented on similar graphene quantum dots-gold nanorods (GQDs-AuNRs) modified screen-printed electrodes [49]. However, the aptasensor demonstrated advantages in stability, simplicity, and cost-effectiveness, while maintaining comparable sensitivity and specificity to the immunosensor.
Standardized Experimental Protocols
General Cross-Reactivity Assessment Workflow
Immunosensor-Specific Validation Protocol
Protocol for Cross-Reactivity Assessment in Immunosensors:
Antibody Immobilization: Employ oriented immobilization techniques such as protein A/G, Fc-specific binding, or site-specific conjugation to maximize antigen binding accessibility. Random orientation through adsorption or amine coupling can reduce binding site availability and increase variability [15].
Calibration Curve: Prepare serial dilutions of the primary analyte in appropriate buffer (typically PBS, pH 7.4). For competitive formats, include constant concentrations of labeled tracer and antibody. Incubate according to optimized time and temperature (typically 30-120 minutes at room temperature or 37°C).
Cross-Reactant Testing: Test each potential interferent individually across a concentration range spanning at least six orders of magnitude. Additionally, test mixtures of structurally similar compounds to identify potential synergistic effects on binding.
Signal Measurement: Depending on transducer principle (electrochemical, optical, piezoelectric), measure signal response. For electrochemical platforms using square-wave voltammetry with [Fe(CN)6]3−/4− redox marker, record current changes before and after binding events [61].
Data Analysis: Calculate IC50 values for target and cross-reactants using four-parameter logistic (4PL) curve fitting. Determine cross-reactivity percentages using the standard formula. Values <1% indicate high specificity, while values >10% may be problematic for applications requiring precise discrimination.
Critical Considerations for Immunosensors:
- Implement oriented immobilization strategies to maximize binding site accessibility
- Carefully control antibody density to avoid steric hindrance while maximizing sensitivity
- Consider using antibody fragments (Fab', scFv) for improved surface coverage and potentially reduced cross-reactivity
- Account for batch-to-batch variability in antibody production through rigorous quality control
Aptasensor-Specific Validation Protocol
Protocol for Cross-Reactivity Assessment in Aptasensors:
Aptamer Immobilization: Thiol-modified aptamers are typically immobilized on gold surfaces via self-assembled monolayers, with subsequent passivation using 6-mercapto-1-hexanol (6-MHol) to minimize non-specific binding [61]. Alternatively, biotin-streptavidin conjugation or carbodiimide chemistry can be employed depending on substrate material.
Folding Pre-treatment: Prior to immobilization or use, heat aptamers to 65-95°C (depending on Tm) for 5-10 minutes and slowly cool in appropriate folding buffer (typically containing Mg2+) to ensure proper tertiary structure formation.
Calibration and Cross-Reactivity Testing: Follow similar dilution and testing schemes as for immunosensors, but consider aptamer-specific factors including magnesium concentration (typically 1-5 mM) and potential susceptibility to nuclease degradation (include inhibitors if necessary).
Regeneration Testing: Assess reusability by testing the ability to regenerate the sensing surface. Common regeneration methods include mild denaturing conditions (low salt, EDTA), brief low/high pH exposure, or urea treatment. Monitor signal recovery over multiple cycles (typically 5-20+ cycles depending on application).
Stability Assessment: Compare performance after storage under various conditions (4°C, room temperature, elevated temperature) and after exposure to challenging conditions (extreme pH, organic solvents).
Critical Considerations for Aptasensors:
- Ensure proper aptamer folding through optimized thermal and buffer conditions
- Consider post-SELEX modifications and truncation strategies to improve specificity and reduce non-specific binding [78]
- Evaluate susceptibility to nuclease degradation in real samples and implement stabilization strategies if needed
- Leverage reusability as a key advantage; establish maximum regeneration cycles without significant performance degradation
Research Reagent Solutions for Cross-Reactivity Assessment
Table 4: Essential Research Reagents for Cross-Reactivity Studies
| Reagent Category | Specific Examples | Function in Validation | Technology Applicability |
|---|---|---|---|
| Immobilization Matrices | 4-Aminothiophenol (4-ATP); 6-Mercapto-1-hexanol (6-MHol); Protein A/G; Streptavidin | Controlled orientation and density of bioreceptors | Both (specific reagents vary) |
| Cross-Linking Agents | EDC; NHS; Sulfo-SMCC; Glutaraldehyde | Covalent attachment of recognition elements | Both |
| Blocking Agents | BSA; Casein; Salmon Sperm DNA; PEG | Minimize non-specific binding | Both |
| Redox Markers | [Fe(CN)6]3−/4−; [Ru(NH3)6]3+; Methylene Blue | Electrochemical signal transduction | Primarily electrochemical platforms |
| Signal Reporters | Horseradish Peroxidase; Alkaline Phosphatase; Fluorescent dyes (Cy5.5, FAM) | Signal generation and amplification | Both |
| Aptamer Folding Reagents | MgCl2; KCl; Tris buffer | Ensure proper tertiary structure formation | Aptasensors |
| Regeneration Solutions | Low/high pH buffers; EDTA; Urea; SDS | Sensor surface regeneration for reuse | Both (aptasensors typically more resilient) |
Advanced Considerations and Future Directions
Emerging Strategies for Enhanced Specificity
Computational Modeling and Rational Design: Molecular docking simulations and quantitative structure-activity relationship (QSAR) analysis are increasingly employed to predict and optimize binding specificity. For aptasensors, in silico approaches enable rational truncation strategies, as demonstrated with a 63-nucleotide okadaic acid aptamer successfully minimized to a 31-nucleotide variant with maintained binding affinity [78]. Similar computational approaches can guide mutagenesis studies for antibody complementarity-determining regions (CDRs) to enhance specificity.
Hybrid Recognition Systems: Combining antibodies and aptamers in integrated sensing platforms leverages the advantages of both technologies. These hybrid systems can employ one recognition element for capture and the other for signal amplification, potentially mitigating the limitations of either technology used independently [15] [79].
Assay Condition Optimization: Beyond inherent bioreceptor properties, strategic manipulation of assay conditions can significantly modulate cross-reactivity profiles. Research demonstrates that shifting to lower concentrations of immunoreagents can decrease cross-reactivities by up to five-fold [1]. Similarly, variations in ionic strength, pH, and addition of organic modifiers can preferentially disrupt lower-affinity interactions with cross-reactants.
Standardization Challenges and Recommendations
The development of universally applicable cross-reactivity assessment protocols faces several challenges, including the diversity of biosensor platforms, variation in target classes, and differences in intended applications. To advance standardization efforts, we recommend:
Minimum Cross-Reactant Panels: Establish target-class-specific minimum panels of structurally similar compounds that must be included in cross-reactivity assessments.
Reporting Standards: Require comprehensive reporting of assay conditions (buffer composition, pH, incubation times, temperature) alongside cross-reactivity data, as these significantly impact results.
Matrix Testing Tiers: Implement tiered matrix validation requirements based on intended application, ranging from simple buffer systems to highly complex clinical or environmental samples.
Data Transparency: Encourage publication of both positive and negative cross-reactivity data to build comprehensive specificity profiles for recognition elements.
The establishment of standardized validation protocols for cross-reactivity assessment is essential for advancing biosensor reliability and facilitating regulatory approval. While immunosensors and aptasensors each present distinct advantages and challenges, rigorous cross-reactivity evaluation following the methodologies outlined in this guide enables informed selection and optimization for specific applications.
Immunosensors benefit from extensive historical validation and naturally evolved specificity but face challenges in production consistency and stability. Aptasensors offer advantages in production control, reusability, and stability but require careful optimization to achieve comparable specificity. The experimental data presented demonstrates that both platforms can achieve excellent specificity when properly designed and validated.
As both technologies continue to evolve, the adoption of standardized cross-reactivity assessment protocols will be crucial for translating promising biosensing platforms from research laboratories to practical applications in clinical diagnostics, environmental monitoring, and food safety.
In Silico Tools and Bioinformatic Predictions for Cross-Reactivity Screening
Cross-reactivity, the phenomenon where a single recognition element binds to multiple, often similar targets, presents a significant challenge in molecular recognition sciences [80]. For researchers developing immunosensors and aptasensors, this challenge is twofold: undesirable cross-reactivity can compromise diagnostic specificity, while engineered cross-reactivity can be beneficial for detecting multiple analytes or targets across species [81] [82]. Traditional experimental methods for characterizing cross-reactivity are resource-intensive, creating a critical need for robust in silico prediction tools that can accelerate screening and guide rational design.
This guide provides a comparative analysis of computational methods for cross-reactivity assessment, evaluating their underlying algorithms, performance metrics, and practical applications. We focus specifically on their utility in the context of biosensor development, where predicting molecular interactions is paramount for creating highly specific diagnostic and therapeutic tools.
Comparative Analysis of In Silico Tools
The landscape of in silico tools for cross-reactivity prediction encompasses structure-based, sequence-based, and machine learning approaches, each with distinct strengths and limitations.
Table 1: Key In Silico Tools for Cross-Reactivity and Interaction Prediction
| Tool Name | Primary Approach | Target Application | Key Input Parameters | Reported Performance |
|---|---|---|---|---|
| Cross-React [83] | Structure-based patch analysis | Allergen cross-reactivity | 3D protein structures, Solvent Accessible Surface Area (SASA) | Successfully identified cross-reactive allergens with >30% sequence identity; uses Pearson Correlation Coefficient (PCC) for ranking |
| MISCAST [84] | Structural impact prediction | Missense variant pathogenicity | Protein structural features, variant position | P3DFi scores; performance varies by gene and training set |
| REVEL [84] | Ensemble machine learning (Random Forest) | Missense variant pathogenicity | Functional impact scores, conservation scores, domain data | Integrates 18 individual tools; AUC performance varies by gene [84] |
| MutPred2 [84] | Deep neural networks | Missense variant pathogenicity | ClinVar/HGMD data, protein structural data, population frequency | Performance dependent on training set composition [84] |
| IL2pred [85] | Ensemble machine learning (Extra Trees) | IL-2 inducing peptide prediction | Dipeptide composition, peptide length | AUC: 0.84 (Main Dataset), 0.90 (Alternate Dataset 1); MCC: 0.51-0.61 [85] |
| SPLICE-AI [84] | Deep neural networks | Splice variant effect | Nucleotide sequence | >0.38 threshold: 90% sensitivity for pathogenicity; <0.2 threshold: 90% specificity for benignity [84] |
Tool Selection Guidelines
Choosing the appropriate tool depends on the specific research question and available data. Structure-based tools like Cross-React are invaluable when 3D structural information is available and conformational epitopes are of primary interest [83]. For research involving genetic variants or mutations, pathogenicity predictors like REVEL and MutPred2 offer insights into how sequence changes might affect protein function and interaction profiles [84]. When engineering peptides for specific immune responses, specialized predictors like IL2pred provide targeted functionality [85].
Performance validation remains challenging, as tool accuracy can be gene-specific and dependent on the training data [84]. For instance, a tool demonstrating excellent performance for BRCA1/2 variants may show inferior sensitivity (<65%) for pathogenic TERT variants [84]. This underscores the importance of understanding each tool's underlying training set and limitations before application.
Experimental Data and Validation
Validation of Structure-Based Predictions
The Cross-React method was validated on a diverse set of seven allergens with experimentally confirmed cross-reactivity [83]. The method successfully identified cross-reactive allergens that shared similar tertiary structure and >30% sequence identity with query allergens. The tool operates by identifying surface patches on 3D structures of potential allergens with amino acid compositions similar to known epitopes, calculating similarity using Pearson correlation coefficient (PCC) between amino acid compositions [83]. This approach is particularly valuable for predicting cross-reactivity between distantly related allergens where linear sequence alignment methods often fail.
Performance in Antibody and Aptamer Development
Experimental validation of cross-reactive antibodies selected using in silico guided approaches demonstrates the practical utility of these tools. In phage display campaigns for snake toxin targets, cross-panning strategies increased the percentage of cross-reactive single-chain variable fragments (scFvs) in two out of three campaigns [82]. The feasibility of discovering cross-reactive binders correlated with antigen similarity, but sequence and structural similarity alone were not perfect predictors. Notably, antigens sharing the same functions offered higher success rates, likely due to structurally similar motifs [82].
For aptamer development, bioinformatics approaches analyzing the mutational landscape within clusters of related sequences have proven effective for identifying high-affinity ligands with defined cross-reactivity profiles [81]. These methods leverage high-throughput sequencing data from Systematic Evolution of Ligands by Exponential Enrichment (SELEX) processes to guide selection.
Limitations and Gene-Specific Performance
Recent performance validation studies reveal important limitations. When applied to cancer gene variants (BRCA1, BRCA2, TP53, TERT, ATM), several tools showed inferior sensitivity (<65%) for pathogenic TERT variants and inferior sensitivity (≤81%) for benign TP53 variants [84]. This gene-specific performance highlights that tools trained on aggregated multi-gene datasets may not always transfer effectively to individual genes, emphasizing the need for gene-specific validation where possible.
Experimental Protocols for Cross-Reactivity Assessment
Workflow for Structure-Based Prediction
Table 2: Key Research Reagent Solutions for Cross-Reactivity Studies
| Reagent/Category | Function in Cross-Reactivity Assessment |
|---|---|
| Allergen/Antigen Databases (e.g., SDAP [83]) | Provide curated structural and sequence data for cross-reactivity analysis |
| 3D Structural Data (X-ray crystallography, homology models) | Essential for structure-based tools like Cross-React; enable conformational epitope analysis |
| Phage Display Libraries | Generate diverse antibody/aptamer repertoires for experimental validation [82] |
| High-Throughput Sequencing | Enables analysis of selection outputs (e.g., SELEX, phage display) [81] |
| Reference/Target Proteins | Critical for differentiating specific binders from non-specific interactors [81] |
Diagram 1: Structural Cross-Reactivity Prediction Workflow. This workflow outlines the key steps for using structure-based tools like Cross-React, from initial protein structure preparation to final experimental validation of predictions.
Bioinformatics-Guided Aptamer Selection
The integration of high-throughput sequencing with bioinformatics has transformed aptamer selection. A proven methodology involves:
- Library Preparation and Selection: A random oligonucleotide pool (e.g., N40 library) is incubated with the target protein. Bound sequences are recovered, amplified, and taken through multiple selection rounds with increasing stringency [81].
- High-Throughput Sequencing: RNA pools from different selection rounds are reverse-transcribed, amplified with barcoded primers, and sequenced [81].
- Bioinformatic Analysis: Sequencing data is processed to identify enriched sequences. Cluster analysis groups related sequences, and the mutational landscape within clusters guides the identification of optimal aptamer candidates [81].
- Cross-Reactivity Screening: Candidates are tested against reference targets to eliminate binders with reduced specificity. This step is crucial for ensuring target-specific binding [81].
Diagram 2: Bioinformatics-Guided Aptamer Discovery. This workflow integrates wet-lab selection with computational analysis to efficiently identify high-affinity aptamers with minimal cross-reactivity.
The evolving landscape of in silico tools for cross-reactivity screening offers researchers powerful resources for biosensor development. Structure-based methods provide critical insights when 3D structural information is available, while ensemble machine learning approaches integrate diverse data types for comprehensive prediction. The experimental validation data demonstrates that these tools can significantly enhance the efficiency of discovering and engineering cross-reactive binders when their limitations are properly respected.
Future developments will likely focus on integrating multiple prediction modalities and improving gene-specific and target-specific performance. As these tools become more sophisticated and validated against broader experimental datasets, they will play an increasingly central role in the rational design of highly specific immunosensors and aptasensors, ultimately accelerating diagnostic and therapeutic development.
Surface Plasmon Resonance (SPR) biosensors have become indispensable tools in biomedical diagnostics and drug development for quantifying biomolecular interactions in real-time. A critical component determining the performance of any SPR biosensor is its biorecognition element. For decades, immunosensors utilizing antibodies have been considered the gold standard. However, the emergence of aptamers—single-stranded DNA or RNA oligonucleotides selected in vitro—has introduced a powerful alternative in the form of aptasensors [15] [66]. This meta-analysis provides a systematic comparison of the diagnostic specificity of these two principal receptor classes, immunosensors and aptasensors, within the context of SPR biosensing. The objective is to offer a rigorous, data-driven assessment of their performance, with a particular focus on cross-reactivity, a key determinant of diagnostic reliability in complex biological matrices. Understanding the strengths and limitations of each platform is essential for researchers and drug development professionals selecting the optimal technology for specific diagnostic applications.
Performance and Specificity Comparison
To objectively evaluate both sensor types, we synthesized data from comparative studies that directly assessed SPR-based immunosensors and aptasensors under similar experimental conditions. The analysis focuses on key performance metrics, including sensitivity, limit of detection (LOD), and reusability, which are intrinsically linked to the specificity and robustness of the biorecognition event.
Table 1: Comparative Performance of SPR Immunosensors and Aptasensors
| Target Analyte | Sensor Type | Limit of Detection (LOD) | Dynamic Range | Key Distinguishing Feature | Reference |
|---|---|---|---|---|---|
| Aflatoxin B1 (AFB1) | Aptasensor | 0.0085 ppb | 0.2–200 ppb | 7 regeneration cycles | [50] |
| Aflatoxin B1 (AFB1) | Immunosensor | 0.0110 ppb | 0.2–200 ppb | 1 regeneration cycle | [50] |
| Prostate Specific Antigen (PSA) | Aptasensor | 0.14 ng mL⁻¹ | Not Specified | Superior stability & cost-effectiveness | [49] |
| Prostate Specific Antigen (PSA) | Immunosensor | 0.14 ng mL⁻¹ | Not Specified | Comparable initial LOD | [49] |
| Viruses (Pooled) | SPR Aptasensor | High Sensitivity (Pooled) | Varied | Best results from conventional SPR configurations | [86] [27] |
The data reveal several critical trends. First, in head-to-head comparisons for specific targets like Aflatoxin B1, aptasensors can achieve a slightly superior LOD and a dramatically enhanced reusability profile, enduring seven regeneration cycles without performance loss compared to a single cycle for the immunosensor [50]. This suggests aptamers undergo reversible denaturation more readily than antibodies, which can be permanently damaged by harsh regeneration conditions. Second, for some protein targets like PSA, both sensors can demonstrate comparable sensitivity in terms of LOD [49]. However, the aptasensor platform maintained advantages in long-term stability and cost-effectiveness. A broader meta-analysis of viral diagnostics confirmed that SPR aptasensors are highly effective, with conventional configurations showing excellent diagnostic results [86] [27].
Cross-Reactivity Assessment
Cross-reactivity occurs when a biorecognition element binds to non-target molecules that share structural similarities with the intended analyte, leading to false-positive results. The fundamental structural and operational differences between antibodies and aptamers directly influence their cross-reactivity profiles.
Immunosensor Cross-Reactivity
Antibodies bind to specific epitopes on their targets through complex molecular interfaces. A primary source of cross-reactivity in immunosensors arises from shared linear or conformational epitopes across different proteins or molecules. For instance, an antibody designed for one viral surface protein might inadvertently bind to a structurally similar protein from a different virus strain or a host protein. This is often mitigated by meticulous antibody screening and purification, but it remains a significant challenge, especially with polyclonal antibody preparations. The immobilization method is also critical; random orientation on the sensor surface can block paratopes and promote non-specific binding, thereby increasing the risk of cross-reactivity [15].
Aptasensor Cross-Reactivity
Aptamers fold into defined three-dimensional structures that engage targets through a combination of hydrogen bonding, electrostatic interactions, van der Waals forces, and shape complementarity [66]. Their cross-reactivity profile is distinct; they are highly specific for their target's three-dimensional structure. A key advantage is the in vitro selection process (SELEX), which can be designed to include counter-selection steps against common interferents. This proactively enriches the aptamer pool for sequences that ignore non-target molecules, thereby engineering high specificity directly into the receptor [66]. Furthermore, the smaller size of aptamers allows for higher density immobilization, which can enhance sensitivity but requires careful surface chemistry to minimize non-specific adsorption of other molecules.
Experimental Protocols for Specificity Evaluation
To ensure the reliability and reproducibility of cross-reactivity data, standardized experimental protocols are essential. The following methodologies are commonly employed to rigorously assess the specificity of both SPR immunosensors and aptasensors.
Sample and Reagent Preparation
- Sensor Chip Functionalization: Gold sensor chips are functionalized following established protocols. For immunosensors, protein A/G or amine coupling are used to immobilize antibodies (150 kDa) or antibody fragments like Fab' (∼50 kDa) [15]. For aptasensors, thiol- or biotin-streptavidin chemistry is used to immobilize aptamers (10-100 nucleotides) [86] [27].
- Analyte and Interferent Solutions: Prepare serial dilutions of the pure target analyte in a suitable running buffer (e.g., HBS-EP). For specificity tests, prepare solutions of structurally similar analogs or common interferents expected in the sample matrix at concentrations significantly higher than the target.
Specificity Assay Procedure
- Baseline Establishment: Flow running buffer over the functionalized sensor surface at a constant rate (e.g., 30 µL/min) until a stable baseline is achieved.
- Target Association: Inject the target analyte solution for a fixed period (e.g., 120-300 seconds) to monitor the association phase.
- Dissociation Phase: Switch back to running buffer for a similar duration to monitor dissociation.
- Surface Regeneration: For immunosensors, a brief pulse (15-30 seconds) of a regeneration solution (e.g., 10 mM Glycine-HCl, pH 2.0) is injected to remove bound analyte. For aptasensors, a milder regeneration (e.g., low salt buffer) is often sufficient [50].
- Cross-Reactivity Test: Repeat steps 1-4, substituting the target analyte solution with solutions of potential interferents.
- Data Analysis: Calculate the response units (RU) for the target and each interferent at the end of the association phase. The cross-reactivity percentage is calculated as:
(RU_Interferent / RU_Target) * 100%. A value below 5% is typically considered indicative of high specificity.
Meta-Analysis and Data Validation
- Literature Screening: Follow PRISMA guidelines to identify relevant studies, as demonstrated in recent systematic reviews [86] [27].
- Quality Assessment: Use tools like QUADAS-2 to evaluate the risk of bias in the selected diagnostic studies.
- Statistical Synthesis: Perform a meta-analysis using software like Cochrane RevMan to calculate pooled sensitivity and specificity estimates, acknowledging heterogeneity (e.g., I² statistic) between studies [86].
Signaling Pathways and Experimental Workflows
The following diagram visualizes the core experimental workflow for conducting a comparative specificity analysis between an SPR immunosensor and aptasensor, highlighting the parallel paths and key decision points.
Comparative Specificity Assay Workflow
The Scientist's Toolkit: Essential Research Reagents
Successful development and deployment of SPR immunosensors and aptasensors rely on a suite of specialized reagents and materials. The table below details key components and their functions.
Table 2: Essential Reagents for SPR Biosensor Research
| Reagent/Material | Function in Immunosensors | Function in Aptasensors | Key Considerations |
|---|---|---|---|
| Gold Sensor Chips | Signal transduction platform; surface for antibody immobilization. | Signal transduction platform; surface for aptamer immobilization. | High surface purity and consistent thickness are critical for reproducible SPR angles. |
| Protein A/G | Affinity capture proteins for oriented antibody immobilization via Fc region. | Not typically used. | Enhances antigen-binding capacity; choice depends on antibody subclass. [15] |
| Biotin-Streptavidin | Can be used for biotinylated antibody immobilization. | Primary method for oriented immobilization of biotinylated aptamers. | Provides strong, specific binding; high density streptavidin surfaces are essential. [15] |
| Monoclonal Antibodies | Biorecognition element; provides specificity towards a single epitope. | Not applicable. | Preferred for consistency; production is biological, costly, and time-consuming. [15] |
| DNA/RNA Aptamers | Not applicable. | Biorecognition element; provides specificity via 3D structure. | Chemically synthesized, stable, and cost-effective; selected via SELEX. [66] |
| Regeneration Buffers | Harsh conditions (low/high pH) often needed to disrupt strong antibody-antigen bonds. | Milder conditions often sufficient due to reversible aptamer denaturation. | Must be optimized to fully dissociate analyte without damaging the immobilized receptor. [50] |
This meta-analysis demonstrates that both SPR immunosensors and aptasensors are powerful diagnostic platforms capable of high sensitivity and specificity. The choice between them is not a matter of simple superiority but depends on the specific application requirements. Immunosensors leverage the well-established power of antibodies and are often the first choice for detecting protein targets where a proven, high-affinity antibody exists. However, they can be limited by batch-to-batch variability, cost, and limited shelf-life. In contrast, aptasensors offer significant advantages in terms of reusability, stability, and cost-effectiveness of production. Their specificity, engineered in vitro, can be exceptionally high, and their smaller size allows for greater sensor surface density. For novel targets, toxic compounds, or applications demanding robust, field-deployable sensors, aptasensors present a compelling alternative. Future research integrating artificial intelligence for aptamer design and further optimization of surface chemistries will continue to narrow the performance gap, solidifying the role of SPR aptasensors in the next generation of diagnostic tools.
Analyzing Real-World Performance in Complex Matrices like Food and Clinical Samples
In the fields of medical diagnostics and food safety control, biosensors that can deliver reliable results in complex, real-world samples are paramount. These samples, ranging from human serum to food extracts, contain myriad interfering substances that can compromise analytical accuracy. A critical figure of merit for any biosensing platform is its cross-reactivity—the ability to distinguish the target analyte from structurally similar compounds. For a long time, immunosensors, which use antibodies as their recognition element, have been the gold standard. However, the emergence of aptasensors, which employ synthetic nucleic acid aptamers, presents a compelling alternative. This guide provides an objective, data-driven comparison of the real-world performance of immunosensors and aptasensors, with a specific focus on their cross-reactivity profiles in complex matrices. Cross-reactivity is formally defined as the ratio of the concentrations of the target analyte and a cross-reactant that cause the same analytical signal, typically a 50% signal inhibition in competitive assays, expressed as a percentage [1]. A lower cross-reactivity value indicates higher specificity. The ensuing analysis synthesizes experimental data and theoretical frameworks to evaluate how these two biorecognition elements perform outside of idealized laboratory conditions.
Core Technologies: Immunosensors vs. Aptasensors
Fundamental Characteristics of Biorecognition Elements
The performance differences between immunosensors and aptasensors are rooted in the intrinsic properties of their respective biorecognition elements.
Immunosensors rely on antibodies, which are proteins produced by the immune system. They offer high affinity and specificity but have limitations. Their protein nature makes them susceptible to denaturation under non-physiological conditions (e.g., extreme pH or temperature). The production of antibodies is a biological process, conducted in animals or cell cultures, leading to higher costs and potential batch-to-batch variability [15] [47]. Furthermore, their large size (∼150 kDa for whole antibodies) can limit the density of immobilization on a sensor surface and their ability to access small molecules or specific epitopes [15].
Aptasensors utilize aptamers, which are single-stranded DNA or RNA oligonucleotides selected in vitro through a process called Systematic Evolution of Ligands by Exponential Enrichment (SELEX) [15] [47]. Aptamers fold into defined three-dimensional structures to bind their targets. Key advantages include their synthetic production, which ensures low cost and high reproducibility. They are generally more stable than antibodies, can be easily denatured and renatured without losing function, and are amenable to chemical modifications for enhanced stability and facile immobilization [54] [47]. Their smaller size facilitates higher surface density and potentially better access to targets.
Table 1: Fundamental Comparison of Antibodies and Aptamers.
| Characteristic | Antibodies (Immunosensors) | Aptamers (Aptasensors) |
|---|---|---|
| Biochemical Nature | Protein (Immunoglobulin G) | Single-stranded DNA or RNA |
| Production Process | In vivo (Biological Systems) | In vitro (SELEX) |
| Production Time | Months | Weeks |
| Cost of Production | High | Moderate to Low |
| Batch-to-Batch Variation | Possible | Minimal |
| Thermal Stability | Low; irreversible denaturation | High; reversible denaturation |
| Chemical Modifications | Difficult and expensive | Easy and site-specific |
| Molecular Size | ~150 kDa (whole antibody) | 10-100 nucleotides (small) |
| Target Range | Primarily immunogenic molecules | Broad (ions, small molecules, proteins, cells) |
Signaling Mechanisms and Assay Formats
Both platforms can be integrated with a wide array of transducers, including electrochemical, optical (e.g., fluorescence, Surface Plasmon Resonance), and piezoelectric systems [54] [87] [55]. The choice of transducer and assay format significantly influences the sensor's sensitivity, limit of detection, and crucially, its cross-reactivity.
A common format for detecting small molecules is the competitive assay. In this format, the target analyte in the sample competes with a labeled analog for binding sites on the immobilized biorecognition element. The signal is inversely proportional to the concentration of the target. The cross-reactivity in such assays is not an immutable property of the antibody or aptamer but can be modulated by the assay conditions. Research has demonstrated that using lower concentrations of antibodies and their competing antigens can lead to a five-fold decrease in cross-reactivity, thereby enhancing specificity [1]. This is because at lower reagent concentrations, the assay becomes more dependent on the affinity of the binding reaction, favoring the highest-affinity interactions (typically with the intended target) over lower-affinity cross-reactions.
Performance Comparison in Complex Matrices
Experimental Data from Direct Comparative Studies
A direct comparative study for the detection of Prostate Specific Antigen (PSA), a key clinical biomarker for prostate cancer, provides valuable experimental insights. Researchers developed both an immunosensor and an aptasensor on the same graphene quantum dots-gold nanorods (GQDs-AuNRs) modified screen-printed electrodes, allowing for a controlled comparison [49].
Table 2: Experimental Comparison of PSA Immunosensor and Aptasensor [49].
| Parameter | PSA Immunosensor | PSA Aptasensor |
|---|---|---|
| Biorecognition Element | Monoclonal Anti-PSA Antibody | DNA Aptamer specific to PSA |
| Limit of Detection (LOD) | 0.14 ng mL⁻¹ | 0.14 ng mL⁻¹ |
| Detection Techniques | CV, DPV, EIS | CV, DPV, EIS |
| Real Sample Analysis | Acceptable results in human serum | Acceptable results in human serum |
| Noted Advantages | High selectivity (for the specific antibody used) | Better stability, simplicity, cost-effectiveness |
The study concluded that while both sensors showed comparable sensitivity (LOD) and performance in real samples, the aptasensor offered distinct advantages in terms of better stability, simplicity, and cost-effectiveness [49]. This highlights that for certain targets, aptasensors can match the performance of established immunosensors while offering practical benefits.
Cross-Reactivity and Specificity in Food Safety Monitoring
The analysis of hazards in food, such as mycotoxins and allergens, presents a significant challenge due to the presence of structural analogs and complex sample matrices.
- Mycotoxin Detection: Immunoassays for mycotoxins can suffer from cross-reactivity with toxin congeners, which is sometimes desirable for class-specific screening but problematic for quantifying a single specific toxin. Aptasensors have demonstrated a strong ability to discriminate between structurally similar molecules. For instance, various optical and electrochemical aptasensors have been developed for Fumonisin B1 (FB1) with high specificity, effectively distinguishing it from other mycotoxins [55]. The design of the aptamer sequence and its three-dimensional structure is crucial for this high specificity.
- Food Allergen Detection: Conventional methods like ELISA can yield false positives due to cross-reactivity and matrix effects [47]. Aptasensors are emerging as robust alternatives. For example, aptamers have been selected against β-lactoglobulin, a major milk allergen, and integrated into graphene-based biosensors, showing high specificity without significant cross-reactivity with other milk proteins [47]. The inherent ability of aptamers to be engineered for specific epitopes makes them less prone to non-specific binding in complex food matrices.
Experimental Protocols for Cross-Reactivity Assessment
To ensure the reliability of biosensor data, standardized protocols for evaluating cross-reactivity and performance in complex matrices are essential.
Protocol for Cross-Reactivity Calculation
This protocol is standardized for competitive immunoassays and aptasensors [1].
- Dose-Response Curves: Run the full assay procedure for a dilution series of both the primary target analyte and the potential cross-reactant.
- IC₅₀ Determination: For each compound, plot the signal (e.g., % inhibition) against the logarithm of its concentration. Determine the concentration that produces 50% signal inhibition (IC₅₀).
- Cross-Reactivity Calculation: Calculate the cross-reactivity (CR) for each cross-reactant using the formula: ( CR (\%) = \frac{IC{50}(target\ analyte)}{IC{50}(cross\text{-}reactant)} \times 100\% )
- Interpretation: A CR of 100% indicates equal recognition, a CR of 1% indicates the cross-reactant is 100 times less potent, and a CR of 0.1% indicates it is 1000 times less potent.
Protocol for Real-World Sample Analysis (e.g., Food Extract)
This protocol outlines the steps for validating a sensor with a complex food matrix [87] [55].
- Sample Preparation: Homogenize the food sample. Extract the target analyte using a suitable solvent (e.g., methanol/water for mycotoxins). The extract may require dilution, filtration, or purification to reduce matrix interference.
- Sensor Calibration: Perform a calibration curve using the target analyte in a pure buffer solution.
- Spike-and-Recovery Test: Spike a known amount of the target analyte into the prepared food extract (which is previously confirmed to be free of the analyte or its background level is known). Analyze the spiked sample using the biosensor.
- Recovery Calculation: Calculate the percentage recovery: ( Recovery (\%) = \frac{Measured\ Concentration}{Spiked\ Concentration} \times 100\% ). Acceptable recovery rates typically fall between 80% and 120%.
- Matrix Effect Evaluation: Compare the calibration curve in the buffer to one performed in the food extract. A significant shift in the curve indicates a matrix effect that may need to be mitigated through sample clean-up or standard addition methods.
Cross-Reactivity Calculation Workflow
The Scientist's Toolkit: Key Research Reagent Solutions
The development and deployment of reliable immunosensors and aptasensors depend on a suite of key reagents and materials.
Table 3: Essential Research Reagents for Biosensor Development.
| Reagent/Material | Function in Biosensor Development | Application Context |
|---|---|---|
| Monoclonal Antibodies | High-specificity capture probe; often used in sandwich assays for large antigens. | Immunosensors for proteins, viruses [15]. |
| Recombinant Antibody Fragments (scFv, Fab') | Smaller size allows for higher surface density; engineered tags enable oriented immobilization. | Immunosensors requiring improved sensitivity and controlled surface chemistry [15]. |
| DNA/Aptamers | Synthetic recognition element; can be selected against a wide range of targets. | Aptasensors for small molecules, toxins, proteins [47] [87]. |
| Chemical Tags (Biotin, Thiol, Amine) | Facilitates covalent or affinity-based immobilization of biorecognition elements onto sensor surfaces. | Both platforms; e.g., thiolated aptamers on gold surfaces [15] [87]. |
| Nanomaterials (GQDs, AuNRs, MOFs) | Enhance electron transfer, increase surface area, and serve as signal amplifiers or carriers. | Electrochemical and optical biosensors to lower LOD [49] [87]. |
| Protein A / Protein G | Affinity ligands for oriented immobilization of antibodies via their Fc region. | Immunosensors to improve antigen-binding capacity [15]. |
| Streptavidin | High-affinity binding partner for biotin, used for immobilizing biotinylated antibodies or aptamers. | Both platforms for oriented and stable surface functionalization [15]. |
Biosensor Architecture and Binding Events
The choice between an immunosensor and an aptasensor for applications in complex matrices is not a simple matter of one being superior to the other. Immunosensors, with their long history and extensive validation, remain a powerful and reliable technology, particularly for targets where highly specific antibodies are available. However, aptasensors have firmly established themselves as competitive alternatives, offering comparable and sometimes superior sensitivity with distinct practical advantages in terms of stability, cost, and engineering flexibility. The critical insight from contemporary research is that cross-reactivity is a tunable parameter influenced by assay design and reagent concentrations, not just an intrinsic property of the capture probe [1]. Therefore, the optimal biosensor platform depends on the specific application: immunosensors may be preferred for established clinical biomarkers with well-characterized antibodies, while aptasensors show immense promise for new targets, point-of-care applications, and situations requiring robust, low-cost, and highly specific detection in challenging environments like food matrices. Future developments will likely see increased use of hybrid approaches that leverage the strengths of both antibodies and aptamers within a single sensing platform [15].
The accurate detection of low-weight molecules is paramount across diverse fields, from ensuring food safety to environmental monitoring. Within this context, immunosensors and aptasensors have emerged as two leading biosensor paradigms. While both utilize highly specific biorecognition elements, their fundamental components—antibodies for immunosensors and single-stranded DNA or RNA aptamers for aptasensors—impart distinct characteristics that critically influence their performance. A thorough, head-to-head comparison of their advantages and limitations, particularly regarding cross-reactivity, is essential for researchers and developers to select the optimal technology for their specific application. This guide objectively evaluates both sensor types by examining direct comparative studies and recent experimental data, providing a structured framework for informed decision-making.
Performance Comparison: Quantitative Data Analysis
The following tables summarize key performance metrics for immunosensors and aptasensors, based on recent experimental findings.
Table 1: Overall Performance Profile of Immunosensors vs. Aptasensors
| Performance Parameter | Immunosensors | Aptasensors | Key Findings from Comparative Studies |
|---|---|---|---|
| Typical Limit of Detection (LOD) | ~0.0110 ppb (for Aflatoxin B1) [50] | ~0.0085 ppb (for Aflatoxin B1) [50] | Aptasensors can achieve marginally lower (more sensitive) LODs. [50] |
| Dynamic Range | 0.2–200 ppb [50] | 0.2–200 ppb [50] | Comparable dynamic ranges can be achieved for both platforms. [50] |
| Cross-reactivity & Selectivity | High, but can be susceptible to interference in complex matrices [13] | Very high; can be engineered for minimal cross-reactivity [50] | Aptamers can be selected to distinguish between closely related analogues (e.g., mycotoxins). [50] [13] |
| Reusability / Regeneration Cycles | 1 cycle [50] | 7 cycles [50] | Aptasensors demonstrate significantly superior reusability due to aptamer stability. [50] |
| Shelf Life & Operational Stability | Moderate; antibodies can denature over time [13] | Long; aptamers are chemically stable and resistant to degradation [13] | Aptamers offer extended shelf life and durability under varied conditions. [50] [13] |
| Production Cost & Batch Variability | High (biological production); potential for batch-to-batch variation [13] | Low (chemical synthesis); minimal batch-to-batch variability [13] | Synthetic production of aptamers makes them more cost-effective and consistent. [13] |
Table 2: Comparison of Biorecognition Element Properties
| Property | Antibodies (Immunosensors) | Aptamers (Aptasensors) |
|---|---|---|
| Production Process | In vivo (Animal hosts) | In vitro (SELEX process) [13] |
| Molecular Nature | Proteins (Large, complex structure) | Single-stranded DNA or RNA (Nucleic acids) [13] |
| Thermal Stability | Low; susceptible to denaturation [13] | High; can withstand repeated heating/cooling cycles [50] [13] |
| Modification Flexibility | Limited; site-specific conjugation can be challenging | High; easy chemical modification with functional groups [13] |
| Target Range | Primarily immunogenic molecules | Broad, including toxins, small molecules, ions [13] |
Experimental Protocols for Cross-Reactivity Assessment
A direct comparative study of an aptasensor and an immunosensor for detecting the mycotoxin Aflatoxin B1 (AFB1) provides a robust experimental framework for evaluating cross-reactivity and overall performance [50] [88].
SERS-Based Sensor Fabrication
- Substrate Preparation: A silver-impregnated porous silicon (Ag-pSi) substrate was fabricated via electrochemical anodization and subsequent immersion plating with silver nanoparticles. This substrate serves as a high-enhancement-factor platform for Surface-Enhanced Raman Scattering (SERS) [50].
- Bioreceptor Immobilization: The Ag-pSi substrate was functionalized with a Raman tag (4-aminothiophenol, 4-ATP). Subsequently, specific biorecognition elements were immobilized:
- Assay Principle: Both sensors operate on a ratiometric SERS principle. The binding of the AFB1 target to its bioreceptor (aptamer or antibody) induces a conformational change or a molecular shielding effect, which alters the signal intensity of the 4-ATP Raman tag. This change is quantitatively correlated with the target concentration [50].
Cross-Reactivity and Specificity Testing Protocol
To rigorously assess cross-reactivity, the following procedure is employed:
- Prepare Analyte Solutions: Prepare separate solutions containing the primary target (AFB1) and its structural analogues, such as Aflatoxin G1 (AFG1), Aflatoxin G2 (AFG2), Aflatoxin M1 (AFM1), Ochratoxin A (OTA), Deoxynivalenol (DON), and Zearalenone (ZEN) [50].
- Measure Sensor Response: Individually expose the functionalized sensors (both aptasensor and immunosensor) to each analyte solution at a fixed concentration.
- Quantify Signal Change: Measure the SERS signal and calculate the percentage change for each analyte relative to the blank signal.
- Calculate Cross-Reactivity Percentage: The cross-reactivity (%CR) is calculated using the formula: %CR = (Signal change from interfering analyte / Signal change from target analyte) × 100% A lower %CR indicates higher specificity and lower cross-reactivity [50].
This experimental design allows for a direct, side-by-side comparison of the selectivity of the two biorecognition elements under identical conditions.
Signaling Pathways and Experimental Workflows
The following diagrams illustrate the fundamental signaling mechanisms and the logical workflow for the comparative evaluation of the two sensor paradigms.
Biosensor Signaling Mechanisms
Cross-Reactivity Assessment Workflow
The Scientist's Toolkit: Key Research Reagent Solutions
Table 3: Essential Materials and Reagents for Sensor Development
| Item | Function in Experiment | Application Context |
|---|---|---|
| Porous Silicon (pSi) Wafers | Serves as a high-surface-area dielectric scaffold for impregnating noble metal nanoparticles, forming the foundational SERS substrate [50]. | Base substrate for metal-dielectric SERS platforms. |
| Silver Nanoparticles (AgNPs) | Impregnated into pSi to act as the plasmonic material that significantly enhances the Raman signal of the reporter molecule (SERS effect) [50]. | Key component for signal amplification in SERS sensors. |
| 4-Aminothiophenol (4-ATP) | Used as a Raman reporter tag; its distinct spectroscopic signature changes upon target binding, enabling ratiometric detection [50]. | Signal transducer in SERS-based biosensors. |
| Anti-AFB1 Aptamer | The synthetic DNA/RNA biorecognition element that binds AFB1 with high specificity and undergoes a conformational change [50]. | Bioreceptor for aptasensors; selected via SELEX. |
| Anti-AFB1 Antibody | The biological protein biorecognition element that binds AFB1 with high specificity through antigen-antibody interaction [13]. | Bioreceptor for immunosensors. |
| Protein A | Used for oriented immobilization of antibodies on the sensor surface, which helps preserve their antigen-binding affinity [50]. | Immunosensor surface chemistry reagent. |
| Aflatoxin Analogue Mix | A standard solution containing AFB1, AFG1, AFG2, AFM1, etc., used for specificity and cross-reactivity testing [50]. | Essential for validation of sensor selectivity. |
The direct, side-by-side comparison of immunosensors and aptasensors reveals a nuanced technological landscape. Immunosensors remain a powerful and well-established technology, offering high sensitivity and specificity, particularly for targets where well-characterized antibodies are available.
However, the experimental data compellingly demonstrates that aptasensors hold distinct advantages in several critical areas for modern sensing applications. Their superior reusability, long-term stability, and cost-effectiveness for chemical synthesis make them highly attractive for applications requiring repeated measurements or deployment in resource-limited settings [50] [13]. Furthermore, while both platforms can achieve high specificity, the ability to finely engineer aptamers via the SELEX process provides a powerful tool to minimize cross-reactivity against complex molecular backgrounds [50].
The choice between these two paradigms ultimately depends on the specific requirements of the application. For projects where robustness, cost, and operational longevity are paramount, aptasensors present a compelling case. In contrast, for targets where the available aptamers do not yet match the affinity of established antibodies, immunosensors may be the preferred option. This comparative guide provides the foundational data and experimental frameworks to empower researchers in making that critical choice.
Conclusion
The strategic assessment and minimization of cross-reactivity are paramount for developing reliable biosensors. This review synthesizes key takeaways, underscoring that cross-reactivity is not a fixed property but a tunable parameter influenced by bioreceptor design, assay format, and operational conditions. While immunosensors benefit from well-established optimization of reagent concentrations and kinetic controls, aptasensors offer a distinct advantage through the intentional integration of counter-selection during the SELEX process, enabling exceptional specificity. Future directions point toward the increased use of in silico predictive models and the development of hybrid sensors that leverage the strengths of both antibodies and aptamers. Advancing these technologies will be crucial for creating next-generation point-of-care diagnostics with the high specificity required for accurate clinical decision-making and effective drug development.
References
- 1. Changing Cross-Reactivity for Different Immunoassays ... [https://www.mdpi.com/2076-3417/11/14/6581]
- 2. A systematic review of allergen cross-reactivity: Translating ... [https://pmc.ncbi.nlm.nih.gov/articles/PMC10959674/]
- 3. Development of a highly specific chemiluminescence ... [https://www.sciencedirect.com/science/article/abs/pii/S0925400518319208]
- 4. Aptamer and Oligonucleotide-Based Biosensors for Health ... [https://pmc.ncbi.nlm.nih.gov/articles/PMC12109747/]
- 5. Reduced graphene oxide-based electrochemical ... [https://www.nature.com/articles/s41598-025-94313-6]
- 6. AI-optimized electrochemical aptasensors for stable, ... [https://www.sciencedirect.com/science/article/pii/S2405844024173690]
- 7. Multiplexed proteomic biosensor platform for label-free real ... [https://www.nature.com/articles/s42003-025-07844-z]
- 8. A Guide to Quantitative Biomarker Assay Development using ... [https://pmc.ncbi.nlm.nih.gov/articles/PMC5657521/]
- 9. [PDF] Structural of basis - antibody . antigen interactions [https://www.semanticscholar.org/paper/Structural-basis-of-antibody-antigen-interactions.-Sundberg/7f0b44c33da5268f16f7a1314ef8b4545bfed2cb]
- 10. Recent Advances in the Optimization of Nucleic Acid ... [https://pmc.ncbi.nlm.nih.gov/articles/PMC12564743/]
- 11. High throughput cross-interaction measures for human ... [https://pmc.ncbi.nlm.nih.gov/articles/PMC4622737/]
- 12. High-throughput analysis system of interaction kinetics for ... [https://www.nature.com/articles/s41598-023-46756-y]
- 13. A comprehensive review on optical and electrochemical ... [https://www.frontiersin.org/journals/nutrition/articles/10.3389/fnut.2025.1596673/full]
- 14. -based Structure -docking analysis of cross – antibody ... antigen [https://www.nature.com/articles/s41598-017-08414-y?error=cookies_not_supported&code=7dae69d5-753b-4ba8-91a4-32d76404d151]
- 15. Aptasensors versus immunosensors—Which will prevail? [https://pmc.ncbi.nlm.nih.gov/articles/PMC8961048/]
- 16. Methods for cell- and tissue-specific DNA aptamer selection [https://www.sciencedirect.com/science/article/pii/S2329050125000774]
- 17. Aptamers and Aptasensors for Highly Specific Recognition ... [https://www.mdpi.com/2072-6651/10/11/427]
- 18. Cross-Reactive Plasmonic Aptasensors for Controlled ... [https://pmc.ncbi.nlm.nih.gov/articles/PMC5620944/]
- 19. Research advances in the diagnosis of infectious disease by ... [https://pubs.rsc.org/en/content/articlehtml/2025/nh/d5nh00098j]
- 20. Machine learning guided aptamer refinement and discovery [https://www.nature.com/articles/s41467-021-22555-9]
- 21. Aptamers vs. Antibodies [https://basepairbio.com/aptamers-vs-antibodies/]
- 22. Aptamers [https://www.antibodies.com/aptamers]
- 23. Recent Advances in Aptamers-Based Nanosystems for ... [https://pmc.ncbi.nlm.nih.gov/articles/PMC11873322/]
- 24. Comparison of Aptamer-Based and Antibody-Based Assays ... [https://pmc.ncbi.nlm.nih.gov/articles/PMC8975030/]
- 25. Optimizing cross-reactivity with evolutionary search for ... [https://pubmed.ncbi.nlm.nih.gov/22142383/]
- 26. Selection of aptamers with high affinity and high specificity ... [https://www.sciencedirect.com/science/article/abs/pii/S0022175904003795]
- 27. Trends and Challenges of SPR Aptasensors in Viral ... [https://www.mdpi.com/2079-6374/15/4/245]
- 28. Designing the Future of Biosensing: Advances in Aptamer ... [https://pmc.ncbi.nlm.nih.gov/articles/PMC12562710/]
- 29. Comparison of Electrochemical Immunosensors and ... [https://pmc.ncbi.nlm.nih.gov/articles/PMC4810399/]
- 30. Different electrode system based electrochemical ... [https://www.sciencedirect.com/science/article/pii/S266635112400007X]
- 31. Redefining antibody cross-reactivity as an advantage for ... [https://www.sciencedirect.com/science/article/abs/pii/S0167779925001829]
- 32. An overview of ELISA: a review and update on best laboratory ... [https://pmc.ncbi.nlm.nih.gov/articles/PMC11808753/]
- 33. Development of competitive and noncompetitive ... [https://www.sciencedirect.com/science/article/abs/pii/S0304389421029800]
- 34. SPR vs ELISA | Comparing techniques for biomolecular ... [https://nicoyalife.com/blog/spr-vs-elisa-comparing-techniques-for-biomolecular-detection/]
- 35. Fluorescence Polarization Immunoassay for Rapid, ... [https://pmc.ncbi.nlm.nih.gov/articles/PMC11763590/]
- 36. Comparison of Enzyme-Linked Immunosorbent Assay ... [https://pmc.ncbi.nlm.nih.gov/articles/PMC4848629/]
- 37. Selection and characterization of DNA aptamers targeting ... [https://www.nature.com/articles/s42003-025-08034-7]
- 38. Capture-SELEX: Selection Strategy, Aptamer Identification ... [https://pmc.ncbi.nlm.nih.gov/articles/PMC9776347/]
- 39. Capture-SELEX: Selection Strategy, Aptamer Identification ... [https://www.mdpi.com/2079-6374/12/12/1142]
- 40. Selection and application of aptamers with high-affinity and ... [https://pubs.rsc.org/en/content/articlehtml/2020/ra/c9ra10600f]
- 41. High-Sensitive FAM Labeled Aptasensor Based on Fe3O4/ ... [https://pmc.ncbi.nlm.nih.gov/articles/PMC9496674/]
- 42. DFT-assisted design of a electrochemical sensor based on ... [https://www.sciencedirect.com/science/article/abs/pii/S0889157525000754]
- 43. Development and Validation of Aptasensor Based on MnO ... [https://www.mdpi.com/2079-6374/13/6/613]
- 44. Direct competitive enzyme-linked immunosorbent assay for ... [https://pubmed.ncbi.nlm.nih.gov/11073088]
- 45. Screening of a broad-spectrum aptamer and its application in ... [https://arabjchem.org/screening-of-a-broad-spectrum-aptamer-and-its-application-in-the-fabrication-of-an-aptasensor-for-the-detection-of-sulfonamides-in-animal-derived-foods/]
- 46. Comparative analysis of immunization strategies for broad ... [https://www.sciencedirect.com/science/article/abs/pii/S2212429225005267]
- 47. Emerging aptasensor technologies for sensitive detection ... [https://www.sciencedirect.com/science/article/abs/pii/S0889157525005551]
- 48. Assessment of allergen cross-reactivity - PMC - PubMed Central [https://pmc.ncbi.nlm.nih.gov/articles/PMC1797810/]
- 49. A comparative Study of Aptasensor Vs Immunosensor for ... [https://www.nature.com/articles/s41598-018-19733-z]
- 50. A comparative study of aptasensor vs. immunosensor for ... [https://www.sciencedirect.com/science/article/abs/pii/S0308814624032874]
- 51. Biosensors, Volume 15, Issue 9 (September 2025) [https://www.mdpi.com/2079-6374/15/9]
- 52. Cross-Reactive Plasmonic Aptasensors for Controlled ... [https://www.mdpi.com/1424-8220/17/9/1935]
- 53. Frontiers | A review of antibody, aptamer, and nanomaterials synergistic systems for an amplified electrochemical signal [https://www.frontiersin.org/journals/bioengineering-and-biotechnology/articles/10.3389/fbioe.2024.1361469/full]
- 54. Trends and Challenges of SPR Aptasensors in Viral ... [https://pmc.ncbi.nlm.nih.gov/articles/PMC12026110/]
- 55. A comprehensive review on optical and electrochemical ... [https://pmc.ncbi.nlm.nih.gov/articles/PMC12351934/]
- 56. Nano-Biosensing Platforms for Detection of Cow’s Milk Allergens: An Overview [https://www.mdpi.com/1424-8220/20/1/32]
- 57. Immunosensors | IntechOpen [https://www.intechopen.com/chapters/48359]
- 58. Electrochemical Affinity Biosensors Based on Disposable ... [https://www.mdpi.com/1424-8220/16/11/1863]
- 59. The optimization of electrochemical immunosensors to detect ... [https://pmc.ncbi.nlm.nih.gov/articles/PMC10262218/]
- 60. Enhancement of antigen–antibody kinetics on ... [https://www.sciencedirect.com/science/article/abs/pii/S0928493112002834]
- 61. Detection of Low Density Lipoprotein—Comparison ... [https://www.mdpi.com/1424-8220/21/22/7733]
- 62. Enhancing Sensitivity and Selectivity: Current Trends in ... [https://www.mdpi.com/2079-6374/14/10/496]
- 63. Development and Optimization of a Cost-Effective ... [https://www.mdpi.com/2079-6374/15/2/67]
- 64. Recent Advances in the Optimization of Nucleic Acid ... [https://pubmed.ncbi.nlm.nih.gov/41149295/]
- 65. Recent advances in aptamer discovery, modification and ... [https://www.sciencedirect.com/science/article/pii/S2405580824002164]
- 66. Recent Advances in the Optimization of Nucleic Acid ... [https://www.mdpi.com/2079-6374/15/10/641]
- 67. Harnessing in Silico Design for Electrochemical ... [https://www.mdpi.com/2079-6374/15/10/665]
- 68. Generation of cross - reactive DNA aptamers to construct the... [https://pubmed.ncbi.nlm.nih.gov/39929049/]
- 69. Frontiers | Simultaneous and sensitive detection of Mycobacterium... [https://www.frontiersin.org/journals/bioengineering-and-biotechnology/articles/10.3389/fbioe.2025.1692839/full]
- 70. In Silico Approaches for the Identification of Aptamer Binding ... [https://pmc.ncbi.nlm.nih.gov/articles/PMC9963831/]
- 71. Selection of ssDNA aptamers and construction of an aptameric... [https://pubs.rsc.org/en/content/articlehtml/2025/sd/d4sd00296b]
- 72. SERS-based aptasensor for culture-free detection of Escherichia coli... [https://nanoconvergencejournal.springeropen.com/articles/10.1186/s40580-025-00506-0]
- 73. Site-Selective Orientated Immobilization of Antibodies and ... [https://pmc.ncbi.nlm.nih.gov/articles/PMC5374010/]
- 74. The importance of antibody orientation for enhancing ... [https://pubs.rsc.org/en/content/articlehtml/2024/sd/d4sd00206g]
- 75. Oriented Surface Immobilization of Antibodies Using Enzyme ... [https://pmc.ncbi.nlm.nih.gov/articles/PMC12044683/]
- 76. Oriented immobilization of antibodies onto sensing platforms [https://www.sciencedirect.com/science/article/pii/S0003267021007339]
- 77. Aptasensors for Point-of-Care Detection of Small Molecules [https://www.mdpi.com/2079-6374/10/9/108]
- 78. Detection of Okadaic Acid (OA) [https://pmc.ncbi.nlm.nih.gov/articles/PMC12562321/]
- 79. Aptasensors versus immunosensors—Which will prevail? [https://www.semanticscholar.org/paper/a8712da96f7f480b7502a0f7d248987be62f92ca]
- 80. A systematic review of allergen cross-reactivity: Translating ... [https://www.sciencedirect.com/science/article/pii/S2772829324000262]
- 81. Identifying high-affinity aptamer ligands with defined cross ... [https://pmc.ncbi.nlm.nih.gov/articles/PMC4499151/]
- 82. Cross-reactivity trends when selecting scFv antibodies ... [https://www.nature.com/articles/s41598-023-37056-6]
- 83. Cross-React: a new structural bioinformatics method for ... [https://pmc.ncbi.nlm.nih.gov/articles/PMC5860227/]
- 84. The performance of in silico prediction tools for variant ... [https://www.medrxiv.org/content/10.1101/2025.07.29.25331316v1.full-text]
- 85. In Silico tool for predicting, designing and scanning IL-2 ... [https://www.nature.com/articles/s41598-025-08388-2]
- 86. Trends and Challenges of SPR Aptasensors in Viral ... [https://pubmed.ncbi.nlm.nih.gov/40277558/]
- 87. Aptasensors for Rapid Detection of Hazards in Food [https://www.mdpi.com/2079-6374/15/9/629]
- 88. A comparative study of aptasensor vs. immunosensor for ... [https://pubmed.ncbi.nlm.nih.gov/39423540/]