Dual-Gate OECT Architecture: A Comprehensive Guide to Drift Mitigation for Robust Biosensing
Organic Electrochemical Transistors (OECTs) are a leading platform for biosensing but are often plagued by temporal current drift, which compromises signal accuracy, especially in complex biological fluids.
Dual-Gate OECT Architecture: A Comprehensive Guide to Drift Mitigation for Robust Biosensing
Abstract
Organic Electrochemical Transistors (OECTs) are a leading platform for biosensing but are often plagued by temporal current drift, which compromises signal accuracy, especially in complex biological fluids. This article provides a thorough examination of the dual-gate OECT (D-OECT) architecture as a robust solution for drift mitigation. We explore the foundational principles of the drift phenomenon, rooted in ion adsorption kinetics, and detail the methodological implementation of dual-gate systems. The content further covers troubleshooting and optimization strategies for enhancing biosensor performance and presents a comparative validation of single-gate versus dual-gate configurations in buffer solutions and human serum. Aimed at researchers and scientists in bioelectronics and drug development, this guide synthesizes theoretical models and experimental data to demonstrate how D-OECTs enable highly sensitive, stable, and reliable detection of biomolecules for advanced clinical and biomedical applications.
Understanding the Drift Phenomenon: Origins and Impact on OECT Biosensor Reliability
Temporal current drift in Organic Electrochemical Transistors (OECTs) is a critical challenge characterized by the undesired, time-dependent fluctuation of the output current during device operation, even in the absence of a target analyte [1] [2]. This phenomenon can mask specific biological signals, reduce measurement accuracy, and compromise the reliability of biosensors, particularly in complex media like human serum [3]. This article details the theoretical underpinnings, experimental characterization, and mitigation of this drift within the context of advancing dual-gate OECT architectures for robust biosensing.
Theoretical Foundation: The Origin of Drift
The temporal current drift in OECTs is fundamentally explained by the uncontrolled diffusion and adsorption of ions from the electrolyte into the gate material. This process can be quantitatively modeled using first-order kinetics [1] [2].
First-Order Kinetic Model
The model describes the change in ion concentration within the bioreceptor layers of the gate. The key equation is:
Where:
- ca: Ion concentration in the bioreceptor (gate) material.
- c0: Ion concentration in the solution (assumed constant, e.g., in PBS or serum).
- k+: Rate constant for ions moving from solution to the gate material.
- k-: Rate constant for ions moving from the gate material back to the solution.
The equilibrium ion partition, K, between the solution and the gate material is governed by the electrochemical potential:
k+/k- = K = e(-∆G + ∆Ve0z) / kBT [1] [2]
This model shows excellent agreement with experimental drift data, fitting an exponentially decaying function that characterizes the observed current drift over time [1].
Signaling Pathway of Drift
The following diagram illustrates the sequential mechanism by which ion diffusion leads to measurable temporal current drift in a single-gate OECT.
Experimental Protocols for Drift Characterization
To systematically study and quantify temporal drift, the following experimental methodologies are employed. These protocols typically use a Phosphate-Buffered Saline (PBS) solution as a initial, simpler system before moving to complex biological fluids like human serum [1].
Protocol: Drift Measurement in Single-Gate OECT (S-OECT)
This protocol characterizes the inherent drift behavior in a standard OECT configuration [1] [2].
Workflow: The experimental workflow for measuring drift in a single-gate OECT is outlined below.
Detailed Procedure:
- Device Fabrication: Fabricate an OECT with a functionalized gate electrode. Common gate functionalization layers include the semiconducting polymer PT-COOH, the insulating polymer PSAA, or a Self-Assembly Layer (SAL) [1].
- Electrolyte Introduction: Immerse the gate and channel in a 1X PBS buffer solution (pH 7.4) or human serum. The use of IgG-depleted human serum is recommended for controlled experiments with human IgG as the analyte [1] [2].
- Biasing: Apply a constant gate voltage (VG) and a constant drain-to-source voltage (VDS). The specific values are device-dependent but should be within the aqueous operation window (typically < 0.9 V to avoid water electrolysis) [4].
- Data Acquisition: Measure the drain-source current (IDS) continuously over a prolonged period (e.g., 30-60 minutes). In control experiments, no target analyte should be present.
- Model Fitting: Fit the resulting IDS-vs-time data to the solution of the first-order kinetic model, which typically takes the form of an exponential decay, to extract the rate constants k+ and k- [1].
Key Quantitative Data from Drift Experiments
The table below summarizes typical experimental observations and model parameters for drift in single-gate OECTs with different bioreceptor layers [1].
Table 1: Experimental Drift Data and Model Fit Parameters for S-OECTs
| Bioreceptor Layer | Experimental Observation | Theoretical Fit | Key Model Parameters |
|---|---|---|---|
| PT-COOH (p-type polymer) | Pronounced temporal drift in IDS [1] | Very good agreement with exponential decay [1] | Layer-specific k+ and k- [1] |
| PSAA (insulating polymer) | Pronounced temporal drift in IDS [1] | Very good agreement with exponential decay [1] | Layer-specific k+ and k- [1] |
| Self-Assembly Layer (SAL) | Pronounced temporal drift in IDS [1] | Very good agreement with exponential decay [1] | Layer-specific k+ and k- [1] |
The Dual-Gate Solution: A Protocol for Drift Mitigation
The dual-gate OECT (D-OECT) architecture is a proven method to actively counteract temporal current drift. This configuration connects two OECT devices in series, canceling out the like-charged ion accumulation that causes drift [1] [2].
Protocol: Drift Mitigation using Dual-Gate OECT (D-OECT)
This protocol details the setup and operation of a D-OECT for drift-free measurements [1].
Workflow: The following diagram illustrates the specific configuration and signal pathway of the dual-gate OECT setup.
Detailed Procedure:
- Circuit Configuration:
- Construct a circuit with two OECTs connected in series.
- Apply the gate voltage (VG) to the bottom of the first OECT device.
- Apply the drain voltage (VDS) to the second OECT device.
- The functionalized gate, which is exposed to the electrolyte and contains the bioreceptor layer (e.g., PT-COOH with immobilized antibodies), remains part of the first OECT [1] [2].
- Measurement:
- Measure the transfer curves (IDS vs. VG) or the output current from the second OECT device.
- This configuration prevents the accumulation of like-charged ions in the functionalized gate during measurement, thereby mitigating the primary source of drift [1].
- Validation in Complex Media:
Performance Comparison: S-OECT vs. D-OECT
The table below contrasts the performance of single-gate and dual-gate architectures, highlighting the effectiveness of the dual-gate approach.
Table 2: Performance Comparison of Single-Gate vs. Dual-Gate OECTs
| Characteristic | Single-Gate OECT (S-OECT) | Dual-Gate OECT (D-OECT) |
|---|---|---|
| Architecture | One functionalized gate [1] | Two OECTs in series; gate voltage applied to the first, output measured from the second [1] |
| Temporal Current Drift | Appreciable drift in control experiments [1] [2] | Largely canceled or mitigated [1] [2] |
| Primary Drift Cause | Ion adsorption/diffusion into gate material [1] | Prevents like-charged ion accumulation [1] |
| Accuracy & Sensitivity | Compromised by drift [1] | Increased accuracy and sensitivity for immuno-biosensing [1] [3] |
| Performance in Human Serum | Challenging due to drift [1] | Effective; specific binding detected at low limits of detection [1] [2] |
The Scientist's Toolkit: Research Reagent Solutions
This section lists key materials and reagents essential for conducting the experiments described in these protocols.
Table 3: Essential Research Reagents for OECT Drift Studies
| Reagent / Material | Function and Application Notes |
|---|---|
| PEDOT:PSS | A widely used p-type conductive polymer for the OECT channel, known for its high transconductance [1] [4]. |
| PT-COOH | A regioregular polythiophene-based polymer used as a bioreceptor layer on the gate electrode for antibody immobilization [1] [2]. |
| Poly(styrene-co-acrylic acid) (PSAA) | An insulating polymer used as a bioreceptor layer to study drift phenomena [1]. |
| Phosphate-Buffered Saline (PBS) | A standard high-ionic-strength buffer solution for initial drift studies and device testing [1]. |
| Human Serum (IgG-depleted) | A complex biological fluid used for validation; IgG-depletion allows for controlled spiking of human IgG as a target analyte [1] [2]. |
| Bovine Serum Albumin (BSA) | A common blocking agent used to passivate non-specific binding sites on the gate electrode [1]. |
| Human Immunoglobulin G (IgG) | A model target biomolecule (antigen) for immuno-biosensing experiments [1]. |
Organic Electrochemical Transistors (OECTs) have emerged as a leading platform for biosensing due to their high amplification, biocompatibility, and flexibility [5] [4]. A significant challenge in their practical application, especially for sensitive measurements in biological fluids, is the temporal drift of the electrical signal—a gradual change in output current over time even in the absence of the target analyte [3] [1] [2]. This drift can obscure specific binding signals and reduce detection accuracy. Research has demonstrated that this phenomenon originates from the slow diffusion and adsorption of ions from the electrolyte (e.g., phosphate-buffered saline or human serum) into the functionalized gate material of the biosensor [1] [2]. Understanding and modeling this process is critical for developing effective drift mitigation strategies, such as the dual-gate OECT (D-OECT) architecture, which significantly improves signal stability and sensing fidelity in complex media like human serum [3] [1].
Theoretical Framework: The First-Order Kinetic Model
The drift phenomenon in single-gate OECTs (S-OECTs) can be quantitatively described by a first-order kinetic model that treats the adsorption and desorption of ions into the gate's bioreceptor layer [1] [2].
Model Fundamentals and Equations
The model focuses on the ion concentration within the gate material, ( c_a ). Its time evolution is governed by the following equation:
Here, ( c0 ) is the constant ion concentration in the bulk electrolyte, ( k+ ) is the rate constant for ion adsorption into the gate material, and ( k_- ) is the rate constant for ion desorption back into the solution [1] [2].
The ratio of these rate constants defines the equilibrium ion partition coefficient, ( K ), between the gate material and the solution, which is influenced by the electrochemical potential:
Where:
- ( ΔG ) is the difference in the Gibbs free energy of an ion between the bioreceptor layer and the solution.
- ( ΔV ) is the difference in electrostatic potential between the gate and the bulk solution.
- ( e_0 ) is the elementary charge.
- ( z ) is the valency of the ion.
- ( k_B ) is the Boltzmann constant.
- ( T ) is the absolute temperature [2].
The base rate constant ( k- ) (when ( ΔG = 0 ) and ( ΔV = 0 )) is related to the diffusion constant ( D ) of ions within the gate material and its thickness ( d ), estimated as ( k0 \sim D/d^2 ) [1] [2]. This model shows excellent agreement with experimental drift data, confirming that ion diffusion is a primary driver of the signal drift in S-OECTs [1].
Visualizing the Drift Mechanism and its Solution
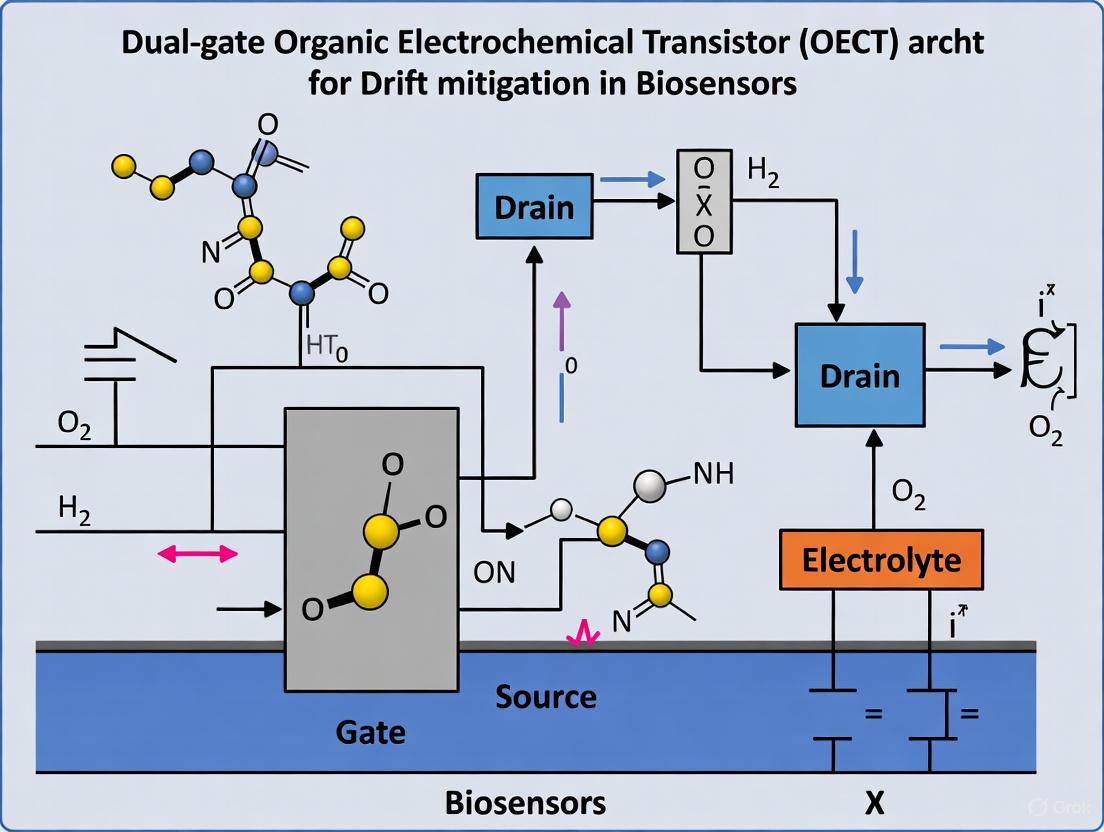
The following diagram illustrates the ion drift mechanism in a single-gate OECT and the principle of its cancellation in a dual-gate architecture.
Diagram 1: Ion Drift Mechanism and Cancellation in OECTs. The S-OECT (top) experiences uncompensated ion accumulation in the gate layer, leading to a drifting output signal. The D-OECT (bottom) uses two symmetrically functionalized gates where the drift signals ((+δ) and (-δ)) are of opposite polarity and cancel each other out, resulting in a stable system output [3] [1].
Experimental Protocols for Model Validation and Drift Characterization
This section provides a detailed methodology for experimentally investigating the drift phenomenon and validating the first-order kinetic model, focusing on the comparison between S-OECT and D-OECT configurations.
Protocol 1: Fabrication of Functionalized Gate Electrodes
Objective: To prepare ITO/PET gate electrodes functionalized with different carboxylic acid-based bioreceptor layers for IgG antibody immobilization [5] [1].
Materials: See Table 1 in the "Research Reagent Solutions" section. Procedure:
- Substrate Preparation: Cut ITO-coated PET sheets into desired dimensions. Clean substrates by submerging in isopropanol for 15 minutes, dry under a stream of nitrogen, and treat with UV-ozone for 30 minutes [5].
- Functional Layer Deposition:
- For PT-COOH and PSAA (Polymer Films): Prepare a 5 mg/mL solution of the polymer in a mixture of DMF and ethanol (1:1 volume ratio). Spin-coat the solution onto the cleaned ITO/PET substrate at 2000 rpm for 60 seconds. Anneal the film on a hotplate at 60°C for 10 minutes to remove residual solvent [5] [1].
- For Self-Assembled Layer (SAL) with DDA: Immerse the UV-ozone-treated ITO/PET substrate into a 1 mM ethanolic solution of 1,10-decanedicarboxylic acid (DDA) for 24 hours at room temperature. Subsequently, rinse the substrate thoroughly with pure ethanol to remove any physisorbed molecules and dry under a nitrogen stream [5] [2].
- Antibody Immobilization: Activate the carboxylic acid groups on the functionalized gate surface using a standard EDC/NHS coupling chemistry protocol. Incubate the activated surface with a solution of human IgG antibody (e.g., 50 µg/mL in PBS) for 1 hour. Rinse with PBS to remove unbound antibodies [1].
- Blocking: To minimize non-specific binding, incubate the functionalized gate with a Bovine Serum Albumin (BSA) solution (e.g., 1% w/v in PBS) for 30 minutes, followed by a PBS rinse [1].
Protocol 2: OECT Drift Measurement and Model Fitting
Objective: To characterize the temporal drift of the drain-source current in both S-OECT and D-OECT configurations and fit the experimental data to the first-order kinetic model [1].
Materials:
- OECT channel material (e.g., P3HT in chlorobenzene) [5] [1].
- Fabricated functionalized gate electrodes from Protocol 1.
- Phosphate-Buffered Saline (PBS), pH 7.4.
- Human IgG-depleted human serum.
- Source Measure Unit (SMU) or potentiostat.
Procedure:
- OECT Setup: Fabricate or use a standard OECT with a P3HT channel. Integrate the functionalized gate electrode into the measurement setup via the electrolyte (PBS or serum) [5] [1].
- Control Experiment (Drift Measurement): In the absence of the target antigen (human IgG), apply a constant gate voltage ((VG)) and drain-source voltage ((V{DS})). For P3HT-based OECTs, typical operating conditions are (VG = +0.5 V) and (V{DS} = -0.5 V) [1]. Monitor the drain-source current ((I_{DS})) over time (e.g., 300-600 seconds) until a steady state is approached.
- D-OECT Configuration: For dual-gate measurement, connect two OECTs in series. Apply (VG) from the bottom of the first device and (V{DS}) to the second device. Measure the transfer characteristics from the second device [1].
- Data Fitting: Fit the obtained (I{DS}) vs. time data from the S-OECT control experiment to an exponential decay function derived from the first-order kinetic model solution. The fitting procedure will yield estimates for the rate constants (k+) and (k_-) [1] [2].
Quantitative Data and Performance Comparison
The experimental application of the first-order kinetic model and the D-OECT architecture yields critical quantitative insights into their performance for drift mitigation.
Table 1: Key Parameters from First-Order Kinetic Model Fitting for Different Gate Materials in PBS
| Bioreceptor Layer | Material Type | Estimated k₊ (s⁻¹) | Estimated k₋ (s⁻¹) | Equilibrium Partition Coefficient, K |
|---|---|---|---|---|
| PT-COOH | p-type semiconductor | To be fitted from data [1] | To be fitted from data [1] | To be fitted from data [1] |
| PSAA | Insulating polymer | To be fitted from data [1] | To be fitted from data [1] | To be fitted from data [1] |
| SAL (DDA) | Self-assembled monolayer | To be fitted from data [1] | To be fitted from data [1] | To be fitted from data [1] |
Table 2: Comparison of S-OECT and D-OECT Biosensor Performance in Human Serum
| Performance Metric | Single-Gate (S-OECT) | Dual-Gate (D-OECT) |
|---|---|---|
| Current Drift Magnitude | High (Appreciable temporal drift) [1] | Largely mitigated (Drift cancellation) [3] [1] |
| Signal Stability | Low | High [1] |
| Limit of Detection (LOD) | Compromised by drift | Relatively low, even in complex human serum [1] |
| Sensitivity to Specific Binding | Obscured by non-specific ion drift | Accurate and detectable [1] |
The Scientist's Toolkit: Essential Research Reagents and Materials
Table 3: Key Research Reagent Solutions for OECT Drift Studies
| Reagent/Material | Function/Description | Example & Notes |
|---|---|---|
| ITO-coated PET Substrate | Flexible, conductive substrate for gate electrode fabrication. | Sigma-Aldrich, catalog number 749729. Provides a non-metal, UV-ozone modifiable surface [5]. |
| P3HT (Poly(3-hexylthiophene-2,5-diyl)) | p-type organic semiconductor for the OECT channel. | SOL4106 from Solaris Chem. Dissolved in chlorobenzene (e.g., 10 mg/mL) for spin-coating [5] [1]. |
| PT-COOH | p-type semiconducting polymer for gate functionalization. | Enables ion penetration, altering bulk electrical properties upon binding [5] [1]. |
| PSAA | Insulating polymer for gate functionalization. | Creates an interfacial voltage change without significant bulk ion penetration [5]. |
| 1,10-Decanedicarboxylic Acid | Molecule for forming a self-assembled monolayer (SAL) on ITO. | Creates an ultra-thin, oriented bioreceptor layer on the gate [5]. |
| Human IgG & Antibody | Model antigen-antibody pair for biosensing validation. | Carries negative charge in physiological solvent, enabling electrical detection of binding [5] [1]. |
| EDC / NHS | Crosslinking catalysts for covalent antibody immobilization. | Standard carbodiimide chemistry for activating carboxylic acid groups on the gate [1]. |
Workflow for Drift Analysis and Mitigation
The following diagram summarizes the comprehensive experimental and analytical workflow, from device preparation to data interpretation, as discussed in the protocols.
Diagram 2: Workflow for OECT Drift Analysis. This chart outlines the key steps for fabricating functionalized OECTs, conducting drift measurements in single and dual-gate modes, and analyzing the data using the first-order kinetic model to validate its effectiveness and the drift cancellation strategy [5] [1] [2].
Organic Electrochemical Transistors (OECTs) have emerged as a reliable platform for biomolecule detection due to their low operating voltage, high transconductance, and promising biosensing behavior [1] [5]. A significant challenge in OECT-based biosensing is the temporal current drift observed in electrical signals even in the absence of target analytes [1]. This drift phenomenon compromises measurement accuracy and can lead to false positives in sensitive detection applications. Understanding the factors governing drift is therefore crucial for advancing OECT technology, particularly for applications in drug development and clinical diagnostics where precision is paramount.
The dual-gate OECT architecture (D-OECT) has shown remarkable effectiveness in mitigating this drift phenomenon [1]. This configuration utilizes two OECT devices connected in series with functionalized gate electrodes, where voltage drifts in the two devices exhibit opposite polarity relative to the direction from the gate voltage probe, thereby significantly canceling out the overall drift [1] [5]. This review systematically examines the key factors influencing drift—ion penetration dynamics, gate material properties, and bioreceptor layer characteristics—within the context of implementing effective drift mitigation strategies for robust biosensing applications.
Theoretical Foundation of Drift in OECTs
The drift phenomenon in OECTs can be theoretically explained by the diffusion of ions into the gate material. Research has demonstrated that this behavior follows a first-order kinetic model of ion adsorption, which shows excellent agreement with experimental data [1]. The model considers the dominant ions in the electrolyte (e.g., Na⁺ and Cl⁻ in phosphate-buffered saline) and their absorption into bioreceptor layers.
The rate of ion concentration change in the bioreceptor layers is governed by the equation:
∂cₐ/∂t = c₀k₊ - cₐk₋
Where cₐ represents the ion concentration in the bioreceptor layers, c₀ is the ion concentration in the solution, k₊ is the rate at which ions move from solution to bioreceptor layers, and k₋ is the rate of reverse movement [1]. The ratio of these rate constants determines the equilibrium ion partition (K) between the solution and gate material, given by the electrochemical potential:
k₊/k₋ = K = e^(−ΔG + ΔVe₀z)/(kBT)
Where ΔG is the difference in Gibbs free energy, ΔV is the difference in electrostatic potential, e₀ is unit charge, z is ion valency, k𝐵 is Boltzmann's constant, and T is absolute temperature [1]. The base rate k₀ = k₋(ΔG = 0, ΔV = 0) is determined by the diffusion constant D of ions in the bioreceptor layer and the width of the layer d within which ions can be incorporated into the material (k₀ ~ D/d²) [1]. This theoretical framework provides the foundation for understanding how material properties and operational parameters influence drift behavior.
Key Factors Influencing Drift Behavior
Ion Penetration and Accumulation Dynamics
The directionality and pathways of ion injection significantly impact transient behaviors and drift characteristics in OECTs. Research has revealed that molecular orientation of organic mixed ionic–electronic conductors (OMIECs) affects the length of ion-drift pathways, which directly correlates with ion mobility and transient responses [6]. Studies comparing polymers with different backbone planarities (DTP-P with edge-on orientation versus DTP-2T with face-on orientation) have demonstrated that these orientational differences result in peculiar OECT transient responses due to varied ion transport efficiencies [6].
The swelling behavior of channel materials upon hydration also critically influences drift stability. Excessive water uptake can disrupt electronic charge transport, slowing OECT response and causing poor reversibility [4]. The ionic circuit characteristics, comprising electrolyte resistance (Rₑ) and channel capacitance (Cₕ), fundamentally govern ion migration dynamics that contribute to drift [7]. In fiber-based OECTs (F-OECTs), the three-dimensional architecture creates distinct ion diffusion pathways compared to conventional planar OECTs, which can be optimized to minimize drift [7].
Table 1: Ion Penetration Parameters Affecting Drift Behavior
| Parameter | Impact on Drift | Experimental Measurement Methods |
|---|---|---|
| Ion Mobility | Determines speed of ion penetration and accumulation; lower mobility can increase drift duration | Moving front measurements, transient frequency-dependent measurements [6] |
| Molecular Orientation | Affects ion-drift pathway length; face-on vs edge-on orientations show different transient behaviors | GIWAXD (Grazing Incidence Wide-Angle X-ray Diffraction) [6] |
| Water Uptake | Excessive swelling disrupts electronic transport, increasing drift and reducing reversibility | Gravimetric analysis, electrochemical monitoring [4] |
| Volumetric Capacitance | Higher capacitance generally increases drift magnitude due to greater ion storage | Electrochemical impedance spectroscopy (EIS) [6] [4] |
Gate Material Composition and Properties
Gate material selection profoundly influences drift behavior through multiple mechanisms. The thickness of the gate material directly impacts ion penetration dynamics, with thinner films generally exhibiting reduced drift duration [1]. The chemical composition of the gate material determines its inherent ion affinity and partition coefficients, which govern the equilibrium state of ion absorption described in the first-order kinetic model [1].
Recent advances in contact resistance engineering have demonstrated that introducing interfacial layers can significantly modulate drift behavior. For example, incorporating a CuₓO thin-film interlayer between Au electrodes and the semiconductor has shown up to a 5-fold reduction in contact resistance, which correlates with improved stability and reduced drift [8]. The energy-level alignment between gate materials and semiconductors further influences charge injection efficiency and drift magnitude [8].
The gate functionalization approach also critically affects drift. Functionalized gates serving as recognition sites for bio-analytes can experience capacitance variations due to selective binding, altering the effective gate potential and contributing to drift signals [9]. Non-polarizable gate electrodes (e.g., Ag/AgCl) typically demonstrate different drift characteristics compared to polarizable gates (e.g., Pt, Au), with the former generally offering more stable operational windows [9] [4].
Bioreceptor Layer Characteristics
The composition and properties of bioreceptor layers immobilized on gate electrodes significantly influence drift behavior through multiple mechanisms:
- Electrical properties: Semiconducting bioreceptor layers (e.g., PT-COOH) allow ion and charge penetration into the bulk polymer, resulting in distinct drift profiles compared to insulating layers (e.g., PSAA) where changes are primarily interfacial [5].
- Thickness and morphology: Thinner bioreceptor layers such as self-assembled layers (SAL) generally exhibit reduced drift duration due to shorter ion diffusion pathways [1] [5].
- Chemical functionality: Carboxylic acid-functionalized layers demonstrate specific interactions with ions in solution, affecting both Gibbs free energy differences (ΔG) and ion partition coefficients [5].
Table 2: Impact of Bioreceptor Layer Properties on Drift Parameters
| Bioreceptor Layer | Type | Thickness | Key Drift Characteristics |
|---|---|---|---|
| PT-COOH | Semiconducting polymer | ~100-200 nm | Bulk ion penetration; significant but predictable drift following first-order kinetics [1] [5] |
| PSAA | Insulating polymer | ~100-200 nm | Primarily interfacial voltage changes; different drift profile compared to semiconductors [5] |
| Self-Assembled Layer (SAL) | Molecular layer | ~1-3 nm | Reduced drift duration due to minimal ion incorporation; more stable signaling [1] [5] |
Quantitative Analysis of Drift Parameters
Systematic studies have enabled quantification of drift parameters across different material systems and operational conditions. The drift magnitude typically follows exponential decay patterns well-described by the first-order kinetic model, with time constants varying from seconds to hours depending on material properties and electrolyte composition [1].
The gate material thickness directly influences the base rate constant (k₀) in the kinetic model, with thinner films exhibiting higher k₀ values and consequently faster stabilization [1]. Experimental results demonstrate that drift can be largely mitigated using dual-gate OECT architectures, with reported improvements in accuracy and sensitivity compared to standard single-gate designs [1].
The electrolyte composition significantly impacts drift behavior, with complex biological fluids like human serum presenting more challenging drift profiles compared to simple buffer solutions like PBS [1]. This highlights the importance of testing drift characteristics in biologically relevant media for drug development applications.
Experimental Protocols for Drift Characterization
Protocol for Measuring Ion Penetration-Induced Drift
Purpose: To quantitatively characterize drift behavior induced by ion penetration into gate materials and bioreceptor layers.
Materials:
- OECT devices with functionalized gates
- Phosphate-buffered saline (PBS) solution (1X)
- Human serum (IgG-depleted for controlled studies)
- Semiconductor parameter analyzer
- Constant temperature chamber (25°C recommended)
Procedure:
- Prepare OECT devices with the bioreceptor layer of interest (PT-COOH, PSAA, or SAL) following standardized fabrication protocols [5].
- Immerse the device in the selected electrolyte (PBS or human serum) and allow thermal equilibrium to establish (10-15 minutes).
- Apply fixed gate voltage (V~G~) and drain voltage (V~DS~) relevant to the operational regime (typically V~G~ = 0.5 V, V~DS~ = -0.5 V for p-type OECTs).
- Record drain current (I~DS~) continuously for a minimum of 1 hour to capture temporal drift behavior.
- Repeat measurements for at least n=3 devices to establish statistical significance.
- Fit experimental data to the first-order kinetic model using nonlinear regression analysis to extract k₊ and k₋ parameters [1].
Data Analysis:
- Normalize current values to initial current (I~DS~(t)/I~DS~(0)) to compare drift patterns across devices.
- Calculate drift magnitude as percentage change from initial to steady-state current.
- Extract time constants from exponential fits to characterize drift duration.
Protocol for Evaluating Dual-Gate Drift Mitigation
Purpose: To quantitatively assess the effectiveness of dual-gate architecture in mitigating temporal current drift.
Materials:
- Single-gate (S-OECT) and dual-gate (D-OECT) devices with identical channel and bioreceptor materials
- Target analyte solutions at relevant concentrations (e.g., human IgG in PBS)
- Semiconductor parameter analyzer with multiple source measurement units
Procedure:
- Fabricate S-OECT and D-OECT devices following established methodologies [1] [5].
- For D-OECT configuration, connect two OECT devices in series with functionalized gate electrodes.
- Apply gate voltage (V~G~) from the bottom of the first device and drain voltage (V~DS~) to the second device [1].
- Measure transfer curves from the second device while applying identical analyte solutions to both configurations.
- Record temporal current changes in both configurations over minimum 60-minute duration.
- Introduce specific analyte (e.g., human IgG) at controlled concentrations to assess drift during actual sensing operations.
Data Analysis:
- Quantify drift magnitude as percentage current change in both configurations.
- Calculate drift reduction factor: (Drift~S-OECT~ - Drift~D-OECT~)/Drift~S-OECT~.
- Compare signal-to-drift ratios at relevant analyte concentrations.
Diagram 1: Key Factors Influencing Drift in OECT Biosensors
Research Reagent Solutions for Drift Studies
Table 3: Essential Research Reagents for OECT Drift Characterization
| Reagent/Material | Function | Example Applications |
|---|---|---|
| PT-COOH (poly [3-(3-carboxypropyl)thiophene-2,5-diyl] regioregular) | Semiconducting bioreceptor layer | Studying bulk ion penetration effects on drift; human IgG detection [1] [5] |
| PSAA (poly(styrene–co–acrylic acid)) | Insulating bioreceptor layer | Comparing interfacial vs bulk ion effects on drift [5] |
| DDA (1,10-decanedicarboxylic acid) | Self-assembled monolayer bioreceptor | Investigating ultra-thin layer effects on drift reduction [5] |
| PEDOT:PSS (poly(3,4-ethylenedioxythiophene):poly(styrenesulfonate)) | High-performance channel material | OECT channel with high transconductance [7] [4] |
| P3HT (poly(3-hexylthiophene-2,5-diyl)) | Semiconductor channel material | Standard OECT channel material for biosensing [5] |
| CuₓO interlayer | Contact resistance modulation | 5-fold contact resistance reduction; drift mitigation [8] |
The systematic investigation of key factors influencing drift in OECTs—ion penetration dynamics, gate material properties, and bioreceptor layer characteristics—provides essential insights for developing robust biosensing platforms. The implementation of dual-gate architectures represents a particularly promising approach for drift mitigation, demonstrating significant improvement in signal stability without compromising sensitivity. The first-order kinetic model of ion adsorption offers a robust theoretical framework for understanding and predicting drift behavior across different material systems.
For researchers and drug development professionals, the experimental protocols and characterization methods outlined herein provide a standardized approach for evaluating drift performance in novel OECT designs. The continued refinement of gate materials, bioreceptor layers, and device architectures will further enhance the reliability of OECT-based biosensors, ultimately expanding their applications in clinical diagnostics and therapeutic monitoring.
Organic Electrochemical Transistors (OECTs) have emerged as a prominent platform for biosensing due to their remarkable signal amplification, ability to operate in aqueous environments, and seamless interface with biological systems [2] [10]. However, the drift phenomenon—a temporal shift in the electrical signal in the absence of a target analyte—poses a significant challenge to the reliability and accuracy of OECT-based biosensors [2] [1]. This drift can obscure specific binding signals, leading to reduced sensitivity, an artificially elevated limit of detection (LOD), and potentially false interpretations in critical applications such as medical diagnostics and drug development [2] [5]. This Application Note examines the consequences of signal drift, quantitatively analyzes its impact on key sensor parameters, and presents the dual-gate OECT (D-OECT) architecture as a robust solution, complete with validated experimental protocols for implementing this drift-mitigation strategy.
Theoretical Background: The Origin and Modeling of Drift
The drift phenomenon in OECTs is fundamentally linked to the uncontrolled diffusion and adsorption of ions from the electrolyte into the gate material. In a typical single-gate OECT (S-OECT) configuration, the gate electrode is functionalized with a bioreceptor layer and is in contact with the electrolyte. When a gate voltage is applied, it not only modulates the channel current via the intended faradaic or capacitive processes but also drives a slow, continuous migration of ions (e.g., Na⁺ and Cl⁻ in PBS) into the bulk of the gate's functionalization layer [2] [1].
This process can be effectively described by a first-order kinetic model [2] [1]. The rate of change of ion concentration ((ca)) within the gate material is given by: [ \frac{\partial ca}{\partial t} = c0 k+ - ca k- ] where (c0) is the ion concentration in the solution, and (k+) and (k-) are the rate constants for ion adsorption into and out of the gate material, respectively [2] [1]. The solution to this model typically results in an exponentially decaying or increasing current signal over time, which is observed experimentally as drift. The equilibrium ion partition coefficient, (K = k+/k_-), is influenced by the electrochemical potential difference between the gate and the solution, explaining why drift is sensitive to the applied gate voltage and the specific gate material [2] [1].
Table 1: Key Parameters in the First-Order Kinetic Drift Model
| Parameter | Symbol | Description | Influence on Drift |
|---|---|---|---|
| Solution Ion Concentration | (c_0) | Concentration of ions in the bulk electrolyte | Higher concentration can increase the driving force for ion uptake. |
| Adsorption Rate Constant | (k_+) | Rate at which ions enter the gate material | A higher value accelerates the drift phenomenon. |
| Desorption Rate Constant | (k_-) | Rate at which ions leave the gate material | A higher value promotes stability and reduces drift. |
| Ion Partition Coefficient | (K) | Equilibrium constant for ion partitioning | Determines the steady-state level of drift. |
Impact of Drift on Biosensor Performance
Signal Accuracy and Stability
Drift manifests as a gradual change in the output signal (e.g., drain current) when the sensor is meant to be at a stable baseline. This compromises signal accuracy by adding a non-specific, time-dependent component to the measurement. In quantitative analyses, where the absolute value or rate of change of the signal is critical, drift can lead to significant errors in determining analyte concentration [2] [5]. For long-term or continuous monitoring applications, such as real-time biomarker tracking, this instability can render the data unreliable.
Limit of Detection (LOD)
The LOD is the lowest analyte concentration that can be reliably distinguished from the background noise. Drift directly elevates the LOD by increasing the noise floor and obscuring the specific signal from low-concentration analytes. As the baseline current drifts, the small current change resulting from the binding of a few target molecules may become indistinguishable from the non-specific drift, preventing their detection [2]. This is particularly detrimental for applications aiming for ultra-sensitive detection, such as early-stage disease diagnosis where biomarker levels are exceptionally low.
Table 2: Comparative Performance of Single-Gate vs. Dual-Gate OECTs for Human IgG Detection
| Performance Metric | Single-Gate (S-OECT) | Dual-Gate (D-OECT) | Implications |
|---|---|---|---|
| Signal Drift | Significant temporal drift observed in PBS and human serum [2] [1]. | Drift is largely canceled or significantly mitigated [2] [1] [5]. | Enhanced signal stability and reliability for D-OECT. |
| Sensitivity | Reduced due to drift obscuring specific binding signals [5]. | Higher sensitivity compared to S-OECT [5]. | D-OECT can detect smaller concentration changes. |
| Applicability in Complex Media | Performance degraded in human serum due to fouling and drift [2]. | Effective detection demonstrated in human IgG-depleted serum [2]. | D-OECT is more robust for real-world sample analysis. |
| Key Enabling Feature | N/A | Series connection of two OECTs with functionalized gates [2] [5]. | The architecture inherently compensates for like-charged ion accumulation. |
Protocol: Implementing a Dual-Gate OECT for Drift Mitigation
This protocol outlines the procedure for fabricating and operating a dual-gate OECT to minimize signal drift in biosensing applications, based on methodologies validated in recent literature [2] [5].
Materials and Reagents
Table 3: Research Reagent Solutions and Essential Materials
| Item Name | Function/Description | Application in Protocol |
|---|---|---|
| Indium Tin Oxide (ITO) / PET Substrate | Conductive, flexible substrate for gate electrode fabrication. | Serves as the base for the functionalized gate electrodes. |
| Poly [3-(3-carboxypropyl)thiophene-2,5-diyl] (PT-COOH) | A p-type semiconducting polymer bioreceptor layer. | Immobilized on the gate electrode; provides carboxylic acid groups for antibody coupling. |
| Poly(3-hexylthiophene-2,5-diyl) (P3HT) | Organic semiconductor for the OECT channel. | Forms the channel material of the OECT devices. |
| Human Immunoglobulin G (IgG) Antibody | Biorecognition element. | Immobilized on the PT-COOH layer to specifically capture the target antigen. |
| Phosphate Buffered Saline (PBS), 1X | Standard buffer solution. | Used for baseline measurements and dilution of analytes. |
| Human Serum (IgG-depleted) | Complex biological test medium. | Used to validate sensor performance in a realistic, challenging environment. |
| (1-ethyl-3-(3-dimethylaminopropyl) carbodiimide) (EDC) / N-Hydroxysuccinimide (NHS) | Crosslinking chemistry reagents. | Activates carboxyl groups on PT-COOH for covalent antibody immobilization. |
Experimental Workflow
The following diagram illustrates the core architecture and operational principle of the drift-mitigating dual-gate OECT.
Step-by-Step Procedure
Part A: Gate Electrode Functionalization
- Substrate Preparation: Clean ITO/PET substrates by submerging in isopropanol for 15 minutes. Dry under a stream of nitrogen gas and treat with UV-ozone for 30 minutes to enhance surface hydrophilicity.
- Bioreceptor Layer Deposition: Prepare a solution of PT-COOH (or alternative polymer like PSAA) in a suitable solvent (e.g., DMF). Spin-coat the polymer solution onto the cleaned ITO surface to form a thin, uniform film.
- Antibody Immobilization: Activate the carboxylic acid groups on the PT-COOH film by incubating with a fresh mixture of EDC and NHS in buffer. Rinse the electrodes and subsequently incubate them with a solution of the capture antibody (e.g., human IgG antibody). Finally, incubate with a blocking agent (e.g., BSA) to passivate any non-specific binding sites.
Part B: OECT Fabrication and D-OECT Assembly
- Channel Formation: Fabricate standard OECTs with a P3HT channel on a separate substrate. The channel can be formed by spin-coating a filtered P3HT solution in chlorobenzene onto pre-patterned source-drain electrodes.
- Electrical Integration: Connect two of these OECTs in series to create the D-OECT configuration. The drain voltage ((V{DS})) is applied to the second OECT, and the output current is measured from the first OECT. The two functionalized gate electrodes (from Part A) are immersed in a common electrolyte and connected to the circuit: the first gate receives the gate voltage ((VG)), and the second gate is grounded [2] [5].
Part C: Measurement and Data Acquisition
- Baseline Acquisition: Place the integrated D-OECT into the measurement electrolyte (e.g., 1X PBS or human serum). Apply the desired (VG) and (V{DS}) and record the output current until a stable baseline is established.
- Analyte Detection: Introduce the target analyte (e.g., human IgG) at known concentrations into the electrolyte chamber. Monitor the real-time change in the output current.
- Data Analysis: The specific binding event will cause a steppy change in the output current. Due to the differential design, the non-specific drift common to both functionalized gates is automatically subtracted, resulting in a stable and accurate sensing signal.
Discussion
The D-OECT architecture represents a significant hardware-based advancement in combating signal drift. Its efficacy stems from its differential sensing mechanism. In this setup, both gate electrodes are identical and exposed to the same ionic environment, thus experiencing nearly identical non-specific ion diffusion and drift. The series connection of the two OECTs ensures that the voltage drifts arising from each gate are of opposite polarity relative to the measurement pathway. Consequently, the common-mode drift signal is subtracted, while the specific binding signal—which occurs only on the primary sensing gate—is amplified and preserved [2] [5].
This approach has been proven effective not only in controlled buffers like PBS but also in complex biological fluids such as human serum, where it enables specific detection at low limits of detection [2]. This makes the D-OECT a highly promising platform for point-of-care diagnostics and continuous monitoring in drug development, where accuracy and reliability over time are paramount.
Implementing Dual-Gate OECTs: Architectural Design and Biosensing Applications
Organic Electrochemical Transistors (OECTs) are a prominent platform for biosensing due to their high amplification capability and compatibility with biological environments. A significant challenge in their application, particularly for single-gate OECT (S-OECT) configurations, is the temporal drift of the electrical signal, which can obscure specific binding events and reduce measurement accuracy. This drift is primarily caused by the uncontrolled diffusion and accumulation of ions from the electrolyte (e.g., PBS buffer or human serum) into the bulk of the gate material. The dual-gate OECT (D-OECT) architecture effectively counters this phenomenon by employing a differential measurement principle that cancels out the common-mode drift signal, thereby enhancing signal stability and sensitivity for applications in immuno-biosensing and real-time monitoring, even in complex media like human serum.
Theoretical Foundation of Drift and Its Mitigation
Origin of Drift in Single-Gate OECTs
In a typical gate-functionalized OECT, the drift phenomenon manifests as an unwanted, gradual change in the output current (e.g., drain current, IDS) over time, even in the absence of a target analyte [2]. Theoretical and experimental analyses attribute this primarily to the slow, spontaneous diffusion of ions from the electrolyte into the gate's functionalization layer. This process can be modeled using first-order kinetics [2].
The rate of change of ion concentration within the gate material (ca) is given by: ∂ca/∂t = c0k+ - cak- where c0 is the constant ion concentration in the solution, and k+ and k- are the rate constants for ion adsorption into and out of the gate material, respectively [2]. The equilibrium of this process is governed by the electrochemical potential, leading to an exponential temporal drift in the electrical signal. This model shows excellent agreement with experimental drift data for S-OECTs functionalized with various bioreceptor layers, including the semiconducting polymer PT-COOH, the insulating polymer PSAA, and self-assembled layers (SAL) [2].
The Dual-Gate Operating Principle
The D-OECT architecture mitigates drift through a series configuration of two OECT devices with identically functionalized gate electrodes [2] [5]. The core principle is that the non-specific ion diffusion causing drift is a common-mode signal affecting both gates similarly. In contrast, the specific binding of a target analyte, which is localized, affects primarily the functionalized gate.
As illustrated in the diagram below, the gate voltage (VG) is applied to the bottom of the first device, and the drain voltage (VDS) is applied to the second device. The transfer curves are measured from the second device. This design prevents the accumulation of like-charged ions during measurement [2]. The differential signal between the two gates cancels the shared drift component while preserving the specific binding signal.
Experimental Protocols for Drift Characterization
This section provides a detailed methodology for quantifying drift and validating the performance of the D-OECT architecture, based on published research [2] [5].
Fabrication of Dual-Gate OECTs
- Channel Preparation: The channel region of the OECT is defined and covered with an organic semiconductor. A common material is poly(3-hexylthiophene-2,5-diyl) (P3HT). The substrate is cleaned via submersion in isopropanol for 15 minutes, dried with nitrogen, and treated with UV-ozone for 30 minutes. A solution of P3HT (e.g., 10 mg/mL in chlorobenzene) is filtered (0.45 μm PTFE filter) and spin-coated onto the channel region to form the film [5].
- Gate Functionalization: The gate electrodes are functionalized with a bioreceptor layer. For immuno-sensing, a common approach is to use polymers with carboxylic acid groups (-COOH) for antibody immobilization. Examples include:
- PT-COOH: A semiconducting polymer (poly [3-(3-carboxypropyl)thiophene-2,5-diyl] regioregular).
- PSAA: An insulating polymer (poly(styrene–co–acrylic acid), random).
- Self-Assembled Layer (SAL): Formed from molecules like 1,10-decanedicarboxylic acid (DDA) on ITO/PET substrates [5]. The functionalized gates are then incubated with a solution of the capture antibody (e.g., human IgG antibody) to complete the bio-functionalization.
Protocol for Drift Measurement in Buffer and Serum
Objective: To quantitatively compare the temporal drift of S-OECT and D-OECT configurations in a controlled buffer and a complex biological fluid (human serum) [2].
Materials:
- Phosphate-Buffered Saline (PBS), 1X
- Human IgG-depleted human serum (to control the concentration of the target analyte)
- Target analyte: Human Immunoglobulin G (IgG)
- Functionalized S-OECT and D-OECT devices
Procedure:
- Baseline Measurement: Immerse the functionalized OECT (S- or D-configuration) in the measurement solution (1X PBS or human serum). Apply a constant gate voltage (VG) and drain voltage (VDS). Monitor and record the drain current (IDS) over a defined period (e.g., 15-30 minutes) without introducing the analyte. This establishes the baseline drift profile.
- Control Experiment: To study non-specific drift, a control experiment can be performed where the gate is functionalized only with a blocking layer (e.g., Bovine Serum Albumin - BSA) without specific antibodies, and human IgG is added to the solution [2].
- Sensing Experiment: Introduce the target analyte (human IgG) at specific concentrations into the solution. For each concentration, monitor the temporal response of IDS.
- Data Analysis: Fit the recorded IDS drift data from the control experiment to the first-order kinetic model to extract rate constants. For the sensing experiment, the stable signal from the D-OECT can be used to calculate the limit of detection (LOD).
The Scientist's Toolkit: Research Reagent Solutions
Table 1: Key materials and reagents for constructing and testing drift-mitigating OECT biosensors.
| Item | Function/Description | Key Characteristic |
|---|---|---|
| P3HT | Organic semiconductor for the OECT channel. | p-type material; provides the transconductance for signal amplification [5]. |
| PT-COOH | Semiconducting polymer for gate functionalization. | Contains -COOH groups for biomolecule immobilization; allows ion penetration into the bulk, altering electrical properties [5]. |
| PSAA | Insulating polymer for gate functionalization. | Contains -COOH groups; biomolecule interaction primarily creates an interfacial voltage change [5]. |
| DDA (1,10-decanedicarboxylic acid) | Forms a self-assembled monolayer (SAL) on gate electrodes. | Creates an ultra-thin, oriented layer of -COOH groups, maximizing surface voltage changes per binding event [5]. |
| Human IgG & Antibody | Model antigen-antibody pair for immuno-sensing. | Human IgG is abundant in serum and carries a charge, enabling electrical detection upon binding [2] [5]. |
| IgG-Depleted Human Serum | Complex biological matrix for testing. | Allows for controlled spiking of human IgG, enabling accurate assessment of sensor performance in a realistic environment [2]. |
Performance Data and Comparative Analysis
Experimental data validates the superior performance of the D-OECT architecture in mitigating drift and improving biosensing capabilities.
Table 2: Comparative analysis of Single-Gate (S-OECT) and Dual-Gate (D-OECT) architectures.
| Parameter | Single-Gate OECT (S-OECT) | Dual-Gate OECT (D-OECT) |
|---|---|---|
| Drift Phenomenon | Exhibits significant temporal current drift due to ion adsorption into the gate material [2]. | Drift is largely canceled by the differential measurement principle [2]. |
| Drift Explanation | Modeled by first-order ion kinetics: ∂ca/∂t = c0k+ - cak- [2]. | The common-mode drift signal is rejected, leaving a stable baseline [2]. |
| Signal Stability | Low; drift can obscure specific binding signals, especially at low analyte concentrations or in serum [2]. | High; provides a stable output, crucial for accurate and reliable measurements over time [2] [5]. |
| Sensitivity | Can be high, but compromised by drift, leading to a higher practical limit of detection [5]. | Increased accuracy and sensitivity; enables specific binding detection at low limits of detection in human serum [2]. |
| Key Advantage | Simpler device structure and fabrication. | Superior stability and reliability for applications in complex, real-world samples. |
The experimental workflow for characterizing these devices involves preparing the functionalized gates, measuring the temporal current in both control and analyte-spiked solutions, and analyzing the data to fit the drift model and extract sensing parameters.
Organic Electrochemical Transistors (OECTs) represent a cornerstone technology in modern bioelectronics, enabling a seamless interface between biological systems and electronic circuits. Their unique operational mechanism, which relies on the mixed conduction of ions and electrons, allows them to transduce and amplify biological signals with exceptional efficiency [4]. This application note details a comprehensive fabrication workflow for dual-gate OECT architectures, a specialized configuration that effectively mitigates current drift—a significant challenge in biosensing applications [1]. The content is structured to provide researchers, scientists, and drug development professionals with a detailed protocol, from material selection to final device assembly, contextualized within a research framework focused on enhancing biosensor stability.
Material Selection and Formulation
The performance of an OECT is profoundly influenced by the properties of its constituent materials. A judicious selection is paramount for achieving optimal device performance, particularly for dual-gate configurations aimed at drift mitigation.
Table 1: Key Materials for Dual-Gate OECT Fabrication
| Component | Material Options | Key Properties & Functions | Research Considerations |
|---|---|---|---|
| Channel Material | PEDOT:PSS [11] [12], p(g2T-TT) [11] [12], BBL [11] [12] | Mixed ionic-electronic conductivity; modulates current flow. p-type (PEDOT:PSS, p(g2T-TT)) or n-type (BBL). | PEDOT:PSS offers high transconductance [9]. Gel formulations (e.g., PEDOT:PSS/PAM) enhance stretchability [11]. |
| Gate Electrode | Au, Pt, Ag/AgCl [4] [9] | Applies gating potential. Polarizable (Au, Pt) or non-polarizable (Ag/AgCl). | Ag/AgCl enables smaller gate footprints [9]. Dual-gate design is critical for drift cancellation [1]. |
| Substrate | Polyurethane (PU) [11], Flexible Polymers | Provides mechanical support. Determines device flexibility/stretchability. | Polyurethane enables stretchability up to 50% [11]. |
| Electrolyte | Hydrogels (e.g., PVA, PAAm) [13], Ion Gels (e.g., PIL) [11] [13] | Medium for ion transport. Solid-state gels prevent leakage. | Poly(ionic liquid) ionogels confer high ionic conductivity and stability [11]. Hydrogels offer superior biocompatibility [13]. |
The Scientist's Toolkit: Essential Research Reagents
Table 2: Essential Reagents for OECT Fabrication and Characterization
| Reagent/Solution | Function | Example Protocol Note |
|---|---|---|
| PEDOT:PSS Dispersion | Forms the semiconducting channel. | Mix with 5% DMSO to enhance conductivity; filter through a 0.45 µm filter before use [12]. |
| Polyacrylamide (PAM) Precursor | Creates a stretchable gel network for the channel. | Solution contains acrylamide monomer, crosslinker (MBA), and initiator (APS) [11]. |
| Phosphate Buffered Saline (PBS) | Standard electrolyte for testing and biosensing. | 1X concentration, pH 7.4, provides physiological ionic strength [1]. |
| Oxygen Plasma | Surface treatment to improve electrode wettability. | Treat substrate for 1 minute at 100 W to ensure uniform film deposition [12]. |
Diagram 1: OECT Fabrication Workflow
Detailed Fabrication Protocols
Protocol: Microelectrode Chip Fabrication
This protocol outlines the procedure for creating the metal electrodes for a dual-gate OECT configuration [14] [1].
Materials:
- Silicon wafer with 500 nm thermal SiO₂
- Positive photoresist (e.g., NR9-1500PY) and RD6 developer
- Electron-beam evaporator
- Titanium (Ti, 20 nm) and Gold (Au, 500 nm) targets
- Lift-off remover (e.g., acetone)
Procedure:
- Substrate Preparation: Begin with a clean Si/SiO₂ wafer. Dehydrate on a hotplate at 150°C for 5 minutes.
- Photolithography: Spin-coat photoresist and soft-bake. Expose the photoresist using a mask defining the source, drain, and two gate electrodes. Develop in RD6 developer to pattern the resist.
- Metal Deposition: Load the patterned wafer into an e-beam evaporator. Deposit a 20 nm Ti adhesion layer followed by a 500 nm Au layer.
- Lift-Off: Submerge the wafer in acetone for several hours to dissolve the photoresist and remove excess metal, leaving behind the defined electrode structures.
- Annealing: Anneal the electrodes at 200°C for 1 hour in a nitrogen atmosphere to improve adhesion and electrical contact.
Protocol: Formulating a Stretchable Semiconducting Gel Active Layer
This protocol describes the synthesis of a PEDOT:PSS/Polyacrylamide (PAM) double-network organohydrogel for high-performance, stretchable channels [11].
Materials:
- PEDOT:PSS aqueous dispersion
- Acrylamide (AM) monomer
- N,N'-methylenebisacrylamide (MBA) crosslinker
- Ammonium persulfate (APS) thermal initiator
- Glycerol
Procedure:
- Solution Preparation: Prepare an aqueous solution containing 0.21-0.75% (w/v) PEDOT:PSS. Add glycerol to a final concentration of 10% (v/v) to improve environmental stability.
- Polymerization Mix: To the PEDOT:PSS/glycerol solution, add AM monomer (to form the PAM network), MBA crosslinker (0.5 mol% relative to AM), and APS initiator (1 mol% relative to AM). Stir until fully dissolved.
- Film Casting: Spin-coat the mixture onto the prepared electrode substrate.
- Gelation: Place the substrate on a hotplate at 60°C for 1-2 hours to initiate free-radical polymerization and form the cross-linked PAM network, resulting in a stable, conductive gel film.
Protocol: Assembling a Solid-State Dual-Gate OECT
This protocol integrates the components into a functional, solid-state dual-gate device.
Materials:
- Fabricated microelectrode chip
- Synthesized semiconducting gel channel
- Precursor solution for poly(ionic liquid) ionogel [11] or a natural hydrogel like gelatin/chitosan [13]
Procedure:
- Channel Definition: If necessary, define the channel area by gently wiping excess semiconducting gel, ensuring a clean connection between source and drain electrodes.
- Electrolyte Preparation: Prepare the gel electrolyte precursor. For a PIL ionogel, this involves mixing a vinyl-functionalized ionic liquid monomer with a crosslinker and photoinitiator [11].
- Electrolyte Integration: Carefully deposit a drop of the gel electrolyte precursor onto the device, fully covering the channel and both gate electrodes.
- Curing: Cure the gel electrolyte as required (e.g., UV light for photocurable ionogels, or thermal cure for other systems) to form a solid-state, non-leaking electrolyte layer.
- Encapsulation: Apply a final encapsulation layer (e.g., a thin PDMS film) to protect the device from the ambient environment and enhance mechanical robustness.
Device Characterization and Drift Mitigation Analysis
Characterization is critical for validating device performance, particularly the efficacy of the dual-gate architecture in mitigating drift.
Electrical Characterization Protocol
Objective: To measure the steady-state and transient performance metrics of the fabricated dual-gate OECT.
Procedure:
- Transfer Curves: Sweep the main gate voltage (VG) while keeping the drain voltage (VD) constant. Record the drain current (I_D). Perform both forward and backward sweeps.
- Transconductance: Calculate the transconductance, gm = ∂ID/∂V_G, from the transfer curve. This metric reflects the signal amplification efficiency [14] [9].
- Output Curves: Sweep VD at different, fixed VG values to obtain the output characteristics.
- Transient Response: Apply a square-wave gate voltage and measure the time it takes for the drain current to reach 90% of its saturation value after the gate pulse. This characterizes the switching speed (τ) [14] [4].
- Dual-Gate Modulation: Repeat the transfer curve measurement while applying different auxiliary gate biases (VAG) to demonstrate the tunability of the threshold voltage (VTH) [14].
Diagram 2: Dual-Gate OECT Drift Mitigation Principle
Quantitative Drift Analysis Protocol
Objective: To model and quantify the drift phenomenon and validate the performance of the dual-gate configuration in complex biological fluids [1].
Materials:
- Fabricated Single-Gate (S-OECT) and Dual-Gate (D-OECT) devices
- 1X PBS buffer solution
- Human serum (IgG-depleted for controlled experiments)
Procedure:
- Baseline Recording: Immerse the device in 1X PBS. Apply a constant VG and VD, and record I_D over a prolonged period (e.g., 1 hour) without any analyte.
- Drift Modeling: Fit the temporal ID drift data from the S-OECT to a first-order kinetic model of ion adsorption [1]: [ \frac{\partial ca}{\partial t} = c0 k+ - ca k- ] where ( ca ) is ion concentration in the gate material, ( c0 ) is ion concentration in solution, and ( k+ ), ( k- ) are adsorption/desorption rate constants.
- Dual-Gate Validation: Repeat the baseline recording with the D-OECT platform in both PBS and human serum. The drift should be significantly suppressed.
- Biosensing Verification: Functionalize the main gate with a bioreceptor (e.g., antibodies). Introduce the target analyte (e.g., human IgG) at varying concentrations in human serum and record the sensor response. The D-OECT should provide a stable baseline, enabling accurate detection at low limits of detection [1].
This application note has provided a detailed fabrication workflow and characterization protocol for constructing stable, dual-gate OECTs. The integration of advanced materials like semiconducting polymer gels and solid-state electrolytes with the drift-mitigating dual-gate architecture provides a robust pathway for developing high-performance biosensors. This workflow offers a solid foundation for researchers in academia and industry pursuing reliable bioelectronic sensing platforms for drug development and clinical diagnostics.
In organic electrochemical transistor (OECT)-based biosensors, gate functionalization serves as the primary strategy for imparting specificity towards target analytes. This process involves immobilizing bioreceptor molecules on the gate electrode, which serves as a recognition site for bio-analytes. When target biomolecules bind to these functionalized receptors, the resulting redox reactions or capacitance variations induce a change in the effective gate potential, which is then amplified by the transistor, yielding a measurable electrical signal [9]. The selection and application of the bioreceptor layer are therefore critical determinants of biosensor performance, influencing key parameters such as sensitivity, selectivity, and limit of detection (LOD) [5].
The broader research context for these functionalization strategies is the mitigation of temporal signal drift, a common challenge in OECT biosensors. This drift phenomenon, attributed to the non-specific absorption and diffusion of ions into the gate material, can be significantly reduced by employing a dual-gate OECT (D-OECT) architecture [1]. Within this stable sensing platform, the choice of an optimal bioreceptor layer becomes paramount for achieving reliable and accurate detection of specific biomarkers, even in complex biological fluids like human serum [5] [1].
Comparing Bioreceptor Layers for Gate Functionalization
The physicochemical properties of the bioreceptor layer—including its electrical characteristics (conductive vs. insulating), thickness, and the density of functional groups for biomolecule immobilization—directly impact the biosensing mechanism and performance. Research has explored various materials for this purpose, notably the conjugated polymer poly [3-(3-carboxypropyl)thiophene-2,5-diyl] (PT-COOH), the insulating polymer poly(styrene–co–acrylic acid) (PSAA), and ultrathin self-assembled layers (SAL) such as 1,10-decanedicarboxylic acid (DDA) [5].
Table 1: Comparison of Bioreceptor Layers for OECT Gate Functionalization
| Bioreceptor Layer | Material Type | Key Characteristics | Proposed Sensing Mechanism | Reported Performance (Human IgG Detection) |
|---|---|---|---|---|
| PT-COOH | P-type conjugated polymer | Semiconducting; ions/charges can penetrate bulk film; COOH groups for immobilization. | Bulk change in electrical properties of polymer due to altered charge distributions. | High sensitivity; suitable for detection in human serum [5] [1]. |
| PSAA | Insulating polymer (non-conjugated) | Insulating; change is likely an interfacial voltage effect. | Capacitive coupling at the electrolyte/polymer interface. | Lower sensitivity compared to PT-COOH [5]. |
| SAL (e.g., DDA) | Self-assembled monolayer | Ultra-thin, highly ordered layer with oriented COOH groups. | Enhanced surface voltage change due to proximity and molecular orientation. | Potential for improved behavior due to thinness and oriented groups [5]. |
The selection of a bioreceptor layer involves trade-offs. Semiconducting polymers like PT-COOH may offer higher sensitivity due to bulk interactions, while insulating layers and SALs might provide more stable and reproducible interfacial characteristics. The D-OECT architecture helps to isolate these specific binding signals from non-specific drift, allowing for a more accurate evaluation of the functionalized layer's performance [1].
Experimental Protocols for Gate Functionalization and Biosensing
The following protocols detail the procedures for functionalizing gate electrodes with different bioreceptor layers and subsequently performing biomarker detection using the D-OECT platform for drift mitigation.
Substrate Preparation and Bioreceptor Layer Immobilization
Materials:
- Gate Substrate: ITO-coated PET [5].
- Cleaning Reagents: Isopropanol [5].
- Surface Treatment: UV-ozone cleaner [5].
- Bioreceptor Polymers: PT-COOH solution (2 mg/mL in DMF), PSAA solution (2 mg/mL in a 4:1 mixture of Ethyl Alcohol and DMF) [5].
- SAL Material: 1,10-decanedicarboxylic acid (DDA) solution (1 mg/mL in Ethyl Alcohol) [5].
Procedure:
- Substrate Cleaning: Submerge the ITO/PET substrates in isopropanol for 15 minutes. Dry using a nitrogen stream [5].
- Surface Activation: Treat the cleaned substrates with UV-ozone for 30 minutes to enhance surface hydrophilicity and reactivity [5].
- Layer Deposition:
- Curing: Anneal all functionalized substrates at 60°C for 30 minutes to ensure solvent removal and layer stability [5].
Antibody Immobilization and Surface Blocking
Materials:
- Crosslinker: Aqueous solution of 1-Ethyl-3-(3-dimethylaminopropyl)carbodiimide (EDC) and N-Hydroxysuccinimide (NHS) [5].
- Bioreceptor: Anti-human IgG antibody (200 µg/mL in 1X PBS) [5].
- Blocking Agent: Bovine Serum Albumin (BSA), 2% w/v in 1X PBS [5].
- Wash Buffer: 1X Phosphate Buffered Saline (PBS) [5].
Procedure:
- Activation: Incubate the functionalized gate electrodes (PT-COOH, PSAA, or SAL) in the EDC/NHS solution for 30 minutes to activate the carboxylic acid groups. Rinse gently with 1X PBS afterward [5].
- Antibody Immobilization: Apply the anti-human IgG antibody solution to the activated surface and incubate for 2 hours. This covalently links the antibodies to the bioreceptor layer via amide bond formation [5].
- Blocking: Incubate the functionalized gates with the 2% BSA solution for 1 hour to passivate any remaining non-specific binding sites on the surface [5].
- Rinsing: Thoroughly rinse the prepared biosensor gates with 1X PBS to remove any unbound reagents [5]. The gates are now ready for use in the OECT setup.
Biosensing Measurement in D-OECT Configuration
Materials:
- D-OECT Setup: Two OECTs connected in series, with channel regions comprising P3HT [5] [1].
- Electrolyte: 1X PBS or human IgG-depleted human serum for experiments in biological fluid [1].
- Analyte: Human IgG antigen, serially diluted in the chosen electrolyte to desired concentrations [5] [1].
- Measurement Equipment: Semiconductor analyzer or source-meter unit [5].
Procedure:
- Baseline Measurement: Place the functionalized gate electrode and a reference electrode into the electrolyte bath of the D-OECT setup. Measure the transfer characteristics (drain current, ID, vs. gate voltage, VG) or record ID over time at a fixed VG to establish a stable baseline [5] [1].
- Analyte Introduction: Introduce the human IgG antigen solution into the electrolyte at a specific concentration.
- Signal Recording: Continuously monitor the change in I_D over time. The specific binding of the antigen to the immobilized antibodies on the gate alters the interfacial potential, modulating the current in the OECT channel [5] [9].
- Drift Mitigation: The D-OECT architecture inherently cancels common-mode temporal drift. The two OECTs are configured such that voltage drifts exhibit opposite polarity and thus subtract from each other, resulting in a more stable output signal [5] [1].
- Data Analysis: The sensor response can be quantified as the normalized change in current, ΔID/ID0. A calibration curve can be constructed by repeating the measurement with varying antigen concentrations to determine the sensitivity and LOD of the biosensor [5] [1].
Schematics and Workflows
The following diagrams illustrate the key concepts and experimental workflows described in this protocol.
Gate Functionalization Leads to Stable Biosensing
Gate Electrode Functionalization Workflow
The Scientist's Toolkit: Essential Research Reagents and Materials
Table 2: Key Research Reagent Solutions for OECT Gate Functionalization
| Item | Function / Application | Exemplary Specifications / Notes |
|---|---|---|
| ITO-coated PET Substrate | Flexible, conductive substrate for gate electrode fabrication. | Sigma-Aldrich, cat. no. 749729. Provides mechanical flexibility and good conductivity [5]. |
| PT-COOH | Semiconducting bioreceptor polymer for gate functionalization. | Rieke Metals, cat. no. 4030. P-type conjugated polymer with pendant COOH groups for biomolecule immobilization [5]. |
| 1,10-Decanedicarboxylic Acid (DDA) | Molecule for forming a self-assembled monolayer (SAL) on ITO. | Forms an ultra-thin, ordered bioreceptor layer with oriented carboxylic acid groups [5]. |
| EDC / NHS Crosslinker | Activates carboxyl groups for covalent coupling to primary amines on antibodies. | Standard carbodiimide chemistry for stable amide bond formation [5]. |
| Anti-human IgG Antibody | Biorecognition element for specific antigen capture. | Used at 200 µg/mL in PBS for immobilization on the functionalized gate [5]. |
| Bovine Serum Albumin (BSA) | Blocking agent to reduce non-specific binding. | 2% w/v solution in PBS used to passivate unreacted sites post-antibody immobilization [5]. |
| P3HT | Organic semiconductor for the OECT channel region. | Solaris Chem, cat. no. SOL4106. Typical p-type channel material [5]. |
| Human IgG-depleted Serum | Complex biological matrix for validating sensor performance in realistic conditions. | Used to spike known concentrations of human IgG, enabling accurate assessment of detection limits in serum [1]. |
The accurate detection of Immunoglobulin G (IgG) in human serum is a critical procedure in medical diagnostics, seroprevalence studies, and therapeutic drug monitoring. As a predominant antibody in human serum, IgG serves as a key indicator of immune response following infection or vaccination [15]. Traditional enzyme-linked immunosorbent assays (ELISAs), while reliable, present limitations including procedural complexity and challenges in standardizing results across different laboratory protocols [16]. Organic Electrochemical Transistors (OECTs) have emerged as a transformative biosensing platform, offering high sensitivity, low operating voltage, and significant signal amplification capabilities. Recent research highlights the development of dual-gate OECT architectures specifically designed to mitigate current drift—a significant challenge for biosensing in complex biological fluids like human serum—thereby enhancing measurement accuracy and reliability for IgG detection [9] [2].
Performance of OECT-based IgG Sensors
Research demonstrates that OECTs functionalized with various bioreceptor layers can detect human IgG across clinically relevant concentration ranges. The performance varies based on the device architecture and materials used.
Table 1: Performance Metrics of OECT-based Biosensors for IgG Detection
| Device Architecture | Bioreceptor Layer | Linear Detection Range | Limit of Detection (LOD) | Sensitivity | Test Medium |
|---|---|---|---|---|---|
| Single-Gate (S-OECT) [5] | PT-COOH, PSAA, SAL | Not Specified | Compared to D-OECT | Lower than D-OECT | Buffer |
| Dual-Gate (D-OECT) [2] | PT-COOH | Not Specified | Relatively Low | Increased vs. S-OECT | Human Serum |
| S-OECT with PEDOT:PSS [15] | Cysteamine/Glutaraldehyde/RBD | 5 to 30 µg mL⁻¹ | Not Specified | 13.75% [µg/mL]⁻¹ | Buffer (Relevance for Serum) |
The dual-gate OECT (D-OECT) configuration connects two OECTs in series, where voltage drifts in the two devices exhibit opposite polarity relative to the measurement direction, thereby largely canceling each other out [2] [5]. This architecture significantly improves signal stability, which is paramount for achieving reliable detection in complex, high-ionic-strength media like human serum.
Experimental Protocols
Protocol 1: IgG Detection Using a Dual-Gate OECT (D-OECT) in Human Serum
This protocol is adapted from studies focusing on drift mitigation for accurate sensing in biological fluids [2].
1. Device Fabrication:
- Channel Preparation: Spin-coat a solution of the organic semiconductor poly(3-hexylthiophene-2,5-diyl) (P3HT) (10 mg/mL in chlorobenzene) onto the pre-cleaned channel region between the source and drain electrodes. The devices should be cleaned beforehand by submerging in isopropanol for 15 minutes, drying with nitrogen, and treating with UV-ozone for 30 minutes [5].
- Gate Functionalization: Use ITO/PET substrates as gate electrodes. Functionalize the gate surface with a bioreceptor polymer. Poly [3-(3-carboxypropyl)thiophene-2,5-diyl] regioregular (PT-COOH) is a suitable choice.
- For PT-COOH, prepare a 5 mg/mL solution in a mixture of DMF and ethanol (4:1 volume ratio). Spin-coat this solution onto the ITO gate and anneal at 100°C for 10 minutes [5].
- Antibody Immobilization: Immobilize anti-human IgG antibodies onto the PT-COOH functionalized gate electrode. This is typically achieved through carbodiimide crosslinking chemistry (e.g., using EDC/NHS) to form amide bonds between the carboxylic acid groups on the polymer and the amine groups on the antibodies.
- Blocking: Incubate the functionalized gate with a Bovine Serum Albumin (BSA) solution (e.g., 1% w/v) to block non-specific binding sites.
2. Sensor Operation and Measurement:
- Setup: Configure the D-OECT platform by connecting two functionalized OECTs in series. Apply the gate voltage (VG) to the first device and the drain voltage (VDS) to the second device. Measure the transfer characteristics (drain current, ID, vs. VG) of the second device [2].
- Baseline Measurement: Immerse the sensor in the test medium—IgG-depleted human serum is recommended to control the baseline IgG concentration. Record the stable baseline current (I_0) [2].
- Analyte Introduction: Introduce the target human IgG at specific concentrations into the serum sample.
- Signal Measurement: Monitor the change in drain current. The figure of merit (FOM) for sensing is the relative change in current:
FOM = |(I - I_0) / I_0| = |ΔI / I_0|, whereIis the current after analyte introduction [15]. The D-OECT design will show a stable FOM with minimal temporal drift compared to a single-gate configuration.
Protocol 2: Persistent Luminescence-Based Sandwich Immunoassay for IgG
This protocol provides an alternative, autofluorescence-free optical method for detecting antigens in complex media [17].
1. Nanoparticle Synthesis:
- Synthesize chromium-doped zinc gallate (ZnGa₂O₄:Cr³⁺, ZGO) persistent luminescence nanoparticles via a hydrothermal method. The protocol involves a treatment at 220°C for different durations (6h, 12h, 24h), followed by calcination at 500°C. A 12-hour hydrothermal treatment was found to yield an 8-fold luminescence increase in the presence of H₂O₂, optimizing the signal [17].
2. Immunoassay Procedure:
- Capture: Immobilize a capture antibody specific to the target antigen (e.g., rabbit IgG) onto a solid surface.
- Blocking: Block the remaining surface with a protein like BSA to prevent non-specific binding.
- Sample Incubation: Incubate the sample (e.g., undiluted human serum) containing the antigen with the capture surface.
- Detection: Add the non-functionalized ZGO nanoparticles that have been conjugated with a detection antibody to form a sandwich complex.
- Washing and Measurement: Wash the surface to remove unbound nanoparticles. Measure the persistent luminescence signal of the bound ZGO nanoparticles. The intensity is correlated with the antigen concentration, providing a linear range from 1 ng mL⁻¹ to 10⁴ ng mL⁻¹ and a limit of detection of 0.01 ng mL⁻¹ [17].
The Scientist's Toolkit: Research Reagent Solutions
Table 2: Essential Reagents and Materials for OECT-based IgG Biosensing
| Reagent/Material | Function / Role in Experiment | Examples / Specifications |
|---|---|---|
| Organic Semiconductors | Forms the conductive channel of the OECT; modulates current flow based on ionic doping. | P3HT (p-type) [5], PEDOT:PSS (p-type) [15] |
| Bioreceptor Polymers | Functionalized on the gate electrode to provide sites for antibody immobilization. | PT-COOH [2] [5], PSAA [5] |
| Crosslinkers | Creates covalent bonds between bioreceptor layer and antibodies for stable immobilization. | Cysteamine/Glutaraldehyde complex [15], EDC/NHS chemistry |
| Blocking Agents | Prevents non-specific binding of proteins to non-target surfaces, ensuring specificity. | Bovine Serum Albumin (BSA) [2] [15] |
| Model Analytes | The target biomarker used for testing and validating sensor performance. | Human Immunoglobulin G (IgG) [2] [15] |
| Complex Test Media | Mimics real-world conditions for validating sensor performance and robustness. | IgG-depleted Human Serum [2], Phosphate-Buffered Saline (PBS) |
Signaling Pathways and Workflows
OECT Biosensing Mechanism and Drift Mitigation
The following diagram illustrates the core working principle of an OECT and how the dual-gate architecture mitigates signal drift.
Experimental Workflow for IgG Detection
This workflow outlines the key steps for fabricating a functional OECT biosensor and performing IgG detection.
The application of dual-gate OECTs for detecting IgG in human serum represents a significant advancement in biosensing technology. By effectively mitigating the inherent drift problems of single-gate architectures, the D-OECT platform enables highly accurate and reliable measurements in complex, clinically relevant media. The detailed protocols for device fabrication, functionalization, and operation provide a clear roadmap for researchers aiming to develop robust biosensors. When combined with the appropriate bioreceptor layers and a thorough understanding of the underlying mechanisms, this technology holds immense promise for enhancing seroprevalence studies, therapeutic drug monitoring, and the management of critical diseases.
Optimizing Dual-Gate OECT Performance: Material and Structural Engineering
In the field of organic bioelectronics, organic electrochemical transistors (OECTs) have emerged as a prominent platform for biosensing due to their high transconductance, low operating voltage, and excellent biocompatibility [18] [9]. The selectivity and sensitivity of OECT-based biosensors are fundamentally governed by their bioreceptor layers—interfaces functionalized with biological recognition elements that selectively capture target analytes [5] [9]. The selection and tuning of these layers are critical for sensor performance, influencing key parameters such as the limit of detection (LOD), signal stability, and specificity.
Two primary material classes for bioreceptor immobilization are conducting polymers with functional side groups (e.g., PT-COOH) and self-assembled monolayers (SAMs) [5]. The choice between them dictates the sensor's design, its mechanism of signal transduction, and its stability in complex biological fluids. Furthermore, innovative device architectures, such as the dual-gate OECT (D-OECT), have been developed specifically to mitigate the inherent current drift observed in single-gate configurations, thereby enhancing data accuracy, particularly in long-term measurements or within complex media like human serum [5] [2]. This application note provides a detailed comparison of these bioreceptor layers and outlines standardized protocols for their implementation within a D-OECT framework for drift-conscious biosensing research.
Bioreceptor Layer Comparison and Selection Guide
The performance of an OECT biosensor is profoundly affected by the physical and chemical properties of its bioreceptor layer. The table below provides a systematic comparison of the key characteristics of conducting polymer-based layers and self-assembled monolayers.
Table 1: Comparative Analysis of Bioreceptor Layers for OECT Biosensors
| Characteristic | Conducting Polymer (e.g., PT-COOH) | Self-Assembled Monolayer (e.g., DDA) |
|---|---|---|
| Material Nature | p-type semiconducting polymer film [5] | Ultra-thin molecular layer (e.g., 1,10-decanedicarboxylic acid) [5] |
| Typical Thickness | ~50 nm (spin-coated) [2] | Molecular-scale, ~1-3 nm (self-assembled) [5] |
| Bioreceptor Immobilization | Covalent attachment via EDC/NHS chemistry to COOH groups on polymer side chains [5] | Covalent attachment via EDC/NHS chemistry to terminal COOH groups on oriented molecules [5] |
| Signal Transduction Mechanism | Bulk property change; ion penetration alters polymer's electrical properties [5] | Interface property change; binding-induced surface potential shift [5] |
| Key Advantage | Amplified signal due to bulk electrochemical gating; suitable for non-metal electrodes (e.g., ITO) [5] | Highly ordered and dense receptor presentation; potentially lower non-specific binding [5] |
| Limitation | Slower ion diffusion into bulk can contribute to temporal signal drift [2] | Limited total number of immobilization sites due to monolayer nature [5] |
Performance Metrics and Drift Considerations
When integrated into a D-OECT architecture, the drift behavior of these layers can be systematically managed. The following table summarizes quantitative performance data and drift parameters for the two layer types, highlighting the effectiveness of the dual-gate approach.
Table 2: Performance and Drift Parameters of Bioreceptor Layers in S-OECT vs. D-OECT Configurations
| Parameter | PT-COOH Layer | SAL (DDA) Layer |
|---|---|---|
| Drift Rate (S-OECT, in PBS) | High (theoretically modeled with k⁺ ~ 0.003 s⁻¹, k⁻ ~ 0.0003 s⁻¹) [2] | Moderate (theoretically modeled with k⁺ ~ 0.002 s⁻¹, k⁻ ~ 0.0005 s⁻¹) [2] |
| Drift Mitigation in D-OECT | Significant reduction; enables stable operation in human serum [2] | Significant reduction; more stable baseline for sensitive detection [5] [2] |
| Detection Capability | Human IgG detection in serum; LOD improvement in D-OECT [2] | Ultra-sensitive antigen detection (e.g., down to single molecule) reported on Au gates [5] |
Experimental Protocols
This section provides detailed methodologies for fabricating and characterizing the two primary bioreceptor layers and their integration into a dual-gate OECT platform for drift-stabilized biosensing.
Protocol 1: Fabrication of PT-COOH Conducting Polymer Bioreceptor Layers
Principle: A semiconducting polymer film with pendant carboxyl groups is spin-coated onto a gate electrode, providing a three-dimensional matrix for the covalent immobilization of biorecognition elements (e.g., antibodies) [5].
Materials:
- Gate Electrode: ITO-coated PET substrate [5].
- Polymer Solution: Poly [3-(3-carboxypropyl)thiophene-2,5-diyl] regioregular (PT-COOH) dissolved in DMF at 5 mg/mL [5].
- Activation Reagents: 50 mM EDC and 50 mM NHS in 1X PBS buffer (pH 7.4) [5].
- Bioreceptor: Human IgG antibody (Ab), 50 µg/mL in 1X PBS [5].
- Blocking Agent: 1% Bovine Serum Albumin (BSA) in 1X PBS [5].
Procedure:
- Substrate Preparation: Clean ITO/PET substrates by submerging in isopropanol for 15 minutes, followed by drying under a nitrogen stream. Treat with UV-ozone for 30 minutes to enhance surface hydrophilicity [5].
- Polymer Deposition: Spin-coat the filtered PT-COOH solution onto the ITO gate at 2000 rpm for 60 seconds to achieve an approximate thickness of 50 nm [5] [2].
- Activation of Carboxyl Groups: Incubate the PT-COOH-coated gate electrode in a freshly prepared solution of EDC/NHS for 1 hour at room temperature to activate the carboxyl groups for covalent coupling [5].
- Antibody Immobilization: Rinse the activated substrate with PBS and immediately incubate it with the human IgG Ab solution overnight at 4°C.
- Surface Blocking: Rinse off unbound Ab and incubate the functionalized gate in 1% BSA solution for 1 hour to passivate any remaining reactive sites and minimize non-specific binding [5].
- Storage: The functionalized gate electrodes can be stored in PBS at 4°C for up to one week before use.
Protocol 2: Formation of Self-Assembled Monolayer (SAL) Bioreceptor Layers
Principle: Bifunctional molecules spontaneously form a dense, oriented monolayer on a compatible surface (e.g., gold or ITO), presenting terminal functional groups for subsequent bioreceptor attachment [5].
Materials:
- Gate Electrode: ITO-coated PET substrate [5].
- SAM Solution: 10 mM 1,10-decanedicarboxylic acid (DDA) in ethyl alcohol [5].
- Activation Reagents & Bioreceptor: Same as Protocol 1 (EDC, NHS, Ab, BSA) [5].
Procedure:
- Substrate Preparation: Clean and UV-ozone treat ITO/PET substrates as described in Protocol 1, Step 1 [5].
- Self-Assembly: Immerse the clean, dry ITO gate electrode in the 10 mM DDA solution in ethanol for 24 hours at room temperature to allow monolayer formation [5].
- Rinsing and Drying: Remove the substrate from the DDA solution and rinse thoroughly with pure ethanol to remove physisorbed molecules. Dry under a gentle nitrogen stream.
- Bioreceptor Immobilization and Blocking: Follow Steps 3-6 from Protocol 1 to activate the terminal carboxyl groups of the SAL, immobilize the antibody, and block with BSA [5].
Protocol 3: Integration into a Dual-Gate OECT (D-OECT) for Drift Mitigation
Principle: The D-OECT configuration connects two OECTs in series, where the voltage drifts from the two functionalized gates are of opposite polarity and thus cancel each other out, yielding a stable output signal [5] [2].
Diagram Title: D-OECT Circuit for Drift Mitigation
Materials:
- Two Identical Functionalized Gate Electrodes: Prepared following either Protocol 1 or 2.
- OECT Pairs: Two OECTs with P3HT channels (W/L = 2000 µm/100 µm, 10 mg/mL in chlorobenzene, spin-coated at 2000 rpm) [5] [2].
- Electrolyte: 1X PBS (pH 7.4) or human IgG-depleted human serum for real-fluid validation [2].
- Measurement Equipment: Semiconductor parameter analyzer.
Procedure:
- Device Assembly: Immerse the two functionalized gate electrodes and the two OECTs (OECT1 and OECT2) in the same electrolyte bath.
- Circuit Configuration: Connect the two OECTs in series. Apply the gate voltage (VG) to the first functionalized gate (G1). Apply the drain voltage (VDS) to the drain of the second OECT (OECT2). The output current (ID) is measured from the drain of OECT2 [5] [2].
- Electrical Characterization:
- Record the transfer curves (ID vs. VG at constant VDS) of the D-OECT system.
- To assess drift, apply a constant VG and VDS and record ID over time (e.g., 600 seconds) for both the S-OECT (single gate) and D-OECT configurations.
- Introduce the target analyte (e.g., human IgG at varying concentrations) into the electrolyte and monitor the stable current shift in the D-OECT configuration to perform quantitative biosensing [2].
The Scientist's Toolkit: Research Reagent Solutions
Table 3: Essential Materials for OECT Bioreceptor Functionalization
| Item | Function / Rationale | Example & Specification |
|---|---|---|
| PT-COOH | p-type semiconducting polymer bioreceptor layer; bulk property change enables signal amplification [5]. | Poly [3-(3-carboxypropyl)thiophene-2,5-diyl], regioregular [5]. |
| DDA (SAL) | Molecule for forming ultra-thin, ordered bioreceptor layers; minimizes drift source from thick films [5]. | 1,10-decanedicarboxylic acid, >95% purity [5]. |
| EDC / NHS | Crosslinking chemistry; activates terminal carboxyl groups for covalent antibody immobilization [5]. | 1-Ethyl-3-(3-dimethylaminopropyl)carbodiimide & N-Hydroxysuccinimide [5]. |
| BSA | Blocking agent; passivates unreacted sites on the functionalized surface to minimize non-specific binding [2]. | Bovine Serum Albumin, fraction V [2]. |
| P3HT | Organic semiconductor for the OECT channel; provides stable operation in aqueous environments [5] [2]. | Poly(3-hexylthiophene-2,5-diyl), RR >90% [5]. |
| Human IgG-depleted Serum | Complex biological matrix for sensor validation; provides realistic background while controlling analyte concentration [2]. | Commercial human serum, pre-depleted of IgG [2]. |
The strategic selection between conducting polymer layers and self-assembled monolayers is paramount for optimizing OECT biosensor performance. PT-COOH offers a robust, amplifiable platform suitable for various electrode materials, while SALs provide an ultra-thin, ordered interface for maximum sensitivity. The integration of either layer into a dual-gate OECT architecture effectively mitigates the confounding factor of temporal current drift, unlocking highly accurate and stable biosensing capabilities. This is especially critical for applications in complex biological fluids like human serum, paving the way for reliable point-of-care diagnostics and advanced drug development tools.
Organic Electrochemical Transistors (OECTs) have emerged as a cornerstone technology in bioelectronics, particularly for biosensing and neuromorphic applications. Their operation, which relies on the volumetric penetration of ions from an electrolyte into a mixed ionic-electronic conductive channel, makes their architecture paramount to performance. This application note details advanced channel architectures, specifically 3D electrolyte-surrounded and nanostructured channels, framing them within a broader research context focused on mitigating drift in dual-gate OECTs. These architectural innovations enhance key performance metrics, including transconductance, response time, and signal stability, which are critical for researchers and drug development professionals requiring high-fidelity, stable biosensing platforms. The following sections provide a quantitative comparison of these architectures, detailed fabrication protocols, and a curated list of essential research reagents.
Performance Comparison of Advanced OECT Architectures
The transition from traditional planar to advanced 3D and nanostructured channels significantly alters device performance. The table below summarizes quantitative data and characteristics for the featured architectures, providing a benchmark for comparison and selection.
Table 1: Performance Metrics of Advanced OECT Channel Architectures
| Architecture Type | Key Material/ Fabrication | Transconductance (gₘ) | Response Time (τ) | Reported Application/ Advantage |
|---|---|---|---|---|
| Fully 3D-Printed OECT | 3D-printed PEDOT:PSS channel & rGO/CNT electrodes [19] | ~34 S cm⁻¹ (geometry-normalized) [19] | τOFF ≈ 27 ms, τON ≈ 100 ms [19] | Dopamine biosensing (LoD: 6 µM); mechanical flexibility [19] |
| Fibre-Based OECT (F-OECT) | Wet-spun polymer fibres (e.g., PEDOT:PSS) as channel [20] | Performance linked to enhanced ion transport & surface area [20] | Improved τ from lateral ion transport (e.g., from 21.3 s to 1.9 s) [20] | Wearable & implantable bioelectronics; conformable surfaces [20] |
| Lateral Ion Transport (Nanostructured) | Patterned P3HT films with microstructures (2–100 µm) [20] | Governed by material μC* product & ion routing [20] | tDiff reduced to 0.2 s (2 µm stripes) [20] | Fundamental ion transport studies; design for speed [20] |
Experimental Protocols
This section outlines detailed methodologies for fabricating and characterizing two prominent advanced OECT architectures: the fully 3D-printed OECT and the fibre-based OECT (F-OECT).
Protocol 1: Fabrication of Fully 3D-Printed OECTs with Electrolyte-Surrounded Channels
This protocol describes an additive manufacturing process for creating complete OECTs, including the channel, electrodes, and electrolyte, on a flexible substrate [19].
3.1.1 Materials and Equipment
- Substrate: Microscope glass slide coated with a thin (<4 µm) Parylene C layer.
- Ink for Source, Drain, and Gate Electrodes: A blend of Graphene Oxide (GO) and Carbon Nanotubes (CNTs).
- Post-processing Solution: 50 wt% Potassium Iodide (KI) in 1 M Hydrochloric Acid (HCl).
- High-Conductivity Ink: PEDOT:PSS formulation (4 wt%) for coating electrodes.
- Channel Ink: PEDOT:PSS formulation (2.5 wt%) with 20 wt% D-Sorbitol and Divinyl-sulfone (DVS) crosslinker.
- Insulator Ink: Polydimethylsiloxane (PDMS).
- Gate Electrolyte Ink: Poly(sodium 4-styrenesulfonate) (PSSNa)-based hydrogel (50 wt%) with 0.2 M Aluminum Chloride (AlCl₃).
- Core Equipment: Wet extrusion-based 3D printing system (e.g., BIOX by Cellink).
3.1.2 Step-by-Step Procedure
- Substrate Preparation: Clean the Parylene-coated glass slide to ensure it is free of dust and organic contaminants.
- Printing Electrodes: 3D print the source, drain, and gate electrodes using the GO/CNT ink.
- Electrode Reduction: Immerse the printed structure in the KI/HCl solution overnight to reduce GO to rGO, enhancing conductivity to ~600 S cm⁻¹.
- Electrode Coating: Print the high-conductivity (4 wt%) PEDOT:PSS ink on top of the rGO/CNT electrodes to lower impedance.
- Channel Definition: 3D print the OECT channel (e.g., 240 µm width, 77 µm length) using the formulated 2.5 wt% PEDOT:PSS channel ink.
- Insulation Layer: Print a PDMS layer with a defined opening (e.g., 0.5 × 3 mm²) over the channel and gate electrode to create a well for the electrolyte.
- Solid Electrolyte Integration: Fill the PDMS well by printing the PSSNa-based hydrogel electrolyte.
- Curing/Stabilization: Allow the device to stabilize at room temperature before electrical characterization.
3.1.3 Characterization and Analysis
- Perform electrical characterization using a source measure unit (SMU).
- Record transfer curves (I₍DS₎ vs. V₍GS₎) at a constant drain voltage (e.g., V₍DS₎ = -1 V) to extract transconductance (gₘ = ∂I₍DS₎/∂V₍GS₎) and ON/OFF ratio.
- Measure output curves (I₍DS₎ vs. V₍DS₎) at varying gate voltages.
- Analyze transient response by applying gate voltage pulses and fitting the I₍DS₎ temporal response with a single exponential function to extract switching times (τ₍ON₎ and τ₍OFF₎) [19].
Protocol 2: Construction and Evaluation of Fibre-Based OECTs (F-OECTs)
This protocol focuses on creating OECTs using one-dimensional polymer fibres as the active channel, enabling conformability to complex geometries [20].
3.2.1 Materials and Equipment
- Channel Material: Conducting polymer (e.g., PEDOT:PSS) processed into a fibre via wet spinning.
- Electrolyte: Aqueous salt solution (e.g., NaCl, PBS) or gel electrolyte.
- Gate Electrode: Standard Ag/AgCl electrode or a metal wire (Pt, Au).
- Substrate: Flexible polymer sheet (e.g., PET, polyimide) or textile.
- Core Equipment: Wet-spinning apparatus; equipment for source/drain electrode deposition (e.g., thermal evaporator or sputter coater).
3.2.2 Step-by-Step Procedure
- Fibre Fabrication: Produce the conducting polymer fibre using a wet-spinning technique, which involves extruding a polymer solution into a coagulation bath to solidify the fibre.
- Substrate Mounting: Secure the flexible substrate and attach the polymer fibre across it, defining the channel length.
- Source/Drain Contact Deposition: Pattern source and drain electrodes (e.g., Au or Pt) at the ends of the fibre using techniques like evaporation or printing. Ensure low-contact resistance.
- Device Assembly: Immerse the fibre channel and a separate gate electrode in the chosen electrolyte.
- Encapsulation: Apply a biocompatible encapsulation layer (e.g., silicone) to define the electrolyte area and protect the contacts, leaving the fibre channel exposed to the electrolyte.
3.2.3 Characterization and Analysis
- The operation mode (depletion or accumulation) is determined by the intrinsic doping state of the fibre material. PEDOT:PSS fibres typically operate in depletion mode [20].
- Electrical characterization follows standard OECT procedures (transfer curves, output curves, transient response).
- Pay particular attention to the unique Lateral Insertion-Assisted Ion Transport mechanism. Characterize ion diffusion time (tDiff) and device response time (τ) for different fibre diameters or micro-patterns to quantify the performance enhancement from the 3D geometry [20].
The Scientist's Toolkit: Research Reagent Solutions
The table below lists essential materials for developing advanced OECT architectures, along with their critical functions in device fabrication and operation.
Table 2: Essential Research Reagents for Advanced OECT Fabrication
| Reagent/Material | Function/Application in OECTs |
|---|---|
| PEDOT:PSS | Benchmark mixed ionic-electronic conductor for OECT channels; can be formulated for 3D printing or wet-spinning into fibres [19] [20]. |
| Graphene Oxide (GO)/Carbon Nanotube (CNT) Ink | Used in 3D printing of conductive electrodes; subsequent reduction to rGO/CNT enhances conductivity [19]. |
| D-Sorbitol | Additive in PEDOT:PSS channel ink; acts as an ion reservoir and plasticizer, improving adhesion and stability [19]. |
| Divinyl-sulfone (DVS) | Crosslinker for PEDOT:PSS; boosts water stability without sacrificing electrical conductivity [19]. |
| PSSNa-based Hydrogel | Solid-state gate electrolyte; provides a stable ion conduction pathway, preventing leakage in flexible devices [19]. |
| N-type Conjugated Polymers | Enables accumulation-mode OECTs for low-power applications and complementary circuits (e.g., with p-type devices) [20] [4]. |
| Ionic Liquid Gels (e.g., [C₂MIM][EtSO₄]) | Non-volatile, highly stable gel electrolytes for OECTs; ideal for long-term wearable applications where water evaporation is a concern [13]. |
Architectural Schematics and Ion Transport Pathways
The performance of advanced OECTs is governed by their physical structure and the resultant ion transport pathways. The following diagrams illustrate these concepts for a 3D electrolyte-surrounded OECT and the lateral ion transport mechanism in a nanostructured channel.
Diagram 1: 3D Electrolyte-Surrounded OECT Architecture. This schematic shows a fully 3D-printed device on a flexible substrate. The OMIEC channel is fully surrounded by the gate electrolyte, facilitating volumetric doping/de-doping. Ion injection from the gel electrolyte into the 3D channel bulk is the core operational mechanism, enhancing the channel's modulation efficiency [19].
Diagram 2: Ion Transport in Nanostructured Channels. The application of a gate voltage drives ions from the electrolyte into the OMIEC channel. In nanostructured channels (e.g., fibres, patterned films), ions diffuse not only vertically but also laterally along the high-surface-area interfaces. This Lateral Insertion-Assisted Ion Transport mechanism synergistically enhances ion injection efficiency and significantly reduces device response time [20].
The strategic implementation of 3D electrolyte-surrounded and nanostructured channels represents a significant leap forward in OECT performance. These architectures directly enhance the fundamental ion-to-electron coupling efficiency by maximizing the channel-electrolyte interfacial area and optimizing ion transport pathways. For research focused on dual-gate architectures for drift mitigation, these designs offer a robust physical foundation. A more stable and efficient primary channel, as described herein, allows the dual-gate system to more effectively compensate for drift phenomena without being overwhelmed by signal noise or intrinsic instability. The provided protocols, performance data, and reagent toolkit equip researchers to implement these advanced architectures, accelerating the development of next-generation, high-stability biosensors and bioelectronic platforms.
In the development of advanced organic electrochemical transistor (OECT) arrays for electrophysiology and biosensing, crosstalk between adjacent gates and channels presents a fundamental challenge to signal fidelity. This application note details proven strategies for mitigating crosstalk, enabling independent operation of multiple gates in dense OECT configurations. As research progresses toward dual-gate OECT architectures for drift mitigation, effective crosstalk suppression becomes increasingly critical for maintaining signal integrity, particularly in applications requiring high spatial resolution such as neural recording and multiplexed biomolecule detection. We present a technical framework encompassing device architecture, material selection, and fabrication protocols to achieve effective crosstalk suppression in OECT-based systems.
Crosstalk Fundamentals in OECT Arrays
Origins and Impact of Crosstalk
In OECT arrays operating through a common electrolyte, crosstalk primarily arises from parasitic ionic and electronic coupling between adjacent components. When multiple OECTs share an electrolyte environment—such as in biological fluids or common culture media—gate-induced ionic currents can create unintended voltage fluctuations that interfere with neighboring channels [21]. This interference manifests as signal bleed-through, reduced signal-to-noise ratio, and compromised accuracy in multi-channel recordings. The high capacitance of conducting polymers, while beneficial for transconductance, exacerbates leakage currents in the off-state, further contributing to inter-channel interference [21]. In practice, crosstalk can limit the scalability of high-density OECT arrays and impede the accurate mapping of biological signals.
Crosstalk Classification in Electrochemical Systems
- Ionic Crosstalk: Occurs through the common electrolyte when gate-induced ion fluxes inadvertently modulate adjacent channels.
- Electronic Crosstalk: Arises from parasitic capacitive coupling between closely spaced interconnects and electrodes.
- Faradaic Crosstalk: Results from unintended redox reactions at gate electrodes affecting the shared electrochemical potential.
Strategic Approaches for Crosstalk Mitigation
Diode-Integrated OECT Architectures
The integration of p-n organic electrochemical diodes (OEDs) with OECTs presents a highly effective strategy for crosstalk suppression. These vertical-stack diodes, fabricated using complementary p- and n-type conducting polymers, enable high current rectification ratios (up to 10⁵) and fast switching speeds (230 μs) [21].
Table 1: Performance Characteristics of p-n OED Integrated OECTs
| Parameter | Performance Value | Impact on Crosstalk |
|---|---|---|
| Rectification Ratio | 10⁵ | Minimizes reverse-biased leakage between elements |
| Switching Speed | 230 μs | Enables rapid multiplexing without signal overlap |
| Pixel Diameter | 15-26 μm | Facilitates high-density array integration |
| Shank Dimensions | 50 × 8 μm² | Enables minimally invasive neural interfaces |
The rectifying behavior of these diodes ensures unidirectional current flow, effectively isolating active OECTs during multiplexing operations. This approach minimizes crosstalk from neighboring elements due to significantly reduced reverse-biased leakage currents, enabling true independent gate operation even in shared electrolytes [21].
Advanced Fabrication and Patterning Techniques
Electron-beam patterning of organic semiconductors enables the creation of high-density OECT arrays while effectively suppressing crosstalk. This direct-write approach converts exposed semiconductor areas to electronic insulators while retaining ionic conductivity, creating defined electronic channels within a continuous ionically conductive matrix [22].
- Fabrication Protocol: Spin-coat organic semiconductor blends (e.g., bgDPP-g2T for p-type, bHOMO-gDPP for n-type) onto patterned source electrodes. Apply electron-beam exposure (300-1000 μC cm⁻²) to define channel regions, then deposit and pattern drain electrodes perpendicular to source lines [22].
- Performance Outcome: This patterning reduces off currents (IOFF) and gate leakage currents (IG) by orders of magnitude, significantly decreasing static power consumption and inter-device crosstalk in high-density arrays [22].
Table 2: Crosstalk Mitigation Through Electron-Beam Patterning
| Parameter | Unpatterned OECT | e-Beam Patterned OECT | Improvement Factor |
|---|---|---|---|
| On/Off Ratio (p-type) | 4.1 × 10⁴ | 1.3 × 10⁶ | 32× |
| On/Off Ratio (n-type) | 9.9 × 10⁶ | 1.5 × 10⁸ | 15× |
| Gate Leakage Current | ~10⁻⁶ A | ~10⁻⁷ A | 10× reduction |
| Array Density | Limited by crosstalk | ~7.2 million OECTs/cm² | Significant enablement |
Asymmetric Contact Design for Single-Material Complementary Circuits
Implementing asymmetric source/drain contact areas enables creation of complementary circuits using a single organic material, effectively reducing crosstalk by minimizing the saturation slope in transistor output characteristics. This approach leverages contact-mediated dedoping where the lowest-potential contact with smaller area enhances localized channel dedoping [23].
- Experimental Protocol: Fabricate transistors with deliberate area asymmetry between source and drain contacts (AD < AS for 3rd quadrant operation). Maintain channel dimensions while varying contact area ratios across up to 3 orders of magnitude. This geometrical control enables optimization of saturation behavior without material modifications [23].
- System Impact: The reduced saturation slope enables higher gain amplification and more efficient transistor cascading, significantly improving signal integrity in multi-stage amplifiers by minimizing inter-stage interference [23].
Internal Ion-Gated Transistor (IGT) Architectures
Replacing conventional electrolyte-gated OECTs with internal ion-gated transistors (IGTs) eliminates shared electrolyte dependencies, fundamentally preventing ionic crosstalk. IGTs incorporate dedicated mobile ion reservoirs within each transistor channel, enabling MHz-range operation while eliminating cross-talk through common electrolytes [23].
- Implementation: Each IGT possesses an independent gate electrode rather than relying on a common electrolyte with shared gate electrode. This architecture permits selective, crosstalk-free operation of densely packed transistors in integrated circuits [23].
- Performance: IGT-based voltage amplifiers demonstrate uniform gains >200 V/V with bandwidth exceeding 2 MHz, maintaining stable performance during chronic implantation exceeding one month [23].
Research Reagent Solutions
Table 3: Essential Materials for Crosstalk-Mitigated OECT Fabrication
| Material/Reagent | Function | Application Notes |
|---|---|---|
| p(C6NDI-T) and PEDOT:PSS | Complementary polymers for p-n OED | Enables rectification ratios >10⁵ in vertical stacks [21] |
| bgDPP-g2T and bHOMO-gDPP blends | Patternable organic semiconductors | Electron-beam patterning enables defined channels [22] |
| Parylene C | Substrate and insulation layer | Low dielectric constant (κ=3.1) minimizes interconnect crosstalk [21] |
| Cin-Cell polymer | Redox-inert matrix material | Enhances patterning capability in semiconductor blends [22] |
| Au and Pt electrodes | Source, drain, and gate contacts | Enable asymmetric design implementation [23] |
Experimental Protocols
Protocol 1: Fabrication of p-n OED Integrated OECT Arrays
Objective: Integrate vertical p-n organic electrochemical diodes with OECTs to minimize crosstalk in multiplexed arrays.
Materials: p-type PEDOT:PSS, n-type p(C6NDI-T) polymer, parylene C substrate (2 μm) and insulation layer (2 μm), Au source/drain electrodes, Ag/AgCl gate electrode, photolithography equipment.
Methodology:
- Pattern bottom Au cathode electrodes on parylene C substrate using photolithography.
- Deposit n-type p(C6NDI-T) film (200 nm) followed by p-type PEDOT:PSS film (240 nm) in vertical stack.
- Pattern top Au anode electrode with 4-μm diameter pinhole for hydration and ionic charge injection.
- Hydrate polymer stack in buffer electrolyte and apply charging voltage (VEC) to inject cations into polymer bulk.
- Characterize rectification behavior by applying anode-cathode bias (VAC) and measuring current migration.
Validation: Measure rectification ratio (target: >10⁵) and switching speed (target: <250 μs) in buffer solution. Verify isolation by measuring leakage currents between adjacent channels in multiplexing operation [21].
Protocol 2: Electron-Beam Patterning for High-Density OECT Arrays
Objective: Create monolithically integrated high-density OECT arrays with minimized crosstalk through direct e-beam patterning.
Materials: bgDPP-g2T (p-type) or bHOMO-gDPP (n-type) semiconductor blends, Cin-Cell polymer, Au source/drain electrodes, PBS electrolyte, electron-beam lithography system.
Methodology:
- Spin-coat semiconductor blend onto patterned Au source electrodes.
- Directly expose out-of-channel regions to electron beam (300-1000 μC cm⁻²) without masks or resists.
- Thermally evaporate and pattern perpendicular Au drain electrodes, creating channel length defined by OSC film thickness (~100 nm).
- Complete devices by dispensing PBS electrolyte and integrating Ag/AgCl gate electrode.
- Characterize transconductance, on/off ratios, and gate leakage currents to verify crosstalk suppression.
Validation: Confirm electronically insulating but ionically conductive properties in exposed regions through impedance spectroscopy. Verify crosstalk suppression by measuring parasitic currents between adjacent channels in array configuration [22].
Protocol 3: Asymmetric Contact Transistor Fabrication
Objective: Implement single-material complementary transistors through geometrical contact asymmetry to enable compatible signal dynamic range.
Materials: PEDOT:PSS, Au electrodes with varied contact areas, flexible substrates.
Methodology:
- Fabricate transistor channels with identical dimensions (length and width).
- Pattern source and drain electrodes with deliberate area asymmetry (ratios from 10:1 to 1000:1).
- For 3rd quadrant operation, design drain contact area (AD) significantly smaller than source contact area (AS).
- For 1st quadrant n-type-like operation, design source contact area (AS) significantly smaller than drain contact area (AD).
- Characterize output characteristics and saturation behavior in both operating quadrants.
Validation: Quantify saturation region slope improvement and verify balanced operation in both quadrants for complementary circuit design [23].
Effective crosstalk mitigation in multi-gate OECT systems requires a multifaceted approach addressing both ionic and electronic interference pathways. The strategies presented herein—diode integration, advanced patterning, asymmetric design, and internal ion gating—provide a comprehensive toolkit for achieving independent gate operation in dense OECT arrays. These approaches enable the development of robust dual-gate OECT architectures for drift mitigation while maintaining signal integrity essential for advanced biosensing and neural interface applications. Implementation of these protocols will support researchers in developing next-generation OECT systems with enhanced precision and scalability.
Organic Electrochemical Transistors (OECTs) have emerged as a premier platform for bioelectronic applications, including biosensing, neuromorphic computing, and wearable devices, owing to their exceptional compatibility with aqueous environments and biological systems [4]. The performance of these devices is governed by three fundamental metrics: transconductance (gₘ), which represents the amplification capability and sensitivity; bandwidth, determining the maximum operational frequency; and response time, characterizing the switching speed between operational states [24] [25]. A fundamental physical trade-off exists between these parameters, where increasing channel thickness to enhance transconductance simultaneously impedes ion transport kinetics, leading to slower switching speeds and reduced bandwidth [24]. This application note explores innovative device architectures and characterization methodologies to overcome these limitations, with particular emphasis on their relevance to dual-gate OECT configurations for mitigating current drift in biosensing applications.
Architectural Strategies for Performance Enhancement
Dual-Gate Architecture for Drift Mitigation
The dual-gate OECT (D-OECT) architecture presents a compelling solution for mitigating temporal current drift, a significant challenge in sensitive biosensing applications. This configuration utilizes two OECT devices connected in series, where the gate voltage is applied to the bottom of the first device and the drain voltage to the second device [1]. This design fundamentally prevents like-charged ion accumulation during measurement, thereby addressing the drift phenomenon commonly observed in control experiments without analytes present [1]. The drift phenomenon can be quantitatively explained by ion diffusion into the gate material, following first-order kinetics where the rate of ion movement from solution to bioreceptor layers (k⁺) and the reverse process (k⁻) determine the equilibrium ion partition [1]. For researchers developing biosensors for clinical applications such as protein detection in human serum, the D-OECT platform demonstrates enhanced accuracy and sensitivity compared to standard single-gate designs, maintaining performance even in complex biological fluids [1].
Table 1: Performance Comparison of OECT Architectures
| Architecture | Transconductance | Bandwidth | Response Time | Key Feature | Best Use Case |
|---|---|---|---|---|---|
| Planar OECT [24] | ~1-400 mS [26] [25] | <1 kHz [25] | ~100 μs-1 ms [26] [25] | Unidirectional ion doping | Fundamental studies, simple biosensors |
| 3D Electrolyte-Surrounded (ES) OECT [24] | Maintains high transconductance | Up to 26 kHz | <1 ms | Multidirectional ion doping, micro/nanostructured channel | High-frequency neural signal recording |
| Vertical OECT (vOECT) [27] [26] | 0.2-0.4 S [26] | - | <1 ms [26] | Ultra-short channel length (≈100 nm), high d/L ratio | Complementary logic circuits, miniaturized devices |
| Dual-Gate OECT (D-OECT) [1] | - | - | - | Drift cancellation, series configuration | Low-drift biosensing in complex fluids (e.g., human serum) |
| Fiber OECT (F-OECT) [7] | Enhanced via high W/L ratio | - | - | Textile integration, mechanical flexibility | Wearable biosensors, implantable devices |
Three-Dimensional and Vertical Architectures
Three-dimensional electrolyte-surrounded (3D ES) OECTs redefine ion transport dynamics by enabling multidirectional ion doping to the channel, facilitating efficient and rapid switching [24]. This architecture incorporates micro- or nanostructures into the channel design, allowing ions from the electrolytes to penetrate simultaneously from all directions, substantially reducing ionic diffusion pathways and expanding the channel-electrolyte interface area [24]. The resulting surface-to-volume ratio enhancement facilitates efficient ion injection, improving transient response while maintaining high transconductance. This approach has demonstrated a remarkable bandwidth of 26 kHz while preserving high transconductance using commercially available PEDOT:PSS [24].
Vertical OECT (vOECT) architectures employ a traverse design with naturally formed crossbar structures, achieving channel lengths defined by semiconductor layer thickness (40-80 nm) while maintaining channel thickness of 100 μm, resulting in an exceptionally high d/L ratio of approximately 2,000 [27]. This substantial geometric ratio produces smaller electric potential gradients along the thickness direction, preventing trapped ions from drifting out of the channel after gate voltage removal, enabling non-volatile memory behavior while maintaining volatile sensing capabilities [27]. These devices have demonstrated transconductances of 0.2-0.4 S with short transient times below 1 ms [26].
Experimental Protocols for Key Metrics Characterization
Transconductance Measurement Protocol
Purpose: To quantitatively determine the amplification capability of OECT devices by measuring transconductance (gₘ = ∂ID/∂VG).
Materials:
- OECT device with specified architecture
- Source Measure Unit (SMU) or parameter analyzer
- Electrolyte solution (e.g., phosphate-buffered saline)
- Gate electrode (Ag/AgCl recommended for stable reference)
- Faraday cage (for low-noise measurements)
Procedure:
- Connect the OECT source, drain, and gate terminals to the SMU.
- Immerse the channel and gate electrode in the electrolyte solution.
- Set drain voltage (VD) to the desired operating voltage (typically -0.6 V to -0.9 V for p-type OECTs).
- Sweep gate voltage (VG) from positive to negative values with increments of 10-50 mV.
- At each VG step, allow sufficient time (100-500 ms) for current stabilization before recording drain current (ID).
- Plot transfer curve (ID vs. VG) at constant VD.
- Calculate transconductance as gₘ = ΔID/ΔVG from the linear region of the transfer curve.
- For small-signal transconductance, superimpose a small AC signal (10-100 mV) on the DC gate bias and measure the AC component of ID.
Data Interpretation: The peak gₘ value represents the maximum amplification capability. For D-OECTs, compare gₘ stability over time between single-gate and dual-gate configurations to quantify drift mitigation [1] [25].
Bandwidth and Response Time Characterization
Purpose: To determine the frequency response and switching speed of OECT devices.
Materials:
- Function generator for gate input signals
- Oscilloscope for recording transient responses
- Bias tee (for combining DC and AC signals)
- Electrolyte environment as previously described
Procedure:
- Set the OECT to the desired operating point with DC VG and VD.
- Apply a small AC signal (10-100 mV) superimposed on the DC gate voltage.
- Sweep the frequency of the AC signal from 1 Hz to 100 kHz while monitoring the AC component of ID.
- Measure the frequency (f-3dB) at which the output current drops to 1/√2 of its low-frequency value.
- For transient response, apply a square wave pulse to the gate and measure the rise/fall time of ID.
- Calculate response time as the time required for ID to reach 90% of its final value after a gate voltage step.
Data Interpretation: The f-3dB point defines the operational bandwidth. For 3D ES OECTs, bandwidths up to 26 kHz have been demonstrated while maintaining high transconductance [24]. Response times below 1 ms have been achieved in vertical OECT architectures [26].
Table 2: Key Performance Metrics Across OECT Technologies
| Device Type | Max Transconductance | Bandwidth (f₋₃dB) | Response Time | Channel Material | Reference |
|---|---|---|---|---|---|
| Planar OECT | 4.0 mS (W=10 μm) | ~1 kHz | ~100 μs | PEDOT:PSS | [25] |
| 3D ES OECT | Maintains high gₘ | 26 kHz | - | PEDOT:PSS | [24] |
| Vertical OECT | 0.2-0.4 S | - | <1 ms | gDPP-g2T (p-type), Homo-gDPP (n-type) | [26] |
| Dual-Gate OECT | - | - | - | PT-COOH | [1] |
Contact Resistance Optimization Protocol
Purpose: To minimize contact resistance at source-drain interfaces for improved current injection and overall device performance.
Materials:
- OECT devices with and without interlayer modification
- CuxO interlayer solution (prepared via sol-gel)
- Annealing oven (200-300°C capability)
- Transfer length method (TLM) structures for quantification
Procedure:
- Deposit CuxO interlayer via sol-gel process on predefined electrode areas.
- Anneal the interlayer at varying temperatures (200-300°C) to modulate energy level alignment.
- Complete OECT fabrication with standard processes.
- Measure output characteristics (ID vs. VD) at various VG.
- Extract contact resistance using TLM structures or gated transmission line method.
- Characterize device performance metrics (gₘ, response time) with optimized contacts.
Data Interpretation: Optimized CuxO interlayers (annealed at 250°C) have demonstrated 5-fold reduction in contact resistance and order-of-magnitude higher peak currents, improving the ionic limit of detection from 10⁻⁵ M to 10⁻⁹ M [8].
The Scientist's Toolkit: Research Reagent Solutions
Table 3: Essential Materials for OECT Fabrication and Characterization
| Material/Reagent | Function | Example Applications | Key Considerations |
|---|---|---|---|
| PEDOT:PSS | p-type channel material, high conductivity | Standard OECTs, biosensors | Commercial dispersions, conductivity enhancers (DMSO, EG) |
| PT-COOH | Functionalized bioreceptor layer | IgG detection in human serum | Carboxyl groups for antibody immobilization |
| gDPP-g2T & Homo-gDPP | High-performance p-type and n-type semiconductors | Complementary circuits | Blended with Cin-Cell (9:2) for stability |
| Cinnamate-Cellulose (Cin-Cell) | Photopatternable stabilizer | Vertical OECTs | Enhances structural robustness, 9:2 blend ratio optimal |
| CuxO Interlayer | Contact resistance modulation | Interface engineering | Sol-gel processed, annealed at 250°C for optimal alignment |
| [EMIM+][TFSI−]:PVDF-HFP Ion Gel | Gate electrolyte | Non-volatile memory OECTs | Low vapor pressure, wide electrochemical window |
| Phosphate-Buffered Saline (PBS) | Aqueous electrolyte | Biosensing experiments | 1X concentration, physiological ion strength |
| Ag/AgCl Gate Electrode | Non-polarizable gate | Stable reference potential | Large capacitance compared to channel capacitance |
Implementation Considerations for Dual-Gate OECTs
Fabrication Guidelines for Dual-Gate Architectures
Implementing effective dual-gate OECTs requires specific fabrication approaches to maximize drift mitigation:
- Series Configuration: Connect two OECT devices in series with gate voltage applied to the bottom of the first device and drain voltage to the second device [1].
- Gate Functionalization: For biosensing applications, immobilize antibodies on a self-assembly monolayer on the gold gate electrode, or use PT-COOH as a bioreceptor layer for IgG detection [1].
- Geometric Considerations: Optimize channel width-to-length (W/L) ratios to balance transconductance and switching speed. Fiber-based OECTs naturally achieve higher W/L ratios through their cylindrical geometry (W = πd) [7].
- Electrolyte Compatibility: Ensure architecture functionality in target biological fluids (e.g., human serum), potentially requiring IgG-depleted serum for controlled biosensing experiments [1].
Performance Validation in Complex Fluids
For drug development professionals implementing OECT-based biosensors, validation in biologically relevant media is essential:
- Conduct control experiments in both simple buffers (PBS) and complex fluids (human serum) to quantify drift reduction [1].
- Utilize first-order kinetic models to analyze ion adsorption into gate materials, fitting experimental drift data with exponentially decaying functions [1].
- Compare limit of detection (LOD) between single-gate and dual-gate configurations in target analytes, with demonstrated improvement to single-molecule detection in optimized architectures [1].
Balancing transconductance, bandwidth, and response time in OECTs requires sophisticated architectural strategies that redefine fundamental ion transport dynamics. The dual-gate OECT architecture presents a specialized solution for drift mitigation in biosensing applications, while 3D electrolyte-surrounded and vertical architectures address the core transconductance-bandwidth trade-off through multidimensional ion doping and ultra-short channel lengths. The experimental protocols and material systems detailed in this application note provide researchers with comprehensive methodologies for developing next-generation OECTs capable of meeting the demanding requirements of advanced bioelectronic applications, particularly in pharmaceutical development and clinical diagnostics where signal stability and temporal resolution are paramount.
Benchmarking Performance: Experimental Validation of Dual-Gate vs. Single-Gate OECTs
A significant challenge in the development of robust biosensors using organic electrochemical transistors (OECTs) is the temporal drift of the electrical signal, which can compromise accuracy and reliability, especially in complex biological fluids. This application note provides a detailed, evidence-based comparison of drift reduction in phosphate-buffered saline (PBS) and human serum, contextualized within the broader research on dual-gate OECT architecture for drift mitigation. The quantitative data and standardized protocols herein are designed for researchers, scientists, and drug development professionals working on high-fidelity biosensing platforms.
The Drift Phenomenon and the Dual-Gate Solution
Origin of Signal Drift
In OECT-based biosensors, the drift phenomenon manifests as an unwanted temporal change in the output current even in the absence of a target analyte. This drift primarily originates from the non-faradaic, continuous diffusion and adsorption of ions from the electrolyte into the gate material. Research has shown that this process can be effectively modeled using first-order kinetics, where the change in ion concentration ((ca)) within the gate's bioreceptor layers is described by: [ \frac{\partial ca}{\partial t} = c0k+ - cak- ] Here, (c0) is the ion concentration in the solution, and (k+) and (k_-) are the rate constants for ion adsorption and desorption, respectively [1] [2]. This model confirms that the drift is an intrinsic property of the material-electrolyte interaction, notably observed in control experiments with only a bovine serum albumin (BSA) blocking layer present [1].
Dual-Gate OECT Architecture for Drift Mitigation
The dual-gate OECT (D-OECT) architecture presents a powerful solution to counteract this drift. This configuration employs two OECT devices connected in series. The gate voltage ((VG)) is applied to the first device, and the drain voltage ((V{DS})) is applied to the second, with transfer curves measured from the second device [1] [2]. This specific design functions by preventing the accumulation of like-charged ions during measurement, thereby neutralizing the primary source of the drift current and significantly enhancing signal stability [1].
Quantitative Head-to-Head Comparison
The following table summarizes the key performance metrics of single-gate and dual-gate OECTs in PBS buffer and human serum, providing a direct comparison of their effectiveness in drift reduction.
Table 1: Quantitative Comparison of Drift Reduction in PBS vs. Human Serum
| Performance Metric | Single-Gate OECT (S-OECT) in PBS | Dual-Gate OECT (D-OECT) in PBS | Single-Gate OECT (S-OECT) in Human Serum | Dual-Gate OECT (D-OECT) in Human Serum |
|---|---|---|---|---|
| Drift Phenomenon | Pronounced temporal current drift [1] [2] | Largely mitigated [1] [2] | Present and complicating detection [1] | Effectively canceled, enabling accurate detection [1] |
| Primary Drift Cause | Ion adsorption/desorption in gate material [1] [2] | Neutralization of like-charged ion accumulation [1] [2] | Ion interactions & complex biofouling proteins [1] | Architecture counteracts ionic drift in complex media [1] |
| Limit of Detection (LOD) | Challenged by drift [1] | Improved due to stable baseline [1] | Severely challenged by drift & background [1] | Low LOD achievable for specific binding (e.g., IgG) [1] |
| Key Evidence | First-order kinetic model fit to drift data [1] [2] | Experimental data showing drift cancellation [1] [2] | Drift observed in BSA-blocked control experiments [1] | Successful detection of human IgG in IgG-depleted serum [1] |
Detailed Experimental Protocols
Protocol 1: Fabrication of a Dual-Gate OECT (D-OECT)
This protocol outlines the steps for creating a D-OECT for drift comparison studies [1] [4].
1. Materials & Reagents:
- Channel Material: Conductive polymer solution (e.g., PEDOT:PSS).
- Substrate: Flexible or rigid substrate (e.g., glass, PET).
- Electrodes: Source, drain, and gate electrodes (e.g., Au, Pt).
- Electrolyte: Phosphate-buffered saline (PBS, 1X) or human serum (IgG-depleted for controlled studies).
- Bioreceptor: Specific biomolecules (e.g., PT-COOH polymer with immobilized IgG antibodies).
2. Fabrication Steps:
- Step 1: Patterning Electrodes. Use photolithography or screen-printing to define source, drain, and gate electrodes on the substrate.
- Step 2: Depositing Channel Material. Spin-coat or drop-cast the conductive polymer solution (e.g., PEDOT:PSS) to form the channel region bridging the source and drain electrodes. Anneal as required.
- Step 3: Constructing Dual-Gate Circuit. Connect two identical OECT devices in series. Apply the gate voltage ((VG)) to the first device and the drain voltage ((V{DS})) to the second device.
- Step 4: Functionalizing Gate Electrode. Immobilize a bioreceptor layer (e.g., PT-COOH with antibodies) or a control layer (e.g., BSA) on the gate electrode.
- Step 5: Encapsulation. Insulate all electrode contacts except for the active channel and gate areas to prevent parasitic currents [4].
3. Equipment:
- Spin coater.
- Precision source measure units (SMUs) or potentiostat.
- Probe station for electrical characterization.
Protocol 2: Quantifying Drift in PBS vs. Human Serum
This protocol describes a direct experimental method for comparing drift behavior across different media [1].
1. Reagent Preparation:
- PBS Buffer: Standard 1X phosphate-buffered saline, pH 7.4.
- Human Serum: Use IgG-depleted human serum to control the baseline concentration of the target analyte (e.g., human IgG) [1].
- Analyte Solutions: Prepare serial dilutions of the target analyte (e.g., human IgG) in both PBS and the IgG-depleted serum.
2. Experimental Workflow:
- Step 1: Baseline Measurement. Immerse the fabricated S-OECT and D-OECT in the solution (PBS or serum) without the analyte. Apply a constant (VG) and (V{DS}) while recording the channel current ((I_{DS})) over time (e.g., 30-60 minutes) to establish the baseline drift profile.
- Step 2: Analytic Introduction. Introduce a known concentration of the target analyte into the solution.
- Step 3: Signal Recording. Continuously monitor the change in (I_{DS}) over time following analyte introduction.
- Step 4: Data Analysis. For both S-OECT and D-OECT configurations, fit the baseline drift data (from Step 1) to the first-order kinetic model to extract rate constants. The signal-to-drift ratio in the presence of the analyte can then be calculated and compared.
The workflow for this comparative analysis is outlined below.
Diagram 1: Experimental Workflow for Drift Comparison
Underlying Signaling and Drift Mechanisms
The operational and drift mechanisms in OECTs are governed by ionic/electronic coupling. The following diagram illustrates the pathways for both desired sensing and undesired drift signals.
Diagram 2: Differentiating Desired Sensing and Undesired Drift Signals
The Scientist's Toolkit: Research Reagent Solutions
Table 2: Essential Materials for OECT Drift Studies
| Research Reagent / Material | Function & Rationale | Example/Note |
|---|---|---|
| PEDOT:PSS | Benchmark p-type organic semiconductor for OECT channel; offers high transconductance and stability in aqueous environments [1] [7] [4]. | Often used as the primary channel material. |
| PT-COOH | Functionalized polymer used as a bioreceptor layer on the gate electrode; allows for biomolecule immobilization [1] [2]. | Used for immobilizing IgG antibodies in human serum detection [1]. |
| IgG-Depleted Human Serum | A controlled biological fluid that minimizes interference from abundant endogenous IgG, allowing for spiking known analyte concentrations [1]. | Critical for accurate quantification in complex media. |
| Ag/AgCl Gate Electrode | A non-polarizable gate electrode providing a stable electrochemical potential, minimizing overpotential that can contribute to drift [4]. | Common reference electrode used in OECT setups. |
| BSA (Bovine Serum Albumin) | Used as a blocking agent to passivate non-specific binding sites on the gate electrode surface [1] [2]. | Essential for control experiments to study non-specific drift. |
This application note establishes that the dual-gate OECT architecture is a highly effective strategy for mitigating signal drift, delivering significantly improved performance in both simplified buffers like PBS and the complex matrix of human serum. The provided quantitative data, detailed protocols, and mechanistic insights offer a validated roadmap for researchers to implement this technology, thereby accelerating the development of reliable, high-sensitivity biosensors for diagnostic and drug development applications.
Organic Electrochemical Transistors (OECTs) have emerged as a leading platform for biosensing, capable of detecting targets from small molecules like glucose to larger proteins and even viruses [5]. Their architecture, flexibility, and intrinsic signal amplification make them particularly attractive for biomedical applications [4]. The performance of OECT-based biosensors is primarily quantified by three critical key performance indicators (KPIs): sensitivity, limit of detection (LOD), and signal stability. Achieving ultra-sensitive detection, often down to a single molecule, relies heavily on gate-functionalized OECT platforms [5]. However, these sensitive configurations are frequently plagued by a temporal drift phenomenon in the output current, which compromises signal stability and accuracy [1]. This application note details the characterization of these essential KPIs, with a specific focus on the dual-gate OECT (D-OECT) architecture—a promising solution for effective drift mitigation. The protocols herein are designed for researchers and scientists engaged in the development of robust, high-performance bioelectronic sensors for drug development and diagnostic applications.
Key Performance Indicators (KPIs) for OECT Biosensors
The following table summarizes the core KPIs essential for evaluating and benchmarking OECT biosensors.
Table 1: Key Performance Indicators for OECT Biosensors
| KPI | Description | Significance in Biosensing | Desired Outcome |
|---|---|---|---|
| Sensitivity | The change in output signal (e.g., drain current, threshold voltage) per unit change in analyte concentration. | Determines the device's ability to respond to small changes in analyte concentration, crucial for detecting low-abundance biomarkers. | A high sensitivity allows for the detection of faint biological signals and small concentration variations [28]. |
| Limit of Detection (LOD) | The lowest analyte concentration that can be reliably distinguished from a blank sample. | Defines the clinical or analytical utility of the biosensor for early disease diagnosis where biomarker concentrations are minimal. | An ultra-low LOD, potentially reaching down to the single-molecule level [5] [1]. |
| Signal Stability | The temporal robustness of the output signal in the absence of a target analyte, often quantified as "drift." | Impacts the accuracy and reliability of measurements over time. Drift can lead to false positives or inaccurate quantification. | Minimal signal drift, ensuring that the measured signal originates from specific binding events rather than non-specific system fluctuations [1]. |
The Drift Phenomenon in Single-Gate OECTs
In single-gate OECT (S-OECT) configurations, control experiments consistently reveal a temporal drift in the electrical signal even when no target analyte is present [1]. This drift poses a significant challenge for accurate biosensing. Theoretical and experimental analyses attribute the drift primarily to the diffusion and accumulation of small ions (e.g., Na⁺ and Cl⁻ in PBS buffer) from the electrolyte into the bulk of the gate material [1]. This process can be modeled using first-order kinetics, where the change in ion concentration within the gate material is governed by the rate of ion ingress from the solution and the rate of ion egress back to the solution [1].
The Dual-Gate OECT (D-OECT) Architecture for Drift Mitigation
The D-OECT configuration is a circuit-level innovation designed to address the fundamental limitation of signal drift in S-OECTs.
Architecture and Working Principle
The D-OECT platform consists of two OECT devices connected in series. The gate voltage is applied from the bottom of the first device, and the drain voltage is applied to the second device; the transfer characteristics are measured from the second device [1]. This specific design is crucial because voltage drifts occurring in the two devices are of opposite polarity relative to the measurement direction. Consequently, these drifts significantly cancel each other out, resulting in a more stable sensing signal [5] [1].
The following diagram illustrates the logical relationship between OECT architecture, ion dynamics, and the resulting KPIs, culminating in the advantage of the dual-gate design.
Diagram 1: From Architecture to Performance
Research has demonstrated the superiority of the D-OECT configuration. Studies comparing the sensitivity and stability of biosensors functionalized with different bioreceptor layers (PT-COOH, PSAA, SAL) found that the D-OECT setup not only provides a more stable sensing signal with less drift but also achieves higher sensitivity compared to the S-OECT configuration [5].
Experimental Protocols for KPI Characterization
This section provides detailed methodologies for quantifying sensitivity, LOD, and signal stability in D-OECTs.
Protocol 1: Fabrication of a Dual-Gate OECT (D-OECT)
Objective: To fabricate a D-OECT with functionalized gate electrodes for drift-resistant biosensing.
Materials:
- See "Research Reagent Solutions" (Section 6).
- ITO-coated PET substrate.
- P3HT solution in chlorobenzene (10 mg/mL).
- Bioreceptor polymer (e.g., PT-COOH) for gate functionalization.
- UV-Ozone cleaner.
Procedure:
- Substrate Cleaning: Submerge the OECT devices (with pre-patterned electrodes) in isopropanol for 15 minutes, dry with a nitrogen stream, and treat with UV-ozone for 30 minutes [5].
- Channel Formation: Spin-coat the filtered P3HT solution onto the pre-defined channel region of the devices [5].
- Gate Electrode Functionalization:
- Option A (Polymer Layer): Spin-coat a solution of the bioreceptor polymer (e.g., PT-COOH or PSAA) onto the ITO/PET gate electrode [5].
- Option B (Self-Assembled Layer): Immerse the ITO gate electrode in a solution of the small molecule (e.g., 1,10-decanedicarboxylic acid, DDA) to form a self-assembled monolayer (SAL) [5].
- Antibody Immobilization: Immobilize the receptor antibodies (e.g., human IgG antibody) onto the functionalized gate electrode. Subsequently, incubate with a Bovine Serum Albumin (BSA) solution to form a blocking layer on any non-specific binding sites [1].
- Circuit Assembly: Connect two identically functionalized OECT devices in series to establish the D-OECT configuration, where the gate voltage is applied to the first device and the drain voltage to the second, with transfer curves measured from the second device [1].
Protocol 2: Quantifying Sensitivity and LOD
Objective: To measure the sensor's transfer characteristics and calculate its sensitivity and limit of detection for a target analyte.
Materials:
- Fabricated D-OECT biosensor.
- Phosphate-Buffered Saline (PBS) or human serum (IgG-depleted for controlled studies).
- Target analyte stock solutions (e.g., human IgG) at known concentrations.
- Semiconductor Parameter Analyzer/Source Measure Unit (SMU).
Procedure:
- Baseline Measurement: Place the D-OECT in the measurement electrolyte (e.g., 1X PBS or IgG-depleted human serum). Measure the transfer curves by sweeping the gate voltage and recording the output current (or voltage in a amplifier configuration) to establish a baseline [1] [28].
- Analyte Introduction: Introduce the target analyte (e.g., human IgG) into the electrolyte at a specific concentration. Allow the system to stabilize.
- Signal Recording: Measure the transfer curves again. The specific binding of the analyte will cause a shift in the transition voltage or a change in the output current [1] [28].
- Dose-Response Curve: Repeat steps 2-3 for a series of analyte concentrations (e.g., from 10 fM to 100 nM). For each concentration, record the shift in the key electrical parameter.
- Data Analysis:
- Sensitivity: Plot the change in the output signal against the logarithm of the analyte concentration. The sensitivity is the slope of the linear region of this curve, reported in units of [Signal] per decade (e.g., mV dec⁻¹) [28].
- Limit of Detection (LOD): Calculate the LOD using the formula LOD = 3σ / S, where σ is the standard deviation of the blank (zero analyte) signal, and S is the sensitivity of the dose-response curve [1].
Protocol 3: Assessing Signal Stability and Drift
Objective: To monitor the temporal stability of the D-OECT output and quantify the drift, comparing it to an S-OECT configuration.
Materials:
- Fabricated D-OECT and S-OECT biosensors with identical functionalization.
- PBS buffer or human serum.
- SMU for continuous monitoring.
Procedure:
- Control Experiment Setup: Place the D-OECT biosensor in the measurement electrolyte without the presence of the target analyte. A control with only a BSA blocking layer (no antibodies) can be used to study non-specific drift [1].
- Long-Term Monitoring: Apply a constant gate voltage and record the output current over an extended period (e.g., 1-2 hours).
- Data Modeling: Fit the recorded temporal current data to a first-order kinetic model of ion adsorption:
∂c_a/∂t = c_0k_+ - c_ak_-wherec_ais the ion concentration in the gate material,c_0is the ion concentration in the solution, andk_+andk_-are the rate constants for ion ingress and egress, respectively [1]. - Comparative Analysis: Repeat the experiment using an identical S-OECT under the same conditions.
- Drift Quantification: Compare the magnitude of current drift and the goodness-of-fit of the kinetic model for both configurations. The D-OECT is expected to show a significantly flatter current transient, confirming effective drift mitigation [1].
Results and Data Interpretation
The following table provides a template for summarizing the quantitative results from the KPI characterization experiments, facilitating direct comparison between S-OECT and D-OECT performances.
Table 2: KPI Comparison Template: S-OECT vs. D-OECT
| Bioreceptor Layer | Architecture | Sensitivity (mV/decade) | LOD (Molar) | Drift Rate (pA/min or %/hr) | Key Findings |
|---|---|---|---|---|---|
| PT-COOH | S-OECT | Record measured values and observations here. | |||
| PT-COOH | D-OECT | E.g., ">2x higher sensitivity and significantly reduced drift vs. S-OECT" [5] [1]. | |||
| PSAA | S-OECT | ||||
| PSAA | D-OECT | ||||
| SAL (DDA) | S-OECT | ||||
| SAL (DDA) | D-OECT |
Interpreting Results in Complex Fluids: A critical step in validation is testing the D-OECT in human serum. The presence of countless biomolecules and ions can exacerbate drift and fouling. Successful performance is indicated by the D-OECT's ability to maintain a low LOD and minimal drift in this complex medium, as demonstrated by specific binding detection in IgG-depleted human serum [1].
The Scientist's Toolkit: Research Reagent Solutions
Table 3: Essential Materials for D-OECT Fabrication and Functionalization
| Reagent / Material | Function / Role in the Experiment | Example & Notes |
|---|---|---|
| P3HT (p-type) | Channel Material: Organic semiconductor that transports electronic charge; its doping state is modulated by ions from the electrolyte. | Poly(3-hexylthiophene-2,5-diyl). A widely used p-type material for OECT channels [5] [1]. |
| PT-COOH | Bioreceptor Layer: Functional polymer on the gate electrode; provides carboxyl groups for covalent immobilization of receptor biomolecules. | Poly [3-(3-carboxypropyl)thiophene-2,5-diyl]. A p-type semiconducting polymer that allows bulk ion penetration [5]. |
| PSAA | Bioreceptor Layer: Alternative functional polymer; an insulator where biomolecule interaction primarily causes an interfacial voltage change. | Poly(styrene–co–acrylic acid). Used to compare the effect of material properties on sensitivity and drift [5]. |
| DDA | Bioreceptor Layer: Small molecule for forming an ultra-thin, ordered self-assembled layer (SAL) on the gate electrode. | 1,10-Decanedicarboxylic acid. Used to create oriented carboxylic acid groups, improving surface voltage changes [5]. |
| IgG-depleted Human Serum | Complex Biological Medium: A controlled matrix for testing biosensor performance in a physiologically relevant environment. | Allows for spiking known concentrations of human IgG without interference from native IgG, ensuring accurate LOD determination [1]. |
| Ion Gel / Aqueous Electrolyte | Gate Coupling Medium: Facilitates ionic transport and coupling between the gate electrode and the channel. | [EMIM+][TFSI−]:PVDF-HFP ion gel or PBS buffer. The electrolyte choice affects device operation and stability [27]. |
Validating novel biosensing technologies in biologically complex, real-world environments is a critical final step in translational research. For biosensors based on organic electrochemical transistor (OECT) architecture, mitigating signal drift—a persistent challenge caused by non-specific binding and ion diffusion in complex fluids—is paramount for achieving clinical and analytical utility [3]. This application note provides detailed case studies and protocols demonstrating the real-world validation of a dual-gate OECT architecture specifically designed for drift mitigation. The documented experiments showcase its superior performance in human serum for protein detection and the parallel use of advanced tools for real-time neurotransmitter monitoring in neuroscience.
The following experimental workflow outlines the key stages from sensor functionalization to data analysis, as detailed in the subsequent case studies.
Case Study 1: Protein Detection in Human Serum Using Dual-Gate OECT
Background & Experimental Aim
The objective was to quantify the performance enhancement of a dual-gate OECT (D-OECT) platform over a standard single-gate configuration (S-OECT) for the detection of human Immunoglobulin G (IgG) in human serum [2]. A key metric for assessment was the mitigation of temporal current drift, a phenomenon that severely compromises accuracy in complex biological fluids [3].
Key Experimental Findings & Quantitative Data
The D-OECT architecture successfully mitigated the signal drift observed in S-OECTs, leading to more reliable detection in human serum. The following table summarizes the key quantitative findings from this study.
Table 1: Performance comparison of single-gate (S-OECT) and dual-gate (D-OECT) biosensors in human serum.
| Performance Parameter | S-OECT Configuration | D-OECT Configuration | Measurement Context |
|---|---|---|---|
| Drift Phenomenon | Significant temporal current drift [2] | Largely mitigated [2] | In human serum [2] |
| Drift Cause | Ion adsorption/diffusion into gate material [3] | Compensated by series configuration [2] | Modeled by first-order kinetics [3] |
| Detection Sensitivity | Accurate detection compromised by drift [2] | Increased accuracy and sensitivity [3] | Specific binding in human serum [3] |
| Limit of Detection (LOD) | Ultra-low LOD possible but unstable [5] | Low LOD maintained reliably [3] | IgG detection [2] |
Detailed Protocol: D-OECT Fabrication & IgG Detection
Title: Protein Detection in Human Serum Using a Dual-Gate OECT Biosensor. Objective: To detect human IgG in IgG-depleted human serum with high accuracy and minimal signal drift. Materials: See Section 5, "Research Reagent Solutions," for a detailed list.
Experimental Workflow:
Gate Electrode Functionalization:
- Clean ITO/PET gate electrodes with isopropanol and treat with UV-ozone for 30 minutes [5].
- Prepare a solution of the bioreceptor polymer (e.g., PT-COOH) in a suitable solvent (e.g., DMF) [5].
- Spin-coat the polymer solution onto the gate electrode to form a thin, uniform film [5].
- Immobilize human IgG antibodies onto the functionalized gate surface to create the bioreceptor [2].
OECT Device Configuration:
- S-OECT Setup: Use a standard three-terminal OECT cell with the functionalized gate as the only gate electrode [2].
- D-OECT Setup: Connect two OECT devices in series. Apply the gate voltage (VG) to the first device and the drain voltage (VDS) to the second device. Measure the transfer curves from the second device [2].
Sample Preparation & Measurement:
- Prepare a dilution series of human IgG antigen in PBS and in IgG-depleted human serum [2].
- Immerse the functionalized gate electrode in the sample solution (PBS or serum).
- Apply a constant VDS and sweep VG while recording the drain current (ID). Monitor ID over time at a fixed voltage to assess drift.
Data Analysis:
- Plot transfer curves (ID vs. VG) for different analyte concentrations.
- Quantify signal drift in S-OECT and D-OECT by monitoring I_D over time in a control solution (e.g., PBS with BSA).
- Calculate the limit of detection (LOD) from the calibration curve of signal response versus IgG concentration.
Case Study 2: Real-Time Monitoring of Neurotransmitter Dynamics
Background & Experimental Aim
Understanding neurochemical signaling in real-time is vital for neuroscience and psychiatric research. This case study highlights two complementary approaches for monitoring neurotransmitters: one using genetically encoded sensors in animal models to study behavior and drug effects, and another using an advanced electrochemical coating for direct measurement in the brain [29] [30].
Key Experimental Findings & Applications
These tools are revealing fundamental neurochemical mechanisms underlying behavior and disease, offering insights that are not possible with traditional methods.
Table 2: Applications and findings from real-time neurotransmitter monitoring technologies.
| Monitoring Technology | Key Applications & Findings | Experimental Model | Reference |
|---|---|---|---|
| Genetically Encoded Sensors (e.g., dLight, iGluSnFR, GRAB5HT) | • Revealed strengthened cortical connections in a depression model and their restoration post-ketamine [29].• Showed heroin use alters dopamine reward circuits [29].• Identified serotonin levels in dorsal striatum inversely correlate with compulsive cocaine seeking [29]. | Mice, Rats, Zebrafish [29] | [29] |
| Advanced Carbon-Coated Electrodes | • Enabled simultaneous measurement of electrochemical (dopamine) and electrophysiological (high-gamma) activity, revealing a strong correlation [30].• Scalable to high-density arrays for greater spatial coverage [30]. | In vivo neuronal sensing [30] | [30] |
Detailed Protocol: Neurotransmitter Dynamics with Genetically Encoded Sensors
Title: Monitoring Neurotransmitter Release in Freely Behaving Animals Using Genetically Encoded Sensors and Fiber Photometry. Objective: To measure spatiotemporal dynamics of specific neurotransmitters (e.g., dopamine) in response to stimuli or drug administration. Materials: Genetically encoded sensor (e.g., dLight for dopamine), viral vector (e.g., AAV), stereotaxic surgery equipment, fiber optic cannula, fiber photometry system, behavioral apparatus.
Experimental Workflow:
Sensor Expression:
- Use a cell-type specific promoter to package the gene for the sensor (e.g., GRABDA) into an adeno-associated virus (AAV) [29].
- Perform stereotaxic surgery on the animal (e.g., mouse) to inject the AAV into the target brain region (e.g., dorsomedial striatum) [29].
- Implant an optical fiber cannula above the injection site for light delivery and collection.
Fiber Photometry Recording:
- After a suitable period for sensor expression (e.g., 2-4 weeks), connect the implanted fiber to the fiber photometry system.
- Measure fluorescence changes in the sensor as the animal engages in a behavioral task (e.g., a place preference test for drug abuse studies) [29].
Data Acquisition & Analysis:
- Record fluorescence signals (typically at sub-second resolution) synchronized with behavioral video tracking [29].
- Normalize the fluorescence signal (ΔF/F) to represent changes in neurotransmitter concentration.
- Align neurochemical data with behavioral events (e.g., entry into a drug-paired chamber) using software like DeepLabCut to establish precise correlations [29].
The logical relationship between a stimulus, the neural response, and the measured signal in this protocol is summarized below.
Discussion & Integrated Analysis
The case studies demonstrate a powerful trend in biosensing: leveraging innovative hardware design and molecular tools to overcome the fundamental challenge of measuring specific signals within biological noise. The D-OECT's dual-gate architecture directly addresses the physicochemical problem of ion-driven drift in complex media like serum [3] [2]. Similarly, the specificity of genetically encoded sensors comes from their precise targeting to cell types and circuits, effectively filtering out irrelevant neurochemical noise [29]. The convergence of these approaches is pushing the boundaries of what is measurable in real-time, in real-world biological environments.
For drug development professionals, these technologies offer a path to de-risking clinical translation. The ability to profile a lead therapeutic candidate's effect on protein biomarkers in clinically relevant samples (serum) or on functional neurochemical dynamics in preclinical models provides invaluable data for understanding mechanism of action and safety, ultimately leading to more informed and successful development pipelines [31] [29].
The Scientist's Toolkit: Research Reagent Solutions
Table 3: Essential materials and reagents for conducting OECT and neurotransmitter sensing experiments.
| Item Name | Function / Application | Specific Example |
|---|---|---|
| PT-COOH Polymer | A p-type semiconducting polymer used as a bioreceptor layer on OECT gate electrodes; its carboxylic acid groups allow for antibody immobilization [5]. | Poly [3-(3-carboxypropyl)thiophene-2,5-diyl] regioregular [5] |
| PEDOT:PSS | A conductive polymer commonly used as the channel material in OECTs due to its high transconductance and stability in aqueous environments [2]. | Poly(3,4-ethylenedioxythiophene) doped with poly(styrene sulfonate) [2] |
| IgG-depleted Human Serum | A controlled biological fluid used for calibration and testing to ensure the baseline human IgG concentration is known and does not interfere with the assay [2]. | Used for detecting human IgG [2] |
| Genetically Encoded Sensors | Fluorescent protein-based tools that change intensity upon binding a specific neurochemical, enabling real-time monitoring in vivo [29]. | dLight (dopamine), iGluSnFR (glutamate), GRAB5HT (serotonin) [29] |
| AAV Vectors | Viral vectors used to deliver genes encoding genetically encoded sensors to specific neuronal populations in the brain [29]. | Adeno-associated virus with cell-type specific promoter [29] |
Organic Electrochemical Transistors (OECTs) represent a rapidly advancing class of devices that efficiently transduce biological signals into electronic readouts, making them ideal for biosensing, neuromorphic computing, and in vivo monitoring [20]. A significant barrier to their widespread adoption, particularly for long-term or high-accuracy applications, is signal drift and instability. These phenomena are often linked to non-ideal operational conditions that prevent the sensing interface from reaching thermodynamic equilibrium [32]. For research focused on dual-gate architectures for drift mitigation, understanding and quantifying these failure modes is the first step toward developing more robust solutions. This document provides detailed application notes and experimental protocols for rigorously assessing the long-term stability and operational robustness of OECTs, with a special emphasis on configurations that enhance accuracy.
Quantitative Stability Performance of OECT Architectures
The performance and stability of OECTs can vary significantly based on their material composition, architecture, and operational mode. The following table summarizes key metrics reported in recent literature for different device types.
Table 1: Performance and Stability Metrics of Various OECT Types
| Device Type / Material | Key Stability / Performance Metric | Reported Value | Test Conditions |
|---|---|---|---|
| Stencil-Printed OECT [33] | Signal-to-Noise Ratio (DC mode) | 40 dB | Operation in aqueous electrolyte |
| N-type OECT (p(gNDI-gT2)) [34] | Operational Stability in Water | Stable for 2 hours under continuous cycling | 0.1 M NaCl aqueous solution |
| Ambipolar OECT (p(gNDI-gT2)) [34] | Electrochemical Bandgap / Stability | Bandgap: 0.71 eV; Reversible over 40 cycles | CV in PBS under ambient conditions |
| Potentiometric-OECT (pOECT) [32] | Sensing Accuracy & Response | Higher than conventional OECT & 2-electrode setup | Na+, Cl⁻, H⁺ sensing |
Experimental Protocols for Stability Assessment
Protocol: Baseline Characterization of OECT Steady-State Performance
This protocol establishes the foundational performance metrics of an OECT prior to long-term stability testing.
1. Key Research Reagent Solutions
- Channel Material (P-type): Poly(3,4-ethylenedioxythiophene):Poly(Styrene Sulfonate) (PEDOT:PSS). Function: Serves as the primary mixed ionic-electronic conductor in depletion-mode OECTs [20].
- Channel Material (N-type): p(gNDI-gT2) polymer. Function: An n-type semiconducting polymer enabling accumulation-mode OECT operation; its polar glycol side chains facilitate ion transport and stability in water [34].
- Electrolyte: Phosphate Buffered Saline (PBS) or 0.1 M Sodium Chloride (NaCl). Function: Provides the ionic medium for gating the transistor and is relevant for bioelectronic applications [34].
- Gate Electrode: Gold (Au) or Platinum (Pt) electrodes. Function: Serves as the gate/sensing interface; can be functionalized with recognition elements [32].
2. Methodology 1. Device Preparation: Fabricate OECT on a chosen substrate (e.g., flexible plastic, glass). The active channel (e.g., PEDOT:PSS or n-type polymer) should be patterned between source and drain electrodes. A gate electrode (e.g., Au wire) is immersed in the electrolyte. 2. Electrolyte Introduction: Place a droplet of or submerge the device in the chosen electrolyte (e.g., 0.1 M NaCl). 3. Output Characteristics: Sweep the drain-source voltage (VDS) from 0 V to a predetermined maximum (e.g., -0.6 V for PEDOT:PSS) while stepping the gate-source voltage (VGS) from 0 V to a positive maximum (e.g., +0.6 V). Measure the resulting drain current (ID) at each point. 4. Transfer Characteristics: At a fixed VDS (e.g., -0.6 V), sweep VGS and measure ID. From this curve, extract the transconductance (gm = ∂ID/∂VGS), which is a measure of amplification capability, and the threshold voltage (VT). 5. Switching Speed: Apply a square-wave pulse to the gate and measure the time it takes for the drain current to reach 90% of its final value (response time, τ) and to return to 10% (recovery time).
Protocol: Accelerated Long-Term Operational Cycling
This test assesses device robustness and signal drift under continuous operation, simulating extended use.
1. Methodology 1. Baseline Measurement: Using the transfer characteristic protocol, record the initial VT and ID at a specific bias point. 2. Cycling Parameters: Set up a potentiostat or source measure unit to apply a continuous series of gate voltage pulses (e.g., square wave between 0 V and an operating voltage, at a frequency of 0.1 Hz) while maintaining a constant VDS. 3. Monitoring: Record the ID waveform over time. A common test duration is 2 hours of continuous cycling, as demonstrated in foundational n-type OECT studies [34]. 4. Data Analysis: Plot ID,ON and ID,OFF as a function of cycle number or time. Calculate the percentage drift of these parameters from their initial values. Monitor for any permanent degradation or failure.
Protocol: Evaluating the Potentiometric-OECT (pOECT) Configuration
This advanced protocol configures the OECT to maintain the sensing electrode under open-circuit potential (OCP) conditions, a critical factor for improving accuracy and reducing drift in potentiometric sensing [32].
1. Methodology 1. Device Reconfiguration: Modify the standard 3-terminal OECT setup by splitting the gate into two separate electrodes. * Sensing Gate (GS): This is the functionalized electrode (e.g., an ion-selective membrane) whose potential is sensitive to the target analyte. It is connected to the RE2 port of the potentiostat. * Gating Gate (GG): This is an inert counter electrode (e.g., Pt coil or Au) responsible for applying the doping voltage to the channel. It is connected to the CE2 port. The source (S) is connected to the working electrode (WE2) port. This is the "gate-referenced" configuration [32]. 2. OCP Verification: With the GS under OCP conditions, apply VSG between the Source (WE2) and the Gating Gate (CE2). The GS (RE2) now acts as a reference, ensuring its electrochemical potential is stable and not perturbed by applied currents. 3. Sensing Experiment: * Immerse the pOECT in the electrolyte. * While applying a constant VSG and VDS, monitor ID. * Introduce changes in analyte concentration (e.g., vary pH or ion concentration). * The change in the electrochemical potential of the GS will modulate ID, providing an amplified and more stable readout of the potentiometric signal compared to a conventional OECT [32].
Visualization of Dual-Gate OECT Operational Principle
The following diagram illustrates the operational principle and ion transport mechanism in a fibre-based OECT, which shares geometric similarities with advanced dual-gate concepts, highlighting the path to improved stability.
Essential Research Reagent Solutions for OECT Fabrication and Testing
A successful stability study requires carefully selected materials. The following table details key reagents and their functions.
Table 2: Essential Research Reagents for OECT Stability Studies
| Reagent / Material | Function / Rationale | Specific Example / Note |
|---|---|---|
| PEDOT:PSS | The benchmark p-type channel material for depletion-mode OECTs. High initial conductivity, modulated by cation incorporation [20]. | Commercial dispersions (e.g., Clevios). Annealing temperature and time are critical for performance [33]. |
| N-type Polymers (e.g., p(gNDI-gT2)) | Enable accumulation-mode OECTs and complementary circuits. Glycol-based side chains are essential for ion transport and aqueous stability [34]. | Designed for high electron affinity and low ionization potential to allow reversible reduction in water [34]. |
| Ion-Selective Membranes | Coated on the gate electrode to create potentiometric sensors for specific ions (Na+, K+, Ca²⁺, etc.), used in pOECT configuration [32]. | Allows for the translation of specific biochemical activity into an electronic signal. |
| Aqueous Electrolytes (PBS, NaCl) | The standard ionic medium for testing bioelectronic relevance. Composition can significantly impact device stability and electrochemical window [34]. | 0.1 M NaCl or Phosphate Buffered Saline (PBS) are commonly used to mimic physiological conditions [34]. |
Conclusion
The dual-gate OECT architecture represents a significant leap forward in overcoming the persistent challenge of signal drift, transforming OECTs into reliable tools for high-precision biosensing. By leveraging a foundational understanding of ion kinetics and a methodical design that cancels out drift, D-OECTs deliver validated performance superior to single-gate designs, particularly in complex media like human serum. Future directions should focus on the integration of novel materials and further architectural innovations, such as 3D electrolyte-surrounded channels, to push the boundaries of transconductance and speed. The ongoing optimization and validation of these devices pave the way for their imminent application in next-generation point-of-care diagnostics, real-time biomarker monitoring, and advanced drug development processes, ultimately bridging the gap between laboratory research and clinical implementation.
References
- 1. A Study of the Drift Phenomena of Gate-Functionalized ... [https://pmc.ncbi.nlm.nih.gov/articles/PMC11013244/]
- 2. A Study of the Drift Phenomena of Gate-Functionalized ... [https://www.mdpi.com/1420-3049/29/7/1459]
- 3. A Study of the Drift Phenomena of Gate-Functionalized ... [https://pubmed.ncbi.nlm.nih.gov/38611739/]
- 4. A guide for the characterization of organic electrochemical ... [https://pubs.rsc.org/en/content/articlehtml/2023/cs/d2cs00920j]
- 5. Sensitive organic electrochemical transistor biosensors [https://www.sciencedirect.com/science/article/abs/pii/S095656632200731X]
- 6. Peculiar transient behaviors of organic electrochemical ... [https://www.nature.com/articles/s41467-023-42840-z]
- 7. Fiber-based organic electrochemical transistors for re- ... [https://www.nature.com/articles/s41528-025-00488-3]
- 8. Modulating contact resistance of organic electrochemical ... [https://pubs.rsc.org/en/content/articlehtml/2025/nr/d5nr01692d]
- 9. Biomolecule sensors based on organic electrochemical ... [https://www.nature.com/articles/s41528-025-00383-x]
- 10. Experimental design of stencil-printed high-performance ... [https://pmc.ncbi.nlm.nih.gov/articles/PMC10711736/]
- 11. Stretchable all-gel organic electrochemical transistors [https://www.nature.com/articles/s41467-025-59240-0]
- 12. Processing of organic electrochemical transistors [https://link.springer.com/article/10.1557/s43579-024-00521-y]
- 13. Solid-state organic electrochemical transistors (OECTs) based ... [https://pubs.rsc.org/en/content/articlehtml/2025/ta/d4ta05288a]
- 14. Dual-liquid-gated electrochemical transistor and its ... [https://www.sciencedirect.com/science/article/abs/pii/S2211285521003724]
- 15. An Organic Electrochemical Transistor-Based Sensor for ... [https://www.mdpi.com/2079-6374/14/4/207]
- 16. Cross-comparison study of three ELISA methodologies to ... [https://pubmed.ncbi.nlm.nih.gov/40951974/]
- 17. IgG detection in human serum employing non- ... [https://www.sciencedirect.com/science/article/pii/S2949829525000683]
- 18. Biological Applications of Organic Electrochemical ... [https://pmc.ncbi.nlm.nih.gov/articles/PMC6514146/]
- 19. Fully 3D-printed organic electrochemical transistors [https://www.nature.com/articles/s41528-023-00245-4]
- 20. Fibre-based organic electrochemical transistors: principle, ... [https://www.nature.com/articles/s41528-025-00417-4]
- 21. Flexible switch matrix addressable electrode arrays with ... [https://www.nature.com/articles/s41467-023-44024-1]
- 22. Monolithically integrated high-density vertical organic ... [https://pmc.ncbi.nlm.nih.gov/articles/PMC11326712/]
- 23. Spatial control of doping in conducting polymers enables ... [https://www.nature.com/articles/s41467-024-55284-w]
- 24. Addressing transconductance-bandwidth trade-off by three ... [https://pmc.ncbi.nlm.nih.gov/articles/PMC12466912/]
- 25. High transconductance organic electrochemical transistors [https://www.nature.com/articles/ncomms3133]
- 26. Vertical organic electrochemical transistors for ... [https://www.nature.com/articles/s41586-022-05592-2]
- 27. An organic electrochemical transistor for multi-modal ... [https://www.nature.com/articles/s41928-023-00950-y]
- 28. Multiscale real time and high sensitivity ion detection with ... [https://www.nature.com/articles/s41467-020-17547-0]
- 29. Applications of functional neurotransmitter release imaging ... [https://pmc.ncbi.nlm.nih.gov/articles/PMC11525779/]
- 30. Dartmouth Research Team Develops New Method… [https://engineering.dartmouth.edu/news/research-team-develops-new-method-to-measure-neurotransmitters-in-real-time]
- 31. Protein Assays in the Real World: 5 Uses You'll Actually ... [https://www.linkedin.com/pulse/protein-assays-real-world-5-uses-youll-actually-see-2025-ncs5f/]
- 32. Reconfiguration of organic electrochemical transistors for ... [https://www.nature.com/articles/s41467-024-50792-1]
- 33. Experimental design of stencil-printed high-performance ... [https://pubs.rsc.org/en/content/articlelanding/2023/ma/d3ma00888f]
- 34. N-type organic electrochemical transistors with stability in ... [https://www.nature.com/articles/ncomms13066]