Electrochemical Impedance Spectroscopy for Virus Detection: A Comprehensive Guide for Researchers
This article provides a detailed examination of Electrochemical Impedance Spectroscopy (EIS) as a powerful, label-free technique for viral pathogen detection.
Electrochemical Impedance Spectroscopy for Virus Detection: A Comprehensive Guide for Researchers
Abstract
This article provides a detailed examination of Electrochemical Impedance Spectroscopy (EIS) as a powerful, label-free technique for viral pathogen detection. Tailored for researchers, scientists, and drug development professionals, it covers the foundational principles of EIS, explores its methodological applications in developing sensitive biosensors for viruses like SARS-CoV-2 and influenza, and addresses key challenges in optimization and real-world deployment. The content further offers a critical validation of EIS against other biosensing platforms and discusses future trajectories, including multiplexed diagnostics and integration with artificial intelligence, underscoring EIS's transformative potential in biomedical research and clinical diagnostics.
The Principles and Promise of EIS in Virology
Electrochemical Impedance Spectroscopy (EIS) is a powerful analytical technique used to study the electrical properties of interfaces and processes in electrochemical systems. Unlike direct current (DC) techniques, EIS applies a small-amplitude sinusoidal alternating current (AC) perturbation across a wide range of frequencies and measures the system's response. This approach provides detailed information about interface structures, reaction mechanisms, and mass transport phenomena that are often inaccessible through other electrochemical methods. The technique's strength lies in its ability to probe multiple processes simultaneously by distinguishing their characteristic time constants through frequency dispersion.
In the context of virus detection and biosensing, EIS has emerged as a premier label-free detection method, enabling the direct measurement of bio-recognition events without requiring fluorescent or enzymatic tags. When a pathogen such as a virus binds to a bioreceptor immobilized on an electrode surface, it alters the local electrical properties at the electrode-electrolyte interface. These changes manifest as modifications to impedance parameters, allowing for highly sensitive detection of biological interactions. The non-destructive nature of EIS measurements further permits real-time monitoring of binding kinetics, making it invaluable for both fundamental studies and diagnostic applications in biomedical research and drug development.
Fundamental Theory and Basic Concepts
Electrical Impedance Concept
Impedance (Z) represents the extension of resistance to AC circuits and measures the opposition a circuit presents to the flow of alternating current. While resistance (R) applies specifically to DC circuits following Ohm's Law (E = I × R), impedance incorporates both magnitude and phase shift between voltage and current waveforms. The mathematical relationship for impedance is analogous to Ohm's Law: E = I × Z, where E is the time-varying potential, I is the time-varying current, and Z is the impedance.
In an EIS experiment, a sinusoidal potential E(t) = E₀·sin(ωt) is applied to the electrochemical system, where E₀ is the potential amplitude, ω is the radial frequency (ω = 2·π·f), and t is time. The system responds with a current I(t) = I₀·sin(ωt + Φ) at the same frequency but shifted in phase by an angle Φ. The impedance is then calculated as a complex function: Z(ω) = E(ω)/I(ω) = Z₀(cosΦ + i·sinΦ), where Z₀ is the impedance magnitude [1].
EIS Measurement Setup
A typical EIS experiment requires a three-electrode system consisting of:
- Working electrode: Where the bio-recognition element is immobilized and the interfacial phenomenon of interest occurs
- Reference electrode: Maintains a stable potential reference point
- Counter electrode: Completes the electrical circuit and carries current
The measurement is performed using a potentiostat capable of frequency response analysis. The instrument applies AC signals with constant amplitude but varying frequencies, typically ranging from millihertz to megahertz, and measures the resulting current response. For each frequency point, the instrument determines the impedance magnitude |Z| and phase shift Φ, which are then used to calculate the real (Zʀₑ) and imaginary (Zᵢₘ) components of the complex impedance [2].
Table 1: Key Parameters in EIS Measurements
| Parameter | Symbol | Unit | Description | ||
|---|---|---|---|---|---|
| Frequency | f | Hz | Number of cycles per second | ||
| Radial Frequency | ω | rad/s | ω = 2·π·f | ||
| Impedance Magnitude | Z | Ω | Ratio of voltage amplitude to current amplitude | ||
| Phase Angle | Φ | degrees | Shift between voltage and current waves | ||
| Real Impedance | Zʀₑ | Ω | In-phase component of impedance | ||
| Imaginary Impedance | -Zᵢₘ | Ω | Out-of-phase component of impedance |
Faradaic vs. Non-Faradaic EIS
EIS operation can be categorized into two main modes based on the presence of redox species:
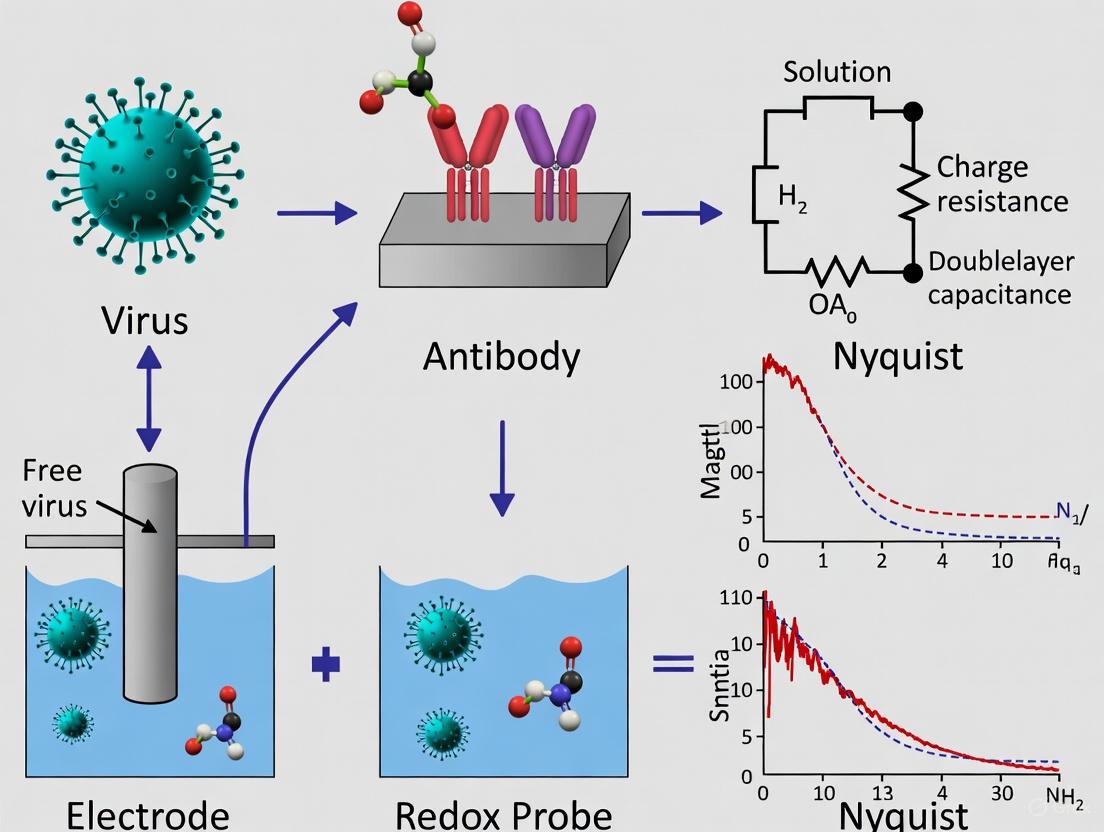
Faradaic EIS involves electron transfer across the electrode-electrolyte interface through a redox couple (e.g., [Fe(CN)₆]³⁻/⁴⁻) added to the solution. The impedance response includes contributions from both the double-layer capacitance and charge transfer resistance, making it highly sensitive to surface modifications. In biosensing, when target analytes bind to surface receptors, they inhibit the redox reaction, increasing the charge transfer resistance (R꜀ₜ), which serves as the primary detection signal [1] [3].
Non-Faradaic EIS operates without redox mediators and relies solely on changes to the electrical double-layer capacitance at the electrode-electrolyte interface. This approach simplifies measurement conditions but may offer lower sensitivity compared to Faradaic systems. The binding of target molecules alters the dielectric properties and thickness of the double layer, resulting in measurable capacitance changes [1].
Data Representation: Nyquist and Bode Plots
Nyquist Plot Representation
The Nyquist plot is the most common representation of EIS data, plotting the negative imaginary impedance (-Zᵢₘ) against the real impedance (Zʀₑ) across all measured frequencies. Each point on the Nyquist curve corresponds to the impedance at a specific frequency, with higher frequencies typically appearing on the left side and lower frequencies on the right. The resulting shape provides immediate visual information about the electrochemical system's characteristics and dominant processes.
For a simple Randles circuit model, the Nyquist plot appears as a semicircular region at higher frequencies followed by a linear region at lower frequencies. The semicircle corresponds to kinetic control (charge transfer resistance), while the linear portion represents diffusional control (Warburg impedance). The diameter of the semicircle equals the charge transfer resistance (R꜀ₜ), a crucial parameter in biosensing applications as it increases proportionally with target analyte binding to the electrode surface [1].
Bode Plot Representation
The Bode plot presents impedance data in two separate graphs: log |Z| versus log f and phase angle Φ versus log f. This representation offers several advantages, including easy determination of frequency values and clear visualization of how impedance magnitude and phase vary with frequency.
In the Bode magnitude plot, different regions correspond to specific circuit elements: resistive behavior appears as horizontal plateaus, capacitive behavior as slopes of -1, and diffusional processes as slopes of -0.5. The Bode phase plot reveals the number of time constants in the system through distinct peaks. For capacitive systems like passive films or coating layers, phase angles approaching -90° indicate nearly ideal capacitive behavior, while lower absolute values suggest resistive contributions or leakage [1] [2].
Table 2: Comparison of Nyquist and Bode Plots
| Feature | Nyquist Plot | Bode Plot | ||
|---|---|---|---|---|
| Axes | -Zᵢₘ vs. Zʀₑ | log | Z | vs. log f & Φ vs. log f |
| Frequency Information | Implicit (not directly visible) | Explicit (directly visible) | ||
| Dominant Processes | Easily identifiable through shape | Identifiable through slopes and peaks | ||
| Data Fitting | More intuitive for equivalent circuits | Requires both magnitude and phase | ||
| Common Applications | Resistive processes analysis | Capacitive systems evaluation |
Equivalent Circuit Modeling
Electrochemical processes are commonly interpreted using equivalent circuit models comprising electrical elements that represent physical processes. The Randles circuit serves as the fundamental model for many electrochemical interfaces, consisting of:
- Solution resistance (Rₛ): Resistance of the electrolyte between working and reference electrodes
- Double-layer capacitance (C𝒹ₗ): Capacitance arising from charge separation at the electrode-electrolyte interface
- Charge transfer resistance (R꜀ₜ): Resistance to electron transfer across the interface
- Warburg impedance (W): Resistance due to mass transport (diffusion) of redox species
Equivalent Circuit Model of a Simple Electrochemical Interface
In biosensing applications, the charge transfer resistance (R꜀ₜ) serves as the most sensitive indicator of biorecognition events. When target molecules bind to surface-immobilized receptors, they create a barrier that hinders electron transfer between the electrode and redox probes in solution, resulting in increased R꜀ₜ values that correlate with target concentration [1] [3].
EIS in Virus Detection Research: Protocols and Applications
EIS-Based Aptasensor for Virus Detection: Experimental Protocol
The following protocol outlines the development of an EIS-based aptasensor for detecting viral antigens, adapted from recent research on SARS-CoV-2 detection [4] [5]:
Materials and Reagents:
- Screen-printed gold electrodes (SPGE)
- Thiolated aptamers specific to target viral antigen
- Tris(2-carboxyethyl)phosphine hydrochloride (TCEP) for aptamer reduction
- 6-mercapto-1-hexanol (MCH) for surface blocking
- Potassium ferrocyanide/ferricyanide redox probe ([Fe(CN)₆]³⁻/⁴⁻)
- Phosphate buffered saline (PBS), pH 7.4
- Target viral antigens and control proteins
- Human serum for spiking experiments
Procedure:
Electrode Pretreatment: Clean SPGEs electrochemically by cycling in 0.5 M H₂SO₄ from 0 to +1.5 V until stable cyclic voltammograms are obtained.
Aptamer Functionalization:
- Reduce thiolated aptamers (1 µM) in 10 mM TCEP for 1 hour
- Incubate electrodes with reduced aptamer solution for 2-4 hours at room temperature
- Rinse thoroughly with PBS to remove unbound aptamers
Surface Blocking: Treat aptamer-modified electrodes with 1 mM MCH for 30 minutes to passivate uncovered gold surfaces and minimize non-specific binding.
Baseline EIS Measurement: Record impedance spectra in PBS containing 5 mM [Fe(CN)₆]³⁻/⁴⁻ as redox probe. Apply frequency range from 0.1 Hz to 100 kHz with 10 mV AC amplitude at formal potential of redox couple.
Antigen Incubation: Expose functionalized electrodes to sample containing target antigen for 10-15 minutes at room temperature.
Post-Incubation EIS Measurement: Record impedance spectra under identical conditions as baseline measurement.
Data Analysis: Calculate ΔR꜀ₜ (difference in charge transfer resistance) between pre- and post-incubation measurements. Plot ΔR꜀ₜ against antigen concentration to generate calibration curve.
Optimization Notes: Key parameters requiring optimization include aptamer concentration (0.5-2 µM), incubation time (5-30 minutes), redox probe concentration (1-10 mM), and pH (6.5-7.5). Each optimization should be validated through statistical analysis of replicate measurements (n ≥ 3) [4].
Research Reagent Solutions for EIS Biosensing
Table 3: Essential Research Reagents for EIS-Based Virus Detection
| Reagent/Category | Function/Purpose | Examples & Specifications |
|---|---|---|
| Biorecognition Elements | Molecular recognition of target viruses | Aptamers (KD = 6.05 nM for S-glycoprotein), antibodies, engineered receptors |
| Electrode Materials | Signal transduction platform | Screen-printed gold electrodes (SPGE), carbon electrodes, gold disk electrodes |
| Redox Probes | Enable Faradaic EIS measurements | [Fe(CN)₆]³⁻/⁴⁻ (5 mM in PBS), Ruthenium hexamine |
| Surface Linkers | Immobilize recognition elements | Thiol-gold chemistry, carbodiimide crosslinkers, silane compounds |
| Blocking Agents | Minimize non-specific binding | 6-mercapto-1-hexanol (1 mM), bovine serum albumin (1-5%), casein |
| Signal Amplifiers | Enhance detection sensitivity | Gold nanoparticles, graphene oxide, carbon nanotubes, polymer coatings |
Data Analysis and Interpretation in Biosensing
In virus detection applications, EIS data analysis focuses on quantifying changes in charge transfer resistance (R꜀ₜ) before and after antigen binding. The binding of viral particles to surface-immobilized receptors creates a physical and electrostatic barrier that hinders electron transfer between the electrode and redox species in solution, resulting in increased R꜀ₜ values.
For quantitative analysis, the normalized change in charge transfer resistance (ΔR꜀ₜ/R꜀ₜ,initial) is plotted against the logarithm of target concentration. The resulting calibration curve typically follows a sigmoidal relationship that can be linearized for determining the limit of detection (LOD). Recent studies demonstrate remarkable sensitivity, with LOD values reaching 0.319 pg/mL for SARS-CoV-2 S-glycoprotein in buffer and 1.421 pg/mL in human serum [4] [5].
EIS Workflow for Virus Detection
Advanced Applications and Emerging Trends
Machine Learning-Enhanced EIS Analysis
Recent advances integrate machine learning (ML) with EIS to improve classification accuracy and diagnostic capabilities. ML algorithms can identify subtle patterns in impedance spectra that may not be apparent through traditional equivalent circuit modeling. For virus detection, this approach enables discrimination between different pathogens or disease states based on their characteristic spectral signatures [6] [7].
In one application, deep learning convolutional neural networks (CNNs) automatically differentiated normal, potentially malignant, and malignant oral tissues using EIS measurements, achieving area under the curve (AUC) values of 0.92 with specificity of 0.95 and sensitivity of 0.84. This demonstrates the potential of EIS-ML integration for medical diagnostics, including viral infection detection [6].
Multiplexed Detection Platforms
The development of multiplexed EIS sensors enables simultaneous detection of multiple viral pathogens in a single measurement. Recent research demonstrates simultaneous detection of Mycobacterium tuberculosis and SARS-CoV-2 antigens using a dual-platform approach on screen-printed gold electrodes. Such multiplexing capabilities are crucial for differential diagnosis of infections with similar symptoms but different treatment protocols [4] [5].
Multiplexed systems typically employ array-based electrodes with different biorecognition elements immobilized on separate working electrodes. Advanced instrumentation with multi-channel capabilities allows parallel EIS measurements across all electrodes, significantly improving testing efficiency and throughput for clinical applications.
Point-of-Care EIS Devices
Integration of EIS technology with microfluidics and miniaturized electronics enables development of portable, low-cost point-of-care diagnostic devices. These systems incorporate disposable sensor chips with integrated electrodes and microfluidic channels for sample handling, coupled with compact potentiostats for impedance measurements. Such devices demonstrate potential for rapid viral detection in resource-limited settings, providing results within minutes compared to hours required for conventional PCR testing [3].
Recent innovations in this area include wireless EIS sensors that transmit data to mobile devices for analysis, further enhancing their field-deployment capabilities. These advancements position EIS as a promising technology for addressing emerging infectious disease threats through rapid, sensitive, and accessible diagnostic platforms.
Electrochemical Impedance Spectroscopy (EIS) has emerged as a powerful, label-free transduction mechanism in biosensing, offering exceptional sensitivity for detecting viral pathogens at the electrode-electrolyte interface [8]. The technique's analytical power is unlocked through equivalent circuit modeling, which translates complex electrochemical phenomena into quantifiable electrical parameters. The Randles circuit stands as the most fundamental and recognizable model for interpreting impedance spectra of faradaic reactions, providing a critical foundation for analytical insights in biosensing applications [9] [10] [11]. This application note details the theoretical principles and practical protocols for fitting the Randles circuit to extract meaningful biological data, with specific focus on virus detection research.
The Randles Circuit: Core Components and Theory
The Randles circuit models a semi-infinite, diffusion-controlled faradaic reaction at a planar electrode surface [10]. Its arrangement of circuit elements represents the key physical processes occurring at the electrochemical interface during a biorecognition event, such as the binding of a viral antigen to an immobilized aptamer.
The complete Randles circuit comprises four fundamental elements, as shown in the diagram below:
Circuit Element Definitions and Physical Significance
Table 1: Core components of the Randles equivalent circuit and their electrochemical significance.
| Circuit Element | Symbol | Physical Process | Impact on Impedance |
|---|---|---|---|
| Solution Resistance | Rₛ | Ionic resistance of the electrolyte between working and reference electrodes [9] [11]. | Independent of frequency; contributes to real impedance at all frequencies. |
| Double-Layer Capacitance | C_dl | Capacitance arising from the ionic layer at the electrode-electrolyte interface [9] [2]. | Impedance decreases with increasing frequency; manifests as negative imaginary impedance. |
| Charge Transfer Resistance | R_ct | Resistance to electron transfer during the faradaic reaction [9] [10]. | inversely proportional to reaction rate; increases when target binding blocks redox probe access. |
| Warburg Impedance | Z_w | Resistance due to diffusion of redox-active species from bulk solution to electrode surface [9]. | Exhibits 45° line in Nyquist plot at low frequencies; magnitude = A_W/√ω. |
Analytical Fitting Protocol for Virus Detection
This protocol provides a step-by-step methodology for acquiring EIS data and fitting the Randles circuit to quantify viral load, using SARS-CoV-2 detection via an aptasensor as a model system [5].
Materials and Reagents
Table 2: Essential research reagents and materials for EIS-based biosensor development and validation.
| Item | Function/Description | Example from Literature |
|---|---|---|
| Screen-Printed Electrodes | Transducer platform; can be gold (SPGE) or carbon (SPC) [5] [12]. | Screen-printed gold electrode (SPGE) for aptasensor [5]. |
| Biorecognition Elements | Molecules that selectively bind the target pathogen (e.g., aptamers, antibodies) [8]. | Thiolated aptamers targeting MPT64 (TB) and S-glycoprotein (SARS-CoV-2) [5]. |
| Redox Probe | Reversible redox couple to enable faradaic EIS measurements. | Potassium ferrocyanide/ferricyanide, [Fe(CN)₆]³⁻/⁴⁻ [5]. |
| Blocking Agents | Minimize non-specific binding on the electrode surface. | 6-mercapto-1-hexanol (MCH) or Bovine Serum Albumin (BSA) [5] [12]. |
| Target Antigens/Virions | The analyte of interest for detection and quantification. | Recombinant SARS-CoV-2 S-glycoprotein and M. tuberculosis MPT64 protein [5]. |
Step-by-Step Experimental Workflow
The following diagram outlines the complete experimental and analytical procedure:
Detailed Functionalization and Measurement Steps
Electrode Functionalization and Assay Setup
- Clean the electrode surface according to manufacturer's protocols.
- Incubate the screen-printed gold electrode (SPGE) with a solution of thiolated aptamers (e.g., 1 µM in Tris-HCl buffer with TCEP) for a specified period (e.g., 16 hours) to form a self-assembled monolayer via gold-sulfur bonds [5].
- Rinse the electrode gently with buffer to remove unbound aptamers.
- Block the remaining electrode surface by incubating with 1 mM 6-mercapto-1-hexanol (MCH) for 1 hour to passivate the surface and minimize non-specific binding [5].
- Rinse the functionalized electrode and incubate with the sample containing the target antigen (e.g., SARS-CoV-2 S-glycoprotein) for a defined period (e.g., 10 minutes) [5].
EIS Data Acquisition
- Prepare a solution containing a reversible redox probe, typically 5 mM K₃[Fe(CN)₆]/K₄[Fe(CN)₆] in PBS [5].
- Measure the EIS spectrum of the functionalized electrode after target binding in the redox probe solution.
- Instrument Settings: Apply a DC potential set to the formal potential of the redox couple (often ~0.2 V vs. Ag/AgCl for ferri/ferrocyanide) with a small AC voltage amplitude (e.g., 10 mV RMS) superimposed. Sweep the frequency across a wide range, typically from 100 kHz to 0.1 Hz, collecting 10-20 data points per frequency decade [2].
Data Validation and Pre-processing
- Visualize the acquired data in a Nyquist plot (‑Z'' vs. Z').
- Validate data quality by confirming the presence of a high-frequency semicircle (dominated by Rₛ, Cdl, and Rct) and, in some cases, a low-frequency 45° Warburg tail (indicative of diffusion control) [9] [10]. If the Warburg element is not significant, a simplified R(RC) circuit may be used.
Circuit Fitting and Data Analysis
Complex Non-Linear Least Squares (CNLS) Fitting
- Model Selection: In your EIS analysis software, select the equivalent circuit model
R_s(Q[R_ctW])as a starting point. The Constant Phase Element (CPE), denoted as 'Q', is often used instead of an ideal capacitor (C_dl) to account for surface roughness and inhomogeneity [9]. - Initial Parameter Estimates: Provide reasonable initial guesses for the fitting algorithm to improve convergence.
- Rₛ: Estimate from the high-frequency x-intercept on the Nyquist plot.
- R_ct: Estimate from the diameter of the semicircle.
- CPE and Warburg parameters can often be initially left for the algorithm to determine.
- Perform Fitting: Execute the CNLS fitting routine. The quality of fit is typically assessed by the chi-squared (χ²) value, which should be small (e.g., <10⁻³), and the visual alignment of the fitted curve with the experimental data points.
Analytical Interpretation for Virus Detection
The core analytical insight lies in correlating the fitted parameter R_ct with the target pathogen concentration. The binding of a target virus or antigen to the immobilized bioreceptor on the electrode surface creates a physical barrier, hindering the electron transfer of the redox probe. This results in an increase in the fitted R_ct value [8].
- Quantification: A calibration curve is constructed by plotting the ΔRct (or Rct) against the logarithm of the target concentration. This curve is used to interpolate the concentration of unknown samples.
- Performance Metrics: The sensitivity of the biosensor is determined from the slope of the calibration curve. The limit of detection (LoD) is calculated as the concentration corresponding to the signal of the blank plus three times its standard deviation.
Table 3: Example performance of an EIS aptasensor for simultaneous pathogen detection, demonstrating the quantitative power of the technique.
| Target Biomarker | Matrix | Linear Detection Range | Limit of Detection (LoD) |
|---|---|---|---|
| MPT64 (M. tuberculosis) | Buffer | 0.01 pg/mL - 10 pg/mL | 0.053 pg/mL [5] |
| S-glycoprotein (SARS-CoV-2) | Buffer | 0.01 pg/mL - 10 pg/mL | 0.319 pg/mL [5] |
| MPT64 (M. tuberculosis) | Human Serum | 0.01 pg/mL - 10 pg/mL | 0.085 pg/mL [5] |
| S-glycoprotein (SARS-CoV-2) | Human Serum | 0.01 pg/mL - 10 pg/mL | 1.421 pg/mL [5] |
Troubleshooting and Best Practices
- Poor Fit: If the Randles model fits poorly, consider more complex models accounting for additional phenomena like porosity, adsorption, or a second time constant.
- Low Rct Sensitivity: Optimize the density of surface-bound bioreceptors and the concentration of the redox probe to maximize the relative change in Rct upon target binding.
- High Non-Specific Signals: Ensure thorough surface blocking and include control experiments with non-complementary targets or bare electrodes to validate specificity.
- Data Quality: Always check the consistency of your data by verifying Kramers-Kronig relations or measuring replicates to ensure reliability.
Mastering the fitting of the Randles circuit is indispensable for transforming raw EIS data into precise, quantitative analytical insights for virus detection and other biosensing applications. The protocols outlined herein provide a robust framework for developing highly sensitive and label-free diagnostic tools.
Electrochemical Impedance Spectroscopy (EIS) has emerged as a powerful analytical technique in bioanalytical sciences, particularly for the detection of viral pathogens. This application note details the core operational principles, advantages, and standardized protocols for employing EIS in virus detection, framing the discussion within the context of its three key advantages: label-free detection, real-time monitoring capabilities, and high sensitivity. The content is tailored for researchers, scientists, and drug development professionals seeking to implement or optimize EIS-based biosensing platforms. The escalating threat of infectious diseases, such as COVID-19, underscores the urgent need for diagnostic tools that are not only accurate but also rapid and deployable at the point of care [8]. EIS presents a compelling alternative to conventional methods like PCR and ELISA, which, despite their accuracy, often require specialized facilities, are time-consuming, and lack suitability for real-time or decentralized testing [13] [8] [14].
Fundamental Principles of EIS in Biosensing
EIS is a non-destructive technique that probes the electrical properties of an electrochemical system by applying a small-amplitude sinusoidal alternating current (AC) voltage over a wide range of frequencies and measuring the corresponding current response [8]. The complex impedance (Z) is calculated from this excitation and response.
In a typical biosensor configuration, a biorecognition element (e.g., an antibody, DNA probe, or aptamer) is immobilized on the surface of a working electrode. When a target viral analyte binds to this receptor, it alters the interfacial properties of the electrode-electrolyte system. This change can be monitored by EIS through several parameters [8]:
- Charge Transfer Resistance (Rct): The binding of biomolecules (proteins, nucleic acids) often hinders the transfer of a redox probe (e.g., [Fe(CN)₆]³⁻/⁴⁻) to the electrode surface, leading to an increase in Rct. This is the most common parameter monitored in Faradaic EIS.
- Interfacial Capacitance: The formation of a biomolecular layer on the electrode surface can alter the dielectric properties and the thickness of the electrical double layer, resulting in a measurable change in capacitance.
The key to EIS's utility in virus detection is its exceptional sensitivity to these subtle changes occurring at the electrode interface, allowing for the direct, label-free transduction of a biorecognition event into a quantifiable electrical signal [8].
Key Advantages and Quantitative Performance
The combination of label-free operation, real-time monitoring, and high sensitivity makes EIS a uniquely powerful tool for diagnostic applications. The table below summarizes the core advantages and their practical implications for virus detection.
Table 1: Core Advantages of EIS for Virus Detection
| Advantage | Description | Impact on Viral Diagnostics |
|---|---|---|
| Label-Free Detection | Direct measurement of the binding event without the need for fluorescent, enzymatic, or radioactive labels [8] [15]. | Simplifies assay protocol, reduces cost and time, minimizes sample handling, and preserves the native state of biomolecular interactions [8]. |
| Real-Time Monitoring | Ability to continuously track binding kinetics (e.g., association/dissociation rates) as the impedance change occurs [8]. | Provides dynamic information on biomolecular interactions; enables the study of binding affinity and cellular responses over time [8] [16]. |
| High Sensitivity | Capable of detecting low concentrations of analyte by measuring minute changes at the electrode interface; can be enhanced with nanomaterials [8] [14]. | Enables early diagnosis by detecting low viral loads; allows for the measurement of biomarkers at extremely low levels in physiological samples [17] [14]. |
The performance of EIS-based biosensors is often benchmarked using key analytical figures of merit. The following table compiles data from recent research to illustrate the sensitivity and detection capabilities achievable with this technology.
Table 2: Performance Metrics of Recent EIS-Based Biosensors for Pathogen Detection
| Biorecognition Element / Target | Sensor Platform / Material | Linear Detection Range | Limit of Detection (LOD) | Reference / Context |
|---|---|---|---|---|
| RdRp gene of SARS-CoV-2 | Graphdiyne-modified disposable electrode | 10⁻⁹ M to 10⁻⁵ M | Nanomolar range | [14] |
| Ebola virus cDNA | Magnetic particles with rolling-circle amplification (RCA) | Not Specified | 200 ymol (≈120 molecules) | [13] |
| Hepatitis A virus cDNA | Thiolated DNA probe on gold electrode (SPAuE) | Not Specified | 6.94 fg µL⁻¹ | [13] |
| Pathogens (General) | EIS-based biosensors with nanomaterials | Varies by design | Enabled by "exceptionally low detection limits" | [17] [8] |
Essential Research Reagent Solutions
The development of a robust EIS-based biosensor requires a suite of key materials and reagents. The following table outlines essential components and their functions.
Table 3: Research Reagent Solutions for EIS-Based Virus Detection
| Item | Function / Application | Examples |
|---|---|---|
| Biorecognition Probes | Provides specificity by binding to the target viral analyte. | Antibodies, single-stranded DNA/RNA probes (e.g., complementary to RdRp gene [14]), aptamers [13]. |
| Electrode Materials | Serves as the solid support and transducer. | Screen-printed gold electrodes (SPAuE) [13], disposable printed electrode chips [14]. |
| Nanomaterials | Enhances electron transfer, surface area, and probe immobilization to boost sensitivity. | Graphdiyne [14], gold nanoparticles, carbon nanotubes [13], graphene [13]. |
| Redox Probes | Enables Faradaic impedance measurement by providing a measurable charge transfer reaction. | Potassium ferrocyanide/ferricyanide ([Fe(CN)₆]³⁻/⁴⁻) [14]. |
| Immobilization Chemistries | Anchors the biorecognition probe to the electrode surface in a stable and oriented manner. | Thiol-Au bonds for gold surfaces [13], streptavidin-biotin crosslinking [13], adsorption on carbon nanomaterials [13]. |
| Microfluidic Systems | Integrates with EIS for automated sample handling, miniaturization, and localized measurements in organ-on-chip models [16]. | Lab-on-a-chip with integrated microelectrode arrays [16]. |
Standardized Experimental Protocol for EIS-Based Virus Detection
This protocol provides a generalized methodology for developing an EIS genosensor for viral RNA/DNA detection, adaptable for specific targets.
Sensor Fabrication and Probe Immobilization
- Electrode Pretreatment: Clean the working electrode (e.g., gold, screen-printed carbon) according to manufacturer specifications. This may involve electrochemical cycling in sulfuric acid or mechanical polishing.
- Surface Modification (Optional): To enhance sensitivity, modify the electrode surface with nanomaterials. For example, deposit a suspension of graphdiyne or graphene and allow it to dry [14].
- Probe Immobilization: Immobilize the specific biorecognition probe onto the electrode surface.
- For thiolated DNA probes: Incubate the cleaned gold electrode with a μM solution of thiolated probe DNA in a suitable buffer (e.g., Tris-EDTA with NaCl) for several hours to form a self-assembled monolayer via Au-S bonds [13].
- For biotinylated probes: First, functionalize the electrode with streptavidin. Then, incubate with the biotinylated probe, leveraging the strong streptavidin-biotin interaction [13].
- Surface Blocking: After probe immobilization, incubate the electrode with a blocking agent (e.g., 6-mercapto-1-hexanol for gold surfaces, or bovine serum albumin) to passivate any remaining non-specific binding sites.
EIS Measurement and Virus Detection
- Setup: Assemble the electrochemical cell with the modified working electrode, a counter electrode (e.g., Pt wire), and a reference electrode (e.g., Ag/AgCl).
- Baseline EIS Measurement: Add an electrolyte solution containing a redox probe (e.g., 5 mM [Fe(CN)₆]³⁻/⁴⁻ in PBS) to the cell. Perform an EIS measurement to establish a baseline impedance spectrum.
- Parameters: Apply a DC potential at the formal potential of the redox probe (often ~0.2 V vs. Ag/AgCl for [Fe(CN)₆]³⁻/⁴⁻). Use a small AC amplitude (e.g., 5-10 mV) to ensure system linearity [18]. Sweep frequencies typically from 100 kHz to 0.1 Hz. Record the Nyquist plot.
- Target Incubation and Detection: Incubate the modified electrode with the sample solution containing the target viral sequence for a defined period (e.g., 30-60 minutes) under controlled temperature.
- Post-Hybridization EIS Measurement: Wash the electrode gently to remove unbound material. Reintroduce the redox probe solution and record a new EIS spectrum under identical conditions.
- Data Analysis: The primary signal is the increase in charge transfer resistance (Rct), represented by the diameter of the semicircle in the Nyquist plot. The ΔRct is correlated with the target concentration [14].
Diagram 1: EIS Virus Detection Workflow.
Critical Experimental Considerations and Troubleshooting
- Linearity and Measurement Conditions: Electrochemical systems are inherently non-linear. To obtain valid impedance data, it is critical to use a sufficiently small amplitude of the AC perturbation signal (typically 5-10 mV) to ensure the system responds in a pseudo-linear manner [18].
- Optimization of Probe Density: The density of immobilized DNA probes on the sensor surface is crucial. Excessive density can lead to steric hindrance, significantly decreasing hybridization efficiency and sensor performance [13].
- Minimizing Non-Specific Binding: Matrix effects and non-specific binding in complex samples (e.g., serum, saliva) are key challenges. The use of effective blocking agents and thorough washing steps is essential to ensure specificity [8].
- Data Interpretation: EIS data is rich in information but can be complex to interpret. Using equivalent circuit modeling (e.g., with a [R(C(RW))] circuit for a simple Faradaic sensor) helps in quantifying parameters like Rct and double-layer capacitance [19].
EIS-based biosensing offers a powerful and versatile platform that aligns with the critical needs of modern viral diagnostics and research. Its label-free nature simplifies assays and reduces costs, its capacity for real-time monitoring provides dynamic insights into biomolecular interactions, and its high sensitivity—often augmented by nanomaterials—enables the detection of low-abundance viral targets. The protocols and considerations outlined in this application note provide a foundation for researchers to develop robust, sensitive, and specific EIS sensors for viruses, contributing to advancements in point-of-care testing, drug development, and pandemic preparedness.
Essential Instrumentation and Experimental Setup for EIS Studies
Electrochemical Impedance Spectroscopy (EIS) has emerged as a powerful, label-free analytical technique for detecting viral pathogens with high sensitivity and specificity. This non-destructive method probes the electrical properties of an electrochemical system by applying a small-amplitude sinusoidal alternating current (AC) voltage or current perturbation across a wide frequency range and measuring the corresponding system response [8]. For viral diagnostics, EIS-based biosensors detect changes in electrical impedance at the electrode-electrolyte interface resulting from the binding of viral particles to biorecognition elements immobilized on the sensor surface [8]. The technique's exceptional sensitivity to interfacial changes enables direct detection of viruses without complex labeling procedures, simplifying assay protocols and reducing analysis time [8]. The capacity to perform rapid, precise, and low-cost testing makes EIS particularly valuable for point-of-care (POC) applications during viral outbreaks, where traditional methods like PCR and ELISA often require specialized equipment, personnel, and extended processing times [13] [20].
The fundamental principle underlying EIS-based viral detection involves monitoring alterations in electrical parameters such as charge transfer resistance (Rct), interfacial capacitance, and dielectric characteristics when target viruses interact with specific biorecognition probes on the electrode surface [8]. These measurable changes in the electrical properties of the electrode-solution interface provide quantitative information about viral presence and concentration, enabling diagnostics with extremely low detection limits, sometimes reaching sub-pico/femto molar ranges [20]. The technique's compatibility with miniaturization, low power requirements, and potential for cost-effective mass production further enhances its suitability for developing portable diagnostic devices for viral detection at point-of-care settings [20] [8].
Fundamental EIS Theory and Data Interpretation
Basic Principles and Key Parameters
Electrochemical Impedance Spectroscopy characterizes the electrical response of an electrochemical system by applying a small-amplitude sinusoidal potential excitation and measuring the current response across a wide frequency range. The impedance (Z(ω)) is a complex number represented as Z(ω) = Z'(ω) + jZ''(ω), where Z' is the real component (resistive), Z'' is the imaginary component (capacitive), and ω is the angular frequency [21]. The impedance modulus |Z(ω)| represents the magnitude, while ϕ(ω) denotes the phase shift between voltage and current signals [21]. In viral detection applications, the binding of target pathogens to bioreceptors immobilized on the electrode surface alters these impedance parameters, enabling quantitative detection [8].
The frequency-dependent nature of EIS allows resolution of different electrochemical phenomena occurring at various timescales. High-frequency measurements (typically above 10³ Hz) primarily reflect ohmic resistance of the electrolyte and contact resistances, while intermediate frequencies (1-10³ Hz) often reveal charge transfer kinetics and double-layer capacitance [21]. Low-frequency measurements (below 1 Hz) are particularly sensitive to slower processes such as mass transport limitations, diffusion-controlled events, and interfacial polarization effects that frequently dominate viral binding interactions [21]. For this reason, many EIS-based viral sensors focus on the low-frequency domain to maximize sensitivity to biomolecular binding events.
Equivalent Circuit Modeling
EIS data are commonly interpreted using equivalent circuit models that represent physical electrochemical processes with electrical components. The Randles circuit is frequently employed as a basic model for biosensing applications, comprising solution resistance (Rs), charge transfer resistance (Rct), double-layer capacitance (Cdl), and Warburg impedance (Zw) for diffusion effects [22]. In viral detection, increases in Rct values following exposure to target viruses typically indicate successful binding events that hinder electron transfer between the solution and electrode surface [8].
The constant phase element (CPE) often replaces ideal capacitors in these models to account for surface heterogeneity and non-ideal capacitive behavior common in functionalized biosensor interfaces [21]. The accurate fitting of equivalent circuit models to experimental EIS data enables extraction of quantitative parameters about biorecognition events, allowing researchers to correlate impedance changes with viral concentration and obtain quantitative detection capabilities [22].
Essential Instrumentation Components
A complete EIS measurement system requires several integrated components to generate precise electrical signals, detect minute responses, and process acquired data. The table below summarizes the core instrumentation requirements for EIS studies in viral detection.
Table 1: Core Instrumentation Components for EIS-Based Viral Detection
| Component | Key Specifications | Function in Viral Detection |
|---|---|---|
| Potentiostat/Galvanostat | Multi-channel capability, low-current measurement (<1 nA), wide voltage range (±2-10 V), built-in frequency generator | Applies controlled potential/current and measures electrochemical response; essential for multiplexed detection [4] |
| Frequency Response Analyzer | Wide frequency range (10⁻³ to 10⁶ Hz), low harmonic distortion, high phase accuracy | Generates AC signals and measures amplitude/phase response; critical for low-frequency measurements [21] |
| Electrode System | Working, counter, and reference electrodes; often screen-printed for disposability; gold, carbon, or platinum materials | Provides platform for probe immobilization and electrochemical transduction; screen-printed electrodes enable POC applications [13] [23] |
| Signal Conditioning Circuits | Low-noise amplifiers, filters, precision current sources | Enhances signal-to-noise ratio for detecting small impedance changes from viral binding [21] |
| Data Acquisition System | High-resolution ADC (16-24 bit), programmable sampling rates, digital signal processing | Converts analog signals to digital data for analysis and interpretation [21] |
| Temperature Control | Thermostatic chamber or Peltier element, ±0.1°C stability | Maintains consistent assay conditions as impedance is temperature-sensitive [20] |
Specialized Requirements for Low-Frequency Measurements
Low-frequency EIS measurements (below 1 Hz) present particular instrumentation challenges that require specialized solutions. Accurate characterization in this frequency regime is essential for studying slow kinetic processes like viral binding and diffusion-limited events [21]. Measurements in the sub-millihertz range can reveal crucial information about electrochemical processes but demand extended acquisition times and exceptional signal stability [21]. Commercial impedance meters often struggle with low-frequency applications unless researchers employ expensive or bulky equipment, making custom-designed circuits increasingly valuable for optimizing performance, reducing costs, and increasing versatility for specific viral detection applications [21].
Recent advances in EIS instrumentation have focused on developing embedded solutions and integrated systems that balance performance, cost, and versatility. These systems typically employ circuits for generating controllable current sources that optimize output impedance and measurable impedance range while maintaining portability [21]. For viral detection applications where field deployment is advantageous, these portable systems enable point-of-care testing without sacrificing the sensitivity required for detecting low viral concentrations.
Experimental Protocols for Viral Detection
Electrode Functionalization and Probe Immobilization
The sensitivity and specificity of EIS-based viral detection primarily depend on effective electrode functionalization and optimized probe immobilization strategies. The following protocol outlines a standard approach for preparing biosensors for viral detection:
Electrode Pretreatment: Clean electrode surfaces (typically gold, carbon, or screen-printed variants) through chemical, electrochemical, or plasma treatment methods. For gold screen-printed electrodes (SPGE), perform electrochemical activation in 0.5 M H₂SO₄ via cyclic voltammetry (CV) between -0.2 and +1.5 V until stable voltammograms are obtained [4].
Probe Immobilization: Immobilize biorecognition elements (antibodies, aptamers, or DNA probes) using appropriate coupling chemistry. For thiolated aptamers, incubate electrodes with 1-5 µM probe solution in Tris-HCl buffer containing 1 mM TCEP for 12-16 hours at 4°C to form self-assembled monolayers via thiol-gold interactions [13] [4].
Surface Blocking: Treat functionalized electrodes with 1-2 mM 6-mercapto-1-hexanol (MCH) for 30-60 minutes to passivate unmodified gold surfaces and reduce non-specific binding [4].
Characterization: Verify successful functionalization using cyclic voltammetry in 5 mM Fe(CN)₆³⁻/⁴⁻ solution and electrochemical impedance spectroscopy to establish baseline impedance [4].
Three-dimensional structured materials significantly enhance biosensor performance by expanding the binding surface area for biorecognition probes and optimizing signal transduction mechanisms [24]. Nanomaterials such as graphene, carbon nanotubes, metal nanoparticles, and metal-organic frameworks provide increased surface areas for probe immobilization while improving electrical conductivity and electron transfer kinetics [24].
EIS Measurement and Viral Detection Protocol
The following standardized protocol enables sensitive detection of viral targets using EIS:
Baseline Measurement: Acquire initial EIS spectra of functionalized electrodes in appropriate buffer solution (e.g., PBS, pH 7.4) containing 5 mM Fe(CN)₆³⁻/⁴⁻ as a redox probe. Apply a DC potential equal to the formal potential of the redox couple with a 10 mV AC amplitude across a frequency range of 0.1 Hz to 100 kHz [4].
Sample Incubation: Expose functionalized electrodes to sample containing target virus for a predetermined incubation period (typically 10-30 minutes) under controlled temperature conditions [23] [4].
Washing Step: Gently rinse electrodes with buffer solution to remove unbound materials and minimize non-specific binding effects.
Post-Incubation Measurement: Record EIS spectra under identical conditions to baseline measurement.
Data Analysis: Calculate changes in charge transfer resistance (ΔRct) by fitting Nyquist plots to an appropriate equivalent circuit model. Generate calibration curves by plotting ΔRct/Rct₀ versus logarithmic viral concentration [4].
Table 2: Key Experimental Parameters for EIS-Based Viral Detection
| Parameter | Typical Range | Optimization Considerations |
|---|---|---|
| Incubation Time | 10-30 minutes | Balance between detection sensitivity and assay rapidity [23] [4] |
| Incubation Temperature | 25-37°C | Higher temperatures may accelerate binding kinetics but affect bioreceptor stability |
| Sample Volume | 10-100 µL | Smaller volumes enable analysis of limited samples but may affect binding efficiency |
| AC Amplitude | 5-10 mV | Ensure linear system response while maintaining adequate signal-to-noise ratio [4] |
| Frequency Range | 0.1 Hz - 100 kHz | Lower frequencies often provide greater sensitivity to viral binding events [21] |
| Redox Probe Concentration | 1-10 mM | Optimize for measurable current response without masking binding-induced impedance changes |
Data Analysis and Validation
Analyze EIS data by fitting to equivalent circuit models using specialized software. The Randles circuit with a constant phase element typically provides satisfactory fitting for functionalized biosensor interfaces. Validate detection specificity through control experiments with non-target viruses and structural analogs [4]. Assess sensor reproducibility through repeated measurements (n ≥ 3) and calculate detection limits based on the concentration yielding a signal three times the standard deviation of the blank measurement [4].
For complex samples, matrix effects can significantly impact EIS measurements. Evaluate clinical performance by testing spiked human serum samples alongside buffer-based measurements, noting that serum components may increase detection limits due to non-specific binding and increased solution complexity [4].
Research Reagent Solutions and Materials
Successful implementation of EIS-based viral detection requires carefully selected reagents and materials optimized for biosensing applications. The table below details essential components and their functions in typical EIS viral detection workflows.
Table 3: Essential Research Reagents for EIS-Based Viral Detection
| Reagent/Material | Function | Examples/Specifications |
|---|---|---|
| Biorecognition Elements | Specific target capture | Antibodies, aptamers, DNA/RNA probes; thiolated for gold surface immobilization [13] [4] |
| Electrode Materials | Signal transduction platform | Screen-printed gold (SPGE), carbon (SPCE), or carbon nanoparticle-modified electrodes [23] [4] |
| Surface Modification Agents | Probe immobilization and surface passivation | 6-Mercapto-1-hexanol (MCH), 11-Mercaptoundecanoic acid (11-MUA), glutaraldehyde [4] |
| Redox Probes | Electron transfer mediators | Potassium ferricyanide/ferrocyanide ([Fe(CN)₆]³⁻/⁴⁻), Ruthenium hexamine [4] |
| Blocking Agents | Minimize non-specific binding | Bovine serum albumin (BSA), casein, ethanolamine [4] |
| Buffer Systems | Maintain physiological conditions | Phosphate buffered saline (PBS), Tris-HCl, with optional KCl for ionic strength adjustment [4] |
| Nanomaterial Enhancers | Signal amplification | Carbon nanoparticles, gold nanoparticles, graphene oxide [24] [23] |
Visualization of Experimental Workflows
The following diagrams illustrate key experimental workflows and conceptual frameworks for EIS-based viral detection, created using DOT language with specified color palette and formatting requirements.
Diagram 1: EIS Experimental Workflow for Viral Detection
Diagram 2: EIS Instrumentation and Equivalent Circuit Model
Developing EIS Biosensors: From Design to Real-World Application
Electrochemical Impedance Spectroscopy (EIS) has emerged as a leading technique for the label-free detection of pathogens, offering a unique combination of sensitivity, non-invasiveness, and adaptability for viral diagnostics [8]. The core of any EIS biosensor is its biorecognition element, which dictates the sensor's specificity, sensitivity, and overall performance. The critical challenge in sensor design lies in selecting the optimal biorecognition molecule—be it an antibody, aptamer, peptide, or other probe—to interface with the transducer and reliably capture the target virus [25]. This selection process requires careful consideration of the application context, including the specific viral target, required detection limits, and the complexity of the sample matrix. This application note provides a structured framework for researchers to navigate this critical selection process, supported by quantitative performance data and detailed experimental protocols tailored for EIS-based virus detection.
Biorecognition Elements: Mechanisms and Performance
The performance of an EIS biosensor is fundamentally governed by the properties of its immobilized biorecognition element. Antibodies, aptamers, and peptides each present distinct advantages and limitations for viral detection, as summarized in Table 1.
Table 1: Comparison of Biorecognition Elements for EIS-Based Virus Detection
| Biorecognition Element | Detection Mechanism | Limit of Detection (LOD) | Key Advantages | Key Limitations |
|---|---|---|---|---|
| Antibodies [25] [26] | Specific antigen-antibody binding | Varies by target; e.g., ~pg/mL for some viral antigens | High specificity and affinity; well-established protocols | Susceptible to denaturation; batch-to-batch variability; limited shelf-life |
| Aptamers [27] [28] [4] | Conformational change upon target binding | femtomolar (fM) to attomolar (aM) range [27]; e.g., 0.319 pg/mL for SARS-CoV-2 S-glycoprotein [4] | Excellent stability; ease of synthesis/modification; reusability | Susceptibility to nuclease degradation; potential for nonspecific binding in complex matrices |
| Peptides [29] | Molecular recognition of viral epitopes or antibodies | Low ng/mL range (e.g., 0.43-8.04 ng/mL for SARS-CoV-2 antibodies) [29] | Rapid, low-cost synthesis; high stability; adaptable to viral mutations | Generally lower affinity compared to antibodies and aptamers |
| Nucleic Acid Probes (Genosensors) [26] [13] | Hybridization with complementary viral RNA/DNA | ~fg/μL for viral cDNA (e.g., Hepatitis A virus) [13] | Direct detection of viral genetic material; high specificity | Requires nucleic acid extraction; complex sample preparation |
The selection of an appropriate biorecognition element directly influences the sensor's analytical performance. For instance, aptamers demonstrate exceptional sensitivity, achieving detection limits in the femtomolar to attomolar range for disease biomarkers, which is critical for early viral detection [27]. Antibodies, while offering high specificity, can be limited by stability issues. Peptides represent a promising alternative with superior stability and the unique advantage of easy adaptability to detect emerging viral variants through simple sequence modifications [29].
Experimental Protocols for Biosensor Fabrication and Testing
Protocol 1: Aptamer-Based EIS Sensor for Viral Antigen Detection
This protocol details the development of an EIS aptasensor for the detection of viral antigens, such as the SARS-CoV-2 S-glycoprotein, adapted from a study demonstrating simultaneous detection of tuberculosis and SARS-CoV-2 biomarkers [4].
Reagents and Materials:
- Thiolated aptamers specific to the target viral antigen
- Screen-printed gold electrodes (SPGE)
- Tris(2-carboxyethyl)phosphine hydrochloride (TCEP)
- 6-mercapto-1-hexanol (MCH)
- Potassium ferrocyanide/potassium ferricyanide redox probe
- Target viral antigen (e.g., SARS-CoV-2 S-glycoprotein)
- Phosphate Buffered Saline (PBS)
Procedure:
- Aptamer Reduction: Treat thiolated aptamers with TCEP to reduce disulfide bonds.
- Electrode Pretreatment: Clean SPGEs electrochemically via cyclic voltammetry in sulfuric acid.
- Aptamer Immobilization: Incubate SPGEs with the reduced aptamer solution for optimal duration.
- Surface Blocking: Treat with MCH solution to passivate unmodified gold surface.
- Target Incubation: Expose functionalized SPGE to sample containing target antigen.
- EIS Measurement: Perform EIS in a solution containing the redox probe.
- Data Analysis: Monitor increase in charge transfer resistance (Rct) relative to antigen concentration.
Validation: The optimized aptasensor achieved a detection limit of 0.319 pg/mL for SARS-CoV-2 S-glycoprotein in buffer, with good selectivity against non-target proteins [4].
Protocol 2: Peptide-Based EIS Biosensor for Viral Antibody Detection
This protocol describes a method for detecting variant-specific antibodies against viruses like SARS-CoV-2 using peptide-based EIS biosensors, based on research utilizing the immunodominant peptide P44 [29].
Reagents and Materials:
- Synthetic peptides (e.g., P44-WT: TGKIADYNYKLPDDF)
- Glassy carbon electrode (GCE)
- Gold nanoparticles (AuNPs, ~30 nm)
- 4-mercaptobenzoic acid (MBA)
- Serum samples from patients
Procedure:
- Electrode Modification: Synthesize AuNPs and immobilize on GCE surface.
- Peptide Functionalization: Incubate AuNP-modified GCE with peptide solution.
- Antibody Binding: Incubate functionalized electrode with serum sample.
- EIS Measurement: Perform EIS in redox probe solution.
- Data Analysis: Correlate Rct increase with antibody concentration.
Validation: The platform demonstrated high specificity in complex serum matrices, with detection limits of 0.43, 4.85, and 8.04 ng/mL for wild-type and mutated peptide sequences, respectively [29].
Workflow and Signaling Pathways
The following diagram illustrates the generalized experimental workflow for developing an EIS-based biosensor for virus detection, integrating the key steps from the protocols above.
The fundamental signaling mechanism in EIS biosensing involves monitoring changes in electrical parameters at the electrode-electrolyte interface. When a target virus binds to the biorecognition element, it alters the interfacial properties, leading to an increase in charge transfer resistance (Rct) and changes in capacitance, which can be quantified through EIS measurements [8] [26].
The Scientist's Toolkit: Essential Research Reagent Solutions
Table 2: Key Research Reagent Solutions for EIS-Based Virus Detection
| Reagent/Material | Function | Example Application | Considerations |
|---|---|---|---|
| Screen-printed Gold Electrodes (SPGE) [4] | Transducer platform | Aptasensor for SARS-CoV-2 S-glycoprotein and MPT64 detection [4] | Disposable; cost-effective; suitable for mass production |
| Thiolated Aptamers [27] [4] | Biorecognition element | Specific detection of viral antigens via Au-S bond immobilization | Require TCEP reduction before use; sequence specificity critical |
| Gold Nanoparticles (AuNPs) [29] | Signal amplification; immobilization matrix | Peptide-based biosensor for SARS-CoV-2 antibodies [29] | ~30 nm size optimal; synthesized via Turkevich method |
| 6-Mercapto-1-hexanol (MCH) [4] | Surface blocking agent | Prevents non-specific binding on gold surfaces | Forms self-assembled monolayer; displaces non-specifically adsorbed probes |
| Redox Probes ([Fe(CN)₆]³⁻/⁴⁻) [26] | Electron transfer mediator | Faradaic EIS measurements | Stable and reversible redox couple; concentration affects sensitivity |
| Specific Peptides [29] | Biorecognition element | Detection of variant-specific SARS-CoV-2 antibodies | P44 sequence (TGKIADYNYKLPDDF) for SARS-CoV-2 RBD |
The strategic selection of biorecognition elements is paramount for developing high-performance EIS biosensors for viral detection. Antibodies offer well-established specificity, while aptamers provide superior stability and sensitivity, and peptides enable rapid adaptation to viral mutations. The integration of these elements with advanced nanomaterials and optimized immobilization strategies, as detailed in the provided protocols, paves the way for robust, sensitive, and specific viral detection systems. Future perspectives point toward multiplexed detection platforms and integration with microfluidic systems for point-of-care applications, ultimately transforming diagnostic capabilities across healthcare sectors.
Electrode Materials and Nanomaterial Integration for Enhanced Signal Transduction
Electrochemical Impedance Spectroscopy (EIS) has emerged as a powerful, label-free technique for the direct detection of viral pathogens, offering significant advantages in sensitivity, cost-effectiveness, and potential for point-of-care (POC) deployment [8]. The technique operates by applying a small amplitude sinusoidal alternating current (AC) potential across an electrochemical cell and measuring the resulting current response, which reveals the system's impedance [2]. This impedance is highly sensitive to changes at the electrode-electrolyte interface, such as the binding of a target virus to a biorecognition element immobilized on the electrode surface [8]. Such binding events alter interfacial properties like capacitance and charge-transfer resistance, enabling the detection and quantification of the target analyte without the need for labels [8] [30].
The performance of EIS biosensors is profoundly influenced by the properties of the electrode surface. Nanomaterial integration represents a pivotal strategy for enhancing signal transduction by fundamentally improving the electrode interface [25] [31]. Nanomaterials provide a high surface-to-volume ratio, significantly increasing the available area for immobilization of biorecognition probes such as antibodies, aptamers, or DNA sequences [32] [31]. Furthermore, many nanomaterials exhibit excellent electrical conductivity and unique electrocatalytic properties, which facilitate faster electron transfer kinetics and amplify the electrochemical signal, leading to lower limits of detection and improved sensitivity for viral targets [14] [31]. This combination of features makes nanomaterials indispensable for developing next-generation EIS biosensors for pathogenic viruses like influenza and SARS-CoV-2 [25] [14].
Key Nanomaterial Classes and Their Properties
The strategic selection of nanomaterials is critical for optimizing EIS biosensor performance. Different classes of materials offer distinct advantages that can be leveraged based on the specific requirements of the detection assay.
Carbon-Based Nanomaterials are widely utilized due to their excellent conductivity, large surface area, and robust chemical stability [31]. This family includes:
- Graphene and its derivatives: Known for their high electrical conductivity and extensive, tunable surface chemistry for biomolecule attachment [31].
- Carbon Nanotubes (CNTs): These materials combine high aspect ratios with superior charge transport capabilities, often used to wire biorecognition elements to the electrode surface [31].
- Graphdiyne: A novel two-dimensional carbon allotrope that has attracted recent interest for its uniformly π-conjugated surface, uniform pore structure, and excellent biocompatibility, which promotes strong adsorption of DNA molecules and enhances the sensitivity of genosensors [14].
Metal and Metal Oxide Nanoparticles offer unique optical and electrical properties:
- Gold Nanoparticles (AuNPs): These are frequently employed for their high conductivity, chemical stability, and facile functionalization with thiolated biomolecules, enabling dense and oriented probe immobilization [25] [32].
- Magnetic Nanoparticles (e.g., Fe₃O₄): While often used for pre-analytical sample concentration and separation, they can also be integrated into sensing platforms to enhance signals in magneto-electrochemical assays [32].
3D Structured Materials create a larger binding surface area compared to traditional 2D surfaces. These include porous structures like metal-organic frameworks (MOFs) and hydrogels, which can be used to form a three-dimensional matrix on the electrode, drastically increasing the probe loading capacity and thereby enhancing the sensor's signal and sensitivity [25].
Table 1: Key Nanomaterial Classes for EIS-based Virus Detection
| Nanomaterial Class | Representative Examples | Key Properties | Impact on EIS Performance |
|---|---|---|---|
| Carbon-Based | Graphene, CNTs, Graphdiyne [14] [31] | High conductivity, large surface area, biocompatibility, tunable chemistry | Enhances electron transfer, increases probe density, improves sensitivity and LOD |
| Metal Nanoparticles | AuNPs, Silver NPs [25] [32] | Excellent conductivity, facile bioconjugation, plasmonic properties | Amplifies signal, enables stable probe immobilization, can catalyze reactions |
| Magnetic Nanoparticles | Fe₃O₄ [32] | Magnetic separation, large surface area | Allows sample pre-concentration, can be used for signal amplification |
| 3D Structured Materials | Hydrogels, MOFs, Porous silica [25] | 3D porous architecture, high surface area | Maximizes probe immobilization, enhances capture efficiency of viral particles |
Quantitative Performance of Nanomaterial-Enhanced EIS Biosensors
The integration of advanced nanomaterials has directly enabled EIS biosensors to achieve remarkable analytical performance for virus detection, as evidenced by recent research. The following table summarizes the quantitative performance of selected nanomaterial-based EIS biosensors reported in the literature.
Table 2: Performance Metrics of Representative EIS Biosensors for Virus Detection
| Target Virus | Biorecognition Element | Nanomaterial Platform | Limit of Detection (LOD) | Linear Dynamic Range | Reference |
|---|---|---|---|---|---|
| SARS-CoV-2 | RdRp-specific DNA sequence | Graphdiyne | Nanomolar range | 10⁻⁹ M to 10⁻⁵ M | [14] |
| SARS-CoV-2 | Anti-Spike S1 Antibody | Gold electrode (miniaturized chip) | Sub-nanomolar (Spike S1 protein) | Not specified | [30] |
| Influenza | Antibodies, Aptamers | 3D surfaces (e.g., graphene, hydrogels) | Enhanced sensitivity over 2D surfaces | Not specified | [25] |
The data in Table 2 underscores the critical role of nanomaterials. The graphdiyne-based genosensor achieves a low nanomolar LOD and a wide dynamic range covering four orders of magnitude, which is essential for detecting viral loads that can vary significantly between individuals [14]. Similarly, the use of a miniaturized gold chip with antibody functionalization allows for sub-nanomolar detection of the SARS-CoV-2 spike protein, demonstrating the sensitivity required for early diagnosis [30]. The general trend of enhanced sensitivity from 3D immobilization platforms highlights how nanomaterial engineering directly translates to improved analytical figures of merit [25].
Detailed Experimental Protocol: Graphdiyne-Based Genosensor for SARS-CoV-2 RdRp Gene
This protocol details the development of an EIS genosensor for the detection of a SARS-CoV-2 RNA-dependent RNA polymerase (RdRp) gene fragment using a graphdiyne-modified disposable electrode chip [14].
Research Reagent Solutions
Table 3: Essential Reagents and Materials
| Item Name | Function/Description |
|---|---|
| Graphdiyne Powder | Two-dimensional carbon nanomaterial platform for DNA immobilization [14] |
| Disposable Electrode Printed Chips (DEP-chips) | Miniaturized, portable sensing platform with working, counter, and reference electrodes [14] |
| RdRp-specific ssDNA Probe | Single-stranded DNA sequence complementary to the target RdRp gene; serves as the biorecognition layer [14] |
| [Fe(CN)₆]³⁻/⁴⁻ Redox Couple | Electrochemical redox probe used in the EIS measurement solution to monitor interfacial changes [14] |
| 2-Iminothiolane (Traut's Reagent) | Used for thiolation of antibodies for covalent immobilization on gold surfaces [30] |
| SARS-CoV-2 Pseudovirus (VSV-ΔG-Spike) | Replication-defective viral model with SARS-CoV-2 spike protein for safe biosensor validation [30] |
Step-by-Step Procedure
Step 1: Electrode Modification with Graphdiyne
- Disperse graphdiyne powder in a suitable solvent (e.g., water or ethanol) to form a homogeneous suspension, typically via sonication.
- Deposit the graphdiyne suspension onto the working electrode of the DEP-chip using drop-casting or electrodeposition.
- Allow the solvent to evaporate completely, forming a uniform graphdiyne film on the electrode surface. The quality of the film should be confirmed via techniques like scanning electron microscopy (SEM) or cyclic voltammetry (CV) [14].
Step 2: Immobilization of the DNA Probe
- Prepare a solution of the thiolated or aminated ssDNA probe sequence specific to the RdRp gene target.
- Incubate the graphdiyne-modified electrode with the DNA probe solution for a defined period (e.g., 2 hours) to allow for physical adsorption or covalent coupling via cross-linkers. The strong π-π stacking between graphdiyne and DNA bases facilitates stable adsorption [14].
- Rinse the electrode thoroughly with a buffer solution (e.g., Tris-EDTA or phosphate buffer) to remove any unbound or loosely adsorbed DNA probes.
Step 3: Blocking of Non-Specific Sites
- Incubate the probe-functionalized electrode with a blocking agent, such as bovine serum albumin (BSA) or casein, for approximately 1 hour.
- This critical step passivates any remaining active sites on the electrode surface, minimizing non-specific binding of the target or other components in the sample, which reduces background noise and false-positive signals [14] [30].
Step 4: EIS Measurement and Hybridization Detection
- Prepare a measurement solution containing a known concentration of the [Fe(CN)₆]³⁻/⁴⁻ redox couple in an appropriate electrolyte buffer [14].
- Measure the EIS spectrum of the biosensor (probe-modified and blocked electrode) in the measurement solution before exposure to the target. This is the baseline measurement. Standard EIS parameters may include a frequency range from 0.1 Hz to 100 kHz, with an AC voltage amplitude of 5-10 mV, applied at the formal potential of the redox couple [14] [2].
- Incubate the biosensor with a sample solution containing the target SARS-CoV-2 RdRp gene sequence (or a synthetic DNA analogue for testing) for a set duration (e.g., 30 minutes) to allow for hybridization.
- Wash the electrode gently to remove unhybridized strands.
- Measure the EIS spectrum again under identical conditions in a fresh aliquot of the measurement solution.
Step 5: Data Analysis
- Fit the obtained EIS data to a suitable equivalent circuit model, such as the Randles circuit, which typically includes solution resistance (Rs), charge transfer resistance (Rct), constant phase element (CPE), and Warburg diffusion element (W) [2].
- The key parameter for quantification is the charge transfer resistance (R_ct), which will increase upon successful hybridization of the target due to the hindrance of electron transfer by the negatively charged DNA backbone.
- Construct a calibration curve by plotting the ΔRct (or Rct) against the logarithm of the target concentration. The LOD and linear dynamic range can be determined from this curve [14].
Graph 1: EIS Genosensor Experimental Workflow. This diagram outlines the key steps for developing and using a graphdiyne-based genosensor, from electrode modification to target quantification.
Mechanisms of Signal Enhancement and Transduction
The enhancement of EIS signals through nanomaterial integration is a multi-faceted process. The following diagram and section detail the primary mechanisms involved in signal transduction and amplification.
Graph 2: Nanomaterial Signal Enhancement Mechanisms. This diagram illustrates how nanomaterials enhance EIS biosensor signals through increased surface area, improved electron transfer, and better probe orientation.
Increased Surface Area and Probe Density: Nanomaterials provide a significantly larger electroactive surface area compared to bare planar electrodes [25] [31]. This allows for the immobilization of a higher density of biorecognition probes (antibodies, DNA), leading to a greater number of potential binding events with the target virus. In a 3D nanomaterial scaffold, this effect is further amplified, maximizing the capture efficiency of viral particles and resulting in a more pronounced change in the measured impedance signal upon binding [25].
Enhanced Electron Transfer Kinetics: Many carbon-based nanomaterials (e.g., graphene, CNTs, graphdiyne) and metal nanoparticles (e.g., AuNPs) are highly conductive [14] [31]. When coated on the electrode, they facilitate the electron transfer between the redox probe (\ce{[Fe(CN)6]^{3-/4-}}) in the solution and the electrode surface. This results in a lower initial charge transfer resistance (Rct). When a target binds, the resulting hindrance to electron transfer causes a larger relative change in Rct (ΔR_ct), making the signal more easily detectable and improving the sensor's sensitivity [14].
Optimal Steric Orientation and Biocompatibility: The surface chemistry of nanomaterials can be engineered to control the orientation and conformation of immobilized biorecognition elements. For instance, gold surfaces allow for covalent, oriented attachment of thiolated antibodies or DNA, which can improve their binding availability and efficiency compared to random physical adsorption [30]. Materials like graphdiyne offer a biocompatible environment that helps maintain the biological activity of probes, while their porous structure can provide optimal spatial arrangement for accessing viral epitopes or genetic sequences [14].
Troubleshooting and Optimization Guidelines
Achieving optimal performance from an EIS biosensor requires careful attention to several experimental parameters. Common challenges and their solutions are outlined below.
Problem: High Non-Specific Binding (NSB)
- Potential Causes: Inadequate blocking of the electrode surface; non-optimized probe density; impurities in the sample matrix.
- Solutions: Test different blocking agents (e.g., BSA, casein, ethanolamine) and increase blocking time. Optimize the concentration of the immobilized probe to avoid overcrowding, which can paradoxically increase NSB. Incorporate wash steps with detergents (e.g., Tween 20) to reduce nonspecific interactions [14] [30].
Problem: Low Signal-to-Noise Ratio or Poor Reproducibility
- Potential Causes: Inconsistent nanomaterial deposition on the electrode; unstable functionalization of biorecognition probes; drift in the reference electrode potential.
- Solutions: Standardize the nanomaterial modification protocol (e.g., precise concentration, volume, and drying conditions). Use covalent chemistry for probe immobilization (e.g., thiol-gold, EDC-NHS coupling) for greater stability. Ensure the reference electrode is properly conditioned and the electrochemical cell is stable before measurements [31] [2].
Problem: Insensitive Sensor Response (Low ΔR_ct)
- Potential Causes: Low density of active biorecognition probes; inefficient electron transfer through the nanomaterial layer; target concentration below the LOD.
- Solutions: Characterize the probe immobilization yield using complementary techniques. Ensure the nanomaterial layer is sufficiently conductive and not too thick, which can insulate the electrode. Verify the activity of the biorecognition elements and the integrity of the target analyte [25] [31].
The most critical optimization steps typically involve:
- Probe Immobilization Density: There is an optimal surface density that maximizes target capture while minimizing steric hindrance between adjacent probe molecules.
- Blocking Efficiency: Systematic testing of blocking agents and conditions is essential to minimize background signal.
- EIS Measurement Parameters: The amplitude of the AC voltage (typically 5-10 mV) should be small enough to maintain system linearity. The frequency range must be chosen to capture the relevant interfacial processes, often between 0.1 Hz and 100 kHz [2].
Surface Immobilization and Biointerface Design Strategies
Surface immobilization and biointerface design are foundational to the development of robust and sensitive electrochemical biosensors, particularly for virus detection. The method by which biorecognition elements are anchored to a transducer surface dictates key performance parameters, including sensitivity, specificity, stability, and reproducibility. Within the context of electrochemical impedance spectroscopy (EIS) for virus detection, the immobilization strategy directly influences the dielectric and conductive properties of the electrode-electrolyte interface, which are the primary sources of the measurable signal in label-free assays [33] [34]. This document outlines critical immobilization chemistries and provides detailed protocols for constructing reliable biointerfaces for EIS-based viral sensing, supporting a broader research thesis on advanced diagnostic development.
Key Immobilization Strategies and Performance Comparison
The selection of an immobilization strategy involves a trade-off between simplicity, stability, and the preservation of bioreceptor activity. The following table summarizes the primary approaches used in EIS-based biosensors for virus detection.
Table 1: Comparison of Bioimmobilization Strategies for EIS Viral Sensors
| Immobilization Strategy | Mechanism | Key Reagents | Advantages | Disadvantages | Representative Application |
|---|---|---|---|---|---|
| Thiol-based Self-Assembled Monolayers (SAMs) | Covalent bond between thiol (-SH) group and gold surface [35]. | Cysteamine, Cysteine, and other thiolated linkers [35]. | Well-ordered, dense layers; excellent electron transfer; highly tunable surface chemistry [33] [34]. | Can be sensitive to storage conditions; long-term stability may be a concern. | Gold electrode functionalization for antibody or aptamer attachment [36] [35]. |
| Covalent Cross-linking | Formation of amide or imine bonds between bioreceptor and activated surface groups [35]. | EDC/NHS (for COOH-NH₂), Glutaraldehyde (for NH₂-NH₂) [35]. | Strong, stable, and irreversible immobilization; high surface coverage [13]. | Multi-step process; potential for random orientation, reducing activity [33]. | Antibody immobilization on SAM-modified gold electrodes [35]. |
| Avidin-Biotin Interaction | High-affinity (K_d ~ 10⁻¹⁵ M) non-covalent binding between avidin/streptavidin and biotin [13]. | Streptavidin, Biotinylated antibodies or nucleic acids [13]. | Nearly irreversible binding; excellent orientation control; universal platform [13]. | Requires biotinylation of bioreceptor; additional cost and preparation steps. | Immobilization of biotinylated DNA probes for genosensors [13]. |
| Hydrogen Bonding Immobilization | Relies on non-covalent hydrogen bond interactions between the bioreceptor and the functionalized surface [35]. | Cysteamine (provides NH₂-terminated surface) [35]. | Simple, rapid, and reagent-free (no EDC/NHS needed); preserves bioreceptor activity [35]. | Potentially weaker than covalent bonds, though demonstrated to be stable for days [35]. | Direct antibody immobilization for hepatitis B virus detection [35]. |
| Physical Adsorption | Non-specific interactions (e.g., hydrophobic, van der Waals) with the surface or nanomaterial [13]. | Carbon nanomaterials (graphene, CNTs), polymers [13]. | Simplest method; no surface modification required. | Uncontrolled orientation; random attachment; can lead to leaching and instability [13]. | Adsorption of DNA probes onto graphene or carbon nanotube surfaces [13]. |
Detailed Experimental Protocols
Protocol 1: Antibody Immobilization via Thiol SAM and Covalent Cross-linking
This is a widely used, robust protocol for creating stable antibody-modified gold surfaces for impedimetric immunosensors [33] [35].
Workflow Overview:
Materials:
- Gold working electrode (e.g., disk electrode, screen-printed gold electrode)
- Cysteamine hydrochloride or 11-mercaptoundecanoic acid (11-MUA)
- Cross-linkers: EDC (N-(3-Dimethylaminopropyl)-N′-ethylcarbodiimide) and NHS (N-Hydroxysuccinimide)
- Antibody specific to the target virus (e.g., anti-Spike protein antibody for SARS-CoV-2)
- Blocking agent: Bovine Serum Albumin (BSA)
- Phosphate Buffered Saline (PBS), pH 7.4
- Redox probe: 25 mM [Fe(CN)₆]³⁻/⁴⁻ in PBS
Procedure:
- Electrode Pre-treatment: Clean the gold electrode surface mechanically (with alumina slurry, 0.05 µm) and electrochemically (via cyclic voltammetry in 0.5 M H₂SO₄ from -0.4 V to 0.8 V until stable CV curves are obtained) to ensure a pristine, reproducible surface [35].
- SAM Formation: Incubate the clean gold electrode in a 10 mM aqueous solution of cysteamine (for an NH₂-terminated surface) or 11-MUA (for a COOH-terminated surface) for 60-90 minutes at room temperature. Rinse thoroughly with ethanol and Milli-Q water to remove physically adsorbed thiols [35].
- Linker Activation (For COOH-terminated SAMs): Prepare a fresh mixture of 40 mM EDC and 10 mM NHS in Milli-Q water. Incubate the SAM-modified electrode in this solution for 30-60 minutes to activate the carboxyl groups to form NHS esters. Rinse gently with PBS (pH 7.4) to stop the reaction [35].
- Antibody Immobilization: Apply 10-50 µL of the specific antibody solution (typical concentration 10-50 µg/mL in PBS, pH 7.4) onto the activated SAM surface. Incubate in a humidified chamber for 60-120 minutes at room temperature or overnight at 4°C. This forms stable amide bonds between the activated surface and the antibody's primary amines.
- Quenching and Blocking: Rinse the electrode with PBS to remove unbound antibodies. To block any remaining activated esters or non-specific binding sites, incubate the electrode with 1% (w/v) BSA in PBS for 30-60 minutes. This step is critical for minimizing non-specific adsorption in subsequent samples.
- Storage: The functionalized biosensor can be stored wet in PBS at 4°C for several days until use. Perform EIS measurements in PBS containing the [Fe(CN)₆]³⁻/⁴⁻ redox probe.
Protocol 2: DNA Aptamer Immobilization via Thiol-Gold Chemistry for SARS-CoV-2 Detection
This protocol details the construction of an EIS aptasensor for detecting SARS-CoV-2 Spike protein, demonstrating high sensitivity and specificity [36].
Workflow Overview:
Materials:
- Interdigitated Gold Electrode (IDE)
- Thiol-modified DNA aptamer with known sequence for SARS-CoV-2 Spike protein
- 6-Mercapto-1-hexanol (MCH)
- Tris-EDTA (TE) buffer or PBS
- Redox probe: 25 mM [Fe(CN)₆]³⁻/⁴⁻ in PBS
- Target analyte: Recombinant SARS-CoV-2 Spike protein or inactivated virus
Procedure:
- Electrode Pre-treatment: Clean the IDE following the same procedure as in Protocol 1.
- Aptamer Immobilization: Deposit 10 µL of the thiolated aptamer solution (e.g., 1 µM in TE buffer) onto the IDE surface. Incubate for 12-16 hours (overnight) in a humidified chamber at 4°C. This allows the thiol group to form a stable covalent bond with the gold surface.
- Backfilling with MCH: Rinse the electrode with PBS to remove loosely bound aptamers. Incubate the electrode with 1 mM MCH solution for 60 minutes. MCH fills any remaining pinholes on the gold surface, creating a well-ordered mixed SAM. This step is crucial as it displaces non-specifically adsorbed aptamers, forces the aptamers into an upright orientation, and minimizes non-specific binding [36].
- Target Binding: After rinsing, incubate the aptasensor with the sample containing the target (SARS-CoV-2 Spike protein or viral particles) for 15-25 minutes at room temperature.
- EIS Measurement: Perform EIS in the [Fe(CN)₆]³⁻/⁴⁻ solution. The binding of the target (a large, insulating protein) to the aptamer will cause a measurable increase in charge-transfer resistance (R_ct), which correlates with the target concentration.
Protocol 3: Reagent-Free Antibody Immobilization via Hydrogen Bonding
This novel protocol offers a simple, cost-effective alternative to covalent cross-linking, demonstrating excellent performance for Hepatitis B virus antigen detection [35].
Materials:
- Gold working electrode
- Cysteamine (CT)
- Antibody (e.g., anti-HBsAg)
- PBS, pH 7.4
- Redox probe: 25 mM [Fe(CN)₆]³⁻/⁴⁻ in PBS
Procedure:
- Electrode Pre-treatment and SAM Formation: Follow Steps 1 and 2 from Protocol 1 to create an NH₂-terminated SAM using cysteamine.
- Hydrogen Bonding Immobilization: After rinsing the cysteamine-modified electrode, apply the antibody solution (e.g., 10 µg/mL in PBS) directly onto the surface and incubate for 2 hours at room temperature. The immobilization relies on the formation of multiple hydrogen bonds between the amine groups on the SAM and the polar residues/backbone of the antibody, without the need for EDC/NHS [35].
- Blocking: Incubate with 1% BSA for 30 minutes to block any non-specific sites.
- Measurement: The biosensor is ready for EIS or DPV measurement after a final rinse with PBS. This method has been shown to provide high sensitivity, good repeatability, and stability over at least 7 days [35].
The Scientist's Toolkit: Essential Research Reagent Solutions
Table 2: Key Reagents for Surface Immobilization in EIS Biosensors
| Reagent | Function | Key Consideration |
|---|---|---|
| Cysteamine | Short-chain thiol linker forming NH₂-terminated SAM. | Enables covalent cross-linking or hydrogen bonding immobilization [35]. |
| 11-Mercaptoundecanoic acid (11-MUA) | Long-chain thiol linker forming COOH-terminated SAM. | Provides a carboxyl group for EDC/NHS activation; longer chains can improve accessibility [33]. |
| EDC / NHS | Cross-linking agents. | Must be prepared fresh for each use; optimal pH for reaction is 4.5-7.2 [35]. |
| 6-Mercapto-1-hexanol (MCH) | Backfilling molecule for thiolated DNA/aptamer sensors. | Essential for improving hybridization efficiency and reducing non-specific binding [36]. |
| Streptavidin | Protein that binds biotin with high affinity. | Can be immobilized first to create a universal surface for biotinylated receptors [13]. |
| [Fe(CN)₆]³⁻/⁴⁻ | Redox probe for Faradaic EIS measurements. | Concentration (typically 5-25 mM) and solution pH must be kept consistent for reproducible R_ct values [35]. |
| Bovine Serum Albumin (BSA) | Blocking agent. | Used to passivate non-specific binding sites on the sensor surface after bioreceptor immobilization [35]. |
Performance Data and Analysis
The following table quantifies the performance of different immobilization strategies as reported in recent literature for virus detection.
Table 3: Analytical Performance of EIS Biosensors with Different Immobilization Strategies
| Target Virus | Bioreceptor | Immobilization Strategy | Limit of Detection (LOD) | Assay Time | Reference |
|---|---|---|---|---|---|
| SARS-CoV-2 (Spike protein) | Aptamer | Thiol-Gold + MCH backfilling | 0.4 pg/mL (in buffer) | < 25 min | [36] |
| SARS-CoV-2 (Viral particles) | Aptamer | Thiol-Gold + MCH backfilling | 6.45 × 10³ TCID₅₀/mL (nasal fluid) | < 25 min | [36] |
| Hepatitis B (HBsAg) | Antibody | Hydrogen Bonding (Cysteamine SAM) | 0.14 ng/mL | N/R | [35] |
| Hepatitis B (HBsAg) | Antibody | Covalent (Cysteamine + Glutaraldehyde) | 0.32 ng/mL | N/R | [35] |
| Ebola Virus (cDNA) | DNA Probe | Streptavidin-Biotin (on magnetic beads) | 200 ymol (~120 molecules) | < 2.5 h | [13] |
| Hepatitis A Virus (cDNA) | DNA Probe | Thiol-Gold (direct) | 6.94 fg/μL | Rapid | [13] |
N/R: Not explicitly Reported in the source.
This application note details the use of Electrochemical Impedance Spectroscopy (EIS) for the label-free detection of pathogenic viruses, including SARS-CoV-2, influenza, and key waterborne pathogens. EIS-based biosensors leverage the change in electrical impedance at an electrode-solution interface upon specific binding of a viral target to an immobilized biorecognition element. The documented case studies demonstrate platforms that achieve high sensitivity and specificity, with detection times often under 30 minutes, showcasing the potential of EIS for rapid diagnostics and environmental monitoring [8] [37].
Case Study 1: SARS-CoV-2 Detection
Label-Free Capacitive Immunosensing of SARS-CoV-2 Antibodies
This study utilized a commercially available impedance-sensing platform for the rapid detection of anti-SARS-CoV-2 antibodies in human serum.
- Principle: A pre-coated recombinant receptor binding domain (RBD) of the SARS-CoV-2 spike protein captures specific antibodies from the sample. The binding event alters the electrical double-layer capacitance at the electrode surface, which is measured as a change in impedance.
- Performance: The platform successfully differentiated between COVID-19 positive and negative patient sera in less than five minutes. The impedance measurements showed a strong correlation (R² = 0.9) with standard ELISA results, validating its accuracy [38].
RdRp Gene Fragment Detection with a Graphdiyne-Based Genosensor
This case study highlights the use of a novel 2D nanomaterial, graphdiyne, for the detection of a SARS-CoV-2-specific gene sequence.
- Principle: A single-stranded DNA (ssDNA) probe, complementary to the RNA-dependent RNA polymerase (RdRp) gene of SARS-CoV-2, is immobilized on a graphdiyne-modified electrode. Hybridization with the target DNA sequence increases the charge transfer resistance (Rct), which is measured via EIS.
- Performance: The sensor demonstrated a linear dynamic range from 10⁻⁹ M to 10⁻⁵ M and high selectivity, effectively distinguishing the target from mutant and non-complementary sequences [14].
Simultaneous Detection of TB and SARS-CoV-2 Biomarkers
This research presents a multiplexed EIS-aptasensor for the concurrent detection of tuberculosis (MPT64 antigen) and SARS-CoV-2 (S-glycoprotein) biomarkers.
- Principle: Thiolated aptamers specific to each antigen are co-immobilized on a single screen-printed gold electrode (SPGE). Binding of either target protein causes an increase in Rct.
- Performance: The aptasensor achieved detection limits in the sub-picogram per milliliter range for both targets in buffer and human serum, demonstrating a robust, label-free platform for diagnosing co-infections [5].
Table 1: Summary of EIS-based Biosensors for SARS-CoV-2 Detection
| Target | Biorecognition Element | Sensor Platform | Detection Limit | Assay Time | Sample Matrix |
|---|---|---|---|---|---|
| Anti-Spike RBD Antibodies | Spike RBD Protein | Commercial ACEA xCELLigence | Correlation with ELISA | < 5 minutes | Human Serum [38] |
| S-glycoprotein Antigen | Anti-Spike Antibody | Graphene Electrode | 5.5 × 10⁵ PFU/mL | 45 minutes | Viral Transport Media [39] |
| RdRp Gene Sequence | Complementary ssDNA Probe | Graphdiyne-modified Electrode | Nanomolar Range | Not Specified | Buffer [14] |
| S-glycoprotein Antigen | S-glycoprotein Aptamer | Screen-Printed Gold Electrode | 0.319 pg/mL (Buffer), 1.421 pg/mL (Serum) | 10 minutes | Buffer & Human Serum [5] |
Case Study 2: Influenza Virus Detection
Ultrasensitive Glycan-Based Biosensor for Influenza H3N2
This work employs host-cell-mimicking glycans as bioreceptors for the specific detection of intact influenza viral particles.
- Principle: Glycans with terminal sialic acids (α2-3 or α2-6 linked), which are natural receptors for influenza hemagglutinin, are immobilized on a gold electrode via a mixed self-assembled monolayer (SAM) of OEG-thiols. Viral binding insulates the electrode surface, increasing charge transfer resistance.
- Performance: The biosensor achieved an exceptionally low limit of detection of 13 viral particles/μL and could distinguish between H3N2 and H7N7 virus subtypes based on their glycan binding preferences [40].
Electrochemical H1N1 Biosensor with Multifunctional DNA 4-Way Junction
This study describes a sophisticated sensor using a DNA nanostructure and 2D nanomaterial for signal amplification.
- Principle: A DNA four-way junction (4WJ) structure is functionalized with an H1N1 hemagglutinin aptamer (head), silver ions for signal amplification (arms), and an amine group for immobilization (tail). This 4WJ is anchored to a carboxylated molybdenum disulfide (carboxyl-MoS₂)-modified electrode. Virus binding causes a measurable change in electron transfer.
- Performance: The biosensor detected H1N1 in a wide linear range (100 nM to 10 pM) and maintained its performance in clinical tests with human serum [41].
Table 2: Summary of EIS-based Biosensors for Influenza Virus Detection
| Influenza Subtype | Biorecognition Element | Sensor Platform | Detection Limit | Key Feature |
|---|---|---|---|---|
| H3N2 | Sialic Acid-terminated Glycans | Gold Electrode with OEG-SAM | 13 particles/μL | Mimics natural host-cell recognition [40] |
| H1N1 | Hemagglutinin Aptamer integrated into DNA 4WJ | Carboxyl-MoS₂ Hybrid Material | 10 pM | Signal amplification via silver ions [41] |
Case Study 3: Waterborne Virus Detection
EIS biosensors are being adapted to address the significant challenges of detecting waterborne viruses in complex environmental matrices like wastewater.
- Challenges: Waterborne pathogens, such as norovirus (NoV), hepatitis A (HAV), and rotavirus (RV), are often present at ultralow concentrations and require sample concentration. The complex wastewater matrix, containing organic substances, humic acids, and other microorganisms, can cause fouling and interfere with sensor performance [42].
- Strategies: Research focuses on optimizing bioreceptors (e.g., aptamers, MIPs) for stability and selecting transducer materials that minimize non-specific binding. The integration of EIS with microfluidic systems for sample pre-treatment and concentration is a key direction for enabling on-site water quality monitoring [42] [37].
Detailed Experimental Protocols
This protocol uses a commercially available 16-well plate system with integrated gold electrodes.
- Electrode Functionalization:
- Coat wells with 50 μL of SARS-CoV-2 spike RBD protein (2.5 μg/mL in PBS).
- Seal the plate and incubate at 4°C for 1-3 days.
- Well Preparation and Blocking:
- Decant the coating solution and wash each well three times with 200 μL of 0.1% PBS-Tween (PBS-T).
- Add 100 μL of blocking solution (3% milk) and incubate for 1 hour.
- Decant the block and add 100 μL of 1% milk solution (background buffer).
- Acquire the baseline impedance measurement (Z₀) at 10 kHz.
- Sample Measurement:
- Aspirate 50 μL of background buffer from the well.
- Immediately add 50 μL of the sample (e.g., serum diluted 1:100 in 1% milk solution).
- Continuously acquire impedance measurements (Z) for 5 minutes.
- Data Analysis:
- Calculate the change in impedance: ΔZ = Z - Z₀.
- A positive ΔZ spike indicates the presence of anti-SARS-CoV-2 antibodies.
This protocol describes the functionalization of a dual screen-printed gold electrode (SPGE).
- Electrode Pretreatment:
- Clean the SPGE by cycling in 0.5 M H₂SO₄ and characterize in 0.1 M KCl containing 5 mM [Fe(CN)₆]³⁻/⁴⁻.
- Aptamer Immobilization:
- Incubate the SPGE with a mixture of thiolated MPT64 and S-glycoprotein aptamers (diluted in TCEP-activated TBS buffer) for 18 hours at 4°C.
- Surface Blocking:
- Rinse the electrode and incubate with 1 mM 6-mercapto-1-hexanol (MCH) for 1 hour to block non-specific sites on the gold surface.
- Target Incubation and EIS Measurement:
- Incubate the functionalized SPGE with the sample (analyte in buffer or diluted serum) for 10 minutes.
- Wash the electrode gently with TBS buffer.
- Perform EIS measurement in 0.1 M KCl with 5 mM [Fe(CN)₆]³⁻/⁴⁻. The frequency range is typically from 0.1 Hz to 10 kHz at a formal potential of 0.17 V.
- Data Analysis:
- Fit the obtained Nyquist plots to a modified Randles equivalent circuit to extract the charge transfer resistance (Rct).
- The increase in Rct (ΔRct) is proportional to the concentration of the captured target antigen.
- SAM Formation:
- Immerse a clean gold electrode in an ethanol solution containing a mixture of OEG-COOH and OEG-OH thiols (optimal ratio 1:5) for at least 18 hours to form a stable, non-fouling monolayer.
- Glycan Immobilization:
- Activate the terminal carboxyl groups on the SAM using a solution of EDC and NHS.
- Incubate the electrode with a solution of the desired sialic acid-terminated glycan, which will form an amide bond with the activated surface.
- Virus Detection:
- Incubate the functionalized electrode with the sample solution containing inactivated influenza viruses.
- Wash the electrode to remove unbound particles.
- EIS Measurement:
- Perform EIS in a solution containing a redox probe like [Fe(CN)₆]³⁻/⁴⁻.
- The binding of the viral particles to the glycans will cause an increase in charge transfer resistance (Rct), which is quantified.
The Scientist's Toolkit
Table 3: Key Research Reagent Solutions for EIS-based Viral Detection
| Reagent / Material | Function in Assay Development | Example Use Case |
|---|---|---|
| Recombinant Viral Proteins (e.g., Spike RBD, Hemagglutinin) | Serve as capture antigens for antibody detection or as targets for aptamer/antibody-based sensors. | Coating electrode for SARS-CoV-2 serology [38]; Target for H1N1 aptasensor [41]. |
| Specific Aptamers | Synthetic oligonucleotide bioreceptors that bind targets with high affinity; offer stability and ease of modification. | Immobilized on SPGE for S-glycoprotein and MPT64 detection [5]; Integrated into DNA 4WJ for H1N1 detection [41]. |
| Thiolated Probes (DNA, RNA, Glycans) | Allow for stable, covalent immobilization onto gold electrode surfaces via gold-sulfur (Au-S) bonds. | Creating self-assembled monolayers (SAMs) for glycan [40] and aptamer [5] immobilization. |
| Screen-Printed Electrodes (SPEs) | Disposable, miniaturized, and mass-producible electrodes that form the core of portable, point-of-care devices. | Used as the transducer in multiplexed TB/COVID aptasensor [5] and other portable platforms [37]. |
| Nanomaterials (Graphdiyne, MoS₂) | Enhance electrode surface area and electronic properties, leading to improved sensitivity and signal amplification. | Graphdiyne for RdRp gene sensing [14]; Carboxyl-MoS₂ in H1N1 DNA 4WJ sensor [41]. |
| Redox Probes ([Fe(CN)₆]³⁻/⁴⁻) | A soluble molecule that shuttles electrons to the electrode; its efficiency is perturbed by binding events, generating the EIS signal. | Used in virtually all Faradaic EIS detection schemes to monitor charge transfer resistance (Rct) [5] [43] [14]. |
Multiplexed EIS Platforms for Simultaneous Multi-Virus Detection
The co-circulation of multiple respiratory viruses, such as SARS-CoV-2, influenza, and respiratory syncytial virus (RSV), presents a significant diagnostic challenge, as these pathogens often cause overlapping clinical symptoms but require different treatment and management strategies [44]. In this context, electrochemical impedance spectroscopy (EIS) has emerged as a powerful label-free technique for biosensing, offering sensitive, specific, and rapid detection of pathogens without the need for complex labeling procedures [8]. EIS-based biosensors are particularly valuable for multiplexed detection platforms, as they can monitor changes in electrical properties at the electrode-electrolyte interface resulting from the binding of target pathogens to immobilized bioreceptors [8] [5].
The escalating threat of infectious diseases and the prevalence of coinfections necessitate diagnostic technologies that are not only rapid and sensitive but also capable of simultaneous pathogen detection [45] [8]. This application note details the development and implementation of a multiplexed EIS aptasensor for the simultaneous detection of Mycobacterium tuberculosis and SARS-CoV-2, providing researchers with a framework that can be adapted for detecting other viral pathogens.
Experimental Principle and Design
Electrochemical impedance spectroscopy operates by applying a small-amplitude sinusoidal alternating current (AC) voltage across a range of frequencies and measuring the corresponding current response [8]. The fundamental strength of EIS lies in its exceptional sensitivity to subtle changes occurring at the electrode-electrolyte interface, where biorecognition events take place [8]. In a typical EIS biosensor, the binding of target pathogens to bioreceptors immobilized on the electrode surface alters the interfacial electrical properties, manifesting as changes in charge transfer resistance (Rct), interfacial capacitance, or other dielectric characteristics [8] [5].
For multiplexed detection, a dual-platform approach utilizing a screen-printed gold electrode (SPGE) enables simultaneous functionalization with different specific aptamers, each targeting a distinct pathogen [5]. The selection of aptamers with high specificity and affinity is crucial for minimizing cross-reactivity and achieving the desired detection limits in complex matrices such as human serum.
The diagram below illustrates the experimental workflow for developing and utilizing a multiplexed EIS aptasensor.
Key Research Reagent Solutions
The successful implementation of a multiplexed EIS biosensor relies on carefully selected materials and reagents, each serving specific functions in the sensor architecture and detection mechanism.
Table 1: Essential Research Reagents for Multiplexed EIS Biosensing
| Reagent/Category | Specific Examples | Function in Biosensor Development |
|---|---|---|
| Biorecognition Elements | Thiolated aptamers against MPT64 & S-glycoprotein [5] | High-affinity target capture; provide specificity through sequence complementarity or molecular recognition |
| Electrode Materials | Screen-printed gold electrode (SPGE) [5] | Transducer platform; enables reproducible fabrication and easy surface functionalization |
| Surface Chemistry | 6-Mercapto-1-hexanol (MCH) [5] | Blocking agent; minimizes non-specific binding and optimizes bioreceptor orientation |
| Electrochemical Probe | Potassium ferri/ferrocyanide [Fe(CN)₆]³⁻/⁴⁻ [5] | Redox couple; enables charge transfer resistance (Rct) monitoring |
| Nanomaterials | Gold nanoparticles, carbon nanotubes, graphene [8] | Signal amplification; increase electrode surface area and enhance electron transfer |
| Sample Matrix | Fetal bovine serum, human serum [5] | Validation medium; tests sensor performance in biologically relevant conditions |
Detailed Experimental Protocol
Aptasensor Fabrication
Electrode Pretreatment: Clean screen-printed gold electrodes (SPGEs) electrochemically through cyclic voltammetry (CV) in 0.5 M H₂SO₄ solution by applying potential scans between -0.2 V and +1.5 V (vs. Ag/AgCl reference) at a scan rate of 100 mV/s until stable voltammograms are obtained [5].
Aptamer Functionalization:
- Prepare thiolated aptamer solutions (1 μM final concentration) in Tris-HCl buffer (pH 7.4) containing 1 mM TCEP as a reducing agent to cleave disulfide bonds [5].
- Incubate 10 μL of aptamer solution on the SPGE working electrode surface overnight at 4°C in a humidified chamber.
- For multiplexing, spatially separate different aptamer solutions on designated working electrodes in a multi-channel configuration.
Surface Blocking:
- Rinse the aptamer-functionalized electrode gently with PBS (pH 7.4) to remove unbound aptamers.
- Treat with 1 mM 6-mercapto-1-hexanol (MCH) in PBS for 1 hour at room temperature to passivate uncovered gold surfaces and minimize non-specific binding [5].
- Wash thoroughly with PBS and store in buffer at 4°C until use.
EIS Measurement Procedure
Experimental Setup: Assemble a three-electrode system with the functionalized SPGE as the working electrode, platinum wire as the counter electrode, and Ag/AgCl as the reference electrode [5].
Measurement Parameters:
- Use 5 mM K₃[Fe(CN)₆]/K₄[Fe(CN)₆] (1:1 mixture) in PBS as the redox probe [5].
- Apply a DC potential of 0.2 V (vs. Ag/AgCl) with a sinusoidal AC voltage amplitude of 10 mV.
- Sweep frequency from 0.1 Hz to 100 kHz, collecting 20-30 data points per frequency decade.
- Perform all measurements at stable room temperature (23 ± 2°C).
Data Acquisition:
- Measure impedance spectra before and after sample incubation.
- Record Nyquist plots and extract charge transfer resistance (Rct) values by fitting to appropriate equivalent circuit models.
- Perform triplicate measurements for each sample to ensure reproducibility.
Sample Processing and Analysis
Sample Incubation: Incubate 10 μL of sample (antigens in buffer or diluted serum) on the functionalized SPGE for 10 minutes at room temperature [5].
Calibration Curve: Prepare serial dilutions of target antigens (0.01 pg/mL to 10 pg/mL) in both buffer and human serum to establish calibration curves [5].
Data Analysis: Calculate the normalized impedance response as ΔRct/Rct₀ = (Rct - Rct₀)/Rct₀, where Rct₀ and Rct are the charge transfer resistances before and after target binding, respectively [5].
Performance Data and Analysis
The multiplexed EIS aptasensor demonstrates excellent sensitivity and specificity for simultaneous detection of pathogens across clinically relevant concentration ranges.
Table 2: Analytical Performance of Multiplexed EIS Aptasensor for Pathogen Detection
| Target Pathogen | Biomarker | Linear Range (pg/mL) | Limit of Detection (LOD) | Specificity Against Non-Targets |
|---|---|---|---|---|
| Mycobacterium tuberculosis | MPT64 antigen | 0.01 - 10 [5] | 0.053 pg/mL (buffer)0.085 pg/mL (serum) [5] | High specificity against MPXV, MERS-CoV [5] |
| SARS-CoV-2 | S-glycoprotein | 0.01 - 10 [5] | 0.319 pg/mL (buffer)1.421 pg/mL (serum) [5] | High specificity against MPXV, MERS-CoV [5] |
The sensor maintains good storage stability for up to 22 days when stored in PBS at 4°C, with less than 10% signal degradation [5]. The slight reduction in sensitivity observed in human serum compared to buffer demonstrates the importance of validating biosensor performance in biologically relevant matrices.
Signal Transduction Mechanism
The following diagram illustrates the binding-induced impedance changes that enable quantitative detection in the EIS aptasensor.
Troubleshooting and Optimization Guidelines
| Issue | Potential Cause | Solution |
|---|---|---|
| High non-specific binding | Incomplete surface blocking | Optimize MCH concentration and incubation time; consider alternative blocking agents (e.g., BSA, casein) |
| Poor reproducibility | Inconsistent electrode pretreatment | Standardize cleaning protocol; verify electrode surface quality through CV in standard redox probe |
| Reduced sensitivity in serum | Matrix interference or biofouling | Dilute serum samples; incorporate additional washing steps; use nanomaterial coatings to resist fouling |
| Signal drift | Unstable bioreceptor immobilization | Ensure proper aptamer reduction with TCEP; verify storage conditions; functionalize electrodes freshly before use |
| Limited multiplexing capacity | Cross-talk between adjacent electrodes | Increase spatial separation; implement differential functionalization protocols; use multi-well configurations |
This application note has detailed the development and implementation of a multiplexed EIS platform for simultaneous detection of multiple viral pathogens. The EIS-based aptasensor platform demonstrates exceptional sensitivity, with detection limits in the picogram per milliliter range, and maintains performance in complex biological matrices like human serum [5]. The methodology presented provides researchers with a robust framework that can be adapted for detecting various viral targets through appropriate selection of biorecognition elements.
The future development of EIS-based multiplexed detection platforms will benefit from integration with microfluidic systems for automated sample handling, incorporation of novel nanomaterials for enhanced signal amplification, and implementation of machine learning algorithms for improved data analysis and pathogen discrimination [8] [6]. These advancements will further establish EIS as a cornerstone technology in the field of rapid, multiplexed pathogen diagnostics, potentially transforming approaches to outbreak management and clinical care.
Overcoming Challenges in EIS Biosensor Performance
Addressing Non-Specific Binding and Matrix Effects in Complex Samples
Electrochemical impedance spectroscopy (EIS) has emerged as a powerful, label-free technique for the direct detection of viral pathogens, offering significant advantages in sensitivity and suitability for point-of-care (POC) diagnostics [8]. However, the application of EIS-based biosensors to complex biological samples (e.g., serum, saliva, blood) presents a substantial challenge due to non-specific binding (NSB) of interfering compounds and matrix effects that can obscure the specific signal from the target analyte [8]. NSB occurs when molecules other than the intended target adsorb onto the sensor surface, altering the interfacial properties and leading to false positives or an overestimation of target concentration [25]. Matrix effects refer to the influence of the sample's overall environment on the assay performance, including its ionic strength, pH, and the presence of macromolecules that can foul the electrode surface [4]. For researchers and drug development professionals, addressing these challenges is paramount to developing robust, reliable, and clinically applicable EIS biosensors. This Application Note details standardized protocols and material strategies to mitigate these issues, ensuring data quality and sensor reproducibility.
Key Challenges and Impact on EIS Biosensing
The fundamental operating principle of label-free EIS biosensing involves measuring changes in charge transfer resistance (Rct) or interfacial capacitance resulting from the specific binding of a target virus to a biorecognition element immobilized on the electrode surface [8] [14]. The integrity of this measurement is highly susceptible to interfacial perturbations.
- Non-Specific Binding (NSB): In complex matrices like human serum, proteins (e.g., albumin, immunoglobulins), lipids, and other biomolecules can physisorb onto the electrode, irrespective of the biorecognition element [25]. This non-specific adsorption directly increases the Rct, mimicking the signal from a target virus and compromising the sensor's specificity and accuracy [4].
- Matrix Effects: Variations in sample composition can influence the diffusional properties of the redox probe (e.g.,
[Fe(CN)₆]³⁻/⁴⁻) and the electrical double-layer structure, thereby altering the impedance baseline and leading to inconsistent results between different sample batches [8] [46]. The inherently lowΔRct/decadesensitivity of impedance transduction amplifies the impact of these interferences [8].
The following table summarizes the primary sources of interference and their concrete effects on EIS measurements.
Table 1: Common Interferences in EIS-Based Virus Detection and Their Impacts
| Interference Type | Source in Complex Samples | Impact on EIS Signal |
|---|---|---|
| Protein Fouling | Albumin, glycoproteins, immunoglobulins in serum or saliva [25] | Increased Rct due to non-specific protein layer blocking electron transfer [4] |
| Lipid Adsorption | Lipoproteins, cell membranes in blood [8] | Altered dielectric properties, affecting interfacial capacitance |
| Cross-reactivity | Non-target pathogens with similar epitopes or genetic sequences [25] | False positive signal due to binding to non-complementary probes |
| High Ionic Strength | Buffers, physiological fluids (e.g., saliva, sweat) [8] | Compression of the electrical double layer, masking Faradaic processes |
Material Solutions for Interference Mitigation
A multi-faceted approach combining advanced nanomaterials, effective surface blocking, and optimized biorecognition elements is essential to counteract NSB and matrix effects.
Research Reagent Solutions Toolkit
Table 2: Essential Reagents for Minimizing Non-Specific Binding
| Reagent / Material | Function / Rationale | Example Application |
|---|---|---|
| 6-Mercapto-1-hexanol (MCH) | Creates a hydrophilic, anti-fouling monolayer on gold surfaces; displaces non-specifically adsorbed bioreceptors and shields the electrode from NSB [4]. | Post-immobilization blocking of thiolated aptamers on screen-printed gold electrodes (SPGE) [4]. |
| Bovine Serum Albumin (BSA) | A common blocking protein that occupies uncovered hydrophobic binding sites on the electrode and immobilization matrix [46]. | Used as a blocking agent in paper-based EIS devices (ePADs) for virus detection [46]. |
| Ethanolamine | Quenches unreacted ester groups from carbodiimide crosslinking chemistry, preventing subsequent nonspecific covalent binding [46]. | Blocking step after carboxylate-amine conjugation on electrode surfaces [46]. |
| Poly(ethylene glycol) (PEG) | Provides a highly hydrated, sterically repulsive layer that reduces protein adsorption [46]. | Incorporated into mixed self-assembled monolayers (SAMs) or as a blocking agent. |
| Nanomaterials (Graphdiyne, MOFs) | Enhance electron transfer, provide high surface area for probe immobilization, and can possess intrinsic anti-fouling properties [14] [47]. | Graphdiyne platforms for SARS-CoV-2 RdRp gene detection show high selectivity against mutant sequences [14]. |
Strategic Use of Nanomaterials and 3D Architectures
The integration of nanomaterials and three-dimensional (3D) structures is a powerful strategy to enhance performance. Materials like graphdiyne, a 2D carbon allotrope, provide a highly π-conjugated surface for strong biomolecule adsorption while enabling excellent electron transfer and selectivity, as demonstrated in a sensor that distinguished SARS-CoV-2 target genes from mutant sequences [14]. Similarly, employing 3D immobilization scaffolds such as metal-organic frameworks (MOFs), hydrogels, or 3D graphene oxide significantly increases the density and accessibility of capture probes (e.g., antibodies, aptamers), which improves the signal-to-noise ratio by amplifying the specific signal relative to background NSB [25].
Standardized Experimental Protocols
The following protocols are consolidated from recent, high-performance EIS studies and are designed to be adapted for various virus targets.
Protocol 1: Aptamer Functionalization for SPGE
This protocol is adapted from a study that successfully detected Mycobacterium tuberculosis and SARS-CoV-2 antigens in human serum with high sensitivity [4].
Workflow Overview
Materials
- Transducer: Screen-printed gold electrode (SPGE)
- Biorecognition Element: Thiol-modified DNA or RNA aptamer (specific to target virus)
- Blocking Agent: 6-Mercapto-1-hexanol (MCH), 1 mM in PBS or Tris-HCl buffer
- Chemical Reagents: Tris(2-carboxyethyl)phosphine hydrochloride (TCEP), Potassium ferri/ferrocyanide (
K₃[Fe(CN)₆]/K₄[Fe(CN)₆]), Magnesium chloride (MgCl₂), Phosphate-buffered saline (PBS) - Apparatus: Potentiostat with EIS capability, µStat-i MultiX or equivalent [4]
Step-by-Step Procedure
- Electrode Pretreatment: Clean the SPGE by performing cyclic voltammetry (CV) in 0.5 M
H₂SO₄(e.g., 10 cycles between 0 V and +1.6 V vs. pseudo-Ag/AgRef) until a stable CV profile is obtained. Rinse thoroughly with deionized water and dry under a gentle stream ofN₂gas. - Aptamer Reduction and Immobilization:
- Prepare a 1 µM solution of the thiolated aptamer in an appropriate buffer (e.g., 10 mM Tris-HCl, pH 7.4, with 1 mM TCEP). Incubate for 1 hour at room temperature to reduce disulfide bonds.
- Pipette 10 µL of the reduced aptamer solution onto the working electrode surface.
- Incubate the electrode in a humidified chamber for 16 hours (overnight) at 4°C to allow for the formation of a stable Au-S self-assembled monolayer.
- Surface Blocking:
- Rinse the electrode gently with PBS to remove loosely bound aptamers.
- Pipette 10 µL of 1 mM MCH solution onto the electrode and incubate for 1 hour at room temperature. This critical step displaces non-specifically adsorbed aptamers and creates a hydrophilic barrier against NSB.
- Rinse again with PBS to remove excess MCH.
- Target Incubation and EIS Measurement:
- Prepare a solution containing the target virus or antigen in the desired matrix (e.g., buffer or diluted human serum).
- Pipette 10 µL of the sample onto the functionalized SPGE and incubate for 10 minutes at room temperature.
- Rinse the electrode with PBS to remove unbound material.
- Perform EIS measurement in a solution of 5 mM
K₃[Fe(CN)₆]/K₄[Fe(CN)₆](1:1 mixture) in PBS. Apply a DC potential at the formal potential of the redox couple (typically ~ +0.22 V vs. Ag/AgCl) with an AC voltage amplitude of 10 mV, scanning frequencies from 100 kHz to 0.1 Hz.
- Data Analysis: Monitor the change in charge transfer resistance (Rct), derived from fitting the Nyquist plot to a suitable equivalent circuit (e.g., the Randles circuit). The
ΔRctis correlated to the target concentration.
Protocol 2: Antibody Immobilization on Paper-Based Devices (ePADs)
This protocol is adapted from a sensitive EIS-based platform for detecting intact West Nile virus particles [46].
Workflow Overview
Materials
- Transducer: Gold microwires (25 µm diameter) integrated into a microfluidic paper-based analytical device (µPAD)
- Biorecognition Element: Specific antibody for the target virus
- Crosslinking Reagents: Lipoic acid, 1-ethyl-3-(3-(dimethylamino)propyl)-carbodiimide (EDC), N-hydroxysulfosuccinimide (NHS)
- Blocking/Quenching Agents: Ethanolamine, Bovine Serum Albumin (BSA)
- Buffers: 2-(N-morpholino)ethanesulfonic acid (MES) buffer (0.05 M, pH 6.0), PBS
Step-by-Step Procedure
- Device and Electrode Preparation: Fabricate the µPAD with integrated Au microwires using wax printing and lamination techniques as described in the literature [46].
- Gold Microwire Cleaning: Immerse the Au microwires in a piranha solution (3:1 v/v
H₂O₂/NaOH) for 20 minutes. Caution: Piranha solution is highly corrosive and must be handled with extreme care. Rinse thoroughly with deionized water and anhydrous ethanol. - Formation of Self-Assembled Monolayer (SAM): Incubate the clean Au microwires in a 1.0 mM solution of lipoic acid (a dithiol) in anhydrous ethanol for 16 hours in an
O₂-free, dark environment. The dithiol moiety provides a more robust anchor than monothiols. Rinse with ethanol and water. - Antibody Conjugation:
- Activate the terminal carboxyl groups of the SAM by incubating the electrodes in a fresh solution of 400 µM EDC and 800 µM NHS in 0.05 M MES buffer (pH 6.0) for 30 minutes.
- Rinse with MES buffer.
- Incubate the electrodes with the specific antibody (e.g., 200 µg/mL in MES buffer) for 4 hours. The antibody's primary amines will form amide bonds with the activated ester.
- Quenching and Blocking: Incubate the functionalized electrodes in 0.1 M ethanolamine for 40 minutes to quench any remaining activated ester groups. Subsequently, a blocking step with 1% BSA can be introduced for 1 hour to further minimize NSB.
- Virus Detection: Introduce the sample into the µPAD. The flow-ePAD design enhances mass transport, improving the capture efficiency of virus particles on the antibody-modified wires [46]. Perform EIS measurement as described in Protocol 1.
Performance Benchmarking and Data Quality Control
Implementing the above strategies leads to quantifiable improvements in sensor performance. The following table benchmarks achievable results in both buffer and complex matrices.
Table 3: Performance Benchmark of EIS Biosensors in Complex Samples
| Target Virus | Biorecognition Element | Sample Matrix | Limit of Detection (LOD) | Key Mitigation Strategy(s) | Reference |
|---|---|---|---|---|---|
| SARS-CoV-2 (S-glycoprotein) | Thiolated Aptamer | Buffer (PBS) | 0.319 pg/mL | MCH blocking on SPGE | [4] |
| SARS-CoV-2 (S-glycoprotein) | Thiolated Aptamer | Human Serum | 1.421 pg/mL | MCH blocking on SPGE | [4] |
| M. tuberculosis (MPT64) | Thiolated Aptamer | Buffer (PBS) | 0.053 pg/mL | MCH blocking on SPGE | [4] |
| M. tuberculosis (MPT64) | Thiolated Aptamer | Human Serum | 0.085 pg/mL | MCH blocking on SPGE | [4] |
| West Nile Virus (whole particle) | Antibody | Cell Culture Media | 10.2 particles/50 µL | Dithiol SAM, flow-enhanced capture in ePAD | [46] |
| SARS-CoV-2 (RdRp gene) | DNA Probe on Graphdiyne | Buffer | Nanomolar range | Graphdiyne platform with high selectivity | [14] |
To ensure the reliability of EIS data, adherence to fundamental quality control criteria is essential. The measurement must demonstrate:
- Linearity: The system's response should be proportional to the applied perturbation.
- Stability: The system should not change during the measurement period.
- Causality: The response must be solely due to the applied signal [48]. Tools such as Kramers-Kronig transformations or built-in potentiostat quality indicators (e.g., for Total Harmonic Distortion - THD) should be used to validate data integrity [48].
Mitigating non-specific binding and matrix effects is a critical hurdle in the translation of EIS-based viral biosensors from research laboratories to clinical and point-of-care settings. A systematic approach is required, combining careful surface chemistry with strategic material selection. As demonstrated, the use of high-quality anti-fouling agents like MCH, robust conjugation chemistries employing dithiol SAMs, and the integration of novel nanomaterials like graphdiyne or 3D scaffolds provide a powerful toolkit for researchers. The standardized protocols outlined herein offer a reproducible pathway to achieving high sensitivity and specificity in complex samples, forming a solid foundation for the next generation of reliable and deployable diagnostic tools. Future developments in multiplexed detection and integration with artificial intelligence for data analysis will further depend on the foundational stability provided by effective interference mitigation [8] [47].
Strategies for Enhancing Sensitivity and Lowering the Limit of Detection (LOD)
Electrochemical Impedance Spectroscopy (EIS) has emerged as a powerful technique in the field of virus detection, offering label-free, sensitive, and specific analysis of viral pathogens. The technique involves applying a small amplitude sinusoidal potential excitation to an electrochemical cell and measuring the resulting current response, which is used to calculate impedance [49] [50]. The effectiveness of EIS biosensors is critically dependent on their sensitivity and Limit of Detection (LOD), which must be optimized for reliable early diagnosis of viral infections. This application note outlines key strategies for enhancing EIS biosensor performance, with a specific focus on applications in virus detection research, providing detailed protocols and methodologies for researchers and scientists in drug development.
Key Strategies for Enhanced Sensitivity and Lower LOD
Electrode Functionalization and Probe Immobilization
The functionalization of the transducer surface and the immobilization of biorecognition elements are fundamental to achieving high sensitivity. A dual-platform approach on screen-printed gold electrodes (SPGEs) has demonstrated exceptional performance for the simultaneous detection of tuberculosis and SARS-CoV-2 biomarkers.
Table 1: Performance of an Optimized EIS Aptasensor for Viral Detection
| Target Antigen | Matrix | Detection Limit | Linear Range | Reference |
|---|---|---|---|---|
| MPT64 (Mycobacterium tuberculosis) | Buffer | 0.053 pg/mL | 0.01 pg/mL to 10 pg/mL | [5] |
| S-glycoprotein (SARS-CoV-2) | Buffer | 0.319 pg/mL | 0.01 pg/mL to 10 pg/mL | [5] |
| MPT64 (Mycobacterium tuberculosis) | Human Serum | 0.085 pg/mL | 0.01 pg/mL to 10 pg/mL | [5] |
| S-glycoprotein (SARS-CoV-2) | Human Serum | 1.421 pg/mL | 0.01 pg/mL to 10 pg/mL | [5] |
Experimental Protocol: Electrode Functionalization with Thiolated Aptamers
- Electrode Preparation: Clean SPGEs with ethanol and deionized water, then dry under nitrogen stream.
- Aptamer Preparation: Prepare 1 µM thiolated aptamer solution in Tris-HCl buffer (pH 7.4) containing 1 mM TCEP as a reducing agent. Incubate at room temperature for 1 hour to reduce disulfide bonds.
- Aptamer Immobilization: Deposit 5 µL of the reduced aptamer solution onto the SPGE working electrode. Incubate in a humid chamber for 16 hours at 4°C.
- Surface Blocking: Rinse electrode with Tris-HCl buffer and incubate with 1 mM 6-mercapto-1-hexanol (MCH) for 1 hour to block non-specific binding sites.
- Sensor Storage: Store the functionalized aptasensor in Tris-HCl buffer at 4°C when not in use. The sensor maintains good stability for up to 22 days [5].
3D Surface Engineering and Nanomaterial Integration
Incorporating three-dimensional (3D) structured materials significantly enhances biosensor performance by expanding the available surface area for probe immobilization and improving signal transduction. This strategy increases the density of capture probes and enhances the efficiency of electron transfer.
Table 2: Nanomaterials for 3D Probe Immobilization in Biosensors
| Material Category | Specific Examples | Key Functions | Impact on Performance |
|---|---|---|---|
| Metal Nanoparticles | Gold Nanoparticles (AuNPs) | Enhanced electron transfer, high surface-to-volume ratio | Increases signal amplitude, lowers LOD |
| Carbon-based Materials | 3D Graphene Oxide, Carbon Nanotubes | Excellent conductivity, large surface area | Improves sensitivity and response time |
| Framework Materials | Metal-Organic Frameworks (MOFs), Covalent-Organic Frameworks | Tunable porosity, high surface area | Enhances probe loading capacity, selective capture |
| Hydrogels | Polymer Hydrogels | Biocompatible matrix, aqueous environment | Preserves biorecognition element activity |
Experimental Protocol: 3D Surface Modification with Gold Nanoparticles
- Electrode Pretreatment: Clean the electrode surface via cyclic voltammetry (CV) in 0.5 M H₂SO₄ by scanning between -0.2 V and 1.5 V (vs. Ag/AgCl) until a stable CV profile is obtained.
- AuNP Electrodeposition: Prepare an electrodeposition solution containing 1 mM HAuCl₄ and 0.1 M KNO₃. Use chronoamperometry at a constant potential of -0.2 V for 60 seconds to deposit AuNPs onto the electrode surface.
- Surface Characterization: Verify AuNP deposition using scanning electron microscopy (SEM) and electrochemical techniques such as CV and EIS in 5 mM [Fe(CN)₆]³⁻/⁴⁻ solution.
- Probe Immobilization: Functionalize the AuNP-modified surface with thiolated capture probes following the protocol in Section 2.1 [25].
System Optimization and Experimental Parameters
Optimizing the experimental parameters of the EIS system and the microfluidic environment is crucial for maximizing binding efficiency and minimizing non-specific interactions. Computational methods and careful parameter selection can significantly enhance biosensor performance.
Experimental Protocol: Microfluidic Chip Optimization for Viral Detection
- Chip Fabrication: Design a microchannel with length 250 μm and height 40 μm. Position a 20 μm reaction surface on the bottom wall at variable distance (X) from the inlet.
- Parameter Optimization using Taguchi Method:
- Utilize an L9(3⁴) orthogonal array to test different parameter combinations.
- Set parameters: Reynolds number (Re) = 4.10⁻², Damköhler number (Da) = 1000, Schmidt number (Sc) = 10⁵, and dimensionless reaction surface position (X) = 1.
- Perform analysis of variance (ANOVA) to determine parameter significance.
- Binding Kinetics Modeling: Model antigen-antibody binding using the first-order Langmuir-Hinshelwood adsorption model with appropriate association (kₒₙ) and dissociation (kₒff) rate constants [51].
Advanced Data Analysis and Equivalent Circuit Modeling
Accurate interpretation of EIS data through appropriate equivalent circuit models (ECMs) is essential for extracting meaningful biological information. Advanced data-driven approaches can improve model discrimination and parameter estimation.
Experimental Protocol: Data Analysis with Loewner Framework for Model Discrimination
- EIS Measurement: Perform EIS measurements across a frequency range of 0.1 Hz to 100 kHz with an applied potential amplitude of 10 mV.
- Data Preprocessing: Validate data quality using Total Harmonic Distortion (THD) to ensure linearity and Non-Stationary Distortion (NSD) to verify stationarity.
- Loewner Framework Application:
- Input the EIS dataset into the Loewner framework algorithm.
- Extract the Distribution of Relaxation Times (DRT) to identify the number and characteristics of underlying electrochemical processes.
- Select the most appropriate Equivalent Circuit Model based on DRT features.
- Parameter Extraction: Fit the selected ECM to the EIS data to quantify circuit parameters such as charge transfer resistance (Rcₜ) and double layer capacitance [52].
The Scientist's Toolkit
Table 3: Essential Research Reagent Solutions for EIS-based Virus Detection
| Reagent/Material | Function | Example Application |
|---|---|---|
| Thiolated Aptamers | Biorecognition element | Specific binding to viral antigens [5] |
| 6-Mercapto-1-hexanol (MCH) | Surface blocking agent | Reduces non-specific binding on gold surfaces [5] |
| Tris(2-carboxyethyl)phosphine (TCEP) | Reducing agent | Cleaves disulfide bonds in thiolated aptamers [5] |
| Phosphate Buffered Saline (PBS) | Electrolyte solution | Provides ionic strength for electrochemical measurements [5] |
| Potassium Ferricyanide/Ferrocyanide | Redox probe | Monitors changes in charge transfer resistance [5] |
| Bovine Serum Albumin (BSA) | Blocking agent | Reduces non-specific protein adsorption [5] |
| Metal Nanoparticles (e.g., AuNPs) | Signal amplification | Enhances electron transfer and surface area [25] |
Workflow and Signaling Pathways
The following diagram illustrates the complete experimental workflow for developing a high-sensitivity EIS biosensor for virus detection, integrating the strategies and protocols described in this document:
Diagram 1: EIS biosensor development workflow (76 characters)
The mechanism of signal generation in EIS-based viral detection relies on changes in electrical properties at the electrode-solution interface, as illustrated below:
Diagram 2: EIS virus detection signaling (44 characters)
The strategies outlined in this application note provide a comprehensive framework for enhancing the sensitivity and lowering the LOD of EIS-based biosensors for virus detection. Through optimized electrode functionalization, 3D surface engineering, system parameter optimization, and advanced data analysis, researchers can achieve detection limits in the sub-picogram per milliliter range, as demonstrated in recent studies for detecting SARS-CoV-2 and tuberculosis biomarkers. The integration of these approaches offers a pathway to developing highly sensitive, specific, and reliable diagnostic tools that can significantly impact public health responses to viral outbreaks.
Optimizing Assay Reproducibility, Stability, and Shelf Life
Electrochemical Impedance Spectroscopy (EIS) has emerged as a powerful label-free transduction technique for viral pathogen detection, offering significant advantages in sensitivity, cost-effectiveness, and potential for point-of-care deployment [8]. However, the transition from research prototypes to commercially viable and clinically reliable diagnostic tools is hampered by challenges in assay reproducibility, storage stability, and predictable shelf life [53] [54]. These parameters are critical for regulatory approval, clinical adoption, and successful integration into public health strategies, especially during outbreak responses [55] [56].
This application note provides a structured framework and detailed protocols to optimize the key operational stability metrics of EIS-based biosensors for virus detection. By focusing on the critical interplay between biorecognition element immobilization, surface chemistry, nanomaterial integration, and storage conditions, we outline strategies to enhance performance consistency and longevity. The protocols are designed to assist researchers and product developers in overcoming the primary obstacles to robust biosensor manufacturing and deployment.
Quantitative Performance Benchmarks
Table 1: Performance Metrics of Advanced Electrochemical Biosensors
| Parameter | Conventional Biosensors | AI-Optimized/Material-Enhanced Biosensors | Citation |
|---|---|---|---|
| Sensitivity | 60-75% | 85-95% | [53] |
| Specificity | 70-80% | 90-98% | [53] |
| False Positive/Negative Rate | 15-20% | 5-10% | [53] |
| Response Time | 10-15 seconds | 2-3 seconds | [53] |
| Data Processing Speed | 10-20 minutes per sample | 2-5 minutes per sample | [53] |
| Calibration Accuracy (Margin of Error) | 5-10% | <2% | [53] |
| Reproducibility (Relative Standard Deviation) | Information missing | 3.87% (for COVID-19 immunosensor) | [54] |
| Storage Stability (Signal Decrease) | Information missing | 22.3% at 25°C; 12.4% at 4°C (over 10 tests) | [54] |
| Limit of Detection (SARS-CoV-2) | Varies with method | 1.21 × 10⁶ particles/μL (Immunosensor); ~1 fg/mL Spike Protein (LIG/SPC Sensor) | [54] [12] |
Stabilization Strategies for Enhanced Assay Performance
Advanced Probe Immobilization via 3D Scaffolds
A primary strategy for improving both sensor sensitivity and reproducibility is the transition from two-dimensional (2D) to three-dimensional (3D) immobilization of capture probes [25]. Traditional 2D surfaces on flat electrodes offer limited probe density and are more susceptible to variations in surface loading and orientation. Utilizing 3D structures dramatically increases the available surface area for probe attachment, enhancing the binding capacity for viral targets and providing a more robust and consistent signal [25].
Suitable 3D materials include:
- Metal Nanoparticles: Gold nanoparticles (AuNPs) can be electrodeposited onto electrodes to create a porous, high-surface-area conductive layer [25].
- Carbon-Based Materials: 3D graphene oxide and laser-induced graphene (LIG) offer excellent conductivity and a highly functionalizable surface [25] [12].
- Framework Materials: Metal-Organic Frameworks (MOFs) and Covalent-Organic Frameworks (COFs) provide tunable, ordered porous structures for precise probe integration [25].
- Hydrogels & Porous Silica: These materials offer a biocompatible microenvironment that helps maintain the stability and activity of immobilized biomolecules [25].
Surface modification techniques such as spin coating, dip coating, electrodeposition, and layer-by-layer assembly are critical for creating uniform and stable 3D coatings on transducer surfaces [25].
Optimized Surface Passivation and Blocking
After immobilization of the primary capture probe (e.g., antibody or aptamer), non-specific binding sites must be effectively blocked to minimize background noise and false positives, which is crucial for reproducibility. A standard protocol involves incubating the functionalized sensor surface with a low-cost, inert protein such as Bovine Serum Albumin (BSA) [54]. For instance, a COVID-19 immunosensor protocol specifies blocking with 0.01% BSA for 10 minutes to ensure high specificity without compromising the activity of the immobilized antibodies [54]. Alternative blocking agents include casein or synthetic blocking solutions tailored for electrochemical systems.
Strategic Storage and Formulation
The shelf life of a biosensor is predominantly determined by the stability of its biological recognition element. The following storage strategies have been demonstrated to prolong functional activity:
- Refrigerated Storage: Storing immunosensors at 4°C has been shown to significantly improve stability compared to room temperature storage. One study recorded only a 12.4% decrease in sensor response after ten uses when stored at 4°C, versus a 22.3% decrease when stored at 25°C [54].
- Lyophilization: For long-term storage, particularly of ready-to-use sensor strips, lyophilizing (freeze-drying) the biorecognition layer in the presence of stabilizing excipients (e.g., sugars like trehalose) can preserve activity for months.
- Controlled Environment Packaging: Packaging sensors with desiccants in airtight pouches under an inert gas atmosphere (e.g., nitrogen) protects the sensitive biological layer from moisture and oxidative degradation.
Detailed Experimental Protocols
Protocol: Fabrication of a Polymeric and Nanomaterial-Enhanced Immunosensor
This protocol details the construction of a stable COVID-19 immunosensor, adaptable for other viral targets, which demonstrates good reproducibility (RSD of 3.87%) and storage stability [54].
Workflow: Immunosensor Fabrication and Testing
Materials
- Electrode: Pencil Graphite Electrodes (PGE), HB type, 0.9 mm diameter.
- Polymer Monomer: 4-hydroxybenzoic acid (4-HBA).
- Biorecognition Element: Anti-SARS-CoV-2 antibodies.
- Nanomaterial: Silver Nanoparticles (AgNPs).
- Blocking Agent: Bovine Serum Albumin (BSA).
- Electrolyte: Phosphate Buffered Saline (PBS), pH 7.4.
- Redox Probe: 5.0 mM Potassium ferrocyanide/ferricyanide ([Fe(CN)₆]³⁻/⁴⁻) in 0.10 M KCl.
Step-by-Step Procedure
Electrode Pretreatment:
- Polish the PGE working electrode on 600-grit sandpaper for 60 seconds.
- Rinse thoroughly with ultrapure water and sonicate for 5 minutes.
- Dry under a gentle stream of ultrapure nitrogen gas.
- Perform electrochemical pretreatment in 0.10 M H₂SO₄ by applying a potential of -1.10 V for 100 seconds [54].
Electropolymerization:
- Prepare a solution containing 2.50 mM 4-HBA monomer in 0.50 M H₂SO₄.
- Immerse the pretreated PGE in the monomer solution.
- Using Cyclic Voltammetry (CV), run 25 consecutive potential cycles between 0.0 V and +1.4 V at a scan rate of 50 mV/s.
- Rinse the modified electrode (now PGE/poly(4-HBA)) with ultrapure water to remove unreacted monomer [54].
Nanomaterial and Antibody Immobilization:
- Adsorb AgNPs onto the PGE/poly(4-HBA) surface to enhance conductivity and provide a matrix for antibody binding.
- Incubate the electrode with a 1:250 dilution of anti-SARS-CoV-2 antibody solution for 30 minutes at room temperature to allow physical adsorption.
- Rinse gently with PBS to remove loosely bound antibodies.
Surface Blocking:
- Incubate the antibody-functionalized electrode in 0.01% BSA solution for 10 minutes.
- Rinse with PBS to remove excess BSA. The sensor is now ready for use or stability testing [54].
Stability and Reproducibility Assessment
- Storage Stability: Test the functionalized sensors after storage at 4°C and 25°C. Compare the charge transfer resistance (Rct) signal for a positive control sample over a defined period (e.g., 10 testing cycles) to quantify signal loss [54].
- Reproducibility (Relative Standard Deviation - RSD): Fabricate at least six immunosensors following the identical protocol. Test them with a shared-pool sample and calculate the RSD of the resulting Rct values. An RSD below 5% indicates acceptable manufacturing reproducibility [54].
Protocol: Evaluating Shelf Life via Real-Time and Accelerated Stability Studies
Workflow: Sensor Shelf Life Evaluation
Real-Time Stability Study
- Procedure: Store the fully assembled and packaged biosensors at the recommended temperature (e.g., 4°C). Periodically (e.g., weekly or monthly), remove a set of sensors (n ≥ 3) and test them against standard samples with known viral load/concentration.
- Data Analysis: Plot the sensor's key performance parameter (e.g., LOD, Rct signal intensity) against time. The shelf life is determined as the point at which the performance falls below a pre-defined acceptance threshold (e.g., a 20% loss in signal or a 25% increase in LOD).
Accelerated Stability Study
- Procedure: To obtain a rapid estimate, store sensors under accelerated stress conditions, such as elevated temperature (e.g., 25°C, 37°C) and/or high humidity (e.g., 75% relative humidity).
- Data Analysis: The degradation rate is monitored over a shorter period. Using the Arrhenius equation, which models the temperature dependence of reaction rates, the data from high-temperature storage can be extrapolated to predict the shelf life under normal storage conditions.
The Scientist's Toolkit
Table 2: Essential Research Reagent Solutions for EIS Biosensor Development
| Reagent/Material | Function in Assay Development | Exemplar Use Case |
|---|---|---|
| Screen-Printed Carbon (SPC) / Pencil Graphite Electrodes (PGE) | Low-cost, disposable transducer platform; enables mass production and point-of-care use. | Used as the base electrode for a cost-effective COVID-19 immunosensor [54] [12]. |
| Laser-Induced Graphene (LIG) Electrodes | Provide a high-surface-area 3D porous structure that enhances probe loading and signal strength. | Integrated into sensors, improving specificity for SARS-CoV-2 detection [12]. |
| Conductive Polymers (e.g., poly(4-HBA)) | Form a stable, functionalizable film on electrodes; facilitate electron transfer and biomolecule immobilization. | Electropolymerized on PGEs to create a robust platform for antibody attachment [54]. |
| Metal Nanoparticles (Au, Ag) | Enhance electrical conductivity and provide a scaffold for high-density probe immobilization. | Silver nanoparticles (AgNPs) were used on a polymer-modified PGE to amplify the electrochemical signal [54]. |
| Bovine Serum Albumin (BSA) | A blocking agent that passivates unused surface areas to minimize non-specific binding. | Used at 0.01% concentration to block a COVID-19 immunosensor, ensuring high specificity [54]. |
| Redox Probes (e.g., [Fe(CN)₆]³⁻/⁴⁻) | Act as an electrochemical reporter in solution; changes in their charge transfer resistance (Rct) are measured by EIS. | A standard probe for EIS characterization in Faradaic mode to monitor antibody-antigen binding [54]. |
Sample Preparation and Pre-treatment for Clinical and Environmental Samples
The performance of electrochemical impedance spectroscopy (EIS) biosensors is fundamentally constrained by sample matrix effects, which can severely impact analytical sensitivity, specificity, and reproducibility. Effective sample preparation is not merely a preliminary step but a critical determinant in realizing the full potential of EIS for detecting viral pathogens in complex clinical and environmental specimens. Proper pre-treatment protocols enhance signal-to-noise ratios by eliminating interferents, concentrate target analytes to improve detection limits, and ensure biosensor surface compatibility for reliable biomarker recognition [8] [57]. This document provides a standardized framework for sample processing methodologies tailored to EIS-based viral detection platforms, enabling researchers to achieve consistent, reproducible results across diverse sample matrices.
Sample Types and Matrix Considerations
The composition of sample matrices varies significantly, necessitating tailored pre-treatment approaches to address specific challenges. The table below summarizes common sample types and key considerations for EIS-based virus detection.
Table 1: Sample Types and Characteristic Matrix Considerations
| Sample Type | Common Target Viruses | Key Matrix Components & Challenges | Recommended Pre-treatment Goals |
|---|---|---|---|
| Nasopharyngeal Swabs | SARS-CoV-2, Influenza virus [58] [59] | Mucins, epithelial cells, salts, respiratory flora [60] | Remove viscous mucins, concentrate viral particles, inactivate nucleases |
| Human Serum/Plasma | Zika virus, SARS-CoV-2, Hepatitis virus [61] [5] | Albumin, immunoglobulins, lipids, hormones, complement proteins [5] | Reduce protein content, inactivate complement, remove lipid-induced turbidity |
| Environmental Water | Enteric viruses, Norovirus [57] [59] | Dissolved organic matter, sediments, bacteria, ionic interferents [59] | Concentrate virus from large volumes, remove PCR inhibitors, reduce salinity |
| Food (e.g., Milk) | Foodborne pathogens [57] | Fats, casein proteins, lactose, calcium ions [57] | Defatting, protein removal, elimination of colloidal particles |
Complex sample matrices interfere with EIS biosensing through several mechanisms: fouling of the electrode surface or biorecognition layer by non-specific adsorption of proteins or other macromolecules [8]; ionic suppression from high salt content that masks faradaic processes [62]; and steric hindrance from particulate matter that physically blocks target-analyte binding [57]. Addressing these challenges is paramount for successful detection.
Pre-treatment Protocols for Clinical Samples
Serum and Plasma Samples
Serum and plasma are rich in proteins and lipids that can non-specifically adsorb to biosensor surfaces, increasing background noise and reducing sensitivity [5].
Table 2: Key Research Reagents for Serum/Plasma Pre-treatment
| Reagent Solution | Function/Explanation |
|---|---|
| Phosphate Buffered Saline (PBS) Dilution | Reduces matrix viscosity and protein concentration, minimizing non-specific binding [60] [5]. |
| Centrifugal Filtration Devices (e.g., 100kDa MWCO) | Removes high-abundance proteins and concentrates viral targets via molecular weight cut-off [5]. |
| Heat Inactivation (56°C for 30 min) | Denatures and precipitates heat-labile interfering proteins, can inactivate complement [60]. |
| Proteinase K Treatment | Degrades contaminating proteins and nucleases, protecting viral nucleic acids in subsequent extraction [57]. |
Protocol: Pre-treatment of Serum for Viral EIS Immunosensing
- Dilution: Dilute the serum sample 1:10 in PBS/MgCl₂ buffer (e.g., 10 µL serum + 90 µL buffer) [60].
- Heat Inactivation: Incubate the diluted sample at 56°C for 30 minutes in a dry bath or water bath.
- Clarification: Centrifuge the heat-treated sample at 10,000 × g for 10 minutes at 4°C.
- Supernatant Collection: Carefully collect the supernatant, avoiding the pelleted debris.
- Application: The clarified supernatant is now ready for analysis on an EIS immunosensor functionalized with appropriate antibodies [60] [63]. For aptasensors, a nucleic acid extraction step is typically required post-clarification [5].
Nasopharyngeal and Swab Samples
Swab samples present challenges due to their viscosity and cellular debris. The primary goal is to release viral particles into a liquid matrix while reducing viscosity.
Protocol: Processing of Nasopharyngeal Swabs for SARS-CoV-2 Spike Protein Detection
- Elution: Place the swab head in a tube containing 1-3 mL of viral transport media (VTM) or PBS. Vortex vigorously for 10-15 seconds.
- Virus Inactivation (Optional): For safety, the sample may be inactivated by ultraviolet (UV) irradiation following established protocols [60].
- Centrifugation: Centrifuge the eluate at 3,000 × g for 15 minutes to pellet cellular debris and mucus.
- Concentration (Optional): For low viral loads, use centrifugal ultrafiltration devices (e.g., 100 kDa MWCO) to concentrate the viral particles from the clear supernatant.
- Analysis: The processed sample can be applied directly to an EIS biosensor functionalized with anti-spike protein antibodies [60] or a specific aptamer [5].
Pre-treatment Protocols for Environmental and Food Samples
Water Samples
Detecting viruses in large water volumes requires effective concentration methods, as pathogen levels can be extremely low.
Protocol: Concentration of Viruses from Water Samples
- Pre-filtration: Pass the water sample (e.g., 1 L) through a 0.45 µm or 0.8 µm pore-size membrane to remove large particulate matter and bacteria.
- Virus Concentration: Employ one of the following methods:
- Ultrafiltration: Use a tangential flow or dead-end ultrafiltration system with a molecular weight cut-off designed to retain viruses.
- Electronegative/Posititive Filtration: Filter the pre-filtered water through a charge-modified membrane that adsorbs viral particles.
- Elution: Flush the filter with a small volume (e.g., 10-20 mL) of an elution solution, such as a glycine-NaOH buffer (pH 9.5) or a beef extract solution, to recover the viruses.
- Secondary Concentration: Further concentrate the eluate to a final volume of 100-500 µL using centrifugal ultrafiltration devices.
- Desalting/Buffer Exchange: Use size-exclusion chromatography columns or dialysis to transfer the concentrate into a low-ionic-strength buffer compatible with EIS measurement [59].
Milk Samples
Milk's high fat and protein content necessitates robust pre-treatment to prevent biosensor fouling. A promising approach uses functionalized beads for integrated pre-treatment.
Table 3: Key Research Reagents for Food/Environmental Sample Pre-treatment
| Reagent Solution | Function/Explanation |
|---|---|
| Tetraethyl Orthosilicate (TEOS)-coated Beads | Silica beads provide a surface for bacterial concentration and cell lysis via sonication [57]. |
| Ultrafiltration Membranes (100 kDa MWCO) | Concentrate viral particles from large volume environmental samples [59]. |
| Glycine-NaOH Elution Buffer (pH 9.5-10.5) | High pH disrupts electrostatic interactions, releasing viruses from filter membranes [57]. |
| PEG/NaCl Precipitation Solution | Polyethylene glycol induces virus precipitation from large volume samples for concentration [59]. |
Protocol: Integrated Pre-treatment of Milk for E. coli DNA Detection This protocol, adaptable for viral targets, demonstrates a rapid pre-treatment and DNA extraction system [57].
- Sample Loading: Mix 1 mL of milk sample with lysis buffer in a chamber containing TEOS-coated beads.
- Sonication: Subject the chamber to sonication. This provides the mechanical force to lyse bacterial cells (or viral capsids) and release nucleic acids, which adsorb to the bead surfaces.
- Washing: Remove residues and impurities by washing the beads with a wash buffer.
- Elution: Elute the purified DNA (or RNA) from the beads using a low-ionic-strength elution buffer like Tris-EDTA (TE) or nuclease-free water.
- Analysis: The extracted nucleic acid is ready for EIS-based genosensing [57]. For viral detection, this would target specific viral RNA or DNA sequences.
Quality Control and Biosensor Compatibility
Assessing Pre-treatment Efficiency
Rigorous quality control is essential for validating any pre-treatment protocol.
- Yield Assessment: Use spiked controls with known concentrations of the target virus or a surrogate (e.g., bacteriophage) to calculate recovery efficiency through the pre-treatment process.
- Purity Checks: Measure the conductivity and pH of the final sample to ensure compatibility with the EIS measurement buffer. Monitor for residual impurities spectrophotometrically (A260/A280 ratio for nucleic acids).
Final Buffer Exchange for EIS
The final sample must be in a low-ionic-strength buffer (e.g., PBS) for optimal EIS performance, particularly in non-faradaic systems where high salt concentrations can dominate the impedance signal [62]. If the pre-treatment concludes in a high-ionic-strength buffer, a final buffer exchange step using dialysis or gel filtration columns is mandatory.
Navigating Faradaic vs. Non-Faradaic Sensing Modes
Electrochemical Impedance Spectroscopy (EIS) has emerged as a powerful, label-free technique for detecting viruses, with particular relevance demonstrated during recent global health crises such as the COVID-19 pandemic [26] [64]. Its suitability for point-of-care (POC) applications stems from its label-free performance, in-situ measurement capabilities, and low cost [65] [3]. A critical decision in developing EIS-based viral detection assays lies in selecting the appropriate sensing mode: Faradaic or Non-Faradaic. This choice fundamentally impacts the sensor's design, performance, and practical implementation. Faradaic EIS relies on redox reactions occurring at the electrode surface, typically using a redox probe in the solution, whereas Non-Faradaic EIS measures changes in the interfacial capacitance without any faradaic current, focusing solely on the electrical double-layer [66] [65]. This application note provides a structured comparison of these two modes, detailed experimental protocols for virus detection, and a practical toolkit to guide researchers and scientists in navigating this essential methodological choice.
Core Principles and Comparative Analysis
The fundamental distinction between these modes lies in the involvement of charge transfer across the electrode-electrolyte interface.
- Faradaic EIS requires the presence of a redox-active species (e.g., [Fe(CN)6]3−/4−) in the electrolyte solution. A sinusoidal potential is applied, driving reversible redox reactions of these species. The resulting charge transfer resistance (Rct) is a key parameter that increases when a target analyte (like a virus or antibody) binds to the biorecognition element on the electrode surface, hindering the redox process [26] [64]. The Nyquist plot typically shows a semicircular region related to electron-transfer kinetics and a linear part related to diffusion.
- Non-Faradaic EIS operates in the absence of redox species. It applies a small amplitude AC voltage (often with 0 DC bias) and monitors changes in the system's capacitance, primarily the electrical double-layer capacitance (Cdl). When a binding event occurs, it alters the dielectric properties and charge distribution at the electrode interface, leading to a measurable change in capacitance [66] [67]. This method is non-destructive and directly probes interfacial properties.
Table 1: Comparative Analysis of Faradaic and Non-Faradaic EIS Modes for Virus Detection
| Feature | Faradaic EIS | Non-Faradaic EIS | ||
|---|---|---|---|---|
| Fundamental Basis | Redox reactions and charge transfer [26] | Changes in interfacial capacitance and charge distribution [66] | ||
| Redox Probe Requirement | Mandatory (e.g., [Fe(CN)6]3−/4−) [64] | Not required [66] | ||
| Key Measured Parameter | Charge Transfer Resistance (Rct) [26] | Double-Layer Capacitance (Cdl) or Impedance ( | Z | ) [66] [67] |
| Typical Sensitivity | ~17 times higher sensitivity reported [64] | High sensitivity, but generally lower than Faradaic [64] | ||
| Common Challenges | Baseline signal drift due to electrode etching, SAM instability [64] | Susceptible to non-specific binding and ionic strength variations [3] [67] | ||
| Assay Complexity | Higher, due to need for redox couple optimization | Lower, simplified assay as no redox probe is needed [66] | ||
| Best Suited For | Detection of low-concentration analytes where maximum sensitivity is critical [64] | Label-free, real-time monitoring; applications where simplicity is prioritized [66] [3] |
Experimental Protocols
Protocol for Faradaic EIS-based Immunosensing (e.g., COVID-19 Antibody Detection)
This protocol outlines the steps for developing a label-free, Faradaic impedimetric immunosensor for detecting anti-SARS-CoV-2 antibodies, adapted from published research [64] [68].
1. Electrode Functionalization: - Use a gold interdigitated electrode array (IDA). - Clean the electrode surface with oxygen plasma or piranha solution (Caution: highly corrosive) to remove organic contaminants. - Immerse the electrode in a 1 mM ethanolic solution of mercaptohexanoic acid (MHA) for a minimum of 12 hours to form a self-assembled monolayer (SAM). - Rinse thoroughly with absolute ethanol and deionized water to remove physically adsorbed molecules.
2. Mitigation of Baseline Signal Drift (A Critical Step for Faradaic EIS): - Incubate the MHA SAM-modified Au-IDA in a solution of 5 mM [Fe(CN)6]3−/4− in Tris-buffered saline. - Apply a conditioning protocol by running an EIS spectrum using an excitation AC sinusoidal voltage of ±10 mV superimposed on a 0.4 V DC, scanning the frequency from 1 Hz to 0.1 MHz. - Monitor the charge-transfer resistance (Rct) until it stabilizes in a region with a coefficient of variation of <3%, indicating suppressed baseline drift [64].
3. Biorecognition Element Immobilization: - Activate the terminal carboxylic acid groups of the MHA SAM using a mixture of EDC (400 mM) and NHS (100 mM) for 15 minutes. - Immobilize the SARS-CoV-2 spike protein (S-protein) by covalently conjugating it to the activated surface. Incubate for 1 hour at room temperature. - Block any remaining active sites with 1% BSA or ethanolamine to minimize non-specific binding.
4. EIS Measurement and Detection: - Use a three-electrode system (if not using an IDA specifically designed for 2-electrode measurements) with the functionalized IDA as the working electrode. - Prepare the sample solution in PBS containing 5 mM [Fe(CN)6]3−/4− as the redox mediator. - Apply a small sinusoidal AC voltage (e.g., ±10 mV) over a frequency range of 0.1 Hz to 100 kHz, superimposed on the formal potential of the redox couple. - Record the impedance spectrum before and after a 10-minute incubation with the sample containing the target antibody. - The specific binding of the antibody to the spike protein will cause an increase in the Rct value, which can be correlated to the antibody concentration. A reported limit of detection (LOD) for this method is 21 ng/mL [64].
Protocol for Non-Faradaic EIS-based Genosensing (e.g., Plant Pathogen Detection)
This protocol details the development of a DNA-based biosensor for detecting Ralstonia solanacearum, showcasing a non-faradaic approach [66].
1. Electrode and Probe Preparation: - Use a micro-sized gold interdigitated electrode (IDE). Clean it via UV-ozone treatment or electrochemical cycling. - Prepare a thiolated, single-stranded DNA (ssDNA) probe specific to the target pathogen's genome (e.g., the lpxC4 gene). - Reduce any disulfide bonds in the ssDNA probe using Tris(2-carboxyethyl)phosphine (TCEP).
2. Probe Immobilization: - Incubate the clean gold IDE with the reduced thiolated ssDNA probe solution for a minimum of 12 hours. - Subsequently, incubate the electrode with 1 mM mercaptohexanol (MCH) for 1 hour. MCH acts as a spacer molecule, creating a mixed SAM that displaces non-specifically adsorbed DNA and orientates the probe for better hybridization efficiency. - Validate the immobilization using techniques like contact angle analysis or ATR-FTIR.
3. Non-Faradaic EIS Measurement: - Use the functionalized IDE with only a buffer solution (e.g., 10 mM PBS). No redox probe is added. - Apply a small amplitude AC voltage (e.g., ±10 mV) with 0 V DC bias across a frequency range (e.g., 0.1 Hz to 1 MHz). - Measure the impedance, focusing on the changes in capacitance (Cdl) or the magnitude of the impedance (|Z|) at a characteristic frequency. - Hybridize the surface-immobilized probe by introducing the complementary target DNA (e.g., from infected plant samples) and incubating for a set time. - Rinse the electrode and measure the EIS signal again. The hybridization event will cause a measurable decrease in Cdl or an increase in |Z| due to the displacement of water molecules and ions by the now-formed double-stranded DNA. This method has achieved an LOD of 0.1 ng/μL for target DNA [66].
Visualizing the Sensing Pathways and Workflows
The following diagrams illustrate the core principles and experimental workflows for both sensing modes.
Diagram 1: Faradaic EIS workflow. Note the mandatory baseline stabilization and the use of a redox probe.
Diagram 2: Non-Faradaic principle. Target binding alters the interfacial capacitance without redox reactions.
The Scientist's Toolkit: Key Research Reagent Solutions
Table 2: Essential Materials and Reagents for EIS-based Virus Biosensors
| Reagent/Material | Function/Description | Example Use Case |
|---|---|---|
| Interdigitated Electrode (IDA/IDE) | Transducer; comb-like structure to enhance sensitivity and signal-to-noise ratio [64] [66]. | Universal platform for both Faradaic and Non-Faradaic EIS. |
| Mercaptohexanoic Acid (MHA) | Self-assembled monolayer (SAM) molecule; provides a stable, functional surface for covalent immobilization [64]. | Faradaic immunosensor for COVID-19 antibodies [64]. |
| Mercaptohexanol (MCH) | Spacer molecule in SAMs; reduces non-specific binding and improves orientation of bioreceptors [66]. | Non-Faradaic DNA biosensor for plant pathogens [66]. |
| [Fe(CN)6]3−/4− Redox Couple | Redox mediator; enables Faradaic charge transfer. Its change in Rct is the primary sensing signal [26] [64]. | Essential component in the measurement buffer for Faradaic EIS. |
| EDC/NHS Chemistry | Crosslinkers; activate carboxyl groups on SAMs for covalent conjugation to proteins (amines) [64]. | Immobilizing spike protein on MHA SAM for antibody detection. |
| Thiolated DNA Probes | Biorecognition element; allows for covalent anchoring to gold surfaces via Au-S bonds for genosensing [66]. | Detecting viral RNA or specific genomic sequences of pathogens. |
| Specific Antigens/Antibodies | Biorecognition element; provides high specificity for immunosensing applications (e.g., spike protein) [64] [67]. | Detecting viral proteins or the host's immune response (antibodies). |
| APTES-modified Nanoparticles | Surface nanomodifier; can enhance sensitivity and stability of the sensing interface [69]. | Used in a Non-Faradaic biosensor for human cytomegalovirus [69]. |
Benchmarking EIS: Performance Validation and Comparative Analysis
The escalating threat of infectious diseases, including those caused by viruses, necessitates the development of diagnostic technologies that are not only rapid and sensitive but also deployable at the point of care [8]. Within this context, Electrochemical Impedance Spectroscopy (EIS) has emerged as a powerful, label-free biosensing technique for pathogen detection [8]. EIS is a non-destructive analytical method that probes the complex impedance of an electrochemical system by applying a small-amplitude sinusoidal alternating current (AC) voltage or current perturbation over a wide range of frequencies and measuring the corresponding response [2]. This technique is exceptionally sensitive to subtle changes at the electrode–electrolyte interface, such as those caused by the binding of a virus to an immobilized bioreceptor, which alters local electrical properties like interfacial capacitance and charge-transfer resistance [8]. These changes can be precisely measured and correlated with the presence and concentration of the target pathogen, eliminating the need for complex labeling procedures [8].
This application note provides a critical comparison between EIS and the established gold standard methods—Polymerase Chain Reaction (PCR) and Enzyme-Linked Immunosorbent Assay (ELISA)—for virus detection. We summarize quantitative performance data, provide detailed experimental protocols for EIS-based detection, list essential research reagents, and visualize the experimental workflow to support researchers and scientists in evaluating and implementing EIS within virology and drug development research programs.
Performance Comparison of Virus Detection Methods
The following tables summarize the key characteristics and performance metrics of EIS, PCR, and ELISA, based on recent literature. These metrics are critical for selecting an appropriate method for specific research applications.
Table 1: Overall comparison of virus detection techniques, EIS, PCR, and ELISA.
| Feature | Electrochemical Impedance Spectroscopy (EIS) | Polymerase Chain Reaction (PCR) | Enzyme-Linked Immunosorbent Assay (ELISA) |
|---|---|---|---|
| Detection Principle | Label-free measurement of impedance changes at a functionalized electrode surface [8] | Amplification of pathogen-specific nucleic acid sequences [8] | Immunological detection of antigens or antibodies using enzyme-linked reporters [70] [71] |
| Typical Assay Time | Minutes to a few hours [4] | Several hours, including sample preparation [72] [8] | 2 to 4 hours, involving multiple incubation steps [8] |
| Sensitivity | Very high (e.g., 0.01-10 pg/mL for viral antigens) [4] | Very high (e.g., 15 pg RNA for LAMP) [72] | High (e.g., 43.3 pg/mL for SARS-CoV-2 nucleoprotein) [71] |
| Specificity | Governed by biorecognition element (e.g., aptamer, antibody) [4] | Very high, governed by primer sequence [8] | High, governed by antibody affinity; potential for cross-reactivity [8] |
| Quantification | Yes, via calibration of ΔRct vs. concentration [4] | Yes (e.g., qPCR) | Yes, via optical density measurement [70] |
| Multi-plexing Capability | High, with electrode arrays [8] [4] | Moderate, requires multiple primer sets and channels | Moderate, requires multiple antibodies and careful optimization |
| Key Advantage | Label-free, real-time monitoring, portability for POC use [8] | Exceptional sensitivity and specificity, established gold standard [72] | High-throughput, well-established, cost-effective for large batches [72] |
| Key Limitation | Signal can be affected by non-specific binding; requires sophisticated data interpretation [8] | Requires skilled personnel, complex sample prep, and advanced lab equipment [72] [8] | Multiple washing and incubation steps; relies on high-quality antibody production [8] |
Table 2: Published performance data for the detection of specific pathogens using different technologies.
| Technology | Target Pathogen/Virus | Sample Matrix | Sensitivity / Limit of Detection (LOD) | Assay Time | Ref. |
|---|---|---|---|---|---|
| EIS Aptasensor | Mycobacterium tuberculosis (MPT64 antigen) | Buffer | 0.053 pg/mL | ~10 min incubation + EIS measurement | [4] |
| EIS Aptasensor | SARS-CoV-2 (S-glycoprotein) | Buffer | 0.319 pg/mL | ~10 min incubation + EIS measurement | [4] |
| EIS Aptasensor | SARS-CoV-2 (S-glycoprotein) | Human Serum | 1.421 pg/mL | ~10 min incubation + EIS measurement | [4] |
| LAMP | Tobacco Rattle Virus (TRV) | Plant RNA | 15 pg RNA | 20–45 min | [72] |
| CRISPR-Cas12a/Cas13a LFA | Tobacco Mosaic Virus (TMV) | Plant | Relative viral load of 10⁻⁸ | ~40 min | [72] |
| Antigen-Capture ELISA | SARS-CoV-2 (Nucleocapsid) | Human respiratory samples | 43.3 pg/mL (for recombinant NP) | Not specified | [71] |
| DAS-ELISA | Various Plant Viruses | Plant | Varies by virus; generally less sensitive than PCR | Several hours | [72] |
Detailed Experimental Protocol: EIS-based Aptasensor for Virus Detection
The following protocol is adapted from a recent study demonstrating the simultaneous detection of Mycobacterium tuberculosis and SARS-CoV-2 antigens using a dual-screen-printed gold electrode (SPGE) platform [4]. This provides a practical guide for developing an EIS-based viral biosensor.
Research Reagent Solutions
Table 3: Essential materials and reagents for EIS aptasensor fabrication and measurement.
| Item | Function/Description | Example |
|---|---|---|
| Screen-Printed Gold Electrode (SPGE) | Transducer platform; provides a stable and reproducible surface for functionalization. | Customized dual SPGE (e.g., Metrohm DropSens) [4] |
| Thiolated Aptamers | Biorecognition element; binds specifically to the target viral antigen. The thiol group allows for self-assembly on the gold surface. | Custom-synthesized (e.g., Eurogentec) [4] |
| 6-Mercapto-1-hexanol (MCH) | Backfilling agent; forms a self-assembled monolayer to minimize non-specific binding and orient the aptamers. | Sigma-Aldrich [4] |
| Redox Probe | Enables Faradaic EIS measurement; its electron transfer efficiency is modulated by the binding event. | 5 mM K₃[Fe(CN)₆]/K₄[Fe(CN)₆] (1:1) in PBS [4] |
| Target Antigen | The viral protein to be detected. | e.g., SARS-CoV-2 S-glycoprotein (Sino Biological) [4] |
| Potentiostat with EIS Capability | Instrument for applying potential and measuring impedance. | Multi-channel potentiostat/impedance analyzer (e.g., Metrohm µStat-i MultiX) [4] |
Step-by-Step Procedure
Step 1: Electrode Pretreatment and Cleaning Clean the SPGE surface according to manufacturer's instructions. This typically involves rinsing with ethanol and deionized water, followed by electrochemical cleaning via cyclic voltammetry (CV) in a suitable electrolyte, such as 0.5 M H₂SO₄, to ensure a pristine gold surface.
Step 2: Aptamer Functionalization
- Prepare a 1 µM solution of thiolated aptamer in Tris-HCl buffer, previously activated with tris(2-carboxyethyl)phosphine hydrochloride (TCEP) to reduce disulfide bonds.
- Pipette 5-10 µL of the aptamer solution onto the working electrode surface.
- Incubate the electrode in a humidified chamber for a defined period (e.g., 16-18 hours at 4°C) to allow for the self-assembly of the aptamer monolayer via Au-S bonds.
Step 3: Surface Blocking
- Rinse the electrode thoroughly with PBS to remove unbound aptamers.
- Apply a 1 mM solution of 6-Mercapto-1-hexanol (MCH) and incubate for 1 hour at room temperature. This step passivates the remaining bare gold surface, thereby reducing non-specific adsorption and forcing the aptamers into an upright orientation for better target accessibility.
Step 4: Incubation with Sample
- Rinse the MCH-blocked electrode with PBS.
- Apply the sample solution (e.g., buffer or diluted serum spiked with the target viral antigen) to the functionalized electrode surface.
- Incubate for a fixed duration (e.g., 10 minutes at room temperature) to allow for specific binding between the aptamer and the target antigen.
Step 5: EIS Measurement
- Rinse the electrode gently with PBS to remove unbound molecules.
- Perform EIS measurements in an electrolyte solution containing a 5 mM equimolar mixture of K₃[Fe(CN)₆] and K₄[Fe(CN)₆] in PBS.
- Parameters: Apply a DC potential set to the formal potential of the redox couple (typically ~ +0.22 V vs. Ag/AgCl) with a sinusoidal AC voltage amplitude of 5-10 mV, scanning over a frequency range from 0.1 Hz to 100 kHz.
- Record the impedance spectrum, typically represented as a Nyquist plot.
Step 6: Data Analysis The binding of the target antigen to the aptamer layer hinders the electron transfer of the [Fe(CN)₆]³⁻/⁴⁻ redox probe to the electrode surface. This results in an increase in the charge-transfer resistance (Rct), which is derived from the diameter of the semicircle in the Nyquist plot. The change in Rct (ΔRct) is proportional to the concentration of the target antigen and is used to generate a calibration curve for quantitative analysis.
Workflow Visualization
The following diagram illustrates the key steps in the fabrication and use of an EIS aptasensor for virus detection.
EIS presents a compelling alternative to gold standard methods like PCR and ELISA for virus detection, particularly in applications demanding rapid, label-free, and quantitative analysis with potential for point-of-care deployment [8]. While PCR remains unmatched in ultimate sensitivity and specificity for nucleic acid detection, and ELISA is a robust workhorse for protein detection, EIS offers a unique blend of advantages. These include real-time monitoring of binding events, high sensitivity achievable at the pg/mL level, minimal sample preparation, and excellent suitability for multiplexing and miniaturization [8] [4]. The primary challenges for EIS involve mitigating non-specific binding effects in complex matrices and standardizing sensor fabrication and data interpretation protocols [8]. As research in biorecognition elements and electrode materials advances, EIS is poised to become an increasingly powerful tool in the researcher's toolkit for virology and infectious disease diagnostics.
Electrochemical Impedance Spectroscopy (EIS) has emerged as a powerful analytical technique in biosensing, particularly for the detection of viral pathogens. Within the broader context of thesis research on EIS for virus detection, understanding its performance relative to other established biosensing platforms is crucial for selecting appropriate methodologies for specific applications. This analysis provides a direct comparison of EIS against Quartz Crystal Microbalance (QCM), Surface Plasmon Resonance (SPR), and Field-Effect Transistor (FET) sensors, focusing on analytical performance parameters, operational characteristics, and implementation requirements for viral detection. The evaluation presented herein draws upon recent advances in biosensor technology to guide researchers and drug development professionals in optimizing their detection strategies.
Performance Comparison of Biosensing Platforms
The selection of an appropriate biosensing platform requires careful consideration of multiple performance parameters. The following table summarizes the key characteristics of EIS, QCM, SPR, and FET sensors for viral detection applications.
Table 1: Comparative Analysis of Biosensing Platforms for Virus Detection
| Platform | Detection Principle | LOD for Proteins | Analysis Time | Real-Time Monitoring | Key Advantages | Major Limitations |
|---|---|---|---|---|---|---|
| EIS | Charge transfer resistance at electrode interface [73] | Sub-fg/mL to pg/mL [60] [12] | 5-40 minutes [73] [12] | Limited (post-binding measurement) [73] | Ultra-high sensitivity; cost-effective instrumentation; miniaturization capability [73] [74] | Labor-intensive data processing; susceptible to non-faradaic interference [73] |
| QCM | Mass-dependent frequency change [73] | μg/mL range for small molecules [73] | Minutes (real-time) [73] | Yes (continuous) [73] | True real-time visualization of binding events; automated multiplex capability [73] | Requires signal amplification for small molecules; sensitivity to environmental vibrations [73] [75] |
| SPR | Refractive index change at metal interface [75] | Varies with molecular mass [75] | Minutes (real-time) [75] | Yes (continuous) [75] | Label-free real-time kinetics; established gold standard for binding studies [75] | Mass-dependent signal challenges for small molecules; requires complex instrumentation [75] |
| FET | Conductivity change from charge binding [74] | Not specified in results | Minutes (real-time) [74] | Yes (continuous) [74] | Ultra-sensitive for charged analytes; potential for miniaturization [74] | Sensitive to ionic strength; Debye length limitation in physiological solutions [74] |
Table 2: Clinical Validation Performance for SARS-CoV-2 Detection
| Platform | Target Analyte | Clinical Sensitivity | Clinical Specificity | Sample Type | Reference |
|---|---|---|---|---|---|
| EIS | Spike protein [60] | 96.04% [76] | 87.75% [76] | Nasopharyngeal swabs, tracheal aspiration [76] | Vasquez et al. |
| EIS | Spike protein [12] | 93.8% (SPC), 68.93% (LIG) [12] | 61.5% (SPC), 86.17% (LIG) [12] | Oropharyngeal swabs, nasopharyngeal swabs [12] | Disposable carbon-based sensors |
| SPR | Virus particles [74] | Not clinically validated | Not clinically validated | Laboratory samples | Marrazza et al. |
| QCM | Small molecules [73] | Not clinically validated | Not clinically validated | Laboratory samples | PMC Study |
Experimental Protocol: EIS-Based Viral Detection
Sensor Fabrication and Functionalization
This protocol describes the development of an EIS immunosensor for detection of SARS-CoV-2 spike protein, adapted from published methodologies [60] [12] [76].
Materials Required:
- Interdigitated gold electrodes (50 electrode pairs, 10 μm width, 10 μm spacing) [60]
- Carboxymethyl chitosan (CMCt) matrix solution (1 mg/mL) [60]
- Cross-linkers: EDC (100 mM) and NHS (100 mM) in ultrapure water [60]
- Specific antibodies for target viral antigen (e.g., anti-spike protein, 1 ng/mL in PBS) [60]
- Magnetic beads with carboxylic acid functionalization for antibody immobilization [76]
- Phosphate Buffered Saline (PBS) with MgCl₂ (10⁻³ M), pH 7.4 [60]
- Redox probe ([Fe(CN)₆]³⁻/⁴⁻ for faradaic EIS) [73]
Procedure:
- Electrode Cleaning: Clean interdigitated gold electrodes with oxygen plasma treatment or piranha solution (Caution: highly corrosive).
- Matrix Formation: Immerse electrodes in CMCt solution (1 mg/mL) for 10 minutes at room temperature to form a monolayer film [60].
- Activation: Transfer electrodes to EDC/NHS solution (100 mM each) for 30 minutes to activate carboxylic groups on the chitosan matrix.
- Antibody Immobilization: Incubate electrodes with antibody solution (1 ng/mL in PBS) for 30 minutes at room temperature.
- Blocking: Treat functionalized electrodes with 1% BSA for 1 hour to minimize non-specific binding.
- Storage: Store prepared sensors in PBS at 4°C until use (stable for up to 1 week).
EIS Measurement Protocol
Instrument Setup:
- Utilize a potentiostat equipped with EIS capabilities (e.g., PalmSens4, Gamry Instruments) [73] [49]
- Set parameters for faradaic EIS measurement: DC potential of 0 mV, AC amplitude of 50 mV, frequency range of 1 Hz to 1 MHz [60]
- Use redox probe solution ([Fe(CN)₆]³⁻/⁴⁻ in PBS) as electrolyte [73]
Measurement Procedure:
- Baseline Measurement: Record EIS spectrum of functionalized sensor in redox probe solution without analyte.
- Sample Incubation: Incubate functionalized sensor with sample solution (250 μL) for 10 minutes [60].
- Washing: Gently rinse sensor with PBS to remove unbound material.
- Sample Measurement: Record EIS spectrum in fresh redox probe solution under identical parameters.
- Data Analysis: Monitor changes in charge transfer resistance (Rct), typically increasing with target binding [73].
Data Interpretation:
- Plot Nyquist curves (Zimag vs Zreal) for visual inspection of impedance changes
- Use equivalent circuit modeling to extract quantitative Rct values [49] [77]
- Generate calibration curve by plotting ΔRct against analyte concentration
Biosensor Signaling Workflow
The following diagram illustrates the fundamental signaling mechanisms across the four biosensing platforms compared in this analysis:
Research Reagent Solutions
Table 3: Essential Materials for EIS-Based Viral Detection
| Reagent/Material | Function | Specifications | Supplier Examples |
|---|---|---|---|
| Screen-Printed Carbon Electrodes | Disposable sensing platform | 3-electrode system; carbon working electrode | Metrohm DropSens, PalmSens [73] [12] |
| Interdigitated Gold Electrodes | High-sensitivity detection | 50 electrode pairs; 10 μm width/spacing | In-house fabrication or specialty suppliers [60] |
| Carboxymethyl Chitosan | Biocompatible matrix | High purity; water-soluble | Dayang Chemicals [60] |
| EDC/NHS Cross-linkers | Antibody immobilization | ≥98% purity; fresh preparation | Sigma-Aldrich [60] [76] |
| Specific Antibodies | Viral antigen recognition | Recombinant; validated for biosensors | ABCAM, Sino Biological [60] [76] |
| Magnetic Beads | Antibody immobilization | Carboxylic acid functionalized | Thermo Fisher Scientific [76] |
| Redox Probes | Faradaic EIS measurement | [Fe(CN)₆]³⁻/⁴⁻ or hexaammineruthenium | Sigma-Aldrich [73] |
Performance Analysis and Discussion
Sensitivity and Limit of Detection
EIS demonstrates exceptional sensitivity for viral detection, consistently achieving limits of detection (LOD) in the sub-femtogram per milliliter range for SARS-CoV-2 spike protein [60] [12]. This exceptional sensitivity surpasses typical QCM performance for small molecules, which operates in the μg/mL range without signal amplification [73]. The disparity stems from fundamental detection principles: EIS measures binding-induced changes in electron transfer kinetics, while QCM detects mass changes, making smaller analytes challenging to detect directly [73] [75]. SPR sensitivity is inherently mass-dependent, creating inherent challenges for low-molecular-weight targets without signal enhancement strategies [75].
Real-Time Monitoring Capabilities
A significant distinction between platforms lies in their real-time monitoring capabilities. QCM, SPR, and FET sensors provide continuous, real-time binding kinetics, enabling researchers to observe association and dissociation events as they occur [73] [75]. In contrast, conventional EIS typically provides endpoint measurements taken after the binding event is complete, although recent advances are addressing this limitation [73]. This fundamental difference makes QCM, SPR, and FET preferable for detailed kinetic studies, while EIS excels in ultra-sensitive quantification after binding completion.
Practical Implementation Considerations
For point-of-care applications, EIS and FET platforms offer significant advantages in miniaturization potential and cost-effectiveness [73] [74]. EIS instrumentation has been successfully miniaturized in portable systems like PalmSense and AnaPot devices, making field deployment feasible [73]. The disposable carbon-based EIS sensors can be produced for under $2 per unit, a critical advantage for large-scale screening applications [12]. SPR systems generally require more complex optical arrangements and remain predominantly laboratory-based, though portable systems are emerging [75].
Clinical validation data demonstrates that properly configured EIS biosensors can achieve sensitivity exceeding 96% with specificity around 88% for SARS-CoV-2 detection in human samples, performance metrics that approach the gold standard RT-PCR method while offering significantly faster results [76]. This robust clinical performance, combined with rapid time-to-result (5-12 minutes), positions EIS as a compelling alternative to traditional diagnostic approaches, particularly in resource-limited settings [12].
Assessing Sensitivity, Specificity, and Ruggedness in Clinical Validation Studies
Electrochemical impedance spectroscopy (EIS) has emerged as a powerful label-free transduction technique for biosensing, offering high sensitivity, minimal sample preparation, and suitability for point-of-care (POC) applications [8]. For viral detection, EIS-based biosensors measure changes in electrical properties (e.g., charge transfer resistance, interfacial capacitance) at the electrode-electrolyte interface when a target viral analyte binds to a biorecognition element immobilized on the sensor surface [8]. The clinical validation of these biosensors is a critical step in translating research innovations into reliable diagnostic tools. This document outlines the core principles and practical methodologies for assessing the key validation parameters—sensitivity, specificity, and ruggedness—within the context of EIS-based virus detection, providing a structured framework for researchers and drug development professionals.
Core Performance Parameters in Clinical Validation
The performance of a diagnostic biosensor is quantitatively assessed against a reference method (e.g., RT-qPCR) using several key parameters, derived from a 2x2 contingency table comparing the new test results to the reference standard.
- Sensitivity (True Positive Rate): The proportion of actual positive samples (e.g., virus present) that are correctly identified by the biosensor. It is calculated as: Sensitivity = (True Positives / (True Positives + False Negatives)) × 100%.
- Specificity (True Negative Rate): The proportion of actual negative samples (e.g., virus absent) that are correctly identified by the biosensor. It is calculated as: Specificity = (True Negatives / (True Negatives + False Positives)) × 100%.
- Ruggedness: A measure of the reproducibility of test results under normal, expected operating conditions. This includes variations introduced by different operators, instruments, lots of reagents (e.g., different electrode batches), and testing days. A rugged method will demonstrate minimal variability in its performance metrics across these expected fluctuations.
Table 1: Key Performance Metrics from Recent EIS-based Clinical Validation Studies
| Target Pathogen | Biorecognition Element | Electrode Material | Clinical Sensitivity (%) | Clinical Specificity (%) | Limit of Detection (LoD) | Reference |
|---|---|---|---|---|---|---|
| SARS-CoV-2 | Antibody (Anti-Spike) | Screen-Printed Carbon (SPC) | 93.8 (Oropharyngeal Swab) | 61.5 (Oropharyngeal Swab) | ~1 fg/mL (in PBS) | [12] |
| SARS-CoV-2 | Antibody (Anti-Spike) | Laser-Induced Graphene (LIG) | 68.93 (Nasopharyngeal Swab) | 86.17 (Nasopharyngeal Swab) | ~1 fg/mL (in PBS) | [12] |
| SARS-CoV-2 Nucleocapsid (N) Protein | Molecularly Imprinted Polymer (MIP) | Screen-Printed Gold (SPGE) | N/A | N/A | 0.2 nM (EIS) | [78] |
| Mycobacterium tuberculosis & SARS-CoV-2 | Aptamer (Anti-MPT64 & Anti-S Glycoprotein) | Screen-Printed Gold (SPGE) | N/A | N/A | MPT64: 0.053 pg/mL (Buffer), 0.085 pg/mL (Serum) | [5] |
Experimental Protocols for Validation
Protocol: Clinical Sensitivity and Specificity Assessment for a SARS-CoV-2 EIS Immunosensor
This protocol is adapted from a clinical study assessing disposable carbon-based immunosensors [12].
1. Objective: To determine the clinical sensitivity and specificity of an anti-Spike protein EIS immunosensor against the reference standard RT-qPCR.
2. Materials and Reagents:
- Biosensors: Disposable screen-printed carbon (SPC) or laser-induced graphene (LIG) three-electrode systems.
- Biorecognition Element: Monoclonal or polyclonal antibodies specific to the SARS-CoV-2 spike protein.
- Immobilization Reagents: Phosphate Buffered Saline (PBS, pH 7.4), cross-linkers (e.g., EDC/NHS for carbon surfaces).
- Blocking Buffer: Bovine Serum Albumin (BSA, 1% w/v in PBS) or Ethanolamine.
- Wash Buffer: PBS with 0.05% Tween 20 (PBST).
- Redox Probe: 5mM Potassium ferri/ferrocyanide, [Fe(CN)₆]³⁻/⁴⁻, in PBS.
- Clinical Samples: Nasopharyngeal aspirates, oropharyngeal swabs, or saliva samples collected in viral transport medium (VTM) or PBS with Triton X-100. Samples should be from a prospectively recruited cohort, including confirmed positive (symptomatic) and negative (healthy) participants, with prior ethical approval and informed consent.
- Reference Method: WHO-approved RT-qPCR kit for SARS-CoV-2.
3. Equipment:
- Potentiostat/Galvanostat with EIS capability.
- Biosafety Cabinet (BSL-2 or appropriate level).
- Refrigerated centrifuge.
- Vortex mixer.
- Micropipettes and sterile tips.
4. Procedure: Step 1: Electrode Functionalization
- Clean the working electrode surface according to manufacturer's instructions (e.g., electrochemical cycling in sulfuric acid for gold electrodes).
- Immobilize the capture antibody. For SPC electrodes, incubate with a solution containing anti-Spike antibody (e.g., 10 µg/mL in PBS), potentially using EDC/NHS chemistry to form covalent amide bonds.
- Block non-specific sites by incubating with 1% BSA for 1 hour at room temperature.
- Rinse the sensor thoroughly with PBST to remove unbound molecules.
Step 2: Sample Preparation
- Dilute patient nasopharyngeal/oropharyngeal swab samples 1:1 in PBS containing a surfactant (e.g., 0.5% Triton X-100) to inactivate the virus and lyse cells.
- Centrifuge at 10,000 × g for 5 minutes to remove debris. The supernatant is used for analysis.
Step 3: EIS Measurement
- Record a baseline EIS spectrum of the functionalized sensor in the redox probe solution. Parameters: DC potential at open circuit voltage (OCP), AC amplitude of 10 mV, frequency range from 100 kHz to 0.1 Hz.
- Incubate the sensor with 50-100 µL of the prepared patient sample for 10 minutes.
- Wash the sensor gently with PBST to remove unbound material.
- Record the EIS spectrum again in the redox probe solution under identical conditions.
- The key parameter to track is the charge transfer resistance (Rₜᶜ), which typically increases upon successful binding of the viral antigen to the immobilized antibody.
Step 4: Data Analysis
- Calculate the normalized signal change, often as ΔRₜᶜ (%) = [(Rₜᶜ(post-sample) - Rₜᶜ(baseline)) / Rₜᶜ(baseline)] × 100%.
- Establish a cut-off value for ΔRₜᶜ (%) that optimally discriminates between positive and negative samples, typically using a Receiver Operating Characteristic (ROC) curve against the RT-qPCR results.
- Classify samples as EIS-positive or EIS-negative based on the cut-off and construct the 2x2 contingency table to calculate sensitivity and specificity.
Protocol: Determination of Limit of Detection (LoD) and Analytical Sensitivity
1. Objective: To determine the lowest concentration of the target viral antigen that can be reliably detected by the EIS biosensor.
2. Procedure:
- Prepare a series of dilutions of the recombinant viral antigen (e.g., Spike protein) in a negative matrix, such as PBS or diluted negative human serum.
- For each concentration, perform the EIS measurement as described in the protocol above (Section 3.1), using a new functionalized sensor for each replicate (n ≥ 3).
- Plot the ΔRₜᶜ (%) against the logarithm of the antigen concentration to generate a calibration curve.
- The Limit of Detection (LoD) is calculated as the concentration corresponding to the signal of the blank (negative matrix) plus three times its standard deviation (LoD = Cblank + 3σblank) [79].
Visualizing the EIS Biosensor Workflow
The following diagram illustrates the key steps in the fabrication, measurement, and clinical validation of a typical EIS-based immunosensor.
The Scientist's Toolkit: Essential Research Reagents
The successful development and validation of an EIS-based viral biosensor rely on a suite of critical reagents and materials.
Table 2: Essential Research Reagents for EIS-based Viral Biosensor Development
| Category | Item | Specific Examples | Function in the Experiment |
|---|---|---|---|
| Biorecognition Elements | Antibodies | Anti-Spike protein mAb [12] | Provides high specificity for binding to viral surface antigens. |
| Aptamers | Anti-S glycoprotein aptamer [5] | Synthetic DNA/RNA strands that bind targets; offer stability and ease of modification. | |
| Peptides | P44 (Spike RBD peptide) [29] | Mimic natural epitopes; can be designed for variant-specific detection. | |
| Molecularly Imprinted Polymers (MIPs) | Polypyrrole MIP for N protein [78] | Synthetic, robust polymer cavities that mimic antibody binding sites. | |
| Electrode & Surface Chemistry | Electrode Materials | Screen-printed carbon (SPC), Laser-induced graphene (LIG) [12], Screen-printed gold (SPGE) [5] | The transducer platform. Material affects conductivity, surface area, and functionalization chemistry. |
| Self-Assembled Monolayer (SAM) | 11-(1H-pyrrol-1-yl) undecane-1-thiol (PUT) [78] | Creates a stable, ordered layer on gold electrodes for subsequent biomolecule attachment. | |
| Cross-linkers | EDC (1-Ethyl-3-(3-dimethylaminopropyl)carbodiimide) / NHS (N-Hydroxysuccinimide) | Activates carboxyl groups on electrode surfaces for covalent antibody immobilization. | |
| Buffers & Reagents | Blocking Agents | Bovine Serum Albumin (BSA), 6-Mercapto-1-hexanol (MCH) [5] | Covers unused surface areas on the electrode to minimize non-specific binding. |
| Redox Probe | Potassium Ferri/Ferrocyanide ([Fe(CN)₆]³⁻/⁴⁻) [78] | A reversible redox couple essential for generating the EIS signal. Binding of the target hinders electron transfer to this probe. | |
| Wash Buffer | PBS with Tween 20 (PBST) | Removes unbound molecules and sample matrix components during assay steps. |
Critical Considerations for Ruggedness and Reproducibility
Ensuring that an EIS biosensor performs reliably outside idealized laboratory conditions is paramount for clinical adoption.
Minimizing Non-Specific Binding (NSB): NSB is a major contributor to poor specificity and false positives. Effective strategies include optimizing the blocking step using agents like BSA or MCH [5], and incorporating stringent washing with detergents like Tween-20 [8]. Testing against negative control samples and samples with potentially cross-reactive pathogens (e.g., other coronaviruses, influenza) is essential [12] [5].
Ruggedness Testing: A robust validation study must assess the impact of minor but expected variations on the sensor's output. This includes:
- Inter-operator variability: Having multiple trained personnel run the assay on the same set of samples.
- Inter-instrument variability: Using different potentiostats from the same model.
- Reagent lot variability: Testing sensors functionalized with different batches of antibodies or different batches of screen-printed electrodes.
- Inter-day variability: Performing assays on different days to account for environmental fluctuations.
Sample Matrix Effects: The clinical sample type (e.g., nasopharyngeal swab, saliva, serum) can significantly influence sensor performance due to varying protein content, viscosity, and potential interferents [12]. Validation should be performed in the intended sample matrix, and the use of standard additions or internal controls can help correct for matrix effects.
The rigorous clinical validation of EIS-based biosensors for virus detection demands a structured approach to assess sensitivity, specificity, and ruggedness. As evidenced by recent studies, these sensors can achieve high sensitivity and specificity, with production costs under $2, making them promising for widespread POC application [12]. However, performance is highly dependent on the choice of biorecognition element, electrode material, and sample handling protocols. By adhering to detailed experimental methodologies, systematically evaluating potential sources of error, and conducting thorough ruggedness testing, researchers can develop EIS biosensors that are not only analytically powerful but also reliable and robust enough for real-world clinical and public health deployment.
Evaluating Cost, Speed, and Suitability for Point-of-Care Applications
Electrochemical Impedance Spectroscopy (EIS) is a powerful, label-free analytical technique that is increasingly being applied in the development of point-of-care (POC) biosensors for infectious disease diagnosis [79]. The technique measures the impedance of an electrochemical system—its opposition to alternating current (AC) flow—across a spectrum of frequencies, generating a rich dataset that can reveal information about binding events and interfacial properties at the electrode surface [2]. For viral detection, this is leveraged by functionalizing the electrode with a biorecognition element (e.g., an antibody or aptamer) specific to a viral target. The binding of the virus to the sensor surface alters the electrical properties of the interface, changing the impedance signal and enabling sensitive and specific detection without the need for labels [80]. The relevance of EIS has been amplified by global health challenges, such as the COVID-19 pandemic, which highlighted the urgent need for diagnostic tools that are not only accurate but also rapid, affordable, and deployable in resource-limited settings [79] [80]. This application note provides a detailed evaluation of EIS-based biosensing, focusing on its cost, speed, and suitability for POC applications, and includes standardized protocols for researchers.
Principles of Electrochemical Impedance Spectroscopy
Fundamental Concepts
In an EIS experiment, a potentiostat applies a sinusoidal potential (or current) signal to an electrochemical cell and measures the resulting current (or potential) response [2]. The applied potential is described by: ( E(t) = E0 \sin(\omega t + \phiE) ) where ( E0 ) is the amplitude, ( \omega ) is the angular frequency, and ( \phiE ) is the phase angle. The measured current response, ( I(t) = I0 \sin(\omega t + \phiI) ), has the same frequency but is often phase-shifted by a phase angle ( \theta = \phiE - \phiI ) [2]. The impedance (( Z )) is a complex number defined as the ratio of the potential to the current: ( Z = \frac{E(t)}{I(t)} = Z0 \frac{\sin(\omega t + \phiE)}{\sin(\omega t + \phiI)} = |Z| \exp(j\theta) ) It can be broken down into a real part (( Z{re} )), representing the resistive component, and an imaginary part (( Z{im} )), representing the capacitive component: ( Z = Z{re} + jZ{im} ) where ( |Z| = \frac{E0}{I0} ) and ( Z{re} = |Z|\cos\theta ), ( Z_{im} = |Z|\sin\theta ) [2].
Data Representation and Circuit Modeling
EIS data is commonly visualized using two types of plots:
- Nyquist Plot: Plots the negative imaginary impedance (-Z~im~) against the real impedance (Z~re~). Each point on the semicircle corresponds to a different frequency, with higher frequencies on the left and lower frequencies on the right [2].
- Bode Plot: Displays the impedance magnitude (|Z|) and the phase angle (θ) each as a function of frequency, typically on a logarithmic scale [2].
To extract quantitative information, EIS data is fitted to an Equivalent Electrical Circuit (EEC) that models the physical processes occurring at the electrode-electrolyte interface [2]. A common model for a functionalized biosensor is the Randles circuit, which includes:
- R~s~: The solution resistance.
- R~ct~: The charge transfer resistance, which often increases upon target binding.
- C~dl~: The double-layer capacitance.
- W: The Warburg element, representing diffusion.
The table below describes the impedance of common circuit elements.
| Circuit Element | Symbol | Impedance (Z) |
|---|---|---|
| Resistor | R | ( Z = R ) |
| Capacitor | C | ( Z = \frac{1}{j\omega C} ) |
| Inductor | L | ( Z = j\omega L ) |
| Warburg (Diffusion) | W | ( Z = \frac{1}{Y_0} (j\omega)^{-1/2} ) |
| Constant Phase Element | CPE | ( Z = \frac{1}{Q(j\omega)^\alpha} ) |
The following diagram illustrates the core working principle of an EIS biosensor and the corresponding data output.
Diagram 1: Fundamental workflow of an EIS experiment, showing the application of an AC potential, measurement of the current response, and subsequent data plotting and analysis.
EIS in Point-of-Care Viral Biosensing: Performance Evaluation
The performance of EIS biosensors is evaluated based on key metrics including sensitivity, specificity, cost, and speed. The following table summarizes quantitative data from the field, demonstrating the capabilities of EIS for detecting various mosquito-borne and other viral diseases.
Table 1: Diagnostic Performance of EIS-based Biosensors for Viral Detection
| Target Disease | Biorecognition Element | Electrode Modification | Detection Time | Limit of Detection (LOD) | Linear Range | Clinical Sample |
|---|---|---|---|---|---|---|
| Dengue [81] | Antibody | Gold Nanoparticles (AuNPs) | < 30 minutes | 0.1 ng/mL | 0.1 - 100 ng/mL | Spiked Serum |
| Zika [81] | DNA Aptamer | Graphene Oxide | ~15 minutes | 0.8 pM | 1 pM - 1 nM | Spiked Buffer |
| Chikungunya [81] | Monoclonal Antibody | Polypyrrole Film | < 20 minutes | 10 PFU/mL | 10 - 10^4^ PFU/mL | Spiked Serum |
| Malaria Parasite [81] | Aptamer | Carbon Nanotubes | ~10 minutes | 1 parasite/μL | 1 - 10^5^ parasites/μL | Spiked Blood |
| SARS-CoV-2 [80] | Angiotensin-Converting Enzyme 2 (ACE2) | Gold Screen-Printed Electrode | ~5 minutes | 1 fg/mL | 1 fg/mL - 1 μg/mL | Saliva |
EIS biosensors are particularly noted for their low cost and high speed, making them strong candidates for POC applications. The detection times consistently range from 5 to 30 minutes, significantly faster than traditional methods like ELISA or PCR [79] [81]. The use of screen-printed electrodes drastically reduces the cost per test and facilitates mass production and disposability [80]. Furthermore, the integration of nanomaterials such as gold nanoparticles and graphene oxide enhances sensitivity, enabling detection at ultralow concentrations (e.g., fg/mL for SARS-CoV-2) which is crucial for early-stage infection diagnosis [79] [80].
Detailed Experimental Protocol
Protocol 1: EIS-based Detection of Viral Antigens using Antibody-Functionalized Electrodes
This protocol details the steps for constructing a biosensor for a model viral antigen (e.g., Dengue NS1 protein) using a gold screen-printed electrode (SPE).
I. Research Reagent Solutions Table 2: Essential materials and reagents for EIS biosensor development.
| Item | Function/Description | Example Supplier/Notes |
|---|---|---|
| Gold Screen-Printed Electrode (SPE) | Provides a stable, disposable, and cost-effective electrochemical platform. | Metrohm DropSens, BVT Technologies |
| Potentiostat with EIS Capability | Instrument for applying potential and measuring impedance. | PalmSens, Ganny Instruments, Pine Research |
| Specific Anti-Target Antibody | Biorecognition element that binds the viral analyte with high specificity. | Recombinant monoclonal antibodies are preferred. |
| 11-Mercaptoundecanoic acid (11-MUA) | Forms a self-assembled monolayer (SAM) on gold for antibody immobilization. | Sigma-Aldrich, 95% purity |
| N-(3-Dimethylaminopropyl)-N′-ethylcarbodiimide (EDC) and N-Hydroxysuccinimide (NHS) | Crosslinkers for activating carboxyl groups to form amide bonds with antibodies. | Thermo Fisher Scientific |
| Phosphate Buffered Saline (PBS), pH 7.4 | Provides a stable physiological pH and ionic strength for biochemical reactions. | Contains 137 mM NaCl, 2.7 mM KCl, 10 mM Na~2~HPO~4~, 1.8 mM KH~2~PO~4~ |
| Potassium Ferri/Ferrocyanide, K~3~[Fe(CN)~6~]/K~4~[Fe(CN)~6~] | Redox probe used in the EIS measurement to amplify the signal change. | 5 mM equimolar solution in PBS |
| Ethanolamine | Used to block unreacted NHS-ester sites to minimize non-specific binding. | 1 M solution, pH 8.5 |
| Bovine Serum Albumin (BSA) | Alternative blocking agent to reduce non-specific adsorption. | 1% (w/v) in PBS |
II. Step-by-Step Procedure
Electrode Pretreatment: Clean the gold working electrode by polishing with 0.05 μm alumina slurry, followed by sequential sonication in ethanol and deionized water for 2 minutes each. Electrochemically clean by performing cyclic voltammetry (CV) in 0.5 M H~2~SO~4~ from -0.2 V to 1.5 V (vs. Ag/AgCl reference) until a stable CV is obtained. Rinse with DI water and dry under nitrogen [79].
Self-Assembled Monolayer (SAM) Formation: Incubate the clean gold electrode in a 2 mM solution of 11-Mercaptoundecanoic acid (11-MUA) in absolute ethanol for 12 hours at room temperature. This forms a dense, ordered SAM on the gold surface. Rinse thoroughly with ethanol to remove physically adsorbed thiols and dry under nitrogen [80].
Carboxyl Group Activation: Prepare a fresh solution of 400 mM EDC and 100 mM NHS in MES buffer (0.1 M, pH 5.5). Pipette 50 μL of this activation mixture onto the SAM-modified electrode surface and incubate for 1 hour at room temperature in a humid chamber. This step converts the terminal carboxyl groups of the SAM into reactive NHS-esters. Rinse gently with PBS (pH 7.4) to stop the reaction and remove excess EDC/NHS.
Antibody Immobilization: Dilute the specific capture antibody in PBS (pH 7.4) to a concentration of 10-50 μg/mL. Apply 50 μL of this solution to the activated electrode and incubate for 2 hours at room temperature (or overnight at 4°C). The primary amines (lysine residues) of the antibody will form stable amide bonds with the NHS-esters.
Blocking: Rinse the electrode with PBS to remove unbound antibody. To passivate any remaining reactive sites and minimize non-specific binding, incubate the electrode with 1 M ethanolamine (pH 8.5) or 1% BSA for 30 minutes. Rinse thoroughly with PBS.
Baseline EIS Measurement: Place the functionalized electrode in a solution containing 5 mM K~3~[Fe(CN)~6~]/K~4~[Fe(CN)~6~] in PBS (pH 7.4). Perform an EIS measurement using the potentiostat. The parameters are:
- DC Potential: Open circuit potential (OCP) of the solution.
- AC Amplitude: 10 mV.
- Frequency Range: 100 kHz to 0.1 Hz.
- Data Points: 10 per frequency decade. Record the Nyquist plot. This serves as the baseline measurement (R~ct,initial~).
Target Incubation and Detection: Incubate the biosensor with 50 μL of the sample (e.g., spiked serum, saliva) containing the target virus/antigen for 15 minutes at room temperature. Gently rinse the electrode with PBS to remove unbound material. Perform the EIS measurement again in the fresh redox probe solution under identical conditions. The binding of the target will hinder electron transfer to the electrode surface, resulting in an increased charge transfer resistance (R~ct,final~).
Data Analysis: Calculate the normalized response or % change in R~ct~. ( \% \Delta R{ct} = \frac{(R{ct,final} - R{ct,initial})}{R{ct,initial}} \times 100\% ) Plot % ΔR~ct~ against the logarithm of the analyte concentration to generate a calibration curve for quantitative analysis.
The following diagram summarizes the biosensor fabrication and detection workflow.
Diagram 2: Step-by-step workflow for fabricating an antibody-functionalized EIS biosensor and detecting a target viral antigen.
Advanced Application: Machine Learning-Assisted EEC Recommendation
A significant challenge in EIS is the selection of an appropriate Equivalent Electrical Circuit (EEC) for data modeling. Machine Learning (ML) can automate and improve the accuracy of this process [82].
Protocol 2: Implementing an ML Pipeline for EEC Selection
Database Curation: Assemble a large, curated database of EIS spectra paired with their physically sound EEC models. This database serves as the training ground for the ML algorithms [82].
Algorithm Benchmarking and Selection: Train and benchmark various ML algorithms (e.g., Neural Networks, Gaussian Process Regression, Support Vector Machines) using the database. The benchmark should report accuracy distributions rather than single point estimates to ensure robust comparison. Hyperparameters for each algorithm must be optimized [82].
Model Deployment: Integrate the best-performing ML model into the data analysis workflow. When a new, unknown EIS spectrum is acquired, the model suggests the most plausible EEC, significantly reducing analysis time and the need for expert intervention, thereby democratizing EIS analysis [82].
Critical Discussion on POC Suitability
The "REASSURED" criteria (Real-time connectivity, Ease of specimen collection, Affordable, Sensitive, Specific, User-friendly, Rapid and robust, Equipment-free, and Deliverable to end-users) provide a framework for evaluating POC diagnostics [79]. EIS-based biosensors excel in several of these areas but face challenges in others.
Strengths: EIS biosensors are inherently Affordable due to the low cost of disposable screen-printed electrodes. They are Rapid, providing results in minutes, and demonstrate high Sensitivity and Specificity [79] [81]. Their design can be simplified for Ease of specimen collection (e.g., using saliva) [80].
Challenges and Future Directions: The main hurdle for true POC deployment is the "Equipment-free" criterion. While miniaturized potentiostats exist, they still represent a piece of equipment. Future work must focus on further device integration and miniaturization [79]. Another challenge is the transition from laboratory proof-of-concept to clinical validation and commercial production. Scalable manufacturing methods (e.g., 3D printing) and open-source hardware initiatives are key to overcoming this barrier [80]. Finally, the integration of EIS with digital health technologies, including smartphones for data acquisition and ML for automated interpretation, is a critical step toward creating robust, user-friendly systems that can be widely deployed in both clinical and field settings [79] [80].
The Role of EIS in Serological Tests and Asymptomatic Carrier Identification
Electrochemical Impedance Spectroscopy (EIS) has emerged as a powerful label-free transduction technique for biosensing, offering significant advantages for serological testing and the identification of asymptomatic carriers of viral pathogens. Within the context of infectious disease management, the prompt identification of individuals who have developed an immune response to a pathogen—including those who never exhibited symptoms—is crucial for understanding disease epidemiology and controlling transmission chains [83]. Traditional serological methods, such as enzyme-linked immunosorbent assays (ELISAs), often involve multiple steps and labeled reagents [8]. In contrast, EIS-based biosensors directly measure the electrical impedance changes at an electrode-solution interface when a specific binding event occurs, such as the capture of a target antibody from a serum sample by an immobilized viral antigen [8] [58]. This label-free, non-destructive nature allows for real-time monitoring of biomolecular interactions, simplifying assay procedures and reducing both cost and time-to-result [8].
The application of EIS is particularly relevant for addressing the challenge of asymptomatic carriers, a group that plays a significant role in the silent spread of pathogens like SARS-CoV-2 [84] [83]. These individuals, by definition, do not present clinical symptoms and are therefore unlikely to seek diagnostic testing based on clinical suspicion. Mass screening using conventional molecular methods like RT-qPCR can be resource-intensive and costly [84]. EIS-based serological tests, with their potential for high sensitivity, miniaturization, and integration into point-of-care (POC) devices, present a viable pathway for large-scale seroprevalence studies and the rapid identification of individuals with an adaptive immune response to the pathogen, thereby enabling more targeted public health interventions [8] [58].
Principles and Advantages of EIS in Serology
Fundamental Mechanism
EIS operates by applying a small-amplitude sinusoidal alternating current (AC) voltage across a range of frequencies to an electrochemical cell and measuring the resulting current response [49] [8]. The impedance (Z), a complex quantity representing the opposition to current flow, is calculated from these measurements. It is typically described in terms of its magnitude (|Z|) and phase shift (Φ), or as a complex function consisting of a real (Z') and imaginary (Z'') component [49]. This is represented as: ( Z(\omega) = Z' + jZ'' ) where ω is the radial frequency. The measured impedance provides rich information about the electrochemical system, including charge transfer resistance (Rct) and interfacial capacitance, which are highly sensitive to changes at the electrode surface [8] [58].
In a typical serological EIS biosensor, the working electrode is functionalized with a specific viral antigen (e.g., spike or nucleocapsid protein). Upon introduction of a serum sample containing the target antibody, the immunocomplex formation on the electrode surface alters the local electrical properties. This binding event typically hinders the transfer of electrons from a redox probe (e.g., [Fe(CN)₆]³⁻/⁴⁻) in the solution to the electrode surface, leading to an increase in Rct, which can be quantitatively measured [58]. This change in Rct is directly correlated to the concentration of the target antibody in the sample, enabling quantitative serological analysis.
Comparative Advantages
The table below summarizes the key advantages of EIS-based serological biosensors over other common diagnostic techniques.
Table 1: Comparison of Serological Testing Methods
| Feature | EIS-Based Biosensor | Conventional ELISA | Rapid Immunochromatographic Test |
|---|---|---|---|
| Detection Principle | Label-free, electrochemical impedance | Enzyme-labeled, colorimetric | Colloidal gold-labeled, visual |
| Assay Time | Minutes to tens of minutes [58] | 1-4 hours | 15-30 minutes [83] |
| Quantification | Yes, semi-quantitative to quantitative | Yes, quantitative | Semi-quantitative or qualitative |
| Sensitivity | High (potentially ultrasensitive) [8] | High | Variable, often lower [83] |
| Portability / POC Suitability | High (easily miniaturized) | Low (lab-based) | High |
| Real-time Monitoring | Yes | No | No |
| Complexity / Cost | Low per test, moderate initial setup | Moderate per test, moderate setup | Low per test, low setup |
Experimental Protocols for EIS-Based Serological Testing
Biosensor Fabrication and Functionalization
This protocol details the creation of an EIS immunosensor for detecting anti-SARS-CoV-2 IgG antibodies in human serum.
Materials:
- Working Electrode: Gold disk electrode (2 mm diameter) or screen-printed gold electrode.
- Biorecognition Element: Recombinant SARS-CoV-2 nucleocapsid (N) protein or receptor-binding domain (RBD) of the spike protein.
- Chemical Reagents: 11-Mercaptoundecanoic acid (11-MUA), N-(3-Dimethylaminopropyl)-N'-ethylcarbodiimide hydrochloride (EDC), N-Hydroxysuccinimide (NHS), Ethanolamine, Potassium ferricyanide (K₃[Fe(CN)₆]), Potassium ferrocyanide (K₄[Fe(CN)₆]), Phosphate Buffered Saline (PBS, pH 7.4).
- Instrumentation: Potentiostat capable of EIS measurements.
Procedure:
- Electrode Pretreatment: Clean the gold working electrode by polishing with 0.05 μm alumina slurry, followed by sequential sonication in ethanol and deionized water for 5 minutes each. Electrochemically clean by performing cyclic voltammetry in 0.5 M H₂SO₄ until a stable voltammogram is obtained.
- Self-Assembled Monolayer (SAM) Formation: Immerse the clean electrode in a 1 mM ethanolic solution of 11-MUA for 12-18 hours at room temperature to form a SAM. Rinse thoroughly with ethanol and deionized water to remove physically adsorbed thiols.
- Antigen Immobilization:
- Activate the terminal carboxyl groups of the SAM by incubating the electrode in a freshly prepared aqueous solution of 0.4 M EDC and 0.1 M NHS for 30 minutes.
- Rinse the electrode with PBS (pH 7.4) to remove excess EDC/NHS.
- Immediately incubate the activated electrode with a 10 μg/mL solution of the recombinant viral antigen in PBS for 2 hours at room temperature.
- Surface Blocking: To minimize non-specific binding, treat the functionalized electrode with 1 M ethanolamine (pH 8.5) for 30 minutes. This step deactivates any remaining activated ester groups and blocks uncovered areas of the SAM.
- Storage: The fabricated biosensor can be stored dry at 4°C until use.
EIS Measurement and Serum Analysis
Materials:
- Sample: Human serum samples (positive, negative, and test unknowns).
- Measurement Solution: 5 mM K₃[Fe(CN)₆]/K₄[Fe(CN)₆] (1:1 mixture) in PBS (pH 7.4).
Procedure:
- Baseline EIS Measurement: Place the functionalized biosensor in the measurement solution. Perform an EIS scan to establish the baseline impedance. Typical parameters are: DC potential set to the open circuit potential, AC amplitude of 10 mV, and a frequency range from 100 kHz to 0.1 Hz.
- Sample Incubation: Incubate the biosensor with a 50 μL droplet of undiluted (or appropriately diluted) human serum for 15 minutes at room temperature.
- Post-Incubation EIS Measurement: Gently rinse the biosensor with PBS to remove unbound serum components. Perform a second EIS measurement in a fresh aliquot of the measurement solution, using the exact same parameters as the baseline.
- Data Analysis: The primary parameter for analysis is the charge transfer resistance (Rct), which can be extracted by fitting the obtained EIS data to a suitable equivalent circuit model (e.g., the Randles circuit). The normalized response can be calculated as: ( \text{\% Change in } R{ct} = \frac{R{ct}(\text{post-incubation}) - R{ct}(\text{baseline})}{R{ct}(\text{baseline})} \times 100\% ) A standard curve can be constructed using sera with known antibody titers to enable quantitative analysis of unknown samples.
The following workflow diagram illustrates the key steps in the biosensor fabrication and detection process:
Diagram 1: Biosensor fabrication and EIS detection workflow.
Performance Data and Asymptomatic Screening Applications
Analytical Performance
The performance of EIS biosensors is typically evaluated based on sensitivity, specificity, and limit of detection (LOD). The following table summarizes performance metrics from selected studies on EIS-based viral detection, which highlight its potential for serological application.
Table 2: Performance Metrics of EIS-Based Biosensors in Pathogen Detection
| Target Pathogen | Biorecognition Element | Sample Matrix | Reported LOD | Key Performance Feature | Reference |
|---|---|---|---|---|---|
| Dengue Virus | Dengue antigen | Buffer / Serum | Not Specified | First dual marker dengue electrochemical assay; high specificity. | [58] |
| General Viruses | Antibodies, DNA probes | Blood, Saliva | Potentially very low | EIS can detect tiny changes at electrode interface; real-time monitoring. | [8] [58] |
| SARS-CoV-2 (Model) | Spike RBD protein | Buffer | Acknowledged as highly sensitive | Technique is sensitive to subtle interfacial changes from binding. | [8] |
EIS is recognized for its ability to detect very low concentrations of analyte due to its sensitivity to minute changes at the electrode interface [8]. For serological testing, this translates to the potential for detecting low titers of antibodies, which is crucial for identifying individuals with waning immunity or those with mild/asymptomatic infections who may mount a lower antibody response.
Value in Asymptomatic Carrier Identification
The utility of any serological test in asymptomatic carrier screening depends on its ability to correctly identify individuals who have been infected. A study on a commercial rapid serological test (lateral flow assay) in an emergency department setting reported a negative predictive value (NPV) of 96.7% for patients without respiratory symptoms [83]. This high NPV suggests that a negative result in an asymptomatic person reliably rules out SARS-CoV-2 infection in a low-prevalence setting. While this data is not from an EIS-based test, it illustrates the performance benchmark for serological assays in this application.
EIS-based biosensors aim to improve upon these figures by offering higher sensitivity. Their quantitative nature also allows for tracking antibody levels over time, which can help distinguish recent from past infections and potentially correlate antibody titers with the level of immune protection in asymptomatic individuals.
Essential Research Reagents and Materials
Successful implementation of EIS-based serological testing requires a standardized toolkit of high-quality reagents and materials.
Table 3: Research Reagent Solutions for EIS-Based Serological Assays
| Item Name | Function / Role in the Assay |
|---|---|
| Gold Electrodes | Provides a stable, biocompatible, and easily functionalizable substrate for biomolecule immobilization. |
| Thiol-based Linkers (e.g., 11-MUA) | Forms a self-assembled monolayer on gold, presenting functional groups (e.g., -COOH) for subsequent covalent binding. |
| Crosslinkers (EDC/NHS) | Activates carboxyl groups, facilitating the covalent immobilization of protein antigens onto the SAM. |
| Recombinant Viral Antigens | Serves as the capture molecule, specifically binding to target antibodies from the serum sample. |
| Redox Probe ([Fe(CN)₆]³⁻/⁴⁻) | Provides a measurable Faradaic current. Binding of antibodies increases Rct, which is the primary signal measured. |
| Blocking Agents (e.g., BSA, Ethanolamine) | Prevents non-specific adsorption of serum proteins to the sensor surface, thereby improving specificity. |
| Reference Serum Panels | Used for calibration, validation, and as positive/negative controls to ensure assay accuracy and reproducibility. |
Implementation Workflow for Population Screening
The following diagram outlines a proposed workflow for deploying EIS-based serological tests in a population screening program aimed at identifying asymptomatic carriers.
Diagram 2: Asymptomatic carrier screening and public health workflow.
Conclusion
Electrochemical Impedance Spectroscopy stands as a versatile and rapidly advancing frontier in biosensing, offering a compelling combination of sensitivity, label-free operation, and potential for miniaturization that is critical for modern virology and diagnostic applications. The synthesis of knowledge from foundational principles to advanced applications confirms its robust capability for detecting a wide spectrum of viruses, from SARS-CoV-2 to influenza and waterborne pathogens, even in complex matrices. Future progress hinges on overcoming challenges in biofouling and standardization, while emerging directions point toward the integration of EIS with multiplexed systems, IoT networks, and AI-driven data analysis for real-time, high-throughput screening. The continued evolution of EIS-based platforms promises to significantly impact public health responses, personalized medicine, and global pandemic preparedness, solidifying its role as an indispensable tool in the researcher's arsenal.
References
- 1. Electrochemical Impedance Spectroscopy (EIS): Principles, ... [https://www.mdpi.com/1424-8220/21/19/6578]
- 2. Electrochemical Impedance Spectroscopy (EIS) Basics [https://pineresearch.com/support-article/eis-basics/]
- 3. Electrochemical Impedance Spectroscopy-Based Biosensors ... [https://pmc.ncbi.nlm.nih.gov/articles/PMC12293632/]
- 4. Simultaneous and sensitive detection of Mycobacterium ... [https://www.frontiersin.org/journals/bioengineering-and-biotechnology/articles/10.3389/fbioe.2025.1692839/full]
- 5. Simultaneous and sensitive detection of Mycobacterium ... [https://pmc.ncbi.nlm.nih.gov/articles/PMC12615495/]
- 6. Deep learning-based electrical impedance spectroscopy ... [https://www.nature.com/articles/s41598-025-05116-8]
- 7. Classifying metal passivity from EIS using interpretable ... [https://www.nature.com/articles/s41598-025-18575-w]
- 8. Electrochemical Impedance Spectroscopy-Based ... [https://www.mdpi.com/2079-6374/15/7/443]
- 9. Randles circuit [https://en.wikipedia.org/wiki/Randles_circuit]
- 10. The Randles Circuit [https://lithiuminventory.com/experimental-electrochemistry/eis/randles-circuit/]
- 11. Randles circuit [https://www.palmsens.com/knowledgebase-topic/randles-circuit/]
- 12. Performance assessment of disposable carbon-based ... [https://www.nature.com/articles/s41598-025-92104-7]
- 13. Biosensing strategies for the electrochemical detection of ... [https://pmc.ncbi.nlm.nih.gov/articles/PMC9186435/]
- 14. Graphdiyne-enhanced impedimetric detection of virus- ... [https://www.sciencedirect.com/science/article/abs/pii/S2452262725001497]
- 15. A review on label free biosensors [https://www.sciencedirect.com/science/article/pii/S2590137022001091]
- 16. Sensitivity Analysis of Localized Electrochemical Impedance ... [https://pmc.ncbi.nlm.nih.gov/articles/PMC12568324/]
- 17. Label-free and label-based electrochemical detection of ... [https://pmc.ncbi.nlm.nih.gov/articles/PMC11289512/]
- 18. Linear vs. non-linear systems in impedance measurements ... [https://www.biologic.net/documents/eis-linearity-electrochemistry-battery-application-note-9/]
- 19. EIS at different states of charge with INTELLO [https://www.metrohm.com/en/applications/application-notes/autolab-applikationen-anautolab/an-bat-016.html]
- 20. Electrochemical diagnostics of infectious viral diseases [https://pmc.ncbi.nlm.nih.gov/articles/PMC7921732/]
- 21. Low-Frequency Measurements in Electrochemical ... [https://www.mdpi.com/2079-9292/14/20/4048]
- 22. Applications of electrochemical impedance spectroscopy in ... [https://www.sciencedirect.com/science/article/pii/S2666053924000213]
- 23. Point-of-care detection of Japanese encephalitis virus ... [https://www.sciencedirect.com/science/article/pii/S1452398124004498]
- 24. Electrochemical biosensors based on the 3D ... [https://pmc.ncbi.nlm.nih.gov/articles/PMC12376872/]
- 25. Electrochemical biosensors based on the 3D immobilization of ... [https://pubs.rsc.org/en/content/articlehtml/2025/ra/d5ra03744a]
- 26. Recent Developments in Electrochemical-Impedimetric ... [https://pmc.ncbi.nlm.nih.gov/articles/PMC9788240/]
- 27. Advances in aptamer-based electrochemical biosensors for ... [https://pubs.rsc.org/en/content/articlehtml/2025/nh/d5nh00368g?page=search]
- 28. Diagnostic accuracy of aptamer-based biosensors for the ... [https://www.sciencedirect.com/science/article/pii/S2405844025017463]
- 29. Peptide-based biosensors for variant-specific detection of ... [https://pubs.rsc.org/en/content/articlehtml/2025/ma/d5ma00485c]
- 30. Rapid electrochemical immunodetection of SARS-CoV-2 ... [https://pmc.ncbi.nlm.nih.gov/articles/PMC8667521/]
- 31. Carbon Nanomaterial-Based Electrochemical Biosensors ... [https://pmc.ncbi.nlm.nih.gov/articles/PMC12562738/]
- 32. Nanomaterials for Sensory Systems—A Review - PMC [https://pmc.ncbi.nlm.nih.gov/articles/PMC12650047/]
- 33. Surface chemistry applications and development of ... [https://www.sciencedirect.com/science/article/pii/S001393512301681X]
- 34. Electrochemical Impedance Spectroscopy (EIS) Based ... [https://chemrxiv.org/engage/chemrxiv/article-details/62822e8b44bdd51f26650d67]
- 35. Bioreceptors' immobilization by hydrogen bonding ... [https://link.springer.com/article/10.1007/s00604-024-06738-x]
- 36. Sensitive Detection of SARS-CoV-2 Variants Using an ... [https://pubmed.ncbi.nlm.nih.gov/36361926/]
- 37. Electrochemical point-of-care devices for monitoring ... [https://www.sciencedirect.com/science/article/pii/S2666016422000044]
- 38. Rapid detection of SARS-CoV-2 antibodies using ... [https://pmc.ncbi.nlm.nih.gov/articles/PMC7539830/]
- 39. Rapid SARS-CoV-2 Detection Using Electrochemical ... [https://www.mdpi.com/1424-8220/21/2/390]
- 40. Ultrasensitive detection of influenza viruses with a glycan ... [https://pmc.ncbi.nlm.nih.gov/articles/PMC4883649/]
- 41. Fabrication of Electrochemical Influenza Virus (H1N1) ... [https://www.mdpi.com/1996-1944/14/2/343]
- 42. Biosensors for waterborne virus detection - PMC - NIH [https://pmc.ncbi.nlm.nih.gov/articles/PMC10759259/]
- 43. Electrochemical Sensors for Detections of Influenza Viruses [https://www.intechopen.com/chapters/51718]
- 44. Simultaneous Detection and Differentiation of SARS-CoV-2, Influenza A/B, and Respiratory Syncytial Viruses in Respiratory Specimens Using the VitaSIRO solo™ SARS-CoV-2/Flu/RSV Assay [https://www.mdpi.com/2075-4418/15/17/2249]
- 45. Challenges and perspectives of multi-virus biosensing techniques: A review - PMC [https://pmc.ncbi.nlm.nih.gov/articles/PMC9868144/]
- 46. Development of an Electrochemical Paper-Based Analytical ... [https://pmc.ncbi.nlm.nih.gov/articles/PMC6595480/]
- 47. Rapid and accurate detection of crop viruses by nano ... [https://pubs.rsc.org/en/content/articlehtml/2025/ay/d5ay01205h]
- 48. Collecting High-Quality EIS Data for AI Training [https://www.biologic.net/topics/collecting-high-quality-eis-data-for-ai-training/]
- 49. Basics of Electrochemical Impedance Spectroscopy [https://www.gamry.com/application-notes/EIS/basics-of-electrochemical-impedance-spectroscopy/]
- 50. What is Electrochemical Impedance Spectroscopy (EIS)? ... [https://www.biologic.net/topics/what-is-eis/]
- 51. Optimizing microfluidic chip for rapid SARS-CoV-2 ... [https://www.nature.com/articles/s41598-025-98304-5]
- 52. Data-driven analysis of electrochemical impedance ... [https://pmc.ncbi.nlm.nih.gov/articles/PMC11907484/]
- 53. AI-optimized electrochemical aptasensors for stable, ... [https://pubmed.ncbi.nlm.nih.gov/39834418/]
- 54. Development and Optimization of a Cost-Effective ... [https://www.mdpi.com/2079-6374/15/2/67]
- 55. Notice of Availability of Final Programmatic Environmental ... [https://www.federalregister.gov/documents/2025/04/18/2025-06621/notice-of-availability-of-final-programmatic-environmental-impact-statement-for-outbreak-response]
- 56. 2024-2025 Influenza Season: Surveillance For Novel ... [https://www.cdc.gov/bird-flu/php/monitoring-bird-flu/surveillance-novel-seasonal.html]
- 57. Construction of on-site DNA pre-treatment device and ... [https://www.sciencedirect.com/science/article/abs/pii/S1385894724073893]
- 58. Ultrasensitive detection of pathogenic viruses with ... [https://pmc.ncbi.nlm.nih.gov/articles/PMC7363606/]
- 59. Nonlinear electrical impedance spectroscopy of viruses ... [https://pmc.ncbi.nlm.nih.gov/articles/PMC4563260/]
- 60. Diagnostics of SARS-CoV-2 infection using electrical ... [https://pmc.ncbi.nlm.nih.gov/articles/PMC8607795/]
- 61. A sensitive electrochemical immunosensor for label-free ... [https://www.nature.com/articles/s41598-018-28035-3]
- 62. Electrochemical Impedance Spectroscopy (EIS): Principles, ... [https://pmc.ncbi.nlm.nih.gov/articles/PMC8512860/]
- 63. Sensitive detection of SARS-CoV-2 spike protein based on ... [https://www.sciencedirect.com/science/article/pii/S2773045X23000225]
- 64. Faradaic Impedimetric Immunosensor for Label-Free Point ... [https://pmc.ncbi.nlm.nih.gov/articles/PMC10812953/]
- 65. Exploring faradaic and non-faradaic electrochemical ... [https://pmc.ncbi.nlm.nih.gov/articles/PMC10943381/]
- 66. Part I: Non-faradaic electrochemical impedance-based ... [https://www.sciencedirect.com/science/article/abs/pii/S1567539423000075]
- 67. Label-free impedimetric immunosensor for point-of-care ... [https://www.nature.com/articles/s41378-022-00460-5]
- 68. Faradaic Impedimetric Immunosensor for Label-Free Point- ... [https://www.mdpi.com/2079-6374/14/1/6]
- 69. Non-faradaic electrochemical biosensor based on APTES- ... [https://www.sciencedirect.com/science/article/abs/pii/S1567539425001896]
- 70. Diagnostic Performance of Three ELISAs for Detection ... [https://pmc.ncbi.nlm.nih.gov/articles/PMC9398874/]
- 71. Diagnostic performance of a novel antigen-capture ELISA ... [https://www.sciencedirect.com/science/article/abs/pii/S0003269723000441]
- 72. Emerging technologies for in-field plant virus detection [https://pmc.ncbi.nlm.nih.gov/articles/PMC12659760/]
- 73. A Comparison of EIS and QCM NanoMIP-Based Sensors for ... [https://pmc.ncbi.nlm.nih.gov/articles/PMC8707575/]
- 74. Advancements and emerging technologies in biosensors ... [https://www.sciencedirect.com/science/article/abs/pii/S0165993624000918]
- 75. Recent Advances in Real-Time Label-Free Detection of ... [https://pmc.ncbi.nlm.nih.gov/articles/PMC10886562/]
- 76. Clinical validation of SARS-CoV-2 electrochemical ... [https://www.sciencedirect.com/science/article/abs/pii/S0166093424000648]
- 77. Electrochemical Impedance Spectroscopy (EIS) Parameter ... [https://www.mathworks.com/help/simscape-battery/ug/eis-parameter-estimation-workflow.html]
- 78. Detection of the SARS-CoV-2 nucleoprotein by ... [https://www.sciencedirect.com/science/article/abs/pii/S0956566324010996]
- 79. Point-of-care biosensors for infectious disease diagnosis [https://pubs.rsc.org/en/content/articlehtml/2025/ra/d5ra03897a?page=search]
- 80. Democratization of Point-of-Care Viral Biosensors [https://pmc.ncbi.nlm.nih.gov/articles/PMC12293509/]
- 81. Developing point-of-care diagnosis using electrochemical ... [https://www.sciencedirect.com/science/article/pii/S2666053924000778]
- 82. A benchmark of different Machine Learning algorithms [https://www.sciencedirect.com/science/article/pii/S1572665724007902]
- 83. The Light and Shadow of Rapid Serological Tests for ... [https://www.mdpi.com/1660-4601/17/18/6493]
- 84. The Main Molecular and Serological Methods for ... [https://pmc.ncbi.nlm.nih.gov/articles/PMC7823618/]