Electrochemical vs. Optical Biosensors for Ethanol Detection: A Comprehensive Review for Biomedical Research
The accurate detection of ethanol is critical in biomedical research, clinical diagnostics, and drug development.
Electrochemical vs. Optical Biosensors for Ethanol Detection: A Comprehensive Review for Biomedical Research
Abstract
The accurate detection of ethanol is critical in biomedical research, clinical diagnostics, and drug development. This article provides a systematic comparison of electrochemical and optical biosensing platforms for ethanol analysis. We explore the fundamental principles, operational mechanisms, and recent technological advancements for both sensor types. The review critically evaluates performance in complex biological matrices, discusses optimization strategies to enhance sensitivity and selectivity, and provides a direct comparative analysis of key metrics including limit of detection, sensitivity, and real-world applicability. This work serves as a strategic guide for researchers and scientists selecting and developing the most appropriate biosensing technology for their specific ethanol detection needs.
Understanding Biosensor Fundamentals: Principles of Ethanol Detection
The Critical Need for Ethanol Monitoring in Clinical and Pharmaceutical Contexts
Ethanol monitoring is a critical analytical challenge with significant implications for clinical diagnostics and pharmaceutical applications. In clinical settings, timely and accurate detection of ethanol is vital for managing acute poisonings, supporting treatment for alcohol use disorders (AUD), and ensuring patient safety [1] [2]. Similarly, the pharmaceutical industry requires precise ethanol measurement for quality control of alcohol-based formulations and sanitizers [1]. Biosensor technologies have emerged as powerful tools to meet these demands, with electrochemical and optical platforms representing two dominant approaches. This guide provides an objective comparison of these biosensor classes, evaluating their performance characteristics, operational parameters, and suitability for specific application contexts to inform researchers, scientists, and drug development professionals.
Clinical and Pharmaceutical Significance of Ethanol Monitoring
Medical Applications and Health Implications
Ethanol monitoring serves multiple critical functions in healthcare. For acute clinical toxicology, ethanol is administered intravenously as an antidote for methanol and ethylene glycol poisoning, competing with these toxic alcohols for metabolism by alcohol dehydrogenase (ADH) [1]. Therapeutic monitoring is essential during such treatments, with target plasma ethanol levels requiring careful maintenance between 100-150 mg/dL [1]. Beyond therapeutic use, ethanol detection is fundamental for identifying excessive alcohol consumption, a leading preventable cause of death [2]. Direct ethanol biomarkers like ethyl glucuronide (EtG), ethyl sulfate (EtS), and phosphatidylethanol (PEth) have emerged as sensitive indicators for detecting alcohol use, supporting diagnosis of AUD and monitoring recovery progress [2] [3].
Analytical Challenges in Ethanol Detection
Effective ethanol monitoring presents several analytical challenges. Ethanol's relatively short half-life in the body limits the detection window for direct measurement, creating a need for sensitive techniques that can detect low concentrations or identify metabolic byproducts [4] [3]. Additionally, assays must distinguish ethanol from similar compounds like methanol and isopropanol while maintaining accuracy in complex biological matrices such as blood, sweat, and saliva [4]. Point-of-care testing demands further requirements for portability, rapid response, and operational simplicity without sacrificing reliability [5] [4].
Biosensor Platforms: Fundamental Principles and Comparison
Biosensors integrate a biological recognition element with a physicochemical transducer to produce a measurable signal proportional to analyte concentration. The choice between electrochemical and optical transduction significantly impacts sensor performance, application suitability, and operational requirements.
Electrochemical Biosensors
Electrochemical biosensors measure electrical signals generated from biochemical reactions involving the target analyte. For ethanol detection, enzymatic approaches typically utilize alcohol dehydrogenase or oxidase, generating electrons that create a measurable current [4]. Recent innovations include chemiresistive sensors using metal oxides like tin dioxide (SnO₂) functionalized with ruthenium dioxide (RuO₂) nanosheets, which demonstrate increased sensitivity to ethanol vapor due to enhanced electron depletion layers and catalytic activity [6].
Advantages: Electrochemical platforms offer high sensitivity, with certain chemiresistive sensors detecting ethanol at parts-per-billion (ppb) concentrations [6]. They exhibit excellent compatibility with miniaturization and wearable formats, enabling non-invasive continuous monitoring through sweat [4]. Their low power requirements and cost-effective fabrication make them suitable for widespread deployment [4].
Limitations: These sensors can suffer from interference in complex biological matrices and may require membrane modifications to enhance selectivity [4]. Enzyme-based systems face stability issues related to enzyme denaturation over time [4].
Optical Biosensors
Optical biosensors transduce biochemical interactions into measurable optical signals. Techniques include surface plasmon resonance (SPR), photonic crystal fiber (PCF) sensors, and fluorescent methods [5] [7]. A novel terahertz (THz) PCF sensor demonstrated high relative sensitivity (96.35% for ethanol) by measuring changes in optical properties when analyte molecules interact with the evanescent field [7]. Alternative approaches employ capacitive micromachined ultrasonic transducers (CMUT) to determine ethanol concentration in solutions via ultrasonic velocity measurements [8].
Advantages: Optical sensors provide high sensitivity and specificity, with minimal sample preparation [5] [7]. They enable real-time, label-free detection and are less susceptible to electromagnetic interference [5]. Terahertz PCF sensors achieve exceptional sensitivity for ethanol and benzene detection [7].
Limitations: Optical platforms typically require more complex instrumentation and higher costs [5] [9]. Their larger size may limit portability for point-of-care applications, and they can be sensitive to environmental conditions like temperature fluctuations [5].
Comparative Performance Analysis
The table below summarizes key performance characteristics of representative electrochemical and optical ethanol biosensors from recent literature:
Table 1: Performance Comparison of Ethanol Biosensor Platforms
| Sensor Platform | Detection Principle | Linear Range | Sensitivity | Limit of Detection | Response Time | Reference |
|---|---|---|---|---|---|---|
| RuO₂/SnO₂ Chemiresistive | Electrochemical | 5 ppb - 10 ppm | Rair/Rgas = 10.47 (10 ppm) | ~5 ppb | 78.1 s (recovery) | [6] |
| THz Photonic Crystal Fiber | Optical (Terahertz) | N/R | 96.35% (Relative Sensitivity) | N/R | N/R | [7] |
| CMUT Ultrasonic | Optical (Ultrasonic) | 30-70% (v/v) | 0.2% error precision | N/R | Real-time | [8] |
| Wearable Sweat Sensor | Electrochemical (Enzymatic) | 2-500 μM (EtG) | N/R | 2 μM (EtG) | Continuous | [4] |
Abbreviations: N/R = Not Reported; ppb = parts per billion; ppm = parts per million; EtG = Ethyl glucuronide
Table 2: Operational Characteristics Comparison
| Parameter | Electrochemical Sensors | Optical Sensors |
|---|---|---|
| Cost | Low to moderate | Moderate to high |
| Portability | Excellent | Moderate |
| Sample Throughput | High | Moderate |
| Ease of Use | Simple operation | Often requires technical expertise |
| Matrix Effects | Susceptible to interferents | Less affected |
| Multiplexing Capability | Limited | Good |
| Instrumentation Complexity | Low | High |
Experimental Protocols and Methodologies
Fabrication of RuO₂/SnO₂ Chemiresistive Sensor
The high-sensitivity chemiresistive ethanol sensor employs a multi-step fabrication process [6]:
Microheater and Electrode Formation: A suspended membrane structure with integrated microheater is fabricated using micro-electromechanical systems (MEMS) technology to minimize heat dissipation and power consumption (<30 mW).
SnO₂ Thin Film Deposition: A tin dioxide (SnO₂) thin film is deposited via sputtering to form the base sensing material.
RuO₂ Nanosheets Synthesis: Ruthenium dioxide (RuO₂) nanosheets are synthesized through an intercalation-driven exfoliation process, producing monolayer sheets with sub-nanometer thickness and high surface-to-volume ratio.
Functionalization: The RuO₂ nanosheets are deposited onto the SnO₂ thin film via drop-casting to create heterojunctions that enhance sensitivity through electronic and chemical sensitization effects.
Characterization: The functionalized sensor is characterized using scanning electron microscopy, atomic force microscopy, and extended X-ray absorption fine structure analysis to confirm morphology and structure.
The following diagram illustrates the operational mechanism of this chemiresistive sensor:
CMUT-Based Ethanol Concentration Detection
The ultrasonic ethanol detection method utilizes a different physical principle [8]:
Sensor Configuration: A pair of capacitive micromachined ultrasonic transducers (CMUTs) is positioned opposite each other in the solution, with one serving as transmitter and the other as receiver.
Temperature Monitoring: A TR6601 temperature sensor continuously monitors solution temperature for subsequent compensation calculations.
Ultrasonic Measurement: The transmitter CMUT emits ultrasonic signals at 3 MHz center frequency through the test solution.
Time-of-Flight Measurement: The system precisely measures the time taken for ultrasonic pulses to travel between transducers (Time-of-Flight, TOF).
Velocity Calculation: Sound velocity is calculated based on the fixed distance between transducers and the measured TOF.
Temperature Compensation: The established relationship between sound velocity, ethanol concentration, and temperature is applied to determine the final ethanol concentration.
The experimental workflow is visualized below:
Research Reagent Solutions and Materials
Successful implementation of ethanol biosensing platforms requires specific materials and reagents optimized for each detection methodology:
Table 3: Essential Research Reagents for Ethanol Biosensor Development
| Material/Reagent | Function | Example Application | Significance |
|---|---|---|---|
| RuO₂ Nanosheets | Functionalization material | Chemiresistive sensors | Enhances sensitivity through electronic and chemical sensitization; increases response by 337% to 10 ppm ethanol [6] |
| SnO₂ Thin Film | Base sensing material | Chemiresistive sensors | Provides high conductivity and oxygen adsorption capability; forms heterojunction with RuO₂ [6] |
| Photonic Crystal Fiber | Waveguide medium | Optical sensors | Enables high relative sensitivity (96.35% for ethanol) through evanescent field interaction [7] |
| CMUT Array | Ultrasonic transducer | Concentration detection | Enables non-destructive, real-time ethanol monitoring in solutions; compact and portable [8] |
| Alcohol Dehydrogenase/Oxidase | Biorecognition element | Enzymatic electrochemical sensors | Provides specificity for ethanol oxidation; generates measurable electroactive products [4] |
| Biomimetic Receptors | Synthetic recognition element | Biomimetic sensors | Alternative to enzymes; improved stability for wearable applications [4] |
| Ethyl Glucuronide (EtG) Antibodies | Immunorecognition element | Indirect ethanol detection | Enables detection of ethanol metabolite with extended window (up to 5 days in urine) [2] [4] |
Electrochemical and optical biosensors offer distinct advantages for ethanol monitoring in clinical and pharmaceutical contexts. Electrochemical platforms, particularly chemiresistive and wearable enzymatic sensors, provide superior portability, cost-effectiveness, and sensitivity for point-of-care applications such as breath alcohol detection and continuous sweat monitoring [6] [4]. Optical sensors, including terahertz PCF and CMUT-based systems, deliver exceptional accuracy and specificity for laboratory-based quantification and industrial process control [8] [7]. The selection between these platforms should follow a "fit-for-purpose" approach, considering specific application requirements for sensitivity, throughput, portability, and operational complexity [9]. Future development will likely focus on multiplexed detection capabilities, enhanced stability in complex matrices, and integration with wireless technologies for remote monitoring applications.
Fundamental Operating Principles of Electrochemical Biosensors
Electrochemical biosensors are analytical devices that integrate a biological recognition element with an electrochemical transducer to convert a biological event into a quantifiable electrical signal [5]. These biosensors have gained significant prominence in diverse fields, particularly in medical diagnostics, environmental monitoring, and food safety, due to their high sensitivity, selectivity, portability, and cost-effectiveness [10]. The fundamental operation relies on the specific interaction between a target analyte and a biological element (such as an enzyme, antibody, or nucleic acid) immobilized on the electrode surface. This interaction produces a biochemical signal that is converted into an electrical output—such as current, potential, or impedance—which is proportional to the analyte concentration [5] [11].
The significance of electrochemical biosensors is particularly evident in point-of-care (POC) applications, where rapid, on-site analysis is crucial [5]. Their operational principle makes them exceptionally suited for miniaturization and integration into wearable or portable formats, a key advantage over many conventional analytical methods [4] [12]. This review will delineate their core operating principles, illustrate their application in ethanol detection, provide a comparative analysis with optical biosensors, and detail standard experimental methodologies.
Core Principles and Transduction Mechanisms
The operation of an electrochemical biosensor can be deconstructed into two key events: biorecognition and signal transduction.
Biorecognition Elements
This is the biological component that confers specificity to the sensor. For ethanol detection, the most common biorecognition elements are:
- Enzymes: Alcohol oxidase (AOX) and alcohol dehydrogenase (ADH) are predominantly used. Their catalytic reactions form the basis of detection [13] [12].
- Other Elements: Antibodies or biomimetic materials like molecularly imprinted polymers (MIPs) can also be used, especially for detecting non-volatile ethanol metabolites such as ethyl glucuronide (EtG) [4] [12].
Transduction Mechanisms
The biochemical signal generated from the biorecognition event is converted into an electrical signal via different electrochemical techniques:
Table 1: Fundamental Transduction Mechanisms in Electrochemical Biosensors
| Transduction Method | Measured Quantity | Principle of Operation | Common Use in Ethanol Detection |
|---|---|---|---|
| Amperometry | Current | Measures the current generated from the oxidation or reduction of an electroactive species at a constant applied potential. | Detection of H₂O₂ (from AOX reaction) or NADH (from ADH reaction) [13] [12]. |
| Voltammetry | Current | Measures current while the potential between the working and reference electrodes is scanned. | Characterizing the oxidation/reduction behavior of species involved in the detection process [11]. |
| Potentiometry | Potential | Measures the potential difference between working and reference electrodes at zero current. | Less common for enzymatic ethanol detection; used for ion-selective sensors [5] [11]. |
| Impedimetry | Impedance | Measures the opposition to current flow (impedance) when a small amplitude AC potential is applied. | Detecting changes in electrode surface properties due to binding events, often used in immunosensors [11]. |
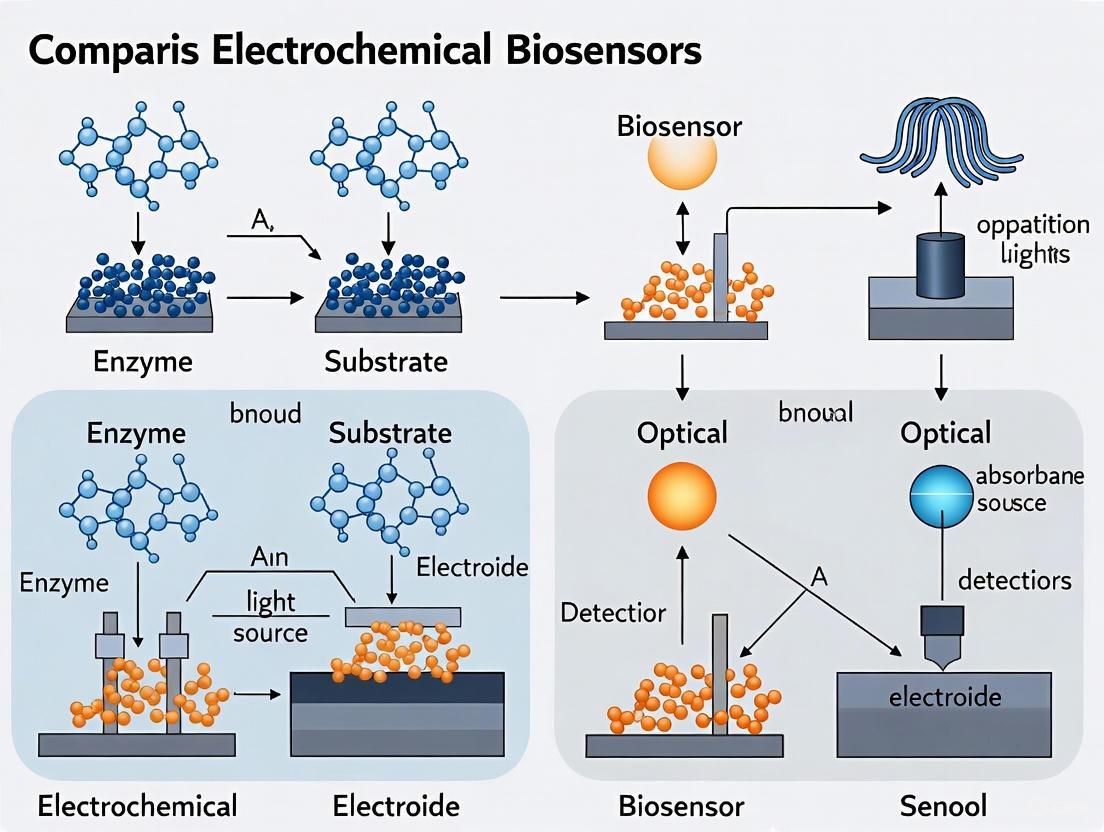
The following diagram illustrates the generalized signaling pathway and workflow for the two primary enzymatic methods of ethanol detection.
Application in Ethanol Detection
Electrochemical biosensors for ethanol leverage the enzymatic reactions detailed in Figure 1. The AOX-based pathway is more commonly implemented in wearable and point-of-care devices because it does not require a soluble cofactor (NAD⁺ must be present in the reaction mixture for ADH) [12]. However, a significant challenge in ADH-based sensors is the high overpotential required for direct NADH oxidation, which can lead to electrode fouling and interference from other electroactive species. This is often mitigated by using modified electrodes with mediators or nanomaterials that lower the operating potential [10] [12].
Recent research focuses on enhancing sensor performance through advanced materials. For instance, a 2023 study reported a highly sensitive ethanol biosensor using a screen-printed electrode modified with a nanocomposite of gold nanoparticles, electrochemically reduced graphene oxide, and polyallylamine hydrochloride (AuNPs-ERGO-PAH) [10]. This nanocomposite acts as an efficient transducer for the electrocatalytic oxidation of NADH, enabling the sensor to achieve a low detection limit of 10 µM and a wide dynamic range, demonstrating applicability in real samples like alcoholic beverages [10].
Wearable formats have also been successfully developed. These devices typically use AOX and monitor ethanol in induced sweat, showing a strong correlation with blood alcohol levels. Such systems can be integrated into single temporary tattoo platforms with screen-printed electrodes for continuous, non-invasive monitoring [4] [12].
Electrochemical vs. Optical Biosensors for Ethanol
While electrochemical biosensors are widely established, optical biosensors represent a major alternative technology. The following table provides a direct, objective comparison of their performance characteristics, particularly in the context of ethanol detection.
Table 2: Performance Comparison of Electrochemical and Optical Biosensors for Ethanol Detection
| Performance Parameter | Electrochemical Biosensors | Optical Biosensors |
|---|---|---|
| Principle | Measure electrical changes (current, potential, impedance) [5]. | Measure light-based changes (absorbance, fluorescence, SPR) [14] [15]. |
| Sensitivity | Very high (e.g., LOD of 10 µM demonstrated [10]). | High, with sensitivity highly dependent on the specific optical method used [14]. |
| Selectivity | High, primarily determined by the enzyme specificity (AOX/ADH) [13]. | High, can also use enzymes; SPR offers label-free specificity [14] [15]. |
| Cost & Portability | Inherently low-cost; easily miniaturized for portable/wearable POC devices [4] [5]. | Often higher cost; miniaturization possible but can require complex optical alignment [14] [5]. |
| Measurement Time | Rapid (seconds to minutes) [12]. | Can be rapid, but some methods require longer analysis or complex calibration [14]. |
| Robustness | Generally robust, but enzyme stability can be a limiting factor over time [13]. | Can be sensitive to environmental light and require clear samples to avoid light scattering [14]. |
| Key Advantage | Cost-effectiveness, simplicity, portability, and suitability for continuous monitoring [5] [12]. | Immunity to electromagnetic interference, potential for multiplexing [14]. |
| Key Disadvantage | Potential for biofouling and interference from electroactive species [12]. | Can be limited by sample turbidity; instrumentation can be bulkier and more expensive [14] [5]. |
Experimental Protocols and Methodologies
This section outlines a generalized experimental protocol for constructing and characterizing an enzymatic electrochemical biosensor for ethanol, synthesizing methodologies from the literature [13] [10] [12].
Biosensor Fabrication Protocol
- Electrode Preparation: Begin with a clean working electrode (e.g., glassy carbon, screen-printed carbon, or gold electrode).
- Surface Modification (if applicable): Modify the electrode surface with nanomaterials (e.g., graphene oxide, carbon nanotubes, metal nanoparticles) or mediators (e.g., Prussian blue, Meldola's blue) to enhance sensitivity and lower working potential. For example, drop-cast a nanocomposite suspension and allow it to dry [10].
- Enzyme Immobilization: Immobilize the biorecognition element (AOX or ADH) onto the transducer surface. Common techniques include:
- Physical Entrapment (e.g., sol-gel): Mix the enzyme with a hydrolyzed alkoxide silicate precursor (e.g., TMOS/MTMOS) and deposit it on the electrode surface, allowing a gel to form at low temperature [10].
- Cross-linking: Mix the enzyme with an inert protein (e.g., BSA) and a cross-linking agent (e.g., glutaraldehyde).
- Covalent Binding: Bind the enzyme to a functionalized electrode surface using carbodiimide chemistry.
- Storage: The fabricated biosensor is typically stored dry at 4°C until use.
Analytical Characterization Procedures
After fabrication, the biosensor's performance is systematically evaluated:
- Amperometric Measurement: The biosensor is immersed in a stirred buffer solution under a constant applied potential (e.g., +0.6 V vs. Ag/AgCl for H₂O₂ detection). Successive aliquots of an ethanol standard solution are added, and the steady-state current is recorded [10] [12].
- Calibration Curve: The measured current (Δi) is plotted against the corresponding ethanol concentration. The sensor's sensitivity is derived from the slope of the linear region of this plot.
- Limit of Detection (LOD): Calculated as 3 times the standard deviation of the blank (buffer) signal divided by the sensitivity of the calibration curve [10].
- Selectivity Test: The biosensor's response to the target analyte (ethanol) is compared to its response to potential interfering substances (e.g., glucose, ascorbic acid, uric acid) present in the sample matrix.
- Stability and Reproducibility: The operational stability is assessed by measuring the sensor response over several hours or days. The reproducibility is determined from the response of multiple independently fabricated sensors.
Essential Research Reagent Solutions
The following table lists key reagents and materials required for developing electrochemical biosensors for ethanol, as cited in the literature.
Table 3: Key Research Reagents for Electrochemical Ethanol Biosensors
| Reagent/Material | Function/Role | Example from Literature |
|---|---|---|
| Alcohol Oxidase (AOX) | Primary biorecognition element; catalyzes ethanol oxidation with O₂, producing H₂O₂ [13]. | Used in wearable tattoo sensors and immobilised enzyme reactors for sweat alcohol monitoring [12]. |
| Alcohol Dehydrogenase (ADH) | Primary biorecognition element; catalyzes ethanol oxidation using NAD⁺ as a cofactor, producing NADH [13]. | Immobilized with sol-gel on nanocomposite-modified electrodes for highly sensitive detection [10]. |
| Nicotinamide Adenine Dinucleotide (NAD⁺) | Soluble coenzyme required for the catalytic function of ADH; its reduced form (NADH) is detected [13] [10]. | Added to the measurement solution or co-immobilized in the sensor film for ADH-based biosensors [10]. |
| Nanocomposites (e.g., AuNPs-ERGO-PAH) | Transducer material; enhances electron transfer, catalyzes the oxidation of H₂O₂ or NADH, and provides a high-surface-area matrix for enzyme immobilization [10]. | AuNPs-ERGO-PAH nanocomposite used to modify SPEs for low-potential NADH detection [10]. |
| Screen-Printed Electrodes (SPEs) | Disposable, miniaturized, and mass-producible electrochemical cell (working, reference, and counter electrode) ideal for POC devices [10]. | Used as the foundational platform for recent highly sensitive biosensors and wearable designs [10] [12]. |
| Sol-Gel Precursors (e.g., TMOS, MTMOS) | Used to create a porous silicate matrix at room temperature for entrapping and stabilizing the enzyme while allowing substrate diffusion [10]. | Used for immobilizing ADH on a nanocomposite-modified SPE to create a stable biosensor [10]. |
The analysis of ethanol concentrations is critically important across biomedical research, clinical diagnostics, and food quality control. Accurate detection of ethanol in biological samples like blood, urine, and breath provides vital information for managing alcohol use disorders, monitoring metabolic processes, and ensuring food safety. Within this field, a significant methodological comparison exists between electrochemical and optical biosensing approaches. While electrochemical sensors have traditionally dominated this application due to their portability and low cost, recent advancements in optical biosensing technologies have demonstrated remarkable potential for creating highly sensitive, label-free, and interference-resistant analytical platforms.
This guide focuses on three sophisticated optical biosensing mechanisms that are reshaping ethanol detection research: Surface Plasmon Resonance (SPR), Localized Surface Plasmon Resonance (LSPR), and Photonic Crystal Fiber (PCF)-based sensors. These technologies exploit the interaction between light and matter at the nanoscale to detect minute changes in the local environment, such as the presence of ethanol molecules. By providing a direct, label-free means of detecting molecular binding events through refractive index changes, these optical platforms are advancing fundamental research into alcohol metabolism and paving the way for next-generation diagnostic devices with performance characteristics that increasingly rival and sometimes surpass established electrochemical methods [16] [5].
Core Sensing Mechanisms and Principles
Surface Plasmon Resonance (SPR)
SPR is a quantum optical-electronic phenomenon that occurs when incident light photons couple with free electron oscillations at a metal-dielectric interface. In conventional SPR configurations, a thin metal film (typically gold or silver) is deposited on a substrate, and light is directed toward the metal surface under conditions of total internal reflection, generating an evanescent wave. When the momentum of this evanescent wave matches that of the surface plasmons in the metal film, resonance occurs, leading to a sharp dip in reflected light intensity at a specific angle or wavelength [17] [18].
This resonance condition is extremely sensitive to changes in the refractive index within the evanescent field region, typically extending 100-300 nanometers from the metal surface. When analyte molecules, such as ethanol, bind to recognition elements on the sensor surface, they alter the local refractive index, causing a measurable shift in the resonance condition. The fundamental relationship governing SPR is expressed in the propagation constant of the surface plasmon wave:
[ k{sp} = \frac{2π}{λ} \sqrt{\frac{εm ns^2}{εm + n_s^2}} ]
Where (k{sp}) is the wave vector of the surface plasmon, (λ) is the wavelength of incident light, (εm) is the dielectric constant of the metal, and (n_s) is the refractive index of the dielectric sensing layer [18].
Localized Surface Plasmon Resonance (LSPR)
LSPR represents a distinct phenomenon from conventional SPR, occurring in metallic nanoparticles rather than continuous thin films. When noble metal nanoparticles are illuminated with light, the confined conduction electrons collectively oscillate at a specific frequency, creating a localized plasmon resonance. This resonance produces strongly enhanced electromagnetic fields near the nanoparticle surfaces and generates characteristic extinction peaks in the visible to near-infrared spectrum [16].
The LSPR extinction peak position and intensity are highly dependent on the nanoparticle's size, shape, composition, and the local dielectric environment. The sensitivity of LSPR to refractive index changes enables its application in biosensing, where molecular binding events near the nanoparticle surface induce measurable spectral shifts. While LSPR typically exhibits lower bulk sensitivity compared to propagating SPR, it offers advantages including simpler instrumentation, higher spatial resolution, and enhanced field confinement for detecting small molecules like ethanol [16] [18].
Photonic Crystal Fiber (PCF)-Based SPR
Photonic crystal fibers represent a revolutionary advancement in fiber optics, featuring a structured cladding with periodic air holes running along the fiber length. This unique microstructure enables precise control over light propagation characteristics. When combined with SPR technology, PCFs create exceptionally versatile sensing platforms [19] [20].
In PCF-SPR sensors, plasmonic materials can be incorporated into the fiber structure through internal coating of air holes or external deposition on a modified fiber surface (such as D-shaped configurations). The guided light in the PCF core evanescently couples with surface plasmons on the metal-dielectric interface, generating resonance phenomena that are highly sensitive to analyte presence. PCF-SPR sensors excel in ethanol detection research due to their large surface area for interaction, minimal sample volume requirements, remote sensing capabilities, and design flexibility that allows optimization for specific detection scenarios [19] [21].
Figure 1: Core signaling pathways and detection mechanisms in SPR, LSPR, and PCF-SPR biosensing platforms. Each mechanism transforms molecular binding events into measurable optical signals through distinct physical phenomena.
Comparative Performance Analysis
Quantitative Performance Metrics
The table below summarizes key performance parameters for SPR, LSPR, and PCF-based biosensing technologies, with particular relevance to ethanol detection applications.
Table 1: Performance comparison of optical biosensing technologies for ethanol detection
| Technology | Sensitivity Range | Detection Limit | Real-time Monitoring | Sample Volume | Multiplexing Capability |
|---|---|---|---|---|---|
| Traditional SPR | 200-292 deg/RIU [16] | ~10⁻⁶ RIU [16] | Excellent | Medium to High | Moderate |
| LSPR | Medium (lower than SPR) [16] | ~10⁻⁵ RIU [16] | Good | Low (μL) | High |
| PCF-SPR | 1,500-42,000 nm/RIU [19] [21] | ~10⁻⁶ RIU | Excellent | Very Low (nL-μL) | High |
| D-shaped PCF-SPR | Up to 42,000 nm/RIU [21] | Sub-ppm possible | Excellent | Low | Moderate |
Application-Specific Performance in Ethanol Detection
Table 2: Experimental performance in ethanol and biological sample detection
| Sensor Technology | Target Analyte | Linear Range | Detection Limit | Selectivity Features |
|---|---|---|---|---|
| SNC-TiO₂ PEC Sensor [22] | Ethanol in whole blood | 1.775 μM - 20 mM | 1.2 μM | Size exclusion, electrostatic effects |
| RuO₂/SnO₂ Chemiresistive [6] | Ethanol vapor | ppb to ppm levels | ~5 ppb | Operating temperature optimization |
| PCF-SPR with Ag/Phosphorene [19] | Refractive index (biomolecules) | 1.39-1.42 RIU | N/A | Phosphorene protection layer |
| D-shaped PCF with Au/TiO₂ [21] | Cancer cells (biomarker) | 1.3-1.4 RIU | High sensitivity | Multi-analyte capability |
Advantages and Limitations for Ethanol Detection
Each optical biosensing technology presents distinctive advantages and limitations for ethanol detection research:
SPR Platforms offer excellent sensitivity and well-established surface chemistry for biorecognition element immobilization. However, they typically require complex instrumentation and have limited portability. Traditional SPR systems are predominantly used in laboratory settings for fundamental ethanol-protein interaction studies rather than portable detection [16] [5].
LSPR Systems provide simpler instrumentation, enhanced portability, and superior spatial resolution. These attributes make LSPR suitable for developing point-of-care ethanol detection devices. The main limitations include moderate sensitivity compared to SPR and potential nanoparticle stability issues in complex biological matrices [16] [18].
PCF-SPR Technologies represent the most advanced approach, offering exceptional design flexibility, minimal sample requirements, remote sensing capability, and the highest reported sensitivity values. The primary challenges include complex fabrication processes and potential coupling inefficiencies. Recent demonstrations of PCF-SPR sensors with optimized gold-TiO₂ layers have achieved remarkable wavelength sensitivity up to 42,000 nm/RIU, making them promising for trace ethanol vapor detection in breath analysis applications [19] [21].
Experimental Protocols and Methodologies
PCF-SPR Sensor Fabrication and Characterization
The development of high-performance PCF-SPR biosensors follows a meticulous fabrication and optimization protocol:
Fiber Preparation and Plasmonic Layer Deposition: Select a suitable PCF substrate (typically silica-based with hexagonal or rectangular air hole arrays). For D-shaped configurations, polish the fiber to create a flat surface for uniform metal deposition. Clean the fiber surface thoroughly using piranha solution and oxygen plasma treatment. Deposit a thin adhesion layer (chromium or titanium, 2-5 nm) followed by the plasmonic metal layer (gold or silver, 40-60 nm thickness) using magnetron sputtering or thermal evaporation. For enhanced stability and sensitivity, additional functional layers such as TiO₂ (10-30 nm) or 2D materials (phosphorene, graphene) may be deposited [19] [21].
Structural Optimization and Performance Validation: Systematically vary critical parameters including metal thickness, air hole diameter, pitch size, and functional layer properties to optimize sensitivity. Characterize the sensor performance using wavelength interrogation by measuring confinement loss spectra across the target wavelength range (typically 500-2000 nm). Determine resonance wavelength shifts corresponding to refractive index changes in the analyte range of interest (1.33-1.45 RIU for biological applications). Calculate wavelength sensitivity using the formula: (Sλ = \frac{\Delta λ{peak}}{\Delta n} ) (nm/RIU), where ( \Delta λ_{peak} ) is the resonance wavelength shift and ( \Delta n ) is the refractive index change [19] [21].
Ethanol Detection Protocol Using Nanochannel-Protected Platform
The following protocol details ethanol detection in complex biological samples using a nanochannel-protected photoelectrochemical platform, which shares methodological principles with optical biosensors:
Sensor Preparation: Fabricate a TiO₂ photoelectrode by depositing anatase TiO₂ nanoparticles (40 nm) onto an indium tin oxide (ITO) substrate. Create a vertical silica nanochannel (SNC) array on the TiO₂ surface using the electrochemically assisted self-assembly method with tetraethoxysilane (TEOS) as the precursor and cetyltrimethylammonium bromide (CTAB) as the template. Remove the template by extraction with acidic ethanol, resulting in a mesoporous SNC layer with uniform pore size (~3 nm) [22].
Biofouling Resistance Testing and Ethanol Detection: Evaluate antibiofouling properties by exposing the sensor to whole blood samples spiked with ethanol and monitoring signal stability compared to unmodified TiO₂. Perform ethanol detection by immersing the SNC-TiO₂ sensor directly into untreated biological samples (blood, fruit juice) with varying ethanol concentrations. Measure photocurrent responses under UV illumination at 365 nm with an applied potential of 0.6 V. Record the steady-state photocurrent for each ethanol concentration and construct a calibration curve. The silica nanochannels exclude macromolecules (proteins, cells) while allowing ethanol diffusion to the TiO₂ surface, enabling direct detection in complex matrices [22].
Figure 2: Experimental workflow for PCF-SPR biosensor fabrication, highlighting key stages from substrate preparation to performance validation.
The Researcher's Toolkit: Essential Materials and Reagents
Table 3: Key research reagents and materials for optical biosensor development
| Category | Specific Materials | Function in Biosensor Development |
|---|---|---|
| Plasmonic Materials | Gold (Au), Silver (Ag) [19] [21] | Generate surface plasmon waves; Au offers stability, Ag provides sharper resonance |
| 2D Materials & Nanocoatings | Phosphorene, Graphene, MoS₂ [19] [20] | Enhance sensitivity, protect metallic layers from oxidation, provide binding sites |
| Metal Oxides | TiO₂, ZnO, SnO₂ [22] [21] [6] | Serve as photocatalytic layers, electron transport materials, or gas sensing elements |
| Fiber Substrates | Silica PCF, D-shaped fibers [19] [21] | Provide flexible light guidance platform with customizable optical properties |
| Functionalization Reagents | CTAB, TEOS, APTES [22] | Enable surface modification, nanochannel formation, and biorecognition element immobilization |
| Detection Elements | Ethanol oxidase, antibodies, aptamers [5] | Provide specific molecular recognition for ethanol detection in complex matrices |
Optical biosensing technologies centered on SPR, LSPR, and PCF platforms have demonstrated remarkable capabilities for ethanol detection and broader biosensing applications. The comparative analysis presented in this guide reveals that each technology offers distinct advantages: traditional SPR provides well-characterized and sensitive platforms for laboratory analysis; LSPR enables compact, potentially portable systems with good sensitivity; while PCF-SPR represents the cutting edge with exceptional design flexibility and the highest reported sensitivity values.
For ethanol detection specifically, the integration of advanced materials such as phosphorene for silver protection [19], TiO₂ for sensitivity enhancement [21], and nanochannel arrays for biofouling resistance [22] has addressed significant challenges in real-sample analysis. These innovations have progressively narrowed the performance gap between optical biosensors and established electrochemical methods for ethanol detection.
Future developments in optical biosensing for ethanol detection will likely focus on several key areas: enhanced multifunctionality through intelligent material combinations, improved portability for point-of-care applications, advanced multiplexing capabilities for parallel biomarker detection, and increased integration with microfluidics and readout instrumentation. As these technologies continue to mature, optical biosensors are poised to become increasingly competitive with and complementary to electrochemical platforms, ultimately expanding the methodological toolbox available to researchers and clinicians working in ethanol detection and alcohol-related research.
The accurate detection and quantification of ethanol is a critical requirement across numerous sectors, including clinical diagnostics, food and beverage quality control, biofuel production, and environmental monitoring. [23] Researchers and industry professionals rely on a suite of established analytical methods, each with its own principles, advantages, and limitations. This guide provides a objective comparison of the core techniques—Gas Chromatography (GC), High-Performance Liquid Chromatography (HPLC), and Enzymatic Assays—focusing on their application for ethanol measurement. Furthermore, it contextualizes these methods within modern biosensor research, where electrochemical and optical transduction platforms often incorporate these classical principles into innovative devices. Understanding the performance benchmarks set by these established methods is essential for evaluating the efficacy of emerging sensor technologies. [5] [23]
Principles and Methodologies of Established Methods
Gas Chromatography (GC)
Principle: GC separates volatile compounds based on their partitioning between a mobile gas phase and a stationary phase within a column. [24] Ethanol's volatility makes it particularly suited for this method.
Experimental Protocol: A sample is injected into a heated inlet, vaporized, and carried by an inert gas (e.g., Helium or Nitrogen) through the column. Different compounds interact differently with the stationary phase, leading to separation. As compounds elute from the column, they are detected by a detector (e.g., Flame Ionization Detection - FID). Identification is based on retention time, and quantification is achieved by comparing the peak area or height to that of calibration standards. [24] [23] Sample preparation may involve dilution, derivatization, or headspace analysis to minimize matrix effects.
High-Performance Liquid Chromatography (HPLC)
Principle: HPLC separates compounds dissolved in a liquid solvent (mobile phase) as they are pumped under high pressure through a column packed with a solid stationary phase. [24]
Experimental Protocol: A liquid sample is injected into the mobile phase stream. Separation occurs based on differential interactions with the stationary phase. The eluting compounds pass through a detector (e.g., UV-Vis, refractive index, or fluorescence). For ethanol, which lacks a strong chromophore, refractive index detection is common, though it is sensitive to temperature and solvent changes. [23] The method requires external calibration with known ethanol standards. Advanced HPLC methods may use internal standards, like caffeine, to improve quantification accuracy, as demonstrated in methodologies for analyzing enzymatic hydrolysis products. [25]
Enzymatic Assays
Principle: These assays rely on the specific catalytic activity of enzymes, such as alcohol dehydrogenase (ADH) or alcohol oxidase (AOX). [10] [26]
Experimental Protocol: In a typical ADH-based assay, ethanol is oxidized in the presence of the coenzyme NAD+, which is reduced to NADH. The reaction is as follows:
Ethanol + NAD+ → Acetaldehyde + NADH + H+
The rate of NADH formation, measured by its absorbance at 340 nm, is directly proportional to the ethanol concentration in the sample. [10] Assays can be performed using spectrophotometers or integrated into biosensor platforms. Key considerations include enzyme activity, pH, temperature, and potential interferences from other substances in the sample matrix. [27] [28]
Performance Benchmarking and Comparison
The following tables summarize the key performance characteristics and a direct comparison of the established methods for ethanol detection, synthesizing data from the search results. [10] [23] [28]
Table 1: Performance Metrics of Established Ethanol Detection Methods
| Method | Typical Dynamic Range | Reported Limit of Detection (LOD) | Key Advantages | Key Limitations |
|---|---|---|---|---|
| Gas Chromatography (GC) | Wide range | Not specified in results, but widely recognized as very low (e.g., ppm) | High reliability, specificity, and accuracy; considered a gold standard. [23] | Complex, costly instrumentation; long analysis time; requires skilled operator; non-volatile compounds require derivatization. [23] |
| High-Performance Liquid Chromatography (HPLC) | µM to mM scale [25] | Can be very low (e.g., 1 µM for pyruvate [28]) | High resolution and sensitivity; suitable for non-volatile and thermally labile compounds. [24] | Expensive solvents; can have long run times; RI detection for ethanol is temperature-sensitive. [24] [23] |
| Enzymatic Assay | 0.05 to 5 mM (in biosensor format) [10] | 10 µM (in biosensor format) [10] | High specificity; simple procedure; can be miniaturized for biosensors. [10] [23] | Enzyme stability and cost; can be less accurate and reproducible; potential interference from other substrates. [27] [23] [28] |
Table 2: Direct Method Comparison for Specific Analytes
| Comparison | Context | Key Finding | Reference |
|---|---|---|---|
| HPLC vs. Enzymatic Assay | Blood pyruvate measurement | HPLC showed better recovery (~99% vs ~90%) and a lower LOD (5 µM vs 10 µM) than the enzymatic assay. A negative bias was observed for the enzymatic method. [28] | [28] |
| Chromatography vs. Enzymatic Assay | Cholesterol measurement in complex profiles (Drosophila) | The enzymatic assay was not specific for cholesterol and detected other sterols, while GC/FID offered the required specificity. This highlights a key limitation of enzymatic methods in complex matrices. [27] | [27] |
Experimental Protocols in Detail
Detailed Protocol: HPLC with Internal Standard
This protocol, adapted from a study on enzymatic hydrolysis, exemplifies a high-accuracy HPLC method. [25]
- Calibration Curve Preparation: Prepare over 10 calibrator samples with variable, known concentrations (e.g., 0.02 to 1.7 mM) of the target analytes (e.g., TPA, MHET, BHET) and a fixed concentration (e.g., 2.11 mM) of an internal standard (e.g., caffeine).
- Sample Preparation: To a reaction sample (e.g., 180 µL), add an equal volume of acetonitrile to precipitate proteins. Centrifuge the mixture (e.g., 4 min at 6200 × g) using a spin column with a 0.2 μm nylon membrane for filtration.
- Acidulation and Standard Addition: Acidify the filtered sample with HCl (to pH ~1.0) and add a known volume of the internal standard stock solution.
- HPLC Analysis: Inject a small volume (e.g., 5 µL) of the prepared sample in triplicate into the HPLC system.
- Column: Phenomenex Luna C8(2) 5 μm, 4.6 × 150 mm.
- Mobile Phase: Gradient elution with water (0.1% formic acid) and acetonitrile (15% to 27.5% over 10 minutes).
- Flow Rate: 1 mL/min.
- Detection: UV-Vis at 240 nm.
- Quantification: Generate a calibration curve by plotting the ratio of the analyte peak area to the internal standard peak area against the known analyte concentration. Use this curve to determine the concentration in unknown samples.
Detailed Protocol: Enzymatic Electrochemical Biosensor for Ethanol
This protocol details the construction and use of a highly sensitive electrochemical biosensor, representing a modern application of enzymatic assays. [10]
- Transducer Preparation: Modify a screen-printed carbon electrode (SPE) with a nanocomposite. This involves depositing a suspension of Gold Nanoparticles, Graphene Oxide, and Poly(allylamine hydrochloride) (AuNPs-GO-PAH) onto the working electrode. Electrochemically reduce the GO to ERGO (electrochemically reduced GO) by cyclic voltammetry in a KCl solution.
- Enzyme Immobilization: Prepare a sol-gel matrix by mixing tetramethoxysilane (TMOS), methyltrimethoxysilane (MTMOS), HCl, water, and polyethylene glycol (PEG 600). Mix the hydrolyzed sol-gel with Alcohol Dehydrogenase (ADH). Drop-cast this mixture onto the modified SPE surface and allow it to cure, trapping the enzyme in the porous sol-gel layer.
- Amperometric Measurement: Place the biosensor in a buffer solution (e.g., 0.1 M PBS, pH 8.8) containing the coenzyme NAD+. Apply a constant potential optimal for NADH oxidation (e.g., +0.4 V vs. Ag/AgCl).
- Calibration and Detection: Introduce standard ethanol solutions under stirring. The enzymatic reaction produces NADH, which is oxidized at the electrode surface, generating a current. Plot the steady-state current against ethanol concentration to create a calibration curve, enabling the quantification of unknown samples.
The Scientist's Toolkit: Essential Research Reagents and Materials
Table 3: Key Reagents and Materials for Ethanol Detection Assays
| Item | Function/Application | Example Usage |
|---|---|---|
| Alcohol Dehydrogenase (ADH) | Biocatalyst; specifically oxidizes ethanol to acetaldehyde, reducing NAD+ to NADH. | Core component in enzymatic assays and electrochemical biosensors. [10] |
| Nicotinamide Adenine Dinucleotide (NAD+) | Coenzyme; acts as an electron acceptor in the ADH-catalyzed reaction. | Essential for enzymatic assays; its reduction to NADH is the measurable event. [10] |
| Screen-Printed Electrodes (SPEs) | Disposable electrochemical platforms (working, reference, and counter electrodes). | Base transducer for portable, low-cost electrochemical biosensors. [10] |
| Gold Nanoparticles (AuNPs) | Nanomaterial; enhances electron transfer, increases surface area, and improves biosensor sensitivity. | Used in nanocomposite transducers for efficient NADH/ethanol detection. [10] |
| Graphene Oxide (GO) / Reduced GO | Nanomaterial; provides a high surface area and excellent electrocatalytic properties. | Component in nanocomposites to lower detection potential and amplify signal. [10] |
| Caffeine | Internal Standard; added in a fixed concentration to samples and calibrators. | Used in HPLC to correct for injection volume variability and improve accuracy. [25] |
| Sol-Gel Matrix | Silicate-based porous network; encapsulates and stabilizes enzymes. | Used for enzyme immobilization on biosensor surfaces, preserving activity. [10] |
Biosensor Context: Electrochemical vs. Optical Sensing
The established methods provide the foundational performance benchmarks against which new biosensor technologies are evaluated. Modern research is focused on developing devices that offer the specificity of enzymatic assays with the portability, speed, and cost-effectiveness required for point-of-care testing. [5]
Electrochemical Biosensors for ethanol, as detailed in the protocol above, typically rely on the enzymatic reaction of ADH and the electrochemical detection of the generated NADH. The use of advanced nanomaterials like AuNPs and rGO is crucial for catalyzing NADH oxidation, reducing the required overpotential, and thus enhancing sensitivity and selectivity. [10] These sensors are prized for their high sensitivity, low detection limits, and easy miniaturization. [5]
Optical Biosensors for ethanol employ a variety of transduction mechanisms, including:
- Absorption-based sensors: Measure the attenuation of light by the sample or a reaction product (e.g., NADH absorbance at 340 nm). [23]
- Plasmonic and interferometric sensors: Detect changes in the refractive index (RI) induced by the binding of ethanol molecules or the enzymatic reaction on a functionalized fiber or chip surface. [29] [23]
- Chemiluminescence: Measures light emission from a chemical reaction, often catalyzed by an enzyme. [5]
A critical review notes that both optical and electrochemical principles are extensively employed in point-of-care devices, with the choice depending on the specific application requirements. [5] Optical fibers are immune to electromagnetic interference and can be used for remote sensing, while electrochemical platforms are often simpler and highly sensitive. [5] [23]
The following diagram illustrates the core signaling pathways and operational principles of these two biosensor types for ethanol detection.
GC, HPLC, and enzymatic assays form the cornerstone of reliable ethanol quantification, each with distinct strengths. GC is the undisputed reference method for volatile analytes, HPLC offers versatile separation for complex mixtures, and enzymatic assays provide biochemical specificity. The choice among them depends on the required sensitivity, specificity, sample throughput, and available resources.
The ongoing research in biosensing aims to translate the accuracy of these laboratory techniques into compact, rapid, and user-friendly devices. Electrochemical biosensors demonstrate remarkable sensitivity by merging enzymatic specificity with advanced nanomaterials, while optical biosensors offer unique advantages for remote and multiplexed sensing. The performance of any new biosensor must be rigorously validated against the benchmarks established by GC, HPLC, and standardized enzymatic methods to ensure data reliability and adoption in both research and industrial practice.
This guide provides an objective comparison of electrochemical and optical biosensors, focusing on three core performance metrics—sensitivity, limit of detection (LOD), and selectivity—within the specific context of ethanol detection research. The evaluation is supported by published experimental data to aid researchers in selecting the appropriate technology.
Biosensors are analytical devices that integrate a biorecognition element with a transducer that converts a biological event into a measurable signal [30]. In ethanol detection, the biorecognition element (e.g., the enzyme alcohol oxidase) interacts specifically with ethanol molecules. This interaction is then transduced, either electrochemically or optically, into a quantifiable output.
The choice between electrochemical and optical transduction is critical, as it directly influences the performance, cost, and applicability of the sensing platform. This is particularly relevant for applications like therapeutic monitoring for alcohol use disorders (AUDs) or roadside alcohol testing, where accuracy, speed, and portability are paramount [4] [22].
Core Performance Metrics Explained
A clear understanding of key metrics is essential for evaluating and comparing biosensor performance.
- Sensitivity refers to the magnitude of the output signal change per unit change in the target analyte concentration. A highly sensitive sensor will produce a large signal shift for a small change in ethanol concentration.
- Limit of Detection (LOD) is the lowest concentration of an analyte that can be reliably distinguished from a blank sample. It is a critical parameter for determining whether a sensor can detect ethanol at physiologically or clinically relevant levels. A paradox exists where achieving an ultra-low LOD is a technological feat but may not always be necessary if the target analyte's relevant concentration is higher [31].
- Selectivity is the sensor's ability to respond exclusively to the target analyte (ethanol) in the presence of potential interferents commonly found in biological samples (e.g., glucose, ascorbic acid, urea, or other alcohols).
Performance Comparison: Electrochemical vs. Optical Biosensors for Ethanol
The table below summarizes the typical performance characteristics of electrochemical and optical biosensors applied to ethanol detection.
Table 1: Performance Comparison for Ethanol Detection
| Performance Metric | Electrochemical Biosensors | Optical Biosensors |
|---|---|---|
| Typical LOD | Low μM range (e.g., 1.2 μM demonstrated by a PEC sensor) [22] | Varies widely; can achieve high sensitivity with advanced methods like dual-comb sensing [32] |
| Sensitivity | High; can be enhanced with nanomaterials (e.g., AuNPs, graphene) [33] | High; techniques like SPR and SERS offer high sensitivity to surface changes [34] [5] |
| Selectivity | High with specific bioreceptors (enzymes, aptamers); but prone to biofouling in complex samples [22] | High with specific bioreceptors; can be engineered for anti-fouling (e.g., nanochannels) [22] |
| Key Advantages | Portability, cost-effectiveness, rapid response, suitability for miniaturization and wearable devices [4] [33] | Label-free detection, real-time monitoring, potential for multiplexing [34] [5] |
| Common Challenges | Susceptibility to environmental factors (pH, temperature); biofouling in untreated samples [22] | Instrumentation can be complex and expensive; some methods require intricate optical alignment [5] |
Experimental Protocols for Ethanol Biosensing
To contextualize the performance data, below are simplified protocols representative of recent research in electrochemical and optical ethanol sensing.
Protocol for a Photoelectrochemical (PEC) Ethanol Sensor
This protocol is adapted from a study demonstrating direct ethanol detection in complex biological samples like whole blood [22].
- Sensor Fabrication:
- Working Electrode Preparation: A cleaned Indium Tin Oxide (ITO) glass substrate is coated with a layer of TiO₂ nanopowder to form the photoactive base.
- Nanochannel Modification: A uniform layer of silica nanochannels (SNC) is grown on the TiO₂ layer using a sol-gel process with tetraethoxysilane (TEOS) as a precursor. This SNC layer is critical for anti-fouling and anti-interference.
- Measurement Procedure:
- The SNC-TiO₂ sensor is connected as the working electrode in a standard three-electrode PEC cell.
- The sensor is immersed directly into the sample (e.g., untreated whole blood or buffer-spiked ethanol).
- The sensor is illuminated with a light source (e.g., a LED), and a fixed potential is applied.
- The photocurrent generated from the catalytic oxidation of ethanol on the TiO₂ surface is measured. The SNC layer excludes large biomacromolecules, preventing fouling and ensuring the signal originates primarily from ethanol.
- Data Analysis: The measured photocurrent is directly proportional to the ethanol concentration. A calibration curve of photocurrent vs. known ethanol concentrations is used to quantify unknown samples.
Protocol for a Surface Plasmon Resonance (SPR) Based Sensor
While not ethanol-specific in the provided results, SPR is a dominant optical technique for label-free bio-sensing, and this protocol outlines its general application [34] [5].
- Sensor Functionalization:
- A gold-coated SPR chip is modified with a self-assembled monolayer to create a surface for biomolecule immobilization.
- A biorecognition element (e.g., an antibody specific to an ethanol metabolite like EtG, or the enzyme alcohol oxidase) is covalently immobilized on the chip surface.
- Measurement Procedure:
- The functionalized chip is installed in the SPR instrument. A baseline is established by flowing a buffer solution over the sensor surface.
- The sample solution is injected over the chip. The binding of the analyte (e.g., EtG) to the immobilized receptor causes an increase in the mass on the surface.
- This mass change alters the refractive index at the sensor surface, leading to a shift in the resonance angle (or wavelength) of the reflected light, which is monitored in real-time.
- Data Analysis: The resulting "sensogram" (a plot of resonance shift vs. time) is analyzed. The rate of binding or the steady-state signal shift is correlated with the analyte concentration in the sample.
Signaling Pathways and Workflows
The following diagrams illustrate the core operational principles of the two biosensor types.
Electrochemical Biosensor Signaling Pathway
Optical Biosensor Signaling Pathway
The Scientist's Toolkit: Key Research Reagents
Successful development of ethanol biosensors relies on several key reagents and materials.
Table 2: Essential Research Reagents for Ethanol Biosensor Development
| Reagent / Material | Function in Biosensor Development |
|---|---|
| Biorecognition Elements (Enzymes, Antibodies, Aptamers) | Provides specificity by selectively binding to ethanol or its metabolites (e.g., EtG) [4]. |
| Nanomaterials (Gold Nanoparticles, Graphene, ZnO Nanorods) | Enhances sensitivity and electron transfer in electrochemical sensors; used for signal amplification in optical SERS sensors [35] [33]. |
| Electrode Materials (SPCE, ITO, Gold Electrodes) | Serves as the solid support for the biorecognition layer and transducer. Screen-printed carbon electrodes (SPCEs) are popular for disposable, low-cost sensors [33]. |
| Anti-fouling Coatings (Polymers, Silica Nanochannels) | Prevents non-specific adsorption of proteins and other macromolecules in complex samples like blood, preserving sensor accuracy and longevity [22]. |
| Redox Probes (e.g., K₃[Fe(CN)₆]/K₄[Fe(CN)₆]) | Used in electrochemical characterization (e.g., Cyclic Voltammetry) to study electrode surface properties and electron transfer efficiency [35]. |
Sensor Technologies in Action: Methodologies and Real-World Applications
The accurate detection and quantification of ethanol is critical across numerous fields, including food and beverage production, forensic science, clinical diagnostics, and biofuel processing [14] [36]. While various analytical techniques exist, sensor-based methods offer distinct advantages in terms of portability, cost, and potential for real-time monitoring. This guide focuses on a detailed comparison of three principal electrochemical sensing techniques—amperometric, potentiometric, and impedimetric—for ethanol detection. Furthermore, these methods are contextualized within a broader thesis comparing electrochemical and optical biosensors, providing researchers and drug development professionals with a comprehensive overview of available sensing strategies, their operational principles, and their relative performance metrics to inform experimental design and application development.
Electrochemical Sensing Approaches: Core Principles and Comparison
Electrochemical sensors transduce chemical information into an analytically useful electrical signal. The three primary types discussed here are distinguished by their fundamental measurement principles.
Amperometric Sensors
Amperometry measures the current resulting from the electrochemical oxidation or reduction of an analyte at a constant applied working electrode potential. The magnitude of the measured current is directly proportional to the concentration of the analyte [37]. For ethanol, this often involves its direct electrocatalytic oxidation or an enzyme-mediated reaction. For instance, copper electrodes in an alkaline medium electrocatalyze ethanol oxidation with participation of electrogenerated Cu(III) species [38]. Alternatively, enzymatic amperometric biosensors use alcohol dehydrogenase (ADH) to oxidize ethanol, coupled with the electrochemical detection of the generated NADH cofactor [39]. A key challenge is minimizing the high overpotential required for NADH oxidation, which is often addressed using modified electrodes with mediators or nanomaterials [39].
Potentiometric Sensors
Potentiometry measures the potential difference between a working electrode and a reference electrode under conditions of zero current. This potential is logarithmically related to the activity of the target ion or molecule via the Nernst equation [37] [40]. Potentiometric ethanol sensors can operate on different principles. Some detect the redox potential change resulting from an enzyme-catalyzed reaction involving ethanol [37]. Others are solid-state sensors, like those based on zinc oxide (ZnO) thin films, where the potential difference (thermo EMF) across a junction of pure and Fe-modified ZnO changes upon exposure to ethanol vapor [41].
Impedimetric Sensors
Impedimetric sensors use electrochemical impedance spectroscopy (EIS) to monitor changes in the impedance (and its components, resistance and capacitance) at the electrode-electrolyte interface. These changes can result from the electrocatalytic oxidation of an analyte or from binding events on the electrode surface. For example, a sensor with a nickel-salen metallopolymer film exhibits changed interfacial charge transfer resistance upon electrocatalytic oxidation of alcohols, allowing for their identification [36]. EIS can also detect ethanol directly by measuring the dielectric properties of ethanol-water solutions using interdigitated electrodes, where the ethanol concentration influences the electrical parameters derived from an equivalent circuit model [42].
Table 1: Comparative Overview of Electrochemical Ethanol Sensing Techniques
| Feature | Amperometry | Potentiometry | Impedimetry |
|---|---|---|---|
| Measured Quantity | Current | Potential | Impedance (Phase/Angle, Magnitude) |
| Typical Dynamic Range | Wide (e.g., 2-10% v/v [38], 0.05-5 mM [39]) | Narrower (Logarithmic response) | Wide (e.g., 0-50% v/v [42]) |
| Sensitivity | High (e.g., 44.6 µA/mM·cm² [39]) | Moderate (e.g., ~41-59 mV/decade [37]) | High (Detects minor interfacial changes) |
| Detection Limit | Low (e.g., 10 µM [39]) | Moderate | Very Low (e.g., 0.2% v/v [42]) |
| Key Advantage | High sensitivity, direct quantitative readout | Simple instrumentation, wide range of ionophores | Label-free, rich information on interfacial properties |
| Key Disadvantage | Fouling of electrode surface, requires constant potential | Susceptible to drift, interference from other ions | Complex data interpretation, requires modeling |
Experimental Protocols for Electrochemical Ethanol Sensing
Protocol 1: Amperometric Biosensor with Enzyme and Nanocomposite
This protocol details the construction of a highly sensitive ethanol biosensor using a screen-printed electrode (SPE) modified with a nanocomposite and the enzyme Alcohol Dehydrogenase (ADH) [39].
1. Sensor Fabrication:
- Transducer Preparation: A ternary nanocomposite is prepared by sequentially sonicating gold nanoparticles (AuNPs) with graphene oxide (GO), and then with poly(allylamine hydrochloride) (PAH). A volume of 5 µL of this AuNPs-GO-PAH suspension is drop-cast onto the carbon working electrode of an SPE and dried [39].
- Electrochemical Reduction: The GO in the composite is electrochemically reduced to ERGO (electrochemically reduced graphene oxide) by performing cyclic voltammetry (e.g., 10 cycles between -1000 and +500 mV) in a deaerated 0.1 M KCl solution. This creates the AuNPs-ERGO-PAH/SPE transducer [39].
- Enzyme Immobilization: Alcohol Dehydrogenase (ADH) is immobilized on the transducer surface using a sol-gel matrix. The sol-gel is prepared by mixing tetramethoxysilane (TMOS), methyltrimethoxysilane (MTMOS), HCl, water, and polyethylene glycol (PEG 600). This mixture is sonicated and aged. The prepared sol-gel is then mixed with ADH solution, and a small volume (e.g., 5 µL) is drop-cast onto the modified electrode and allowed to dry, resulting in the ADH-sol-gel/AuNPs-ERGO-PAH/SPE biosensor [39].
2. Measurement and Detection:
- The biosensor is placed in a stirred electrochemical cell containing a suitable buffer (e.g., 0.1 M phosphate buffer, pH 8.8) along with the necessary cofactor (NAD⁺).
- A constant potential optimal for NADH oxidation (e.g., +0.5 V vs. Ag/AgCl) is applied to the working electrode.
- Ethanol samples are introduced into the cell. The enzymatic oxidation of ethanol by ADH produces NADH, which is subsequently oxidized at the electrode surface, generating a measurable current proportional to the ethanol concentration [39].
Diagram 1: Amperometric biosensor fabrication workflow.
Protocol 2: Impedimetric Sensor with Metallopolymer for Alcohol Identification
This protocol describes the use of a nickel-salen metallopolymer sensor and electrochemical impedance spectroscopy (EIS) to study and differentiate small-chain alcohols [36].
1. Sensor Fabrication:
- Electrode Preparation: A fluoride-doped tin oxide (FTO) glass slide is typically used as the working electrode.
- Polymer Electrodeposition: The FTO electrode is immersed in a solution containing the monomeric nickel(II) complex ([Ni(α,α'-Methyl₂Salen)]). The metallopolymer film is formed on the FTO surface by performing multiple cycles (e.g., 30 cycles) of cyclic voltammetry within a suitable potential window in an acetonitrile solution. This creates the Ni-salen/FTO sensor [36].
2. Measurement and Data Analysis:
- EIS Measurement: The Ni-salen/FTO sensor is immersed in an alkaline medium (e.g., NaOH) containing the alcohol of interest (e.g., methanol, ethanol, propanol). Electrochemical impedance spectra are recorded at a fixed DC potential (e.g., 0.45 V vs. SCE) with a superimposed AC voltage over a wide frequency range.
- Data Fitting: The obtained impedance spectra are fitted to an equivalent electrical circuit model to extract parameters such as the charge transfer resistance and double-layer capacitance.
- Multivariate Analysis: The extracted impedimetric parameters for different alcohols are processed using Principal Component Analysis (PCA). The PCA plot allows for the visual identification and distinction of different alcohols based on their unique impedimetric fingerprints [36].
The Scientist's Toolkit: Essential Research Reagents and Materials
The successful development and implementation of electrochemical ethanol sensors rely on a suite of specialized materials and reagents.
Table 2: Key Research Reagent Solutions for Electrochemical Ethanol Sensors
| Reagent/Material | Function/Application | Example Use Case |
|---|---|---|
| Alcohol Dehydrogenase (ADH) | Enzyme; biocatalyst for selective oxidation of ethanol to acetaldehyde. | Core recognition element in amperometric biosensors [39]. |
| Nicotinamide Adenine Dinucleotide (NAD⁺) | Cofactor; necessary for the enzymatic reaction, reduced to NADH during ethanol oxidation. | Required for signal generation in ADH-based amperometric biosensors [39]. |
| Gold Nanoparticles (AuNPs) | Nanomaterial; enhances electron transfer, increases surface area for enzyme immobilization. | Used in nanocomposite transducers to facilitate NADH oxidation [39]. |
| Graphene Oxide/Reduced GO | Nanomaterial; provides high electrical conductivity and large surface area. | Component in nanocomposites to improve sensor sensitivity and lower detection limits [39]. |
| Nickel-Schiff Base Complex (e.g., Ni-Salen) | Metallopolymer; acts as an electrocatalyst for the oxidation of alcohols. | Sensing layer in impedimetric sensors for alcohol identification [36]. |
| Poly(allylamine hydrochloride) (PAH) | Polyelectrolyte; aids in the formation of stable nanocomposites and film integrity. | Binder and dispersing agent in AuNPs-ERGO-PAH nanocomposites [39]. |
| Sol-Gel Precursors (TMOS, MTMOS) | Silica matrix; creates a porous, stable inorganic network for enzyme encapsulation. | Matrix for immobilizing ADH on sensor surfaces while maintaining activity [39]. |
Electrochemical vs. Optical Biosensors for Ethanol Detection
While electrochemical sensors are widely used, optical biosensors represent a major alternative technology. A comparison is essential for a balanced thesis.
Optical Biosensor Approaches:
- Principle: These sensors detect changes in an optical property (e.g., absorbance, fluorescence, refractive index) induced by the interaction between ethanol and a sensing element [14].
- Examples: An "optical bio-sniffer" for ethanol vapor uses an oxygen-sensitive optical fiber coated with alcohol oxidase (AOD). The enzymatic reaction consumes oxygen, which is detected by the fluorescent quenching of a ruthenium complex [43]. Other types include surface plasmon resonance (SPR) sensors, interferometric sensors, and fiber grating sensors, which often rely on detecting refractive index changes in a sensitive coating [14].
- Advantages: High sensitivity, immunity to electromagnetic interference, and potential for multiplexing [14].
- Disadvantages: Can be more complex and expensive, often requiring precise optical alignment and sophisticated instrumentation [14].
Comparative Analysis:
- Performance: Both optical and electrochemical sensors can achieve high sensitivity and low limits of detection for ethanol. For instance, an optical fiber sensor based on complementary double split ring resonators (CDSRRs) reported a detection limit of 0.2% v/v for ethanol in water [42], which is comparable to advanced electrochemical sensors.
- Practicality: Electrochemical sensors generally excel in cost-effectiveness, miniaturization potential, and ease of integration into portable devices, which is critical for point-of-care and field applications [39]. Optical sensors, while potentially more robust in electrically noisy environments, often face challenges in miniaturization and cost [14].
- Selectivity: Both platforms can achieve high selectivity through the use of biological recognition elements (ADH, AOD). In non-enzymatic designs, selectivity is achieved through tailored materials (e.g., metallopolymers [36] or specific hydrogel compositions [44]).
Diagram 2: Hierarchical classification of primary ethanol sensor types.
Amperometric, potentiometric, and impedimetric sensors each offer distinct mechanisms and performance profiles for ethanol detection. Amperometry is highly sensitive and directly quantitative, potentiometry offers simplicity, and impedimetry provides rich, label-free information on interfacial processes. The choice of technique depends heavily on the specific application requirements, such as the need for sensitivity, selectivity, portability, or cost-effectiveness.
When framed within the broader context of biosensor technology, electrochemical methods present a compelling case due to their relatively low cost, potential for miniaturization, and compatibility with portable instrumentation. However, optical biosensors remain a powerful technology, particularly in environments where electrical interference is a concern or where their unique advantages in multiplexing can be fully leveraged. Future research will likely focus on the continued enhancement of these platforms through novel nanomaterials, improved biorecognition elements, and advanced data processing techniques to push the boundaries of sensitivity, stability, and real-world applicability.
This guide provides an objective comparison of two principal biosensing methodologies—advanced optical platforms based on Photonic Crystal Fiber (PCF) and Terahertz (THz) technologies versus conventional electrochemical biosensors—for the detection of ethanol. Aimed at researchers and drug development professionals, it synthesizes experimental data and protocols to inform sensor selection and development.
Performance Comparison: PCF/THz vs. Electrochemical Biosensors for Ethanol Detection
The table below summarizes the key performance metrics of PCF/THz sensors and electrochemical biosensors, highlighting their distinct advantages for different application scenarios.
Table 1: Performance Comparison of Ethanol Sensing Technologies
| Sensor Technology | Detection Principle | Key Performance Metrics | Advantages | Limitations |
|---|---|---|---|---|
| PCF/THz Optical Sensor | Refractive Index (RI) change in photonic crystal fiber at Terahertz frequencies [45] [46] | - Relative Sensitivity: 94.67% - 97.55% [45] [46]- Effective Material Loss (EML): 0.0044 - 0.0083 cm⁻¹ [45] [46]- Confinement Loss (CL): ~10⁻¹¹ - 10⁻⁵ dB/m [47] [48] | Label-free, direct chemical identification [45]; High specificity to molecular fingerprints [45]; Resistant to electromagnetic interference [45] | Requires complex modeling (e.g., FEM) [45]; Can be sensitive to temperature and mechanical stress [47] |
| Electrochemical Biosensor | Enzymatic reaction (ADH) & electrochemical detection of NADH [39] | - Detection Limit: 1.2 µM - 10 µM [22] [39]- Linear Range: 1.775 µM - 20 mM [22] [39]- Sensitivity: 44.6 µA/mM·cm² [39] | High sensitivity in liquids [22] [39]; Portable and cost-effective [39]; Suitable for wearable formats [4] | Susceptible to biofouling in complex samples [22]; Requires enzyme immobilization [39]; Performance affected by pH, temperature [22] |
Experimental Protocols for Key Sensor Technologies
Protocol for PCF/THz Sensor Design and Analysis
The development of a PCF-based THz sensor involves a rigorous numerical simulation process to optimize its design and predict performance.
Table 2: Key Experimental Steps for PCF/THz Sensor Analysis
| Step | Description | Key Parameters & Tools |
|---|---|---|
| 1. Geometric Modeling | Design the PCF cross-section (e.g., hexagonal, web-like core, square core, or hollow-core structures) using simulation software [45] [47]. | - Software: COMSOL Multiphysics [45] [47]- Core Materials: Zeonex (RI=1.53), Topas [45] [49]- Analyte Channels: Design core for chemical infiltration [48] |
| 2. Material and Mode Definition | Define background material properties and analyze the fundamental optical mode (e.g., LP01) propagating in the fiber [49] [47]. | - Analysis Method: Finite Element Method (FEM) [45] [48]- Boundary Condition: Perfectly Matched Layer (PML) [47] |
| 3. Performance Evaluation | Simulate and calculate key performance metrics by analyzing the interaction of the THz wave with the target analyte [45] [46]. | - Metrics: Relative Sensitivity, Confinement Loss (CL), Effective Material Loss (EML) [45] [46]- Frequency Range: Typically 2.0 - 3.0 THz [45] [48] |
Protocol for Electrochemical Biosensor Operation
Electrochemical biosensors for ethanol follow a well-established enzymatic pathway and detection method.
- Biorecognition Element: Alcohol dehydrogenase (ADH) is immobilized onto a transducer surface, often using a sol-gel matrix to entrap the enzyme [39].
- Enzymatic Reaction: Upon introduction of a sample containing ethanol, ADH catalyzes the oxidation of ethanol, using the cofactor NAD+ as an electron acceptor. This reaction produces acetaldehyde and the reduced form of the cofactor, NADH [39].
- Electrochemical Transduction: The generated NADH is then oxidized at the surface of a chemically modified electrode. The resulting electrical current is directly proportional to the concentration of ethanol in the sample [39]. Modifying the electrode with composites like gold nanoparticles and reduced graphene oxide is common to enhance sensitivity and lower the oxidation potential of NADH [39].
Signaling Pathways and Workflow Visualizations
The diagrams below illustrate the core working principles of the two sensor types.
PCF/THz Sensor Working Principle
Electrochemical Ethanol Biosensor Pathway
The Scientist's Toolkit: Essential Research Reagents and Materials
Successful experimentation in this field relies on specific materials and reagents.
Table 3: Essential Research Reagents and Materials for Sensor Development
| Category | Item | Function / Application |
|---|---|---|
| PCF/THz Platform | Zeonex (Cyclic Olefin Copolymer) | Low-loss background material with stable RI (≈1.53) for PCF in THz range [45] [48] |
| Topas (Cyclic Olefin Copolymer) | Low-loss polymer used for cladding in hollow-core or twisted PCF designs [49] | |
| COMSOL Multiphysics Software | Industry-standard FEM platform for modeling PCF geometry and electromagnetic properties [45] [47] | |
| Electrochemical Platform | Alcohol Dehydrogenase (ADH) | Primary biorecognition element that catalyzes ethanol oxidation [39] |
| β-Nicotinamide Adenine Dinucleotide (NAD⁺) | Cofactor required for the enzymatic reaction; its reduction to NADH is the measurable event [39] | |
| Gold Nanoparticles (AuNPs) / Reduced Graphene Oxide (ERGO) | Nanomaterials used to modify electrodes, enhancing surface area and electrocatalytic activity for NADH oxidation [39] | |
| Sol-Gel Precursors (e.g., TMOS, MTMOS) | Used to create a porous matrix for stable enzyme (ADH) immobilization on the sensor surface [39] |
Photoelectrochemical (PEC) sensors represent a cutting-edge analytical technology that ingeniously integrates optical excitation with electrochemical detection. This hybrid approach leverages light as an excitation source and measures the resulting electrical current generated by photoinduced charge transfers at a solid-liquid interface [50] [51]. The fundamental operating principle involves photoactive materials that absorb light energy, prompting electrons to transition from the valence band to the conduction band, thereby generating electron-hole pairs [52]. These photogenerated carriers then participate in redox reactions with species in the electrolyte solution, producing a measurable electrical signal that serves as the analytical readout [53]. This unique mechanism provides PEC sensors with exceptional advantages, including remarkably low background signals due to the complete separation of excitation source (light) and detection signal (current), high sensitivity approaching single-molecule detection levels, simple instrumentation requirements, and excellent potential for miniaturization [50] [51] [54]. The subsequent sections of this guide will explore how these fundamental characteristics position PEC sensors as powerful alternatives to conventional electrochemical and optical biosensors, with a specific focus on their application in ethanol detection for biomedical research and diagnostic applications.
Fundamental Principles and Comparative Advantages
Core Mechanism of PEC Sensing
The operational framework of a PEC biosensor centers on photoelectric conversion processes occurring at the interface between a photoactive material and an electrolyte solution. When a photoactive material, typically a semiconductor, absorbs photons with energy exceeding its bandgap energy, electrons become excited and jump from the valence band (VB) to the conduction band (CB), creating electron-hole pairs [52] [51]. The resulting photogenerated carriers then separate and migrate: electrons move toward the electrode substrate while holes travel to the material surface where they can oxidize electron donors in the electrolyte [53]. Alternatively, electrons may reduce electron acceptors at the electrode interface. This light-induced charge separation generates a photocurrent that can be precisely measured by an electrochemical workstation [51]. The presence of target analytes modulates this photocurrent through various mechanisms, including serving as electron donors/acceptors, quenching photogenerated carriers, or blocking interfacial charge transfer via specific biological recognition events [55]. This elegant mechanism forms the basis for quantitative detection in PEC biosensing platforms.
Comparative Analysis with Conventional Biosensing Platforms
The table below provides a systematic comparison of PEC sensors against traditional electrochemical and optical biosensors for ethanol detection, highlighting key performance characteristics and practical considerations.
Table 1: Performance Comparison of Biosensing Platforms for Ethanol Detection
| Feature | Photoelectrochemical (PEC) Sensors | Traditional Electrochemical Sensors | Optical Biosensors |
|---|---|---|---|
| Excitation Source | Light [51] | Electrical potential [50] | Light [51] |
| Detection Signal | Photocurrent [51] | Faradaic current [50] | Fluorescence, absorbance, etc. [51] |
| Background Signal | Very low [50] [51] | Relatively higher [50] | Moderate to high [50] |
| Sensitivity | Excellent (high signal-to-noise) [50] [22] | Good | Good to excellent |
| Selectivity | High (dual recognition via bio-receptor & potential) [53] | Moderate to high | High |
| Instrumentation | Relatively simple, portable options [54] | Simple, highly portable | Often complex, bulky equipment [54] |
| Cost | Low to moderate [50] | Low | High [54] |
| Miniaturization Potential | Excellent [50] [51] | Excellent | Limited |
| Susceptibility to Interference | Low (separate energy forms) [50] | Moderate (electrical interference) | Moderate (optical interference) |
The distinct advantage of PEC sensors lies in their unique combination of low background signals and high sensitivity. Because the excitation source (light) and detected signal (current) represent two different forms of energy, the background signal inherent in traditional electrochemical techniques—where the excitation potential can cause non-faradaic processes—is significantly reduced [50]. This separation results in an superior signal-to-noise ratio, enabling lower detection limits and enhanced sensitivity compared to conventional approaches [51]. Furthermore, PEC sensors maintain the cost-effectiveness, operational simplicity, and excellent miniaturization potential of electrochemical systems while overcoming many of their limitations [50] [54].
Figure 1: Fundamental signaling pathway in a photoelectrochemical sensor. The core PEC process involves light absorption, electron-hole pair generation, charge separation, and oxidation of the target analyte (e.g., ethanol), culminating in a measurable photocurrent.
Experimental Realization: PEC Ethanol Detection
Detailed Experimental Protocol
The application of PEC sensors for ethanol detection has been demonstrated through sophisticated experimental designs. A representative protocol, adapted from a study on direct ethanol detection in complex biological samples, is outlined below [22]:
- Electrode Modification: Begin with an Indium Tin Oxide (ITO) conductive glass substrate. Modify the electrode surface by depositing a layer of TiO₂ nanoparticles (anatase, 40 nm) to form the primary photoactive layer.
- Nanochannel Fabrication: To enhance selectivity in complex matrices, grow a protective layer of vertical silica nanochannels (SNC) on the TiO₂ surface. This is achieved using a sol-gel process with tetraethoxysilane (TEOS) as the precursor and cetyltrimethylammonium bromide (CTAB) as a structure-directing agent.
- Sensor Assembly: Incorporate the modified electrode (SNC-TiO₂) into a standard three-electrode electrochemical cell, using a platinum wire as the counter electrode and an Ag/AgCl reference electrode.
- PEC Measurement: Immerse the sensor directly into the sample solution (e.g., whole blood, fruit juice). Illuminate the working electrode with a UV LED light source (wavelength ~365 nm). Apply a constant low bias potential (e.g., 0 V vs. Ag/AgCl) and record the generated anodic photocurrent over time.
- Quantification: The photocurrent intensity is directly correlated with ethanol concentration. As ethanol diffuses through the nanochannels and is oxidized on the TiO₂ surface, it acts as an efficient electron donor, scavenging photogenerated holes and leading to a measurable increase in photocurrent.
The Scientist's Toolkit: Essential Research Reagents and Materials
The following table catalogues the key materials and reagents essential for constructing and operating high-performance PEC ethanol sensors, based on current research methodologies [22] [10].
Table 2: Essential Research Reagents and Materials for PEC Ethanol Sensor Development
| Reagent/Material | Function/Description | Research Context |
|---|---|---|
| TiO₂ Nanoparticles | Primary photoactive material; generates electron-hole pairs under UV light [22]. | Core component of the photoelectrode; its properties dictate light absorption and charge generation efficiency [22]. |
| Silica Nanochannels (SNC) | Anti-biofouling layer; provides size and electrostatic exclusion of interferents [22]. | Crucial for direct detection in complex samples (e.g., blood) by protecting the photoactive surface [22]. |
| Alcohol Dehydrogenase (ADH) | Biological recognition element; specifically catalyzes ethanol oxidation [10]. | Used in enzyme-based PEC biosensors to provide high selectivity for ethanol [10]. |
| Nicotinamide Adenine Dinucleotide (NAD⁺) | Coenzyme; essential for the enzymatic reaction catalyzed by ADH [10]. | The enzymatic oxidation of ethanol produces NADH, which is then electrochemically detected, providing the sensing signal [10]. |
| Indium Tin Oxide (ITO) Glass | Transparent conducting electrode substrate. | Allows light to pass through to illuminate the photoactive material while serving as a conductor for electron collection. |
| Gold Nanoparticles (AuNPs) | Signal amplifier and electron transfer facilitator [10]. | Often integrated into nanocomposites to enhance electrical conductivity and improve NADH oxidation kinetics [10]. |
| Graphene Oxide (GO) | Component of nanocomposite transducers [10]. | Provides a high surface area and excellent electrical properties when reduced, facilitating efficient electron transfer. |
Figure 2: Generalized experimental workflow for constructing and using a PEC ethanol sensor, from electrode modification to final signal measurement.
Performance Analysis and Research Data
Quantitative Performance Metrics of PEC Ethanol Sensors
The analytical performance of recently developed PEC sensors for ethanol detection is quantified in the table below, which summarizes key metrics reported in the research literature.
Table 3: Experimental Performance Data of PEC and Comparative Sensors for Ethanol
| Sensor Type | Detection Principle | Linear Range | Detection Limit | Real-Sample Application | Reference |
|---|---|---|---|---|---|
| PEC Sensor (SNC-TiO₂) | Nanochannel-protected direct oxidation [22] | 1.775 μM - 20 mM | 1.2 μM | Untreated whole blood, kiwifruit [22] | [22] |
| Electrochemical Biosensor (AuNPs-ERGO-PAH) | ADH enzyme + NAD⁺ cofactor [10] | 0.05 - 5 mM | 10 μM | Alcoholic beverages [10] | [10] |
| Breathalyzer | Breath alcohol estimation [4] | Varies | Varies | Exhaled breath | [4] |
The data reveals the exceptional capability of the SNC-TiO₂ PEC sensor, which achieves a remarkably low detection limit of 1.2 μM and a wide linear dynamic range spanning four orders of magnitude [22]. This performance is attributed to the synergistic combination of the high-responsivity TiO₂ photoactive material and the anti-fouling properties of the silica nanochannels. Furthermore, this sensor's unique design enables its direct application in challenging, complex matrices like untreated whole blood without sample pre-treatment, a significant advantage over many conventional sensors [22]. When compared to a sophisticated electrochemical biosensor that also demonstrates high sensitivity, the PEC sensor shows a marginally lower detection limit, highlighting its superior potential for trace-level analysis [22] [10].
This guide has objectively detailed the principles, construction, and performance of photoelectrochemical sensors, underscoring their significant advantages for ethanol detection research. The core strength of PEC technology lies in its ingenious merging of optical and electrochemical principles, which results in exceptionally low background signals and high sensitivity [50] [51]. The presented experimental data confirms that well-designed PEC sensors, such as the nanochannel-protected SNC-TiO₂ platform, can achieve low micromolar detection limits and operate directly in complex biological fluids like blood, outperforming many traditional alternatives [22]. While challenges remain—including the potential photodegradation of materials and the need for robust anti-fouling strategies in long-term use—ongoing research in novel photoactive materials [50] [53], signal amplification strategies [50] [51], and integration with microfluidic and wearable platforms [54] is poised to further advance the field. For researchers and drug development professionals, PEC biosensors offer a powerful, versatile, and rapidly evolving analytical tool that is particularly well-suited for sensitive, selective, and potentially point-of-care ethanol quantification.
The direct detection of analytes like ethanol in complex, untreated biological fluids such as whole blood represents a significant frontier in biosensing. These matrices contain numerous interfering species, including proteins, cells, and small molecules, which can foul sensor surfaces, reduce specificity, and compromise accuracy. Traditional methods often require extensive sample pre-treatment, which is impractical for point-of-care testing and real-time monitoring. This guide objectively compares the performance of two prominent sensing technologies—electrochemical and optical biosensors—in addressing these challenges, with a specific focus on ethanol detection. The evaluation is framed within a broader thesis that, while optical sensors achieve exceptional sensitivity in controlled settings, electrochemical platforms currently demonstrate superior practicality and robustness for direct analysis in complex, fouling-prone biological environments.
Performance Comparison: Electrochemical vs. Optical Biosensors
The table below summarizes the experimentally demonstrated performance of representative electrochemical and optical biosensors for detecting target analytes in complex biological matrices.
Table 1: Performance Comparison of Biosensors in Complex Matrices
| Sensor Technology | Target Analyte | Complex Matrix | Linear Range | Limit of Detection (LOD) | Key Advantages | Primary Limitations |
|---|---|---|---|---|---|---|
| Photoelectrochemical (PEC) Optical Sensor [22] | Ethanol | Untreated Whole Blood, Kiwifruit | 1.775 μM – 20 mM | 1.2 μM | Direct immersion; excludes biofouling via size/electrostatic exclusion; high stability. | Requires nanoengineering; potential light scattering in highly opaque samples. |
| Terahertz (THz) Optical Sensor [56] | Ethanol & Benzene | Simulated Environmental Samples | N/S | N/S | High relative sensitivity (96.35% for ethanol). | Performance data in real biological fluids not provided. |
| Electrochemical DNA (E-DNA) Sensor [57] | miRNA-29c | Whole Human Serum | 0.1 – 100 nM | N/S | Resistant to electrode fouling; amplification-free; high specificity for sequence discrimination. | Sigmoidal response may complicate quantification. |
| Electrochemical Microfluidic Biosensor [58] | CD4+ T Cells | Whole Blood | 1.25×10⁵ – 2×10⁶ cells/mL | 1.41×10⁵ cells/mL | Minimized manual handling; suitable for low-resource settings. | Specific to cellular targets, not small molecules like ethanol. |
| Flexible Electrochemical Biosensor [59] | Alcohol (Biomarkers) | Sweat | N/S | N/S | Non-invasive monitoring; high correlation with blood levels; wearable form factor. | Performance can be influenced by skin physiology and sweat rate. |
Abbreviation: N/S = Not Specified in the provided context.
Detailed Experimental Protocols
Protocol 1: Silica Nanochannel-Modified Photoelectrochemical (PEC) Sensor for Ethanol in Whole Blood
This protocol details the methodology for creating a nanoengineered PEC sensor capable of direct ethanol detection in untreated whole blood [22].
- Sensor Fabrication: An Indium Tin Oxide (ITO) glass electrode serves as the substrate. A layer of TiO₂ nano-powder (anatase) is first applied. The key modification involves coating this layer with a vertical, uniform silica nanochannel (SNC) film. This is achieved using a sol-gel process with tetraethoxysilane (TEOS) as the silica source and cetyltrimethylammonium bromide (CTAB) as a structure-directing agent, which is subsequently removed to create the nanochannels [22].
- Detection Principle: The SNC-TiO₂ electrode is immersed in the untreated biological sample. Under illumination, the TiO₂ generates photo-induced charge carriers. Ethanol diffuses through the nanochannels and is oxidized on the TiO₂ surface, producing a measurable photocurrent. The nanochannels act as a selective barrier: their hydrophilic nature, small size, and electrostatic properties effectively exclude larger biofouling macromolecules (e.g., proteins, cells) and interfering substances from reaching and fouling the active TiO₂ surface [22].
- Experimental Procedure:
- Calibration: The sensor is calibrated in standard ethanol solutions to establish the photocurrent-concentration relationship.
- Real Sample Analysis: The sensor is directly immersed into untreated whole blood or other complex samples (e.g., fruit juice).
- Measurement: The photocurrent is measured under a fixed potential and light intensity. The ethanol concentration is quantified based on the calibration curve, with the nanochannels ensuring the signal is specific to the small target analyte [22].
Protocol 2: Conformational Change-Based Electrochemical DNA Sensor for miRNA in Whole Serum
This protocol describes an electrochemical sensor that leverages a structural change for specific, fouling-resistant detection in serum [57].
- Sensor Fabrication: A gold disk electrode is polished and cleaned. It is then functionalized with a thiolated, methylene blue (MB)-tagged DNA capture probe via a gold-thiol self-assembled monolayer. The probe sequence is complementary to the target miRNA-29c. The electrode is treated with 6-mercapto-1-hexanol (MCH) to passivate unused gold sites and create a well-ordered, upright probe layer [57].
- Detection Principle: The sensing mechanism is based on a binding-induced conformational change. In the absence of the target, the flexible DNA probe keeps the MB redox tag in close proximity to the gold electrode, enabling efficient electron transfer and a high Faradaic current. Upon hybridization with the target miRNA, the probe undergoes a rigid, linear conformational change, pushing the MB tag away from the electrode surface. This reduces the electron transfer efficiency, leading to a measurable drop in current [57].
- Experimental Procedure:
- Baseline Measurement: The electrochemical signal (e.g., via Square-Wave Voltammetry) is recorded in a buffer or pure serum to establish the baseline current.
- Sample Incubation: The sensor is incubated in the whole serum sample containing the target miRNA.
- Signal Measurement: After incubation and washing, the electrochemical signal is measured again. The signal suppression (%) is directly correlated to the concentration of the target miRNA in the sample. This "signal-off" mechanism is inherently resistant to fouling, as non-specific adsorption does not typically cause the same specific conformational change [57].
Diagram 1: Biosensor antifouling mechanisms for complex matrices.
The Scientist's Toolkit: Essential Research Reagents and Materials
Successful development of biosensors for complex matrices relies on specialized materials and reagents. The following table details key components cited in the featured research.
Table 2: Key Research Reagent Solutions for Biosensor Development
| Reagent/Material | Function in Biosensing | Application Example |
|---|---|---|
| TiO₂ Nanoparticles | Photoactive material; generates electron-hole pairs under illumination for photoelectrochemical signal generation. | Core sensing material in PEC ethanol sensor [22]. |
| Tetraethoxysilane (TEOS) | Precursor for constructing silica nanochannels via sol-gel processes; forms a protective, selective layer. | Creating the antifouling nanochannel layer in the SNC-TiO₂ sensor [22]. |
| Cetyltrimethylammonium Bromide (CTAB) | Structure-directing template for creating ordered mesoporous silica nanochannels. | Used as a porogen in the SNC fabrication process [22]. |
| Thiolated DNA Probes | Forms self-assembled monolayers on gold surfaces; provides specific biorecognition for DNA/RNA targets. | Capture probe for miRNA detection in E-DNA sensors [57]. |
| Methylene Blue (MB) | Redox reporter tag; its electron transfer efficiency is modulated by changes in distance from the electrode. | Signaling molecule in conformational change-based E-DNA sensors [57]. |
| 6-Mercapto-1-hexanol (MCH) | Backfilling agent; passivates gold surface to minimize non-specific adsorption and orient DNA probes. | Essential for reducing fouling and improving performance of E-DNA sensors [57]. |
| Indium Tin Oxide (ITO) Glass | Transparent conducting electrode substrate; essential for photoelectrochemical and optical sensing. | Electrode substrate for the SNC-TiO₂ PEC sensor [22]. |
Direct detection in complex matrices remains a demanding yet critical goal for biosensors. The experimental data and protocols presented in this guide illustrate distinct technological pathways. Photoelectrochemical sensors achieve direct analysis in whole blood by integrating sophisticated nanoarchitectures for physical exclusion of interferents [22]. In contrast, electrochemical sensors exploit clever mechanisms like conformational change to maintain function in fouling environments like whole serum, often with simpler instrumentation [57]. For the specific challenge of ethanol detection, PEC sensors demonstrate remarkable performance in blood, while flexible electrochemical platforms offer a viable, non-invasive route via sweat monitoring [59]. The choice between optical and electrochemical approaches involves a trade-off between the exceptional sensitivity of some optical methods and the robustness, miniaturization potential, and cost-effectiveness of electrochemical systems for real-world, point-of-care applications.
The accurate detection of ethanol is critically important across biomedical, forensic, and clinical domains, serving as a vital indicator for assessing intoxication levels and diagnosing alcohol use disorders [22]. Traditional laboratory-based methods, while accurate, are often time-consuming, require complex instrumentation, and are unsuitable for rapid point-of-care (POC) testing. The evolving landscape of POC diagnostics demands technologies that are rapid, cost-effective, user-friendly, and capable of being deployed in decentralized settings [60] [5]. In this context, biosensors have emerged as transformative analytical tools. These devices integrate a biological recognition element with a physicochemical transducer to produce a quantifiable signal proportional to the target analyte [60] [61]. Among the various sensing modalities, electrochemical and optical biosensors have garnered significant attention for POC applications due to their high sensitivity, potential for miniaturization, and compatibility with portable readout systems [5]. This guide provides a systematic comparison of electrochemical and optical biosensing platforms for ethanol detection, evaluating their performance, portability, miniaturization potential, and integration capabilities to inform researchers and drug development professionals.
Fundamental Principles: A Tale of Two Transductions
Biosensors function by converting a biological recognition event into a measurable electrical or optical signal. The core components include a biorecognition element (e.g., enzyme, antibody, nucleic acid) that selectively interacts with the target analyte (ethanol), and a transducer that translates this interaction into a detectable output [60] [61]. The fundamental distinction between electrochemical and optical biosensors lies in the nature of this transduction mechanism.
Electrochemical Biosensors
Electrochemical biosensors measure electrical signals arising from biochemical reactions. When the biorecognition element interacts with ethanol, it may trigger a redox reaction, leading to changes in electrical properties that are measured as current (amperometric), potential (potentiometric), or impedance (impedimetric) [62] [5]. For instance, an enzymatic electrochemical sensor for ethanol might utilize alcohol dehydrogenase, and the ensuing enzymatic reaction generates or consumes electrons, producing a measurable current. These sensors are prized for their high sensitivity, low detection limits, and excellent compatibility with miniaturized, portable electronics [62].
Optical Biosensors
Optical biosensors detect changes in light properties as a result of the biorecognition event. These changes can be in intensity, wavelength, polarization, or phase [61] [5]. Modalities include colorimetry (visible color change), fluorescence (light emission), chemiluminescence (light from a chemical reaction), and surface plasmon resonance (SPR, changes in refractive index at a metal surface) [63] [5]. A colorimetric ethanol biosensor might produce a visible color change readable by the naked eye or a smartphone camera, making it highly suitable for simple POC tests.
The diagram below illustrates the core working principles and logical workflow of these two biosensor types.
Performance Comparison: Electrochemical vs. Optical Biosensors for Ethanol
The choice between electrochemical and optical transduction for ethanol detection involves trade-offs between sensitivity, cost, complexity, and suitability for POC applications. The table below summarizes a comparative analysis of the two platforms based on key performance metrics.
Table 1: Comparative analysis of electrochemical and optical biosensors for ethanol detection.
| Feature | Electrochemical Biosensors | Optical Biosensors |
|---|---|---|
| Fundamental Principle | Measures changes in current, potential, or impedance from redox reactions [62] [5]. | Measures changes in light properties (e.g., absorbance, fluorescence) [63] [5]. |
| Typical Bioreceptor | Enzymes (e.g., Alcohol Oxidase, Dehydrogenase) [22]. | Enzymes, synthetic dyes, or responsive hydrogels [64] [22]. |
| Sensitivity | Very high (can achieve µM to nM detection limits) [62]. | High (colorimetric may be less sensitive than fluorescence/SPR) [63] [5]. |
| Selectivity | High with specific bioreceptors; can be affected by interfering electroactive species [62]. | High with specific bioreceptors; can be compromised by sample turbidity or autofluorescence [5]. |
| Miniaturization Potential | Excellent; compatible with microelectrodes and lab-on-a-chip (LOC) fabrication [60] [62]. | Good; can be integrated into microfluidics, but some optical paths can be challenging to miniaturize [63] [65]. |
| Portability & Equipment | High; compact, low-power potentiostats available; ideal for field use [62] [5]. | Variable; colorimetric strips with smartphone readout are highly portable; SPR systems are less so [63] [5]. |
| Cost & Simplicity | Generally low-cost electronics and electrodes; can be mass-produced [62]. | Variable; colorimetric strips are very low-cost; complex fluorimeters/SPR are expensive [5]. |
| Key Advantage for POC | High sensitivity in a small, low-power, and potentially implantable format [62]. | Visual readout (colorimetric) enables intuitive use and simple result interpretation [5]. |
| Key Challenge for POC | Biofouling of electrode surfaces in complex samples (e.g., blood) can degrade signal [62] [22]. | Signal interference from colored or turbid biological samples can affect accuracy [5] [22]. |
Experimental Deep Dive: A Case Study in PEC Ethanol Sensing
Recent research focuses on overcoming the limitations of traditional biosensors in complex biological samples like whole blood. A state-of-the-art photoelectrochemical (PEC) sensor, which combines light excitation with electrochemical detection, demonstrates this progress.
Detailed Experimental Protocol: Nanochannel-Protected PEC Sensor
The following protocol is adapted from a recent study on a direct ethanol sensor for whole blood [22].
Sensor Fabrication:
- Electrode Preparation: Clean and dry an Indium Tin Oxide (ITO) glass slide, which serves as the transparent conducting substrate.
- Photo-active Layer Coating: Deposit a layer of TiO₂ nano-powder (anatase) onto the ITO surface to form the photo-active core.
- Nanochannel Modification: Grow a vertical, uniform layer of silica nanochannels (SNC) on the TiO₂ layer. This is achieved via a sol-gel process using tetraethoxysilane (TEOS) as the precursor and cetyltrimethylammonium bromide (CTAB) as a structure-directing agent, followed by calcination to remove the template.
Assay Procedure:
- The SNC-TiO₂ working electrode is assembled into a standard three-electrode PEC cell with a Pt counter electrode and an Ag/AgCl reference electrode.
- The sensor is connected to a potentiostat and illuminated with a LED light source.
- A fixed volume (e.g., 50 µL) of the untreated biological sample (whole blood, fruit juice) is dropped directly onto the sensor surface or the sensor is immersed in the sample.
- The photocurrent is measured under applied potential. Ethanol diffuses through the nanochannels and is oxidized on the TiO₂ surface, leading to a enhancement of the anodic photocurrent.
- The change in photocurrent is quantified and correlated to the ethanol concentration in the sample using a pre-established calibration curve.
Key Findings and Data: This sensor achieved a broad linear detection range from 1.775 µM to 20 mM and a low detection limit of 1.2 µM in untreated whole blood. The silica nanochannels were critical for performance, providing size-exclusion and electrostatic filtering to block biofouling macromolecules and interferents, while allowing small ethanol molecules to pass through. The sensor demonstrated excellent reproducibility and stability, maintaining performance after direct immersion in complex samples [22].
The experimental workflow for this advanced PEC sensor is visualized below.
The Scientist's Toolkit: Essential Reagents and Materials
The development and implementation of POC biosensors for ethanol rely on a suite of specialized reagents and materials. The following table details key components used in the featured experiments and the broader field.
Table 2: Key research reagent solutions for biosensor development.
| Reagent/Material | Function/Brief Explanation | Example Use Case |
|---|---|---|
| Indium Tin Oxide (ITO) Glass | A transparent conducting oxide substrate; allows light to pass through for excitation while serving as an electrode. | Used as the base working electrode in photoelectrochemical (PEC) sensors [22]. |
| TiO₂ (Anatase) Nanopowder | A semiconductor material that acts as a photo-active element; generates electron-hole pairs upon light illumination. | Forms the core sensing layer in the PEC ethanol sensor, where it catalyzes the oxidation of ethanol [22]. |
| Tetraethoxysilane (TEOS) | A common precursor in sol-gel chemistry for synthesizing silica (SiO₂) layers and structures. | Used to fabricate the protective silica nanochannel (SNC) membrane on the sensor surface [22]. |
| Cetyltrimethylammonium Bromide (CTAB) | A surfactant that acts as a structure-directing agent or template. | Used to create the ordered porous structure of the silica nanochannels during the sol-gel process [22]. |
| Alcohol Oxidase/Dehydrogenase | Enzymes that serve as the biorecognition element, specifically catalyzing the oxidation of ethanol. | Immobilized on transducer surfaces in enzymatic electrochemical or optical biosensors for ethanol [22]. |
| Nafion | A proton-conducting polymer membrane; can be used to entrap enzymes and repel interfering anions. | Used as a permselective coating on electrode surfaces to improve selectivity in electrochemical sensors. |
The journey toward ideal point-of-care ethanol biosensors is marked by a continuous trade-off between the exceptional sensitivity and miniaturization of electrochemical platforms and the visual simplicity and user-friendliness of optical systems. The experimental case study on the nanochannel-protected PEC sensor highlights a powerful trend: the convergence of optical and electrochemical principles to create hybrid platforms that mitigate the weaknesses of a single approach [22]. The future of POC biosensing lies in such innovative integrations, alongside the incorporation of advanced materials like nanomaterials and smart polymers [64] [66], and the leveraging of artificial intelligence (AI) for intelligent signal processing and automated decision-making [63]. For researchers and drug development professionals, the choice between electrochemical and optical biosensors is not about finding a universally superior technology, but about selecting the right tool for the specific application, balancing the demands of sensitivity, cost, complexity, and the end-user environment to truly unlock the potential of point-of-care diagnostics.
Enhancing Performance: Overcoming Challenges and Optimization Strategies
Addressing Biofouling and Interference in Complex Biological Samples
The accurate detection of ethanol in complex biological samples is a critical challenge with significant implications for medical diagnostics, law enforcement, and food safety. Researchers, scientists, and drug development professionals consistently face the obstacle of biofouling—the non-specific adsorption of proteins, cells, and other biomolecules onto sensor surfaces—which severely compromises sensor accuracy and longevity. This comparative guide objectively evaluates the performance of electrochemical and optical biosensing platforms in overcoming these challenges, providing supporting experimental data to inform selection for specific research applications. The fundamental distinction between these platforms lies in their transduction mechanisms: electrochemical sensors measure electrical signals resulting from biochemical interactions, while optical sensors detect changes in light properties. Both pathways ultimately convert the biorecognition event into a quantifiable analytical signal, but their approaches to mitigating fouling and interference differ substantially, as detailed in the following sections.
Electrochemical Biosensing Approaches
Electrochemical biosensors convert biological recognition events into measurable electrical signals (current, potential, or impedance) and represent a prominent technology for ethanol detection due to their high sensitivity, portability, and cost-effectiveness. Recent advances have focused on innovative materials and nanostructuring strategies to create barriers against fouling agents while maintaining ethanol accessibility.
Multifunctional Peptide-Modified Sensors
Experimental Protocol: A groundbreaking approach involved designing a multifunctional branched peptide that integrates distinct antifouling, antibacterial, and recognition sequences on a single scaffold [67]. The peptide was constructed with: (1) a zwitterionic antifouling sequence (EKEKEKEK) that forms a hydration layer via hydrogen bonding; (2) an antibacterial sequence (KWKWKWKW) with positive charges that disrupt bacterial membranes through electrostatic interactions; and (3) a specific recognition sequence (KSYRLWVNLGMVL) for target binding [67]. Researchers immobilized this peptide onto a gold nanoparticle/poly(3,4-ethylenedioxythiophene) polystyrene sulfonate (AuNP/PEDOT:PSS)-modified glassy carbon electrode via gold-sulfur bonds. The fabrication was validated through scanning electron microscopy, electrochemical impedance spectroscopy, and quartz crystal microbalance measurements [67].
Performance Analysis: The sensor demonstrated exceptional antifouling capabilities, reducing non-specific protein adsorption to 3.1% compared to 87.6% on control surfaces when exposed to undiluted human saliva [67]. The antibacterial efficacy reached 96.4% against E. coli and 95.3% against S. aureus [67]. For the target analyte (SARS-CoV-2 RBD protein), the sensor achieved a detection limit of 0.28 pg mL⁻¹ with a wide linear range (1.0 pg mL⁻¹ to 1.0 μg mL⁻¹) [67].
Nanochannel-Protected Photoelectrochemical Sensors
Experimental Protocol: For direct ethanol detection in complex samples, researchers developed a silica nanochannel (SNC)-protected TiO₂ photoelectrochemical (PEC) sensor [22]. The SNC film was fabricated on a TiO₂-coated indium tin oxide (ITO) electrode through a surfactant-templated method using cetyltrimethylammonium bromide and tetraethoxysilane, creating uniform vertical channels approximately 2-3 nm in diameter [22]. This architecture was characterized by scanning electron microscopy and high-resolution transmission electron microscopy, confirming successful TiO₂ encapsulation. The hydrophilic nanochannels function as a physical sieve, excluding macromolecules (>3 nm) like proteins and cells while permitting ethanol diffusion to the photoactive surface [22].
Performance Analysis: The SNC modification enhanced PEC performance through improved light absorption, electron-hole separation, and surface reaction rates [22]. When directly immersed in untreated whole blood, the sensor maintained functionality with a broad linear range for ethanol detection (1.775 μM to 20 mM) and a low detection limit (1.2 μM) [22]. The sensor demonstrated excellent reproducibility (RSD = 2.1%) and stability (maintaining 95.8% signal after 4 weeks) in complex biological matrices [22].
Table 1: Performance Comparison of Electrochemical Biosensors for Ethanol Detection
| Sensor Type | Antifouling Strategy | Linear Range | Detection Limit | Sample Matrix | Stability/Reproducibility |
|---|---|---|---|---|---|
| RuO₂/SnO₂ Film [6] | Catalytic RuO₂ nanosheets | Few ppm to ppb levels | ~5 ppb | Humid air, simulated breath | >80% response after 28 days |
| Peptide-Based [67] | Multifunctional branched peptide | 1.0 pg mL⁻¹ to 1.0 μg mL⁻¹ | 0.28 pg mL⁻¹ | Human saliva | Good correlation with ELISA (clinical samples) |
| SNC-TiO₂ PEC [22] | Silica nanochannels (size exclusion) | 1.775 μM to 20 mM | 1.2 μM | Untreated whole blood, fruit | RSD = 2.1%; 95.8% signal after 4 weeks |
Optical Biosensing Approaches
Optical biosensors detect analytes through changes in light properties (absorption, reflectance, fluorescence) and offer advantages for ethanol detection including high sensitivity and resistance to electromagnetic interference. These platforms employ various mechanisms to mitigate fouling, particularly through surface functionalization and nanomaterial engineering.
Surface Plasmon Resonance (SPR) Platforms
Experimental Protocol: SPR biosensors detect refractive index changes at a metal surface (typically gold) when biomolecular binding occurs [34]. The experimental setup involves immobilizing a recognition element (e.g., antibody, enzyme) on the sensor chip surface, often through a carboxymethylated dextran matrix functionalized with NHS chemistry for amine coupling [34]. Sample solution flows over the surface, and binding events are monitored in real-time as resonance angle shifts. For ethanol detection, alcohol oxidase or specific antibodies can serve as recognition elements. The sensor surface can be pre-treated with zwitterionic polymers or PEG-based coatings to minimize non-specific adsorption [34].
Performance Analysis: SPR enables label-free, real-time monitoring of molecular interactions with typical detection limits in the nanomolar range for proteins [34]. While direct ethanol detection data in complex matrices is limited in the searched literature, SPR platforms have demonstrated robust performance in detecting various analytes in biofluids. For instance, SPR successfully diagnosed Epstein-Barr virus infection stages by simultaneously detecting antibodies against three viral antigens in clinical serum samples [34]. The technology has also detected antibiotics in milk with high sensitivity and mycotoxin patulin with a detection limit of 0.1 nM [34].
Localized Surface Plasmon Resonance (LSPR) Systems
Experimental Protocol: LSPR utilizes metallic nanoparticles (Au, Ag) that exhibit localized plasmon oscillations when illuminated, resulting in specific absorption peaks [34]. Sensor fabrication involves immobilizing nanoparticles on a substrate (glass, optical fiber) or using them in suspension [34]. The nanoparticles can be functionalized with recognition elements and antifouling coatings. Binding events cause local refractive index changes, shifting the absorption peak. LSPR systems typically operate in transmission or reflection modes, with the transmission mode measuring light passing through the sample and reflection mode detecting reflected light [34].
Performance Analysis: LSPR offers enhanced sensitivity compared to conventional SPR for certain applications due to heightened electromagnetic fields around nanoparticles [34]. The detection mechanism relies on "wavelength-shift sensing" caused by environmental dielectric changes when binding occurs [34]. LSPR properties are tunable by adjusting nanoparticle material, size, shape, and inter-particle distance, allowing optimization for specific detection scenarios. These sensors are particularly adaptable for various fabrication formats and are considered next-generation plasmonic label-free methods [34].
Table 2: Performance Comparison of Optical Biosensors
| Sensor Type | Detection Principle | Key Features | Representative Detection Limit | Advantages for Complex Samples |
|---|---|---|---|---|
| SPR [34] | Refractive index change | Label-free, real-time monitoring | ~nM range for proteins | High-throughput capability with SPR imaging |
| LSPR [34] | Nanoparticle plasmon resonance | Tunable sensitivity | Potentially higher than SPR for small molecules | Adaptable fabrication formats |
| SERS [5] | Raman scattering enhancement | Molecular fingerprinting | Single-molecule detection possible | Can be combined with antifouling coatings |
Comparative Performance Analysis
Direct Experimental Comparison
While direct head-to-head comparisons of electrochemical and optical biosensors for ethanol detection in complex matrices are limited in the searched literature, the available data reveals distinct performance patterns. Electrochemical sensors generally demonstrate superior sensitivity for small molecules like ethanol, with detection limits reaching parts-per-billion levels [6]. The RuO₂/SnO₂-based sensor achieved remarkable sensitivity with a limit of detection of approximately 5 ppb for ethanol, while maintaining functionality under varied humidity conditions [6]. Optical platforms, particularly SPR and LSPR systems, excel in providing detailed binding kinetics and multiplexing capabilities without requiring labels [34].
Biofouling Resistance Mechanisms
Both sensing approaches employ sophisticated antifouling strategies, but their implementation differs substantially. Electrochemical sensors frequently utilize:
- Multifunctional peptides combining zwitterionic sequences for hydration layer formation with antibacterial domains [67]
- Nanochannel barriers providing physical size exclusion while permitting analyte access [22]
- Polymer coatings such as PEDOT:PSS that offer conductive antifouling properties [67]
Optical sensors typically employ:
- Self-assembled monolayers with polyethylene glycol or zwitterionic functionalities [34]
- Dextran matrices that provide both immobilization support and fouling resistance [34]
- Nanoparticle functionalization with antifouling ligands in LSPR systems [34]
The Scientist's Toolkit: Essential Research Reagents
Table 3: Key Research Reagent Solutions for Biosensor Development
| Reagent/Material | Function | Example Applications |
|---|---|---|
| Zwitterionic Peptides (EKEKEKEK) [67] | Forms hydration layer to resist non-specific protein adsorption | Electrochemical sensor surfaces |
| Antibacterial Peptides (KWKWKWKW) [67] | Disrupts bacterial membranes via electrostatic interactions | Multifunctional biosensor coatings |
| Silica Nanochannels [22] | Provides size-based exclusion of interferents | Protecting photoactive surfaces in PEC sensors |
| RuO₂ Nanosheets [6] | Enhances catalytic activity and sensor response | Functionalizing metal oxide sensors |
| PEDOT:PSS [67] | Conductive polymer for electrode modification with antifouling properties | Electrochemical sensor substrates |
| Carboxymethylated Dextran [34] | 3D matrix for biomolecule immobilization on SPR chips | SPR sensor functionalization |
| Gold Nanoparticles [34] | Plasmonic nanomaterial for LSPR signal transduction | Optical biosensor enhancement |
The comparative analysis of electrochemical and optical biosensors for ethanol detection in complex biological samples reveals distinct advantages and optimal application scenarios for each platform. Electrochemical biosensors, particularly those incorporating multifunctional peptides and nanochannel architectures, demonstrate exceptional sensitivity for small molecules like ethanol, with detection limits reaching parts-per-billion levels. These systems offer practical advantages for field deployment and continuous monitoring applications due to their miniaturization potential and lower instrumentation costs. Optical biosensors, especially SPR and LSPR platforms, provide superior capabilities for detailed binding kinetic analysis and multiplexed detection without requiring labeling. The selection between these technologies should be guided by specific research requirements: electrochemical sensors for maximum sensitivity and portability in ethanol detection, and optical platforms when binding mechanism elucidation or parallel detection of multiple analytes is prioritized. Future developments will likely focus on hybrid approaches that combine the sensitivity of electrochemical detection with the spatial resolution and multiplexing capabilities of optical systems, further enhancing our ability to perform accurate ethanol measurements in challenging biological matrices.
Biosensors are analytical devices that integrate a biological recognition element with a transducer to convert a biological response into a measurable signal [68]. The integration of nanotechnology has revolutionized biosensing performance by leveraging the unique properties of materials at the nanoscale. Nanomaterials provide exceptional characteristics for biosensing applications, including extensive surface area-to-volume ratios, enhanced catalytic activity, superior electron transfer capabilities, and the ability to be precisely functionalized with various biorecognition elements [68] [69] [70]. These properties collectively address key biosensing challenges, enabling devices with significantly improved sensitivity, selectivity, and stability.
The evolution of biosensor technology is categorized into five generations, with current systems representing a paradigm shift where bioreceptors are integral components of the sensing element [68]. This progression has been accelerated by nanotechnology, leading to the development of biosensing platforms capable of detecting analytes at ultra-low concentrations, which is crucial for applications ranging from medical diagnostics to environmental monitoring [68] [71]. Nanoengineered interfaces, formed by integrating biological molecules with engineered nanomaterials, create synergistic systems that combine exceptional recognition capabilities with enhanced signal transduction [72]. This review comprehensively compares the performance of electrochemical and optical biosensing platforms incorporating nanomaterials, metal nanoclusters, and nanoengineered interfaces, with a specific focus on ethanol detection applications relevant to research and industrial contexts.
Fundamental Biosensing Mechanisms and Nanomaterial Integration
Electrochemical Biosensing Platforms
Electrochemical biosensors function by converting biological recognition events into quantifiable electrical signals such as current, voltage, or impedance changes [71] [70]. These systems typically employ a three-electrode configuration (working, reference, and counter electrodes) where the working electrode serves as the solid support for immobilizing both nanomaterials and biorecognition elements. The analytical performance is heavily dependent on the electrode material and its modification, with common materials including gold, glassy carbon, screen-printed electrodes, and indium tin oxide (ITO) [71].
Nanomaterials enhance electrochemical biosensors through multiple mechanisms: they provide increased surface area for biomolecule immobilization, facilitate faster electron transfer kinetics, and often exhibit electrocatalytic properties that amplify the detection signal [71] [70]. Carbon-based nanomaterials like carbon nanotubes (CNTs) and graphene are particularly valuable due to their extraordinary mechanical stability, substantial surface area, and remarkable electrical conductivity resulting from orbital hybridization (sp²) between adjacent carbon atoms [70]. Functional nanomaterials are integrated into these systems to significantly improve sensitivity and selectivity while enabling real-time monitoring capabilities [71].
Optical Biosensing Platforms
Optical biosensors transduce biological recognition events into measurable optical signals through various mechanisms including photoluminescence, colorimetric changes, chemiluminescence, bioluminescence, and electrochemiluminescence [73] [74]. These platforms leverage the unique optical properties of nanomaterials, which differ significantly from their bulk counterparts due to quantum confinement effects and enhanced surface interactions [73].
Metal nanoclusters (MNCs), in particular, have emerged as powerful components for optical biosensing due to their strong photoluminescence, high photochemical stability, and tunable emission properties [75] [74]. These ultra-small nanoclusters (typically less than 2 nm) consist of tens to hundreds of metal atoms and exhibit discrete energy levels that result in unique optical behavior distinct from larger nanoparticles [75]. The integration of low-dimensional nanomaterials (zero-dimensional, 1D, 2D, and 3D) has redirected focus toward the design, fabrication, and optimization of optical biosensors for applications requiring portability and rapid responsiveness [73].
Table 1: Fundamental Mechanisms in Nanomaterial-Enhanced Biosensors
| Biosensor Type | Transduction Mechanism | Measurable Signal | Key Nanomaterial Enhancers |
|---|---|---|---|
| Electrochemical | Electron transfer during biochemical reactions | Current, voltage, impedance | Carbon nanotubes, graphene, metal nanoparticles, nanowires |
| Optical | Light-matter interaction | Fluorescence intensity, color change, luminescence | Metal nanoclusters, quantum dots, plasmonic nanoparticles |
| Primary Advantage | High sensitivity, portability, cost-effectiveness | Visual detection, multiplexing capability, high spatial resolution | |
| Common Techniques | DPV, SWV, EIS, chronoamperometry | Fluorescence spectroscopy, colorimetric analysis, SPR, SERS |
Key Nanomaterials and Their Properties
Carbon-Based Nanomaterials
Carbon nanomaterials represent a fundamental category for biosensing applications due to their versatile properties and functionalization capabilities. Carbon nanotubes (CNTs), discovered by Sumio Ijima in 1991, are hollow carbon structures with nanoscale diameters where carbon atoms join through sp² bonds, providing exceptional strength and stiffness [68]. These structures exist as single-walled (SWCNTs) or multi-walled (MWCNTs) configurations, each offering distinct advantages for biosensing applications [70].
SWCNTs exhibit extraordinary electronic and mechanical characteristics that have garnered significant attention in electrochemical biosensing [70]. Their substantial surface area increases the quantity of immobilized enzymes, expands reaction areas between enzymes and substrates, facilitates electrical conductivity, and enhances the signal response of biosensors [70]. However, SWCNTs face challenges with insolubility in aqueous solutions, which can be addressed through nanocomposite formation with biocompatible polymers [70]. MWCNTs, comprising multiple concentric graphene cylinders, present excellent conduction and electrocatalytic characteristics that make them valuable as modified scaffolds on electrodes [70].
Graphene offers a two-dimensional hexagonal pattern of carbon atoms with higher specific surface area than CNTs, though its hydrophobicity can limit biosensing applications [70]. Graphene oxide (GO) and reduced graphene oxide (rGO) address these limitations by increasing hydrophilicity and restoring electrical conductivity while maintaining ease of surface modification for biomolecule immobilization [70].
Metal Nanoclusters and Nanoparticles
Metal nanoclusters (MNCs) represent an emerging class of nanomaterials with exceptional properties for biosensing applications. These ultra-small structures consist of tens to hundreds of metal atoms with core sizes typically less than 2 nm, placing them between individual metal atoms and larger nanoparticles [75]. This size regime results in pronounced quantum confinement effects that lead to discrete energy states, generating unique properties including strong photoluminescence, redox capabilities, large Stokes shift, and molecular magnetism [75].
MNC synthesis employs various methodologies, with chemical reduction being the most common "bottom-up" approach where metal ions are reduced to lower-valent-state atoms in solution, followed by clustering to form MNCs [75]. Common reducing agents include Sodium Borohydride (NaBH₄), ascorbic acid, and glutathione (GSH) [75]. Alternative synthesis strategies include ligand exchange, chemical etching, and microwave-assisted techniques, each offering distinct advantages in yield, scalability, and reproducibility [75].
Gold nanoclusters (AuNCs), silver nanoclusters (AgNCs), and copper nanoclusters (CuNCs) have attracted significant attention in biosensor development due to their broad applicability and relatively straightforward synthesis protocols [74]. These materials enable precise detection at remarkably low detection limits, making them suitable for demanding analytical applications where sensitivity is paramount [75] [74].
Hybrid Nanoengineered Interfaces
Hybrid nanoengineered interfaces represent the cutting edge of biosensing platforms, combining multiple nanomaterials with biological recognition elements to create systems with enhanced performance characteristics. These interfaces leverage the synergistic effects between different nanomaterials to achieve properties unattainable with single-component systems [72]. For instance, quaternary nanocomposites such as Ag-S-Zn-O NCs synthesized via environmentally-friendly processes demonstrate exceptional capabilities for biosensing applications, offering enhanced mechanical and electrical properties along with overall robustness [72].
The development of nanobioengineered interfaces involves the stable and functional anchoring of biological molecules onto nanointerfaces through cross-linking or physical entrapment, leveraging the high surface area and tunable surface chemistry of the nanomaterials [72]. These interactions between biological molecules and nanointerfaces enhance selectivity toward target analytes while improving signal transduction, ultimately increasing sensitivity and response time while maintaining the biological activity of immobilized biomolecules [72].
Table 2: Key Nanomaterial Categories and Their Biosensing Applications
| Nanomaterial Category | Key Representatives | Unique Properties | Primary Biosensing Applications |
|---|---|---|---|
| Carbon-Based | SWCNTs, MWCNTs, graphene, rGO | High conductivity, large surface area, functionalization capability | Electrochemical sensing, enzyme-based biosensors, DNA detection |
| Metal Nanoclusters | AuNCs, AgNCs, CuNCs | Strong photoluminescence, tunable emission, catalytic activity | Fluorescence sensing, optical detection, pathogen identification |
| Metal Nanoparticles | Gold, silver nanoparticles | Localized surface plasmon resonance, conductivity enhancement | Colorimetric assays, electrochemical signal amplification |
| Hybrid Nanocomposites | Ag-S-Zn-O NCs, other quaternary systems | Synergistic properties, enhanced stability, multi-functionality | High-sensitivity detection, specialized sensing applications |
Experimental Protocols for Biosensor Development
Synthesis of Metal Nanoclusters
The chemical reduction method represents the most common approach for synthesizing metal nanoclusters. For DNA-stabilized AgNCs, the protocol involves mixing DNA, AgNO₃, and NaBH₄ at an optimal molar ratio of 1:18:18 [75]. The reaction proceeds for 6 hours in a dark environment to prevent photo-decomposition, resulting in stable, fluorescent AgNCs suitable for biosensing applications [75].
For AuNCs synthesis using glutathione as both reducing agent and stabilizer, the protocol involves adding L-GSH to an HAuCl₄ solution to reduce Au(III) to Au(I) [75]. Subsequently, NaBH₄ is added to further reduce Au(I) to Au(0), followed by methanol addition to precipitate AuNCs, which are collected via centrifugation and supernatant removal [75]. This process yields AuNCs with excellent photothermal activity within 2 hours without requiring low-temperature conditions or agitation [75].
CuNCs synthesis frequently employs ascorbic acid as a reducing agent. One documented protocol involves preparing water-soluble fluorescent CuNCs templated by nucleosides, where Cu(II) in copper nitrate is reduced to copper atoms by ascorbic acid, followed by agglomeration to form CuNCs at 80°C [75]. Nucleotides comprise the CuNCs to improve stability, with optimal fluorescence achieved using a DNA/Cu²⁺/ascorbate ratio of 1:1000:400 under neutral conditions [75].
Fabrication of Nanoengineered Interfaces
The development of nanobioengineered interfaces requires precise fabrication protocols to ensure optimal performance. For urease-based biosensors, the fabrication process involves synthesizing a novel Ag-complex [(PPh₃)₂Ag(SCOf)]-based quaternary Ag-S-Zn-O nanocomposites through an environmentally-friendly process [72]. These nanocomposites, with average crystallite and particle sizes of 36.08 and 40.22 nm respectively, are deposited onto ITO electrodes using electrophoretic deposition (EPD) [72].
The biofunctionalization process involves immobilizing the urease enzyme onto the Ag-S-Zn-O NCs/ITO surface through cross-linking or physical entrapment, creating a Ur/Ag-S-Zn-O NCs/ITO nanobioengineered electrode for electrochemical urea detection [72]. Interfacial kinetic studies of these systems reveal quasi-reversible processes with high electron transfer rates and linear current responses, indicating efficient reaction dynamics suitable for sensitive biosensing applications [72].
Electrode Modification and Bioreceptor Immobilization
Critical to biosensor performance is the effective immobilization of biorecognition elements onto nanomaterial-modified electrodes. Common immobilization strategies include adsorption/physisorption, covalent binding, membrane entrapment, and incorporation in gels/hydrogels or polymers [71]. For carbon nanotube-based systems, SWCNTs can be incorporated into gold electrodes with surface modification by self-assembled monolayers made of thiol derivatives [70]. Single-stranded DNA probes are then anchored to the SWCNTs support via covalent bonding between -COOH groups in the nanotubes and -NH₂ groups at the 5' end of the ssDNA [70].
For electrochemical biosensors, the immobilization procedure must preserve biological activity while ensuring stability and specificity. Oxygen-functionalized multi-walled carbon nanotubes (f-MWCNT) provide stable immobilization platforms through covalent bonding between oxygen functional groups of f-MWCNT and -NH₂ groups of antibodies or other biorecognition elements [70]. These functionalization strategies are crucial for maintaining orientation and biological activity of biomolecules upon immobilization, directly impacting biosensor performance [70].
Performance Comparison: Electrochemical vs. Optical Biosensors
Analytical Performance Metrics
The analytical performance of biosensors is evaluated through several key parameters including sensitivity, detection limit, linear range, selectivity, reproducibility, and stability. Electrochemical biosensors incorporating nanomaterials consistently demonstrate exceptional performance across these metrics. For instance, a urease/Ag-S-Zn-O NCs/ITO biosensor exhibited high sensitivity (12.56 μA mM⁻¹ cm⁻²) and a low detection limit (0.54 mM) for urea detection, along with high selectivity, reproducibility, and stability for up to 60 days [72].
Optical biosensors leveraging metal nanoclusters similarly achieve impressive detection capabilities. MNC-based biosensors provide high sensitivity, specificity, portability, and cost-efficiency, with the integration of nanotechnology enabling real-time and point-of-care diagnostics [74]. The unique photophysical properties of MNCs, including strong photoluminescence and high photostability, contribute to these performance advantages, particularly for fluorescence-based detection platforms [75] [74].
Detection limits for nanomaterial-enhanced biosensors vary significantly based on the specific platform and application. Environmental monitoring typically requires detection capabilities in the parts-per-million range, while medical diagnostics often necessitate sensitivities from nanograms to femtograms per milliliter [68]. Both electrochemical and optical biosensors incorporating nanomaterials routinely meet or exceed these demanding requirements through various signal amplification strategies enabled by nanomaterial properties.
Comparative Advantages and Limitations
Electrochemical biosensors offer distinct advantages including high sensitivity, portability, cost-effectiveness, and compatibility with miniaturized systems [71] [70]. These platforms are particularly well-suited for point-of-care testing and field-deployable sensing solutions. However, they can face challenges related to matrix effects from complex samples and may require careful electrode preparation and surface renewal procedures [70].
Optical biosensors provide benefits such as visual detection capability, resistance to electromagnetic interference, potential for multiplexing, and high spatial resolution [73] [74]. These systems excel in applications requiring high-throughput screening or spatial information. Limitations can include potential photobleaching of fluorescent labels, light scattering in certain samples, and generally more complex instrumentation compared to electrochemical platforms [74].
Both biosensing approaches benefit significantly from nanomaterial integration, which addresses many inherent limitations while enhancing inherent advantages. Nanomaterials improve sensitivity and detection limits for both platforms while also enabling miniaturization, multiplexing capabilities, and enhanced stability through optimized biomolecule immobilization [68] [69] [73].
Table 3: Performance Comparison of Electrochemical vs. Optical Biosensors
| Performance Parameter | Electrochemical Biosensors | Optical Biosensors |
|---|---|---|
| Sensitivity | Very high (e.g., 12.56 μA mM⁻¹ cm⁻² for urea sensor) [72] | High (enhanced by MNC fluorescence) [74] |
| Detection Limit | Low (e.g., 0.54 mM for urea; nanogram to femtogram range for medical targets) [68] [72] | Ultra-low (single molecule detection possible) [75] [74] |
| Selectivity | High (dependent on bioreceptor and minimized fouling) [70] | High (dependent on bioreceptor specificity) [74] |
| Response Time | Rapid (seconds to minutes) [71] | Very rapid (real-time monitoring possible) [73] |
| Multiplexing Capability | Moderate (array designs required) | High (multiple optical signatures) [73] |
| Portability | Excellent (compatible with handheld devices) [71] | Good (miniaturization possible) [73] |
Application to Ethanol Detection Research
Ethanol Detection Mechanisms
The detection of ethanol employs specific biorecognition elements integrated with nanomaterial-enhanced transduction platforms. Enzymatic recognition using alcohol dehydrogenase or oxidase enzymes represents the most common approach, where the enzymatic reaction generates measurable products proportional to ethanol concentration [68]. Optical detection of ethanol can leverage fluorescence changes in metal nanoclusters upon interaction with ethanol or enzymatic reaction products, utilizing the quenching or enhancement of MNC fluorescence for quantification [74].
Non-enzymatic approaches employing direct electrochemical oxidation of ethanol on nanocatalyst-modified electrodes offer alternative detection strategies, particularly using metal or metal oxide nanoparticles with enhanced electrocatalytic properties [68]. These systems benefit from the inherent catalytic activity of nanomaterials, potentially offering improved stability compared to enzyme-based systems while maintaining high sensitivity.
Performance Expectations for Ethanol Detection
Nanomaterial-enhanced biosensors for ethanol detection are expected to demonstrate performance metrics surpassing conventional analytical methods. Based on similar applications, electrochemical ethanol biosensors incorporating nanomaterials should achieve detection limits in the micromolar range with linear responses across physiologically relevant concentrations (0.1-10 mM) [68] [70]. Sensitivity enhancements of 2-5 times compared to non-nanomaterial systems are achievable through increased surface area and improved electron transfer kinetics [70].
Optical platforms utilizing metal nanoclusters for ethanol detection can leverage fluorescence intensity changes or wavelength shifts upon ethanol exposure, potentially achieving detection limits in the nanomolar range for direct detection or through competitive binding assays [74]. The strong photostability of MNCs compared to traditional organic dyes enables prolonged monitoring capabilities essential for continuous ethanol sensing applications [75] [74].
Research Considerations for Ethanol Sensing
Researchers developing ethanol biosensors must consider several application-specific factors. Selectivity against interfering substances such as methanol, glucose, and ascorbic acid is crucial, achievable through optimized biorecognition elements and nanomaterial interfaces [70]. Sample matrix effects from complex biological or industrial samples necessitate appropriate blocking strategies and interface engineering to minimize non-specific binding [70].
Operational stability under varying pH and temperature conditions represents another critical consideration, addressed through robust immobilization strategies and stable nanomaterial-biomolecule interfaces [72]. For continuous monitoring applications, the reversibility and regeneration capabilities of the biosensing interface must be engineered, with electrochemical platforms generally offering superior performance in this regard compared to optical systems [71] [73].
Research Reagent Solutions Toolkit
Table 4: Essential Research Reagents for Nanomaterial-Enhanced Biosensor Development
| Reagent Category | Specific Examples | Function in Biosensor Development |
|---|---|---|
| Nanomaterials | SWCNTs, MWCNTs, graphene oxide, AuNCs, AgNCs, CuNCs | Signal enhancement, surface area expansion, bioreceptor immobilization |
| Biorecognition Elements | Alcohol dehydrogenase, alcohol oxidase, antibodies, DNA aptamers | Target-specific recognition and binding |
| Chemical Linkers | EDC, NHS, glutaraldehyde, maleimide, hydrazide | Covalent immobilization of bioreceptors to nanomaterials |
| Electrode Materials | Gold electrodes, glassy carbon, screen-printed electrodes, ITO | Signal transduction platform, nanomaterial support |
| Reducing Agents | NaBH₄, ascorbic acid, glutathione, citrate | Synthesis and stabilization of metal nanoclusters |
| Stabilizers | Thiol compounds, polymers, dendrimers, proteins | Preventing nanomaterial aggregation, maintaining bioactivity |
| Signal Probes | Ferrocene derivatives, methylene blue, enzymatic labels | Generating measurable electrochemical or optical signals |
The integration of nanomaterials, metal nanoclusters, and nanoengineered interfaces has substantially advanced biosensing capabilities for applications including ethanol detection. Both electrochemical and optical platforms benefit significantly from nanomaterial incorporation, though each approach offers distinct advantages suited to different research and application requirements. Electrochemical biosensors excel in portability, cost-effectiveness, and sensitivity, while optical platforms offer superior capabilities for multiplexing and visual detection.
Future developments in this field will likely focus on enhancing multiplex detection capabilities, improving stability in complex sample matrices, and advancing point-of-care compatibility through further miniaturization [74]. The convergence of biosensing technology with wireless communication and artificial intelligence presents promising directions for next-generation sensing platforms [68]. Additionally, green synthesis methods for nanomaterials and standardized fabrication protocols will be crucial for translating laboratory research into commercially viable biosensing devices capable of addressing real-world analytical challenges across various sectors [72].
Diagram 1: Working Principles of Nanomaterial-Enhanced Biosensors
Diagram 2: Ethanol Detection Workflow Using Nanomaterial-Enhanced Biosensors
Functionalization and Surface Chemistry for Improved Biorecognition
The performance of any biosensor is fundamentally governed by the interactions that occur at the interface between the physical transducer and the biological sample. Surface functionalization—the process of modifying a sensor surface with specific chemical groups or biorecognition elements—is therefore a critical determinant of biosensor efficacy. This process enables the stable, specific, and oriented immobilization of bioreceptors, which directly influences key performance parameters including sensitivity, selectivity, reproducibility, and operational longevity [76] [77]. Within the specific context of detecting small molecules like ethanol, choosing between electrochemical and optical transduction platforms introduces distinct requirements and challenges for surface chemistry. This guide provides a comparative analysis of these platforms, focusing on how functionalization strategies are tailored to optimize biorecognition for ethanol detection, supported by experimental data and detailed methodologies for researchers and scientists in drug development.
Core Principles of Biorecognition and Surface Functionalization
Key Biorecognition Elements for Ethanol Sensing
The biorecognition element is the primary source of a biosensor's analyte specificity. The selection of this element imposes specific demands on the surface functionalization strategy.
- Enzymes: Enzymatic biosensors for ethanol are typically biocatalytic. Enzymes like alcohol oxidase (AOX) or alcohol dehydrogenase (ADH) capture and convert ethanol into a measurable product (e.g., hydrogen peroxide or NADH) [77] [4]. The surface chemistry must preserve the enzyme's native conformation and active site accessibility.
- Antibodies: These affinity-based bioreceptors form a stable immunocomplex with ethanol or its metabolites, such as ethyl glucuronide (EtG) [4]. Functionalization must facilitate oriented immobilization to maximize antigen-binding site availability.
- Aptamers: These synthetic oligonucleotides, selected via the SELEX process, bind to targets like ethanol with high affinity [77]. Their small size and synthetic nature allow for dense surface packing and functionalization via well-established thiol- or amino-group chemistry.
- Molecularly Imprinted Polymers (MIPs): MIPs are synthetic polymers containing tailor-made cavities that mimic natural recognition sites for ethanol [76] [4]. The functionalization involves polymerizing functional monomers around a template molecule (ethanol or a analogue), creating a highly stable and customizable synthetic receptor.
Fundamental Surface Functionalization Techniques
The following techniques form the foundation for immobilizing the aforementioned biorecognition elements.
- Covalent Immobilization: This strong, irreversible binding is achieved using linker molecules that react with functional groups on both the transducer surface and the bioreceptor. Common strategies include silanization (e.g., using APTES) on metal oxides, and the formation of self-assembled monolayers (SAMs) of alkanethiols on gold surfaces [76]. Covalent bonds enhance stability but require careful control to prevent denaturation or random orientation.
- Non-Covalent Immobilization: This includes adsorption via hydrophobic or electrostatic interactions, and affinity-based binding (e.g., using biotin-streptavidin). While simpler, these methods can lead to less stable surfaces prone to bioreceptor leaching [76].
- Nanomaterial-Enhanced Functionalization: Nanomaterials like graphene, carbon nanotubes, gold nanoparticles, and metal-organic frameworks (MOFs) are increasingly used to augment sensor surfaces. Their high surface-to-volume ratio allows for a higher density of bioreceptor immobilization, while their unique electronic and optical properties can enhance signal transduction [76] [78]. For example, a recent study used Mn-doped ZIF-67 (a MOF) to create a high-surface-area electrode, which was then functionalized with antibodies for highly sensitive pathogen detection [78].
Comparative Analysis: Electrochemical vs. Optical Ethanol Biosensors
The choice of transducer—electrochemical or optical—dictates the design of the functionalized interface. The table below compares these two platforms for ethanol detection.
Table 1: Comparison of Electrochemical and Optical Biosensors for Ethanol Detection
| Feature | Electrochemical Biosensors | Optical Biosensors (Evanescent Wave) |
|---|---|---|
| Transduction Principle | Measures electrical changes (current, potential, impedance) from redox reactions [5] [4]. | Measures changes in light properties (refractive index, absorption) upon binding near the sensor surface [79]. |
| Typical Bioreceptors | Enzymes (ADH, AOX), MIPs [4]. | Antibodies, aptamers, MIPs [79]. |
| Common Functionalization | SAMs on Au electrodes; polymer hydrogels; nanomaterial composites (graphene, MOFs) [78] [4] [80]. | SAMs on gold films (for SPR); silanization on silica waveguides/fibers [79]. |
| Key Advantage | High sensitivity, portability, cost-effectiveness, and compatibility with miniaturized, wearable formats [5] [4]. | Label-free, real-time kinetic analysis of binding events; high specificity and multiplexing potential [79]. |
| Key Limitation | Signal can be susceptible to fouling and interference from electroactive species in complex samples [4]. | Often requires sophisticated, bulky instrumentation; can be sensitive to non-specific binding and temperature fluctuations [5] [79]. |
| Reported Performance for Ethanol/Related Analytes | Wearable sweat sensors detect ethanol via direct oxidation or via metabolites (EtG); high correlation with blood levels reported [4]. | SPR-based sensors can detect small molecules and biomarkers; sensitivity highly dependent on functionalization and surface plasmon field strength [79]. |
Experimental Protocols for Surface Functionalization and Testing
To illustrate the practical application of these concepts, here are detailed protocols for two common functionalization approaches relevant to ethanol sensing.
Protocol 1: Covalent Enzyme Immobilization on a Gold Electrode
This protocol is typical for creating an electrochemical ethanol biosensor using an enzyme like Alcohol Oxidase.
- Electrode Pretreatment: Clean the gold working electrode mechanically (with alumina slurry) and electrochemically (via cyclic voltammetry in sulfuric acid) to ensure a pristine surface [78].
- SAM Formation: Immerse the electrode in a 1-10 mM ethanolic solution of an alkanethiol (e.g., 11-mercaptoundecanoic acid) for 12-24 hours. This forms a densely packed, ordered monolayer on the gold surface, presenting terminal carboxylic acid groups [76].
- BioLinker Activation: Rinse the electrode and activate the carboxyl groups by immersing it in a solution containing EDC (1-ethyl-3-(3-dimethylaminopropyl)carbodiimide) and NHS (N-hydroxysuccinimide) for 30-60 minutes. This forms an amine-reactive NHS ester [80].
- Enzyme Immobilization: Incubate the activated electrode with a solution of the enzyme (e.g., AOX) in a suitable buffer (e.g., phosphate buffer, pH 7.4) for 2-4 hours. The primary amines (lysine residues) on the enzyme covalently couple to the activated surface.
- Quenching and Storage: Rinse the functionalized electrode thoroughly to remove unbound enzyme. Quench any remaining active esters by immersing in a 1M ethanolamine solution. Store the biosensor in buffer at 4°C until use [81].
Protocol 2: Antibody Immobilization on a SPR Chip
This protocol details the functionalization of a gold-coated SPR chip for optical detection, which could be adapted for ethanol metabolites.
- Surface Cleaning: Clean the gold chip surface with oxygen plasma or piranha solution to remove organic contaminants, followed by extensive rinsing and drying.
- SAM Formation: Similarly to Protocol 1, form a SAM using a carboxyl-terminated alkanethiol.
- BioLinker Activation: Activate the carboxylated surface using an EDC/NHS solution as described above [79].
- Antibody Immobilization: Inject a solution of the specific antibody (e.g., anti-EtG monoclonal antibody) over the activated chip surface using a microfluidic flow system. Monitor the increase in SPR signal in real-time as the antibodies covalently attach.
- Surface Blocking: Inject a solution of an inert protein (e.g., Bovine Serum Albumin - BSA) or ethanolamine to block any remaining reactive sites and minimize non-specific binding in subsequent assays [79].
Data Interpretation and Performance Analysis
The success of functionalization is validated through both quantitative sensor performance and characterization of the modified surface.
Table 2: Key Analytical Performance Metrics from Representative Studies
| Sensor Type / Bioreceptor | Target Analyte | Linear Range | Limit of Detection (LOD) | Reference & Context |
|---|---|---|---|---|
| Electrochemical / MIP | Ethanol (in sweat) | 0.1 - 5 mM (estimated) | Low µM range | [4] (Wearable alcohol monitoring) |
| Electrochemical / Anti-E. coli Ab on Mn-ZIF-67 | E. coli bacteria | 10 to 1010 CFU mL–1 | 1 CFU mL–1 | [78] (Demonstrates nanomaterial enhancement) |
| Optical (SERS) / Aptamer | Salmonella bacteria | Not specified | 16.73 ng/mL (for AFP antigen) | [82] [80] (Demonstrates aptamer-based optical sensing) |
| Electrochemical / COOH-functionalized 3D Graphene | Tau-441 protein | 1 fM – 1 nM | 0.14 fM | [80] (Demonstrates high-sensitivity platform) |
Characterization Techniques:
- FTIR (Fourier-Transform Infrared) Spectroscopy: Used to confirm the presence of specific functional groups (e.g., amide bonds) after bioreceptor immobilization [78].
- XPS (X-ray Photoelectron Spectroscopy): Provides elemental composition of the top few nanometers of the functionalized surface.
- Electrochemical Impedance Spectroscopy (EIS): A highly sensitive method to monitor the step-by-step modification of an electrode surface by tracking changes in charge transfer resistance [78] [80].
Visualizing Biosensor Functionalization and Signaling Pathways
The following diagram illustrates the core components and signal transduction pathways of the two biosensor types compared in this guide.
Figure 1: Comparative schematic of electrochemical and optical biosensor operation, highlighting the central role of surface functionalization in enabling specific biorecognition and signal transduction.
The Scientist's Toolkit: Essential Reagents for Functionalization
Table 3: Key Reagent Solutions for Biosensor Surface Functionalization
| Reagent / Material | Function / Application | Key Characteristics |
|---|---|---|
| Alkanethiols (e.g., 11-Mercaptoundecanoic acid) | Forms Self-Assembled Monolayers (SAMs) on gold surfaces. Provides a stable, ordered layer with terminal functional groups for subsequent bioconjugation [76]. | High purity is critical for dense packing. Carboxyl, amino, or hydroxyl-terminated varieties available. |
| (3-Aminopropyl)triethoxysilane (APTES) | Silanizing agent for introducing amine groups onto silica, glass, or metal oxide surfaces [76]. | Enables covalent attachment to oxide surfaces. Reaction conditions must be controlled to prevent polymerization. |
| EDC and NHS | Carbodiimide crosslinkers. Activate carboxyl groups to form amine-reactive esters for coupling biomolecules (proteins, aptamers) to surfaces [82] [80]. | EDC is unstable in aqueous solution; fresh preparation is essential. NHS stabilizes the intermediate. |
| Bovine Serum Albumin (BSA) | A blocking agent used to passivate unreacted sites on the sensor surface after functionalization, reducing non-specific adsorption [79]. | Inexpensive and effective. Critical for improving signal-to-noise ratio in complex samples. |
| Polyethylene Glycol (PEG) | Used as a spacer arm or anti-fouling coating. Reduces non-specific binding and can improve bioreceptor accessibility and activity [76]. | Creates a hydrophilic, protein-repellent layer. Thiol- or amino-PEG derivatives are common. |
| Metal-Organic Frameworks (ZIF-67) | Nanomaterial used to modify electrode surfaces, providing extremely high surface area for increased bioreceptor loading and enhanced electrochemical signal [78]. | Tunable porosity and chemistry. Can be doped with other metals (e.g., Mn) to enhance catalytic properties. |
The journey from a bare transducer to a high-performance biosensor is paved with deliberate and optimized surface chemistry. For ethanol detection, the choice between electrochemical and optical platforms is not a matter of superiority, but of appropriate application. Electrochemical sensors, benefiting from robust functionalization with enzymes or MIPs, excel in portable, wearable, and point-of-care scenarios where cost and miniaturization are paramount. Optical evanescent wave sensors, with their label-free, real-time capabilities, are powerful tools for detailed binding kinetics and multiplexed analysis in laboratory settings, though they demand more complex functionalization and instrumentation. Ultimately, the convergence of novel nanomaterials, sophisticated functionalization protocols, and a deep understanding of interfacial science continues to push the boundaries of what biosensors can achieve, promising more sensitive, reliable, and accessible tools for research and clinical practice.
Strategies for Improving Limit of Detection (LOD) and Sensitivity
The limit of detection (LOD) and sensitivity are fundamental performance parameters in biosensor development, directly determining a sensor's capability to identify minimal analyte concentrations. For ethanol detection—relevant to medical diagnostics, food safety, and law enforcement—achieving lower LOD and higher sensitivity enables earlier disease detection, more accurate monitoring, and enhanced safety controls [22]. The ongoing advancement of biosensing technologies has generated substantial innovation in how these parameters can be improved, spanning materials science, engineering, and data analysis techniques.
This guide objectively compares the performance of electrochemical and optical biosensors, with a specific focus on ethanol detection, by synthesizing current research and experimental data. We present directly comparable quantitative data, detailed experimental protocols, and analytical frameworks to assist researchers in selecting and optimizing appropriate biosensing platforms.
Comparative Performance of Biosensor Technologies
The strategies for enhancing LOD and sensitivity can be categorized into material-based, engineering-based, and data analysis-based approaches. The table below summarizes the performance outcomes of different strategies as demonstrated in recent studies.
Table 1: Performance Comparison of LOD Improvement Strategies
| Strategy Category | Specific Approach | Biosensor Type | Target Analyte | Reported LOD | Linear Range | Key Improvement Factor |
|---|---|---|---|---|---|---|
| Material-Based | Silica Nanochannel (SNC) modification on TiO₂ | Photoelectrochemical (PEC) | Ethanol | 1.2 μM [22] | 1.775 μM - 20 mM [22] | Enhanced light absorption, charge separation, and anti-fouling [22] |
| Material-Based | Au-Ag Nanostars platform | Optical (SERS) | α-Fetoprotein (AFP) | 16.73 ng/mL [82] | 0 - 500 ng/mL [82] | Intense plasmonic enhancement from sharp-tipped morphology [82] |
| Engineering-Based | Ligand-related Exporters (NisFEG) | Cell-based (Nisin A) | Nisin A | Not Specified | 100-fold expansion [83] | Regulation of intracellular ligand concentration to avoid saturation [83] |
| Data Analysis-Based | Uncertainty Profile Validation | HPLC (Sotalol) | Sotalol in Plasma | Realistic Assessment [84] | N/A | Use of tolerance intervals for precise uncertainty estimation [84] |
Detailed Experimental Protocols
Protocol 1: Nanochannel-Enhanced Photoelectrochemical Sensor
This protocol details the construction of a silica nanochannel-modified TiO₂ (SNC-TiO₂) PEC sensor for direct ethanol detection in complex samples, achieving a LOD of 1.2 μM [22].
- Key Reagents and Materials: Indium tin oxide (ITO) glass, TiO₂ nano-powder (anatase), Tetraethoxysilane (TEOS), Cetyltrimethylammonium bromide (CTAB), Ethanol standard, Phosphate buffer saline (PBS, pH 7.4) [22].
- Sensor Fabrication:
- TiO₂ Electrode Preparation: Disperse TiO₂ nanopowder in a suitable solvent (e.g., ethanol) to form a homogeneous suspension. Deposit the suspension onto a cleaned ITO glass substrate and anneal to form a stable TiO₂ film.
- SNC Modification: Synthesize the silica nanochannel film on the TiO₂/ITO electrode via a sol-gel process using TEOS as the silica source and CTAB as a structure-directing agent. Remove the CTAB template by extraction or calcination to reveal the vertical, ultrasmall nanochannels.
- PEC Measurement and Ethanol Detection:
- Use the SNC-TiO₂ as the working electrode in a standard three-electrode PEC cell (with Pt counter and Ag/AgCl reference electrodes).
- Illuminate the electrode with a LED light source and measure the photocurrent using a potentiostat.
- For direct detection, immerse the sensor into untreated whole blood or other biological samples spiked with ethanol.
- The photocurrent response is proportional to the ethanol concentration. The LOD is calculated based on the standard deviation of the blank signal (σ) and the slope of the calibration curve (S), using the formula LOD = 3.3σ/S [85] [22].
Protocol 2: Exporter-Assisted Detection Range Shifting
This method uses ligand-related exporters in cell-based biosensors to shift the dynamic range toward higher concentrations, overcoming saturation and toxicity [83].
- Key Reagents and Materials: Bacterial strains (e.g., E. coli MG1655), Plasmid vectors for biosensor and exporter expression, Target ligand (e.g., Nisin A), Growth media (e.g., LB), Fluorescence reporter assay reagents [83].
- Experimental Workflow:
- Strain Engineering: Genetically engineer host cells to harbor two key components: a) a biosensor circuit where the target ligand activates a promoter driving a reporter gene (e.g., GFP), and b) a plasmid for constitutive or inducible expression of a specific (e.g., NisFEG) or nonspecific (e.g., AcrAB-TolC) exporter protein.
- Cultivation and Induction: Grow the engineered cells in culture and expose them to a gradient of the target ligand concentration.
- Output Measurement: Quantify the biosensor output (e.g., fluorescence intensity) and cell viability over the ligand concentration range.
- Data Analysis: Compare the dose-response curves (signal vs. ligand concentration) of strains with and without the exporter. The successful implementation shifts the saturation curve to the right, expanding the usable detection range [83].
Analytical and Validation Strategies
Beyond physical sensor modifications, the method for calculating and validating LOD itself is crucial. The classical statistical approach and the graphical uncertainty profile method can yield different, sometimes more realistic, results [84] [86].
Table 2: Methods for Calculating and Validating LOD and LOQ
| Method | Principle | Calculation (for LOD) | Advantages | Limitations |
|---|---|---|---|---|
| Calibration Curve (ICH Q2(R1)) | Based on standard deviation of response and slope of calibration curve [85]. | LOD = 3.3σ / S Where σ is std dev of response, S is calibration slope [85]. | Simple, widely accepted in regulatory guidelines [85]. | Can provide underestimated values; highly dependent on calibration quality [84]. |
| Uncertainty Profile | A graphical tool based on tolerance intervals and measurement uncertainty [84]. | The LOQ is the concentration where the uncertainty interval intersects the acceptability limit (λ) [84]. | Provides a realistic and relevant assessment; includes uncertainty estimation [84] [86]. | More complex to implement than classical methods [84]. |
The Scientist's Toolkit: Essential Research Reagents
This table lists key reagents and materials used in the featured experiments for improving biosensor LOD and sensitivity.
Table 3: Research Reagent Solutions for Biosensor Development
| Reagent/Material | Function in Experiment | Research Context |
|---|---|---|
| TiO₂ (Anatase) Nanopowder | Photo-active nanomaterial; generates electron-hole pairs under illumination to produce photocurrent [22]. | Core material in PEC ethanol sensor [22]. |
| Tetraethoxysilane (TEOS) | Precursor for constructing vertical silica nanochannels (SNC) via sol-gel process [22]. | Creates an anti-fouling, anti-interference layer on PEC sensor [22]. |
| Au-Ag Nanostars | Plasmonic nanoparticles; sharp tips create intense electromagnetic fields for signal enhancement [82]. | SERS substrate for biomarker detection [82]. |
| NisFEG Exporter | Specific bacterial exporter protein that actively transports nisin A out of the cell [83]. | Used to shift detection range of nisin A biosensor to higher concentrations [83]. |
| AcrAB-TolC Exporter | Non-specific bacterial efflux pump; regulated by MarA transcriptional activator [83]. | Used to shift detection range of quorum-sensing biosensors [83]. |
Signaling Pathways and Workflow Diagrams
The diagrams illustrate two modern strategies for enhancing biosensor performance. Pathway A shows the mechanism of a nanochannel-enhanced photoelectrochemical (PEC) sensor. Light excites the SNC-TiO₂ electrode, generating electron-hole pairs, while ethanol in the sample is oxidized. Concurrently, the silica nanochannels provide anti-fouling by excluding large biomacromolecules from complex samples like blood. This dual function of enhanced charge generation and exclusion of interferents leads to a significantly enhanced and more reliable signal [22].
Pathway B depicts the use of ligand-related exporters in cell-based biosensors to shift the detection range. When a high concentration of the target ligand is present in the environment, specific or non-specific exporter proteins actively regulate its intracellular concentration. By maintaining the intracellular ligand level within an optimal, non-saturating range, the biosensor circuit (e.g., a transcription factor and promoter driving a reporter gene) can produce a linear response over a much wider concentration range, effectively preventing signal saturation and mitigating toxicity at high concentrations [83].
Head-to-Head Comparison: Validating Performance and Selecting the Right Tool
In biosensor research, analytical sensitivity and the limit of detection (LOD) are fundamental performance metrics, yet they are frequently and incorrectly used interchangeably [87]. Analytical sensitivity is formally defined as the slope of the analytical calibration curve (y = f(x)), indicating how strongly the output signal responds to changes in analyte concentration [87]. In contrast, the LOD is the lowest concentration of an analyte that can be reliably distinguished from a blank sample, with a specified degree of certainty [87]. This guide provides a direct performance comparison of these metrics for electrochemical and optical biosensors, contextualized within ethanol detection research. We summarize quantitative performance data, detail standardized experimental protocols, and visualize key workflows to provide researchers with a clear, objective framework for evaluating these critical biosensor classes.
Performance Data Comparison
The following tables compile key performance metrics and characteristics for electrochemical and optical biosensors, with a focus on ethanol detection where data is available.
Table 1: Quantitative Performance Metrics for Ethanol Biosensors
| Biosensor Type | Detection Principle | Linear Range | Limit of Detection (LOD) | Sensitivity | Reference |
|---|---|---|---|---|---|
| Electrochemical | Amperometric detection of NADH via AuNPs-ERGO-PAH/SPE | 0.05 - 5 mM | 10 µM | 44.6 ± 0.07 µA/mM·cm² | [39] |
| Optical (PEC) | Photoelectrochemical (PEC) on SNC-TiO₂ platform | 1.775 µM - 20 mM | 1.2 µM | Not Specified | [22] |
Table 2: General Characteristics of Electrochemical and Optical Biosensors
| Feature | Electrochemical Biosensors | Optical Biosensors |
|---|---|---|
| Key Advantages | High sensitivity, selectivity; fast response; portable, low-cost equipment [88] [33] | High sensitivity; real-time, label-free detection capabilities [34] [89] |
| Common Transduction | Amperometric, Voltammetric, Potentiometric, Impedimetric [33] | Surface Plasmon Resonance (SPR), Localized SPR, Photoelectrochemical (PEC) [34] [22] |
| Typical Bioreceptors | Enzymes (e.g., ADH), Antibodies, DNA, Aptamers [33] | Enzymes, Antibodies, Nucleic Acids, Whole Cells [34] |
Experimental Protocols for Key Methodologies
Electrochemical Biosensor for Ethanol (ADH-based)
This protocol is adapted from the work on a gold nanoparticle-electrochemically reduced graphene oxide nanocomposite (AuNPs-ERGO-PAH) biosensor [39].
- Sensor Fabrication: The process begins with preparing a ternary composite. Gold nanoparticles (AuNPs) and Graphene Oxide (GO) are sonicated together, centrifuged, and the resulting AuNPs-GO composite is further sonicated with poly(allylamine hydrochloride) (PAH). A volume of 5 µL of this AuNPs-GO-PAH composite is drop-cast onto the working electrode of a screen-printed electrode (SPE) and dried at room temperature for 24 hours. The GO in the composite is then electrochemically reduced to ERGO by performing cyclic voltammetry (e.g., 10 cycles between -1000 mV and +500 mV) in a 0.1 M KCl solution [39].
- Enzyme Immobilization: Alcohol dehydrogenase (ADH) is immobilized onto the modified electrode surface using a sol-gel matrix. The sol-gel is typically prepared from precursors like tetramethoxysilane (TMOS) and methyltrimethoxysilane (MTMOS), hydrolyzed with HCl, and mixed with polyethylene glycol (PEG 600). This sol-gel is then mixed with an ADH solution (e.g., 20 IU), and a fixed volume (e.g., 5 µL containing 5 IU of ADH) is deposited on the sensor surface and allowed to dry at 4°C for 24 hours [39].
- Measurement & Detection: The biosensor is operated in a standard three-electrode electrochemical cell with the modified SPE, an Ag/AgCl reference electrode, and a platinum counter electrode. Measurements are conducted in a buffer solution (e.g., 0.1 M phosphate buffer, pH 8.8) containing the coenzyme NAD⁺. Upon addition of an ethanol sample, ADH catalyzes the oxidation of ethanol, producing NADH. The anodic current resulting from the electrochemical oxidation of NADH at the transducer surface is measured amperometrically at a fixed potential (e.g., +0.4 V vs. Ag/AgCl). The current increase is proportional to the ethanol concentration [39].
Optical Biosensor for Ethanol (Photoelectrochemical)
This protocol is based on the direct PEC detection of ethanol using a silica nanochannel-modified TiO₂ (SNC-TiO₂) platform [22].
- Sensor Fabrication: A TiO₂ film is first fabricated on an Indium Tin Oxide (ITO) glass substrate. A silica nanochannel (SNC) film is then grown on the TiO₂ layer. This is achieved by using a precursor solution containing tetraethoxysilane (TEOS) and a structure-directing agent (e.g., cetyltrimethylammonium bromide, CTAB), which is spin-coated onto the TiO₂/ITO electrode. The film is subsequently subjected to a thermal treatment (e.g., 100°C for 24 hours) to complete the condensation and formation of the vertical, uniform nanochannels [22].
- Measurement & Detection: The PEC sensor is used in a two-electrode system (working and counter electrodes) immersed in the sample solution, which can be a buffer or a complex matrix like whole blood. The sensor is illuminated with a controlled light source (e.g., a 365 nm LED), and the photocurrent is measured under a constant applied potential. Ethanol acts as an efficient hole scavenger upon illumination. When it diffuses through the nanochannels and interacts with the TiO₂ surface, it consumes photo-generated holes, leading to an enhanced and stable photocurrent. The magnitude of this photocurrent is directly related to the ethanol concentration in the sample [22].
Visualizing Biosensor Comparison and Workflows
The following diagram illustrates the core operational principles and comparative analysis of the two biosensor types for ethanol detection.
The Scientist's Toolkit: Essential Research Reagents and Materials
Table 3: Key Reagents and Materials for Biosensor Construction
| Item | Function/Brief Explanation | Example Application |
|---|---|---|
| Alcohol Dehydrogenase (ADH) | Biorecognition element; enzyme that specifically catalyzes the oxidation of ethanol using NAD⁺ as a cofactor. | Core component in enzymatic electrochemical biosensors for ethanol [39]. |
| Nicotinamide Adenine Dinucleotide (NAD⁺) | Cofactor; essential electron acceptor in the ADH-catalyzed reaction, converting to its reduced form (NADH) for signal generation. | Required for the enzymatic reaction in dehydrogenase-based electrochemical biosensors [39]. |
| Gold Nanoparticles (AuNPs) | Nanomaterial transducer; enhances electrical conductivity, provides a high surface area for biomolecule immobilization, and can catalyze reactions. | Used to modify electrodes to improve sensitivity and facilitate electron transfer, e.g., in NADH oxidation [39] [33]. |
| Graphene Oxide (GO) / Reduced GO (rGO) | Nanomaterial transducer; excellent electrical conductivity and large surface area. ERGO is often used to improve electron transfer kinetics. | Component of nanocomposites to enhance the electrochemical detection of small molecules like NADH [39]. |
| Titanium Dioxide (TiO₂) | Photo-active nanomaterial; acts as a semiconductor, generating electron-hole pairs upon light illumination, which is crucial for PEC sensing. | Photoanode material in photoelectrochemical biosensors [22]. |
| Tetraethoxysilane (TEOS) | Precursor molecule; used in the sol-gel process to create a silica matrix for enzyme encapsulation or to grow silica nanochannels. | Used for enzyme immobilization in sol-gel films or for creating protective nanochannel films on sensors [39] [22]. |
| Screen-Printed Electrode (SPE) | Disposable electrochemical platform; integrates working, reference, and counter electrodes, enabling portable and low-cost sensing. | Base transducer for many commercial and research-focused electrochemical biosensors [39] [33]. |
| Indium Tin Oxide (ITO) Glass | Optically transparent and electrically conductive substrate; allows light to pass through while serving as an electrode. | Essential for constructing photoelectrochemical and other optically-based biosensors [22]. |
This guide provides a structured, data-driven comparison of analytical sensitivity and LOD for electrochemical and optical biosensors. The presented data, protocols, and workflows demonstrate that while both sensor classes are highly capable, their optimal application depends on the specific research requirements. Electrochemical sensors, exemplified by the ADH/AuNPs-ERGO-PAH system, offer a robust, enzyme-mediated approach with well-established sensitivity [39]. In contrast, optical platforms like the SNC-TiO₂ PEC sensor can achieve lower LODs and possess unique advantages for direct analysis in complex biological samples, largely due to innovative nanoengineering strategies that mitigate biofouling [22]. Researchers must base their selection on a clear understanding of the distinct definitions of sensitivity and LOD, alongside practical considerations such as the required detection limit, sample matrix complexity, and intended use.
Analysis of Selectivity and Specificity in Multianalyte Environments
The accurate detection of specific analytes within complex biological samples is a fundamental challenge in analytical science, particularly in fields like medical diagnostics, food safety, and environmental monitoring. Selectivity and specificity are two pivotal performance parameters that determine the reliability of any biosensing platform. While often used interchangeably, these terms represent distinct concepts. Specificity refers to the ability of a biosensor to detect a single target analyte unequivocally in a sample containing other potentially interfering components [90]. In an ideal scenario, a perfectly specific sensor recognizes no other molecules, akin to a single key opening only one lock [91] [90]. Selectivity, on the other hand, describes the sensor's ability to differentiate and quantify multiple different analytes within the same sample, identifying all components present rather than just one [90].
This distinction becomes critically important in multianalyte environments such as blood serum, cell lysates, or food samples, where numerous similar compounds coexist. Two dominant biosensing transduction principles—electrochemical and optical—have been extensively developed to navigate these challenges. This review provides a comparative analysis of these platforms, using ethanol detection as a case study, to evaluate their performance regarding selectivity and specificity in complex matrices.
Conceptual Framework: Specificity vs. Selectivity
Biosensing strategies can be broadly categorized into two complementary paradigms, each with distinct merits for multianalyte analysis.
Specific Sensing
Specific sensing relies on highly selective biorecognition elements—such as antibodies, aptamers, or enzymes—engineered to bind exclusively to a single target analyte [91]. This "lock-and-key" approach forms the basis for numerous commercial biosensors, including lateral flow immunochromatographic assays for pregnancy testing and enzyme-based blood glucose meters [91]. The principal strength of specific sensing is its ability to provide direct, unambiguous information on individual biomarkers, which is often essential for clinical diagnosis where a specific hypothesis about one or two analytes is being tested [91].
Selective Sensing
Selective sensing employs cross-reactive receptor arrays that generate a unique response pattern or "fingerprint" for different samples or analytes [91]. This approach, often called a "chemical nose/tongue," does not require prior knowledge of all sample components and operates effectively in a "hypothesis-less" fashion [91]. Its power lies in detecting complex sample profiles rather than individual components, making it particularly valuable for differentiating disease states where the complete biomarker pattern is more informative than single analytes [91].
Table 1: Comparison of Specific and Selective Sensing Approaches
| Feature | Specific Sensing | Selective Sensing |
|---|---|---|
| Analytical Goal | Identify and quantify a single predefined target | Differentiate complex samples or multiple analytes |
| Recognition Element | Highly specific receptors (antibodies, aptamers, enzymes) | Cross-reactive sensor arrays |
| Data Output | Direct analyte concentration | Multidimensional response pattern ("fingerprint") |
| Ideal Use Case | Testing specific hypotheses about known biomarkers | Hypothesis-free exploration; sample classification |
| Advantages | Direct, interpretable results; high specificity for target | Broad screening capability; adaptable to new analytes |
| Limitations | Requires prior knowledge of target; limited multiplexing | Complex data analysis; does not identify individual components |
Biosensor Platform Comparison: Electrochemical vs. Optical
The fundamental differences between electrochemical and optical biosensing platforms significantly impact their performance in multianalyte environments. The table below compares their general characteristics, while subsequent sections provide experimental details using ethanol detection as a case study.
Table 2: General Comparison of Electrochemical and Optical Biosensing Platforms
| Characteristic | Electrochemical Biosensors | Optical Biosensors |
|---|---|---|
| Transduction Principle | Measures electrical changes (current, potential, impedance) from biochemical reactions | Measures light-based changes (absorbance, fluorescence, luminescence) |
| Common Bio-recognition Elements | Enzymes (e.g., dehydrogenases, oxidases), antibodies, aptamers | Antibodies, enzymes, nucleic acids, lectins |
| Typical Multiplexing Approach | Electrode arrays with different bioreceptors | Multi-wavelength detection, spatial encoding, array-based sensing |
| Sensitivity | Very high (can detect nM to pM concentrations) | High (can detect nM to pM concentrations) |
| Selectivity Control Mechanism | Applied potential, electrode material, selective membranes | Wavelength selection, specific bioreceptor binding |
| Susceptibility to Sample Interference | Affected by electroactive interfering species | Affected by colored/turbid samples and autofluorescence |
| Instrumentation Portability | Excellent (miniaturized potentiostats available) | Moderate (miniaturization possible but can be complex) |
| Cost | Generally low-cost instrumentation | Can be higher due to optical components |
Electrochemical Biosensors for Ethanol Detection
Electrochemical biosensors typically utilize enzymes like alcohol dehydrogenase (ADH) for specific ethanol recognition. The general reaction mechanism is: [ \text{Ethanol} + \text{NAD}^+ \xrightarrow{\text{ADH}} \text{Acetaldehyde} + \text{NADH} + \text{H}^+ ] The generated NADH is then electrochemically oxidized at the electrode surface, producing a measurable current proportional to ethanol concentration [10]. A advanced platform used a screen-printed electrode modified with a nanocomposite of gold nanoparticles, electrochemically reduced graphene oxide, and poly(allylamine hydrochloride) (AuNPs-ERGO-PAH) to electrocatalyze NADH oxidation [10]. This biosensor demonstrated:
- A wide linear dynamic range of 0.05 to 5 mM ethanol
- A low detection limit of 10 µM
- High sensitivity of 44.6 ± 0.07 µA/mM·cm²
- Excellent stability for up to 6 weeks [10]
The selectivity was achieved through the enzyme's intrinsic specificity for ethanol over other alcohols, combined with the electrocatalytic properties of the nanocomposite that lowered the NADH oxidation potential, thus reducing interference from other electroactive species [10].
Electrochemical Ethanol Biosensor Workflow
Optical Biosensors for Ethanol Detection
Optical platforms for ethanol sensing employ various transduction mechanisms, including photoelectrochemical (PEC) systems. A notable PEC sensor was fabricated by modifying a TiO₂ photoelectrode with vertical silica nanochannels (SNC) [22]. This platform directly detected ethanol in complex samples through its photocatalytic oxidation at the TiO₂ surface, which generated a photocurrent. The SNC coating provided crucial size-exclusion and anti-fouling properties by preventing large biomacromolecules from reaching the photoactive surface while allowing small ethanol molecules to diffuse freely [22]. This sensor exhibited:
- A broad linear range from 1.775 µM to 20 mM
- A detection limit of 1.2 µM
- Direct operation in untreated whole blood and fruit samples [22]
The selectivity in this system was achieved through a combination of the inherent photocatalytic activity of TiO₂ toward ethanol and the physical filtration by the nanochannels, which excluded interfering substances based on size and charge [22].
Optical Ethanol Biosensor Workflow
Experimental Protocols for Key Studies
Sensor Fabrication:
- Prepare ternary nanocomposite by sonicating 1 mL of gold nanoparticles (AuNPs) with 25 µL graphene oxide (GO, 1 mg/mL) for 1 hour.
- Centrifuge the AuNPs-GO composite and remove the supernatant.
- Resuspend 80 µg of AuNPs-GO composite with 40 µL poly(allylamine hydrochloride) (PAH, 1 mg/mL) and sonicate for 15 minutes.
- Deposit 5 µL of the AuNPs-GO-PAH composite onto the carbon working electrode of a screen-printed electrode (SPE) and air-dry for 24 hours.
- Electrochemically reduce GO to ERGO by cyclic voltammetry from -1000 to +500 mV in 0.1 M KCl for 10 cycles at 10 mV/s.
- Prepare sol-gel immobilization matrix by mixing 5 µL tetramethoxysilane (TMOS), 15 µL methyltrimethoxysilane (MTMOS), 40 µL HCl (20 mM), 44 µL ultrapure water, and 4 µL polyethylene glycol 600.
- Sonicate the mixture for 15 minutes and age at 4°C for 6 hours.
- Mix 10 µL of hydrolyzed sol-gel with 10 µL alcohol dehydrogenase (ADH, 20 IU) and deposit 5 µL on the AuNPs-ERGO-PAH/SPE surface.
- Dry the biosensor in a desiccator at 4°C for 24 hours.
Measurement Protocol:
- Place the biosensor in 0.1 M phosphate buffer (pH 8.8) containing 0.1 M KCl and NAD⁺ cofactor.
- Apply a constant potential of +0.4 V vs. the pseudo-reference Ag electrode.
- Under stirred conditions, add successive aliquots of standard ethanol solution.
- Record the amperometric current response and plot against ethanol concentration.
Sensor Fabrication:
- Clean indium tin oxide (ITO) glass substrates sequentially with acetone, ethanol, and deionized water.
- Prepare TiO₂ suspension (5 mg/mL) in deionized water and deposit onto ITO electrode.
- Grow vertical silica nanochannels (SNC) on the TiO₂ surface using electrochemically assisted self-assembly with cetyltrimethylammonium bromide (CTAB) as a template and tetraethoxysilane (TEOS) as the silica source.
- Remove the CTAB template by extraction to create ordered mesoporous nanochannels.
- Characterize the SNC-TiO₂ electrode by scanning electron microscopy and electrochemical impedance spectroscopy.
Measurement Protocol:
- Use a standard three-electrode system with SNC-TiO₂ as working electrode, Pt wire as counter electrode, and Ag/AgCl as reference electrode.
- Immerse the sensor directly into untreated biological samples (whole blood, fruit juice).
- Illuminate with a 365 nm LED light source.
- Record the photocurrent response at a fixed potential in PBS (pH 7.4).
- Relate the photocurrent intensity to ethanol concentration using a calibration curve.
Performance Comparison in Multianalyte Environments
Table 3: Direct Performance Comparison for Ethanol Detection
| Performance Parameter | Electrochemical Biosensor [10] | Optical (PEC) Biosensor [22] |
|---|---|---|
| Detection Principle | Amperometric detection of enzymatically generated NADH | Photoelectrochemical detection of direct ethanol oxidation |
| Linear Range | 0.05 - 5 mM | 1.775 µM - 20 mM |
| Detection Limit | 10 µM | 1.2 µM |
| Sensitivity | 44.6 ± 0.07 µA/mM·cm² | Not specified |
| Assay Time | Minutes (including response stabilization) | Minutes (rapid photocurrent stabilization) |
| Selectivity Mechanism | Enzyme specificity + Nanocomposite electrocatalysis | Nanochannel exclusion + Photocatalytic selectivity |
| Interference Management | Lowered operating potential minimizes interference | Physical exclusion by nanochannels |
| Sample Matrix Tolerance | Requires buffer-based measurement | Direct measurement in whole blood and fruit samples |
| Stability | 6 weeks | Excellent reproducibility and stability |
Strategies for Enhancing Selectivity and Specificity
Both platforms employ sophisticated strategies to manage interference in multianalyte environments:
Electrochemical Approach:
- Enzyme Specificity: ADH provides primary specificity for ethanol over other alcohols.
- Nanocomposite Catalysis: AuNPs-ERGO-PAH lowers the NADH oxidation potential to +0.4 V, minimizing oxidation of common interferents like ascorbic acid and uric acid [10].
- Sol-gel Encapsulation: The sol-gel matrix provides a protective microenvironment for the enzyme while allowing substrate diffusion.
Optical (PEC) Approach:
- Size-Exclusion Nanochannels: The SNC layer (2-3 nm pores) excludes biomacromolecules like proteins and cells while permitting ethanol diffusion [22].
- Electrostatic Repulsion: Negatively charged silica surfaces repel negatively charged interferents at physiological pH.
- Photocatalytic Selectivity: TiO₂ exhibits preferential photocatalytic activity toward ethanol oxidation.
The Scientist's Toolkit: Essential Research Reagents and Materials
Table 4: Key Research Reagent Solutions for Biosensor Development
| Reagent/Material | Function in Biosensor Development | Example Application |
|---|---|---|
| Alcohol Dehydrogenase (ADH) | Biorecognition element that specifically catalyzes ethanol oxidation | Electrochemical ethanol biosensor [10] |
| Nicotinamide Adenine Dinucleotide (NAD⁺) | Cofactor required for ADH enzymatic activity; its reduction to NADH enables detection | Electrochemical ethanol biosensor [10] |
| Gold Nanoparticles (AuNPs) | Enhance electron transfer, increase surface area, and catalyze NADH oxidation | Nanocomposite in electrochemical biosensor [10] |
| Graphene Oxide/Reduced GO | Provides high electrical conductivity and large surface area for biomolecule immobilization | Transducer material in electrochemical biosensor [10] |
| Poly(allylamine hydrochloride) (PAH) | Polyelectrolyte that improves film formation and stabilizes the nanocomposite | Component of AuNPs-ERGO-PAH nanocomposite [10] |
| TiO₂ Nanoparticles | Semiconductor material with photocatalytic activity for direct analyte oxidation | Photoactive material in PEC biosensor [22] |
| Silica Nanochannels (SNC) | Create size-selective and anti-fouling barrier to exclude interferents | Surface modification in PEC biosensor for direct blood detection [22] |
| Sol-Gel Precursors (TMOS/MTMOS) | Form porous silica matrix for enzyme encapsulation while allowing substrate diffusion | Enzyme immobilization in electrochemical biosensor [10] |
The analysis of selectivity and specificity in multianalyte environments reveals that both electrochemical and optical biosensing platforms offer distinct advantages for different application scenarios. Electrochemical biosensors, exemplified by the ADH-based ethanol sensor, provide excellent specificity through biological recognition elements, with the added benefit of lower cost and easier miniaturization. The optical PEC platform demonstrates superior performance in direct analysis of complex samples like whole blood, achieved through innovative nanoengineering that provides physical exclusion of interferents.
The choice between these platforms depends on the specific analytical requirements. For controlled laboratory settings where sample pretreatment is possible, electrochemical systems offer robust, quantitative analysis. For field applications requiring direct analysis of complex biological samples, optical platforms with integrated anti-fouling strategies present a compelling advantage. Future developments will likely focus on combining elements from both approaches—integrating specific biological recognition with advanced materials for interference exclusion—to create next-generation biosensors with enhanced performance in multianalyte environments.
The accurate detection of ethanol is critical across numerous fields, including clinical diagnostics, food and beverage quality control, and forensic science [23] [22]. The choice of biosensing technology directly impacts the efficiency, accessibility, and reliability of these measurements. While traditional laboratory methods like gas chromatography offer high precision, their operational complexity and cost limit their use for rapid, on-site testing [23]. This has driven the development of alternative biosensors, primarily categorized as electrochemical and optical, which are better suited for decentralized analysis [5] [88]. This guide provides a objective comparison of these two biosensor classes, focusing on the critical operational factors of cost, simplicity, and robustness to inform researchers and development professionals in selecting the appropriate technology for specific ethanol detection applications.
Comparative Performance Analysis: Electrochemical vs. Optical Biosensors for Ethanol
Table 1: Overall comparison of electrochemical and optical biosensors for ethanol detection.
| Operational Factor | Electrochemical Biosensors | Optical Biosensors |
|---|---|---|
| Overall Cost | Low-cost materials and fabrication; suitable for mass production and disposable use [92] [93]. | Variable cost; can be low (e.g., paper-based) to high (e.g., requiring precise light sources/detectors) [23] [94] [95]. |
| Simplicity & Ease of Use | Generally simple instrumentation; minimal sample preparation; direct electrical readout [92] [88]. | Varies by type; colorimetric sensors are very simple, while others require optical alignment and more complex components [23] [95]. |
| Robustness & Anti-Interference | Susceptible to electrochemical interferents in complex samples; can be affected by pH and temperature [22]. | Can be highly resistant to biofouling and electromagnetic interference; some designs excel in complex matrices [23] [22]. |
| Sensitivity & Performance | High sensitivity and low limits of detection are achievable [92] [88]. | High sensitivity and low limits of detection are achievable, with some methods offering superior resolution [94] [22]. |
| Key Strengths | Portability, cost-effectiveness, and compatibility with miniaturized, point-of-care devices [5] [92] [88]. | Immunity to electromagnetic interference, capability for remote sensing, and visual readout possibilities [23] [5]. |
| Primary Limitations | Potential sensitivity to environmental conditions and fouling of the electrode surface [22]. | Potential for complex and costly instrumentation, and sensitivity to ambient light in some configurations [23] [5]. |
Table 2: Comparison of specific ethanol sensor performances from recent literature.
| Sensor Type | Detection Principle | Linear Range | Limit of Detection (LOD) | Tested Sample | Key Operational Advantage |
|---|---|---|---|---|---|
| Electrochemical [92] | Amperometric / Enzymatic (Enzyme/Oxidase) | Not fully specified | 0.4 mM (ETH) | Wine | Integrated, 3D-printed design for simultaneous multi-analyte detection. |
| Optical (Fluorescent) [95] | Fluorescence / Enzymatic | 0.05–2 v/v% | 0.05 v/v% | Vodka | Low-cost paper-based design (microPAD); simple smartphone camera detection. |
| Optical (PEC) [22] | Photoelectrochemical / Non-enzymatic | 1.775 μM - 20 mM | 1.2 μM | Whole Blood, Fruit | Direct detection in complex samples (e.g., blood) without pretreatment. |
| Optical (LED Photometry) [94] | Colorimetric (PEDD) | Not fully specified | Superior to spectrophotometry and imaging in comparative study | pH Dye Model | High performance and low cost, ideal for decentralized systems. |
Experimental Protocols for Ethanol Biosensing
To contextualize the performance data in the tables, this section outlines the fundamental experimental protocols for prominent electrochemical and optical ethanol biosensors.
Electrochemical Biosensor Protocol: 3D-Printed Enzymatic Biodevice
A representative protocol for a dual-sensor electrochemical device for ethanol and glucose, as detailed by [92], is as follows:
- Device Fabrication: The biosensor is fabricated via a one-step process using a 3D printer and fused deposition modeling (FDM) with a carbon black/polylactic acid (CB/PLA) filament. The printed device comprises a biodegradable PLA cell housing four embedded electrodes: two working electrodes (WEs), one reference electrode (RE), and one counter electrode (CE).
- Electrode Modification: The two WEs are individually functionalized. First, a Prussian Blue (PB) mediator layer is electrodeposited onto each WE. Subsequently, one WE is modified with alcohol oxidase enzyme for ethanol sensing, while the other is modified with glucose oxidase for glucose sensing. Finally, a Nafion film is applied over both enzymatically modified WEs to confer selectivity and prevent interference.
- Amperometric Measurement: A single drop of the sample (e.g., wine) is applied to the device cell, covering all electrodes. A portable bi-potentiostat is used to apply a fixed potential to the WEs. The enzymatic oxidation of ethanol by alcohol oxidase produces electrons, which are shuttled by the PB mediator, generating a current proportional to the ethanol concentration.
Optical Biosensor Protocol: Fluorescent microPAD
A protocol for a paper-based fluorescent ethanol biosensor, as described by [95], is outlined below:
- Sensor Preparation: A two-zone, cut-out paper device is fabricated. The sensor zone is impregnated with a custom fluorophore, carboxy-bis(4-pyridyl)dineopentoxyl-p-phenylenedivinylene (c-P4VB). The reaction zone is coated with the enzyme alcohol oxidase.
- Enzymatic Reaction: A sample containing ethanol is applied to the reaction zone. Ethanol diffuses and is oxidized by alcohol oxidase, producing hydrogen peroxide (H₂O₂) as a by-product.
- Signal Transduction: The generated H₂O₂ diffuses to the sensor zone. The c-P4VB fluorophore is highly sensitive to H₂O₂, which induces a protonation of its terminal pyridine groups, causing a large fluorescence color shift from teal-blue to orange.
- Detection and Quantification: The fluorescence change is captured using a smartphone camera or a portable fluorescence reader. The ratio of fluorescence intensities at different wavelengths (ratiometric approach) is used to quantify the ethanol concentration, minimizing issues like photo-bleaching.
The Scientist's Toolkit: Key Research Reagent Solutions
The development and operation of ethanol biosensors rely on a set of key reagents and materials. The table below details essential components, their functions, and relevance to the featured experiments.
Table 3: Essential reagents and materials for ethanol biosensor development.
| Reagent/Material | Function in Biosensing | Application in Featured Experiments |
|---|---|---|
| Oxidase Enzymes (e.g., Alcohol Oxidase) | Biorecognition element; catalyzes the oxidation of ethanol, producing H₂O₂ as a measurable signal [95] [22]. | Used in both electrochemical [92] and optical [95] enzymatic sensors to initiate the sensing cascade. |
| Prussian Blue (PB) | An electron mediator; facilitates the transfer of electrons from the enzymatic reaction to the electrode surface, enhancing electrochemical signal [92]. | Used to modify the working electrode in the 3D-printed amperometric biodevice [92]. |
| Functionalized Fluorophores (e.g., c-P4VB) | Optical reporter; changes its fluorescent properties (e.g., color or intensity) in response to the presence of a reaction product like H₂O₂ [95]. | The core sensing element in the fluorescent paper microPAD, enabling ratiometric detection [95]. |
| Nafion | A perfluorinated polymer membrane; used to coat electrodes to prevent fouling from large molecules and improve selectivity in complex samples [92]. | Applied as a protective film over the enzyme-modified working electrodes in the electrochemical sensor [92]. |
| Magnetic Beads (MBs) | A solid support for immobilizing biorecognition elements (e.g., antibodies, aptamers); enables target preconcentration and separation from complex matrices, reducing interference [93]. | While not used in the cited ethanol examples, they represent a key tool for enhancing robustness in electrochemical pathogen sensors [93]. |
| Metal-Organic Frameworks (MOFs) | Nanostructured porous materials; can host enzymes or fluorophores, enhance stability, and serve as signal amplifiers in optical sensors due to their tunable properties [96]. | Represent an advanced material for next-generation optical biosensors, improving sensitivity and stability [96]. |
The detection and quantification of ethanol is a critical analytical task in forensic science, clinical diagnostics, and the food industry. Blood alcohol concentration (BAC) serves as a vital indicator for assessing ethanol intoxication, making its direct detection in whole blood particularly significant for law enforcement and biomedical applications [22]. While various analytical methods exist, biosensors employing electrochemical and optical transduction mechanisms have emerged as powerful tools capable of bridging the gap between laboratory-based analysis and point-of-care (POC) testing [5] [97].
The evolution toward POC diagnostics addresses a crucial healthcare need, with nearly half the global population lacking access to basic diagnostics [98]. POC devices provide rapid, on-site testing that is vital for containing outbreaks, initiating early treatment, and managing chronic diseases—particularly in resource-limited settings [98] [99]. This comparison guide objectively evaluates the performance characteristics of electrochemical and optical biosensing platforms for ethanol detection, focusing on their operational principles, analytical performance, and suitability for transitioning from controlled laboratory environments to real-world POC applications.
Fundamental Principles and Sensing Mechanisms
Electrochemical Biosensors
Electrochemical biosensors transduce biological recognition events into measurable electrical signals such as current, potential, or impedance [5]. These sensors typically employ a biorecognition element (e.g., enzymes, antibodies, or aptamers) immobilized on an electrode surface, which interacts specifically with the target analyte [99]. For ethanol detection, enzymatic approaches using alcohol dehydrogenase or oxidase have been conventional, though they face limitations due to sensitivity to environmental factors like pH, temperature, and humidity [22].
Recent advances have introduced non-enzymatic photoelectrochemical (PEC) approaches that combine light excitation with electrochemical detection. In one innovative platform, a silica nanochannel-modified TiO₂ (SNC-TiO₂) sensing system demonstrated direct ethanol detection in complex biological samples [22]. This PEC sensor operates by generating electron-hole pairs upon light illumination, where ethanol molecules undergo oxidation at the photoactive material surface, producing measurable photocurrents proportional to ethanol concentration [22].
Optical Biosensors
Optical biosensors detect analytes by measuring changes in light properties resulting from biomolecular interactions, including absorbance, fluorescence, chemiluminescence, or surface plasmon resonance [5]. These platforms offer diverse detection modalities, with colorimetric assays using metal nanoparticles representing one of the most widespread approaches, particularly in commercial lateral flow immunoassays [5].
Other optical techniques include chemiluminescence, where light emission is triggered by chemical reactions, and fluorescence-based detection, which requires both an excitation light source and a detector for emitted photons [5]. More recently, optomagnetic biosensors have emerged as a subgroup that employs alternating magnetic fields to generate periodic movements of magnetic labels, with the resulting optical modulation analyzed by photodetectors [100]. These systems can suppress background noise through lock-in detection, accelerate molecular reactions via magnetic force-enhanced collision, and facilitate homogeneous volumetric detection [100].
Performance Comparison: Analytical Figures of Merit
The table below summarizes the key performance characteristics of electrochemical and optical biosensing platforms, with specific data for ethanol detection where available.
Table 1: Performance Comparison of Electrochemical and Optical Biosensors for Ethanol Detection
| Parameter | Electrochemical Biosensors | Optical Biosensors |
|---|---|---|
| Detection Limit | 1.2 μM (PEC ethanol sensor) [22] | Varies by technique; generally nM-pM for fluorescence and SPR [5] |
| Linear Range | 1.775 μM - 20 mM (PEC ethanol sensor) [22] | Varies by technique and application [5] |
| Assay Time | Minutes to tens of minutes [5] [22] | Minutes (e.g., LFA) to hours [5] |
| Sample Preparation | Minimal for direct detection platforms [22] | Often requires minimal preparation [5] |
| Multiplexing Capability | Moderate (with array designs) [99] | High (with multiple wavelengths/regions) [5] |
| Susceptibility to Matrix Effects | Reduced with nanochannel protection [22] | High in complex matrices due to background [5] |
| Instrumentation Complexity | Low to moderate [5] [99] | Moderate to high [5] |
| Cost per Test | Low [5] | Low (LFA) to high (SPR, specialized fluorescence) [5] |
Experimental Protocols for Ethanol Detection
Photoelectrochemical (PEC) Ethanol Sensor Protocol
The following protocol details the experimental methodology for the direct detection of ethanol in complex biological samples using a silica nanochannel-modified TiO₂ (SNC-TiO₂) PEC sensor [22]:
Table 2: Key Research Reagent Solutions for PEC Ethanol Sensing
| Reagent/Material | Function/Application | Source/Specification |
|---|---|---|
| Indium Tin Oxide (ITO) Glass | Conductive electrode substrate | Zhuhai Kaivo Electronic Components [22] |
| TiO₂ Nano-powder | Photoactive material | Anatase, 40 nm, 99.8% purity [22] |
| Tetraethoxysilane (TEOS) | Precursor for silica nanochannels | Analytical grade [22] |
| Cetyltrimethylammonium Bromide (CTAB) | Template for nanochannel formation | Analytical grade [22] |
| Ethanol Standards | Calibration and validation | Various concentrations in buffer and biological matrices [22] |
Sensor Fabrication:
- Electrode Preparation: Clean ITO glass substrates sequentially with acetone, ethanol, and deionized water via ultrasonication.
- TiO₂ Coating: Prepare a TiO₂ suspension (5 mg/mL in water) and deposit it onto the pre-cleaned ITO electrodes, followed by drying at 60°C.
- Silica Nanochannel Modification: Synthesize the SNC layer using a sol-gel process with TEOS as the silicon source and CTAB as the structure-directing agent. Coat the TiO₂-modified electrode with the SNC precursor solution and age for 24 hours at room temperature. Remove the CTAB template by extracting with ethanol.
- Characterization: Verify the successful modification using scanning electron microscopy (SEM) and high-resolution transmission electron microscopy (HRTEM) to confirm uniform SNC coating.
Measurement Procedure:
- Apparatus Setup: Utilize a standard three-electrode configuration with the SNC-TiO₂ as working electrode, Ag/AgCl reference electrode, and platinum counter electrode.
- PEC Measurements: Conduct measurements in a quartz cell containing the sample solution. Illuminate the electrode with a 365 nm LED light source and apply a constant potential of 0.6 V vs. Ag/AgCl.
- Calibration: Record photocurrent responses for standard ethanol solutions across the concentration range (1.775 μM to 20 mM) in both buffer and biological matrices (e.g., whole blood, fruit extracts).
- Sample Analysis: Directly immerse the sensor into untreated biological samples without pretreatment steps. Measure the photocurrent response and calculate ethanol concentration from the calibration curve.
Validation and Quality Control
For both electrochemical and optical platforms, rigorous validation is essential. The PEC ethanol sensor demonstrated excellent reproducibility and stability, with the SNC modification providing enhanced anti-biofouling and anti-interference capabilities [22]. The hydrophilic effect, size-exclusion (approximately 2-3 nm pore size), and electrostatic exclusion of the nanochannels effectively prevented fouling macromolecules and interferents from reaching the photoactive surface while allowing target ethanol molecules to diffuse freely [22].
Standard validation procedures should include:
- Linearity Assessment: Across the claimed analytical measurement range
- Limit of Detection (LOD) and Quantification (LOQ): Determined using standard statistical methods
- Precision Studies: Intra-assay and inter-assay variability
- Specificity Evaluation: Against common interferents in biological samples
- Recovery Studies: In relevant biological matrices
Application Suitability: From Laboratory to Point-of-Care
Laboratory-Based Analysis
In controlled laboratory settings, both electrochemical and optical platforms offer distinct advantages. The PEC ethanol sensor exemplifies modern electrochemical approaches that provide excellent sensitivity (LOD of 1.2 μM) and a broad linear range (1.775 μM - 20 mM) suitable for precise quantification across clinically relevant concentrations [22]. Optical platforms, particularly those based on fluorescence or surface plasmon resonance, typically offer superior sensitivity and are well-established in laboratory environments [5].
Point-of-Care Adaptation
The transition to POC testing imposes additional requirements including minimal sample preparation, operational simplicity, rapid results, and cost-effectiveness [98] [99]. For ethanol detection, the direct measurement capability demonstrated by the SNC-TiO₂ PEC sensor—without requiring complex sample pretreatments—represents a significant advancement for POC adaptation [22].
Complementary metal-oxide-semiconductor (CMOS) technology plays a pivotal role in enabling compact, efficient diagnostic systems by allowing integration of sensing, signal processing, and data communication onto a single chip [99]. This miniaturization and low-power consumption make CMOS-based platforms particularly suitable for battery-powered POC applications [99].
Lateral flow immunoassays (LFIAs) represent the most successful optical POC platform, offering simplicity, rapidity, and cost-effectiveness [5] [98]. However, their application to small molecules like ethanol presents design challenges. Recent innovations in smartphone-based detection systems, utilizing built-in CMOS cameras and flashlights as light sources and detectors, respectively, further enhance POC capabilities for both optical and photoelectrochemical platforms [5] [99].
Electrochemical and optical biosensors each present distinct advantages for ethanol detection across the analytical spectrum from laboratory-based analysis to point-of-care testing. Electrochemical platforms, particularly innovative PEC approaches, offer direct detection capability in complex matrices with minimal sample preparation, excellent sensitivity, and broad dynamic ranges. Optical biosensors provide high sensitivity and established multiplexing capabilities, with LFIAs representing mature technology for decentralized testing.
The optimal platform selection depends fundamentally on the specific application requirements, with electrochemical sensors showing particular promise for direct ethanol detection in complex biological samples, and optical platforms maintaining advantages in multiplexed detection and established POC formats. Future developments in CMOS integration, nanomaterials, and microfluidics will further enhance the performance and accessibility of both platforms, ultimately expanding their implementation across healthcare, forensic, and industrial applications.
The field of biosensing is undergoing a profound transformation, driven by concurrent advances in computational intelligence, materials science, and nano-engineering. In the specific domain of ethanol detection, the traditional competition between electrochemical and optical biosensing platforms is evolving toward a more integrated, intelligent, and sustainable paradigm. Researchers and developers are no longer solely focused on incremental improvements to a single sensor's sensitivity. Instead, the field is moving toward systems capable of measuring multiple analytes simultaneously (multiplexing), leveraging artificial intelligence (AI) for enhanced data interpretation, and incorporating sustainable materials for reduced environmental impact [101] [102]. This guide provides a comparative analysis of how these three disruptive trends are being integrated into electrochemical and optical biosensing frameworks, offering objective performance data and detailed experimental protocols to inform future research directions in ethanol detection and beyond.
Comparative Performance Analysis of Next-Generation Biosensors
The integration of advanced functionalities is reshaping the performance metrics of both electrochemical and optical biosensors. The table below provides a structured comparison based on key parameters critical for future applications.
Table 1: Performance comparison of electrochemical and optical biosensors integrating AI, multiplexing, and sustainable materials.
| Performance Parameter | Electrochemical Biosensors | Optical Biosensors |
|---|---|---|
| Multiplexing Capacity | Moderate; limited by electrode addressability and cross-talk [103]. | High; inherent suitability for spatial encoding and imaging [104] [105]. |
| AI-Enhanced LOD | Significant improvement; ML models effectively denoise signals, achieving sub-pg/mL LOD for pathogens in complex food matrices [102]. | Exceptional; AI-driven analysis of complex optical outputs (e.g., SERS, phase shifts) can push LOD to fg/mL levels [106] [102]. |
| Signal Complexity for AI | Lower complexity; primarily temporal current/voltage data [102]. | Higher complexity; spectral, spatial, and intensity data provide rich features for AI models [106] [102]. |
| Compatibility with Green Materials | High; compatible with paper-based electrodes, carbon inks, and plant-derived NPs [107] [103] [108]. | Moderate; effective with paper substrates and some bio-based nanomaterials [107] [108]. |
| Typical Assay Time (with AI) | Minutes (rapid, real-time signal processing) [102] [5]. | Can be longer due to imaging or spectral acquisition, but accelerated by AI analysis [104] [102]. |
| Portability & POC Suitability | Excellent; naturally miniaturized, low-power, easy to integrate with handheld readers [5] [109]. | Improving; new compact designs (e.g., smartphone-based) are enhancing portability [106] [5]. |
Table 2: Sustainability assessment of materials for next-generation biosensors.
| Material Type | Examples | Key Advantages | Biosensor Applications |
|---|---|---|---|
| Paper/Cellulose | Filter paper, nitrocellulose membrane, nanocellulose [103] [108] | Low-cost, biodegradable, porous for capillary flow, easy functionalization [108]. | Substrate for electrodes, microfluidic channels, lateral flow assays [103] [108]. |
| Green Nanomaterials | Plant-derived metal nanoparticles, bio-based carbon dots [107] | Biocompatible, eco-friendly synthesis, reduced toxicity, often from abundant sources [107]. | Signal labels, catalytic elements, immobilization matrices in both optical and electrochemical sensors [107]. |
| Polymers | Polydimethylsiloxane (PDMS), poly-acrylic acid (ppAA) [104] [109] | Flexibility, optical transparency (for optics), moldability for microfluidics [109]. | Microfluidic chambers, flexible substrates, nanostructured sensing surfaces [104] [109]. |
Experimental Protocols for Advanced Biosensing
Protocol for Multiplexed Optical Detection
This protocol is adapted from a study on multi-pinhole interferometric biosensors for the detection of human α-thrombin, demonstrating principles applicable to multiplexed ethanol assay development [104].
Primary Materials:
- Photonic-Crystal Slab: A nanostructured sensor surface (e.g., grating period of 370 nm) replicated using polydimethylsiloxane (PDMS) from a master and transferred into an AMONIL layer on a glass substrate [104].
- Multi-pinhole Aperture: A metal film with a precise array of pinholes (e.g., 400 µm diameter) to select light from different measurement fields [104].
- Microfluidic Chamber: A custom chamber created from a rubber foil (e.g., 2 mm thick) with punched holes, sandwiched between the photonic-crystal substrate and a cover glass, incorporating inlet/outlet cannulas [104].
- Optical Setup: HeNe laser (632.8 nm), aspheric focusing and collimating lenses, circular polarizer, and a CMOS camera for detection [104].
Methodology:
- Sensor Functionalization: The specific biorecognition elements (e.g., enzymes selective for ethanol) are immobilized onto distinct regions of the photonic-crystal surface within the microfluidic chamber using established biofunctionalization protocols (e.g., EDC/NHS chemistry) [104].
- Optical Alignment: The photonic crystal is placed on a rotation stage. The angle of incident light (α) is adjusted to match the resonance condition for the laser wavelength and grating period, according to Bragg's law (λres = Λ(neff ± sin(α))) [104].
- Sample Introduction & Data Acquisition: The sample is introduced via the microfluidic inlets. The GMR light, modulated by binding events, passes through the circular polarizer and the multi-pinhole aperture. A Fourier lens projects the far-field diffraction pattern onto the CMOS camera, which records frames over time [104].
- Signal Processing: A Python script processes the image frames. The Fast Fourier Transform (FFT) of each frame is calculated. The phase difference (ϕ_mn) for each interference spot corresponding to a measurement field is computed using an arctangent function on the real and imaginary parts of the inverse FFT, followed by phase unwrapping and noise filtering with a moving average [104].
Protocol for AI-Enhanced Electrochemical Detection
This protocol outlines the use of machine learning to analyze electrochemical data for foodborne pathogens, a approach that can be directly translated to discerning complex signals in ethanol detection [102].
Primary Materials:
- Electrochemical Biosensor: A standard three-electrode system (working, reference, auxiliary), which can be screen-printed or paper-based, functionalized with the relevant bioreceptor [103] [102].
- Potentiostat: A portable or multiplexed potentiostat for measuring amperometric, impedimetric, or voltammetric signals.
- Data Acquisition System: A computer or embedded system to record the electrochemical output.
- AI/ML Software Environment: Python with libraries such as Scikit-learn, TensorFlow, or PyTorch for model development.
Methodology:
- Data Collection: A large dataset of electrochemical responses (e.g., chronoamperograms, electrochemical impedance spectroscopy Nyquist plots) is generated from samples with varying known concentrations of ethanol, along with potential interferents.
- Feature Engineering: Key features are extracted from the raw signals. For amperometry, this could be the steady-state current; for EIS, features like charge-transfer resistance (R_ct) or parameters from equivalent circuit fitting are used [102].
- Model Training: A machine learning model (e.g., Support Vector Machine for classification, Random Forest or Convolutional Neural Network for regression) is trained on a subset of the data. The model learns the complex relationship between the extracted features and the target analyte concentration.
- Validation & Deployment: The trained model's performance is validated on a separate, unseen test dataset. Metrics such as accuracy, precision, recall, and mean absolute error are calculated. Once validated, the model is deployed to analyze data from new, unknown samples in real-time, providing a concentration readout that is more accurate and robust than traditional calibration curves [102].
The Integration of Artificial Intelligence
AI, particularly machine learning (ML) and deep learning (DL), is moving beyond simple data analysis to become a core component of the biosensing architecture itself. AI's role in enhancing biosensor performance is multifaceted and applies differently across transduction principles.
The following diagram illustrates the typical workflow for integrating AI with biosensors, from data acquisition to intelligent output.
(AI-Enhanced Biosensing Workflow)
For electrochemical biosensors, AI models excel at denoising signals and distinguishing target signals from background interference in complex matrices like food samples, with reported accuracies for pathogen classification exceeding 95% [102]. ML algorithms can process the inherently multivariate data from techniques like impedance spectroscopy to quantify ethanol concentration while compensating for the influence of pH or temperature fluctuations.
Optical biosensors generate rich, high-dimensional data from techniques like surface-enhanced Raman spectroscopy (SERS) or hyperspectral imaging. Convolutional Neural Networks (CNNs) are exceptionally well-suited for analyzing these complex patterns, enabling the identification and quantification of multiple analytes simultaneously from a single spectral output, a task that is challenging with traditional analytical methods [102].
Sustainable Materials and Green Nanotechnology
The drive toward sustainability is promoting the adoption of green materials that minimize environmental impact without compromising sensor performance. This trend is closely aligned with the goals of point-of-care testing, which demands low-cost, disposable devices [107] [108].
- Paper and Cellulose-Based Materials: Paper substrates are revolutionizing biosensor design due to their porosity, biodegradability, and low cost. They serve as excellent platforms for creating microfluidic paper-based analytical devices (μPADs) and as a substrate for printing electrodes. The capillary action within the fibrous network eliminates the need for external pumps, facilitating passive fluid transport [103] [108].
- Green Nanomaterials: The synthesis of nanomaterials using plant extracts or other biological templates is a key pillar of green nanotechnology. These plant-derived nanoparticles (e.g., silver or gold NPs) and bio-based carbon nanomaterials are biocompatible, abundant, and reduce the use of hazardous chemicals. They are integrated into biosensors as catalytic labels, signal amplifiers, or immobilization matrices [107].
The Scientist's Toolkit: Key Research Reagent Solutions
Table 3: Essential materials and reagents for developing advanced biosensors.
| Item Name | Function/Brief Explanation | Example Application |
|---|---|---|
| Photonic-Crystal Slab | A nanostructured surface that enhances light-matter interaction, used to transduce binding events into optical signals. | Label-free detection of biomolecular interactions in multiplexed optical biosensors [104]. |
| Multi-pinhole Aperture | A spatial filter that enables simultaneous interferometric sampling from multiple measurement fields on a sensor surface. | Enabling inherent differential referencing in multiplexed interferometric biosensing [104]. |
| Paper/Carbon Ink | A sustainable substrate and conductive ink for fabricating low-cost, disposable electrodes. | Manufacturing working electrodes for electrochemical paper-based analytical devices (e-PADs) [103]. |
| Gold-plated Connector Headers | A reusable interface connecting paper-based working electrodes to a potentiostat, simplifying multiplexed device design. | Creating a multiplexed (e.g., 8-channel) electrochemical platform for simultaneous measurements [103]. |
| EDC/NHS Coupling Kit | A common chemical toolkit for activating carboxyl groups, facilitating the covalent immobilization of biomolecules on sensor surfaces. | Functionalizing sensor surfaces with enzymes or antibodies for specific target recognition [104] [105]. |
| Plant-Derived Nanoparticles | Metallic or carbon nanoparticles synthesized using green chemistry principles, serving as sustainable signal labels or catalysts. | Acting as a nanozyme or SERS-active substrate in eco-friendly optical or electrochemical assays [107]. |
The future of biosensing, particularly for applications like ethanol detection, lies in the convergence of the trends discussed. The next generation of devices will likely be hybrid systems that leverage the strengths of both electrochemical and optical transduction, guided by AI and built with a focus on sustainability and full integration. Key future directions include:
- Hybrid Sensing Modules: Combining electrochemical and optical readouts in a single device to provide complementary data, cross-validate results, and gather a more comprehensive physiological profile [106] [5].
- Advanced AI Integration: Moving beyond analysis to predictive and autonomous systems. AI will be used not just to interpret data, but to optimize sensor design, predict calibration drift, and enable closed-loop systems that automatically adjust therapy based on real-time biosensor data [101] [102].
- Full System Integration: The ultimate goal is the development of "lab-on-paper" or wearable devices that integrate sample preparation, reaction, detection, and data transmission into a single, miniaturized, and user-friendly platform. This will be achieved through the convergence of flexible electronics, microfluidics, and IoT connectivity [103] [109] [108].
In conclusion, the objective comparison between electrochemical and optical biosensors is no longer a simple binary choice. For ethanol detection and a myriad of other applications, the optimal path forward involves a strategic fusion of multiplexing capabilities, intelligent data processing with AI, and the principled adoption of sustainable materials. This integrated approach is paving the way for smarter, more efficient, and environmentally responsible biosensing technologies that will redefine diagnostics and monitoring.
Conclusion
The choice between electrochemical and optical biosensors for ethanol detection is not a matter of absolute superiority but of context. Electrochemical sensors offer compelling advantages in portability, cost-effectiveness, and ease of miniaturization for point-of-care applications. In contrast, optical sensors, particularly advanced platforms like PCF and LSPR-based systems, frequently demonstrate superior sensitivity and specificity, making them ideal for laboratory-based analysis requiring the utmost precision. Future advancements will be driven by the integration of artificial intelligence for data analysis, the development of sustainable materials, and the creation of modular, multiplexed platforms capable of detecting ethanol alongside other critical biomarkers. This evolution will further empower researchers and drug development professionals in creating next-generation diagnostic and monitoring tools.
References
- 1. Ethanol - StatPearls - NCBI Bookshelf - NIH [https://www.ncbi.nlm.nih.gov/books/NBK556147/]
- 2. Ethanol testing in behavioral health - Insights - Mayo Clinic Labs [https://news.mayocliniclabs.com/ethanol-testing-in-behavioral-health/]
- 3. Biomarkers and Clinical Laboratory Detection of Acute ... [https://pubmed.ncbi.nlm.nih.gov/35325064/]
- 4. A Review on Flexible Electrochemical Biosensors to ... [https://pmc.ncbi.nlm.nih.gov/articles/PMC9026542/]
- 5. Electrochemical vs. Optical Biosensors for Point-of-Care ... [https://www.mdpi.com/2227-9040/11/10/546]
- 6. Ultra-sensitive ethanol detection using a chemiresistive ... [https://www.nature.com/articles/s41378-025-01055-6]
- 7. Advanced THz Optical Sensor for Ethanol and Benzene ... [https://ui.adsabs.harvard.edu/abs/2025SBSR...4900846H/abstract]
- 8. An ethanol concentration detection method based on ... [https://www.sciencedirect.com/science/article/abs/pii/S0925400525002837]
- 9. Comparison of biosensor platforms in the evaluation ... [https://www.sciencedirect.com/science/article/pii/S0003269716301592]
- 10. A New Highly Sensitive Electrochemical Biosensor for ... [https://www.mdpi.com/2079-6374/13/11/954]
- 11. Electrochemical vs Optical Biosensors for Point of Care ... [https://www.preprints.org/manuscript/202307.1536/v1]
- 12. Wearable Electrochemical Alcohol Biosensors - PMC [https://pmc.ncbi.nlm.nih.gov/articles/PMC6407881/]
- 13. Review Ethanol biosensors based on alcohol oxidase [https://www.sciencedirect.com/science/article/abs/pii/S0956566304004889]
- 14. A Review of Optical Fibre Ethanol Sensors - PubMed Central [https://pmc.ncbi.nlm.nih.gov/articles/PMC8840036/]
- 15. Optical biosensors: a decade in review [https://www.sciencedirect.com/science/article/pii/S1110016822008249]
- 16. Advancements and Perspectives in Optical Biosensors - PMC [https://pmc.ncbi.nlm.nih.gov/articles/PMC11170745/]
- 17. Performance improvement approaches for optical fiber ... [https://opg.optica.org/prj/fulltext.cfm?uri=prj-10-1-126]
- 18. Recent advances of optical fiber biosensors based on surface ... [https://pubs.rsc.org/en/content/articlehtml/2024/sd/d4sd00045e]
- 19. Surface plasmon resonance photonic crystal fiber biosensor [https://www.sciencedirect.com/science/article/abs/pii/S0030401824005388]
- 20. Recent Advances in Photonic Crystal Fiber-Based SPR ... [https://www.mdpi.com/2072-666X/16/7/747]
- 21. Advanced SPR biosensor with optimized gold-TiO2 D ... [https://www.nature.com/articles/s41598-025-24697-y]
- 22. Direct photoelectrochemical detection of ethanol in ... [https://www.sciencedirect.com/science/article/abs/pii/S0956566324009229]
- 23. A Review of Optical Fibre Ethanol Sensors: Current State ... [https://www.mdpi.com/1424-8220/22/3/950]
- 24. Chromatography Methods Compared: HPLC vs. FPLC vs. GC [https://synapse.patsnap.com/article/chromatography-methods-compared-hplc-vs-fplc-vs-gc]
- 25. Fine tuning enzyme activity assays for monitoring the ... [https://www.nature.com/articles/s41598-024-84177-7]
- 26. [PDF] Evaluating the Performance of Ethanol Electrochemical ... [https://www.semanticscholar.org/paper/Evaluating-the-Performance-of-Ethanol-Nanobiosensor-Farahbakhsh-Abad/7a209aa093f630e6ae299133766fc935f3a51dc0]
- 27. enzymatic assay versus gas chromatography [https://www.sciencedirect.com/science/article/pii/S002222752400066X]
- 28. Comparison of High-Performance Liquid Chromatography ... [https://pubmed.ncbi.nlm.nih.gov/19374894/]
- 29. Improvement of the optical cavity-based biosensor's limit ... [https://www.nature.com/articles/s41598-025-92151-0]
- 30. A Closer Look at Biosensors: A Practical Tutorial for ... [https://www.spectroscopyonline.com/view/a-closer-look-at-biosensors-a-practical-tutorial-for-spectroscopists]
- 31. When lower isn't always better in biosensor research and ... [https://www.sciencedirect.com/science/article/abs/pii/S0956566324006766]
- 32. Rapid, high-sensitivity detection of biomolecules using ... [https://www.nature.com/articles/s41598-023-41436-3]
- 33. Research Progress of Electrochemical Biosensors for ... [https://pmc.ncbi.nlm.nih.gov/articles/PMC12024860/]
- 34. Optical biosensors - PMC [https://pmc.ncbi.nlm.nih.gov/articles/PMC4986466/]
- 35. Controlling parameters and characteristics of ... [https://www.nature.com/articles/s41598-019-43680-y]
- 36. Impedimetric study of the electrocatalytic oxidation ... [https://www.sciencedirect.com/science/article/abs/pii/S0039914022008256]
- 37. Potentiometric, Amperometric, and Impedimetric CMOS ... [https://www.intechopen.com/chapters/41005]
- 38. Amperometric determination of ethanol in beverages at ... [https://www.sciencedirect.com/science/article/abs/pii/S000326700200942X]
- 39. A New Highly Sensitive Electrochemical Biosensor for ... [https://pmc.ncbi.nlm.nih.gov/articles/PMC10669219/]
- 40. Electrochemical Sensors and Biosensors - PMC [https://pmc.ncbi.nlm.nih.gov/articles/PMC3264821/]
- 41. Theoretical and experimental investigations of ethanol ... [https://www.sciencedirect.com/science/article/abs/pii/S092442471300589X]
- 42. Miniaturized Sensors for Detection of Ethanol in Water ... [https://pmc.ncbi.nlm.nih.gov/articles/PMC9003094/]
- 43. Optical bio-sniffer for ethanol vapor using an oxygen- ... [https://www.sciencedirect.com/science/article/abs/pii/S0956566303002185]
- 44. Hydrogel-Based Sensors for Ethanol Detection in Alcoholic ... [https://pmc.ncbi.nlm.nih.gov/articles/PMC6427446/]
- 45. Terahertz photonic crystal fiber sensor [https://www.sciencedirect.com/science/article/abs/pii/S0735193324003774]
- 46. Photonic crystal fiber sensors in the THz domain: A leap ... [https://www.sciencedirect.com/science/article/pii/S2405844024169769]
- 47. Hollow-core PCF for terahertz sensing - PubMed Central - NIH [https://pmc.ncbi.nlm.nih.gov/articles/PMC11952228/]
- 48. Design and Analysis of a Photonic Crystal Fiber Sensor for ... [https://www.mdpi.com/2304-6732/12/11/1136]
- 49. Designing a terahertz optical sensor based on helically ... [https://www.nature.com/articles/s41598-024-82704-0]
- 50. Research progress of photoelectrochemical sensors in food detection - ScienceDirect [https://www.sciencedirect.com/science/article/abs/pii/S0963996925004089]
- 51. Review on Research Progress of Photoelectrochemical ... [https://pmc.ncbi.nlm.nih.gov/articles/PMC12654009/]
- 52. Fundamental principles of photoelectrochemical sensors ... [https://pmc.ncbi.nlm.nih.gov/articles/PMC12550690/]
- 53. Recent advances in photoelectrochemical platforms based on porous materials for environmental pollutant detection - PMC [https://pmc.ncbi.nlm.nih.gov/articles/PMC10915833/]
- 54. Photoelectrochemical sensors based on paper and their ... [https://www.sciencedirect.com/science/article/abs/pii/S0956566323003421]
- 55. Recent advances in photoelectrochemical sensing of ... [https://www.sciencedirect.com/science/article/pii/S2666831925001444]
- 56. Advanced THz Optical Sensor for Ethanol and Benzene ... [https://www.sciencedirect.com/science/article/pii/S2214180425001126]
- 57. Conformational change-based electrochemical biosensor for ... [https://pubs.rsc.org/en/content/articlehtml/2025/ra/d5ra06247k?page=search]
- 58. Electrochemical microfluidic biosensor for the detection of ... [https://www.nature.com/articles/s41378-025-00893-8]
- 59. A Review on Flexible Electrochemical Biosensors to ... [https://www.mdpi.com/2079-6374/12/4/252]
- 60. A Short Review on Miniaturized Biosensors for the Detection ... [https://pmc.ncbi.nlm.nih.gov/articles/PMC10046286/]
- 61. Innovations in Biosensor Technologies for Healthcare ... [https://www.mdpi.com/1424-8220/24/16/5143]
- 62. Electrochemical Biosensors: A Prospective Insight to ... [https://www.sciencedirect.com/science/article/abs/pii/S2451910325001358]
- 63. Emerging trends in AI-integrated optical biosensors for point ... [https://pubs.rsc.org/en/content/articlehtml/2025/cc/d5cc04899k]
- 64. Biosensor-Integrated Drug Delivery Systems as New ... [https://pmc.ncbi.nlm.nih.gov/articles/PMC9496590/]
- 65. Lab-on-a-Chip Biosensors for Drug Safety and Health [https://esmed.org/lab-on-a-chip-biosensors-for-drug-safety-and-health/]
- 66. Nanoparticle-enabled portable biosensors for early ... [https://www.sciencedirect.com/science/article/pii/S2590137025001025]
- 67. A low-fouling electrochemical biosensor based on ... [https://www.sciencedirect.com/science/article/abs/pii/S0925400524000510]
- 68. Nanomaterial-Powered Biosensors: A Cutting-Edge ... [https://pmc.ncbi.nlm.nih.gov/articles/PMC12471708/]
- 69. Biosensor nanoengineering: Design, operation, and ... [https://www.sciencedirect.com/science/article/pii/S2666351120300401]
- 70. Electrochemical biosensors: perspective on functional ... [https://biomaterialsres.biomedcentral.com/articles/10.1186/s40824-019-0181-y]
- 71. Functional Nanomaterials Enhancing Electrochemical ... [https://pmc.ncbi.nlm.nih.gov/articles/PMC10180161/]
- 72. Fabrication of Nanobioengineered Interfaces Utilizing ... [https://pmc.ncbi.nlm.nih.gov/articles/PMC11465734/]
- 73. Recent advances in nanomaterial-based optical ... [https://www.sciencedirect.com/science/article/pii/S2095177925001662]
- 74. Optical and Electrochemical Biosensors for Detection of ... [https://www.mdpi.com/2079-6374/15/7/460]
- 75. Metal Nanocluster-Based Biosensors for DNA Detection [https://pmc.ncbi.nlm.nih.gov/articles/PMC11853106/]
- 76. AI-Enhanced Surface Functionalization in Biosensors [https://www.sciencedirect.com/science/article/abs/pii/S0165993625003887]
- 77. Guide to Selecting a Biorecognition Element for Biosensors [https://pmc.ncbi.nlm.nih.gov/articles/PMC6416154/]
- 78. High-performance electrochemical biosensor comprising ... [https://www.nature.com/articles/s42004-025-01703-y]
- 79. Evanescent wave-based optical biosensors for innovations ... [https://www.sciencedirect.com/science/article/pii/S2090123225005053]
- 80. Biosensors, Volume 15, Issue 7 (July 2025) – 74 articles [https://www.mdpi.com/2079-6374/15/7]
- 81. Bioreceptors as the key components for electrochemical ... [https://www.sciencedirect.com/science/article/pii/S2666386424000213]
- 82. Biosensors, Volume 15, Issue 9 (September 2025) [https://www.mdpi.com/2079-6374/15/9]
- 83. Shifting the detection range of cell biosensors toward high ... [https://www.sciencedirect.com/science/article/abs/pii/S0167779925002057]
- 84. Comparison of approaches for assessing detection and ... [https://www.nature.com/articles/s41598-024-83474-5]
- 85. Determining LOD and LOQ Based on the Calibration Curve [https://www.sepscience.com/hplc-solutions-126-chromatographic-measurements-part-5-determining-lod-and-loq-based-on-the-calibration-curve-6959]
- 86. Comparison of approaches for assessing detection and ... [https://pubmed.ncbi.nlm.nih.gov/39952988/]
- 87. Chapter 7 - Sensitivity and Limit of Detection [https://www.sciencedirect.com/science/chapter/bookseries/pii/S092234870870220X]
- 88. Electrochemical biosensors represent promising detection ... [https://www.sciencedirect.com/science/article/pii/S2773045X23000365]
- 89. Recent advances in optical biosensing approaches for ... [https://www.sciencedirect.com/science/article/pii/S2590137022001625]
- 90. What is the difference between specificity and selectivity? [https://mpl.loesungsfabrik.de/en/english-blog/method-validation/specificity-selectivity]
- 91. Selectivity and Specificity: Pros and Cons in Sensing - PMC [https://pmc.ncbi.nlm.nih.gov/articles/PMC6173322/]
- 92. 3D printed electrochemical dual-sensor biodevice for the ... [https://www.sciencedirect.com/science/article/pii/S095671352500653X]
- 93. A Cost-Effective and Rapid Manufacturing Approach for ... [https://pmc.ncbi.nlm.nih.gov/articles/PMC11944730/]
- 94. A Comparative Study of Optical Sensing Methods for ... [https://pmc.ncbi.nlm.nih.gov/articles/PMC12251617/]
- 95. A Fluorescent Alcohol Biosensor Using a Simple microPAD ... [https://www.frontiersin.org/journals/sensors/articles/10.3389/fsens.2022.840130/full]
- 96. Metal–Organic-Framework-Based Optical Biosensors [https://pmc.ncbi.nlm.nih.gov/articles/PMC12390483/]
- 97. Advancing biological investigations using portable sensors ... [https://www.sciencedirect.com/science/article/pii/S2405844023098870]
- 98. Sample Preparation and Detection Methods in Point-of- ... [https://pmc.ncbi.nlm.nih.gov/articles/PMC11270053/]
- 99. CMOS Point-of-Care Diagnostics Technologies [https://www.mdpi.com/2072-666X/15/11/1320]
- 100. Optomagnetic biosensors: Volumetric sensing based on ... [https://www.sciencedirect.com/science/article/abs/pii/S0956566322006005]
- 101. Future advances of artificial biosensor technology in ... [https://www.sciencedirect.com/science/article/pii/S2666831924000158]
- 102. Integration of Artificial Intelligence in Biosensors for Enhanced ... [https://pmc.ncbi.nlm.nih.gov/articles/PMC12564411/]
- 103. Sampling and multiplexing in lab-on-paper ... [https://www.sciencedirect.com/science/article/abs/pii/S0956566319302854]
- 104. Multiplex optical biosensors based on multi-pinhole ... [https://pmc.ncbi.nlm.nih.gov/articles/PMC8367262/]
- 105. Multiplexed label-free optical biosensor for medical ... [https://www.spiedigitallibrary.org/journals/journal-of-biomedical-optics/volume-19/issue-1/017006/Multiplexed-label-free-optical-biosensor-for-medical-diagnostics/10.1117/1.JBO.19.1.017006.full]
- 106. Optical sensors for transdermal biomarker detection: A review [https://www.sciencedirect.com/science/article/abs/pii/S0956566324008510]
- 107. Emerging Trends in Smart and Sustainable Nano-Biosensing [https://www.sciencedirect.com/science/article/pii/S0926669024020855]
- 108. Paper-based sustainable biosensors - RSC Publishing [https://pubs.rsc.org/en/content/articlehtml/2024/ma/d3ma01019h]
- 109. The design, fabrication, and applications of flexible biosensing ... [https://pmc.ncbi.nlm.nih.gov/articles/PMC6310145/]