Electrochemical vs. Optical vs. Piezoelectric Biosensors: A Sensitivity and Application Comparison for Researchers
This article provides a comprehensive, comparative analysis of the sensitivity and performance of electrochemical, optical, and piezoelectric biosensors, tailored for researchers and drug development professionals.
Electrochemical vs. Optical vs. Piezoelectric Biosensors: A Sensitivity and Application Comparison for Researchers
Abstract
This article provides a comprehensive, comparative analysis of the sensitivity and performance of electrochemical, optical, and piezoelectric biosensors, tailored for researchers and drug development professionals. It explores the foundational principles and transduction mechanisms of each biosensor type, details their methodologies and real-world applications in areas like infectious disease diagnosis and therapeutic monitoring, and addresses key challenges in optimization and reproducibility. By presenting a direct, evidence-based comparison of limits of detection, susceptibility to interference, and suitability for point-of-care settings, this review serves as a critical resource for selecting and validating biosensor technologies for biomedical research and clinical translation.
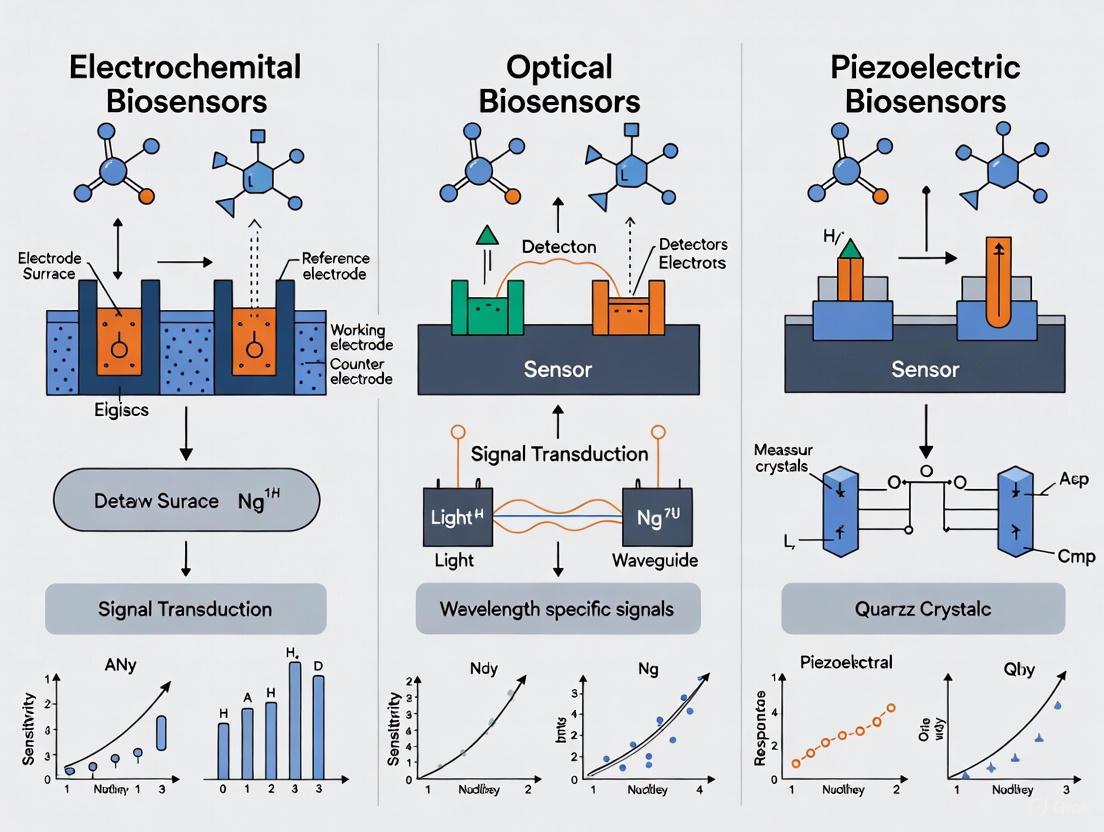
Core Principles and Transduction Mechanisms: How Biosensors Convert Biological Events into Measurable Signals
Biosensors are analytical devices that combine a biological recognition element with a physicochemical transducer to detect chemical or biological substances. The fundamental architecture of all biosensors comprises four key components: the analyte (the substance to be detected), the bioreceptor (a biological molecule that specifically binds the analyte), the transducer (which converts the biological response into a measurable signal), and the signal processor (which processes and displays the output). Researchers and drug development professionals increasingly rely on these devices for applications ranging from disease diagnosis to environmental monitoring. The performance of biosensors varies significantly across different transducer principles, with electrochemical, optical, and piezoelectric systems representing the most common technological approaches, each with distinct advantages and limitations in sensitivity, detection time, and applicability.
Comparative Performance Analysis of Biosensor Architectures
The selection of an appropriate biosensor architecture involves careful consideration of performance characteristics relative to the specific application requirements. The table below provides a structured comparison of the three primary biosensor types based on current research data.
Table 1: Performance Comparison of Electrochemical, Optical, and Piezoelectric Biosensors
| Performance Parameter | Electrochemical Biosensors | Optical Biosensors | Piezoelectric Biosensors |
|---|---|---|---|
| Sensitivity | High sensitivity for metabolic biomarkers [1] | High sensitivity; capable of single molecule detection [2] | High mass sensitivity; picogram-level detection |
| Detection Time | Fast response; real-time monitoring possible [1] | Varies; from minutes (e.g., ~90-120 min for bacterial detection [3]) to real-time with advanced systems | Rapid; frequency changes are instantaneous |
| Cost & Portability | Low cost; excellent potential for miniaturization and wearable devices [1] | Systems range from complex lab equipment to simple, low-cost colorimetric setups [3] [4] | Moderate cost; quartz crystal microbalances are portable |
| Key Applications | Disease diagnosis, therapeutic monitoring, wearable devices [1] | Bacterial detection, biomolecular interaction studies, clinical diagnostics [3] [2] | Gas detection, viscosity measurements, real-time binding kinetics |
| Limitations | Electrode fouling, signal interference in complex samples [1] | Susceptible to ambient light interference; can be instrument-heavy | Sensitive to environmental factors like temperature and viscosity |
Experimental Protocols for Biosensor Evaluation
Robust experimental validation is critical for assessing biosensor performance. The following protocols outline standard methodologies for evaluating the key biosensor types discussed.
Protocol for Electrochemical Biosensor Characterization
This protocol is adapted from studies validating sensors for biomedical applications [1].
- Electrode Modification: Immerse the working electrode (e.g., gold, glassy carbon) in a solution containing the bioreceptor (e.g., enzyme, antibody, aptamer) for a specified period to form a recognition layer.
- Electrochemical Measurement: Place the modified electrode in a buffer solution containing the target analyte. Apply a controlled potential and measure the resulting current (amperometry) or electrochemical impedance (impedimetry).
- Signal Calibration: Record the electrochemical response (e.g., current change, impedance shift) against a series of standard solutions with known analyte concentrations to generate a calibration curve.
- Real Sample Analysis: Test the sensor's performance in complex biological matrices (e.g., serum, urine) and validate the results by comparison with a standard analytical method, such as high-performance liquid chromatography (HPLC) or mass spectrometry.
Protocol for Optical Biosensor Analysis
This protocol is derived from bacterial detection methods using colorimetric and fluorescence-based sensors [3] [2].
- Sensor Preparation: Functionalize the optical substrate (e.g., nanoparticles, gel-shell beads, culture medium) with the biological recognition element.
- Sample Incubation: Introduce the sample containing the target analyte to the sensor surface or matrix and allow for binding or metabolic reaction.
- Optical Signal Acquisition: Illuminate the sensor with an appropriate light source (e.g., LED, laser) and measure the resulting optical signal change using a detector (e.g., photodiode, spectrometer, camera). Signals can include changes in color (absorbance), fluorescence intensity, or refractive index.
- Data Quantification: For colorimetric sensors, capture images and analyze RGB values or use spectrophotometry to measure absorbance at specific wavelengths. Correlate the signal intensity with analyte concentration.
Protocol for Piezoelectric Biosensor Assessment
- Crystal Functionalization: Immobilize the bioreceptor (e.g., antibody, DNA probe) onto the surface of a piezoelectric crystal (commonly quartz).
- Baseline Frequency Measurement: Place the functionalized crystal in an oscillation circuit and measure the resonant frequency in a stable buffer solution to establish a baseline.
- Analyte Binding and Measurement: Introduce the analyte solution to the crystal surface. As the analyte binds to the bioreceptor, the mass on the crystal surface increases, leading to a decrease in the resonant frequency. Monitor this frequency shift in real-time.
- Regeneration (Optional): For reusable sensors, apply a regeneration solution (e.g., low pH buffer) to dissociate the analyte-bioreceptor complex and return the crystal frequency to near its baseline, confirming the sensor's reusability.
Biosensor Architecture and Experimental Workflow
The following diagram illustrates the fundamental components and signal flow of a generalized biosensor system.
The Scientist's Toolkit: Essential Research Reagents and Materials
Successful biosensor development and experimentation rely on a suite of specialized materials and reagents. The table below details key components and their functions in a typical biosensor setup.
Table 2: Essential Research Reagents and Materials for Biosensor Development
| Reagent/Material | Function in Biosensor Architecture |
|---|---|
| Bioreceptors (Antibodies, Aptamers, Enzymes) | The molecular recognition element that provides specificity by binding to the target analyte [1]. |
| Gold Nanoparticles/Nanorods | Commonly used nanostructures for enhancing signal transduction in both electrochemical and optical (e.g., SPR, SERS) biosensors [1]. |
| Selective Culture Media (e.g., Mannitol Salt Agar) | Used in microbial biosensors to support the growth of specific bacteria and induce metabolically triggered color changes [3]. |
| Cell-Free Expression Systems (e.g., PUREfrex) | Enable the in vitro transcription and translation of genetically encoded fluorescent biosensor proteins for high-throughput screening [2]. |
| Fluorescent Dyes/Proteins (e.g., for FRET) | Act as signal reporters in optical biosensors, changing their emission properties upon analyte binding [2]. |
| Conductive Polymers (e.g., PEDOT:PSS) | Used to modify electrodes in electrochemical sensors, improving electron transfer and biocompatibility [1]. |
Advanced Integration: The Role of Artificial Intelligence
A transformative trend in biosensing is the integration of artificial intelligence (AI) and machine learning (ML) to enhance performance, particularly in the signal processing component of the architecture.
- Material Screening and Performance Prediction: ML algorithms can rapidly predict the performance of novel sensor materials and composites, accelerating the development cycle [1].
- Signal Processing and Feature Extraction: AI, especially deep learning models like Convolutional Neural Networks (CNNs), can extract complex features from sensing signals (e.g., electrochemical curves, SERS spectra, colorimetric images) to improve accuracy and suppress noise [4] [1]. For instance, CNNs have been used to achieve 100% accuracy in identifying bacterial strains from SERS spectra and 97.78% accuracy in detecting liver diseases from serum spectra [1].
- Data Interpretation in Complex Matrices: In colorimetric detection, AI models such as ColorNet can automate the analysis of raw images, correcting for variables like lighting conditions and device type, thereby reducing subjective bias and enhancing reproducibility [4]. This allows for the development of robust, smartphone-integrated sensors for point-of-care testing.
The workflow below illustrates how AI integrates into the modern biosensor framework.
Electrochemical transduction, which converts a biological recognition event into a measurable electrical signal, is a cornerstone of modern biosensing. This guide provides an objective comparison of the analytical performance of electrochemical methods against optical and piezoelectric techniques, with a specific focus on sensitivity. For researchers and drug development professionals, the choice of transduction mechanism is critical, as it directly impacts a sensor's limit of detection, scalability, and suitability for point-of-care applications.
Performance Comparison of Biosensor Transduction Methods
The following table compares the key performance characteristics of the primary biosensor transduction types, with quantitative data highlighting their capabilities in sensitivity and more.
Table 1: Comparative Analysis of Biosensor Transduction Mechanisms
| Transduction Method | Typical LoD (Concentration) | Key Advantages | Key Limitations | Ideal Application Scenarios |
|---|---|---|---|---|
| Electrochemical | ||||
| - Voltammetric (DPV, SWV) | Sub-nM to pM [5] | High sensitivity, portability, low cost, label-free operation with EIS [6] | Susceptible to electrode fouling; performance depends on electrode material and environment [5] | Point-of-care diagnostics, environmental monitoring (e.g., heavy metals, pathogens) [5] [7] |
| - Impedimetric (EIS) | fM for protein biomarkers [6] | Label-free, real-time monitoring, low power requirements [6] [7] | Low ΔRct/decade sensitivity; signal can be affected by non-specific binding [7] | Pathogen detection, real-time binding kinetics studies [7] |
| Optical | ||||
| - Plasmonic (SERS) | Single-molecule / fg mL⁻¹ [6] | Extraordinary sensitivity, rapid response, multiplexing capability [6] | Requires expensive nanostructured chips and complex optics, high cost [6] | High-sensitivity lab-based detection of viral and protein targets |
| - Chemiluminescence | nM range (similar to ELISA) [8] | High throughput, well-established protocols | Multiple incubation/washing steps, longer assay times [7] | Centralized laboratory testing |
| Piezoelectric | ng cm⁻² (mass) [6] | Label-free, real-time mass sensing | Sensitive to environmental vibrations and temperature fluctuations [6] | Gas phase sensing, study of adsorption processes |
Experimental Protocols for Key Electrochemical Techniques
To ensure reproducibility and validate performance claims, detailed experimental protocols are essential. Below are methodologies for two central electrochemical techniques used in sensitivity studies.
Protocol for Faradaic Impedimetric Biosensing
This protocol details the steps for detecting a target analyte using Faradaic Electrochemical Impedance Spectroscopy (EIS), which utilizes a redox probe to monitor changes in charge transfer resistance (Rct).
Workflow for Faradaic EIS Biosensing
Materials and Reagents:
- Working Electrode: Gold disk electrode or screen-printed carbon electrode (SPCE) [6].
- Redox Probe: 5 mM Potassium ferri/ferrocyanide [Fe(CN)₆]³⁻/⁴⁻ in buffer solution [6].
- Biorecognition Element: Target-specific antibody, aptamer, or DNA probe.
- Immobilization Reagents: Thiol-based self-assembled monolayer (SAM) reagents for gold surfaces; EDC/NHS chemistry for carbon surfaces [6].
- Blocking Agent: Bovine Serum Albumin (BSA) or ethanolamine to minimize non-specific binding.
Step-by-Step Procedure:
- Electrode Pretreatment: Clean the working electrode according to manufacturer protocols (e.g., polish with alumina slurry for disk electrodes).
- Baseline EIS: Immerse the electrode in a solution containing the redox probe. Perform an EIS measurement over a frequency range (e.g., 0.1 Hz to 100 kHz) at a fixed DC potential (e.g., open circuit potential). Record the Nyquist plot and fit the data to an equivalent circuit to determine the initial charge transfer resistance (Rct₁).
- Surface Functionalization: Immobilize the biorecognition element onto the electrode surface.
- For gold electrodes: Incubate with a thiolated antibody/aptamer to form a SAM [6].
- For carbon electrodes: Modify the surface with carboxylic acid groups, then activate with EDC/NHS to covalently bind antibodies.
- Surface Blocking: Incubate the modified electrode with a blocking agent (e.g., 1% BSA) for 30-60 minutes to cover any remaining active sites.
- Target Incubation: Expose the functionalized electrode to the sample containing the target analyte for a defined period (e.g., 20-30 minutes).
- Final EIS Measurement: Wash the electrode and perform EIS again in the redox probe solution under identical conditions to step 2. Determine the new charge transfer resistance (Rct₂).
- Data Analysis: Calculate the change in charge transfer resistance (ΔRct = Rct₂ - Rct₁). The value of ΔRct is proportional to the concentration of the captured target analyte.
Protocol for Interdigitated Electrode (IDE) Optimization
This protocol, derived from a recent study, outlines the process for optimizing electrode geometry to maximize sensitivity in non-Faradaic impedimetric biosensors [9].
Workflow for IDE Biosensor Optimization
Materials and Reagents:
- IDE Chips: Fabricated with varying electrode gaps (e.g., 3 μm, 4 μm, 5 μm) and fixed width/height [9].
- Biorecognition Element: e.g., SARS-CoV-2 spike protein.
- Target Analyte: e.g., Human anti-SARS-CoV-2 monoclonal antibody (mAb).
- Signal Amplifier: Protein G conjugated to a secondary label.
Step-by-Step Procedure:
- Computational Modeling: Construct a 3D finite element model (e.g., using COMSOL) to simulate the electric field distribution and sensitivity for different IDE geometries (gap, width, height). The simulation reveals that sensitivity correlates strongly with the inner gap between electrodes [9].
- IDE Fabrication: Based on simulation results, fabricate multiple IDE prototype chips using photolithography and thin-film deposition. For instance, create chips with electrode gaps of 3 μm, 4 μm, and 5 μm [9].
- Surface Functionalization: Immobilize the capture probe (e.g., SARS-CoV-2 spike protein) uniformly on the surface of all IDE chips.
- Experimental Validation: For each IDE geometry, incubate with a series of target analyte (mAb) concentrations (e.g., from 50 ng/mL to 500 ng/mL). Use a solution of Protein G to enhance the impedance shift.
- EIS Measurement: Perform non-Faradaic EIS measurements (without a redox probe) for each concentration and each chip type. Monitor the change in impedance modulus or capacitance.
- Determine Limit of Detection (LoD): The chip with the smallest gap (e.g., 3 μm) demonstrated the highest sensitivity, achieving detection of mAb concentrations as low as 50 ng/mL, a threshold not reached by the 4 μm and 5 μm designs [9].
Research Reagent Solutions and Materials
Table 2: Essential Research Reagents and Materials for Electrochemical Biosensing
| Item | Function in Experiment | Example Application |
|---|---|---|
| Gold (Au) Electrodes | Provides a high-conductivity, biocompatible surface easily modified with thiol chemistry [6]. | Ultra-sensitive detection of cardiac troponin I (cTnI) [6]. |
| Screen-Printed Carbon Electrodes (SPCEs) | Low-cost, disposable, and adaptable platform for mass-produced sensors [6]. | Portable environmental monitoring of heavy metals [5]. |
| Carbon Nanotubes (CNTs) | Nanomaterials used to modify electrodes, providing high surface area and facilitating electron transfer, which enhances sensitivity [5] [6]. | Detection of the chemoprotective agent Mesna [6]. |
| Redox Probes (e.g., [Fe(CN)₆]³⁻/⁴⁻) | Mediates electron transfer in Faradaic EIS measurements; change in probe's charge transfer resistance (Rct) indicates target binding [6]. | General Faradaic impedimetric sensing of proteins and nucleic acids. |
| Molecularly Imprinted Polymers (MIPs) | Synthetic, stable biorecognition elements that mimic natural antibodies [6] [7]. | Detection of targets in harsh environments where biological receptors may degrade. |
| Organic Electrochemical Transistors (OECTs) | Amplifies weak electrical signals by several orders of magnitude, improving the signal-to-noise ratio [10]. | Highly sensitive detection of arsenite in water or lactate in sweat [10]. |
The data and protocols presented herein demonstrate that electrochemical transduction methods, particularly impedimetric techniques, offer a powerful combination of high sensitivity—rivaling even the most sensitive optical methods—along with significant advantages in cost, portability, and ease of use. The ability to achieve label-free, real-time detection of biomarkers at femtomolar concentrations makes electrochemical biosensors exceptionally compelling for applications in clinical diagnostics and drug development. While optical sensors remain the gold standard for ultra-high sensitivity in centralized labs, and piezoelectric sensors excel in mass detection, electrochemical biosensors stand out as the most versatile and promising technology for the growing field of decentralized, point-of-care testing.
Biosensors function by coupling a biological recognition element with a physicochemical transducer that converts the binding event into a measurable signal. The transduction mechanism fundamentally determines key performance metrics, including sensitivity, limit of detection (LOD), multiplexing capability, and suitability for point-of-care (POC) applications [11]. Among the primary transduction classes—optical, electrochemical, and piezoelectric—each operates on distinct physical principles, leading to characteristic performance profiles and application niches. For researchers and drug development professionals, selecting the appropriate transduction technology is critical for assay development, diagnostic innovation, and therapeutic monitoring.
Optical biosensors, the focus of this guide, leverage light-matter interactions to detect analytes. These platforms utilize various phenomena, including refractive index changes, fluorescence emission, and spectroscopic shifts [12] [11]. Electrochemical biosensors, in contrast, measure electrical signals (current, potential, or impedance) resulting from biochemical reactions [13] [14]. Piezoelectric biosensors detect mass changes on a sensor surface through shifts in resonant frequency [15]. The integration of novel materials like MXenes [13], graphene [16] [17], and nanostructured metals [16] [18] has been a key driver in enhancing the sensitivity and stability of all these biosensor classes. Furthermore, the emergence of artificial intelligence (AI) is bringing a new revolution to the field, particularly for optical biosensors, by enabling intelligent signal processing and automated decision-making, thereby improving analytical performance in POC diagnostics [12].
Comparative Performance Analysis of Biosensor Technologies
The following table provides a quantitative comparison of the three major biosensor types, highlighting their key performance characteristics, advantages, and limitations. This data is synthesized from recent experimental reports and review articles.
Table 1: Performance Comparison of Major Biosensor Transduction Technologies
| Technology | Typical LOD Ranges | Key Advantages | Major Limitations | Example Applications |
|---|---|---|---|---|
| Optical | ||||
| • Surface Plasmon Resonance (SPR) | ~0.83 nM - 16.73 ng/mL [16] [18] | Label-free, real-time monitoring, high sensitivity, multiplexing capability [12] [11] | Bulky instrumentation, sensitive to ambient interference, complex data analysis [11] | Protein interaction analysis, biomarker detection (e.g., IgE, miRNA) [15] [18] |
| • Fluorescence | ~0.83 nM [18] | Extremely high sensitivity, spatial and temporal resolution, versatile [19] [18] | Often requires fluorescent labels, potential for photobleaching [18] | Pathogen detection, single-molecule diagnostics, cellular imaging [19] [17] |
| • Terahertz (THz) | Sensitivity up to 3.1043×10⁵ deg/RIU [16] | Low energy, non-destructive, rich spectral information | Requires complex source/detector, signal absorption by water | Material characterization, layer thickness monitoring [16] |
| Electrochemical | ~0.14 fM - 0.195 μΜ [17] [14] | High sensitivity, portability/miniaturization, low cost, low power requirement [13] [14] | Susceptible to electrical noise, often requires redox probes, limited multiplexing | Glucose monitoring, food safety (pathogens, toxins), wearable sensors [20] [14] |
| Piezoelectric (e.g., QCM) | ~3.0 nM [17] | Label-free, real-time, sensitive to mass changes | Sensitive to viscosity changes, difficult to use in liquid samples, low specificity | Aptamer-analyte interaction studies, detection in milk [17] |
The market dynamics reflect these technological strengths. The global biosensor market is projected to grow from USD 34.5 billion in 2025 to USD 54.4 billion by 2030, with optical biosensors expected to grow at the highest CAGR [20]. This growth is largely attributed to their versatility in applications like drug discovery and their ability to determine affinity and kinetics of molecular interactions in real-time without labels [20].
Deep Dive into Optical Transduction Mechanisms
Refractive Index-Based Sensing
Refractive index (RI)-based optical biosensors detect analytes by measuring localized changes in the RI upon molecular binding at the sensor surface. Surface Plasmon Resonance (SPR) is the most established technology in this category. It operates by exciting charge-density oscillations at a metal-dielectric interface (typically a gold film), and the resonance condition is extremely sensitive to changes in the refractive index within the evanescent field, typically within ~200 nm of the surface [12] [11].
Recent theoretical work on a graphene-coupled Otto configuration for terahertz SPR demonstrated a phase sensitivity of up to 3.1043×10⁵ deg/RIU for liquid sensing, showcasing the potential for ultra-sensitive detection [16]. Another advancement is the combination of SPR with other techniques. For instance, a novel dual-mode platform integrated Quartz Crystal Microbalance (QCM-D), a piezoelectric method, with Localized Surface Plasmon Resonance (LSPR) for the detection of penicillin G (PEN), achieving an LOD of 3.1 nM [17]. This synergy allows for the simultaneous measurement of mass change and RI change, providing a more comprehensive view of biomolecular interactions.
Fluorescence-Based Sensing
Fluorescence biosensors rely on the detection of light emitted by a fluorophore after excitation by a specific wavelength. The signal can be generated by an intrinsic fluorescent label or by a label that changes its fluorescent properties upon binding to the target.
A prime example of an advanced fluorescence methodology is the "turn-on" biosensor for miRNA-21 [18]. This sensor employs Upconversion Nanoparticles (UCNPs) as donors, which are excited by near-infrared (NIR) light to emit visible light. NIR excitation minimizes autofluorescence and light scattering from biological samples, thereby enhancing sensitivity. The sensor utilizes Graphene Oxide (GO) and a black hole quencher (BHQ2) as dual acceptors, creating a highly efficient Luminescence Resonance Energy Transfer (LRET) system that is disrupted in the presence of the target, turning the fluorescence back "on." This system achieved an impressive LOD of 0.83 nM for miRNA-21 in serum samples [18].
Fluorescent biosensors are also extensively used for multiplexed detection of foodborne pathogens like Salmonella and E. coli, where different fluorescent tags can be used to simultaneously detect multiple targets in a single assay [19].
Spectroscopic Techniques
Spectroscopic biosensors utilize the unique vibrational or scattering signatures of molecules for identification and quantification. Surface-Enhanced Raman Spectroscopy (SERS) is a powerful technique that relies on the dramatic enhancement of Raman scattering signals from molecules adsorbed on or near nanostructured metallic surfaces (e.g., gold or silver).
A recent study developed a SERS-based immunoassay using Au-Ag nanostars for the detection of the α-fetoprotein (AFP) cancer biomarker. The sharp-tipped morphology of the nanostars provides intense plasmonic enhancement, enabling an LOD of 16.73 ng/mL for AFP without the need for Raman reporters, exploiting the intrinsic vibrational modes of the target [16]. Another innovation is the development of noble-metal-free SERS substrates, such as a hybrid of MIL-101(Cr) metal-organic framework (MOF) with reduced graphene oxide (rGO), for the detection of formaldehyde, a volatile organic compound, demonstrating a path toward lower-cost sensing solutions [17].
Experimental Protocols for Key Optical Biosensing Platforms
Protocol: "Turn-on" Fluorescence miRNA Sensor
This protocol details the experimental workflow for constructing the UCNP-GO/BHQ2 LRET biosensor for miRNA-21 detection [18].
1. Sensor Fabrication and Probe Preparation:
- Synthesis of Core-Shell UCNPs: Prepare NaYF₄: Yb³⁺/Er³⁺ core UCNPs via a solvothermal method. Subsequently, grow an inert NaYF₄ shell around the core to enhance fluorescence intensity.
- Surface Functionalization: Conjugate a single-stranded DNA aptamer (H1), complementary to the target miRNA-21, onto the surface of the UCNPs to form the UCNP-H1 nanoprobe.
- Quencher Preparation: Label a complementary DNA primer (H2) with the BHQ2 quencher. Then, adsorb the H2-BHQ2 onto Graphene Oxide (GO) via π-π stacking interactions to form the dual-receptor quenching platform.
2. Assay Execution and Detection:
- Incubation: Mix the UCNP-H1 nanoprobe with the GO/H2-BHQ2 complex. The H1 strand adsorbs onto the GO surface, bringing the UCNP donor in close proximity to the GO/BHQ2 acceptors, leading to efficient LRET and fluorescence quenching ("off" state).
- Target Introduction: Introduce the sample containing target miRNA-21.
- Strand Displacement: The miRNA-21 binds to the H1 aptamer on the UCNP via toehold-mediated strand exchange. This binding is more thermodynamically favorable, causing the UCNP-H1/miRNA-21 complex to be released from the GO surface.
- Signal Measurement: The physical separation of the UCNP donor from the quenchers restores fluorescence. Measure the fluorescence intensity at 541 nm or 650 nm under NIR (980 nm) excitation. The intensity is proportional to the miRNA-21 concentration.
Diagram 1: Workflow for the "turn-on" fluorescence miRNA biosensor.
Protocol: SERS Immunoassay for Protein Biomarker Detection
This protocol outlines the steps for detecting α-fetoprotein (AFP) using a SERS platform with Au-Ag nanostars [16].
1. Substrate and Immunosensor Preparation:
- Synthesis of Au-Ag Nanostars: Synthesize spiky Au-Ag core-shell nanostars via a seed-mediated growth method. The sharp tips are critical for generating intense local electromagnetic fields ("hot spots").
- Surface Functionalization: Activate the SERS substrate using mercaptopropionic acid (MPA) to form a self-assembled monolayer. Then, use EDC/NHS carbodiimide chemistry to covalently immobilize monoclonal anti-AFP antibodies onto the nanostar surface.
2. Assay Procedure and Measurement:
- Antigen Binding: Incubate the functionalized SERS substrate with the sample containing the AFP antigen. The antigen binds specifically to the immobilized antibodies.
- Washing: Remove unbound and non-specifically bound molecules by washing to reduce background signal.
- SERS Measurement: Under laser excitation, acquire the Raman spectrum of the captured analyte on the nanostar surface. The intense SERS enhancement allows for the detection of the intrinsic vibrational fingerprint of AFP or a Raman reporter. The intensity of characteristic peaks is quantified and correlated with the AFP concentration.
Diagram 2: Workflow for the SERS immunoassay for protein detection.
The Scientist's Toolkit: Essential Research Reagents and Materials
The performance of modern optical biosensors is heavily dependent on the advanced materials used in their construction. The following table catalogs key materials and their functional roles in the featured experimental platforms.
Table 2: Essential Research Reagents and Materials for Advanced Optical Biosensors
| Material/Reagent | Function/Role in Biosensing | Example Use Case |
|---|---|---|
| Upconversion Nanoparticles (UCNPs) | Fluorescent donor; excited by NIR light to emit visible light, reducing background autofluorescence [18]. | "Turn-on" miRNA-21 sensor [18]. |
| Graphene Oxide (GO) | Two-dimensional quencher and adsorbent; provides high surface area and efficient fluorescence quenching via LRET [18]. | "Turn-on" miRNA-21 sensor [18]. |
| Black Hole Quencher (BHQ2) | Organic molecule that acts as a non-fluorescent acceptor in LRET, providing synergistic quenching [18]. | "Turn-on" miRNA-21 sensor [18]. |
| Au-Ag Nanostars | Plasmonic nanostructure; sharp tips act as "hot spots" for massive enhancement of Raman signals in SERS [16]. | SERS detection of α-fetoprotein [16]. |
| Aptamers | Single-stranded DNA or RNA molecules that bind specific targets with high affinity; used as recognition elements [15] [17]. | Detection of IgE, penicillin G, and miRNAs [15] [18] [17]. |
| MXenes | Two-dimensional conductive nanomaterials; enhance sensitivity and stability in electrochemical and optical sensors [13] [11]. | Wearable and flexible biosensing platforms [13] [11]. |
| Polydimethylsiloxane (PDMS) | Flexible, transparent polymer substrate; provides biocompatibility and mechanical adaptability for wearable sensors [11]. | Flexible optical biosensor platforms [11]. |
| EDC/NHS Chemistry | Cross-linking reagents used to covalently conjugate biomolecules (e.g., antibodies) to sensor surfaces via carboxyl-amine coupling [16]. | Immobilization of antibodies on SERS substrates [16]. |
The comparative analysis of biosensor transduction technologies reveals a clear trajectory toward hybridization and material-driven innovation. While electrochemical sensors lead in portability and cost for applications like glucose monitoring, optical biosensors offer superior sensitivity, label-free operation, and powerful multiplexing capabilities, making them indispensable for advanced research and clinical diagnostics [12] [20] [11]. The future of optical biosensing is being shaped by the convergence of multiple disciplines: the development of novel nanomaterials like UCNPs and graphene hybrids [18], the integration with other sensing modalities like QCM [17], and the application of AI for data analysis and system optimization [12]. These advancements are paving the way for highly sensitive, robust, and intelligent biosensing systems that will profoundly impact drug discovery, personalized medicine, and point-of-care diagnostics.
Biosensors are analytical devices that convert a biological recognition event into a measurable signal, playing a critical role in medical diagnostics, environmental monitoring, and drug development. The core of any biosensor is its transducer, the component that transforms the biological interaction into a quantifiable output. Among the various transduction principles, piezoelectric transduction stands out for its unique ability to directly detect mass changes through mechanical resonance. This guide provides a detailed, objective comparison of piezoelectric biosensors against two other predominant types: electrochemical and optical biosensors, with a specific focus on their sensitivity and operational characteristics. The performance of these biosensors is critically evaluated within the context of a broader thesis on sensitivity comparison, providing researchers and scientists with the experimental data and methodologies needed for informed technology selection.
The fundamental requirement for rapid, accurate, and accessible diagnostics, particularly highlighted during the COVID-19 pandemic, has significantly accelerated the development and adoption of various point-of-care biosensors. The ideal point-of-care test should meet the REASSURED criteria, encompassing Real-time connectivity, Ease of sample collection, Affordability, Sensitivity, Specificity, User-friendliness, Rapid and robust operation, Equipment-free, and Deliverability to end-users [21]. This framework provides a valuable lens through which to evaluate the practical potential of the biosensor technologies discussed herein.
Principles of Piezoelectric Transduction
Core Mechanism and the Piezoelectric Effect
Piezoelectric biosensors operate on the direct piezoelectric effect, a physical phenomenon discovered by the Curie brothers in 1880, where certain materials generate an electric charge in response to applied mechanical stress [22] [23]. This effect is reversible; applying an electric field to these materials causes mechanical deformation. The most common application of this principle in biosensing is the Quartz Crystal Microbalance (QCM), which consists of a thin plate of quartz (an anisotropic crystal) coated on both sides with metallic electrodes, typically gold [24] [25].
When an alternating voltage is applied to the electrodes, it excites mechanical vibrations in the quartz crystal at its characteristic resonant frequency. When a target analyte, such as a protein or pathogen, binds to a recognition layer (e.g., an antibody) immobilized on the sensor surface, it adds mass to the oscillating system. This increase in mass causes a measurable decrease in the crystal's resonant frequency. The relationship between the bound mass and the frequency shift is quantitatively described by the Sauerbrey equation, which states that the change in frequency (Δf) is directly proportional to the mass change (Δm) [24] [22]:
Δf = -2f₀²Δm / [A(ρqμq)^1/2]
Where f₀ is the fundamental resonant frequency, A is the active area of the electrode, and ρq and μq are the density and shear modulus of quartz, respectively [24]. This direct mass-sensing capability is the hallmark of piezoelectric transduction.
Operational Modes and Measurement Setups
Piezoelectric sensors can operate in different modes depending on how the force is applied relative to the crystal's cut: transverse, longitudinal, or shear mode [23]. For biosensing applications in liquid environments, the shear mode is most commonly used. A significant practical challenge is that the Sauerbrey equation is strictly valid only for rigid layers in air or vacuum. Measurements in liquid media are complicated by the viscosity and density of the solution, which also cause a frequency shift, as described by the Kanazawa and Gordon equation [24] [22]. To address this, advanced measurement techniques like QCM with Dissipation monitoring (QCM-D) have been developed. QCM-D not only tracks the frequency shift (Δf) related to mass but also monitors the energy dissipation (ΔD), which provides information about the viscoelastic properties of the adlayer and helps in interpreting data from soft, non-rigid biological layers in solution [24] [25].
Two primary electronic methods are used to drive the piezoelectric resonator and measure the frequency shift:
- Active Method: The crystal is part of an oscillator circuit, and its output frequency is directly measured using a frequency counter. Sensitivity can be enhanced by mixing the output with a reference frequency to create a lower beat frequency for easier measurement [24].
- Passive Method: This approach uses impedance spectroscopy to analyze the electrical characteristics of the crystal across a range of frequencies, identifying the resonant frequency from the impedance spectrum [24] [25].
Comparative Analysis of Biosensor Performance
The following tables provide a structured comparison of the core characteristics, performance data, and practical considerations for piezoelectric, electrochemical, and optical biosensors, synthesizing information from recent research.
Table 1: Fundamental comparison of biosensor transduction principles.
| Feature | Piezoelectric Biosensors | Electrochemical Biosensors | Optical Biosensors |
|---|---|---|---|
| Transduction Principle | Mass change → Frequency shift [24] | Biochemical reaction → Electrical signal (current, potential, impedance) [21] | Refractive index/light interaction → Optical signal (wavelength, intensity) [21] |
| Primary Measured Signal | Change in resonant frequency (Hz) [24] | Current (A), Potential (V), or Impedance (Ω) [21] | Shift in resonance wavelength (nm) or intensity [21] [26] |
| Key Equation/Model | Sauerbrey equation [24] [22] | Nernst equation, Faraday's law [21] | Fresnel equations, Surface Plasmon Resonance (SPR) models [21] |
| Label-Free Detection | Yes, direct [24] [25] | Often requires labels (e.g., enzymes); label-free with EIS [21] | Yes (e.g., SPR, LSPR) [21] [17] |
| Real-Time Monitoring | Yes [24] [25] | Yes | Yes |
Table 2: Comparison of experimental sensitivity and performance data.
| Parameter | Piezoelectric Biosensors | Electrochemical Biosensors | Optical Biosensors |
|---|---|---|---|
| Typical Limit of Detection (LOD) | PEMC sensors: 20 pg/Hz [27]; QCM for carbaryl: 0.14 ng/mL [24] | Varies with technique; generally very high sensitivity [21] | High accuracy; e.g., SPR/LSPR for antibiotics: ~3 nM [17] |
| Reported Mass Sensitivity | Piezoelectric-coupled microcantilevers: 8% voltage change per 0.1 fg [28] | Not primarily a mass sensor | Not primarily a mass sensor |
| Dynamic Range | PEMC sensors: up to 6 orders of magnitude [27] | Wide dynamic range [21] | Wide dynamic range [21] |
| Response Time | Seconds to minutes for binding events | Rapid (seconds) [21] | Rapid (seconds) [21] |
| Multiplexing Capability | Moderate (sensor arrays) [22] | High (multi-electrode arrays) [21] | High (array-based imaging) [21] [26] |
Table 3: Practical considerations for research and development.
| Aspect | Piezoelectric Biosensors | Electrochemical Biosensors | Optical Biosensors |
|---|---|---|---|
| Inherent Advantages | Direct mass quantification, real-time kinetics, reusability, cost-effective instrumentation [24] [25] | High sensitivity, low cost, portability, miniaturization, POC compatibility [21] | High accuracy, low electromagnetic interference, low noise, high multiplexing potential [21] [26] |
| Key Limitations | Signal interference from liquid viscosity, complex data interpretation for viscoelastic layers, limited scalability for very high frequencies [24] [22] | Susceptible to electronic noise, often requires redox labels or mediators [21] | Bulky and expensive instrumentation, sensitivity to ambient light, complex data analysis [21] |
| Suitability for POC | Moderate (equipment can be portable but not yet equipment-free) [22] | High (e.g., glucose meters) [21] [22] | Low for decentralized settings (due to cost and size) [21] |
Experimental Protocols for Key Measurements
Protocol: Mass Sensitivity Measurement for a QCM Biosensor
This protocol outlines the steps to determine the mass-change sensitivity of a Quartz Crystal Microbalance biosensor, fundamental to piezoelectric transduction research [24] [22].
- Objective: To establish a calibration curve between resonant frequency shift (Δf) and the mass of analyte bound to the sensor surface, and to determine the limit of detection (LOD).
- Materials & Reagents:
- QCM sensor chip (e.g., AT-cut quartz with gold electrodes).
- QCM instrument with flow cell and temperature control.
- Phosphate Buffered Saline (PBS) for baseline stabilization.
- Ethanol and water for cleaning.
- Recognition molecule solution (e.g., specific antibody or aptamer).
- Coupling chemistry reagents (e.g., EDC/NHS for carboxyl groups, thiol-based linkers for gold surfaces).
- Blocking agent (e.g., Bovine Serum Albumin - BSA).
- Analyte solutions at known, serially diluted concentrations.
- Procedure:
- Sensor Preparation: Clean the QCM chip with ethanol and water, then dry with nitrogen gas.
- Baseline Establishment: Mount the chip in the flow cell and perfuse with PBS at a constant flow rate until a stable frequency baseline (f₀) is achieved.
- Surface Functionalization: Immobilize the recognition element onto the gold electrode surface. A common method is to form a self-assembled monolayer (SAM) using thiolated antibodies or aptamers, exploiting gold-thiol interactions [21] [24].
- Blocking: Perfuse with a BSA solution to block any non-specific binding sites on the sensor surface.
- Sample Measurement: Introduce the analyte solution at a specific concentration and monitor the frequency decrease (Δf) in real-time until saturation is reached.
- Regeneration (Optional): For reusable sensors, use a mild acidic or basic solution to dissociate the analyte from the recognition layer, returning the frequency close to baseline.
- Replication: Repeat steps 5 and 6 for at least three different analyte concentrations.
- Data Analysis:
- Plot the steady-state Δf for each concentration against the known analyte concentration or mass.
- Perform linear regression to obtain the slope of the curve, which represents the sensitivity (Hz/M or Hz/g).
- Calculate the Limit of Detection (LOD) using the formula: LOD = 3σ/S, where σ is the standard deviation of the blank signal (buffer alone) and S is the sensitivity of the calibration curve [21].
Protocol: Comparing Transducer Surfaces with Nanomaterial Enhancements
This experiment investigates how nanomaterials can boost the performance of different biosensor types, a key area of modern research [21] [26].
- Objective: To compare the sensitivity enhancement achieved by modifying piezoelectric (QCM), electrochemical, and optical (SPR) transducer surfaces with graphene-based nanomaterials.
- Materials & Reagents:
- QCM chips, screen-printed carbon electrodes (for electrochemical), and SPR sensor chips.
- Graphene Oxide (GO) and reduced Graphene Oxide (rGO) dispersions.
- Common recognition element (e.g., a specific DNA aptamer).
- Common target analyte.
- Electrochemical workstation, QCM instrument, and SPR instrument.
- Procedure:
- Nanomaterial Functionalization:
- For QCM: Deposit GO or rGO onto the gold electrode surface via drop-casting or electrophoretic deposition.
- For Electrochemical: Modify the working electrode surface with GO/rGO to enhance electron transfer and surface area.
- For SPR: Create a thin film of GO/rGO on the gold sensor chip to enhance the refractive index shift and plasmonic coupling [26].
- Bioreceptor Immobilization: Immobilize the same aptamer onto all three modified sensor platforms using a consistent coupling chemistry.
- Testing: For each sensor type, measure the dose-response to the same set of analyte concentrations. For QCM, measure Δf; for electrochemical, measure current via DPV or impedance via EIS; for SPR, measure the resonance wavelength shift.
- Nanomaterial Functionalization:
- Data Analysis:
- Compare the LOD and sensitivity (slope of the calibration curve) for each sensor platform (with and without nanomaterial).
- Note that while graphene itself lacks intrinsic piezoelectricity, its integration with piezoelectric substrates can augment performance by improving the transducer's properties [26].
Visualization of Biosensor Transduction Pathways
The following diagram illustrates the core signal transduction pathways for the three biosensor types, highlighting the conversion of a biological event into a measurable signal.
The Scientist's Toolkit: Essential Research Reagents and Materials
Table 4: Key reagents and materials for developing and working with piezoelectric biosensors.
| Item | Function/Description |
|---|---|
| AT-cut Quartz Crystals | The piezoelectric substrate of choice for QCM due to its stable temperature frequency characteristic [24] [25]. |
| Gold Electrode Chips | Provide an inert, easily functionalizable surface for immobilizing biorecognition elements via thiol-gold chemistry [24]. |
| Thiolated Aptamers/Antibodies | Common biorecognition elements; the thiol group allows for covalent, oriented immobilization on gold surfaces [21] [24]. |
| EDC/NHS Coupling Kit | Chemicals used for carbodiimide crosslinking; activate carboxyl groups on surfaces for covalent attachment of proteins or other ligands [24]. |
| BSA or Casein | Blocking agents used to passivate unreacted sites on the sensor surface, minimizing non-specific binding [24]. |
| Flow Cell System | Allows for controlled introduction of samples and buffers, enabling real-time monitoring of binding events in solution [24]. |
| Oscillator Circuit (e.g., 74LS320) | Active electronic component that drives the piezoelectric crystal and produces an oscillating signal whose frequency is measured [24] [25]. |
| Impedance Analyzer | Instrument for passive measurement of the piezoelectric resonator's characteristics, an alternative to oscillator-based methods [24]. |
The Role of Nanomaterials in Enhancing Signal Transduction and Sensitivity
The development of high-sensitivity biosensors is a critical focus in scientific research, driven by demands from medical diagnostics, environmental monitoring, and food safety. A fundamental challenge in this field is the detection of ultralow analyte concentrations within complex sample matrices, which requires exceptional sensor sensitivity and robustness. Signal transduction—the process of converting a biological recognition event into a quantifiable physical signal—lies at the heart of biosensor performance. Nanomaterials have emerged as transformative components in biosensor design, significantly enhancing transduction efficiency and sensitivity across various sensing platforms. Their unique physicochemical properties, including high surface-to-volume ratios, exceptional electrical conductivity, and tunable surface chemistry, enable unprecedented signal amplification capabilities. This review provides a systematic comparison of how nanomaterials enhance signal transduction in three principal biosensor architectures: electrochemical, optical, and piezoelectric systems, offering researchers a foundation for selecting appropriate nanomaterial-sensor combinations for specific applications.
Performance Comparison of Nanomaterial-Enhanced Biosensing Platforms
The integration of nanomaterials differentially enhances the performance metrics of biosensing platforms depending on their underlying transduction mechanism. The table below provides a quantitative comparison of the three major biosensor types, highlighting the distinct performance advantages conferred by nanomaterial incorporation.
Table 1: Performance Comparison of Nanomaterial-Enhanced Biosensing Platforms
| Sensor Type | Key Nanomaterials Used | Detection Limit | Key Advantages | Common Applications |
|---|---|---|---|---|
| Electrochemical | Gold nanoparticles (AuNPs), graphene/CNTs, MOFs/COFs, quantum dots | Attomolar (aM) to femtomolar (fM) range [29] | High sensitivity, portability, cost-effectiveness, rapid response, compatibility with miniaturization [30] [31] | Pathogen detection [31], biomarker monitoring [29], folic acid detection [32] |
| Optical | Au/Ag nanoparticles, carbon-based nanomaterials, quantum dots, polymeric nanostructures | Nanomolar (nM) to picomolar (pM) range [33] | Visual readout (colorimetric), multiplexing capability, high spatial resolution | Food contaminants, environmental pollutants, clinical diagnostics (e.g., SARS-CoV-2) [33] |
| Piezoelectric | Noble metal nanoparticles, metal oxides | Varies with mass change; enhanced by NPs [34] | Label-free detection, real-time monitoring, high mass sensitivity | Detection of antibodies, DNA, pathogens via mass change [34] |
Enhancement Mechanisms and Experimental Protocols
Electrochemical Biosensors
Enhancement Mechanisms: In electrochemical biosensors, nanomaterials function as exceptional signal amplifiers through multiple mechanisms. They provide large surface areas that increase biorecognizer and receptor immobilization density, facilitate rapid electron transfer acting as "electron wires," and catalyze electrochemical reactions [34]. Porous nanomaterials like Metal-Organic Frameworks (MOFs) and Covalent Organic Frameworks (COFs) are particularly effective, offering ultrahigh surface areas and tunable porosity that enable high-capacity probe loading and enhanced electrochemical reactivity [29]. Composite structures that combine different nanomaterials often create synergistic effects for further signal amplification.
Table 2: Key Nanomaterial Functions in Electrochemical Biosensors
| Nanomaterial | Primary Function | Impact on Performance |
|---|---|---|
| Gold Nanoparticles (AuNPs) | Electron transfer facilitation, antibody immobilization [34] | Enhanced conductivity and signal amplification |
| Graphene/CNTs | Increased surface area, efficient electron transfer [31] [29] | Higher biomolecule loading, faster response |
| MOFs/COFs | High-capacity probe carriers, selective molecular transport [29] | Ultra-low detection limits (attomolar) |
| Quantum Dots | Redox probes, electrochemiluminescence [31] | Signal amplification via optoelectronic mechanisms |
Experimental Protocol: Attomolar Immunosensing Using MOF-Based Platform
- Objective: Achieve attomolar detection of disease biomarkers using MOF-enhanced electrochemical immunosensing [29].
- Materials: Working electrode (e.g., screen-printed carbon electrode), MOF nanoparticles (e.g., ZIF-8), target-specific antibodies, redox mediators (e.g., ferrocene, methylene blue), electrochemical analyzer.
- Procedure:
- Electrode Modification: Synthesize MOF nanoparticles using solvothermal methods and deposit them onto the working electrode surface.
- Bioreceptor Immobilization: Covalently conjugate specific antibodies to the MOF surface, utilizing the high surface area for dense, oriented immobilization.
- Sample Incubation: Expose the functionalized electrode to samples containing the target analyte for a specified period.
- Electrochemical Measurement: Employ voltammetry (e.g., cyclic or square wave) with redox mediators. Monitor current changes proportional to target concentration.
- Signal Amplification: The porous MOF structure increases antibody loading and facilitates efficient electron transfer, while integrated enzymatic or catalytic systems provide additional signal enhancement.
Optical Biosensors
Enhancement Mechanisms: Nanomaterials enhance optical biosensors by intensifying signals in colorimetric, fluorescence, surface plasmon resonance (SPR), and surface-enhanced Raman spectroscopy (SERS) platforms. Noble metal nanoparticles like gold and silver exhibit localized surface plasmon resonance (LSPR), generating strong electromagnetic fields that dramatically enhance optical signals [35] [34]. In fiber-optic LSPR biosensors, functionalized graphene oxide (GO) and gold nanoparticles create highly sensitive probes for biomarkers like creatinine [35]. Carbon-based nanomaterials such as graphene quantum dots provide stable fluorescence with wavelength-controllable emissions, while nanozymes (nanomaterial-based enzyme mimics) offer robust catalytic activity for colorimetric detection.
Experimental Protocol: LSPR-Based Fiber-Optic Biosensing
- Objective: Detect biomarkers (e.g., creatinine) using a fiber-optic LSPR biosensor with nanomaterial enhancement [35] [36].
- Materials: Optical fiber, gold nanoparticles (AuNPs), graphene oxide (GO), specific enzyme (e.g., keratinase for creatinine), light source, spectrometer.
- Procedure:
- Probe Fabrication: Functionalize the fiber optic tip with AuNPs to create LSPR conditions.
- Nanocomposite Formation: Layer GO sheets onto the AuNP surface to increase enzyme binding sites and biocompatibility.
- Enzyme Immobilization: Conjugate specific biorecognition elements (e.g., enzymes) to the GO surface.
- Measurement: Expose the probe to the sample solution. Biomarker binding alters the local refractive index.
- Signal Detection: Monitor shifts in the resonance wavelength peak using a spectrometer. The shift magnitude correlates with analyte concentration, with nanomaterials significantly amplifying the optical response.
Piezoelectric Biosensors
Enhancement Mechanisms: Piezoelectric biosensors detect mass changes on a sensor surface resulting from biomolecular binding events. Nanomaterials enhance their sensitivity by increasing the effective surface area for bioreceptor immobilization and the mass load per binding event [34]. Noble metal nanoparticles and metal oxides can serve as platforms for immobilizing recognition elements like antibodies or DNA sequences. The high surface area of these nanomaterials allows for greater receptor density, improving the capture efficiency of target analytes and thus amplifying the measurable mass change and resonant frequency shift [34]. Comparative studies indicate that triboelectric nanogenerators (TENGs) incorporating nanomaterials can demonstrate superior power performance at low frequencies (<4 Hz) compared to piezoelectric generators (PGs), making them particularly suitable for harvesting energy from human motion [37].
Signaling Pathways and Experimental Workflows
The following diagrams illustrate the fundamental signaling pathways and experimental workflows for nanomaterial-enhanced biosensors.
Electrochemical Sensor Signaling Pathway
Diagram 1: Electrochemical Sensor Signal Pathway
Optical Biosensor Workflow
Diagram 2: Optical Biosensor Workflow
Comparative Sensor Selection Logic
Diagram 3: Biosensor Platform Selection Logic
The Scientist's Toolkit: Essential Research Reagents and Materials
Table 3: Essential Research Reagents and Nanomaterials for Biosensor Development
| Material/Reagent | Function | Example Applications |
|---|---|---|
| Gold Nanoparticles (AuNPs) | LSPR generation, electron transfer enhancement, biomolecule immobilization [35] [34] | Colorimetric assays, electrochemical signal amplification |
| Graphene Oxide (GO) | Large surface area for immobilization, fluorescence quenching, biocompatibility enhancement [35] | LSPR fiber-optic sensors, electrochemical platforms |
| Carbon Nanotubes (CNTs) | Efficient electron transfer, high aspect ratio, biomolecule carrier [31] | Electrochemical immunosensors, enzyme-based biosensors |
| Metal-Organic Frameworks (MOFs) | Ultrahigh surface area carriers, tunable porosity, enhanced probe loading [29] | Attomolar-level electrochemical immunosensing |
| Quantum Dots (QDs) | Fluorescent labeling, redox probes, electrochemiluminescence [31] | Fluorescent biosensors, electrochemical signal tags |
| Specific Bioreceptors | Target recognition (antibodies, aptamers, enzymes) [31] | All affinity-based biosensors |
| Screen-Printed Electrodes | Disposable, customizable electrochemical platforms [31] | Portable electrochemical biosensors |
| Redox Mediators | Facilitate electron transfer in electrochemical systems [31] | Voltammetric/amperometric sensors |
The integration of nanomaterials into biosensing platforms has fundamentally advanced the capabilities of signal transduction and sensitivity across electrochemical, optical, and piezoelectric systems. Each platform offers distinct advantages: electrochemical sensors achieve unparalleled sensitivity to the attomolar level, enabled by the superior electron transfer and loading capacity of materials like MOFs and AuNPs. Optical platforms provide versatile visual readouts and multiplexing capabilities enhanced by plasmonic nanoparticles and carbon-based nanomaterials. Piezoelectric systems benefit from the mass-enhancing properties of nanomaterials for label-free detection. The choice of platform and nanomaterial must align with specific application requirements, including desired detection limits, sample matrix, and need for portability. Future developments will likely focus on multifunctional nanocomposites, microfluidic integration, and AI-assisted sensor design, further pushing detection limits toward single-molecule resolution and expanding the frontiers of diagnostic capabilities.
Methodologies and Real-World Applications: From Glucose Monitoring to Pathogen Detection
Dominant Market and Clinical Applications of Electrochemical Biosensors (e.g., Glucose Monitoring)
Electrochemical biosensors have revolutionized diagnostic medicine by offering rapid, sensitive, and quantitative analysis of clinically relevant biomarkers. These devices integrate biological recognition elements with electrochemical transducers to convert biological interactions into quantifiable electrical signals [38]. Since the pioneering development of the first enzyme-based electrode by Clark and Lyons in 1962, electrochemical biosensors have dominated the commercial biosensor market, accounting for approximately 72% of the worldwide market share [39]. This dominance is particularly evident in point-of-care testing and continuous monitoring applications, where their advantages in miniaturization, cost-effectiveness, and operational simplicity are paramount [40] [38].
The global biosensors market, valued at $32.3 billion in 2024, demonstrates the significant impact of this technology, with electrochemical biosensors representing the largest technology segment at $13.4 billion in the same year [41]. Projections indicate continued robust growth, with the overall biosensors market expected to reach $68.5 billion by 2034, expanding at a compound annual growth rate (CAGR) of 7.9% [41]. This growth trajectory is largely fueled by the increasing prevalence of chronic diseases requiring frequent monitoring, particularly diabetes, and the accelerating transition toward decentralized healthcare and personalized medicine [42] [41].
Market Dominance and Segmentation
The electrochemical biosensors market demonstrates impressive global expansion driven by technological advancements and growing diagnostic needs. North America currently leads the market, holding approximately 45% of the global share, supported by advanced healthcare infrastructure, significant R&D investments, and a high prevalence of chronic diseases [42]. Key players such as Abbott Laboratories, Medtronic, and Johnson & Johnson maintain a strong competitive presence in this region [42].
Europe represents the second-largest market, accounting for about 30% of the global share, with growth catalyzed by stringent regulatory frameworks and increasing focus on personalized medicine [42]. Companies like Roche Diagnostics and Siemens Healthineers are prominent contributors to the regional market dynamics [42].
The Asia-Pacific region is emerging as the fastest-growing market, propelled by increasing healthcare investments, growing population, and rising awareness of chronic diseases [40] [42]. This region is expected to exhibit the most rapid growth, with China and India representing key markets driving demand for affordable and efficient healthcare solutions [40].
Table: Global Market Snapshot for Electrochemical Biosensors
| Region | Market Share (2024) | Key Growth Drivers | Leading Players |
|---|---|---|---|
| North America | ~45% | High healthcare expenditure, technological advancement, chronic disease prevalence | Abbott Laboratories, Medtronic, Johnson & Johnson [42] |
| Europe | ~30% | Stringent regulatory frameworks, focus on personalized medicine & POCT | Roche Diagnostics, Siemens Healthineers [42] |
| Asia-Pacific | ~20% | Growing healthcare investments, rising awareness, large population | Biosensors International Group, local and international players [40] [42] |
| Rest of the World | ~5% | Increasing healthcare needs, rising investments in medical technology | Mix of local and international players [42] |
Application and End-User Segmentation
Electrochemical biosensors serve diverse applications across healthcare and environmental monitoring. The blood glucose testing segment dominates the application landscape, with the market valued at $13.6 billion in 2024 [41]. This segment's dominance is directly linked to the global diabetes epidemic, with the International Diabetes Federation reporting approximately 537 million adults living with diabetes in 2021 [41].
Other significant applications include:
- Cholesterol testing: For cardiovascular disease risk assessment
- Infectious disease testing: For rapid pathogen detection
- Drug discovery: Supporting high-throughput screening
- Environmental monitoring: Detecting pollutants and contaminants [40] [41]
The point-of-care testing (POCT) segment represents the largest end-user category, valued at $16.4 billion in 2024 [41]. The growth in this segment is attributed to the demand for rapid results that enable immediate clinical decision-making, particularly in emergency care and chronic disease management [41]. Home healthcare diagnostics represents another rapidly growing segment, fueled by the increasing preference for self-monitoring and decentralized healthcare [42].
Table: Electrochemical Biosensors Market Segmentation (2024)
| Segment Type | Dominant Category | Market Size (2024) | Key Examples/Applications |
|---|---|---|---|
| By Technology | Electrochemical | $13.4 billion (41.6% share) [41] |
Glucose meters, cardiac biomarker detection, blood gas analyzers [41] |
| By Application | Blood Glucose Testing | $13.6 billion [41] |
Continuous Glucose Monitoring (CGM), self-monitoring systems [43] [41] |
| By Product | Wearable Biosensors | Growing segment | Fitness trackers, continuous health monitors [40] |
| By End User | Point-of-Care Testing | $16.4 billion [41] |
Clinic-based testing, bedside monitoring, home testing kits [40] [41] |
Dominant Clinical Applications
Glucose Monitoring: The Paradigm for Success
Glucose monitoring represents the most successful clinical application of electrochemical biosensors, accounting for a significant portion of the commercial market [44]. The development of electrochemical glucose sensors has evolved through four distinct generations, each marked by improvements in electron transfer mechanisms and reduced susceptibility to interference [43].
First-generation sensors utilized oxygen as a natural mediator, measuring oxygen consumption or hydrogen peroxide production during glucose oxidation [43]. While revolutionary, these sensors were susceptible to oxygen deprivation and interference from electroactive substances [43].
Second-generation sensors incorporated artificial redox mediators (e.g., ferrocene derivatives, ferricyanide) to shuttle electrons between the enzyme and electrode, overcoming oxygen dependence and operating at lower potentials [43]. This advancement significantly improved detection precision and formed the basis for most commercial glucose monitoring systems [44] [43].
Third-generation sensors achieved direct electron transfer between the enzyme and electrode without mediators, utilizing advanced electrode materials and immobilization techniques [43]. Nanomaterials such as gold nanoparticles, carbon nanotubes, and graphene facilitated efficient electron exchange by bridging the spatial barrier of the enzyme's embedded active center [43].
Fourth-generation sensors employ enzyme-free technologies that leverage nanostructured electrodes with large surface areas and exceptional electrocatalytic properties for direct glucose oxidation [43]. These sensors address limitations of enzymatic sensors, including deactivation, toxicity, and stringent environmental requirements, thereby enhancing stability and reproducibility [43].
The continuous glucose monitoring (CGM) systems represent the cutting edge in glucose monitoring technology. Leading commercial systems like the Dexcom G series and Medtronic's Guardian Connect offer real-time tracking of glucose levels with wearable form factors that integrate seamlessly with smartphone applications for data visualization and alerts [43] [41].
Expanding Clinical Applications
Beyond glucose monitoring, electrochemical biosensors are increasingly deployed for diverse clinical applications:
Infectious Disease Diagnostics: Electrochemical biosensors enable rapid detection of pathogenic protozoa including Plasmodium (malaria), Leishmania, Toxoplasma, Trypanosoma, and Giardia [45]. These biosensors offer significant advantages over conventional methods like microscopy, immuno-detection, and PCR, which can be time-consuming, complex, and expensive [45]. Nanomaterial-based biosensors demonstrate particularly high specificity and sensitivity for detecting protozoan parasite markers, providing valuable tools for controlling disease transmission [45].
Cancer Biomarker Detection: Recent advances have enabled sensitive detection of protein cancer biomarkers such as Prostate-Specific Antigen (PSA) [46]. Chinese researchers developed a biosensing system using gold nanofiber-modified screen-printed carbon electrodes (SPCE) that achieved a detection limit of 0.28 ng/mL (8.78 fM) for PSA, demonstrating the potential for early cancer diagnosis [46]. Similar approaches are being applied for biomarkers associated with breast, ovarian, and lung cancers [38].
Neurodegenerative Disorder Management: Electrochemical biosensors are emerging as valuable tools for detecting biomarkers associated with Alzheimer's and Parkinson's diseases [38]. For instance, researchers have developed sensors for phosphorylated α-synuclein in human blood for Parkinson's diagnosis, and for miRNA-34a as a potential Alzheimer's disease biomarker [38]. These developments support earlier diagnosis and therapeutic monitoring for challenging neurological conditions.
Cardiovascular Disease Risk Assessment: Cholesterol biosensors represent another significant application segment, allowing for rapid assessment of cardiovascular disease risk factors [41]. The growing global burden of cardiovascular diseases, affecting approximately 620 million people according to the British Heart Foundation, underscores the importance of these diagnostic tools [41].
Performance Comparison of Biosensor Technologies
Fundamental Operational Characteristics
Biosensing technologies are fundamentally classified based on their energy transfer mechanisms. For electrochemical biosensors, this differentiates between Faradaic and non-Faradaic processes, while photonic biosensors are separated into refractive index sensing and fluorescence/vibrational spectroscopy [39].
Faradaic electrochemical biosensors involve charge transfer to/from an electrode, typically through chemical reduction or oxidation reactions [39]. These sensors measure current resulting from redox reactions and include techniques such as amperometry and voltammetry. The most common example is the glucose biosensor based on glucose oxidase [44] [39].
Non-Faradaic electrochemical biosensors quantify changes in capacitance or charge distribution at the electrode-electrolyte interface without net electron transfer [39]. Electrochemical Impedance Spectroscopy (EIS) is a prominent non-Faradaic method that measures impedance changes resulting from biomarker binding to the sensor surface [39].
Refractive index photonic biosensors detect changes in the local refractive index induced by biomarker binding to the sensor surface [39]. Techniques include surface plasmon resonance (SPR), microring resonators, and Mach-Zehnder interferometers, which transduce binding events into measurable optical signals [39].
Fluorescence-based photonic biosensors rely on light emission from labeled molecules and measure intensity changes resulting from binding events [39]. These sensors typically offer high sensitivity but require labeling steps that can complicate the assay [39].
Table: Comparison of Major Biosensor Transduction Technologies
| Parameter | Electrochemical (Faradaic) | Electrochemical (Non-Faradaic) | Photonic (Refractive Index) | Photonic (Fluorescence) | Piezoelectric |
|---|---|---|---|---|---|
| Measured Quantity | Current from redox reactions [44] | Impedance/Capacitance changes [39] | Refractive index changes [39] | Light intensity [39] | Mass change [44] |
| Key Advantage | High sensitivity, low cost, portability [38] | Label-free, real-time monitoring [39] | Label-free, multiplexing capability [39] | Ultra-high sensitivity, multiplexing [39] | Label-free [44] |
| Primary Limitation | Susceptible to electrode fouling [39] | Susceptible to non-specific binding [39] | Bulk refractive index sensitivity [39] | Requires labeling [39] | Limited by viscosity of medium [44] |
| Common Clinical Use | Glucose monitoring, metabolite detection [44] | Affinity-based detection, DNA sensors [39] | Biomolecular interaction analysis [39] | High-sensitivity assays [39] | Gas detection, small molecule detection [44] |
| Approx. Market Share | ~72% of biosensor market [39] | Part of electrochemical segment | ~14% of biosensor market [39] | Part of optical segment | Minor segment |
Analytical Performance Metrics
The analytical performance of electrochemical biosensors demonstrates distinct advantages in clinical settings, particularly for point-of-care applications. Their sensitivity often reaches nanomolar to picomolar detection limits, sufficient for most clinical biomarkers [46]. For example, advanced electrochemical aptasensors have achieved detection limits as low as 0.55 fg/mL for endotoxin detection [46].
The selectivity of electrochemical biosensors stems from the specific binding between biological recognition elements (enzymes, antibodies, aptamers) and target analytes [38] [46]. This specificity minimizes interference from complex biological matrices, though non-specific binding remains a challenge that nanomaterials and surface modifications help address [39].
Response time is a particular strength of electrochemical biosensors, with many assays providing results within minutes [38]. This rapid analysis is crucial for point-of-care testing where immediate clinical decisions are necessary [41].
The susceptibility to fouling and matrix effects represents a significant challenge for electrochemical biosensors, as the electrochemical double layer extends only <10 nm from the electrode surface, making the signal highly sensitive to surface contamination and non-specific binding [39]. This contrasts with photonic sensors where the evanescent field typically extends 100-200 nm, offering somewhat greater tolerance to minor surface contamination [39].
Experimental Protocols and Methodologies
Representative Experimental Workflow: Enzyme-Based Glucose Biosensor
The development and characterization of an electrochemical biosensor follow a systematic experimental workflow. The following protocol describes a representative process for constructing and testing a second-generation enzymatic glucose biosensor based on glucose oxidase (GOx) with an artificial mediator [44] [43].
Step 1: Electrode Preparation and Modification
- Begin with a clean working electrode (typically gold, glassy carbon, or screen-printed carbon)
- Modify the electrode surface with nanomaterials (e.g., gold nanoparticles, graphene, carbon nanotubes) to enhance surface area and electron transfer kinetics [43]
- Apply the nanomaterial suspension via drop-casting, electrodeposition, or other suitable methods
- Dry under controlled conditions (temperature, atmosphere) to form a stable nanocomposite film
Step 2: Enzyme Immobilization
- Prepare a solution containing glucose oxidase (GOx) in appropriate buffer (typically phosphate buffer, pH 7.4)
- Incorporate an artificial mediator (e.g., ferrocene derivative, ferricyanide) in the enzyme solution [43]
- Apply the enzyme-mediator solution to the modified electrode surface
- Cross-link with glutaraldehyde vapor or use entrapment in polymer matrices (e.g., chitosan, Nafion) to stabilize the enzyme layer [44]
Step 3: Electrochemical Characterization
- Assemble the three-electrode system: modified working electrode, reference electrode (Ag/AgCl), and counter electrode (platinum)
- Use cyclic voltammetry (CV) in buffer solution containing the mediator to confirm successful immobilization and electron transfer
- Perform electrochemical impedance spectroscopy (EIS) to characterize charge transfer resistance
- Optimize operational parameters: working potential, pH, temperature
Step 4: Analytical Performance Assessment
- Record amperometric responses (current vs. time) with successive additions of glucose standard solutions under stirred conditions
- Construct a calibration curve of steady-state current versus glucose concentration
- Determine linear range, sensitivity, and limit of detection (LOD) from the calibration data
- Evaluate selectivity by testing against potential interferents (ascorbic acid, uric acid, acetaminophen)
- Assess reproducibility, stability, and reusability through repeated measurements
Experimental workflow for electrochemical biosensor development
Key Research Reagent Solutions
The performance of electrochemical biosensors relies heavily on specialized reagents and materials that facilitate biological recognition and signal transduction.
Table: Essential Research Reagents for Electrochemical Biosensor Development
| Reagent/Material | Function | Example Applications |
|---|---|---|
| Glucose Oxidase (GOx) | Biological recognition element; catalyzes glucose oxidation [44] | Glucose biosensors [44] [43] |
| Artificial Mediators(Ferrocene, Ferricyanide) | Shuttle electrons between enzyme active site and electrode surface [43] | Second-generation biosensors [43] |
| Gold Nanoparticles (AuNPs) | Enhance electron transfer, increase surface area, immobilization platform [46] | Signal amplification in PSA detection [46] |
| Carbon Nanomaterials(Graphene, CNTs) | Improve conductivity, provide large surface area, functional groups for immobilization [43] [46] | Dopamine sensors, electrode modification [46] |
| Screen-Printed Electrodes (SPE) | Disposable, reproducible, miniaturized electrode platforms [46] | Point-of-care biosensors [46] |
| Specific Antibodies/Aptamers | Provide molecular recognition for specific biomarkers [38] [46] | Immunosensors, aptasensors for cancer biomarkers [46] |
Signaling Pathways and Transduction Mechanisms
The fundamental signaling pathways in electrochemical biosensors convert molecular recognition events into measurable electrical signals through distinct transduction mechanisms.
Electron Transfer Pathways in Enzymatic Biosensors
Enzymatic electrochemical biosensors operate through defined electron transfer pathways that vary by sensor generation:
First-Generation Pathway: Relies on oxygen as the natural electron acceptor. Glucose oxidase (GOx) catalyzes glucose oxidation to gluconolactone while reducing its FAD cofactor to FADH₂. The enzyme is reoxidized by oxygen, producing hydrogen peroxide, which is detected amperometrically at the electrode [44]. The detection is based on monitoring oxygen consumption or hydrogen peroxide production [43].
Second-Generation Pathway: Employs artificial mediators (Mₒₓ) as electron shuttles. The reduced enzyme (GOx-FADH₂) transfers electrons to the oxidized mediator (Mₒₓ), regenerating the oxidized enzyme. The reduced mediator (Mᵣₑd) is then oxidized at the electrode surface, generating a measurable current proportional to glucose concentration [44] [43].
Third-Generation Pathway: Achieves direct electron transfer (DET) between the enzyme's redox center and the electrode without mediators. This is facilitated by nanomaterial-modified electrodes that bridge the spatial barrier posed by the enzyme's protein shell [43]. The current is generated directly from the enzyme's redox reaction.
Electron transfer pathways in different generations of enzymatic biosensors
Affinity Biosensor Transduction Mechanisms
Non-enzymatic electrochemical biosensors, particularly those based on antibody-antigen or aptamer-target interactions, employ different signaling mechanisms:
Access Modulation Mechanisms: Binding of the target biomolecule can either block (BAE) or open (OAE) access to the electrode surface for a redox probe, thereby altering the electrochemical signal [46].
Electrostatic and Intercalation Effects: Biomolecular binding events can change the electrostatic affinity of redox probes or facilitate intercalation of specific redox molecules, modulating the electron transfer efficiency [46].
Charge Transport Alteration: Binding events can affect the transport of ions or charge carriers at the electrode-electrolyte interface, detectable through techniques like electrochemical impedance spectroscopy (EIS) [39] [46].
These fundamental signaling pathways enable the detection of diverse analytes beyond metabolites, including proteins, nucleic acids, and whole cells, significantly expanding the clinical applications of electrochemical biosensors.
Electrochemical biosensors have established undeniable dominance in the biosensing market, particularly for clinical applications such as glucose monitoring, which continues to drive commercial success and technological innovation. Their market leadership stems from a powerful combination of performance characteristics including high sensitivity, miniaturization capability, cost-effectiveness, and operational simplicity that aligns perfectly with the needs of point-of-care testing and continuous monitoring applications [40] [38] [39].
While photonic and piezoelectric biosensors offer complementary advantages for specific applications—such as multiplexing capability and label-free detection—electrochemical platforms provide the most practical solution for widespread clinical implementation, particularly in decentralized healthcare settings [39]. The ongoing integration of nanomaterials, artificial intelligence, and wireless technologies into electrochemical biosensing platforms promises to further enhance their capabilities, potentially enabling new applications in personalized medicine, remote patient monitoring, and global health initiatives [40] [47].
As the healthcare landscape continues evolving toward more proactive, preventive, and personalized models, electrochemical biosensors are poised to play an increasingly central role in clinical decision-making and health management worldwide. Their continued development will likely focus on overcoming current limitations related to fouling, stability in complex biological matrices, and further multiplexing capabilities to address the growing need for comprehensive diagnostic information.
High-Accuracy Applications of Optical Biosensors in Infectious Disease and Cancer Diagnostics
Optical biosensors have emerged as powerful analytical tools that translate biological binding events into quantifiable optical signals, enabling the highly sensitive and specific detection of pathogens and disease-specific biomarkers. Within clinical diagnostics, these biosensors address a critical need for rapid, accurate, and point-of-care testing, moving beyond the limitations of conventional methods like culturing, polymerase chain reaction (PCR), and enzyme-linked immunosorbent assay (ELISA), which can be time-consuming, require centralized laboratories, and incur significant costs [48]. The performance of any biosensor, including optical varieties, is benchmarked against the World Health Organization's (WHO) ASSURED criteria—Affordable, Sensitive, Specific, User-friendly, Rapid and robust, Equipment-free, and Deliverable—which define the ideal characteristics for point-of-care diagnostic tools [48].
This guide objectively compares the performance of optical biosensing modalities with electrochemical and piezoelectric alternatives, framing the discussion within a broader thesis on their relative sensitivities. We summarize experimental data, detail core methodologies, and provide a resource toolkit to inform researchers and drug development professionals in selecting the appropriate sensing technology for specific diagnostic challenges.
Performance Comparison of Biosensing Modalities
While optical biosensors are the focus of this guide, their performance is best understood in the context of other prominent sensing modalities. The table below provides a comparative overview of optical, electrochemical, and piezoelectric biosensors based on key performance parameters.
Table 1: Comparative Overview of Major Biosensor Types for Clinical Diagnostics
| Biosensor Type | Transduction Principle | Key Advantages | Typical Sensitivity | Key Limitations |
|---|---|---|---|---|
| Optical | Measures changes in light properties (e.g., intensity, wavelength, polarization) [49]. | Label-free detection, high sensitivity and specificity, potential for miniaturization and multiplexing [48] [49]. | Very high (detection down to attomolar range with CRISPR [50] and single molecules with SIMOA [50]) | Can be susceptible to environmental interference, some platforms require complex instrumentation. |
| Electrochemical | Measures electrical changes (e.g., current, potential, impedance) due to bio-recognition events [51]. | High sensitivity, excellent selectivity, cost-effectiveness, portability, and compatibility with miniaturization (lab-on-a-chip) [51] [52]. | High (detection down to femtomolar range with nanomaterial enhancement [52]) | Signal can be affected by non-specific adsorption; requires stable reference electrode. |
| Piezoelectric | Measures change in the resonance frequency of a crystal due to mass adsorption from a binding event [53]. | Label-free, real-time monitoring of binding kinetics, suitable for viscous samples. | Lower (measures mass change, typically suitable for larger molecules or cells) | Lower sensitivity for small molecules, susceptible to interference from environmental vibrations and temperature fluctuations. |
High-Accuracy Optical Biosensing Modalities and Experimental Data
Optical biosensors encompass a diverse family of technologies. The following table summarizes the operating principles and documented performance of major optical biosensor types in detecting targets relevant to infectious diseases and cancer.
Table 2: Performance of Key Optical Biosensor Modalities in Disease Diagnostics
| Optical Modality | Principle | Target / Disease | Experimental Limit of Detection (LOD) | Assay Time | Reference |
|---|---|---|---|---|---|
| Surface Plasmon Resonance (SPR) | Tracks refractive index changes at a metal-dielectric interface upon biomolecular binding [54]. | Influenza Virus (H3N2) | 10 PFU/mL | 5 min | [48] |
| Localized SPR (LSPR) | Utilizes nanoscale metal structures to confine light, enhancing sensitivity to local environmental changes [54]. | Influenza Virus (H1N1) | 0.03 pg/mL (in water) | 5 min | [48] |
| Fluorescence Polarization | Measures change in the rotational speed of a fluorescently-labeled molecule upon binding a larger target. | Salmonella spp. in blood | 1 CFU | 20 min | [48] |
| CRISPR-based Fluorescence | Utilizes Cas enzyme's trans-cleavage activity to release fluorescent signals upon target nucleic acid recognition [50]. | Nucleic Acids | Attomolar (aM) range | Short (suitable for POC) | [50] |
| Colorimetric (AuNP) | Detects color change from the aggregation of gold nanoparticles (AuNPs) induced by target binding [50]. | Neurodegenerative Disease Biomarkers | Varies by target | Rapid | [50] |
| Guided-Mode Resonance (GMR) | Employs a photonic grating structure to create a sharp resonance dip in reflection spectrum sensitive to refractive index changes [55]. | Cytokeratin 8/18 (Gastric Cancer Biomarker) | High Sensitivity: 420.33 nm/RIU (Bulk) | Rapid, real-time | [55] |
Detailed Experimental Protocol: SPR/LSPR-based Detection of Influenza Virus
Objective: To detect and differentiate influenza virus subtypes (e.g., H1N1 and H3N2) using an LSPR-based biosensor with AuNP-alloyed quantum dots [48].
Materials and Reagents:
- Biosensor Chip: A chip with a gold nanograting or nanoparticle structure to generate LSPR.
- Probe Molecule: Specific antibodies or aptamers against the target influenza hemagglutinin protein.
- Signal Amplifier: Alloyed quantum dots (e.g., CdSeTe) to enhance the optical signal.
- Running Buffer: Phosphate-buffered saline (PBS, pH 7.4) with a surfactant (e.g., Tween 20).
- Sample: Inactivated virus particles spiked into buffer or human serum.
- Microfluidic System (optional): For automated buffer and sample delivery.
Methodology:
- Sensor Functionalization: The surface of the LSPR biosensor chip is activated and coated with the specific anti-influenza probe molecules. The surface is then blocked with an inert protein (e.g., BSA) to minimize non-specific binding.
- Baseline Acquisition: A stable baseline signal is established by flowing running buffer over the functionalized sensor surface while continuously monitoring the resonance wavelength (for LSPR) or angle (for SPR).
- Sample Injection: The sample solution (containing the target virus) is injected over the sensor surface. The binding of viral particles to the immobilized probes causes a localized change in the refractive index, resulting in a measurable shift in the resonance signal.
- Signal Amplification (if applicable): For enhanced sensitivity, a secondary antibody conjugated with alloyed quantum dots is introduced, which binds to the captured virus, inducing a further signal shift.
- Regeneration: The sensor surface is regenerated for subsequent use by injecting a mild acidic or basic solution (e.g., Glycine-HCl) to dissociate the antibody-antigen complex without damaging the immobilized probes.
- Data Analysis: The magnitude of the resonance shift is quantified and correlated to the target analyte concentration using a pre-established calibration curve.
The Scientist's Toolkit: Essential Research Reagents and Materials
The development and operation of high-performance optical biosensors rely on a suite of specialized reagents and materials.
Table 3: Key Research Reagent Solutions for Optical Biosensor Development
| Reagent/Material | Function in Biosensing | Example Applications |
|---|---|---|
| Gold Nanoparticles (AuNPs) | Plasmonic nanotransducers; aggregation causes visible color shift [50]. | Colorimetric detection of proteins and nucleic acids [50]. |
| Graphene Oxide (GO) | Fluorescence quencher; substrate for biomolecule immobilization [53]. | Fluorescence resonance energy transfer (FRET) assays; electrical biosensors [53]. |
| Specific Aptamers | Synthetic nucleic acid recognition elements; high affinity and stability [53]. | Target capture for viruses (Influenza [48]), proteins (Thrombin [53] [51]), and cells. |
| Monoclonal Antibodies | High-specificity biological recognition elements for antigens. | Immobilized on SPR chips or quantum dots for pathogen capture [48]. |
| Quantum Dots (QDs) | Fluorescent nanocrystals with high brightness and photostability for signal tagging. | Fluorescent tags in multiplexed detection and signal amplification [48]. |
| CRISPR-Cas System | Provides highly specific nucleic acid recognition and signal amplification via trans-cleavage [50]. | Fluorescent detection of viral RNA or DNA with ultra-high sensitivity [50]. |
Comparative Framework: Sensitivity and Application Scope
The following diagram illustrates the logical relationship between different biosensor types, their fundamental transduction principles, and their characteristic application scopes and sensitivities, providing a conceptual framework for selection.
Optical biosensors represent a rapidly advancing frontier in diagnostic technology, demonstrating exceptional accuracy through their high sensitivity and specificity in detecting pathogens and cancer biomarkers. As the data indicates, modalities like SPR, CRISPR-based fluorescence, and GMR metasurfaces can achieve detection limits that meet or surpass those of traditional laboratory methods, but in a potentially faster and more streamlined format [48] [50] [55]. The choice between optical, electrochemical, or piezoelectric biosensors is not a matter of which is universally superior, but rather which is most appropriate for the specific application, weighing factors such as required sensitivity, cost, portability, and sample type. The ongoing integration of optical platforms with nanomaterials, microfluidics, and artificial intelligence promises to further enhance their performance, solidifying their role as indispensable tools in the future of personalized medicine, infectious disease management, and cancer care.
Employing Piezoelectric Biosensors for Label-Free Detection of Pathogens and Biomolecules
Biosensors are analytical devices that integrate a biological recognition element with a transducer to convert a biological response into a measurable electrical signal [56]. The evolution of biosensor technology has produced three generations of devices, progressing from mediator-less systems to modern platforms incorporating artificial mediators and nanomaterials to enhance analytical performance [56]. Among the various transduction principles, piezoelectric biosensors represent a significant category of label-free detection systems that measure mass changes resulting from biointeractions [57] [58].
Label-free detection methods offer distinct advantages over labelled techniques, including simplified assay formats, reduced preparation time, and the ability to monitor biomolecular interactions in real-time without modifying the interacting components [57]. Within this landscape, piezoelectric biosensors occupy a specialized niche, capitalizing on the direct conversion of mechanical energy to electrical energy for detecting pathogens, disease biomarkers, and other biological analytes. Their operating principle is fundamentally different from optical and electrochemical counterparts, relying on mass-based detection rather than optical properties or redox reactions [58].
This review provides a comprehensive comparison of piezoelectric biosensors against other major biosensor types, with particular emphasis on their relative sensitivity, operational characteristics, and implementation requirements. We present structured experimental data and detailed methodologies to enable researchers to make informed decisions when selecting biosensor platforms for specific applications in pathogen detection and biomolecular analysis.
Fundamental Principles of Piezoelectric Biosensing
Core Mechanism and Theoretical Foundation
The piezoelectric effect is a physical phenomenon discovered by the Curie brothers in 1880, wherein certain materials generate an electric charge in response to applied mechanical stress (direct piezoelectric effect), and conversely, undergo mechanical deformation when subjected to an electric field (inverse piezoelectric effect) [22] [59]. This reversible energy conversion property forms the operational basis for piezoelectric biosensors.
Piezoelectric biosensors typically utilize a thin quartz crystal plate with metallic electrodes deposited on opposite sides, where the overlapping region of the electrodes defines the active sensing area [58]. These systems operate as mass-sensitive devices, where the resonance frequency of an oscillating crystal changes when mass attaches to its surface through specific biological recognition events [57] [58]. The relationship between mass change and frequency shift is quantitatively described by the Sauerbrey equation [22] [57]:
∆f = -2f₀²∆m / [A(ρᵩμᵩ)¹ᐟ²]
Where Δf is the frequency change, f₀ is the fundamental resonant frequency, Δm is the mass change, A is the active sensor area, ρᵩ is the quartz density, and μᵩ is the shear modulus of quartz [22]. This equation establishes that the frequency decrease is directly proportional to the mass bound to the sensor surface, enabling quantitative detection of analytes.
For operation in liquid environments—essential for biological sensing—the Kanazawa-Gordon equation describes how frequency is additionally affected by liquid properties [22]:
∆f = -f₀³ᐟ²(ηₗρₗ/πρᵩμᵩ)¹ᐟ²
Where ηₗ represents liquid viscosity and ρₗ represents liquid density [22]. This relationship highlights the importance of accounting for solution properties when interpreting sensor responses in biological assays.
Common Piezoelectric Transducer Configurations
Two primary transducer configurations dominate piezoelectric biosensing:
Quartz Crystal Microbalance (QCM): Also known as bulk acoustic wave (BAW) sensors, QCM systems utilize thin quartz discs that oscillate in thickness shear mode when excited by an alternating electric field [58]. These sensors typically operate at frequencies between 5-20 MHz, with higher frequencies providing greater mass sensitivity but requiring thinner, more fragile quartz elements [57].
Surface Acoustic Wave (SAW) Devices: These sensors propagate acoustic waves along the surface of the piezoelectric material, with the wave characteristics being influenced by mass loading on the sensing area [58]. SAW devices can operate at higher frequencies than QCM, potentially offering improved sensitivity.
Advanced measurement techniques such as QCM with dissipation monitoring (QCM-D) provide additional information about the viscoelastic properties of adsorbed layers by analyzing the energy dissipation characteristics alongside frequency changes [57]. This capability is particularly valuable for characterizing soft biological layers that don't behave as rigid masses.
Comparative Performance Analysis of Biosensor Platforms
Sensitivity and Detection Limits Across Biosensor Categories
The following table summarizes the typical performance characteristics of major biosensor types based on published comparative studies:
Table 1: Performance comparison of major biosensor technologies
| Biosensor Type | Detection Principle | Typical Analysis Time | Limit of Detection | Label-Free Capability |
|---|---|---|---|---|
| Piezoelectric (QCM) | Mass change, frequency shift | 10-30 minutes [60] | 1 nM (CRP detection) [60] | Yes [57] |
| Electrochemical | Current/voltage from redox reactions | Minutes [22] | pM-fM range (with amplification) [60] | Optional |
| Optical (SPR) | Refractive index change | 10 seconds - 2 hours [60] | 3 nM (label-free) - 1.4 fM (labeled) [60] | Yes |
| Lateral Flow Assays | Visual detection with labels | 3-5 minutes [22] [60] | ~10 μM (hCG in urine) [60] | No |
| Mechanical Cantilevers | Surface stress or mass change | 10-100 minutes [60] | 100 pM - 15 nM [60] | Yes |
Real-World Pathogen and Biomolecule Detection Performance
The table below provides specific experimental data for pathogen and biomarker detection using different biosensor platforms:
Table 2: Experimental detection data for specific pathogens and biomarkers
| Target Analyte | Biosensor Platform | Sample Matrix | Limit of Detection | Reference |
|---|---|---|---|---|
| C-reactive Protein | Piezoelectric (QCM) | Buffer | 1 nM | [60] |
| Mycobacterium tuberculosis | Piezoelectric (Gold NP-enhanced) | Laboratory samples | 30 CFU/mL | [58] |
| Protozoan Pathogens | Various nanomaterial biosensors | Clinical samples | High sensitivity and specificity reported | [45] |
| Prostate Specific Antigen (PSA) | Nanowire Field-Effect Transistor | Buffer | 0.15-5 pM | [60] |
| Bilirubin | Piezoelectric (Molecularly Imprinted) | Serum | 0.01-0.05 μM | [58] |
| DNA Targets | Surface Plasmon Resonance (Labeled) | Buffer | 1.4 fM | [60] |
Comprehensive Technology Comparison
Table 3: Strategic comparison of biosensor technologies for research implementation
| Parameter | Piezoelectric | Electrochemical | Optical (SPR) |
|---|---|---|---|
| Instrument Cost | Moderate | Low | High |
| Assay Development Complexity | Moderate | Low | High |
| Throughput Capability | Moderate | High | Moderate |
| Real-time Monitoring | Yes | Limited | Yes |
| Liquid Operation | Challenging (damping effects) [58] | Excellent | Excellent |
| Multiplexing Potential | Moderate | High | Moderate |
| Sample Preparation Needs | Minimal | Minimal to extensive | Minimal |
| Suitability for Point-of-Care | Good with miniaturization | Excellent | Limited |
Experimental Protocols for Piezoelectric Biosensing
Standard Quartz Crystal Microbalance Immunosensing Protocol
Sensor Preparation:
- Begin with AT-cut quartz crystals (typically 5-20 MHz) with gold electrodes [57].
- Clean crystals using piranha solution (3:1 H₂SO₄:H₂O₂) CAUTION: Highly oxidative followed by oxygen plasma treatment for 10-15 minutes.
- Functionalize gold surface with self-assembled monolayer (SAM) of alkanethiols (e.g., 11-mercaptoundecanoic acid) by incubating in 1 mM ethanol solution for 12-24 hours.
- Activate carboxyl groups using EDC/NHS chemistry (400 mM EDC/100 mM NHS in water, 30-minute incubation).
- Immobilize capture antibodies (50-100 μg/mL in 10 mM acetate buffer, pH 5.0) for 1-2 hours.
- Block non-specific binding sites with 1% BSA in PBS for 1 hour.
Measurement Procedure:
- Mount functionalized crystal in flow cell or dipping probe configuration.
- Establish baseline frequency in running buffer (typically PBS, pH 7.4).
- Introduce analyte samples at desired concentrations and flow rates (typically 50-100 μL/min).
- Monitor frequency shift in real-time throughout association phase (10-30 minutes).
- Replace with running buffer to monitor dissociation phase.
- Regenerate surface for reuse with mild acidic or basic solutions (e.g., 10 mM glycine-HCl, pH 2.5).
Data Analysis:
- Record frequency changes relative to baseline.
- For quantitative analysis, plot steady-state frequency shifts versus analyte concentration.
- Fit binding data to appropriate models (Langmuir, etc.) to determine affinity constants.
Enhanced Sensitivity Protocol with Nanomaterial Amplification
Gold Nanoparticle Enhancement:
- Follow standard immunosensing preparation through antibody immobilization (steps 1-5 above).
- After analyte capture, introduce secondary antibodies conjugated to 10-50 nm gold nanoparticles.
- Allow nanoparticle conjugation for 30-60 minutes.
- The high mass of nanoparticles significantly amplifies the frequency shift, enhancing detection sensitivity by 10-100× [58] [61].
Alternative Signal Amplification Strategies:
- Enzyme-precipitation: Use enzyme-conjugated detection antibodies followed by introduction of substrate that forms an insoluble precipitate on the sensor surface.
- Polymer enlargement: Employ polyelectrolyte layers that associate with captured analyte to amplify mass change.
Essential Research Reagents and Materials
Table 4: Key research reagents for piezoelectric biosensor development
| Reagent/Material | Function | Example Specifications |
|---|---|---|
| Piezoelectric Crystals | Signal transduction | AT-cut quartz, 5-20 MHz, gold electrodes |
| Surface Chemistry Reagents | Sensor functionalization | Alkanethiols (e.g., 11-mercaptoundecanoic acid), silanes |
| Crosslinkers | Bioreceptor immobilization | EDC, NHS, sulfo-SMCC, glutaraldehyde |
| Bioreceptors | Target recognition | Antibodies, aptamers, oligonucleotides, molecularly imprinted polymers |
| Blocking Agents | Reduce non-specific binding | BSA, casein, fish skin gelatin, pluronic surfactants |
| Gold Nanoparticles | Signal amplification | 10-50 nm, functionalized with streptavidin or antibodies |
| Buffer Components | Maintain optimal assay conditions | PBS, HEPES, acetate buffer, tween-20 |
Emerging Trends and Future Perspectives
Advanced Piezoelectric Materials Development
The field is witnessing significant innovation in piezoelectric materials beyond traditional quartz crystals. Organic piezoelectric polymers such as polyvinylidene fluoride (PVDF) and its copolymers are gaining attention for their flexibility, biocompatibility, and ease of processing into various form factors [59]. These materials are particularly suitable for wearable biosensing applications where mechanical flexibility is essential. Additionally, lead-free piezoelectric ceramics like barium titanate (BaTiO₃) and sodium potassium niobate are being developed to address toxicity concerns associated with lead zirconate titanate (PZT) while maintaining competitive piezoelectric performance [59].
Nanomaterial-enhanced piezoelectric systems represent another frontier, where the integration of carbon nanotubes, graphene, and metallic nanoparticles creates composite structures with enhanced sensitivity and functionality [56] [61]. These nanocomposites can improve charge transfer characteristics, increase surface area for bioreceptor immobilization, and introduce additional sensing mechanisms through synergistic effects.
System Integration and Miniaturization
Current research focuses on integrating piezoelectric biosensors with microfluidic systems for automated sample handling and processing, and with complementary metal-oxide-semiconductor (CMOS) electronics for miniaturized, portable sensing platforms [62]. The development of multiplexed piezoelectric arrays enables parallel detection of multiple analytes, significantly expanding the analytical capability of these systems.
The integration of piezoelectric biosensors with wearable and implantable devices represents a particularly promising direction [59]. Such systems leverage the self-powering potential of piezoelectric materials through biomechanical energy harvesting while providing continuous physiological monitoring capabilities. These advancements are gradually addressing traditional limitations of piezoelectric biosensors, particularly their performance in liquid environments and the challenge of distinguishing specific binding signals from non-specific adsorption in complex biological matrices.
Piezoelectric biosensors offer a unique combination of label-free operation, real-time monitoring capability, and relatively simple instrumentation that positions them as valuable tools for pathogen detection and biomolecular analysis. While they may not achieve the ultimate sensitivity of some advanced optical or electrochemical platforms with sophisticated amplification strategies, their direct mass detection principle provides distinct advantages for many applications.
The choice between piezoelectric, electrochemical, and optical biosensors ultimately depends on the specific research requirements, including sensitivity needs, sample matrix, available budget, and intended application environment. Piezoelectric systems particularly excel when direct monitoring of binding events without secondary labels is preferred, when measuring higher molecular weight analytes, and when operational simplicity is valued.
Ongoing advancements in materials science, surface chemistry, and instrumentation continue to address historical limitations of piezoelectric biosensors, particularly regarding liquid-phase operation and sensitivity. These developments, coupled with their inherent strengths, ensure that piezoelectric biosensing will remain a vital technology in the researcher's toolkit for biological detection and characterization.
The Rise of Portable and Wearable Form Factors for Point-of-Care Testing
The paradigm of medical diagnostics is shifting from centralized laboratories to the point of need, driven by significant advancements in portable and wearable form factors for point-of-care testing (POCT). This transition is accelerated by the growing demand for real-time health monitoring and the urgent need for rapid diagnostic solutions in resource-limited settings, a need starkly highlighted by the COVID-19 pandemic [21]. The global wearable medical devices market, valued at approximately USD 42.7 billion in 2024 and projected to reach USD 54.0 billion in 2025, underscores the rapid adoption of these technologies [63].
The core of this revolution lies in biosensors, analytical devices that integrate a biological recognition element with a physicochemical transducer to convert a biological event into a measurable signal [21]. The miniaturization of these biosensors into wearable and portable platforms is redefining clinical diagnostics, enabling continuous monitoring of biomarkers, physiological parameters, and even specific pathogens outside traditional lab settings [11]. This article provides a objective performance comparison of the three dominant biosensing transducers—electrochemical, optical, and piezoelectric—within the context of portable and wearable POCT, framing the analysis within a broader thesis on sensitivity and practical application for researchers and drug development professionals.
Biosensing Transduction Mechanisms: A Comparative Analysis
Biosensors are classified based on their transduction mechanism, each with distinct advantages and challenges for POCT integration. The biological recognition element (e.g., enzyme, antibody, aptamer) interacts specifically with the target analyte. This interaction is then converted into a quantifiable signal by the transducer [21].
Electrochemical Biosensors
Electrochemical biosensors measure electrical signals—current, potential, or impedance—resulting from biochemical reactions. They are characterized by high sensitivity, low cost, and ease of miniaturization, making them exceptionally suitable for POCT [21]. A key application is glucose monitoring, where the enzyme glucose oxidase facilitates the reaction: O2 + glucose → H2O2 + gluconic acid [21]. The resulting current is proportional to glucose concentration. Recent innovations, such as the use of gold nano/microislands (NMIs) and graphene-carbon nanocomposites, have significantly increased the active surface area of electrodes, thereby enhancing sensor performance and enabling the detection of low-abundance analytes [21].
Optical Biosensors
Optical biosensors detect changes in light properties—such as intensity, wavelength, or polarization—induced by biomarker interactions. These sensors benefit from high sensitivity, immunity to electromagnetic interference, and capability for multiplexed detection through spectral separation [11]. Techniques include surface plasmon resonance (SPR), fluorescence, and surface-enhanced Raman spectroscopy (SERS). For wearable applications, flexible optical biosensors leverage materials like polydimethylsiloxane (PDMS), hydrogels, and textile-based platforms to create comfortable, skin-conformal devices that can monitor analytes in sweat or interstitial fluid [11]. A notable example is a fluorescent dental protector made from ZnO-PDMS nanocomposites that can detect and localize volatile sulfur compounds associated with dental lesions [11].
Piezoelectric Biosensors
Piezoelectric biosensors, typically using quartz crystal microbalances (QCM), measure changes in the resonance frequency of a crystal when a mass (such as a captured analyte) binds to its surface. They are highly sensitive to mass changes and are valuable for label-free detection. A critical consideration for real-world use is sensor encapsulation to protect electrical components, which can affect sensitivity. Research shows that encapsulation with materials like polyetherimide can maintain high-frequency performance while providing necessary durability, making them suitable for structural health monitoring and, by extension, certain biomedical sensing applications [64].
Table 1: Performance Comparison of Biosensor Transduction Mechanisms for POCT.
| Parameter | Electrochemical | Optical | Piezoelectric |
|---|---|---|---|
| Fundamental Principle | Measures change in current, potential, or impedance from a biochemical reaction [21] | Measures change in light properties (e.g., intensity, wavelength) [11] | Measures change in resonant frequency due to mass adsorption [64] |
| Sensitivity | High (e.g., LOD of 9.10 nM for guanine [65]) | Very High (e.g., Phase sensitivity up to 3.1x10⁵ deg/RIU for THz SPR [16]) | High (mass-dependent) |
| Selectivity | Achieved via specific biorecognition elements (enzymes, aptamers) [21] | Achieved via specific biorecognition elements; enhanced by spectral separation [11] | Achieved via specific biorecognition elements on the crystal surface |
| Miniaturization Potential | Excellent; ideal for portable/wearable form factors [21] | Good; advancing with flexible materials and optical fibers [11] | Moderate; challenges with crystal size and encapsulation [64] |
| Key Advantage(s) | Low cost, simple instrumentation, portable [21] | Resistant to electromagnetic interference, potential for multiplexing [11] | Label-free, highly sensitive to mass changes |
| Key Limitation(s) | Can be susceptible to electrical noise and electrode fouling [21] | Signal can be affected by ambient light; motion artifacts in wearables [11] | Sensitivity can be reduced by encapsulation; viscous samples can dampen signal [64] |
| Example Wearable Integration | Continuous glucose monitors (CGMs), smartwatch ECG [66] [63] | Smart rings (sleep, readiness scores), patches for biomarker monitoring [66] [11] | Limited in current consumer wearables; used in specialized health monitors |
Experimental Insights and Performance Data
Objective performance comparison relies on standardized experimental protocols and critical evaluation of quantitative data from peer-reviewed studies.
Experimental Protocol for Sensor Characterization
To ensure comparability, the following generalized protocols are employed in sensor development and validation:
- Sensor Fabrication and Functionalization: The transducer surface is modified to enhance performance. For electrochemical sensors, this involves electropolymerization of functional complexes or deposition of nanomaterials on the working electrode [65]. Optical sensors require engineering of the sensing interface, such as creating nanograting structures in PDMS or functionalizing Au-Ag nanostars with specific antibodies for SERS detection [16] [11].
- Analytical Performance Measurement: Sensors are tested with standard solutions of the target analyte across a known concentration range. The limit of detection (LOD) and limit of quantification (LOQ) are calculated using the formulas
LOD = 3σ/SandLOQ = 10σ/S, whereσis the standard deviation of the blank signal andSis the sensitivity or slope of the calibration curve [21]. - Real-Sample Validation: The sensor is applied to relevant biological samples (e.g., serum, urine, saliva) via spike-and-recovery experiments. Recovery rates close to 100% indicate high accuracy and minimal matrix interference [65].
- Interference and Stability Studies: Selectivity is tested by exposing the sensor to potentially confounding substances. Long-term stability is assessed by monitoring signal response over days or weeks [11].
Quantitative Performance Data
Recent studies demonstrate the advanced capabilities of modern biosensors, as summarized in the table below.
Table 2: Experimental Performance Data from Recent Biosensor Studies.
| Analyte | Transduction Method | Sensor Platform | Linear Range | Limit of Detection (LOD) | Real-Sample Tested (Recovery) | Ref. |
|---|---|---|---|---|---|---|
| Adenine & Guanine | Electrochemical | poly(Mn(HR)4)/GCE | 0.01–300 μM | 66.54 nM (Adenine), 9.10 nM (Guanine) | Urine, Blood Serum (96–104%) | [65] |
| α-Fetoprotein (AFP) | Optical (SERS) | Au-Ag Nanostars Platform | 0–500 ng/mL | 16.73 ng/mL | Not Specified | [16] |
| Volatile Sulfur Compounds | Optical (Fluorescence) | ZnO-PDMS Nanocomposite | Not Specified | High sensitivity for lesion localization | Oral Cavity (Visualized via 3D imaging) | [11] |
| C-reactive Protein (CRP) | Optical (Photonic) | PDMS Nano-grating | Not Specified | Not Specified | Not Specified | [11] |
| General Analyte (Liquid) | Optical (SPR) | Graphene-coupled Otto Structure | N/A | Phase Sensitivity: 3.10×10⁵ deg/RIU | Simulated Liquid Environment | [16] |
The following diagram illustrates the logical workflow for developing and validating a biosensor for POCT applications, integrating the key experimental steps discussed above.
The Scientist's Toolkit: Essential Research Reagents and Materials
The development of high-performance portable biosensors relies on a suite of specialized materials and reagents. The following table details key components and their functions in sensor fabrication and operation.
Table 3: Key Research Reagent Solutions for Biosensor Development.
| Material/Reagent | Function in Biosensor Development | Example Application |
|---|---|---|
| Gold Nanoparticles (AuNPs) & Nanostructures | Enhance electrochemical signal and provide a surface for biomolecule immobilization via gold-thiol chemistry [21]. | Used in SERS platforms (e.g., Au-Ag nanostars) and for electrode modification to improve sensitivity [16] [21]. |
| Graphene & Carbon Nanotubes | Provide a high surface-area-to-volume ratio, excellent conductivity, and facilitate electron transfer in electrochemical transducers [21]. | Served as a base material for electrodes in electrochemical biosensors [21]. |
| Polydimethylsiloxane (PDMS) | A flexible, transparent, and biocompatible polymer used as a substrate for wearable optical sensors [11]. | Used as a flexible substrate for nano-grating photonic sensors and fluorescent dental protectors [11]. |
| Molecularly Imprinted Polymers (MIPs) | Synthetic polymers with tailor-made cavities that act as artificial receptors for specific analytes, offering stability over natural receptors [21]. | Utilized as robust recognition elements in electrochemical and optical biosensors [21]. |
| Aptamers | Single-stranded DNA or RNA oligonucleotides that bind to specific targets with high affinity; offer stability and design flexibility [21]. | Serve as recognition elements; their surface density on electrodes can be calculated via chronocoulometry [21]. |
| Zinc Oxide (ZnO) Nanostructures | Used for their high isoelectric point and strong binding affinity toward biomolecules; also have fluorescent properties [11] [21]. | Integrated into PDMS for fluorescent volatile compound detection [11]. |
| Polyetherimide (PEI) | A high-performance polymer used for encapsulating and protecting sensitive transducer elements like piezoelectric composites [64]. | Used to encapsulate piezoelectric sensors, maintaining sensitivity at higher frequencies while providing durability [64]. |
The rise of portable and wearable biosensors is intrinsically linked to advancements in transduction technologies. Each class of biosensor—electrochemical, optical, and piezoelectric—offers a unique profile of sensitivity, miniaturization potential, and practical applicability for point-of-care testing. Electrochemical sensors currently lead in widespread commercial deployment for metabolic monitoring due to their cost-effectiveness and simplicity. Optical sensors offer unparalleled sensitivity and multiplexing capabilities, rapidly advancing through flexible material innovations. Piezoelectric sensors provide highly sensitive, label-free mass detection, though their integration into consumer wearables is still evolving.
The future of this field lies in the convergence of these technologies with artificial intelligence for intelligent signal processing and the development of robust, clinically validated platforms that move beyond the lab to address real-world health challenges, from managing chronic diseases to combating antimicrobial resistance [63] [67].
The rapid detection of infectious diseases is a critical component of global health, particularly during pandemics and in resource-limited settings. Traditional diagnostic methods like polymerase chain reaction (PCR) and enzyme-linked immunosorbent assay (ELISA) often require advanced laboratory infrastructure, trained personnel, and extended processing times, making them unsuitable for rapid response scenarios [21]. The recent COVID-19 pandemic highlighted the urgent need for diagnostic tools that can deliver accurate results quickly and reliably outside conventional laboratory environments [21]. Point-of-care (POC) biosensors have emerged as promising alternatives, with electrochemical, optical, and piezoelectric systems representing the primary technological approaches. Each platform offers distinct advantages and limitations in sensitivity, cost, portability, and operational complexity. This case study provides a comparative analysis of these biosensor technologies, evaluating their performance characteristics, experimental methodologies, and practical implementation potential for pandemic response and resource-limited applications. The analysis is framed within the broader context of sensitivity comparisons to guide researchers, scientists, and drug development professionals in selecting appropriate biosensing platforms for specific diagnostic challenges.
Biosensors are analytical devices that integrate a biological recognition element with a physicochemical transducer to detect specific analytes. The core components include: (1) a biorecognition element (antibodies, enzymes, nucleic acids, or aptamers) that specifically interacts with the target analyte; (2) a transducer that converts the biological interaction into a measurable signal; and (3) a signal processor that interprets and displays the results [21]. The REASSURED criteria (Real-time connectivity, Ease of sample collection, Affordable, Sensitivity, Specificity, User-friendly, Rapid and robust, Equipment-free, and Deliverable to end-users) provide a framework for evaluating ideal POC diagnostic tools [21].
The three major biosensor platforms—electrochemical, optical, and piezoelectric—operate on distinct signal transduction principles. Electrochemical biosensors measure electrical signals (current, potential, or impedance) generated from biochemical reactions [21]. Optical biosensors detect changes in light properties (wavelength, intensity, or polarization) resulting from analyte binding [11] [68]. Piezoelectric biosensors utilize mass-sensitive transducers that detect frequency changes when analytes bind to the sensor surface [22]. Each platform exhibits unique performance characteristics that determine its suitability for specific diagnostic applications.
Figure 1: Fundamental working principles of biosensors showing the pathway from sample introduction to diagnostic result through various biorecognition elements and transduction mechanisms.
Comparative Performance Analysis of Biosensor Platforms
Sensitivity and Performance Metrics Comparison
The analytical performance of biosensors is critically evaluated through multiple parameters, with sensitivity being paramount for early disease detection. The limit of detection (LOD) represents the lowest analyte concentration that can be reliably distinguished from background noise, calculated using the formula LOD = 3σ/S, where σ is the standard deviation of the blank signal and S is the sensitivity [21]. Other crucial performance metrics include specificity, dynamic range, response time, and reproducibility, all of which vary significantly across biosensor platforms.
Table 1: Comparative Performance Metrics of Major Biosensor Technologies
| Performance Parameter | Electrochemical | Optical | Piezoelectric |
|---|---|---|---|
| Limit of Detection | nM–pM range [21] | pM–fM range [68] [69] | ng–pg mass detection [22] |
| Sensitivity | High (nA mM⁻¹ for glucose) [70] | Very high (125,000 nm/RIU for SPR) [69] | Mass-dependent (Sauerbrey equation) [22] |
| Response Time | Seconds to minutes [21] | Real-time to minutes [11] | Minutes [22] |
| Multiplexing Capability | Moderate [71] | High [71] [11] | Low to moderate [22] |
| Sample Volume | Microliters [21] | Microliters to milliliters [11] | Milliliters [22] |
| Portability | Excellent [21] | Moderate to high [11] | Low to moderate [22] |
| Equipment Cost | Low [21] | High [11] | Moderate [22] |
| Power Requirements | Low [21] | Moderate to high [11] | Moderate [22] |
Technology-Specific Performance Characteristics
Electrochemical biosensors demonstrate high sensitivity with detection limits in the nanomolar to picomolar range, making them suitable for detecting various biomarkers at clinically relevant concentrations [21]. Their excellent sensitivity is exemplified by glucose sensors showing responses of -0.46 nA mM⁻¹ in artificial saliva with LOD of 0.3 μM [70]. The primary advantages of electrochemical platforms include low cost, simplicity, miniaturization potential, and compatibility with complex biological samples [21].
Optical biosensors achieve superior sensitivity through various mechanisms including surface plasmon resonance (SPR), photonic crystal fiber (PCF)-SPR, fluorescence, and chemiluminescence [11] [68]. Recent advancements in PCF-SPR biosensors have demonstrated exceptional wavelength sensitivity up to 125,000 nm/RIU and resolution of 8×10⁻⁷ RIU [69]. The integration of nanomaterials has further enhanced their performance through mechanisms like localized surface plasmon resonance (LSPR) and surface-enhanced Raman scattering (SERS) [68]. Optical platforms particularly excel in multiplexed detection capabilities but often require more complex instrumentation [71].
Piezoelectric biosensors, typically based on quartz crystal microbalance (QCM) technology, function according to mass-sensitive detection principles described by the Sauerbrey equation [22]. These systems detect mass changes on the nanogram to picogram scale, with frequency shifts proportional to bound mass. While offering label-free detection and moderate sensitivity, piezoelectric biosensors face limitations in complex liquid samples due to viscosity effects, as described by the Kanazawa and Gordon equation [22]. Their application in resource-limited settings is further constrained by relatively lower portability and susceptibility to environmental interference.
Experimental Protocols and Methodologies
Electrochemical Biosensor Fabrication and Testing
The development of electrochemical biosensors involves precise electrode modification, biorecognition element immobilization, and electrochemical characterization. A representative protocol for glucose sensing exemplifies this process [70]:
Electrode Preparation: Begin with pristine gold electrodes cleaned via electrochemical cycling in sulfuric acid solution. For enhanced sensitivity, modify electrodes with platinum black through electrodeposition from hexachloroplatinic acid solution.
Enzyme Immobilization: Immobilize glucose oxidase (GOx) using an electrodeposition method with a mixture containing o-phenylenediamine (o-PD) and β-cyclodextrin (β-CD). This creates a cross-linked polymer network that entraps the enzyme while maintaining bioactivity.
pH Control Implementation: Incorporate interdigitated microelectrodes (IDEs) for in-situ pH control to optimize the enzymatic reaction environment. This is particularly crucial for non-invasive applications like saliva testing where natural pH variations occur.
Electrochemical Measurement: Perform detection using techniques such as cyclic voltammetry (CV), differential pulse voltammetry (DPV), or electrochemical impedance spectroscopy (EIS). Apply appropriate potential ranges and scan rates specific to the redox mediator employed.
Data Analysis: Calculate sensitivity from the slope of the current versus concentration plot. Determine LOD using the formula LOD = 3σ/S, where σ is the standard deviation of the blank signal and S is the sensitivity [21].
Optical Biosensor Development with Machine Learning Integration
Advanced optical biosensor implementation incorporates both fabrication and computational optimization [69]:
Sensor Design: Develop photonic crystal fiber (PCF) structures with precise air hole patterning. Apply gold coating of optimized thickness (typically 20-50 nm) to the sensing region to induce surface plasmon resonance.
Simulation Setup: Utilize COMSOL Multiphysics or similar finite element method (FEM) software to model optical properties including effective refractive index (Neff), confinement loss (CL), and amplitude sensitivity (SA).
Machine Learning Integration: Employ regression models (random forest, decision tree, gradient boosting) to predict optical properties based on design parameters. Train models with simulation data to establish correlations between structural features and performance metrics.
Explainable AI Analysis: Apply SHapley Additive exPlanations (SHAP) to identify critical design parameters (wavelength, analyte RI, gold thickness, pitch) that most significantly influence sensor performance.
Experimental Validation: Fabricate optimized designs and characterize using wavelength interrogation. Calculate wavelength sensitivity as Sλ = Δλ/Δn (nm/RIU), where Δλ is resonance wavelength shift and Δn is refractive index change.
Piezoelectric Biosensor Implementation
Quartz crystal microbalance (QCM) biosensors follow a distinct experimental pathway focused on mass detection [22]:
Crystal Preparation: Clean AT-cut quartz crystals with precision. Functionalize the gold electrode surface with specific biorecognition elements (antibodies, aptamers) using self-assembled monolayers (SAMs) through gold-thiol chemistry.
Flow Cell Assembly: Incorporate the crystal into a flow cell system allowing controlled sample introduction while maintaining stable oscillation conditions.
Baseline Establishment: Record resonance frequency in buffer solution to establish stable baseline before sample injection.
Sample Measurement: Introduce analyte solutions with precise flow control. Monitor frequency shift (Δf) in real-time during analyte binding.
Data Processing: Calculate mass change using the Sauerbrey equation: Δf = -2f₀²Δm/(A√(ρₑμₑ)), where f₀ is fundamental frequency, Δm is mass change, A is active area, ρₑ is quartz density, and μₑ is shear modulus.
Viscosity Correction: Apply Kanazawa and Gordon equation for measurements in liquid samples: Δf = -f₀³/²√(ηₗρₗ/(πρₑμₑ)), where ηₗ is liquid viscosity and ρₗ is liquid density.
Figure 2: Experimental protocol workflow for biosensor development showing common steps and technology-specific procedures for electrochemical, optical, and piezoelectric platforms.
Research Reagent Solutions and Materials
The performance of biosensor platforms depends critically on the quality and specificity of research reagents and materials. The table below outlines essential components and their functions across different biosensor types.
Table 2: Essential Research Reagents and Materials for Biosensor Development
| Material/Reagent | Function | Biosensor Application |
|---|---|---|
| Gold Electrodes | Provides conductive surface for electron transfer; enables thiol-based immobilization | Electrochemical, Piezoelectric [21] [22] [70] |
| Enzymes (GOx, FAD-GDH) | Biological recognition element for specific substrate conversion | Electrochemical [21] [72] [70] |
| Antibodies/Aptamers | High-affinity binding to specific antigens/targets | Optical, Piezoelectric, Electrochemical [21] [22] |
| Redox Mediators (Quinones, Ferricyanide) | Shuttles electrons between biorecognition element and electrode | Electrochemical [21] [72] |
| Nanomaterials (AuNPs, Graphene, CNTs) | Enhances surface area, electron transfer, and signal amplification | Electrochemical, Optical [21] [11] [68] |
| Polymers (PDMS, PI, PET) | Flexible substrates with tunable optical/mechanical properties | Optical (Wearable) [11] |
| Quartz Crystals | Piezoelectric substrate for mass-sensitive detection | Piezoelectric (QCM) [22] |
| Functional Monomers | Creates molecularly imprinted polymers (MIPs) for artificial receptors | Electrochemical [21] |
Implementation in Pandemics and Resource-Limited Settings
The deployment of biosensors during public health emergencies requires careful consideration of operational constraints and performance requirements. The REASSURED framework provides comprehensive criteria for evaluating diagnostic suitability in these challenging environments [21].
Electrochemical biosensors represent the most mature technology for resource-limited settings, with proven deployment in glucose monitoring and emerging applications in infectious disease detection [21] [70]. Their advantages include minimal power requirements, rapid results, simple operation, and low manufacturing costs. Recent innovations in paper-based electrochemical sensors further enhance their suitability for resource-constrained environments by eliminating the need for sophisticated instrumentation [21].
Optical biosensors offer superior sensitivity but face implementation challenges due to higher cost and complexity [11] [68]. However, recent advancements in portable SPR systems and the integration of smartphone-based detection have improved their field deployment potential [11]. The development of flexible optical biosensors using polymer substrates like PDMS and PI enables wearable monitoring applications, particularly valuable for continuous health assessment during pandemics [11].
Piezoelectric biosensors currently demonstrate more limited applicability in resource-limited settings due to sensitivity to environmental conditions and relatively complex instrumentation [22]. While they offer label-free detection and moderate sensitivity, their implementation in point-of-care scenarios remains challenging compared to electrochemical alternatives.
The integration of artificial intelligence and machine learning across all platforms shows promise for enhancing diagnostic accuracy and reducing operational complexity [73] [69]. AI-assisted signal processing can compensate for environmental variations and user technique inconsistencies, particularly valuable in settings with limited trained personnel [73] [69].
This comparative analysis demonstrates that each biosensor technology offers distinct advantages for pandemic response and resource-limited applications. Electrochemical biosensors currently provide the most balanced performance characteristics for decentralized testing, combining adequate sensitivity with practical implementation requirements. Optical platforms deliver superior analytical performance but require further development to address cost and complexity barriers. Piezoelectric systems, while valuable for laboratory research, face significant challenges in field deployment.
Future development should focus on multiplexed detection capabilities, integration with digital health technologies, and enhanced stability under challenging environmental conditions. The convergence of biosensor technologies with artificial intelligence, advanced nanomaterials, and microfluidics will likely yield next-generation platforms that transcend current performance limitations. For researchers and drug development professionals, selection criteria should prioritize not only analytical sensitivity but also the practical considerations of cost, stability, and operational simplicity required for successful deployment in global health emergencies.
Overcoming Technical Hurdles: Strategies for Enhancing Sensitivity, Specificity, and Reproducibility
Addressing Non-Specific Binding and Signal Interference in Complex Clinical Samples
The accurate detection of target analytes in complex clinical samples such as blood serum, urine, and tissue homogenates represents a significant challenge in biosensor development. Non-specific binding (NSB) of interfering substances and signal interference from sample matrix components can severely compromise analytical performance, leading to reduced sensitivity, false positives, and unreliable quantification [21]. These challenges are particularly pronounced in point-of-care diagnostics where minimal sample processing is desired. As biosensing technologies evolve to meet demands for higher sensitivity and earlier disease detection, addressing these fundamental limitations becomes increasingly critical for successful clinical translation.
This guide provides a comparative analysis of how three principal biosensing platforms—electrochemical, optical, and piezoelectric—manage NSB and signal interference. By examining their fundamental operating principles, specific mitigation strategies, and experimental performance in complex matrices, we aim to provide researchers and developers with a practical framework for selecting and optimizing biosensor platforms for specific clinical applications.
Biosensor Technology Platforms: Fundamental Principles and Interference Challenges
Electrochemical Biosensors
Electrochemical biosensors transduce biological recognition events into measurable electrical signals such as current, potential, or impedance [21]. These systems typically employ a three-electrode configuration (working, reference, and counter electrodes) and detection techniques including cyclic voltammetry (CV), differential pulse voltammetry (DPV), and electrochemical impedance spectroscopy (EIS) [65] [21].
The biorecognition element (e.g., antibody, aptamer, enzyme) is immobilized on the working electrode surface, often using strategies such as gold-thiol interactions, electropolymerized films, or covalent bonding to enhance stability and reduce NSB [21]. Despite these approaches, electrochemical systems remain vulnerable to interference from electroactive compounds in clinical samples (e.g., ascorbic acid, uric acid) which can generate non-faradaic currents, and fouling of electrode surfaces by proteins or other macromolecules [21] [74].
Optical Biosensors
Optical biosensors detect analytes by measuring changes in light properties resulting from biomolecular interactions, using mechanisms including surface plasmon resonance (SPR), fluorescence, photoluminescence, and surface-enhanced Raman scattering (SERS) [12] [68]. These platforms benefit from high sensitivity, resistance to electromagnetic interference, and the potential for multiplexing [21] [68].
SPR-based sensors detect refractive index changes near a functionalized metal surface, while SERS platforms utilize plasmonic nanomaterials (e.g., Au-Ag nanostars) to significantly enhance Raman signals for ultrasensitive detection [16] [68]. However, optical systems can suffer from interference through light scattering by particulate matter, autofluorescence from sample components, and non-specific adsorption to sensing surfaces, which alter optical pathways and generate background noise [68].
Piezoelectric Biosensors
Piezoelectric biosensors operate based on mass-sensitive detection, where the binding of target molecules to a functionalized crystal surface (commonly quartz) alters its resonance frequency [21]. These label-free devices are particularly valuable for monitoring binding events in real-time without requiring external labels.
The primary challenge for piezoelectric biosensors in complex samples is non-mass-related interference, where viscosity changes, non-specific adsorption of non-target molecules, or particulate deposition on the sensor surface can produce frequency shifts indistinguishable from specific binding events [75] [21]. While these systems are less commonly deployed in clinical settings compared to electrochemical and optical platforms, ongoing technological advancements continue to address these limitations.
Comparative Analysis of Interference Management Strategies
Table 1: Comparison of Interference Management Strategies Across Biosensor Platforms
| Biosensor Platform | Primary Interference Sources | Key Mitigation Strategies | Advantages | Limitations |
|---|---|---|---|---|
| Electrochemical | Electroactive compounds in sample, electrode fouling, non-specific adsorption | Surface passivation (MCH, BSA) [74], nanomaterial-modified electrodes [21], potential cycling, selective membranes | High inherent selectivity with proper modification, effective passivation protocols | Vulnerable to diverse electroactive interferents, requires multiple mitigation layers |
| Optical | Light scattering, autofluorescence, refractive index changes, non-specific adsorption | Spectral separation, plasmonic nanomaterials [16], reference channel normalization, surface functionalization [68] | Low electromagnetic interference, multiple detection parameters available | Complex instrumentation, background signals from sample matrix |
| Piezoelectric | Non-mass effects (viscosity, density), non-specific adsorption | Microbalance designs, viscosity compensation algorithms, reference crystals, surface modification [75] | Label-free operation, real-time monitoring | Limited application in complex liquids, sensitive to environmental changes |
Table 2: Performance Comparison in Complex Clinical Samples
| Biosensor Platform | Reported LOD in Buffer | Reported LOD in Clinical Sample | Signal Reduction in Complex Matrix | Key Clinical Demonstration |
|---|---|---|---|---|
| Electrochemical | 0.8 fM (miRNA-21) [74] | Similar performance in spiked serum [74] | Minimal with optimized surface chemistry | Enzyme-free miRNA detection in serum [74] |
| Optical | 16.73 ng/mL (AFP) [16] | Not specified for clinical sample | Addressed by surfactant-free aqueous platform [16] | AFP cancer biomarker detection with SERS [16] |
| Piezoelectric | Varies by target | Limited data for undiluted samples | Significant in unprocessed samples; requires sample pre-treatment | Primarily researched in controlled buffers with synthetic samples [75] |
Experimental Protocols for Addressing NSB and Signal Interference
Electrochemical Biosensor Protocol for miRNA Detection in Serum
The following detailed protocol, adapted from an enzyme-free electrochemical biosensor for microRNA-21 detection, demonstrates effective strategies for managing interference in complex serum samples [74]:
1. Electrode Preparation and Modification:
- Polish gold disk electrode (3mm diameter) with 0.05 μm alumina slurry, followed by ultrasonic cleaning in ultrapure water.
- Treat electrode surface with piranha solution (3:1 H₂SO₄:H₂O₂) to create a clean, hydrophilic surface. Caution: Piranha solution is highly corrosive and requires careful handling.
- Incubate electrode with 10 μL of 100 nM thiol-modified hairpin probe (HP1) at 4°C for 12 hours to form self-assembled monolayers via gold-thiol bonds.
- Block non-specific sites with 10 μL of 1 mM 6-mercapto-1-hexanol (MCH) for 1 hour to displace non-specifically adsorbed DNA and minimize NSB.
- Further passivate with 1% bovine serum albumin (BSA) for 30 minutes to prevent protein fouling during serum analysis.
2. Target Recycling Amplification and Detection:
- Mix serum samples containing target miRNA-21 with hairpin probe 2 (HP2) at 1:4 volume ratio (final HP2 concentration: 200 nM).
- Apply 10 μL of mixture to modified electrode and incubate for 1 hour to facilitate target recycling amplification.
- During incubation, prepare NHCR components: substrate-A and substrate-B, each with 2 μM corresponding auxiliary strands, incubated separately for 30 minutes.
- After TRA reaction, trigger nonlinear hybridization chain reaction (NHCR) by adding prepared substrate solutions to produce high molecular weight double-stranded DNA with multiple biotin labels.
- Incubate with streptavidin-alkaline phosphatase (ST-AP) for 30 minutes, enabling conjugation between biotin labels and enzyme.
- Add α-naphthyl phosphate (α-NP) substrate and measure electrochemical signal generated by α-naphthol product using differential pulse voltammetry.
Key Interference Control Mechanisms:
- Dual passivation with MCH and BSA effectively minimizes NSB and electrode fouling.
- Enzyme-free amplification eliminates variability associated with enzymatic reactions.
- Hairpin probe design provides inherent structural specificity, reducing false positives.
- Optimized buffer systems (PBS with MgCl₂ and Tween-20) maintain assay stability while reducing non-specific interactions.
Optical Biosensor Protocol for Protein Detection in Clinical Samples
This protocol for α-fetoprotein (AFP) detection using a SERS-based immunoassay illustrates interference management strategies for optical platforms [16]:
1. Nanostar Synthesis and Optimization:
- Synthesize Au-Ag nanostars with sharp-tipped morphology through seed-mediated growth.
- Concentrate nanostars via centrifugation (10, 30, and 60 min intervals) to optimize plasmonic enhancement.
- Characterize SERS enhancement using methylene blue (MB) and mercaptopropionic acid (MPA) as probe molecules.
2. Surface Functionalization and Assay:
- Functionalize optimized nanostars with MPA to create self-assembled monolayers.
- Activate carboxyl groups with EDC/NHS chemistry for covalent attachment of anti-AFP antibodies.
- Incubate functionalized nanostars with clinical samples (serum/plasma) for 30 minutes.
- Measure intrinsic vibrational signals of captured AFP using Raman spectroscopy without additional labels.
Key Interference Control Mechanisms:
- Surfactant-free aqueous platform minimizes background interference.
- Sharp-tipped nanostar morphology provides intense electromagnetic enhancement, enabling direct detection of intrinsic AFP signals.
- Covalent antibody immobilization oriented presentation and enhanced stability.
- Spectral fingerprinting distinguishes specific signals from background interference.
Piezoelectric Biosensor Protocol for Pathogen Detection
While specific clinical protocols for piezoelectric biosensors in complex matrices are limited in the search results, the following generalized protocol can be applied based on current literature [21] [45]:
1. Crystal Functionalization:
- Clean quartz crystal microbalance (QCM) sensor crystals with oxygen plasma treatment.
- Immobilize capture probes (antibodies, aptamers) using appropriate chemistries (e.g., silanization, thiol-gold).
- Block non-specific sites with BSA or casein to minimize NSB.
2. Sample Analysis:
- Dilute clinical samples in appropriate buffer to reduce viscosity effects.
- Apply samples to sensor surface while monitoring frequency and dissipation shifts.
- Use reference crystals with non-specific probes to distinguish specific binding.
- Regenerate surface with mild denaturing conditions for reuse.
Key Interference Control Mechanisms:
- Viscosity compensation through dual-parameter monitoring (frequency and dissipation).
- Reference crystal subtraction accounts for non-mass effects.
- Sample dilution reduces matrix complexity at potential sensitivity cost.
- Surface regeneration enables multiple measurements for improved statistical reliability.
The Scientist's Toolkit: Essential Reagents and Materials
Table 3: Key Research Reagent Solutions for Interference Management
| Reagent/Material | Function | Specific Example | Considerations for Use |
|---|---|---|---|
| 6-Mercapto-1-hexanol (MCH) | Surface passivation to reduce NSB in electrochemical sensors | Displaces non-specifically adsorbed DNA on gold electrodes [74] | Use following thiolated probe immobilization; optimize concentration to maintain probe accessibility |
| Bovine Serum Albumin (BSA) | Blocking agent for non-specific sites | Prevents protein fouling on electrode and sensor surfaces [74] | Apply after probe immobilization; test different concentrations for optimal signal-to-noise |
| EDC/NHS Chemistry | Covalent immobilization of recognition elements | Crosslinks antibodies to carboxyl-functionalized surfaces [16] | Fresh preparation required due to hydrolysis; optimize ratio for specific antibody |
| Plasmonic Nanomaterials | Signal enhancement in optical biosensors | Au-Ag nanostars for SERS-based detection [16] | Tune morphology and concentration for maximum enhancement; ensure colloidal stability |
| Hairpin DNA Probes | Specific recognition with inherent structural specificity | Target recycling amplification for miRNA detection [74] | Carefully design stem-loop structures; validate thermal stability |
| Nonlinear HCR Components | Signal amplification through branched DNA structures | Generates high molecular weight DNA products for enhanced detection [74] | Optimize stoichiometry of substrate strands; confirm trigger specificity |
The effective management of non-specific binding and signal interference in complex clinical samples remains a pivotal challenge in biosensor development. Each biosensor platform presents distinct advantages and limitations in this regard:
Electrochemical biosensors offer the advantage of established, effective surface passivation strategies (MCH, BSA) and sophisticated amplification methodologies that can maintain exceptional sensitivity even in challenging matrices like serum [74]. The enzyme-free approaches emerging in recent research demonstrate particular promise for enhancing robustness and reducing cost.
Optical biosensors leverage the unique capabilities of plasmonic nanomaterials and intrinsic signal transduction mechanisms that are less susceptible to certain forms of electrochemical interference [16] [68]. The continuing development of advanced nanostructures with enhanced enhancement factors provides a powerful pathway for overcoming background interference.
Piezoelectric biosensors, while less commonly applied directly in complex clinical samples, offer mass-sensitive detection that is inherently orthogonal to optical and electrochemical methods, suggesting potential for complementary applications in specific diagnostic scenarios [75] [21].
The selection of an appropriate biosensing platform must consider the specific clinical matrix, target analyte concentration, and required detection robustness. Future directions point toward integrated approaches that combine the strengths of multiple sensing modalities, advanced machine learning algorithms for interference discrimination, and continued innovation in nanomaterial design to push the boundaries of detection specificity in complex clinical samples [12] [21].
Optimizing Surface Functionalization and Bioreceptor Immobilization Techniques
The performance of a biosensor is fundamentally dictated by the careful engineering of its interface, where surface functionalization and bioreceptor immobilization occur. These processes control the density, orientation, and stability of biological recognition elements, directly influencing analytical sensitivity, specificity, and operational longevity [76] [77]. For researchers and drug development professionals, selecting the optimal immobilization strategy is critical, as it must be compatible with the transducer material and the intended application. This guide provides a comparative analysis of major functionalization techniques, supported by experimental data and protocols, to inform the development of electrochemical, optical, and piezoelectric biosensors.
Key Surface Functionalization Strategies and Performance Comparison
Surface functionalization strategies can be broadly categorized into covalent, non-covalent, and nanomaterial-enhanced methods. The choice of strategy depends on the transducer material, the nature of the bioreceptor, and the required stability of the biosensing interface.
Table 1: Comparison of Key Surface Functionalization Strategies
| Strategy | Mechanism | Common Materials | Key Advantages | Key Limitations |
|---|---|---|---|---|
| Covalent Binding | Forms strong, stable covalent bonds between the surface and bioreceptor. | APTES, GOPS, Glutaraldehyde (GA) [76] [77] [78] | High stability; reduced bioreceptor leaching; controlled orientation. | Requires specific functional groups; complex multi-step protocols. |
| Self-Assembled Monolayers (SAMs) | Spontaneous organization of molecules on a surface (e.g., thiols on gold) [76] [79]. | Alkanethiols on gold | Highly ordered, dense, and reproducible layers. | Primarily limited to gold surfaces; can be sensitive to environmental conditions. |
| Bioaffinity Immobilization | Exploits high-affinity biological interactions (e.g., avidin-biotin) [79]. | Avidin, Streptavidin, Biotinylated molecules | High degree of control over orientation and activity; simple procedure. | Can be expensive; stability dependent on the affinity pair. |
| Physical Adsorption | Relies on non-specific physical forces (electrostatic, hydrophobic) [79]. | Polymers (e.g., chitosan, PDA) | Simple and fast; no chemical modification needed. | Low stability; random orientation; high risk of desorption and denaturation. |
| Nanomaterial-Assisted | Uses nanomaterials to increase surface area and enhance signal [76]. | Gold nanoparticles, graphene, CNTs | Significant signal amplification; high probe density. | Potential issues with reproducibility and non-specific binding. |
Experimental Protocols for Key Immobilization Techniques
Silanization with APTES on Oxide Surfaces
Silanization with 3-aminopropyltriethoxysilane (APTES) is a widely used method to introduce amine groups onto oxide surfaces (e.g., silicon, glass) for subsequent covalent immobilization.
- Surface Cleaning: Thoroughly clean the substrate (e.g., silicon wafer) with oxygen plasma or piranha solution to create a hydrophilic, hydroxyl-rich surface.
- Solution-Phase Deposition: Immerse the substrate in a 2-5% (v/v) solution of APTES in anhydrous toluene for 1-2 hours under an inert atmosphere. Using anhydrous conditions is critical to prevent uncontrolled polymerization and multilayer formation.
- Post-Treatment Rinsing: Rinse the substrate sequentially with toluene, acetone, and ethanol to remove physisorbed APTES molecules.
- Curing: Cure the surface at 110°C for 10-20 minutes to complete the covalent bonding to the surface.
- Characterization: The resulting APTES monolayer can be characterized by ellipsometry, showing a typical layer thickness of 1.2 ± 0.4 nm [77]. This amine-functionalized surface can then be activated with a crosslinker like glutaraldehyde for coupling to amine-containing bioreceptors.
Thiol-Based Self-Assembly on Gold Electrodes
This is the most common method for functionalizing gold surfaces, such as those used in electrochemical and piezoelectric quartz crystal microbalance (QCM) sensors.
- Electrode Preparation: Clean the gold electrode electrochemically (e.g., via cyclic voltammetry in sulfuric acid) or via oxygen plasma to ensure a pristine surface.
- SAM Formation: Incubate the electrode in a 1-10 mM solution of thiolated molecules (e.g., alkanethiols, thiolated DNA) in ethanol for 12-24 hours. This allows for the spontaneous formation of a highly ordered monolayer.
- Rinsing and Drying: Rinse the electrode thoroughly with pure ethanol and dry under a stream of nitrogen.
- Backfilling: To minimize non-specific adsorption and create a well-ordered surface, the remaining gold sites are "backfilled" with a short-chain, non-functional thiol like 6-mercapto-1-hexanol (MCH) for 30-60 minutes [79].
- Bioreceptor Coupling: The functional head groups of the SAM (e.g., carboxylic acids) can be activated using EDC/NHS chemistry to covalently immobilize proteins or other bioreceptors.
Photochemical Immobilization Technique (PIT) for Antibodies
PIT is a rapid, simple method for directly immobilizing antibodies on gold surfaces with controlled orientation, without the need for pre-modification.
Detailed Protocol [80]:
- Antibody Solution Preparation: Prepare a solution of the antibody in a phosphate buffer (pH ~7.4).
- UV Irradiation: Place a droplet of the antibody solution on the gold surface and irradiate with UV light (e.g., 270 nm) for a few minutes. The mechanism involves UV-induced reduction of disulfide bridges in the antibody's hinge region, generating reactive thiol groups.
- Surface Washing: Wash the surface with buffer to remove unbound antibodies. Studies using Mass Spectrometry and Surface-Enhanced Raman Spectroscopy have shown that PIT produces a side-on antibody orientation, with one antigen-binding fragment (Fab) exposed to the solution, which remains effective due to the molecule's intrinsic flexibility [80].
Transducer-Specific Considerations and Performance Data
The choice of transducer material dictates the available immobilization chemistries and influences the final sensor performance.
Table 2: Immobilization Strategies and Performance for Different Transducer Materials
| Transducer Material | Preferred Immobilization Strategies | Typical Experimental Performance Data | Key Considerations |
|---|---|---|---|
| Gold | Thiol-based SAMs [79]; Photochemical Immobilization (PIT) [80]. | QCM immunosensor for carbaryl: LOD of 0.14 ng/mL with a 100 MHz resonator [25]. | Excellent for SAM formation; backfilling is crucial to reduce non-specific binding. |
| Carbon | Diazonium electrografting; Adsorption of avidin for biotinylated probes; EDCNHS on carboxylated surfaces [79]. | - | Wide potential window; complex surface chemistry requires careful activation. |
| Silicon/Oxides | Silanization (e.g., APTES, GOPS) [77] [78]. | APTES layer thickness: 1.2 ± 0.4 nm; with glutaraldehyde: 2.1 ± 0.1 nm [77]. | Monolayer control is key; vapor-phase deposition can offer more homogeneous layers than solution-phase. |
| Piezoelectric (QCM) | Same as gold (SAMs). Often used to monitor immobilization in real-time via frequency shift. | QCM mass sensitivity: ~4.4 ng/cm² for a 10 MHz crystal (Δf = 1 Hz) [25]. | The Sauerbrey equation quantifies mass loading; performance in liquid must account for viscosity [22] [25]. |
The Scientist's Toolkit: Essential Research Reagent Solutions
Table 3: Key Reagents for Surface Functionalization and Immobilization
| Reagent / Material | Function / Role in Immobilization |
|---|---|
| APTES (3-Aminopropyltriethoxysilane) | Silane coupling agent used to introduce primary amine (-NH₂) groups onto oxide surfaces for covalent bonding [78]. |
| GOPS (3-Glycidyloxypropyltrimethoxysilane) | Silane coupling agent that introduces reactive epoxide rings for immobilization with amine groups under mild conditions [77]. |
| EDC / NHS | Crosslinking agents that activate carboxylic acid groups for efficient amide bond formation with primary amines [16]. |
| Glutaraldehyde | Homobifunctional crosslinker that connects amine-bearing surfaces (e.g., from APTES) to amine-containing bioreceptors [77]. |
| Avidin/Streptavidin | Protein that physically adsorbs to various materials, providing a universal anchoring point for biotinylated biomolecules [79]. |
| MCH (6-Mercapto-1-hexanol) | Used to "backfill" leftover sites on gold surfaces after SAM formation, reducing non-specific binding and orienting probes [79]. |
| Gold Nanoparticles (AuNPs) | Nanomaterial used to increase surface area, enhance electronic or plasmonic signals, and facilitate denser bioreceptor immobilization [76] [16]. |
| Polydopamine (PDA) | A versatile polymer that forms a thin, adherent coating on virtually any surface, providing a platform for secondary functionalization [76]. |
Advanced Optimization: The Role of AI and Simulation
The development of biosensor surfaces is being transformed by artificial intelligence (AI) and computational modeling, moving beyond traditional trial-and-error approaches.
- AI-Driven Optimization: Machine learning (ML) models, including neural networks and genetic algorithms, can analyze complex datasets to predict optimal surface architectures, material compositions, and bioreceptor configurations. This data-driven approach accelerates the optimization of biosensor interfaces, reducing development cycles [76].
- Finite Element Method (FEM) Simulation: FEM can be used to visualize and analyze the diffusion profiles of substrates and mediators within a biosensor strip. For instance, simulations have confirmed that in advanced glucose sensor strips using a quinone mediator with high enzyme reactivity, the rate-limiting step is substrate diffusion. This understanding allows for the design of sensors with higher sensitivity and a wider measurement range using minimal mediator amounts [72]. The following diagram illustrates the conceptual diffusion and reaction layers within such an electrochemical biosensor.
Optimizing surface functionalization is a critical determinant of biosensor performance. As demonstrated, the choice between covalent, non-covalent, and nanomaterial-enhanced strategies involves trade-offs between stability, simplicity, and signal strength. The experimental protocols and performance data provided serve as a guide for researchers to make informed decisions tailored to their specific transducer and application. The future of this field lies in the increasing adoption of AI and computational models, which promise to usher in a new era of rationally designed, high-performance biosensing platforms for advanced diagnostics and drug development.
Advanced Signal Amplification Strategies using Nanoparticles and Nanostructures
This guide provides a comparative analysis of how nanoparticles and nanostructures are utilized to amplify signals in electrochemical, optical, and piezoelectric biosensors, focusing on performance metrics and underlying methodologies critical for research and drug development.
Biosensors are analytical devices that combine a biological recognition element with a physicochemical transducer to detect specific analytes [81]. A major challenge in biosensing is that the interaction between a biological probe and its target often produces a very weak signal, making it difficult to detect low-abundance biomarkers directly [81] [82]. Signal amplification strategies are therefore employed to enhance the output signal, thereby improving the sensitivity, selectivity, and limit of detection (LOD) of these devices [81] [83] [82]. These strategies can be broadly classified into target-based amplification, which increases the number of detectable analytes (e.g., via nucleic acid amplification), and signal-based amplification, which modifies the transducer to intensify the signal per binding event [82]. The integration of nanoparticles (NPs) and nanostructured materials (NSMs) has been pivotal in advancing both approaches, leveraging their unique tunable physical, chemical, and biological properties to significantly boost biosensor performance [84] [85].
Performance Comparison of Biosensor Platforms
The table below summarizes key performance characteristics of major biosensor types that utilize nanoparticles for signal amplification.
Table 1: Performance Comparison of Biosensor Platforms with Nanoparticle-Enhanced Signal Amplification
| Biosensor Platform | Key Nanomaterials Used | Typical Signal Readout | Key Strengths | Typical Limits of Detection (LOD) | Example Applications |
|---|---|---|---|---|---|
| Electrochemical [81] [83] [82] | Metal NPs (Au, Ag), graphene, carbon nanotubes, polymer NPs | Current, potential, impedance | High sensitivity and selectivity, fast response, portable, low cost, compatible with miniaturization [81] [83] | Nucleic acids: down to attomolar (aM) levels [82]; Proteins: variable, down to low ng/mL levels [86] | Viral detection (SARS-CoV-2, HPV) [82], cancer biomarkers [83] [87], environmental monitoring [81] |
| Optical [88] [49] [87] | Plasmonic NPs (Au, Ag nanospheres, nanorods), quantum dots, carbon dots | Light absorption, scattering, fluorescence, Raman signal | Ultra-high sensitivity, capacity for multiplexing, visualization capability, rapid sensing [88] [87] | SERS: single-molecule sensitivity [87]; Waveguide: ~50 nM nucleic acids [88] | Cancer biomarker sensing [87], influenza detection [88], bioimaging [85] |
| Piezoelectric [57] | Gold films, metal oxide NPs, polymer nanostructures | Resonant frequency shift, dissipation factor | Label-free, real-time monitoring, provides kinetic data, relatively inexpensive [57] | Mass change: ~4.4 ng/cm² for a 10 MHz crystal [57] | Immunosensing [57], pathogen detection [57], monitoring of cellular activities [57] |
Experimental Protocols for Key Methodologies
Electrochemical Signal Amplification via Nanomaterial Transducers
Objective: To fabricate an electrode modified with nanomaterials to enhance the electrochemical signal for the detection of a specific protein biomarker.
Materials:
- Working Electrode: Glassy carbon, gold, or screen-printed carbon electrode.
- Nanomaterials: Gold nanoparticles (AuNPs), graphene oxide, multi-walled carbon nanotubes.
- Biorecognition Element: Antibody or aptamer specific to the target biomarker.
- Crosslinkers: 1-Ethyl-3-(3-dimethylaminopropyl)carbodiimide (EDC), N-hydroxysuccinimide (NHS).
- Blocking Agent: Bovine serum albumin (BSA).
- Electrochemical Probe: Potassium ferricyanide/ferrocyanide ([Fe(CN)₆]³⁻/⁴⁻).
Procedure:
- Electrode Pretreatment: Polish the working electrode with alumina slurry and wash thoroughly with deionized water.
- Nanomaterial Modification: Deposit the nanomaterial suspension (e.g., AuNPs) onto the electrode surface and allow to dry. This increases the electroactive surface area and enhances electron transfer [83] [86].
- Bioreceptor Immobilization: Activate the nanomaterial surface with EDC/NHS chemistry. Incubate with the antibody or aptamer solution to facilitate covalent bonding. Site-specific immobilization techniques are recommended to ensure optimal orientation and activity of the bioreceptor [86].
- Surface Blocking: Treat the electrode with BSA to block any remaining non-specific binding sites.
- Target Incubation & Measurement: Expose the modified electrode to samples containing the target biomarker. After binding, perform electrochemical measurements (e.g., Differential Pulse Voltammetry or Electrochemical Impedance Spectroscopy) in the presence of the redox probe. The binding event causes a measurable change (e.g., decrease in current, increase in impedance) proportional to the target concentration, which is amplified by the nanomaterial transducer [83] [86].
Optical Signal Amplification via Plasmonic Nanoparticles
Objective: To utilize the Localized Surface Plasmon Resonance (LSPR) of gold nanoparticles for the sensitive detection of a cancer biomarker.
Materials:
- Plasmonic Nanoparticles: Spherical AuNPs or gold nanorods (AuNRs) with tunable LSPR peaks.
- Substrate: Glass slide or waveguide.
- Biorecognition Element: Antibody or DNA probe.
- Instrumentation: Spectrophotometer, dark-field microscope, or surface-enhanced Raman scattering (SERS) spectrometer.
Procedure:
- Sensor Fabrication: Immobilize the capture bioreceptor onto a solid substrate. Alternatively, the bioreceptor can be conjugated directly to the surface of the plasmonic nanoparticles.
- LSPR Tuning: Synthesize or purchase AuNRs with an aspect ratio that tunes their LSPR to the near-infrared region, which is optimal for biological tissues [87].
- Assay Assembly: For a sandwich assay, the target analyte is first captured on the substrate and then detected by the bioreceptor-conjugated plasmonic nanoparticles.
- Signal Detection and Amplification: The presence of the target analyte leads to the assembly or aggregation of nanoparticles on the sensor surface. This causes a shift in the LSPR wavelength and/or an intense amplification of the local electromagnetic field.
- Readout: The signal is measured as a colorimetric shift, a change in scattering intensity under dark-field microscopy, or a dramatic enhancement of the Raman signal (SERS) from molecules adsorbed on the nanoparticle surface, enabling single-molecule sensitivity [87].
Piezoelectric Signal Detection via Mass Loading
Objective: To detect the binding of a target molecule in real-time using a piezoelectric quartz crystal microbalance (QCM).
Materials:
- Piezoelectric Sensor: AT-cut quartz crystal with gold electrodes (e.g., 10 MHz).
- Oscillator Circuit: To drive the crystal at its resonant frequency.
- Frequency Counter: To monitor frequency changes with high precision (≥1 Hz resolution).
- Biorecognition Element: Antibody or aptamer.
Procedure:
- Baseline Measurement: Place the QCM sensor in the flow cell and introduce buffer solution. Record the stable baseline resonant frequency (f₀).
- Bioreceptor Immobilization: Functionalize the gold electrode surface and immobilize the capture bioreceptor (e.g., antibody) using standard chemistries like self-assembled monolayers.
- Target Binding Measurement: Introduce the sample containing the target analyte. As the analyte binds to the surface, the mass on the electrode increases, leading to a decrease in the resonant frequency (Δf) as described by the Sauerbrey equation [57].
- Data Analysis: Monitor the frequency shift in real-time. The change in frequency (Δf) is proportional to the mass bound to the sensor surface, allowing for the quantification of the target analyte. For viscoelastic layers like cells, the dissipation factor (D) should also be monitored (QCM-D) for a more accurate interpretation [57].
Signaling Pathways and Workflow Visualizations
Electrochemical Nanomaterial Amplification Workflow
Plasmonic Optical Signal Amplification Mechanism
The Scientist's Toolkit: Essential Research Reagents and Materials
Table 2: Key Research Reagent Solutions for Nanoparticle-Enhanced Biosensing
| Item | Function in Experiment | Common Examples |
|---|---|---|
| Gold Nanoparticles (AuNPs) | Plasmonic enhancers for optical sensors; excellent conductors for electrochemical transducers; facile surface chemistry for biomolecule conjugation [84] [87]. | Spherical AuNPs (10-100 nm), Gold Nanorods (tunable NIR LSPR) [87] |
| Carbon Nanomaterials | Increase electroactive surface area and facilitate electron transfer in electrochemical sensors [84] [83]. | Graphene, Graphene Oxide, Carbon Nanotubes [84] |
| Specific Bioreceptors | Molecular recognition elements that provide the sensor's specificity towards the target analyte [83]. | Monoclonal Antibodies, DNA/Aptamers [83] |
| Crosslinking Chemistries | Covalently attach bioreceptors to nanomaterial surfaces while preserving their biological activity and orientation [86]. | EDC/NHS, Maleimide-Thiol, Streptavidin-Biotin [86] |
| Redox Probes | Generate the measurable current in electrochemical techniques; their electron transfer efficiency is modulated by binding events [83] [82]. | Ferricyanide, Methylene Blue [82] |
| Piezoelectric Crystals | Transduce the mass of bound analyte into a measurable frequency shift [57]. | AT-cut Quartz Crystal Microbalance (QCM) with gold electrodes [57] |
The strategic incorporation of nanoparticles and nanostructures provides a powerful pathway for amplifying signals across electrochemical, optical, and piezoelectric biosensing platforms. Electrochemical biosensors, enhanced with conductive nanomaterials, offer an exceptional blend of high sensitivity, portability, and cost-effectiveness, making them strong candidates for point-of-care diagnostics [81] [83] [82]. Optical biosensors leveraging plasmonic nanoparticles achieve unparalleled sensitivity, even down to the single-molecule level, and are ideal for complex laboratory-based assays and imaging [87]. Piezoelectric biosensors offer the key advantage of label-free, real-time monitoring of binding interactions, which is invaluable for kinetic studies [57]. The choice of the optimal platform ultimately depends on the specific application requirements, including the required limit of detection, sample matrix, need for multiplexing, and available infrastructure. The continued development of novel nanomaterials and their synergistic integration with biorecognition elements will undoubtedly push the boundaries of sensitivity and specificity in biosensing.
Mitigating Fouling and Matrix Effects to Improve Reliability
The reliable detection of target analytes in complex, real-world samples is a fundamental challenge in biosensor development. Fouling—the non-specific adsorption of proteins, cells, and other biomolecules onto sensor surfaces—and matrix effects from complex sample compositions are primary factors compromising sensor accuracy and longevity [89] [90]. These phenomena can cause signal drift, reduced sensitivity, false positives/negatives, and ultimately, sensor failure [91]. For researchers and drug development professionals, selecting a biosensor technology necessitates a thorough understanding of its inherent vulnerability to fouling and the available mitigation strategies. This guide provides an objective, data-driven comparison of how fouling impacts major biosensor types (electrochemical, optical, piezoelectric) and evaluates the experimental evidence for anti-fouling technologies, enabling more informed choices for sensitive and reliable in vitro and in vivo applications.
Biosensor Technologies: Comparative Fouling Susceptibility and Mitigation Approaches
The core biosensor transduction principles each interact uniquely with fouling layers, leading to distinct failure modes and performance requirements for anti-fouling strategies.
Table 1: Comparative Analysis of Fouling Impact on Major Biosensor Types
| Biosensor Type | Primary Fouling Impact Mechanism | Common Anti-Fouling Materials & Strategies | Key Challenges |
|---|---|---|---|
| Electrochemical [89] [91] | Non-specific adsorption electrically passivates the electrode surface, increasing impedance and hindering electron transfer. | Polyethylene glycol (PEG) & derivatives, zwitterionic polymers (e.g., PSBMA), hydrogels, peptide layers [89] [91]. | Balancing anti-fouling layer coverage with maintaining analyte diffusion and electron conductivity. |
| Optical [92] [90] | Biofouling scatters light, quenches signals, and creates an interfering optical layer on waveguides, lenses, or windows. | Fluorinated polymers (e.g., Fluoroplast 42), hydrophilic coatings, mechanical wipers, biocidal coatings [92] [90]. | Maintaining optical clarity and signal-to-noise ratio over extended deployments. |
| Piezoelectric [93] | Adsorbed mass from fouling directly adds to the sensed load, causing signal drift and damping acoustic energy. | Piezoelectric self-cleaning (via vibration), hydrophobic surfaces, stimuli-responsive materials [93]. | Integrating effective actuation for in-situ cleaning without damaging the sensitive transducer. |
The following diagram illustrates the logical decision-making pathway for selecting an anti-fouling strategy based on the biosensor platform and application environment.
Experimental Data: Performance Comparison of Anti-Fouling Strategies
Performance of Passive Anti-Fouling Materials
Extensive research has quantified the effectiveness of various material coatings in reducing non-specific adsorption. These are often evaluated by measuring the amount of protein adsorbed or the retention of sensor signal in fouling media.
Table 2: Experimental Performance of Passive Anti-Fouling Materials
| Anti-Fouling Material | Experimental Protocol Summary | Key Performance Results | Supported Biosensor Platforms |
|---|---|---|---|
| Polyethylene Glycol (PEG) [89] | Gold electrode self-assembled with HS-PEG-NH₂; exposed to serum proteins (HE-4, IgG, CA12-5, NSE). | Current response from non-specific proteins was negligible, demonstrating high fouling resistance. | Electrochemical |
| Zwitterionic Polymers (e.g., PSBMA) [89] | Coated surfaces incubated in complex biological fluids; protein adsorption measured via spectroscopic or QCM techniques. | Forms a strong hydration layer via hydrogen bonds; overall electro-neutrality minimizes electrostatic protein adsorption. | Electrochemical, Optical |
| Fluorinated Polymers (e.g., F42) [92] | Optical DO sensors with F42, PS, and PBMA membranes biofouled for 2 weeks in bioreactors with yeast/bacteria. | F42-based sensor remained functional post-biofouling; PS and PBMA sensors showed significant performance degradation. | Optical |
| Hydrogels [89] | Polymer networks swollen with water formed on sensor surfaces; tested for non-specific protein adsorption. | Highly hydrophilic, porous structure acts as a physical barrier and reduces protein adhesion. | Electrochemical, Implantable |
Emerging Active and Systems-Based Strategies
Beyond passive coatings, advanced strategies involve dynamic systems or "smart" materials that respond to their environment.
Table 3: Emerging and Active Anti-Fouling Strategies
| Strategy | Mechanism of Action | Experimental Evidence & Efficacy | Considerations |
|---|---|---|---|
| Piezoelectric Self-Cleaning [93] | The membrane generates an electrical response to hydraulic pressure, repelling foulants via electrokinetics and dielectrophoresis. | In 15-day filtration, reduced TMP growth by >50%; suppressed EPS secretion and altered microbial community. | Energy-autonomous; suitable for filtration and flow-based sensors. |
| Magnetic Bead-Based Assay [89] | Immunorecognition occurs on anti-fouling-coated magnetic beads, physically separated from the electrode. | Achieved ultralow LOD of 6.31 ag mL⁻¹ for h-IgG in serum; eliminates electrode surface contamination. | Electrochemical; requires complex fluidic handling. |
| Stimuli-Responsive Polymers [91] | Material properties (e.g., hydrophilicity) change in response to stimuli (pH, temperature, light), releasing fouling layers. | Demonstrated reversible fouling release in laboratory settings; promising for implantable and reusable sensors. | Long-term stability and biocompatibility under chronic stimulation require further validation. |
Essential Reagents and Materials for Anti-Fouling Research
The experimental protocols featured in this guide rely on a core set of research reagents and materials.
Table 4: Key Research Reagent Solutions for Anti-Fouling Studies
| Reagent/Material | Function in Experimental Protocol | Example Application |
|---|---|---|
| HS-PEG-NH₂ [89] | Forms a dense, self-assembled monolayer on gold electrodes, creating a hydrophilic, protein-repellent surface. | Modifying electrochemical sensor electrodes for use in serum. |
| Zwitterionic Monomer (e.g., SBMA) [89] | Polymerized to create a surface that binds water molecules tightly, preventing non-specific protein adsorption via its electro-neutral nature. | Coating implantable biosensors to delay the foreign body response. |
| Fluorinated Polymer (e.g., F42) [92] | Creates a sensor membrane with low surface energy, repelling microbial adhesion and biofilm formation. | Fabricating sensitive layers for optical oxygen sensors in bioreactors. |
| Piezoelectric Polymer (e.g., β-PVDF) [93] | The active material in membranes and transducers that generates a cleaning electrical potential in response to mechanical pressure or vibration. | Developing self-cleaning membranes for water treatment and monitoring sensors. |
| Functionalized Magnetic Beads [89] | Solid support for immobilizing biorecognition elements (e.g., antibodies), separating the recognition event from the transducer surface. | Enabling sensitive detection in complex samples for electrochemical immunoassays. |
Detailed Experimental Protocol: Assessing an Anti-Fouling Coating for Electrochemical Sensors
The following workflow details a standard method for creating and testing a PEG-based anti-fouling coating on an electrochemical biosensor, based on methodologies from the literature [89].
Protocol Steps:
- Electrode Preparation: A polycrystalline gold disk electrode is sequentially polished with alumina slurries (e.g., 1.0, 0.3, and 0.05 µm) and sonicated in water and ethanol to create a clean, reproducible surface. Electrochemical cleaning via cycling in sulfuric acid is often performed [89].
- Self-Assembled Monolayer (SAM) Formation: The clean, dry electrode is immersed in an aqueous or ethanolic solution of HS-PEG-NH₂ (typically 1-10 mM) for 4-12 hours. This allows the thiol (SH) group to covalently bind to the gold, forming a dense monolayer with the PEG chains extending outwards [89].
- Biorecognition Element Immobilization: The terminal amine (NH₂) groups of the PEG layer are activated using a crosslinker like a mixture of EDC (1-ethyl-3-(3-dimethylaminopropyl)carbodiimide) and NHS (N-hydroxysuccinimide). The antibody or other biorecognition element is then introduced, forming an amide bond with the activated surface [89].
- Baseline Electrochemical Characterization: Cyclic Voltammetry (CV) and Electrochemical Impedance Spectroscopy (EIS) are performed in a standard redox probe solution (e.g., 5 mM [Fe(CN)₆]³⁻/⁴⁻). This provides a baseline for electron transfer kinetics (CV peak shape and separation) and interface properties (charge transfer resistance, Rₜ, from EIS) [89].
- Fouling Challenge Test: The modified electrode is incubated in the challenging medium, such as undiluted human serum, fetal bovine serum, or a solution of a model protein like bovine serum albumin (BSA), for a set period (1-4 hours) at 37°C [89] [91].
- Post-Fouling Characterization: The electrode is gently rinsed with buffer to remove loosely adsorbed material. CV and EIS measurements are repeated in the same redox probe solution used in Step 4 [89].
- Data Analysis: The effectiveness of the anti-fouling layer is quantified by comparing the pre- and post-fouling electrochemical data. A successful coating will show a minimal change in:
- The charge transfer resistance (Rₜ) from EIS Nyquist plots.
- The peak current and peak-to-peak separation (ΔEp) from CV.
The mitigation of fouling and matrix effects is not a one-size-fits-all endeavor but a critical design parameter that must be aligned with the biosensor platform and its intended application. As the experimental data shows, material science solutions like PEG and zwitterionic polymers provide robust passive protection for electrochemical sensors, while specialized fluoropolymers offer superior performance for optical systems in biofouling environments. Emerging strategies, such as piezoelectric self-cleaning and compartmentalized assays using magnetic beads, push the boundaries of reliability by introducing active or physical cleaning mechanisms. For researchers driving innovation in drug development and diagnostics, the continued validation and refinement of these anti-fouling strategies are paramount to translating sensitive laboratory biosensors into robust, real-world analytical tools.
The Impact of Miniaturization and Integration on Sensor Performance
Sensor miniaturization and integration, driven largely by Micro-Electro-Mechanical Systems (MEMS) and nanotechnology, represent a paradigm shift in sensing capabilities across medical, environmental, and industrial fields [94] [95]. This technological evolution pushes devices toward smaller footprints while integrating multiple functions into single systems. The core question for researchers and drug development professionals is how these scaling and integration processes affect critical performance parameters including sensitivity, limit of detection, and overall reliability. While miniaturization can enhance some aspects of performance by reducing power consumption and improving portability, it also introduces significant engineering challenges related to signal-to-noise ratios, fluidic dynamics, and thermal management [95] [96]. Similarly, sensor integration enables powerful multi-analyte detection and system-level functionality but creates new complexities in signal cross-talk and data processing. This guide objectively compares these impacts across dominant biosensing platforms—electrochemical, optical, and piezoelectric—providing researchers with a structured framework for selecting and optimizing sensor technologies based on application-specific requirements.
Performance Comparison of Miniaturized Sensor Modalities
The effects of miniaturization vary significantly across different sensing modalities due to their distinct transduction mechanisms. The table below provides a systematic comparison of how miniaturization impacts key performance parameters for three primary biosensor types.
Table 1: Performance Comparison of Miniaturized Biosensor Technologies
| Performance Parameter | Electrochemical Sensors | Optical Sensors | Piezoelectric Sensors |
|---|---|---|---|
| Typical Miniaturized Size | Micro-electrodes, Nano-gaps (3-5 μm) [9] | Fiber-optic tips (<1 μm), Micro-plateforms [95] | Nano-cantilevers [96] |
| Sensitivity Trend with Miniaturization | Increases significantly with reduced electrode gap [9] | High in micro-contexts; can be size-dependent [95] [96] | Very high mass sensitivity at nanoscale [96] |
| Limit of Detection (LOD) | Can detect antibodies at 50 ng/mL with optimized gaps [9] | Sub-femtomole for oxygen/glucose sensors [95] | Single molecule detection theoretically possible [96] |
| Response Time | Rapid (seconds-minutes) [9] | Very fast (sub-second range reported) [95] | Fast (seconds) [96] |
| Key Advantage from Miniaturization | Enhanced sensitivity from increased field density; ideal for POC devices [97] [9] | Ultra-small sample volumes; minimal reagent use [97] [95] | Extreme mass sensitivity from high surface-to-volume ratio [96] |
| Primary Challenge with Miniaturization | Increased susceptibility to fouling; precise fabrication required [9] | Signal intensity loss with reduced active area [96] | Thermal noise and environmental interference [96] |
Experimental Insights into Miniaturization Effects
Case Study: Optimizing Electrochemical Impedance Spectroscopy (EIS) Sensors
A recent 2024 study provides quantitative data on geometric optimization for electrochemical biosensors. Researchers used 3D COMSOL modeling and experimental validation to determine the relationship between Interdigitated Electrode (IDE) geometry and impedance sensitivity for detecting human anti-SARS-CoV-2 monoclonal antibodies [9].
Table 2: Experimental Results for IDE Gap Optimization
| Electrode Gap | Minimum Detectable Antibody Concentration | Relative Sensitivity Factor |
|---|---|---|
| 3 μm | 50 ng/mL | 1.0 (Highest) |
| 4 μm | >50 ng/mL | ~0.6 (Estimated) |
| 5 μm | >50 ng/mL | ~0.4 (Estimated) |
Experimental Protocol Summary [9]:
- Sensor Fabrication: Three IDE prototype chips were fabricated with electrode gaps of 3 μm, 4 μm, and 5 μm respectively.
- Biofunctionalization: SARS-CoV-2 spike protein was immobilized on the chip surface as a capture agent.
- Detection Protocol: Human anti-SARS-CoV-2 monoclonal antibody (mAb) was introduced at concentrations ranging from 50-500 ng/mL.
- Signal Amplification: Protein G conjugates were used to amplify the impedance shift upon antibody binding.
- Measurement: Impedance spectra were recorded, with sensitivity defined by the magnitude of impedance change per concentration unit.
The 3 μm gap configuration uniquely achieved detection at 50 ng/mL, demonstrating that reduced inter-electrode gap directly enhances detection limits by concentrating the electric field and increasing the sensitivity to surface binding events [9].
The Miniaturization Trade-Off: Theoretical and Practical Considerations
Despite promising results in controlled studies, nanosensors face fundamental physical constraints. As sensor active areas shrink below 1 μm², they encounter mass transport limitations where the rate of analyte delivery to the sensing surface becomes the limiting factor rather than binding affinity [96]. Furthermore, reduced active areas capture fewer photons, electrons, or molecules, potentially decreasing the signal-to-noise ratio. Research suggests that microscale sensors (1-100 μm) often represent an optimal compromise, balancing the benefits of miniaturization with practical detection requirements [96].
Integration Trends and Their Impact on System Performance
Multi-Functional Integration in Single Devices
Sensor integration combines multiple sensing modalities or analytical functions into a unified system, creating powerful diagnostic platforms. Multi-functional sensors can simultaneously monitor different parameters (e.g., temperature, pressure, vibration) from a single device, while lab-on-chip (LoC) systems integrate complete analytical workflows into miniature platforms [94] [97].
Table 3: Approaches and Impacts of Sensor Integration
| Integration Approach | Key Implementation | Performance Impact | Primary Applications |
|---|---|---|---|
| Multi-analyte Sensing | Combining temperature, humidity, pressure sensors [94] | Comprehensive environmental profiling; reduced system footprint | Industrial predictive maintenance; Environmental monitoring |
| Microfluidics with Biosensors | Lab-on-Chip (LoC) for nucleic acid detection [97] | Ultra-low sample volumes (<10⁻¹⁸ L); faster analysis | Point-of-Care (POC) medical diagnostics; Drug discovery |
| CMOS Integration | CIS (CMOS Image Sensor) packaging innovations [98] | Better heat dissipation; higher reliability in compact form | Smartphones; AI glasses; Portable imaging devices |
| Intelligent Sensing Systems | On-sensor AI preprocessing [99] | Reduced data latency; improved signal-to-noise ratio | Implantable medical devices; Autonomous systems |
Integration-Enabled Advancements in Point-of-Care Diagnostics
The convergence of miniaturization and integration has particularly transformed point-of-care (POC) testing. Microfluidic-based biosensors represent a prime example, managing micro/nanoliter sample volumes while integrating sample preparation, separation, and detection on a single chip [97] [100]. This integration enables devices that meet the ASSURED criteria (Affordable, Sensitive, Specific, User-friendly, Rapid and robust, Equipment-free, Deliverable to end-users) established by the World Health Organization for ideal diagnostics in resource-limited settings [97].
Essential Research Reagent Solutions for Sensor Development
The experimental advances in sensor miniaturization and integration depend on specialized materials and reagents. The following table details key components used in state-of-the-art biosensing research.
Table 4: Key Research Reagents and Materials for Advanced Sensor Development
| Reagent/Material | Function in Sensor Development | Example Applications |
|---|---|---|
| Graphene & Carbon Nanotubes | Enhance electron transfer; provide high surface area for immobilization [95] | Dopamine and serotonin detection in neural probes [95] |
| Protein G Conjugates | Amplify antibody-antigen binding signals [9] | Impedimetric detection of SARS-CoV-2 antibodies [9] |
| Ruthenium diimine complexes | Fluorescence-based oxygen sensing via quenching mechanisms [95] | Fiber-optic oxygen and glucose sensors [95] |
| Polymer Hydrogels | Responsive matrices that swell/shrink with analyte binding [100] | Target-responsive systems for portable visual detection [100] |
| Specific Bioreceptors | Provide molecular recognition (antibodies, aptamers, enzymes) [97] [67] | Pathogen detection (ESKAPE bacteria); metabolic marker sensing [67] |
| Titanium & Ceramic Packaging | Provide biocompatibility and sterilization compatibility [99] | Long-term implantable sensors [99] |
Miniaturization and integration collectively transform sensor performance, but not uniformly across all modalities. Electrochemical sensors achieve remarkable sensitivity gains through geometric optimization, while optical sensors leverage miniaturization for extreme detection limits with minimal sample volumes. Piezoelectric platforms offer exceptional mass sensitivity at the nanoscale but face practical environmental stability challenges. For researchers and drug development professionals, the optimal pathway depends critically on the application context: electrochemical systems for portable POC diagnostics, optical platforms for ultra-sensitive laboratory analysis, and piezoelectric sensors for specialized mass-based detection. Future progress will likely emphasize heterogeneous integration combining multiple sensing modalities with advanced signal processing and AI to overcome the inherent limitations of individual approaches, ultimately creating more intelligent, reliable, and context-aware sensing systems [94] [99].
Head-to-Head Comparison and Validation: Sensitivity, Limits of Detection, and Commercial Viability
The Limit of Detection (LOD) represents a fundamental figure of merit in analytical science, defined as the lowest quantity of a substance that can be reliably distinguished from its absence with a stated confidence level [101]. In the context of biosensor research and development, precise LOD determination provides a critical benchmark for comparing the analytical sensitivity of different sensing platforms, enabling researchers to select appropriate technologies for specific diagnostic applications [102] [103]. While the pursuit of increasingly lower LODs has driven significant advances in biosensor technology, a paradox emerges when this narrow focus overlooks practical utility - lower isn't always better if it compromises other essential factors like detection range, cost-effectiveness, or real-world applicability [104] [105].
This guide provides a structured framework for directly comparing the sensitivity of electrochemical, optical, and piezoelectric biosensors through the rigorous quantification of LOD. For researchers and drug development professionals, understanding these performance metrics is essential for selecting appropriate technologies for specific applications, whether for early disease biomarker detection, therapeutic drug monitoring, or environmental pollutant screening [104] [21]. The following sections present experimental LOD data across biosensor platforms, detailed methodologies for LOD determination, and practical considerations for balancing sensitivity with real-world utility in diagnostic applications.
LOD Performance Comparison Across Biosensor Platforms
Direct comparison of biosensor performance requires standardized evaluation under controlled conditions. The following data illustrates the range of LODs achievable across different biosensing technologies and their applications to specific analytes.
Table 1: Comparative LOD Performance of Commercial SARS-CoV-2 Detection Platforms
| Assay Platform | Technology Category | Probit LOD (copies/ml) | Key Applications |
|---|---|---|---|
| Roche Cobas | High-throughput laboratory | ≤10 | Clinical diagnostics, high-volume testing |
| Abbott m2000 | High-throughput laboratory | 53 | Clinical diagnostics, high-volume testing |
| Hologic Panther Fusion | High-throughput laboratory | 74 | Clinical diagnostics, high-volume testing |
| CDC ABI 7500 (EZ1) | Laboratory PCR | 85 | Public health testing, reference methods |
| DiaSorin Simplexa | Sample-to-answer | 167 | Rapid diagnostics, moderate complexity settings |
| GenMark ePlex | Sample-to-answer | 190 | Rapid diagnostics, multiplexed testing |
| Abbott ID NOW | Point-of-care | 511 | Point-of-care testing, rapid results |
Data derived from direct comparison study using droplet digital PCR for quantification [102].
Table 2: LOD Ranges by Biosensor Technology Category
| Biosensor Category | Typical LOD Range | Advantages | Limitations |
|---|---|---|---|
| Electrochemical biosensors | pM-nM | High sensitivity, low cost, portability, POC compatibility | May require sample preprocessing |
| Optical biosensors | fM-pM | High accuracy, low background interference, resistance to electromagnetic noise | Can require complex instrumentation |
| Piezoelectric biosensors | nM-μM | Label-free detection, real-time monitoring | Sensitive to environmental interference |
| High-throughput laboratory systems | <10-100 copies/ml | Maximum sensitivity, high reproducibility | Require centralized facilities, trained staff |
| Sample-to-answer systems | 100-200 copies/ml | Balanced performance, simplified workflow | Moderate sensitivity compared to lab systems |
| Point-of-care systems | 200-500+ copies/ml | Rapid results, minimal infrastructure | Lower sensitivity than laboratory methods |
Composite data derived from multiple sources [102] [106] [21].
Experimental Protocols for LOD Determination
Statistical Methods for LOD Calculation
The determination of LOD follows established statistical approaches that account for both the analytical sensitivity and the variability in background measurements:
3σ Method: The most common approach defines LOD as the analyte concentration that produces a signal three times the standard deviation of the blank (background) measurements: LOD = 3σ/S, where σ represents the standard deviation of the blank signal and S represents the sensitivity or slope of the calibration curve [101] [21].
Probit Analysis: This more sophisticated statistical method determines the concentration at which 95% of replicate samples test positive, providing a more robust LOD estimation particularly for biological samples with inherent variability [102].
Multivariate Approaches: For sensor systems producing multidimensional data like electronic noses, methods such as principal component regression (PCR) and partial least squares regression (PLSR) can be employed to estimate LOD, though these may yield results differing by a factor of eight or more depending on the algorithm used [107].
Standardized Experimental Workflow
A typical experimental workflow for LOD determination involves the following key steps that ensure reproducible and comparable results across different sensing platforms:
LOD Determination Workflow
The experimental workflow for LOD determination begins with careful preparation of serial dilutions of the target analyte across a concentration range expected to span the detection limit [102] [103]. For each concentration, multiple replicates (typically 20 or more) are analyzed to establish statistical significance, with blank samples repeatedly measured to determine background signal variability [102]. The sensor response is recorded for all measurements, followed by calculation of the mean and standard deviation of the blank signals [101] [21]. A calibration curve plotting signal response against analyte concentration is generated, and an appropriate statistical model (3σ, Probit, etc.) is applied to calculate the LOD with the desired confidence level [102] [101].
Key Experimental Considerations
Several critical factors must be controlled during LOD determination to ensure accurate and reproducible results:
Sample Matrix Effects: The composition of the sample matrix can significantly impact LOD measurements. For SARS-CoV-2 detection, studies have used pooled patient material in universal transport media to mimic clinical conditions [102].
Instrumentation Parameters: Effective sample volume, elution volume, and volume used for amplification critically impact LOD. For example, the Roche Cobas system processes 400μl per sample with all eluate used for PCR, while the Hologic Panther Fusion uses only 5μl of elution for PCR, resulting in different effective tested volumes [102].
Environmental Conditions: Temperature, pH, and ionic strength must be standardized and reported as they can significantly influence LOD measurements, particularly for point-of-care devices intended for use in varied settings [103] [21].
The Scientist's Toolkit: Essential Research Reagents and Materials
Table 3: Essential Research Reagents for Biosensor Development and LOD Determination
| Reagent/Material | Function in LOD Determination | Example Applications |
|---|---|---|
| Biorecognition elements (antibodies, aptamers, enzymes) | Molecular recognition component that provides specificity to target analyte | Antibodies for SARS-CoV-2 detection [102]; aptamers for electrochemical sensors [21] |
| Nanomaterials (gold nanoparticles, graphene, MXenes) | Signal amplification, increased surface area for biorecognition element immobilization | Gold nanostructures for electrochemical biosensors [21]; MXenes for enhanced sensitivity [108] |
| Transducer elements (electrodes, piezoelectric crystals, optical fibers) | Conversion of biological recognition event into measurable signal | Electrodes in electrochemical biosensors [21]; resonant structures in piezoelectric sensors [103] |
| Reference standards (quantified analyte samples) | Calibration and quantification of target analyte | Droplet digital PCR for SARS-CoV-2 quantification [102]; standardized reference materials [107] |
| Immobilization matrices (polymers, self-assembled monolayers) | Stable attachment of biorecognition elements to transducer surface | Polypyrrole films for electropolymerization [21]; cellulose nanofibers for signal enhancement [101] |
| Buffer systems | Maintain optimal pH and ionic strength for biological interactions | Universal transport media for viral transport [102]; specialized buffers for surface chemistry [21] |
Advanced Considerations in LOD Determination
The LOD Paradox: When Lower Isn't Always Better
The intense focus on achieving lower LODs in biosensor research may not always align with practical clinical needs [104] [105]. A biosensor capable of detecting picomolar concentrations of a biomarker represents a technical achievement, but becomes redundant if the biomarker's clinical relevance occurs in the nanomolar range [104]. This "LOD paradox" highlights the importance of aligning technological development with practical utility, considering that excessive focus on sensitivity can compromise other essential features like detection range, linearity, robustness, cost-effectiveness, and user-friendliness [104].
The pursuit of ultra-sensitive detection remains justified for specific applications where biomarkers appear at very low concentrations during early disease stages, such as in cancer diagnostics or early pathogen detection [104]. However, for many clinical applications, the ability of a biosensor to operate within the relevant biological range proves more critical than detecting trace levels well below physiological concentrations [104].
Emerging Technologies and Future Directions
Recent advances in biosensor technology continue to push the boundaries of LOD performance:
MXene-Based Sensors: Two-dimensional transition metal carbides and nitrides offer exceptional electrical conductivity, surface reactivity, and tunable properties that enhance sensitivity across physical, chemical/electrochemical, and optical sensing platforms [108].
Signal Processing Techniques: Advanced algorithms for noise reduction, signal amplification, and data analysis can significantly enhance LOD without physical sensor modifications, particularly for resonant biosensors [103].
Multi-modal Sensing: Combining complementary sensing mechanisms in a single platform extends dynamic range and lowers detection limits by overcoming the limitations of individual techniques [103].
Microfluidic Integration: Controlled sample handling, reduced sample volumes, and efficient mixing through microfluidic systems can enhance the sensor's ability to detect low concentrations and handle a wide range of analyte levels [103].
Direct comparison of Limits of Detection across biosensor platforms provides invaluable insights for researchers and drug development professionals selecting appropriate technologies for specific applications. While high-throughput laboratory systems like the Roche Cobas achieve exceptional sensitivity (≤10 copies/ml), point-of-care platforms like the Abbott ID NOW (511 copies/ml) offer rapid results with minimally compromised sensitivity for many clinical applications [102].
The experimental protocols and comparative data presented in this guide establish a framework for rigorous LOD determination across electrochemical, optical, and piezoelectric biosensing platforms. By balancing the pursuit of sensitivity with practical considerations of detection range, cost-effectiveness, and real-world applicability, researchers can maximize the impact of biosensor technologies in clinical diagnostics, environmental monitoring, and therapeutic development [104] [105] [21].
This guide provides an objective comparison of three primary biosensor transduction platforms—electrochemical, optical, and piezoelectric—focusing on the critical performance parameters of cost, complexity, speed, and ease of use. Aimed at researchers and drug development professionals, this analysis is framed within the broader context of biosensor sensitivity research to inform experimental design and technology selection.
Comparative Performance Analysis of Biosensor Platforms
The table below summarizes the core trade-offs between electrochemical, optical, and piezoelectric biosensors based on current literature and market data.
| Parameter | Electrochemical Biosensors | Optical Biosensors | Piezoelectric Biosensors |
|---|---|---|---|
| Relative Cost | Low cost; simple setup [109] | High cost; specialized optics [109] | Moderate cost and precision [22] |
| System Complexity & Ease of Use | Compact; simple operation; can work with complex samples [109] | Bulky; requires expertise in optics and data analysis; often needs purified samples [109] | Simplicity and efficiency for field use; interpretation complicated in viscous liquids [22] [57] |
| Speed & Response Time | Fast (seconds) [109] | Slow (minutes) [109] | Real-time monitoring capabilities [57] |
| Key Strengths | High sensitivity, rapid response, suitability for miniaturization and point-of-care use [110] [109] | High sensitivity, real-time detection, superior multiplexing capabilities [109] [111] | Label-free, direct detection; measures mass changes; reusable [57] |
| Key Limitations | Limited multiplexing, electrode fouling, susceptible to electromagnetic interference [112] [109] | Sensitive to environmental factors (pH, temperature), high background signal interference [109] | Performance affected by sample viscosity and density; requires stable oscillator circuits [22] [57] |
Experimental Protocols and Methodologies
Understanding the experimental principles behind each biosensor type is crucial for interpreting performance data and selecting appropriate methodologies.
Electrochemical Biosensing Protocol
The fundamental working principle involves converting a biochemical reaction into a quantifiable electrical signal [113].
Detailed Workflow:
- Bioreceptor Immobilization: A biological recognition element (e.g., enzyme, antibody, DNA) is immobilized on a transducer electrode, typically made of gold, carbon, or platinum [109] [113].
- Analyte Binding and Electron Transfer: The target analyte interacts with the bioreceptor, triggering a biochemical reaction that results in the transfer of electrons [109].
- Signal Transduction: This electron transfer is converted into a measurable electrical signal (current, voltage, or impedance change) using techniques such as amperometry, potentiometry, or electrochemical impedance spectroscopy (EIS) [110] [109] [113].
- Signal Processing: The measured electrical signal is processed and analyzed to determine the concentration of the target analyte [109].
Optical Biosensing Protocol
These sensors detect analytes by measuring changes in optical properties resulting from the interaction of light with biological recognition elements [113].
Detailed Workflow:
- Surface Preparation: A bioreceptor is immobilized on a specialized sensing surface (e.g., a prism or optical fiber) [109].
- Optical Interaction: A light source (laser, LED) is directed toward the sensing surface. In a common configuration like Surface Plasmon Resonance (SPR), this generates an evanescent field [114].
- Analyte Binding-Induced Change: The binding of the target analyte to the bioreceptor alters the local refractive index or other optical properties (absorbance, fluorescence, reflectance) at the sensor surface [109].
- Signal Detection: A detector (e.g., photodiode or camera) records the change in the optical signal, such as a shift in the resonance angle, wavelength, or fluorescence intensity [109].
Piezoelectric Biosensing Protocol
These are mass-based biosensors that utilize the piezoelectric effect, where mechanical stress on a crystal generates an electrical charge [22] [113].
Detailed Workflow:
- Bioreceptor Functionalization: A recognition molecule (e.g., antibody, aptamer) is immobilized onto the gold electrodes of a piezoelectric crystal, commonly a Quartz Crystal Microbalance (QCM) [22] [57].
- Oscillation and Mass Sensing: The crystal is incorporated into an oscillator circuit that drives it at its resonant frequency. The QCM operates as a mass-sensitive transducer, where the oscillation frequency is inversely proportional to the mass on the crystal surface [22].
- Analyte Binding and Frequency Shift: The binding of the target analyte to the surface-bound bioreceptors increases the mass on the sensor, leading to a measurable decrease in the resonant frequency (described by the Sauerbrey equation for rigid layers) [22] [57].
- Data Acquisition: The frequency shift is monitored in real-time using a frequency counter, providing a direct measure of bound mass. In liquid environments, simultaneous monitoring of dissipation (D) can account for viscoelastic effects [57].
Research Reagent Solutions and Essential Materials
The table below details key reagents and materials essential for developing and operating the featured biosensor platforms.
| Item | Function / Description | Relevant Biosensor Platform(s) |
|---|---|---|
| Gold Electrodes | Serve as an inert, conductive surface for biomolecule immobilization and for generating plasmonic effects. | Electrochemical, Piezoelectric, Optical (SPR) [57] [114] [109] |
| Specific Bioreceptors | Biological recognition elements (antibodies, enzymes, aptamers, nucleic acids) that provide specificity toward the target analyte. | All (Electrochemical, Optical, Piezoelectric) [109] [113] |
| Quartz Crystal Microbalance (QCM) | The core piezoelectric transducer that acts as a mass-sensitive platform, typically with gold electrodes. | Piezoelectric [22] [57] |
| Graphene & Nanomaterials | Used to enhance sensor surface area, electronic conductivity, and sensitivity. Examples include graphene and black phosphorus. | Optical, Electrochemical [114] [111] |
| Oscillator Circuit (e.g., 74LS320) | An integrated circuit that drives the piezoelectric crystal at its resonant frequency in active measurement modes. | Piezoelectric [57] |
| Prism / Optical Coupler | A critical optical component for coupling light and exciting surface plasmons in SPR-based sensors. | Optical (SPR) [114] |
Interpretation for Research and Development
The choice of biosensor platform involves strategic trade-offs aligned with application requirements. Electrochemical systems are ideal for portable, rapid, and cost-effective point-of-care diagnostics. Optical biosensors are powerful tools for high-sensitivity, multiplexed analysis in controlled laboratory environments. Piezoelectric biosensors offer a versatile, label-free method for real-time interaction analysis.
Future development is focused on overcoming these trade-offs through the integration of nanotechnology, advanced materials like graphene and black phosphorus, and machine learning for data analysis, which collectively enhance sensitivity, stability, and specificity across all platforms [114] [111].
Biosensors are analytical devices that convert a biological response into a measurable electrical signal, typically consisting of a bioreceptor, transducer, and signal processor [115]. The global biosensors market is experiencing substantial growth, projected to expand from USD 27.40 billion in 2024 to USD 55.78 billion by 2032, exhibiting a Compound Annual Growth Rate (CAGR) of 9.3% [112]. This growth is fueled by the rising prevalence of chronic diseases, increasing demand for point-of-care diagnostics, and technological advancements across healthcare, environmental monitoring, and food safety sectors [112] [116]. Among the various transduction technologies available, electrochemical, optical, and piezoelectric biosensors represent three principal categories with distinct operational mechanisms, performance characteristics, and market positions. Electrochemical biosensors currently dominate the market landscape, holding a commanding share due to their established success in glucose monitoring and point-of-care testing [112] [117]. Meanwhile, optical biosensors are demonstrating rapid growth driven by their high sensitivity and integration with artificial intelligence, while piezoelectric biosensors maintain specialized niches in mass-sensitive detection applications [112] [117]. This analysis provides a comparative assessment of these technologies, examining their market shares, quantitative performance parameters, underlying experimental methodologies, and specific applications to guide researchers and drug development professionals in selecting appropriate sensing platforms for their specific requirements.
Market Share and Quantitative Performance Comparison
Technology Market Positioning
The biosensors market is characterized by clear technology stratification, with electrochemical platforms maintaining commercial leadership while optical technologies demonstrate accelerated growth in specialized applications. According to recent market analyses, electrochemical biosensors captured a dominant 72.4% of market revenue in 2024, anchored by their direct transduction of biochemical reactions into electrical signals and superior suitability for mass production [117]. This segment is further projected to hold an 80.6% share of the type segment in 2024, largely driven by the widespread global adoption of glucose monitoring systems for diabetes care in both healthcare and home settings [112]. In contrast, optical biosensors, while smaller in absolute market share, are projected to expand at the fastest CAGR of 10.5% among sensing technologies, supported by increasing demand for non-invasive, real-time diagnostic tools in oncology and infectious disease testing [112] [117]. The global optical biosensor market specifically is expected to grow at a CAGR of 8.1%, reaching USD 14.1 billion by 2032, driven by advancements in sensor technology and increasing point-of-care testing adoption [118]. Piezoelectric biosensors, along with thermal and nanomechanical categories, hold specialized niches within the broader market, finding repeat applications in areas such as food safety labs where mass change offers a reliable proxy for pathogen presence [117].
Table 1: Biosensor Technology Market Positioning and Growth Trends
| Technology | Market Share (2024) | Projected CAGR | Primary Growth Drivers | Dominant Applications |
|---|---|---|---|---|
| Electrochemical | 72.4% of total market revenue [117] | Stable growth | Diabetes prevalence, point-of-care testing expansion, mass production capability | Glucose monitoring, infectious disease screening, cardiac biomarkers [112] [119] |
| Optical | Second largest segment | 10.5% (2025-2032) [112] | Non-invasive monitoring demand, AI integration, high-sensitivity requirements | Oncology diagnostics, infectious diseases, environmental monitoring [112] [12] |
| Piezoelectric | Specialized niche | Moderate | Mass-sensitive detection, food safety regulations | Pathogen detection in food safety labs, viral mass detection [117] |
Performance Metrics and Sensitivity Comparison
When evaluated according to technical performance parameters, each biosensor technology demonstrates distinctive strengths and limitations. Electrochemical biosensors consistently achieve excellent sensitivity across multiple applications, with demonstrated detection limits reaching 1 CFU mL⁻¹ for E. coli using advanced electrode materials [120]. These systems typically offer wide linear ranges (e.g., 10 to 10¹⁰ CFU mL⁻¹), excellent reproducibility, and short response times, making them suitable for quantitative analysis [120]. The technology benefits from continuous improvements through nanostructured electrodes and enzyme immobilization techniques that enhance detection limits and stability [119]. Optical biosensors, including Surface Plasmon Resonance (SPR), fluorescence, and Bio-Layer Interferometry (BLI) platforms, provide superior sensitivity for specific applications, with certain SPR configurations achieving detection limits down to 4.1 nM for neurotransmitters – representing a 100-fold sensitivity improvement over previous technologies [117]. Fluorescence-based optical biosensors further offer multiplexing capabilities and exceptional sensitivity for low-abundance analyte detection, enhanced by innovations in fluorophore chemistry and quantum dot applications [118]. Piezoelectric biosensors operate on mass-detection principles, providing exceptional resolution for mass change measurements but generally offering less impressive concentration detection limits compared to electrochemical and optical alternatives, particularly for low molecular weight analytes [117].
Table 2: Quantitative Performance Comparison of Biosensor Technologies
| Performance Parameter | Electrochemical | Optical | Piezoelectric |
|---|---|---|---|
| Detection Limit | 1 CFU mL⁻¹ for E. coli [120] | 4.1 nM for neurotransmitters [117] | Varies by application; suitable for pathogen detection [117] |
| Linear Range | 10 to 10¹⁰ CFU mL⁻¹ [120] | Varies by technique (SPR, fluorescence, etc.) | Limited for low molecular weight analytes |
| Assay Time | Minutes to rapid response [115] | Real-time, label-free detection possible [118] | Minutes to hours depending on system |
| Multiplexing Capability | Limited | High (especially fluorescence) [118] | Limited |
| Reproducibility | High with proper electrode design [121] | Moderate to high | High for mass detection |
| Key Strengths | High sensitivity, portability, cost-effectiveness [38] | Label-free detection, real-time monitoring, high specificity [12] | Mass sensitivity, reliability for particulate analytes |
Experimental Protocols and Methodologies
Electrochemical Biosensor Protocol for Pathogen Detection
The development of high-performance electrochemical biosensors requires meticulous attention to material synthesis, electrode modification, and measurement techniques. The following protocol, adapted from a recent study demonstrating ultra-sensitive E. coli detection, outlines the key steps for fabricating and characterizing a bimetallic metal-organic framework (MOF)-based electrochemical biosensor [120]:
Synthesis of Mn-doped ZIF-67 (Co/Mn ZIF):
- Prepare solutions of cobalt nitrate (Co(NO₃)₂·6H₂O) and manganese chloride (MnCl₂) in methanol with varying molar ratios (10:1, 5:1, 2:1, 1:1 Co:Mn).
- Simultaneously, prepare a 2-methylimidazole solution in methanol.
- Rapidly mix the metal solution with the ligand solution under vigorous stirring and react at room temperature for 24 hours.
- Centrifuge the resulting purple crystals, wash thoroughly with methanol, and dry under vacuum at 60°C overnight [120].
Electrode Modification:
- Prepare a homogeneous ink by dispersing 2 mg of the synthesized Co/Mn ZIF material in 1 mL of ethanol with 10 μL of Nafion solution.
- Clean the working electrode (typically glassy carbon) with alumina slurry and wash thoroughly with deionized water.
- Drop-cast 5-10 μL of the Co/Mn ZIF ink onto the electrode surface and allow it to dry at room temperature [120].
Bioreceptor Immobilization:
- Activate the modified electrode surface with a mixture of EDC and NHS to create reactive esters.
- Incubate the electrode with anti-O antibody solution (10-100 μg/mL in PBS) for 2 hours at 25°C to facilitate covalent bonding.
- Block nonspecific sites with 1% BSA solution for 1 hour to minimize background signal [120].
Electrochemical Measurement:
- Employ a standard three-electrode system with the modified working electrode, Ag/AgCl reference electrode, and platinum counter electrode.
- Incubate the biosensor with analyte samples for 15-20 minutes.
- Perform electrochemical measurements using techniques such as Electrochemical Impedance Spectroscopy (EIS) or Cyclic Voltammetry (CV) in a suitable redox probe solution (e.g., 5mM [Fe(CN)₆]³⁻/⁴⁻).
- Quantify bacterial concentration based on the increase in electron transfer resistance (Rₑₜ) proportional to bacterial binding on the electrode surface [120].
This methodology demonstrates how nanomaterial engineering enhances biosensor performance. The incorporation of Mn into the ZIF-67 framework induces phase reconstruction, increases surface area (from 1583 m² g⁻¹ for ZIF-67 to 2025 m² g⁻¹ for Co/Mn ZIF 1:1), and significantly improves electron transfer kinetics, collectively contributing to the achieved 1 CFU mL⁻¹ detection limit [120].
Optical Biosensor Workflow with AI Integration
Advanced optical biosensors increasingly incorporate artificial intelligence to enhance their analytical capabilities. The following workflow describes the integration of machine learning with optical biosensing platforms, particularly for multiplexed disease diagnostics [12]:
Sensor Design and Fabrication:
- Select an appropriate optical transducer (SPR chip, optical fiber, or waveguide).
- Functionalize the sensing surface with specific bioreceptors (antibodies, aptamers) using covalent immobilization techniques.
- For multiplexed detection, create an array pattern with different bioreceptors in distinct spatial locations.
Data Acquisition:
- Expose the sensor to the sample solution and monitor optical signals (wavelength shift, intensity change, or interferometric pattern) in real-time.
- Collect kinetic data throughout the association and dissociation phases for binding event analysis.
- For complex samples, acquire spectral data across multiple wavelengths.
AI-Enhanced Signal Processing:
- Preprocess raw optical data to remove noise and correct for baseline drift.
- Apply machine learning algorithms (e.g., convolutional neural networks) to deconvolute overlapping signals from multiple analytes.
- Use pattern recognition models to classify samples based on their distinctive response signatures.
- Train algorithms on large datasets to improve accuracy in predicting analyte concentrations in complex biological matrices.
Data Integration and Output:
- Integrate sensor platforms with cloud computing for remote data access and analysis.
- Provide real-time decision support through user-friendly interfaces on connected devices.
This AI-integration approach significantly improves the sensitivity and specificity of optical biosensors, enabling them to distinguish subtle pattern differences in complex biological samples that might be challenging to detect with conventional analytical methods [12].
Figure 1: AI-Integrated Optical Biosensor Workflow. This diagram illustrates the three-phase workflow of modern AI-enhanced optical biosensors, from signal acquisition through AI processing to clinical output generation.
Analytical Framework and Research Toolkit
Signaling Pathways and Transduction Mechanisms
The fundamental performance differences between electrochemical, optical, and piezoelectric biosensors originate from their distinct transduction mechanisms. Electrochemical biosensors operate on the principle of converting biological recognition events into measurable electrical signals (current, potential, or impedance changes) [121] [115]. When an analyte binds to the bioreceptor on the electrode surface, it modulates the electron transfer kinetics at the electrode-solution interface, which can be measured via techniques such as amperometry, potentiometry, or electrochemical impedance spectroscopy [121] [38]. The incorporation of nanomaterials like graphene, carbon nanotubes, or metal-organic frameworks significantly enhances this electron transfer, leading to improved sensitivity [121] [120]. Optical biosensors transduce binding events into optical signals through various mechanisms including surface plasmon resonance, fluorescence, or bio-layer interferometry [118]. In SPR-based sensors, for example, binding events alter the refractive index near the sensor surface, causing a detectable shift in the resonance angle [118]. Fluorescence-based sensors measure changes in fluorescence intensity, polarization, or energy transfer upon analyte binding [12]. Piezoelectric biosensors rely on mass-sensitive transduction, where analyte binding on the crystal surface changes the resonant frequency of an oscillating crystal, typically quartz [117]. This mass-dependent frequency shift provides quantitative information about the bound analyte.
Figure 2: Biosensor Transduction Mechanisms. This diagram illustrates the fundamental signaling pathways for electrochemical, optical, and piezoelectric biosensors, highlighting how each technology converts biological recognition events into measurable signals.
Research Reagent Solutions and Essential Materials
The performance of biosensing platforms depends critically on the quality and specificity of their constituent materials. The following table details key research reagent solutions and their functional roles in developing advanced biosensors across the three technology platforms.
Table 3: Essential Research Reagents and Materials for Biosensor Development
| Material Category | Specific Examples | Function in Biosensor | Technology Applicability |
|---|---|---|---|
| Biorecognition Elements | Anti-O antibody [120], glucose oxidase [115], aptamers [38] | Provides selective binding to target analyte; determines sensor specificity | All technologies (Electrochemical, Optical, Piezoelectric) |
| Nanomaterials | Graphene, carbon nanotubes [117], gold nanoparticles [115], Mn-doped ZIF-67 [120] | Enhances surface area, electron transfer, and signal amplification; improves sensitivity | Primarily Electrochemical, also Optical |
| Electrode Materials | Glassy carbon, screen-printed electrodes, gold electrodes [121] | Serves as transduction platform; facilitates electron transfer in electrochemical systems | Electrochemical |
| Immobilization Matrices | Polyurethane-zwitterionic matrices [117], Nafion membrane [120] | Stabilizes biorecognition elements; maintains bioactivity and extends sensor lifetime | Primarily Electrochemical |
| Optical Components | SPR chips, optical fibers with plasmonic graphene coatings [117], fluorophores [118] | Generates and modulates optical signals; enables label-free detection or fluorescence sensing | Optical |
| Piezoelectric Crystals | Quartz crystal microbalances [117] | Transduces mass changes into frequency signals; provides mass-sensitive detection | Piezoelectric |
| Signal Processing Tools | Machine learning algorithms [12], potentiostats [121] | Analyzes complex data; enhances specificity and enables multiplexing | All technologies (implementation varies) |
The comprehensive analysis of electrochemical, optical, and piezoelectric biosensor technologies reveals a clear market and application stratification. Electrochemical biosensors maintain commercial dominance, capturing over 70% of market revenue, driven by their established success in glucose monitoring, cost-effectiveness, and suitability for point-of-care testing [112] [117]. Their ongoing development focuses on enhancing sensitivity through nanomaterial engineering and improving reproducibility for broader clinical adoption [121] [38]. Optical biosensors, while currently holding a smaller market share, represent the fastest-growing segment, propelled by their exceptional sensitivity, capability for multiplexing, and increasing integration with artificial intelligence for advanced signal processing [12] [118]. Piezoelectric biosensors maintain stable niche applications where mass-change detection provides distinct advantages, particularly in food safety and pathogen monitoring [117].
Future development across all biosensor platforms will be influenced by several converging trends. The integration of artificial intelligence and machine learning algorithms is transforming data analysis capabilities, particularly for optical systems performing multiplexed detection in complex samples [12]. Similarly, the convergence of biosensors with Internet of Things (IoT) technologies enables real-time health monitoring and environmental sensing, creating new opportunities for connected diagnostic ecosystems [116] [119]. Advances in nanomaterials science continue to push detection limits to unprecedented levels, as demonstrated by Mn-doped ZIF-67 frameworks achieving single-CFU sensitivity for pathogen detection [120]. Additionally, the growing emphasis on sustainability is driving research into eco-friendly materials and energy-efficient designs across all biosensor categories [116]. For researchers and drug development professionals, selection criteria should prioritize application-specific requirements: electrochemical systems for cost-sensitive, high-volume applications; optical platforms for maximum sensitivity and multiplexing capability; and piezoelectric solutions for specialized mass-detection needs. As these technologies continue to evolve through interdisciplinary innovation, their collective impact on healthcare diagnostics, environmental monitoring, and drug development is expected to expand significantly throughout the next decade.
The translation of biosensing technologies from research laboratories to clinical and commercial settings is a complex process governed by rigorous validation frameworks. These frameworks establish the benchmarks for demonstrating that a biosensor is not only scientifically sound but also clinically useful and safe for its intended purpose. For researchers and drug development professionals, navigating these requirements is essential for gaining regulatory approval and achieving successful market adoption. The core challenge lies in bridging the gap between demonstrating technical performance in controlled settings and proving clinical utility in real-world environments [122] [123]. This guide provides a comparative analysis of validation pathways for major biosensor platforms—electrochemical, optical, and piezoelectric—within the context of regulatory and clinical translation.
A robust validation framework typically progresses through several stages: technical verification (confirming the device operates as designed), analytical validation (establishing performance characteristics like sensitivity and specificity), and clinical validation (demonstrating utility in the target population) [123]. Furthermore, regulatory agencies are increasingly emphasizing usability validation to ensure technologies integrate effectively into clinical workflows and are accessible to diverse user populations [123]. The precision implementation framework proposes that these considerations should be embedded throughout the entire translational continuum, from early-stage technology development through post-market surveillance, rather than being treated as a final step [123]. This holistic approach is critical for overcoming systemic barriers such as reimbursement gaps and integration complexity that often impede widespread adoption.
Comparative Performance Analysis of Biosensor Platforms
The performance characteristics of biosensors vary significantly across different technological platforms. The following tables provide a structured comparison of key metrics and clinical validation benchmarks for electrochemical, optical, and piezoelectric biosensors, synthesizing data from recent research and development.
Table 1: Analytical Performance Comparison of Biosensor Technologies
| Performance Parameter | Electrochemical Biosensors | Optical Biosensors | Piezoelectric Biosensors |
|---|---|---|---|
| Typical Sensitivity | Very High (e.g., pM-fM) [124] | Extremely High (e.g., Single Molecule) [16] | High (Mass changes at ng/cm²) [125] |
| Limit of Detection (LOD) | Excellent for viral targets (e.g., influenza) [124] | Superior (e.g., SERS LOD: 16.73 ng/mL for AFP) [16] | Suitable for mass-based binding events |
| Specificity | High (with optimized probe design) [124] | Very High (e.g., SERS-based immunoassays) [16] | High (dependent on probe selectivity) |
| Multiplexing Capability | Good (with electrode arrays) | Excellent (e.g., multi-wavelength detection) [68] | Moderate |
| Assay Time | Minutes to < 30 minutes [124] | Rapid (Minutes for POC tests) [12] [68] | Real-time, label-free monitoring |
| Robustness in Complex Media | Good (with surface passivation) | Can be affected by scattering/absorption | Can be affected by viscous samples |
Table 2: Clinical Validation and Regulatory Considerations
| Consideration | Electrochemical Biosensors | Optical Biosensors | Piezoelectric Biosensors |
|---|---|---|---|
| Primary Clinical Applications | Infectious disease (e.g., Influenza), POC glucose [124] | Cancer biomarker detection (e.g., α-fetoprotein), POC diagnostics [12] [16] | Medical diagnostics, drug discovery, environmental monitoring [125] |
| Key Regulatory Hurdles | Clinical outcome assessment vs. biomarker classification [123] | Validation of optical readouts as primary endpoints [123] | Demonstrating clinical utility beyond research use |
| Prospective Clinical Trial Status | Limited for primary endpoints [122] | Limited for primary endpoints [122] | Limited for primary endpoints [122] |
| Integration with DCTs | High potential for portable readers | High potential for miniaturized devices | Moderate |
| Reimbursement Pathway | Evolving (e.g., digital mental health codes) [123] | Evolving [123] | Less established |
Experimental Protocols for Benchmarking
To generate the comparative data shown in the tables, standardized experimental protocols are essential. The following sections detail core methodologies used for evaluating and validating the performance of biosensor platforms.
Protocol for Electrochemical Biosensor Characterization
A common protocol for evaluating electrochemical biosensors, particularly for viral detection, involves the following steps [124]:
- Probe Immobilization on 3D Surfaces: A three-dimensional (3D) working electrode is fabricated using materials such as nanostructured gold, porous graphene, or metal-organic frameworks (MOFs) to increase the surface area and binding sites. The capture probe (e.g., an oligonucleotide or antibody specific to the target, such as influenza hemagglutinin) is then immobilized onto this 3D surface using techniques like electrodeposition or layer-by-layer assembly.
- Electrochemical Measurement: The functionalized sensor is exposed to the target analyte in a buffer or simulated biological fluid. Electrochemical techniques such as electrochemical impedance spectroscopy (EIS) or amperometry are employed to measure the electrical signal change resulting from the binding event.
- Data Analysis: The signal (e.g., change in charge transfer resistance or current) is correlated with the target concentration. The limit of detection (LOD) is calculated, typically as the concentration corresponding to the signal from the blank plus three times its standard deviation. Cross-reactivity is tested against non-target analytes to establish specificity.
Protocol for Optical Biosensor Characterization
For optical platforms like surface-enhanced Raman scattering (SERS), a typical validation protocol is as follows [16]:
- Substrate Preparation and Functionalization: A SERS-active substrate, such as Au-Ag nanostars, is synthesized and concentrated via centrifugation. The substrate is then functionalized with a linker (e.g., mercaptopropionic acid, MPA) and activated to covalently attach capture antibodies.
- Optical Signal Acquisition: The functionalized substrate is incubated with the sample. Upon binding of the target biomarker (e.g., α-fetoprotein), the intrinsic Raman signature of the target or a labeled reporter molecule is measured. A Raman spectrometer is used to acquire the spectral data.
- Sensitivity and Specificity Determination: The intensity of the characteristic Raman peak is plotted against the target concentration to generate a calibration curve. The LOD is derived from this curve. Specificity is validated by testing against a panel of potential interfering substances.
Protocol for Piezoelectric Biosensor Characterization
The validation of piezoelectric biosensors, such as Quartz Crystal Microbalance (QCM) systems, generally follows this workflow [125]:
- Sensor Functionalization: The gold electrode surface of a QCM crystal is cleaned and modified with a self-assembled monolayer to facilitate the immobilization of capture probes (antibodies, aptamers).
- Frequency Measurement: The crystal is placed in a flow cell, and the baseline resonance frequency is stabilized with a running buffer. The sample solution containing the analyte is introduced, and the binding event is monitored in real-time as a decrease in the resonant frequency proportional to the mass bound.
- Data Interpretation: The frequency shift over time is recorded to generate a binding kinetics curve. The rate constants (association and dissociation) and binding affinity can be calculated from this data. The LOD is determined as the minimal concentration producing a statistically significant frequency shift.
Visualizing the Validation Workflow
The journey from biosensor development to regulatory approval and clinical implementation follows a structured, multi-stage pathway. The following diagram synthesizes the key technical, regulatory, and commercial milestones.
Biosensor Validation and Implementation Pathway illustrates the translational pipeline from technology development (T0) to population-level impact (T4), highlighting persistent barriers. Economic barriers like funding constraints and reimbursement gaps affect all stages. Technical/regulatory barriers, including compliance costs, are most acute in early phases. Social/access barriers, such as health inequities, become critical during scaling and determine whether a technology mitigates or exacerbates disparities [123].
The Scientist's Toolkit: Essential Research Reagents and Materials
The development and validation of high-performance biosensors rely on a suite of specialized materials and reagents. The following table catalogues key components referenced in the experimental protocols and their critical functions.
Table 3: Essential Reagents for Biosensor Development
| Reagent/Material | Function in Biosensor Development | Example Platforms |
|---|---|---|
| Capture Probes (Antibodies, Aptamers) | Biological recognition element that binds specifically to the target analyte. | All (Electrochemical, Optical, Piezoelectric) [124] |
| Metal Nanoparticles (Au, Ag) | Enhance signal transduction; Au-Ag nanostars provide intense plasmonic enhancement for SERS. | Optical (SERS) [16], Electrochemical [124] |
| 3D Structured Materials (Graphene, MOFs, Hydrogels) | Provide high surface area for probe immobilization, enhancing sensitivity and loading capacity. | Electrochemical [124] |
| Polymer Membranes (e.g., Polydopamine) | Biocompatible coating for surface modification; improves stability and functionalization. | Electrochemical (Melanin-based sensors) [16] |
| Quartz Crystal Microbalance (QCM) Chips | Piezoelectric transducer that converts mass changes on its surface into measurable frequency shifts. | Piezoelectric [125] |
| Signal Amplification Enzymes (e.g., Horseradish Peroxidase) | Used in conjunction with substrates to generate a measurable colorimetric, electrochemical, or chemiluminescent signal. | Electrochemical, Optical (Colorimetric) |
| Raman Reporters (e.g., Methylene Blue) | Molecules with strong Raman signatures used to generate a measurable signal in SERS-based assays. | Optical (SERS) [16] |
| Crosslinkers (e.g., EDC/NHS) | Facilitate the covalent immobilization of capture probes onto sensor surfaces. | All [16] [124] |
The validation of electrochemical, optical, and piezoelectric biosensors for clinical translation demands a rigorous, multi-faceted approach that extends beyond technical performance. While each platform offers distinct advantages in sensitivity, speed, and application fit, all must navigate a complex landscape of analytical validation, prospective clinical trials, and evolving regulatory and reimbursement frameworks. The increasing emphasis on real-world evidence, diversity in clinical trials, and the precision implementation model signals a shift towards more holistic and equitable validation strategies. For researchers and developers, success will depend on integrating these regulatory and clinical considerations from the earliest stages of design, ensuring that innovative biosensor technologies can reliably cross the bridge from the laboratory bench to the patient's bedside.
Biosensors are analytical devices that combine a biological recognition element (bioreceptor) with a physicochemical transducer to detect the concentration of a specific analyte or set of analytes [126]. The global biosensors market is projected to grow significantly from USD 34.51 billion in 2025 to USD 54.37 billion by 2030, driven by advancements in semiconductor devices and expanding applications in healthcare, food safety, and environmental monitoring [127]. This growth is particularly notable in wearable biosensors, which are expected to achieve the highest compound annual growth rate (CAGR), and optical biosensors, which are anticipated to record the highest CAGR among sensing technologies [127].
The core function of any biosensor is to provide information about a biological sample by converting a biological response into an electrical signal through a transducer [126]. Bioreceptors may include antibodies, aptamers, DNA oligonucleotides, enzymes, or whole cells that selectively bind the target analyte of interest [126]. Signal transducers can be optical, electrochemical, piezoelectric, thermal, or nanomechanical, each with distinct operating principles and application suitability [127]. This guide provides a comprehensive, data-driven comparison of the primary biosensor technologies—electrochemical, optical, and piezoelectric—with a specific focus on their sensitivity performance for research and drug development applications.
Technology Comparison: Mechanisms and Performance Metrics
Fundamental Operating Principles
Biosensor technologies are primarily categorized by their signal transduction mechanisms. Electrochemical biosensors measure electrical changes (current, potential, or impedance) resulting from biochemical reactions at electrode surfaces [13]. The emergence of novel nanomaterials like MXenes—two-dimensional materials with unique layered structures and exceptional electrochemical properties—has significantly improved the performance of these sensors, creating new frontiers for highly sensitive analysis [13].
Optical biosensors detect changes in light properties (wavelength, intensity, or polarization) caused by analyte binding [128]. These include techniques such as surface plasmon resonance (SPR), photonic microring resonators (PhRR), and colorimetric detection systems [126] [128]. Optical biosensors are particularly valuable for determining the affinity and kinetics of molecular interactions in real time without requiring molecular tags [127].
Piezoelectric biosensors measure changes in mass or viscoelastic properties through frequency variations in quartz crystal microbalances or surface acoustic wave devices [127]. While less prominently featured in current literature than electrochemical and optical formats, they remain important for specific applications requiring mass detection without labeling.
Quantitative Performance Comparison
The table below summarizes key performance parameters for major biosensor technologies, with specific attention to sensitivity characteristics critical for research applications.
Table 1: Performance Comparison of Major Biosensor Technologies
| Technology | Sensitivity Range | Detection Time | Key Advantages | Primary Limitations |
|---|---|---|---|---|
| Electrochemical | Varies with electrode design and nanomaterials | Minutes to hours | High compatibility with miniaturization and portable devices; Cost-effective manufacturing | Susceptible to electronic interference; Limited multiplexing capability |
| Optical | - SPR: High- Colorimetric: 2 nM (protein), 10¹-10² CFU/mL (bacteria) [129]- PhRR: pg/mL to μg/mL [126] | Real-time to 2 hours [129] | Real-time kinetic measurements; High specificity; Superior sensitivity with nanotechnology enhancement [127] | Nonspecific binding in complex media [126]; Requires sophisticated instrumentation for some formats |
| Piezoelectric | Mass-dependent (typically ng to pg) | Minutes to hours | Label-free detection; Direct mass measurement | Sensitive to environmental vibrations; Challenging for liquid-phase measurements |
Table 2: Application-Based Technology Selection Guide
| Research Application | Recommended Technology | Key Supporting Evidence |
|---|---|---|
| Drug Discovery & Kinetic Studies | Optical (SPR, BLI, GCI) | Enables real-time, label-free analysis of biomolecular interactions including affinity and kinetics [127] |
| Point-of-Care Diagnostics | Electrochemical / Colorimetric | Simple operation, rapid results, and cost-effectiveness ideal for clinical settings [128] |
| Food Safety & Pathogen Detection | Colorimetric (nanoparticle-based) | Detects Salmonella at 10² CFU/mL in whole milk without preprocessing [129] |
| Continuous Health Monitoring | Wearable Biosensors | Enables monitoring of vital signs in patients, athletes, and elderly populations [127] |
| Biomarker Detection in Complex Media | Optical (PhRR) with reference correction | Reference channel strategy mitigates nonspecific binding in serum [126] |
Critical Consideration: Nonspecific Binding and Reference Controls
A fundamental challenge in label-free biosensing, particularly in complex biological media like serum, is nonspecific binding (NSB) of matrix constituents to the bioreceptor sensing area [126]. Electrostatics, hydrogen bonding, and van der Waals interactions all contribute to NSB, with serum proteins being particularly problematic for increasing assay noise [126]. For research requiring high accuracy in complex matrices, the implementation of proper reference controls is essential.
A systematic framework for optimal control probe selection has demonstrated that the best reference control varies by analyte [126]. In model studies with photonic microring resonator sensors:
- For IL-17A detection, BSA scored highest (83%) as a reference control, with mouse IgG1 isotype control antibody close behind (75%)
- For CRP detection, rat IgG1 isotype control antibody performed best (95%), while anti-FITC scored second highest (89%) [126]
These findings contradict the assumption that isotype-matching always provides the optimal reference control and highlight the need for case-by-case optimization using established frameworks [126].
Experimental Protocols for Biosensor Evaluation
Protocol: Colorimetric Detection Using Functionalized Gold Nanoparticles
This protocol details the detection of pathogens and contaminants in food matrices, adaptable for various research applications [129].
Principle: The core mechanism relies on the aggregation of streptavidin-functionalized AuNPs (stAuNPs), which varies with the concentration of bifunctional linkers (BLs) and reflects the quantity of effective linkers (EALs) available in the system [129]. Target presence reduces EAL concentration, increasing the BL concentration required for stAuNP aggregation and shifting the range exhibiting visible color change [129].
Materials:
- Streptavidin-functionalized gold nanoparticles (stAuNPs)
- Bifunctional linkers (BLs) specific to target analyte
- Target analyte (protein, bacteria, etc.)
- PBS buffer (for controlled experiments) or complex matrices (e.g., whole milk)
- Colorimetric reader or smartphone camera for quantification
Procedure:
- System Optimization: Determine optimal reaction time, system volume, and BL concentration using target-free controls.
- Sample Preparation: Mix samples with BLs and incubate for predetermined time.
- stAuNP Addition: Add stAuNPs to the sample-BL mixture and incubate to allow aggregation.
- Detection:
- Qualitative: Observe visible color change (e.g., red to purple for AuNP aggregation)
- Quantitative: Measure absorbance spectrum or capture image for RGB analysis
- Data Analysis: Calculate target concentration based on shift in aggregation profile compared to calibration standards.
Performance Validation: This system detects protein in PBS at concentrations as low as 2 nM, and Salmonella at 10¹ CFU/mL. In complex matrices like whole milk, detection limits were 20 nM for protein and 10² CFU/mL for Salmonella [129].
Protocol: Photonic Microring Resonator (PhRR) Assay with Reference Subtraction
This protocol details a label-free approach for biomarker detection with built-in correction for nonspecific binding, suitable for serum-based assays [126].
Principle: PhRRs measure changes in refractive index of the surrounding medium. Capture of an analyte increases the local effective refractive index due to displacement of aqueous medium, producing a red-shift in the resonant wavelength [126].
Materials:
- Photonic microring resonator sensor chips (photonic integrated circuits, PICs)
- Capture antibodies (e.g., anti-IL-17A, anti-CRP)
- Panel of negative control proteins (BSA, isotype controls, anti-FITC, cytochrome c)
- Target analytes in buffer or diluted serum
- Microfluidic packaging materials (pressure sensitive adhesive, PDMS)
- PhRR instrumentation for real-time wavelength monitoring
Procedure:
- Sensor Functionalization: Immobilize capture probes and various negative control proteins on individual sensors within a single PIC.
- Microfluidic Assembly: Package PhRR sensor PICs in microfluidic devices using pressure sensitive adhesive and PDMS gaskets with precut fluidic ports.
- Assay Execution: Flow samples containing target analytes under continuous flow conditions while monitoring resonant wavelength shifts.
- Reference Subtraction: Subtract signals from negative control sensors to isolate specific binding signals from nonspecific background.
- Data Analysis: Generate response curves from specific binding signals and calculate analyte concentrations using appropriate calibration models.
Performance Validation: This approach enables specific detection of biomarkers across broad concentration ranges (e.g., IL-17A: 0.5-15 pg/mL; CRP: up to 200 μg/mL in disease states) despite challenging matrix effects [126].
Essential Research Reagent Solutions
Successful implementation of biosensor technologies requires carefully selected reagents and materials. The following table details key research reagent solutions essential for optimal experimental design and execution.
Table 3: Essential Research Reagents for Biosensor Development
| Reagent/Material | Function | Application Examples | Performance Considerations |
|---|---|---|---|
| MXenes (Ti₃C₂Tₓ) | Electrode modification material | Electrochemical biosensors | Enhances sensitivity and stability; Unique layered structure improves electron transfer [13] |
| Functionalized Gold Nanoparticles (f-AuNPs) | Signal generation via LSPR | Colorimetric biosensors | Aggregation-induced color change enables visual detection; Streptavidin functionalization enables bioconjugation [129] [128] |
| Isotype Control Antibodies | Reference probes for nonspecific binding correction | Label-free optical biosensors (SPR, PhRR) | Critical for accurate quantification in complex media; Must be optimized for each analyte [126] |
| Bifunctional Linkers (BLs) | Crosslinkers for nanoparticle aggregation | Colorimetric aggregation assays | Concentration optimization required; Target binding reduces effective linker concentration [129] |
| Photonic Microring Resonator (PhRR) Chips | Label-free detection platform | Biomarker quantification in serum | CMOS-compatible fabrication; Bulk sensitivity up to 220 nm/RIU; Enables multiplexed detection [126] |
Emerging Trends and Future Perspectives
The biosensor field is evolving rapidly through integration with digital technologies and artificial intelligence. Colorimetric biosensors are increasingly combined with smartphone cameras for quantitative analysis of red, green, and blue (RGB) values, enabling more accurate results than visual interpretation alone [128]. The integration of machine learning and artificial intelligence (AI) platforms is further improving analytical precision and automating data interpretation by learning RGB values and color change patterns [128].
Wearable biosensors represent another significant frontier, combining wearable electronics with biosensing technology to monitor vital signs in patients, athletes, and elderly populations [127]. These devices provide healthcare solutions for remote areas lacking access to traditional medical services and are available as small, portable devices that can be worn on the body or integrated into clothing [127].
For researchers working toward clinical translation, standardization of reporting is crucial. The STROBE (Standards for Reporting Optical Biosensor Experiments) guidelines address the growing problem of insufficient methodological details in publications, which often makes replication difficult or impossible [130]. Critical information frequently missing includes sample preparation details, method settings, data evaluation procedures, and sometimes even the type of sensor or instrumentation used [130].
Nanoparticle-enabled portable biosensors are particularly promising for improving global healthcare outcomes, especially in low-resource settings [131]. These platforms provide a powerful combination of miniaturization, sensitivity, and instant detection, showing potential for non-invasive and rapid disease monitoring with significant cost reduction potential [131]. As these technologies continue to mature, they are poised to reshape the future of diagnostics for chronic diseases through earlier intervention, ongoing monitoring, and wider access to healthcare [131].
Conclusion
The comparative analysis reveals that electrochemical biosensors lead in commercial adoption and point-of-care utility due to their cost-effectiveness and miniaturization potential, holding over 70% of the market share. Optical biosensors offer superior sensitivity and are unparalleled for applications requiring ultra-low limits of detection and multiplexing. Piezoelectric biosensors provide robust, label-free detection ideal for specific pathogen monitoring. The future of biosensing lies in the convergence of these technologies with artificial intelligence, advanced nanomaterials like graphene, and integrated digital health platforms. This synergy will drive the next generation of multiplexed, real-time biosensors, ultimately accelerating personalized medicine and decentralized diagnostics.
References
- 1. AI-Empowered Electrochemical Sensors for Biomedical ... [https://pmc.ncbi.nlm.nih.gov/articles/PMC12384469/]
- 2. A high-throughput multiparameter screen for accelerated ... [https://www.nature.com/articles/s41467-022-30685-x]
- 3. Biosensor for Bacterial Detection Through Color Change in ... [https://pmc.ncbi.nlm.nih.gov/articles/PMC12384555/]
- 4. Artificial intelligence and machine learning for colorimetric ... [https://www.sciencedirect.com/science/article/pii/S2214158825000236]
- 5. Recent Trends in Electrochemical Methods for Real-Time ... [https://www.sciencedirect.com/science/article/abs/pii/S2451910325001085]
- 6. Advances in Impedimetric Biosensors: Current Applications ... [https://www.mdpi.com/2072-666X/16/11/1244]
- 7. Electrochemical Impedance Spectroscopy-Based Biosensors ... [https://pmc.ncbi.nlm.nih.gov/articles/PMC12293632/]
- 8. Maximising the translation potential of electrochemical ... [https://pmc.ncbi.nlm.nih.gov/articles/PMC12355650/]
- 9. Sensitivity studies and optimization of an impedance- ... [https://www.sciencedirect.com/science/article/pii/S2590137024000438]
- 10. New method developed to dramatically enhance bioelectronic ... [https://news.rice.edu/news/2025/new-method-developed-dramatically-enhance-bioelectronic-sensors]
- 11. Recent Advances in Flexible Materials for Wearable ... [https://pmc.ncbi.nlm.nih.gov/articles/PMC12467128/]
- 12. Emerging trends in AI-integrated optical biosensors for point ... [https://pubs.rsc.org/en/content/articlehtml/2025/cc/d5cc04899k]
- 13. Recent advances in biosensors based on the electrochemical ... [https://pubs.rsc.org/en/content/articlehtml/2025/an/d5an00235d]
- 14. Biosensors, Volume 15, Issue 7 (July 2025) – 74 articles [https://www.mdpi.com/2079-6374/15/7]
- 15. Advances in Biosensing Technologies for Immunoglobulin E [https://www.sciencedirect.com/science/article/pii/S2949913525000527]
- 16. Biosensors, Volume 15, Issue 9 (September 2025) [https://www.mdpi.com/2079-6374/15/9]
- 17. Biosensors, Volume 15, Issue 10 (October 2025) – 73 articles [https://www.mdpi.com/2079-6374/15/10]
- 18. Near-infrared fluorescence biosensors based on ... [https://www.sciencedirect.com/science/article/abs/pii/S0026265X25030395]
- 19. Fluorescent biosensors for the detection of foodborne ... [https://pubs.rsc.org/en/content/articlehtml/2025/ay/d5ay01025j]
- 20. Biosensors Market Size, Share & Trends Report 2030 [https://www.marketsandmarkets.com/Market-Reports/biosensors-market-798.html]
- 21. Point-of-care biosensors for infectious disease diagnosis [https://pubs.rsc.org/en/content/articlehtml/2025/ra/d5ra03897a?page=search]
- 22. Piezoelectric Chemosensors and Biosensors in Medical ... [https://pmc.ncbi.nlm.nih.gov/articles/PMC11940703/]
- 23. Piezoelectric sensor - Wikipedia [https://en.wikipedia.org/wiki/Piezoelectric_sensor]
- 24. Piezoelectric biosensors: shedding light on principles and applications - PMC [https://www.ncbi.nlm.nih.gov/pmc/articles/PMC10920441/]
- 25. Piezoelectric biosensors: shedding light on principles and ... [https://link.springer.com/article/10.1007/s00604-024-06257-9]
- 26. Graphene-Based Biosensors: Enabling the Next Generation of ... [https://pmc.ncbi.nlm.nih.gov/articles/PMC12467994/]
- 27. Mass-change sensitivity of piezoelectric-excited millimeter-sized cantilever (PEMC) sensors: Model and experiments - ScienceDirect [https://www.sciencedirect.com/science/article/abs/pii/S0925400508000543]
- 28. High Sensitive Mass Detection using Piezoelectric Coupled Microcantilevers - ScienceDirect [https://www.sciencedirect.com/science/article/pii/S1877705812042105]
- 29. Multidimensional signal amplification architectures in ... [https://pubs.rsc.org/en/content/articlehtml/2025/ra/d5ra05209b?page=search]
- 30. Roles of nanotechnology in electrochemical sensors for ... [https://www.sciencedirect.com/science/article/pii/S2214180424001156]
- 31. Advances in Nanomaterials-Based Electrochemical ... [https://pmc.ncbi.nlm.nih.gov/articles/PMC8538910/]
- 32. From fundamentals to real-world application [https://www.sciencedirect.com/science/article/pii/S2211715625006125]
- 33. Recent advances and trends in the applications of ... [https://www.sciencedirect.com/science/article/abs/pii/S0165993624003972]
- 34. Noble metal nanoparticles in biosensors: recent studies ... [https://pmc.ncbi.nlm.nih.gov/articles/PMC5766271/]
- 35. Optically Active Nanomaterials and Its Biosensing ... [https://pmc.ncbi.nlm.nih.gov/articles/PMC9855722/]
- 36. Nanomaterials, Volume 15, Issue 12 (June-2 2025) [https://www.mdpi.com/2079-4991/15/12]
- 37. Article Triboelectric Nanogenerator versus Piezoelectric ... [https://www.sciencedirect.com/science/article/pii/S2589004220304739]
- 38. Biomedical field applications of electrochemical biosensors ... [https://www.sciencedirect.com/science/article/abs/pii/S2451910325000973]
- 39. Photonic and electrochemical biosensors for near-patient ... [https://pmc.ncbi.nlm.nih.gov/articles/PMC11601118/]
- 40. Global Biosensors Report Market : 2025 ... Electrochemical [https://finance.yahoo.com/news/biosensors-global-market-report-2025-080400250.html]
- 41. Size & Share Report, Biosensors – 2034 Market 2025 [https://www.gminsights.com/industry-analysis/biosensors-market]
- 42. Size, Share, Trends 2035 Electrochemical Biosensors Market [https://www.marketresearchfuture.com/reports/electrochemical-biosensors-market-2792]
- 43. Advancements in electrochemical glucose sensors [https://www.sciencedirect.com/science/article/abs/pii/S0039914024012761]
- 44. Application of Electrochemical Biosensors in Clinical ... [https://pmc.ncbi.nlm.nih.gov/articles/PMC6807684/]
- 45. Recent advances on the piezoelectric, electrochemical, ... [https://www.sciencedirect.com/science/article/pii/S0165993622002862]
- 46. Research Progress of Electrochemical Biosensors for ... [https://www.mdpi.com/2079-6374/15/4/231]
- 47. Aptamer-based Electrochemical Trends by... Biosensors Market [https://www.linkedin.com/pulse/electrochemical-aptamer-based-biosensors-market-trends-hedcf]
- 48. A comparison of optical, electrochemical, magnetic, and ... [https://pmc.ncbi.nlm.nih.gov/articles/PMC6736529/]
- 49. Optical biosensors: a decade in review [https://www.sciencedirect.com/science/article/pii/S1110016822008249]
- 50. Optical biosensors for diagnosing neurodegenerative ... [https://www.nature.com/articles/s44328-025-00040-3]
- 51. Recent Advances in Electrochemical Sensors for the ... [https://pmc.ncbi.nlm.nih.gov/articles/PMC7824644/]
- 52. A concise overview of advancements in ultrasensitive ... [https://www.frontiersin.org/journals/bioengineering-and-biotechnology/articles/10.3389/fbioe.2023.1288049/full]
- 53. Comparison of Optical and Electrical Sensor ... [https://pmc.ncbi.nlm.nih.gov/articles/PMC9688426/]
- 54. Comprehensive Analysis of Advancement in Optical ... [https://www.mdpi.com/2079-6374/15/5/292]
- 55. High-sensitivity biosensors based on reflection-type guided ... [https://www.sciencedirect.com/science/article/abs/pii/S0925400525003843]
- 56. A Review on Biosensors and Recent Development of ... [https://pmc.ncbi.nlm.nih.gov/articles/PMC7915135/]
- 57. Piezoelectric biosensors: shedding light on principles and ... [https://pmc.ncbi.nlm.nih.gov/articles/PMC10920441/]
- 58. Piezoelectric Biosensors - an overview [https://www.sciencedirect.com/topics/engineering/piezoelectric-biosensors]
- 59. Next‐Generation Piezoelectric Materials in Wearable and ... [https://pmc.ncbi.nlm.nih.gov/articles/PMC12591194/]
- 60. Comparative advantages of mechanical biosensors - PMC [https://pmc.ncbi.nlm.nih.gov/articles/PMC3839312/]
- 61. A Review on Gold Nanoparticles-Based Biosensors in ... [https://deerhillpublishing.com/index.php/ijemm/article/view/217]
- 62. Unlocking the Future of Piezoelectric Biosensors: Growth ... [https://www.datainsightsmarket.com/reports/piezoelectric-biosensors-1646427]
- 63. Health Wearable Technology Trends in 2025 - MOKOSmart [https://www.mokosmart.com/health-wearable-technology-trends/]
- 64. Experimental investigation of sensitivity changes during ... [https://pubmed.ncbi.nlm.nih.gov/40877449/]
- 65. Sensitive and selective electrochemical biosensor based ... [https://www.sciencedirect.com/science/article/pii/S2590137025000305]
- 66. The Best 15+ Wearable Health Devices of 2025: Smart ... [https://www.myhealthtechtalk.com/best-wearable-health-devices-2025/]
- 67. Advances in optical biosensors as alternative diagnostics ... [https://www.sciencedirect.com/science/article/pii/S2666053925000839]
- 68. Recent advances in nanomaterial-based optical ... [https://www.sciencedirect.com/science/article/pii/S2095177925001662]
- 69. Design optimization of high-sensitivity PCF-SPR biosensor ... [https://journals.plos.org/plosone/article?id=10.1371/journal.pone.0330944]
- 70. In situ pH-Controlled electrochemical sensors for glucose ... [https://www.sciencedirect.com/science/article/pii/S0956566325001083]
- 71. High-performance nanobiosensing technologies for future ... [https://www.sciencedirect.com/science/article/pii/S0167779925001805]
- 72. Insights into the performance-determining aspects of ... [https://pubs.rsc.org/en/content/articlehtml/2025/sd/d5sd00095e]
- 73. Optical Biosensors enabled by integrated optics and AI [https://www.lightcounting.com/research-note/may-2025-optical-biosensors-enabled-by-integrated-optics-and-ai-400]
- 74. An enzyme-free electrochemical biosensor for sensitive ... [https://www.nature.com/articles/s41598-025-06003-y]
- 75. Buy Piezoelectric Biosensors Market Report [https://www.linkedin.com/pulse/buy-piezoelectric-biosensors-market-report-latest-insights-hqljf/]
- 76. AI-Enhanced Surface Functionalization in Biosensors [https://www.sciencedirect.com/science/article/abs/pii/S0165993625003887]
- 77. Design and Optimization of a Biosensor Surface ... [https://pmc.ncbi.nlm.nih.gov/articles/PMC8399133/]
- 78. 3-Aminopropyltriethoxysilane (APTES) Deposition Methods on ... [https://pubmed.ncbi.nlm.nih.gov/36671871/]
- 79. Surface immobilization strategies for the development of ... [https://www.sciencedirect.com/science/article/abs/pii/S0956566323003822]
- 80. Biosensor surface functionalization by a simple ... [https://pubs.rsc.org/en/content/articlelanding/2019/an/c9an00443b]
- 81. Electrochemical Signal Amplification Strategies and Their ... [https://pmc.ncbi.nlm.nih.gov/articles/PMC9394270/]
- 82. Recent Advances in Signal Amplification to Improve ... [https://www.frontiersin.org/journals/chemistry/articles/10.3389/fchem.2022.911678/full]
- 83. Frontiers | A review of antibody, aptamer, and nanomaterials synergistic systems for an amplified electrochemical signal [https://www.frontiersin.org/journals/bioengineering-and-biotechnology/articles/10.3389/fbioe.2024.1361469/full]
- 84. Review on nanoparticles and nanostructured materials [https://pmc.ncbi.nlm.nih.gov/articles/PMC5905289/]
- 85. Review on Nanoparticles and Nanostructured Materials [https://www.mdpi.com/2079-4991/12/3/457]
- 86. Signal amplification strategies in electrochemical biosensors ... [https://pubs.rsc.org/en/content/articlehtml/2022/ma/d2ma00427e]
- 87. Plasmonic Nanoparticle-Enhanced Optical Techniques for Cancer Biomarker Sensing [https://www.mdpi.com/2079-6374/13/11/977]
- 88. Optical Biosensor Platforms Display Varying Sensitivity for ... [https://pmc.ncbi.nlm.nih.gov/articles/PMC8534094/]
- 89. Anti-Fouling Strategies of Electrochemical Sensors for Tumor Markers - PMC [https://www.ncbi.nlm.nih.gov/pmc/articles/PMC10256055/]
- 90. Antifouling Strategies for Sensors Used in Water Monitoring [https://www.mdpi.com/1424-8220/21/2/389]
- 91. Anti-Biofouling Strategies for Long-Term Continuous Use ... [https://www.mdpi.com/2227-9040/8/3/66]
- 92. A comprehensive study of the resistance to biofouling ... [https://www.sciencedirect.com/science/article/abs/pii/S2352492819305598]
- 93. Pressure-induced piezoelectric response for mitigating ... [https://www.sciencedirect.com/science/article/abs/pii/S0043135424014532]
- 94. The future of sensor technology: emerging trends and ... [https://www.memsf.com/chanpinredian/The-future-of-sensor-technology-emerging-trends-and-innovations]
- 95. Miniaturized Sensor - an overview | ScienceDirect Topics [https://www.sciencedirect.com/topics/engineering/miniaturized-sensor]
- 96. Size Matters: Problems and Advantages Associated with ... [https://pmc.ncbi.nlm.nih.gov/articles/PMC3376590/]
- 97. A Short Review on Miniaturized Biosensors for the Detection ... [https://pmc.ncbi.nlm.nih.gov/articles/PMC10046286/]
- 98. New Advances in Miniaturized CIS Packaging - GALAXYCORE [https://en.gcoreinc.com/news/detail-80]
- 99. Balancing Miniaturization, Power, and Compliance in ... [https://www.medicaldesignbriefs.com/component/content/article/53871-balancing-miniaturization-power-and-compliance-in-sensor-design]
- 100. Trends in miniaturized biosensors for point-of-care testing [https://www.sciencedirect.com/science/article/abs/pii/S016599361930514X]
- 101. Detection limit [https://en.wikipedia.org/wiki/Detection_limit]
- 102. Direct Comparison of SARS-CoV-2 Analytical Limits ... [https://pmc.ncbi.nlm.nih.gov/articles/PMC7448668/]
- 103. How to Characterize Limit of Detection (LOD) and Dynamic ... [https://eureka.patsnap.com/report-how-to-characterize-limit-of-detection-lod-and-dynamic-range-for-resonant-biosensors]
- 104. When lower isn't always better in biosensor research and ... [https://www.sciencedirect.com/science/article/abs/pii/S0956566324006766]
- 105. When lower isn't always better in biosensor research and ... [https://pubmed.ncbi.nlm.nih.gov/39151260/]
- 106. A comparison of conventional and advanced electroanalytical ... [https://pmc.ncbi.nlm.nih.gov/articles/PMC9270057/]
- 107. Methods for Estimating the Detection and Quantification ... [https://www.mdpi.com/1424-8220/24/11/3520]
- 108. Progress towards efficient MXene sensors [https://www.nature.com/articles/s43246-025-00907-y]
- 109. Optical vs. Electrochemical Biosensors: Key Differences [https://www.rfwireless-world.com/terminology/optical-vs-electrochemical-biosensors]
- 110. An outlook on electrochemical approaches for molecular ... [https://www.sciencedirect.com/science/article/pii/S2666053922000145]
- 111. Biosensors Market Size, Share, & Trends Reports 2032 [https://www.meticulousresearch.com/product/biosensors-market-5518]
- 112. Biosensors Market Size, Share & Analysis | Growth Report ... [https://www.fortunebusinessinsights.com/industry-reports/bio-sensors-market-100146]
- 113. Types of Biosensors : Optical, Electrochemical, Piezoelectric examples | RF Wireless World [https://www.rfwireless-world.com/articles/biosensor-types-and-working-principles]
- 114. Machine learning optimized design of THz piezoelectric perovskite-based biosensor for the detection of formalin in aqueous environments | Scientific Reports [https://www.nature.com/articles/s41598-025-88766-y]
- 115. Point-of-care biosensors for infectious disease diagnosis: recent... [https://pubs.rsc.org/en/content/articlehtml/2025/ra/d5ra03897a]
- 116. Biosensors Market: Comprehensive Analysis and Forecast ... [https://www.pharmiweb.com/press-release/2025-02-13/biosensors-market-comprehensive-analysis-and-forecast-2025-2035]
- 117. Biosensors Market Size, Trends & Growth Drivers 2030 [https://www.mordorintelligence.com/industry-reports/biosensors-market]
- 118. Optical Biosensor Market Report | Global Forecast From ... [https://dataintelo.com/report/optical-biosensor-market]
- 119. Biosensors Market Size & Demand Forecast 2025-2035 [https://www.futuremarketinsights.com/reports/biosensors-market]
- 120. High-performance electrochemical biosensor comprising ... [https://www.nature.com/articles/s42004-025-01703-y]
- 121. Electrochemical Biosensors: A Prospective Insight to ... [https://www.sciencedirect.com/science/article/abs/pii/S2451910325001358]
- 122. AI in Drug Development: Clinical Validation and ... [https://globalforum.diaglobal.org/issue/june-2025/ai-in-drug-development-clinical-validation-and-regulatory-innovation-are-dual-imperatives/]
- 123. Bridging Implementation Gaps in Digital Health [https://pmc.ncbi.nlm.nih.gov/articles/PMC12494540/]
- 124. Electrochemical biosensors based on the 3D immobilization of ... [https://pubs.rsc.org/en/content/articlehtml/2025/ra/d5ra03744a]
- 125. Piezoelectric Biosensor Market Report 2025 (Global Edition) [https://www.cognitivemarketresearch.com/piezoelectric-biosensor-market-report]
- 126. Everything's under Control: Maximizing Biosensor ... [https://pmc.ncbi.nlm.nih.gov/articles/PMC11840803/]
- 127. Biosensors Industry worth $54.37 billion by 2030 [https://www.marketsandmarkets.com/PressReleases/biosensors.asp]
- 128. Colorimetric Biosensors: Advancements in Nanomaterials ... [https://pmc.ncbi.nlm.nih.gov/articles/PMC12190540/]
- 129. Design and optimization of a colorimetric biosensor using ... [https://www.sciencedirect.com/science/article/pii/S0026265X24017120]
- 130. Improving standards in the reporting of optical biosensor ... [https://www.sciencedirect.com/science/article/pii/S2472555224000546]
- 131. Nanoparticle-enabled portable biosensors for early ... [https://www.sciencedirect.com/science/article/pii/S2590137025001025]