ELISA Weak Signal: Expert Troubleshooting Guide for Causes and Reliable Solutions
This guide provides researchers, scientists, and drug development professionals with a comprehensive framework for diagnosing and resolving weak or absent signals in Enzyme-Linked Immunosorbent Assays (ELISA).
ELISA Weak Signal: Expert Troubleshooting Guide for Causes and Reliable Solutions
Abstract
This guide provides researchers, scientists, and drug development professionals with a comprehensive framework for diagnosing and resolving weak or absent signals in Enzyme-Linked Immunosorbent Assays (ELISA). Covering foundational principles, methodological best practices, systematic troubleshooting, and validation techniques, the article delivers actionable strategies to overcome common pitfalls, optimize assay performance, and ensure the generation of robust, reproducible, and reliable data in both research and diagnostic settings.
Understanding ELISA Weak Signals: Core Principles and Common Pitfalls
The Core Principle of ELISA Signal Generation
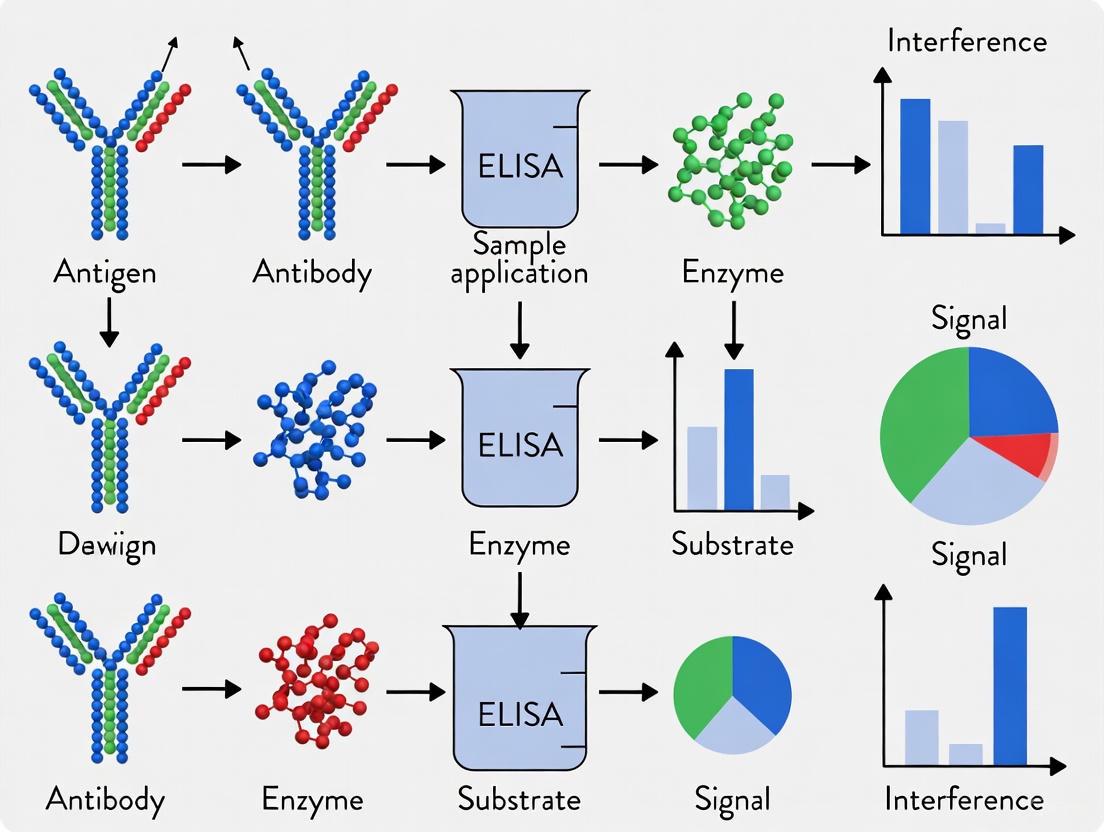
The Enzyme-Linked Immunosorbent Assay (ELISA) operates on the principle of indirectly detecting the binding between an antibody and an antigen through an enzyme-mediated reaction that produces a measurable signal [1]. The fundamental process involves immobilizing a target molecule (antigen) on a solid surface, using a specific antibody conjugated to an enzyme for detection, and then adding a substrate that the enzyme converts into a colored, fluorescent, or luminescent product [1] [2]. The intensity of this final signal is proportional to the amount of target analyte present in the sample, allowing for both qualitative and quantitative analysis [1].
The following diagram illustrates the logical sequence of the core signal generation pathway, from reagent preparation to signal measurement.
The Scientist's Toolkit: Essential Reagents and Materials
Successful execution of an ELISA and reliable signal generation depend on a set of core components. The table below details these essential items and their specific functions within the assay.
Table 1: Key Research Reagent Solutions for ELISA
| Component | Function in Signal Generation Pathway |
|---|---|
| Solid Phase (Microplate) [3] [2] | Provides a surface for passive adsorption (binding) of the capture antibody or antigen; typically a 96-well plate made of polystyrene. |
| Capture & Detection Antibodies [1] [3] | Provide specificity. The capture antibody immobilizes the antigen, while the detection antibody, often part of a "matched pair," binds to a different epitope on the antigen [4]. |
| Enzyme Conjugate [1] [2] | Key to signal generation. Enzymes like Horseradish Peroxidase (HRP) or Alkaline Phosphatase (AP) are linked to the detection antibody or a secondary antibody and catalyze the conversion of substrate to detectable product. |
| Enzyme Substrate [2] [5] | The molecule converted by the enzyme into a measurable product (e.g., TMB for HRP turns blue, then yellow when stopped). Choice depends on the enzyme and detection mode (colorimetric, fluorescent, chemiluminescent). |
| Coating Buffer [6] [3] | A high-pH buffer (e.g., carbonate-bicarbonate, pH 9.6) that optimizes the binding of protein (antibody or antigen) to the plastic microplate. |
| Blocking Buffer [1] [3] | A solution of irrelevant protein (e.g., BSA, casein) that coats any remaining protein-binding sites on the plate after coating, preventing nonspecific binding of antibodies and reducing background noise. |
| Wash Buffer [3] [4] | Typically PBS or Tris-buffered saline with a detergent like Tween 20, used to remove unbound reagents and reduce background in between assay steps, which is critical for a clean signal. |
ELISA Troubleshooting Guide: Weak or No Signal
Weak or absent signal is a common challenge that can stem from issues at various points in the signal generation pathway. The following FAQs systematically address the root causes and solutions.
FAQ: My ELISA produced no signal. What are the primary causes?
A complete lack of signal indicates a critical failure in the signal generation cascade. The most common causes are related to reagent integrity and fundamental protocol execution [6] [7] [8].
Table 2: Troubleshooting No Signal in ELISA
| Possible Cause | Recommended Solution |
|---|---|
| Inactive Enzyme Conjugate or Substrate [6] [7] | Prepare fresh substrate and check conjugate activity with a positive control. Ensure conjugates are stored correctly (often at 4°C) and protected from light [6]. |
| Reagents Added Incorrectly [7] [8] | Review the protocol to ensure reagents were added in the correct order. Verify all dilutions and calculations. |
| Expired or Improperly Stored Reagents [7] | Confirm all reagent expiration dates. Double-check storage conditions on the kit label; most components require refrigeration at 2–8°C. |
| Capture Antibody Failed to Bind to Plate [7] [8] | Ensure you are using an ELISA plate (not a tissue culture plate). If coating your own plate, dilute the antibody in PBS and ensure correct incubation time and temperature for the coating step. |
FAQ: I have a signal, but it is consistently weak. How can I optimize it?
A weak signal suggests the assay is functioning sub-optimally. This often requires fine-tuning reagent concentrations and incubation conditions to enhance the signal-to-noise ratio [9] [3] [4].
Table 3: Optimization Strategies for Weak Signal
| Parameter to Optimize | Guidelines and Recommended Ranges |
|---|---|
| Antigen Coating [6] | Check coating concentration (1–10 µg/mL for most proteins). Ensure optimal coating buffer (e.g., pH 9.6 carbonate-bicarbonate) and incubate overnight at 4°C for maximum adsorption. |
| Antibody Concentrations [9] [3] | Titrate both capture and detection antibodies. For affinity-purified antibodies, typical ranges are 1–12 µg/mL for coating and 0.5–5 µg/mL for detection. |
| Enzyme Conjugate Concentration [9] [3] | Titrate the conjugate. For HRP in colorimetric systems, a range of 20–200 ng/mL is a common starting point. Too little conjugate yields weak signal; too much increases background. |
| Incubation Conditions [6] | Ensure all incubation steps are performed at the correct temperature (room temperature or 37°C) and for a sufficient duration (typically 1–2 hours) to allow for complete binding. |
| Sample and Matrix Effects [9] [4] | Perform serial dilutions of the sample to overcome matrix interference. Use spike-and-recovery experiments to verify antigen detection in complex matrices like serum. |
FAQ: My standard curve looks good, but my samples show weak signal. What does this mean?
This specific scenario indicates that the assay itself is functioning correctly, but something is interfering with the detection of the target in the sample matrix [8].
- Sample Matrix Interference: Components in complex biological samples (e.g., serum, plasma) can mask epitopes, bind the target, or non-specifically interfere with antibody binding [3] [8].
- Solution: Dilute the sample at least 1:2 in the appropriate diluent, or perform a series of dilutions to check for linearity and improved recovery [9] [8]. Using a diluent that closely matches the sample matrix can also help.
- Target Concentration Too Low: The analyte in the sample may be below the detection limit of the assay.
- Solution: Concentrate the sample or switch to a more sensitive ELISA format or substrate (e.g., from colorimetric to chemiluminescent) [9] [4].
Experimental Protocol: Checkerboard Titration for Antibody Optimization
To systematically optimize antibody and conjugate concentrations, a checkerboard titration is the most efficient methodology [9] [4]. This experiment allows you to test multiple concentrations of two components simultaneously against a constant antigen concentration.
Objective: To determine the optimal working concentrations of the capture and detection antibodies for a sandwich ELISA.
Materials:
- Coating buffer (e.g., 0.2 M carbonate-bicarbonate, pH 9.4)
- Blocking buffer (e.g., 1-5% BSA in PBS)
- Wash buffer (PBS or TBS with 0.05% Tween 20)
- Capture antibody (at a known stock concentration)
- Detection antibody (at a known stock concentration)
- Antigen (recombinant protein standard)
- Enzyme conjugate
- Substrate solution
- Stop solution
Methodology:
- Prepare Capture Antibody Dilutions: Dilute the capture antibody in coating buffer to create a series of concentrations (e.g., 0.5, 1, 5, and 10 µg/mL).
- Coat Plate: Add each concentration of capture antibody to a row of the microplate, using a different column for each concentration. Incubate overnight at 4°C.
- Block: Wash the plate and add blocking buffer to all wells. Incubate for 1-2 hours at room temperature.
- Prepare Detection Antibody Dilutions: Dilute the detection antibody in blocking buffer to create a series of concentrations (e.g., 0.5, 1, 2, and 4 µg/mL).
- Add Antigen and Detection Antibody: After washing, add a fixed, known concentration of antigen to all wells. Then, add the different concentrations of detection antibody to the columns, creating a matrix where each well has a unique combination of capture and detection antibody concentrations.
- Complete Assay: Continue with the standard protocol for enzyme conjugate incubation, substrate addition, and signal measurement.
- Analysis: Identify the combination of antibody concentrations that yields the strongest specific signal with the lowest background.
The following diagram visualizes the setup of a checkerboard titration experiment.
What is a Weak Signal in ELISA?
In the context of ELISA, a "weak signal" describes a measurement that is fainter than expected, ranging from a complete absence of signal (no color development) to a perceptible but low-intensity signal that falls below the assay's optimal detection range [10]. This compromised signal-to-noise ratio directly impacts the assay's sensitivity and reliability, making it difficult to accurately quantify the target analyte. Properly defining and troubleshooting this issue is crucial for generating valid, reproducible data in research and drug development.
What are the Primary Causes of Weak or No Signal?
Weak or absent signals in ELISA can stem from failures at various stages of the assay. The table below summarizes the most common causes and their direct solutions.
| Primary Cause Category | Specific Example | Recommended Solution |
|---|---|---|
| Reagent Handling & Integrity [11] [7] | Expired reagents; improper storage (e.g., not at 2-8°C); contamination; repeated freeze-thaw cycles of antibodies [10]. | Check expiration dates [7]; store all components as recommended [12]; use fresh, single-use aliquots [12]. |
| Assay Procedure Errors [11] [7] | Reagents not brought to room temperature before use; incorrect incubation time or temperature; missing a key reagent (e.g., detection antibody or enzyme conjugate) [11]. | Allow all reagents to equilibrate to room temperature for 15-20 minutes before starting [7]; follow recommended incubation times and temperatures precisely [11]. |
| Pipetting & Dilution Errors [13] | Incorrect dilutions of standard or detection antibody; use of uncalibrated pipettes; fast aspiration/discharge causing inaccurate volumes [13]. | Calibrate pipettes; double-check dilution calculations; pipette slowly and carefully to ensure volume accuracy [13]. |
| Insufficient Antibody Binding [3] | Too little capture or detection antibody used; antibody pairs are not compatible or are not "matched"; epitope impeded due to plate adsorption [10]. | Titrate antibodies to find optimal concentration [3]; ensure antibody compatibility [10]; for peptides, conjugate to a carrier protein before coating [10]. |
| Plate-Related Issues [3] [8] | Using a tissue culture plate instead of a binding-optimized ELISA plate; capture antibody did not bind to the plate; wells dried out during incubation [8]. | Use a correct ELISA plate [8]; ensure plates are covered with a fresh sealer during all incubations to prevent evaporation [12]. |
| Detection System Problems [10] [13] | Plate read at incorrect wavelength; incompatible buffer (e.g., sodium azide in HRP-based systems) [10]; substrate exposed to light or prepared incorrectly [13]. | For TMB, read absorbance at 450 nm [13]; ensure buffers do not contain enzyme inhibitors like sodium azide [10]; protect substrates from light [12]. |
Diagram 1: Troubleshooting weak or no signal in ELISA.
How Do You Systematically Troubleshoot a Weak Signal?
A systematic approach is the most efficient way to resolve weak signal issues.
Step 1: Verify the Obvious
Begin by confirming that all reagents are within their expiration dates and have been stored according to the manufacturer's instructions [7]. Before starting the assay, ensure all reagents, including the plate, have been allowed to reach room temperature (18-25°C) for 15-30 minutes [7] [13].
Step 2: Review the Protocol and Technique
Carefully retrace your steps against the protocol. Confirm that all reagents were added in the correct order and that no steps (e.g., adding detection antibody or enzyme conjugate) were accidentally skipped [11] [8]. Check your pipetting technique and calibration; inaccurate pipetting is a common source of error [13].
Step 3: Include Appropriate Controls
Always run the provided standards and controls. A normal standard curve with a weak sample signal points to an issue with the sample itself (e.g., analyte not present, incompatible matrix) [8]. If the positive control also shows a weak signal, the problem lies with the assay reagents or procedure [10].
Step 4: Investigate Detection
Confirm that the plate reader is set to the correct wavelength (e.g., 450 nm for TMB substrate) [13]. If using fluorescence or chemiluminescence, ensure the correct filters and settings are used [3]. Also, verify that the substrate was prepared correctly and used immediately [12].
How Can You Validate and Optimize a Low-Sensitivity Assay?
If systematic troubleshooting does not resolve the issue, your assay may be suffering from fundamental low sensitivity. The following experimental protocols can help validate and optimize your assay.
Experimental Protocol 1: Antibody Titration
Objective: To determine the optimal concentration of capture and detection antibodies for maximum signal-to-noise ratio.
- Capture Antibody Titration: Coat the ELISA plate with a range of concentrations (e.g., 1-15 μg/mL) of the capture antibody overnight at 4°C [3].
- Block and Wash: Block the plate with an appropriate blocking buffer (e.g., 1% BSA in PBS).
- Add Target: Add a fixed, medium concentration of your target antigen (standard) and incubate.
- Detection Antibody Titration: Add a range of concentrations (e.g., 0.5-10 μg/mL) of the detection antibody and incubate [3].
- Complete Assay: Add enzyme conjugate and substrate, then measure the signal. The optimal antibody combination is the one that yields the highest signal for the target with the lowest background.
Experimental Protocol 2: Sample and Matrix Investigation
Objective: To rule out matrix effects and confirm analyte detection.
- Spike-and-Recovery Experiment: Prepare a sample of known analyte concentration by "spiking" your standard into your sample matrix (e.g., serum, cell lysate).
- Run Assay: Measure the concentration of the spiked sample using your ELISA standard curve.
- Calculate Recovery: (Measured Concentration / Expected Concentration) x 100. Recovery should typically be between 80% and 120%. Poor recovery indicates matrix interference [3].
- Linearity-of-Dilution: Serially dilute a sample and assay the dilutions. The measured concentrations should be proportional to the dilution factor. Non-linearity suggests interference.
Diagram 2: Validation and optimization of a low-sensitivity assay.
The Scientist's Toolkit: Key Research Reagent Solutions
| Reagent / Material | Critical Function | Optimization Tip |
|---|---|---|
| Matched Antibody Pairs [3] | A pair of antibodies that bind to distinct, non-overlapping epitopes on the target antigen. Essential for sandwich ELISA. | Use validated pairs to ensure compatibility and performance. Using unpurified antibodies (e.g., serum) can increase background [3]. |
| High-Binding ELISA Plates [3] [8] | Specialized polystyrene plates designed to passively adsorb proteins efficiently. | Do not substitute with tissue culture plates, which have different surface properties and will result in poor antibody binding [8]. |
| Affinity-Purified Antibodies [3] | Antibodies purified to isolate only those specific to the target antigen. | Using affinity-purified antibodies significantly improves the signal-to-noise ratio by reducing non-specific binding [3] [12]. |
| Enzyme Conjugates [3] | The enzyme (e.g., HRP, AP) linked to the detection system. Generates the measurable signal. | Concentration is crucial. Titrate to find the optimal level; too little causes weak signal, too much increases background [3]. |
| Blocking Buffer [3] | A protein solution (e.g., BSA, non-fat dry milk) used to coat all unused plastic surfaces to prevent non-specific antibody binding. | If cross-reactivity is observed, switch to a non-mammalian protein blocker (e.g., fish serum) or a protein-free blocker [3]. |
| Wash Buffer [3] | Typically PBS or TBS with a low concentration (0.05%) of a detergent like Tween 20. | The detergent helps remove unbound reagents while minimizing the disruption of specifically bound complexes. |
Critical Reagents and Their Role in Signal Failure
Within the broader research on ELISA weak signal causes and solutions, the critical role of specific reagents is well-established. Signal failure or weakness is rarely an isolated equipment malfunction; it is frequently a direct consequence of improper reagent handling, selection, or optimization. This technical guide addresses the most common reagent-related failures encountered by researchers and drug development professionals, providing targeted troubleshooting and methodologies to restore assay integrity.
FAQs: Addressing Common Reagent-Related Signal Failures
What are the primary reagent-related causes of a weak or absent ELISA signal?
Weak or no signal often stems from issues that prevent the antibody-antigen-enzyme complex from forming properly or from the degradation of critical components.
- Incorrect Reagent Preparation or Handling: Improper reconstitution, dilution outside the optimal range, or the use of expired reagents directly impacts effective concentration and activity [11] [7]. Pipetting errors during serial dilution are a common source of error [7] [8].
- Loss of Reagent Activity: Antibodies, enzyme conjugates, and substrates can lose activity due to improper storage (e.g., not at 2–8°C as recommended), repeated freeze-thaw cycles, or bacterial contamination of buffers [7] [10] [8].
- Inefficient Antibody Binding: The capture antibody may not have bound effectively to the plate, or the detection antibody may be used at a concentration that is too low [7] [8]. This is particularly critical when using antibody pairs that have not been validated to work together [3] [14].
- Incompatible Reagents: The use of buffers containing inhibitors (e.g., sodium azide, which inhibits HRP) with the corresponding enzyme conjugate will quench the signal [10]. Mixing components from different kit lots or manufacturers can also lead to failure, as they are not optimized to work together [11] [10].
Why is my ELISA background too high, and how can reagents be optimized to address this?
High background, which reduces the signal-to-noise ratio, is typically caused by non-specific binding or incomplete washing.
- Insufficient Blocking: An suboptimal or cross-reactive blocking buffer fails to occupy all non-specific protein-binding sites on the plate [3] [14]. If cross-reactivity is suspected, switch to a different blocking agent, such as a non-mammalian protein like salmon serum or a protein-free solution [3].
- Over-concentration of Enzyme Conjugate: Using too much enzyme conjugate can lead to excessive non-specific binding, elevating the background signal [3] [14]. Titration is required to find the optimal concentration that maximizes specific signal while minimizing background.
- Contaminated Reagents or Buffers: Bacterial contamination in buffers or the reuse of plate sealers can introduce residual enzyme activity, leading to high background across the plate [11] [7] [8].
My standard curve is poor, but my samples seem fine. Could reagents be the issue?
A poor standard curve directly invalidates sample quantification and is often linked to the standard and its handling.
- Degraded Standard: The standard protein, if improperly stored, handled, or reconstituted, can degrade, leading to an inaccurate standard curve [8].
- Incorrect Standard Dilutions: Errors in pipetting or calculations during the serial dilution of the standard will distort the curve [7] [8]. Always prepare fresh dilutions and double-check calculations.
- Incompatible Standard Diluent: The matrix of the standard diluent should closely match the sample matrix. A significant mismatch can affect protein stability and antibody binding, leading to a compressed or non-linear curve [9] [14].
Troubleshooting Guides
Systematic Troubleshooting for Weak/No Signal
| Possible Cause | Diagnostic Steps | Recommended Solution |
|---|---|---|
| Expired or Inactive Reagents | Check expiration dates on all vials. Run a positive control if available. | Use fresh, validated reagents. Do not use reagents past their expiration date [11] [7]. |
| Improper Reagent Storage | Verify that all components have been stored according to the manufacturer's instructions (typically 2–8°C). | Store reagents as directed. Avoid repeated freeze-thaw cycles [11] [7] [10]. |
| Incorrect Antibody Concentration | Review protocol for recommended concentrations. If developing an in-house assay, the concentration may need optimization. | Follow kit protocols precisely. For in-house assays, perform a checkerboard titration to optimize antibody concentrations [3] [9]. |
| Incompatible Detection System | Confirm that the secondary antibody is raised against the species of the primary antibody. Check buffers for enzyme inhibitors (e.g., sodium azide for HRP). | Use a compatible secondary antibody. Prepare fresh buffers without inhibitory agents [10]. |
| Low-Quality Coating | If coating your own plate, ensure an ELISA plate (not a tissue culture plate) is used with a suitable coating buffer (e.g., carbonate-bicarbonate, pH 9.4) [3]. | Use an ELISA-specific plate and an optimized coating buffer. Ensure correct incubation time and temperature for coating [7] [8]. |
Experimental Protocol: Checkerboard Titration for Antibody Optimization
When developing a sandwich ELISA in-house or troubleshooting a matched antibody pair, a checkerboard titration is essential for determining the optimal concentrations of capture and detection antibodies [9] [14].
Methodology:
- Prepare Capture Antibody Dilutions: Dilute the capture antibody in a suitable coating buffer (e.g., 0.2 M carbonate-bicarbonate, pH 9.4) to at least three different concentrations within the recommended range (e.g., 1, 5, and 10 µg/mL for an affinity-purified antibody) [3] [9].
- Coat the Plate: Add each dilution of the capture antibody to a full row of the ELISA plate. Incubate overnight at 4°C or for 1-2 hours at room temperature.
- Block the Plate: Wash the plate and add a blocking buffer (e.g., 1% BSA or a commercial protein blocker) to all wells. Incubate for 1-2 hours.
- Prepare Detection Antibody Dilutions: While blocking, prepare a series of dilutions for the detection antibody (e.g., 0.5, 1, and 2 µg/mL).
- Add Antigen and Detection Antibody: After washing, add a fixed, medium concentration of the target antigen (or a positive control sample) to all wells. Then, add the different detection antibody dilutions to separate columns, creating a matrix where each well has a unique combination of capture and detection antibody concentrations.
- Complete the Assay: Continue with the standard protocol for enzyme conjugate addition, washing, substrate development, and signal detection.
- Analysis: Analyze the results to identify the combination of antibody concentrations that yields the strongest specific signal with the lowest background.
The Scientist's Toolkit: Research Reagent Solutions
| Item | Function in ELISA |
|---|---|
| Matched Antibody Pairs | Pre-validated sets of capture and detection antibodies that bind to distinct epitopes on the target antigen, forming the core of a specific sandwich ELISA [3] [14]. |
| Affinity-Purified Antibodies | Antibodies purified to remove non-specific immunoglobulins, which reduces background noise and improves the signal-to-noise ratio [3] [9]. |
| Protein-Based Blockers | Solutions (e.g., BSA, casein, non-fat dry milk) containing inert proteins that occupy non-specific binding sites on the microplate to prevent false-positive signals [3] [15]. |
| HRP or AP Enzyme Conjugates | Enzymes like Horseradish Peroxidase (HRP) or Alkaline Phosphatase (AP) linked to detection or secondary antibodies. They catalyze the substrate to produce a detectable signal [3] [5]. |
| High-Sensitivity Substrates | Chromogenic, chemiluminescent, or fluorogenic molecules that produce a measurable product upon enzyme action. Choosing a high-sensitivity substrate is crucial for detecting low-abundance targets [9] [14]. |
| Stabilized Protein Standards | Purified recombinant proteins of known concentration used to generate the standard curve, which is essential for accurate sample quantification [3] [9]. |
Critical Reagent Interaction Workflow
The following diagram illustrates the logical relationship between critical reagents in a sandwich ELISA and where failures can lead to a weak or absent signal.
ELISA Signal Failure Troubleshooting Path
This decision diagram provides a systematic path for diagnosing signal failure based on experimental observations.
▎Frequently Asked Questions (FAQs)
1. What is the most critical factor in choosing an ELISA plate? The most critical factor is selecting a plate with the correct surface binding properties. High-binding plates (often hydrophilic) are suitable for most globular proteins, synthetic antigens, and antibodies. Low-binding plates are a better choice for hydrophobic proteins, such as lipoproteins, to prevent denaturation and maintain functionality [16].
2. How does the coating buffer affect assay performance? The coating buffer stabilizes the protein and facilitates its adsorption to the polystyrene plate. A buffer with a pH above or below the protein's isoelectric point (pI) is necessary for effective binding. While carbonate/bicarbonate buffer (pH 9.6) and PBS (pH 7.4) are common choices, commercial coating buffers containing stabilizers and antioxidants are recommended for sensitive proteins to maintain physiological stability and reactivity [16].
3. Why is a blocking step essential, and what are the common blocking agents? Blocking is crucial to prevent non-specific binding of detection antibodies to any remaining protein-binding sites on the plate, which causes high background noise. Common agents include Bovine Serum Albumin (BSA), casein, and normal serums. Be cautious with BSA, as some preparations may contain contaminating IgG, which can lead to background with certain antibodies [17] [18].
4. My assay has a weak signal even after coating. What could be wrong? Weak signal can stem from several issues related to plate coating [10] [7] [8]:
- Poor Antibody Orientation: Passive adsorption can cause random antibody orientation, reducing the number of functionally active antibodies available for binding [17].
- Insufficient Coating Concentration: The concentration of the capture antibody or antigen may be too low.
- Improper Washing: Aggressive washing can sometimes remove coated protein [10].
5. How can I improve the sensitivity of my ELISA through plate coating? Strategies to enhance sensitivity include [17]:
- Oriented Immobilization: Using plates pre-coated with Protein A, Protein G, or streptavidin to ensure the antibody's antigen-binding regions are facing the solution.
- Surface Modifications: Employing plates with polymer coatings (e.g., PEG) to reduce non-specific binding and improve the signal-to-noise ratio.
▎Troubleshooting Guide: Common Plate and Coating Issues
| Problem | Possible Cause | Recommended Solution |
|---|---|---|
| Weak or No Signal | Poor protein adsorption to plate [10] | Pre-treat plate or use "enhanced binding" plates [10]; ensure using an ELISA plate, not a tissue culture plate [7] [8]. |
| Random antibody orientation [17] | Use specialized plates (e.g., Protein G, streptavidin) for oriented antibody binding [17] [18]. | |
| Epitope masked due to adsorption [10] | For peptide targets, conjugate to a large carrier protein before coating [10]. | |
| High Background | Ineffective blocking [18] [15] | Use a fresh, effective blocking agent (e.g., BSA, normal serum); ensure blocking buffer is compatible with assay components [18]. |
| Non-specific binding | Apply nonfouling surface modifications or polymer brushes to the plate surface [17]. | |
| High Variation Between Replicates | Uneven coating [8] | Ensure coating buffer is protein-free; check coating volumes, times, and method of reagent addition [18] [8]. |
| Inconsistent washing | Follow a standardized washing procedure; ensure all ports of an automatic washer are clean [8]. |
▎Experimental Protocol: Checkerboard Titration for Optimal Coating
A checkerboard titration is a critical experiment to simultaneously determine the optimal concentrations of both the capture and detection antibodies for a sandwich ELISA. This prevents reagent waste and ensures a strong, specific signal.
1. Materials Needed
- ELISA plate (e.g., high-binding)
- Capture antibody (purified)
- Detection antibody (purified, conjugated or for subsequent secondary antibody use)
- Coating buffer (e.g., 0.2 M carbonate/bicarbonate, pH 9.6)
- Blocking buffer (e.g., 1-5% BSA or normal serum in PBS)
- Wash buffer (e.g., PBS with 0.05% Tween-20)
- Substrate solution (appropriate for your detection enzyme)
- Stop solution (if required)
- Plate reader
2. Procedure
- Prepare Capture Antibody Dilutions: Create a series of dilutions (e.g., 0.5, 1, 2, 5, 10 µg/mL) in coating buffer [16].
- Coat the Plate: Add each dilution to a column of wells (100 µL/well). Incubate overnight at 4°C or for 1-4 hours at room temperature [16].
- Block the Plate: Discard the coating solution, wash the plate 3 times, add blocking buffer (150-200 µL/well), and incubate for 1-2 hours [16].
- Prepare Detection Antibody Dilutions: While blocking, prepare a series of detection antibody dilutions.
- Apply Detection Antibody: After washing, add different detection antibody concentrations to rows of wells.
- Complete the Assay: Continue with standard ELISA steps: incubate, wash, add substrate, and read the signal.
3. Data Analysis The optimal concentration pair is the one that yields the strongest positive signal with the lowest background (often the highest signal-to-noise ratio). The results can be visualized in a table where the columns are capture antibody concentrations and the rows are detection antibody concentrations.
▎The Scientist's Toolkit: Essential Reagents for ELISA Coating
| Item | Function | Key Considerations |
|---|---|---|
| High-Binding ELISA Plates | Provides a hydrophilic surface for passive adsorption of proteins via hydrophobic interactions [16]. | Ideal for most antibodies and globular proteins. |
| Low-Binding ELISA Plates | Minimizes protein attachment, useful for specific hydrophobic proteins to prevent denaturation [16]. | Use for lipoproteins or highly hydrophilic proteins. |
| Carbonate/Bicarbonate Buffer | A common coating buffer (pH 9.6) that creates conditions favorable for protein binding to polystyrene [18] [16]. | Suitable for many proteins; check protein stability at high pH. |
| PBS Buffer | An alternative coating buffer at a neutral pH (7.4) [18] [16]. | Use if the protein is sensitive to alkaline conditions. |
| BSA (Bovine Serum Albumin) | A widely used blocking agent that occupies any remaining protein-binding sites on the plate [17] [18]. | Ensure the preparation is IgG- and protease-free to avoid background [18]. |
| Normal Serum | An alternative blocking reagent derived from non-immunized animals (e.g., goat, donkey) [18]. | Use serum from the same species as the detection antibody to minimize interference. |
| Protein A/G Coated Plates | Provides oriented antibody immobilization by binding the Fc region, improving antigen-binding efficiency [17] [18]. | Not recommended for sandwich ELISA as detection antibodies may also bind [18]. |
| Streptavidin-Coated Plates | Used to capture biotinylated antibodies or antigens, ensuring uniform orientation [18]. | Requires prior biotinylation of the capture molecule [17]. |
FAQs and Troubleshooting Guides
FAQ 1: Why is the selection of antibody pairs critical for a sandwich ELISA?
In a sandwich ELISA, the capture and detection antibodies must recognize the target antigen simultaneously by binding to distinct, non-overlapping epitopes. [19] [20] If the antibodies bind to the same or sterically hindered epitopes, effective detection cannot occur, leading to a weak or absent signal. [19] Using a validated matched antibody pair is crucial to prevent the antibodies from competing for binding and to avoid inter-antibody cross-reactivity that can cause high background noise. [21]
FAQ 2: How can epitope accessibility affect my ELISA signal?
The structural state of your target protein can hide antibody-binding sites. [22] For example, in protein aggregates, the N- and C-terminal regions may become buried within the complex, making them inaccessible to antibodies. [22] If your detection antibody's epitope is not exposed, binding will not occur, resulting in a weak signal. This is a common challenge when detecting different structural forms of a protein, such as monomers versus oligomers. [22]
FAQ 3: What are the consequences of improper antibody orientation on the plate?
When capture antibodies are passively adsorbed to the plate, they can attach in random orientations. [17] This can block their antigen-binding sites and reduce the number of functionally active antibodies available to capture the target, ultimately diminishing assay sensitivity. [17] Strategies like using Protein A/G or the biotin-streptavidin system help ensure uniform orientation of the capture antibody via its Fc region, improving binding capacity and signal strength. [17]
Troubleshooting Guide: Weak or No Signal
| Problem Area | Possible Cause | Recommended Solution |
|---|---|---|
| Antibody Pairs | Antibodies compete for the same or sterically hindered epitope. [19] [20] | Use a pre-validated matched antibody pair. [20] [21] |
| Antibody Orientation | Random antibody adsorption impedes antigen binding. [17] | Employ oriented immobilization (e.g., Protein G, biotin-streptavidin). [17] |
| Epitope Accessibility | Target epitope is hidden in the protein's native structure or aggregate form. [22] | Select an antibody targeting an accessible, linear epitope; consider protein denaturation. [22] |
| Assay Format | Direct ELISA format offers limited signal amplification. [21] | Switch to an indirect or sandwich ELISA format for enhanced sensitivity. [19] [21] |
| Signal Generation | Detection system is not sensitive enough for low-abundance targets. [10] | Implement signal amplification (e.g., biotin-streptavidin systems). [10] [21] |
Workflow Diagrams for Effective Binding
Antibody Pair Selection Strategy
Epitope Accessibility Workflow
Experimental Protocol: Validating an Antibody Pair
This protocol outlines the key steps to validate a new capture and detection antibody pair for a sandwich ELISA. [20]
Principle: To confirm that two antibodies can bind to the target antigen simultaneously without interference, forming the essential "sandwich" complex. [20]
Materials:
- Coating Buffer (e.g., carbonate-bicarbonate buffer, pH 9.4) [20]
- Blocking Buffer (e.g., PBS with 3-5% BSA or other protein) [20]
- Wash Buffer (e.g., PBS with 0.05% Tween-20)
- Capture and Detection Antibodies (candidates for the pair)
- Purified Target Antigen
- Appropriate Enzyme-Conjugated Secondary Antibody (if using an indirect detection method) [19] [21]
- Detection Substrate (colorimetric, chemiluminescent, or fluorescent)
Procedure:
- Plate Coating: Dilute the capture antibody in coating buffer to a concentration typically between 1–10 µg/mL. Add 50-100 µL to each well of a microplate and incubate for 2 hours at room temperature or overnight at 4°C. [20]
- Washing: Discard the coating solution and wash the plate three times with wash buffer. [20]
- Blocking: Add 200-300 µL of blocking buffer to each well to cover all unsaturated binding sites. Incubate for 1-2 hours at room temperature. [20]
- Antigen Addition: Wash the plate three times. Add a known concentration of the purified target antigen to the wells and incubate for 1-2 hours to allow binding to the capture antibody. [20]
- Detection Antibody Addition: Wash the plate three times. Add the detection antibody (either directly conjugated or biotinylated) and incubate for 1-2 hours. [19] [20]
- Signal Development (if needed): If using an indirect method, wash and add an enzyme-conjugated secondary antibody or streptavidin. Finally, add the appropriate substrate and measure the signal. [21]
Interpretation: A strong signal indicates the antibody pair is compatible and the epitopes are distinct. A weak or absent signal suggests the antibodies are competing for the same epitope or that their binding is sterically hindered.
Research Reagent Solutions
| Reagent / Material | Function in Assay Development |
|---|---|
| Validated Matched Antibody Pairs | Pre-optimized capture/detection antibodies known to bind non-overlapping epitopes, saving development time. [20] |
| Protein A/G Coated Plates | Microplates pre-coated with bacterial proteins that bind the Fc region of antibodies, ensuring proper orientation of capture antibodies. [17] |
| Biotinylated Antibodies & Enzyme-Labeled Streptavidin | A signal amplification system; multiple biotins on an antibody are bound by tetrameric streptavidin-enzyme, enhancing detection sensitivity. [21] |
| Monoclonal vs. Polyclonal Antibodies | Monoclonal antibodies offer high specificity to a single epitope, while polyclonal antibodies can increase sensitivity by binding multiple epitopes. [20] |
| Molecularly Imprinted Polymers (MIPs) | Synthetic polymers that can pre-concentrate the target antigen from a large sample volume into a small elution volume, improving the limit of detection. [23] |
ELISA Best Practices: Methodological Setup to Prevent Signal Issues
Step-by-Step Protocol for Robust Assay Setup
Core Principles of a Robust ELISA Setup
A robust Enzyme-Linked Immunosorbent Assay (ELISA) provides reproducible and reliable data. The foundation lies in meticulous attention to detail during the planning, execution, and analysis stages. Adherence to a standardized, optimized protocol minimizes variability and ensures the integrity of your results, which is crucial for sensitive detection in research and drug development [24].
The following workflow outlines the critical path for establishing a reliable assay, from initial reagent preparation to data validation.
Troubleshooting Guide: Weak or No Signal
Weak or absent signal is a common challenge that can stem from errors at various stages of the assay. The table below summarizes the primary causes and their respective investigative actions and solutions [11] [7] [10].
| Possible Cause | Investigation & Action | Reference Section |
|---|---|---|
| Reagent Handling | Confirm all reagents were at room temperature before use [7]. Check expiration dates and storage conditions (typically 2-8°C); avoid repeated freeze-thaw cycles [7] [10]. | Reagent Preparation |
| Pipetting & Dilutions | Verify pipette calibration and technique [7]. Double-check dilution calculations and ensure all reagents were added in the correct order [7] [8]. | Protocol Adherence |
| Inadequate Incubation | Ensure incubation times and temperatures adhere to the protocol. Low temperature or short incubation can reduce binding efficiency [11] [10]. | Incubation Parameters |
| Antibody Issues | Confirm the capture antibody bound correctly to the plate [7]. For self-coated plates, ensure an ELISA plate (not tissue culture) was used with PBS for dilution [7] [8]. Titrate antibody concentrations if too low [10] [8]. | Assay Components |
| Inefficient Detection | The detection system may not be sensitive enough. Consider switching from colorimetric to fluorescence, or use signal amplification methods like biotin-streptavidin [10]. Ensure the correct enzyme conjugate was added [25]. | Signal Generation |
| Over-Washing | While insufficient washing causes high background, overly aggressive washing can sometimes remove detection reagents. Reduce wash duration or pressure if this is suspected [10]. | Washing Process |
| Plate Coating Problems | For peptide targets, conjugation to a large carrier protein before coating can enhance detection. Using plates with "enhanced binding" surfaces can also improve adsorption [10]. | Plate Coating |
Essential Materials: The Scientist's Toolkit
The reliability of an ELISA is dependent on the quality and appropriate use of its core components. The table below lists key reagents and materials with their critical functions.
| Item | Function & Importance |
|---|---|
| ELISA Microplate | A plate specifically designed for high protein-binding capacity. Do not substitute with tissue culture plates [7] [8]. |
| Matched Antibody Pairs | Sets of capture and detection antibodies that recognize different, non-competing epitopes on the target antigen, which is essential for sandwich ELISA [24]. |
| Blocking Buffer | A protein-rich solution (e.g., BSA, casein, or serum) that coats any remaining plastic surface to prevent non-specific binding of detection antibodies, thereby reducing background noise [17] [24]. |
| Wash Buffer | Typically a buffered solution with a detergent (e.g., PBS-Tween), used to remove unbound reagents between steps. Thorough and consistent washing is critical for a low background [7] [25]. |
| Enzyme Conjugate | An antibody (secondary or detection) linked to an enzyme such as Horseradish Peroxidase (HRP) or Alkaline Phosphatase (AP). This enzyme generates the detectable signal [26]. |
| Substrate | A chemical converted by the enzyme into a colored (chromogenic), fluorescent, or luminescent product. The choice depends on the required sensitivity [24] [15]. |
| Stop Solution | An acidic solution that abruptly halts the enzyme-substrate reaction, stabilizing the signal before plate reading [25] [15]. |
Advanced Optimization & Validation Protocols
Checkerboard Titration for Systematic Optimization
When developing a new ELISA, optimal concentrations of capture and detection antibodies must be determined empirically. The checkerboard titration method efficiently tests different combinations of these two components simultaneously [24] [26].
Key Validation Parameters
Once a protocol is established, validate its performance using the following criteria [26]:
- Precision: Calculate the coefficient of variation (%CV). The intra-assay (within-plate) %CV should be <10%, and the inter-assay (between-plate) %CV should be <15% [26].
- Accuracy (Spike-and-Recovery): Spike a known amount of the target analyte into a sample matrix and measure the observed concentration against the expected value. Recovery close to 100% indicates minimal matrix interference [24] [26].
- Dilution Linearity: Serially dilute a high-concentration sample. The measured concentrations should be proportional to the dilution factor, confirming that the sample matrix does not interfere with detection across the working range [26].
- Sensitivity: The lower limit of detection (LLOD) is typically defined as the concentration corresponding to the mean signal of the zero standard plus two or three standard deviations.
Frequently Asked Questions (FAQs)
Q: My standard curve looks good, but my samples show no signal. What should I do? A: This indicates the target may be absent or below the assay's detection limit in your samples [8]. First, run a positive control. If the target is expected, try concentrating your sample or using a more sensitive detection method (e.g., chemiluminescence) [10]. Also, ensure your sample matrix is compatible with the assay, as interfering components can mask detection [10] [8].
Q: How can I reduce high background across the entire plate? A: High background is most commonly caused by insufficient washing or blocking [7] [24].
- Action: Increase the number of wash cycles or add a 30-second soak step during washing to ensure complete removal of unbound reagents [7] [8].
- Action: Verify that your blocking buffer is effective and that you used enough. You may need to test different blocking agents (e.g., BSA vs. casein) [24] [25].
- Action: Titrate down the concentration of your detection antibody or enzyme conjugate, as excess can bind non-specifically [24].
Q: What causes high variation between replicate wells? A: Poor replicates often stem from technical inconsistencies.
- Pipetting Error: Calibrate pipettes and ensure proper technique. Mix all reagents and samples thoroughly before addition [25].
- Inconsistent Washing: Use an automated plate washer or pay careful attention to manual washing to ensure each well is treated identically [8] [25].
- Edge Effects: Avoid stacking plates during incubation and use proper plate sealers to prevent evaporation and temperature gradients across the plate [7] [15].
Q: Are there novel methods to significantly enhance ELISA sensitivity? A: Yes, beyond traditional optimization, emerging strategies focus on advanced surface engineering and signal amplification. Surface modifications using polymer brushes (e.g., PEG) or oriented immobilization (e.g., via Protein G) can dramatically increase capture efficiency and reduce noise [17]. Furthermore, cell-free synthetic biology approaches are being integrated to create novel assay formats like expression immunoassays and CRISPR-linked immunoassays (CLISA), which can amplify signals and push detection limits to the attomolar range [17].
FAQs: Essential Reagent Handling for ELISA
What is the proper way to store and handle ELISA reagents to maintain stability? Reagents must be stored according to the manufacturer's instructions, typically at 2-8°C in a dry place, and avoiding freezing unless specified [27]. Key practices include:
- First In, First Out (FIFO): Use kits with the shortest expiry date first [27].
- Pre-warming: Bring all reagents to room temperature (20-25°C) before use to prevent condensation and ensure accurate pipetting [27] [8].
- Avoid Contamination: Return components to their recommended storage conditions promptly after use [27]. Use fresh, sterile buffers to prevent bacterial contamination, which can interfere with detection [10].
- No Component Interchange: Do not mix components from different kits or different lots of the same kit, as each kit is calibrated as a complete system [28] [29].
How should lyophilized reagents be reconstituted for optimal performance? Lyophilized (freeze-dried) reagents require careful reconstitution:
- Use Correct Buffer: Use the specific reconstitution buffer and volume stated in the kit's Instructions for Use (IFU) or Certificate of Analysis (CoA) [29].
- Gentle Reconstitution: Loosen the stopper carefully to avoid dislodging material. After adding the buffer, replace the stopper and gently swirl the vial for 5-10 seconds. Invert the vial three times to dissolve any material on the stopper [29].
- Equilibration: Unless stated otherwise, allow reconstituted reagents to stand for 30 minutes before use to ensure complete dissolution [29].
How can I prevent the degradation of antibodies and enzyme conjugates? Proper storage and handling are critical:
- Avoid Repeated Freeze-Thaws: Aliquot antibodies and reagents into single-use volumes to minimize freeze-thaw cycles, which reduce activity [27] [10].
- Protect from Light: Store fluorophores and fluorophore-conjugated antibodies in the dark by wrapping vials in foil to prevent photobleaching [10].
- Use Fresh Aliquots: For the best results, use fresh primary and secondary antibodies for each experiment rather than reusing them across multiple assays [10].
What are the best practices for handling samples to ensure reagent compatibility? Sample integrity directly impacts reagent performance and signal detection:
- Aliquot and Store Properly: Divide samples into smaller aliquots and store them at ≤ -70°C to prevent degradation and avoid repeated freeze-thaw cycles [27] [29].
- Thaw Correctly: Thaw samples completely at 4°C or room temperature before use, then mix thoroughly without creating foam [27].
- Clarify Samples: Centrifuge thawed samples at 10,000 rpm for 5 minutes at 4°C to remove debris that could interfere with the assay [27].
Troubleshooting Guide: Weak Signal Related to Reagent Handling
A weak or absent signal in ELISA can often be traced back to issues with reagent handling, storage, or stability. The following table outlines common problems and their solutions.
| Problem | Possible Cause Related to Reagents | Recommended Solution |
|---|---|---|
| No Signal | Expired reagents or improperly prepared reagents [11] [8] | Check expiration dates before use. Repeat assay with new buffers and standards [11] [8]. |
| Missing or incorrect addition of detection antibody/enzyme conjugate [11] | Verify labels and liquid levels at each step. Prepare and add according to the manual [11]. | |
| Contamination of detection antibodies, enzyme conjugates, or buffers [11] [10] | Prepare fresh dilutions and use sterile buffers [11] [10]. | |
| Buffer incompatibility (e.g., sodium azide inhibits HRP) [10] | Check buffer components and replace with compatible buffers [10]. | |
| Low/Weak Signal | Reagents lost activity due to improper storage or excessive freeze-thaw cycles [10] | Check storage instructions on the datasheet. Aliquot reagents to avoid repeated freezing/thawing [27] [10]. |
| Low incubation temperature or short incubation time [11] | Follow protocol instructions for incubation. Ensure all reagents and plates are at room temperature before starting [11] [8]. | |
| Inaccurate pipette or incorrect sample addition [11] | Use calibrated pipettes and ensure sufficient dissolution of reagents [11]. | |
| Poor Standard Curve | Improper reconstitution of the standard [29] | Gently swirl and allow 30 minutes for complete dissolution after reconstitution [29]. |
| Standard has degraded due to improper handling [8] | Check handling directions. Use a new vial and ensure proper aliquoting and storage [27] [8]. | |
| Improper calculation of standard curve dilutions [8] | Check calculations and prepare a fresh standard curve [8]. | |
| High Background | Contaminated buffers [10] [8] | Make fresh, sterile buffers [10] [8]. |
| Reusing plate sealers or reagent reservoirs, leading to residual HRP [8] | Use a fresh plate sealer and reagent reservoir for each assay step [8]. | |
| Poor Replicate Data | Buffers are contaminated [8] | Make fresh buffers [8]. |
| Reagents were not homogeneous before use [15] | Mix reagents well and ensure they are fully dissolved and at room temperature [29] [15]. |
Experimental Protocols: Key Methodologies
Protocol for Validating an Unvalidated Sample Type
Before using a sample type not listed in the kit's insert (e.g., tissue homogenates), a spike and recovery experiment must be performed to check for matrix interference [28].
- Divide Sample: Split a sample into two aliquots.
- Spike: Add a known amount of the kit standard into one aliquot.
- Dilution Series: Perform a dilution series comparing the spiked versus the unspiked sample.
- Calculate Recovery: Determine the percentage of the spiked analyte that is recovered. Recovery between 80-120% is generally considered acceptable, though each laboratory should determine its own acceptable range [28].
Protocol for Proper Sample Dilution Preparation
Using a dilution plate improves consistency and reduces errors [29].
- Preparation: Prepare all standard and sample dilutions in a separate 96-well deep-well polypropylene plate or microtiter tubes.
- Layout: Place sample dilutions in adjacent columns to facilitate the use of a multichannel pipette (e.g., initial 1:5 dilution in columns 2 and 4, and a subsequent 1:20 dilution in columns 3 and 5).
- Transfer: Use a multichannel pipette to rapidly transfer prepared dilutions from the dilution plate to the assay plate, minimizing variation in incubation time across the plate [29].
Research Reagent Solutions: Essential Materials
The following table lists key reagents and materials critical for optimal handling and stability in ELISA workflows.
| Item | Function & Importance in Reagent Handling |
|---|---|
| Calibrated Pipettes | Ensures accurate and precise dispensing of reagents and samples, which is vital for reproducibility and avoiding weak signals [27] [29]. |
| Aliquoting Tubes | Allows division of reagents and samples into single-use volumes to avoid repeated freeze-thaw cycles and maintain stability [27]. |
| ELISA Plate (High-Binding) | Specially treated polystyrene plates for passive antibody binding. Tissue culture plates should not be used as they will not bind capture antibody effectively [10] [8]. |
| Desiccant Packs | Used when storing unused ELISA strips to protect them from moisture, which can degrade the coated antibody [27]. |
| Protein-Stabilized Diluents | Specialized diluents reduce non-specific binding and matrix interference, protecting the integrity of antibodies and the analyte [15]. |
| Reagent Reservoirs | Allows for the efficient and consistent distribution of reagents using a multichannel pipette, improving inter-well consistency [29]. |
Workflow Diagram: Reagent Handling and Stability Management
The diagram below outlines the critical decision points for managing reagent handling to prevent weak signals.
Mastering the Coating and Blocking Process
Troubleshooting Guides
Troubleshooting Guide: Weak Signal
A weak or absent signal is a common issue that often originates from inadequacies in the initial coating and blocking steps. The table below outlines specific problems and solutions related to this part of the ELISA process.
| Problem & Possible Source | Recommended Test or Action |
|---|---|
| Capture antibody didn't bind to plate [7] | Use a dedicated, high-binding ELISA plate (not a tissue culture plate). Dilute the coating antibody in PBS without carrier proteins [8] [7]. |
| Inefficient blocking [10] | Ensure the blocking buffer is fresh and uncontaminated. Confirm that the blocker is compatible with your detection system (e.g., avoid HRP with sodium azide) [10]. |
| Poor adsorption of target or antibody [10] | Pre-treat plate wells or use plates with 'enhanced binding'. For small molecules like peptides, conjugate to a large carrier protein before coating [10]. |
| Insufficient coating concentration/time [7] | Titrate the concentration of your capture antibody to find the optimal level. Ensure the coating incubation is performed for the recommended duration [7]. |
| Improper reagent handling [7] | Bring all reagents, including the plate, to room temperature before starting the assay. Avoid using expired reagents [7]. |
Troubleshooting Guide: High Background
High background signal can obscure your results and is frequently caused by inadequate blocking or washing following the coating step.
| Problem & Possible Source | Recommended Test or Action |
|---|---|
| Insufficient blocking [30] | Increase the concentration of your blocker or the blocking incubation time. Test different blocking agents (e.g., BSA, casein, non-fat dry milk) to find the most effective one for your assay [30]. |
| Non-specific binding (NSB) [30] | Select a microplate with appropriate binding capacity (e.g., high-binding vs. medium-binding). Validate antibodies to ensure they are not binding non-specifically to other assay components [30]. |
| Insufficient washing [8] | Follow a rigorous washing procedure after the blocking and coating steps. Add a 30-second soak step between washes to better dislodge unbound material [8]. |
| Contaminated buffers [8] | Prepare fresh, sterile washing and coating buffers. Bacterial contamination can cause high background [8] [10]. |
Frequently Asked Questions
Q1: What is the most critical factor for a successful coating process?
The most critical factor is ensuring the capture antibody properly adsorbs to the plate. This requires using a dedicated, high-binding ELISA plate and diluting the antibody in an appropriate buffer, typically PBS, without additional proteins that would compete for binding sites [8] [7]. Inadequate binding at this stage will compromise the entire assay.
Q2: Why is blocking necessary after coating?
Blocking is essential to cover any remaining protein-binding sites on the plastic surface of the microplate after coating [30]. If these sites are not blocked, other proteins and antibodies added in subsequent steps will bind non-specifically, leading to high background noise and false-positive signals [31] [32].
Q3: My standard curve is good, but my sample signals are weak. Could coating be the issue?
While other factors are possible, a sample-specific issue related to coating is unlikely if your standard curve is normal. This problem is more frequently caused by the sample matrix itself, which may mask detection [8]. To investigate, try diluting your samples or performing a spike-and-recovery experiment to see if the target analyte can be detected in the sample matrix.
Q4: How can I tell if my high background is due to poor blocking?
You can investigate this using a Non-Specific Binding (NSB) control. This control involves running wells through the assay where blocking or wash buffer is added in place of specific reagents, but the labeled detection antibody is still added [31] [32]. A high signal in the NSB wells indicates that the labeled antibody is binding non-specifically, often due to ineffective blocking.
Experimental Protocols
Protocol 1: Optimizing Coating Antibody Concentration
Principle: Identifying the optimal concentration of your capture antibody is crucial for maximizing assay sensitivity and signal-to-noise ratio. Using too little antibody results in weak signal, while too much can lead to high background or antibody stacking that impedes antigen binding.
Materials:
- ELISA Plate (High-Binding)
- Capture Antibody
- Coating Buffer (e.g., PBS, 0.05 M Carbonate-Bicarbonate)
- Blocking Buffer (e.g., 1% BSA in PBS)
Methodology:
- Prepare a series of dilutions of your capture antibody in coating buffer (e.g., 0.5, 1, 2, 4, 8 µg/mL).
- Add 100 µL of each dilution to separate wells of the ELISA plate. Include a well with coating buffer only as a blank.
- Seal the plate and incubate overnight at 4°C or for 1-2 hours at 37°C.
- Discard the coating solution and wash the plate three times with wash buffer.
- Block the plate with 200 µL of blocking buffer per well for 1-2 hours at room temperature.
- Wash three times.
- Proceed with your standard ELISA protocol from the sample addition step onward, using a positive control sample if available.
- The optimal coating concentration is the lowest one that yields a strong signal for your positive control with a low background.
Protocol 2: Evaluating Blocking Buffer Efficacy
Principle: Different blocking agents have varying efficacies depending on the specific antibodies and samples used. This protocol systematically compares common blockers to minimize non-specific binding.
Materials:
- Coated ELISA Plate
- Various Blocking Agents (e.g., BSA, Casein, Non-Fat Dry Milk, Fish Gelatin)
- Target Antigen
- Detection Antibodies
- Substrate
Methodology:
- Coat an entire ELISA plate with your capture antibody at the optimized concentration and incubate.
- Wash the plate.
- Divide the plate into sections. Block each section with a different blocking buffer (e.g., 1% BSA, 3% BSA, 5% Non-Fat Dry Milk, 1% Casein, 1% Fish Gelatin).
- Incubate for 1-2 hours at room temperature.
- Wash the plate.
- On each section, run a standard curve and a blank (zero concentration) control.
- Compare the background of the zero control and the signal-to-noise ratio of the standard curve across the different blockers. The best blocker provides the lowest background without diminishing the specific signal [30].
Workflow Visualization
The Scientist's Toolkit
Research Reagent Solutions
| Item | Function in Coating/Blocking |
|---|---|
| High-Binding ELISA Plates [30] | Polystyrene plates engineered with high surface energy to maximize adsorption of capture antibodies. |
| PBS (Phosphate Buffered Saline) [8] [7] | Standard ionic buffer for diluting the capture antibody for coating, providing optimal pH and conditions for adsorption. |
| BSA (Bovine Serum Albumin) [30] | A very common and effective blocking agent that saturates unused binding sites on the plate surface. |
| Casein [30] | A protein-based blocker known for providing low background in many ELISA applications. |
| Non-Fat Dry Milk [30] | A cost-effective blocking agent; however, it can contain biotin and immunoglobulins which may cause interference in some assays. |
| Tween-20 [30] | A detergent added to wash buffers to help reduce non-specific hydrophobic interactions during washing steps. |
FAQs on ELISA Washing
What is the fundamental purpose of the washing steps in an ELISA? Washing is a critical process in ELISA that occurs between each major assay step (e.g., after coating, blocking, and incubation with detection antibodies). Its primary function is to remove unbound reagents, such as free antibodies, antigens, or enzyme conjugates, from the microplate wells. This separation is crucial for minimizing background noise and non-specific binding, which directly enhances the assay's specificity and signal-to-noise ratio. Effective washing ensures that the measured signal is generated only by the specific target complexes formed during the assay [17] [33].
How can improper washing lead to a weak or absent signal? Excessive or overly aggressive washing is a common cause of weak or absent ELISA signals. Over-washing can physically dislodge or dilute the specific antigen-antibody complexes that are bound to the plate, effectively reducing the amount of material available for detection. If these specific complexes are washed away, the final enzymatic reaction has less substrate to act upon, resulting in a weak or no signal [10]. This directly undermines the goal of preserving the complexes you intend to measure.
How can improper washing cause a high background signal? Insufficient washing is a primary culprit behind high background signals. When washing is not thorough enough, unbound detection antibodies or enzyme conjugates remain in the well. During the final substrate addition step, these residual enzymes will catalyze a colorimetric or chemiluminescent reaction indiscriminately, generating a false signal that obscures the specific signal from the target biomarker. This high background reduces the assay's sensitivity and can lead to inaccurate quantification [11] [15].
What are "edge effects" and how are they related to washing? Edge effects refer to observable inconsistencies in signal between wells located at the periphery of a microplate and those in the center. These variations can be caused by uneven temperature distribution across the plate during incubation steps, which affects binding kinetics. While not caused by washing itself, this uneven binding can make the results more susceptible to variation during the washing process. Using a uniform, stable incubation surface and ensuring the plate sealer is properly applied can help mitigate edge effects [15].
Troubleshooting Guide: Washing-Related Issues
Weak or No Signal
- Problem: The expected signal is low or absent, making quantification difficult or impossible.
- Potential Washing Cause: Over-washing or overly aggressive washing, leading to the detachment of specific antigen-antibody complexes [10].
- Solutions:
- Reduce Wash Steps: Decrease the number of washing cycles for one or more steps and re-evaluate the signal.
- Gentle Technique: If washing manually with a pipette, ensure gentle aspiration and dispensing to avoid disturbing the bound layer. Automated plate washers should be set to a gentler pressure setting [10].
- Optimize Buffer: Ensure the wash buffer is fresh and free of contaminants that could promote dissociation [11].
High Background Signal
- Problem: A high level of uniform signal is detected across many wells, including blanks or negative controls.
- Potential Washing Cause: Incomplete removal of unbound detection antibodies or enzyme conjugates due to insufficient washing [11] [15].
- Solutions:
- Increase Wash Steps: Add one or more additional wash cycles after critical steps like the incubation with detection antibody.
- Ensure Thorough Washing: Confirm that each well is filled completely during each wash cycle. After washing, firmly tap the plate upside down on absorbent paper to remove all residual fluid [15].
- Check Wash Buffer: Use a fresh batch of washing solution to ensure efficacy and avoid bacterial contamination [11].
High Variation Between Replicates
- Problem: Poor reproducibility and high coefficient of variation (CV) between technical replicates.
- Potential Washing Cause: Inconsistent washing across the plate, where some wells are washed more thoroughly than others.
- Solutions:
- Standardize Technique: For manual washing, use a consistent, multi-channel pipette technique. For automated washers, ensure nozzles are not clogged and that each well receives the same volume and pressure.
- Verify Equipment: Calibrate pipettes and automated plate washers regularly.
The following workflow diagram outlines the decision-making process for diagnosing and resolving common washing-related issues in ELISA.
Experimental Protocol: Optimizing Washing Conditions
This protocol provides a systematic method to determine the optimal number of wash cycles for a specific ELISA, balancing signal preservation with background reduction.
Objective: To empirically determine the ideal number of wash cycles that minimizes background noise without compromising the specific signal.
Materials:
- Validated ELISA kit or components (capture antibody, detection antibody, antigen standard)
- Coated and blocked microplate
- Wash buffer (e.g., PBS with 0.05% Tween-20)
- Plate washer or manual washing equipment
- Substrate and stop solution
- Microplate reader
Methodology:
- Setup: Run the ELISA according to the established protocol until the final wash step after detection antibody incubation.
- Variable Application: Divide the plate into sections. For the same set of standards and controls, apply a different number of wash cycles to each section (e.g., 3, 5, 7, and 9 cycles). Keep all other parameters (incubation times, temperatures, volumes) constant.
- Completion: Complete the assay by adding substrate, stopping the reaction, and reading the plate.
- Data Analysis: Plot the standard curve and calculate the signal-to-noise ratio (SNR) for each washing condition. The SNR can be calculated as (Mean Signal of Low Standard) / (Mean Signal of Blank).
Expected Outcome and Interpretation: The goal is to identify the "sweet spot" where the signal-to-noise ratio is maximized. Typically, as wash cycles increase from a low number, the background will drop significantly with only a minor loss in specific signal, leading to an improved SNR. Beyond a certain point, further washing will begin to erode the specific signal more than it reduces background, causing the SNR to drop. The optimal number of cycles is at the peak of the SNR curve.
The table below summarizes the quantitative data you might obtain from such an optimization experiment.
Table 1: Sample Data from Washing Cycle Optimization Experiment
| Number of Wash Cycles | Mean Signal (Low Std) | Mean Background (Blank) | Signal-to-Noise Ratio |
|---|---|---|---|
| 3 | 0.750 | 0.250 | 3.00 |
| 5 | 0.720 | 0.105 | 6.86 |
| 7 | 0.685 | 0.085 | 8.06 |
| 9 | 0.510 | 0.075 | 6.80 |
Note: In this sample dataset, 7 wash cycles yield the highest Signal-to-Noise Ratio, indicating the optimal condition.
Research Reagent Solutions for Washing Optimization
The following table lists key reagents and materials essential for achieving precise and reproducible washing in ELISA protocols.
Table 2: Key Reagents for ELISA Washing and Stabilization
| Item | Function in Washing & Assay Performance |
|---|---|
| Wash Buffer (PBS with Tween-20) | The ionic strength of PBS helps to disrupt non-specific ionic interactions, while the mild detergent Tween-20 helps to solubilize and wash away unbound proteins and hydrophobic contaminants [2] [33]. |
| Protein Stabilizers & Blockers | Used in the blocking step before washing cycles, these agents (e.g., BSA, casein) coat any remaining hydrophobic sites on the plate, preventing non-specific adsorption of detection reagents during subsequent steps, which reduces background and the burden on washing [17] [15]. |
| Sample / Assay Diluents | Specialized diluents can help reduce matrix interference and non-specific binding from complex biological samples, making unbound material easier to remove during washing and thus lowering false positives and background [15]. |
| Polystyrene Microplates | Plates with a high protein-binding capacity and low well-to-well variation (<5% CV) ensure uniform coating and complex formation, providing a stable foundation that is less susceptible to disruption during washing [34]. |
| Automated Plate Washer | Provides superior consistency and reproducibility compared to manual washing by applying controlled, uniform pressure and volume to every well, which is critical for minimizing variation between replicates [15]. |
FAQs: Addressing Common Incubation Issues
1. My ELISA produced a weak signal. Could the incubation temperature be the cause?
Yes, a low incubation temperature is a common cause of weak or no signal. Antibody-binding reactions are temperature-sensitive, and a temperature below the recommended range can significantly slow down this process, leading to insufficient binding of the detection antibody or enzyme conjugate [11] [10]. To resolve this, ensure all reagents and the assay plate are equilibrated to room temperature (typically 18-25°C) for 15-20 minutes before starting the procedure, unless the protocol specifies an alternative temperature like 37°C [7] [35].
2. I followed the recommended incubation time but still have a high background. What went wrong?
Excessively long incubation times can be a direct cause of high background [7] [35]. Prolonged incubation, especially with the detection antibody or enzyme conjugate, can increase non-specific binding, where these reagents attach to the plate in a non-targeted manner. Adhere strictly to the recommended incubation times. If high background persists, you can systematically test and optimize (shorten) the incubation time for the detection antibody step while ensuring washing steps are sufficient [36] [8].
3. Why are my results inconsistent from one experiment to the next, even though I use the same protocol?
Variations in incubation temperature and time are primary sources of poor assay-to-assay reproducibility [7] [8]. Fluctuations in laboratory temperature or inconsistent timing during reagent incubation can lead to different binding efficiencies between runs. To ensure consistency, perform incubations in a temperature-controlled environment, use a timer for all steps, and avoid stacking plates during incubation, as this can create uneven temperature distribution across the plate [35] [15].
Troubleshooting Guide: Time and Temperature Effects
| Problem | Possible Cause | Recommended Solution |
|---|---|---|
| Weak or No Signal | Reagents not at room temperature at start of assay [7] | Allow all reagents to equilibrate on the bench for 15-20 minutes before use [7]. |
| Incubation temperature too low [10] [35] | Ensure all steps are carried out at the protocol's specified temperature (e.g., room temperature or 37°C) [11] [10]. | |
| Incubation time too short [35] | Increase the incubation time for key steps like the primary antibody incubation; for optimization, this can be extended to overnight at 4°C [36]. | |
| High Background | Incubation temperature too high [35] | Incubate at the recommended temperature; antibody binding activity is optimal within a specific range. |
| Incubation times longer than recommended [7] [35] | Strictly follow the recommended incubation times for all steps, particularly for the detection antibody and enzyme conjugate [7]. | |
| Poor Replicate Data & Edge Effects | Uneven incubation temperature across the plate [7] [15] | Avoid stacking plates and incubate in a stable, uniform environment. Use a plate sealer to prevent evaporation [7] [15]. |
| Inconsistent Assay-to-Assay Results | Variations in incubation temperature and/or time between experiments [7] [8] | Adhere to the same incubation temperature and periods for every run. Avoid areas where environmental conditions fluctuate [7] [36]. |
Optimization Protocols and Data Analysis
Checkerboard Assay for Systematic Optimization
Where an ELISA is developed from scratch or a kit requires fine-tuning, a checkerboard assay is a powerful method to optimize multiple variables simultaneously, including incubation time and temperature [37].
Methodology:
- Plate Setup: Titrate the coating (or primary) antibody concentration across the rows of a 96-well microplate.
- Variable Testing: Titrate the detection antibody concentration down the columns of the same plate.
- Parallel Testing: Set up multiple plates to compare different blocking solutions, washing solutions, and critically, different incubation times and temperatures.
- Analysis: Measure the signal and background for each condition. The optimal conditions are those that yield the maximal assay window (the difference between the full signal and background) [37].
Factors that require optimization via this method include:
- Coating antibody concentration and its incubation time/temperature
- Choice and concentration of blocking solution and its incubation time
- Detection antibody concentration and its incubation time/temperature
- Substrate incubation time/temperature [37]
Validating Optimal Conditions
Once potential optimal conditions are identified, perform the following validation experiments to ensure the assay's robustness:
- Spike and Recovery: Add a known amount of the analyte to your sample matrix. A recovery rate close to 100% indicates that the sample matrix does not interfere with the detection under your chosen conditions [37].
- Dilutional Linearity: Serially dilute a sample with a high analyte concentration. The measured concentrations should show a linear relationship with the dilution factor, confirming the assay is performing correctly within its dynamic range [37].
- Parallelism: Serially dilute samples with naturally high analyte levels. A low coefficient of variation (%CV) between the calculated concentrations of different dilutions indicates that the antibody binding affinity is consistent and matrix effects are minimized [37].
Research Reagent Solutions
| Item | Function in Optimization |
|---|---|
| ELISA Microplate | Plates with high and consistent binding capacity are essential for reliable protein adsorption. Avoid using tissue culture plates [7] [36]. |
| Protein Stabilizers & Blockers | High-quality blockers (e.g., BSA, Casein) reduce non-specific binding, which is crucial for minimizing background when optimizing incubation times [15]. |
| Sample / Assay Diluents | Specialized diluents help reduce matrix interference (e.g., from serum), improving signal-to-noise ratio and accuracy under various incubation conditions [15]. |
| TMB Substrate & Stop Solution | A stable, sensitive TMB substrate is vital. A reliable stop solution (e.g., acid) halts the enzyme reaction at the optimized time for consistent reading [35] [15]. |
| Plate Sealer | Prevents evaporation during incubations, which is critical for maintaining consistent reagent concentration and avoiding edge effects, especially at higher temperatures [7] [35]. |
Workflow Diagram
ELISA Incubation Optimization Workflow
Systematic ELISA Troubleshooting: Diagnosing and Fixing Weak Signals
Visual Troubleshooting Guide for ELISA Weak/No Signal
The following flowchart provides a systematic pathway to diagnose and resolve the common issue of weak or no signal in your ELISA experiments.
Detailed Troubleshooting Questions and Answers
Could my reagent preparation or handling be causing a weak signal?
Answer: Yes, improper reagent handling is a primary cause of weak or absent signals.
- Temperature Equilibration: All reagents must be at room temperature before starting the assay. Running the ELISA with cold reagents can hinder specific binding interactions. Allow reagents to sit on the bench for 15-20 minutes to equilibrate [7] [38].
- Storage and Expiry: Confirm that all reagents have been stored at 2-8°C as per the kit label and are not past their expiration date. Expired or improperly stored reagents lose activity [7].
- Preparation and Order of Addition: Check the protocol to ensure reagents were prepared to the correct dilution and added in the proper order. An incorrect sequence can prevent key reactions from occurring [7] [8].
- Contamination: Buffers or detection antibodies contaminated with bacteria or other agents can compromise the assay. Always use fresh, sterile buffers [10].
Are my incubation and washing steps sufficient?
Answer: Suboptimal incubation and washing are common sources of signal failure.
- Incubation Time and Temperature: Low incubation temperatures or shorter-than-recommended incubation times can drastically reduce antibody-antigen binding. Strictly follow the protocol's specified times and temperatures [11] [7]. For in-house developed ELISAs, increasing the primary antibody incubation time to 4°C overnight can improve signal [36].
- Insufficient Washing: While over-washing can sometimes remove signal, insufficient washing leaves unbound enzyme conjugate in the well, which can cause high background and mask a specific signal. Ensure thorough washing by inverting the plate onto absorbent tissue after each wash step and tapping forcefully to remove residual fluid [7] [38].
- Over-Washing: Excessively aggressive or prolonged washing can, in some cases, strip away specifically bound reagents. If you suspect this, reduce the duration and/or number of washes and ensure gentle pressure if washing by pipette [10].
Is the detection system the source of the problem?
Answer: The components responsible for generating the measurable signal are often the culprit.
- Antibody Compatibility (Sandwich ELISA): For a sandwich ELISA, ensure the capture and detection antibodies recognize distinct, non-overlapping epitopes on the target antigen. If they compete for the same site, no signal will form [36].
- Antibody Compatibility (Secondary Antibody): Ensure the secondary antibody was raised against the species of the primary antibody (e.g., use an anti-mouse secondary for a mouse primary antibody) [10] [36].
- Insufficient Detection Reagent: The concentration of the detection antibody or enzyme conjugate may be too low. For developed assays, titrate the antibody to find the optimal concentration. Manufactured kits have pre-optimized concentrations, so verify you are following the dilution instructions exactly [7] [36].
- Enzyme Inhibition: Sodium azide, a common preservative in antibody stocks, is an inhibitor of Horseradish Peroxidase (HRP). Ensure all azide is washed away or use azide-free buffers in steps involving HRP [36].
Could my equipment or plates be at fault?
Answer: The physical tools used in the assay can directly impact results.
- Pipette Calibration: Inaccurate pipettes lead to incorrect reagent volumes and poor data reproducibility. Check pipette calibration regularly and use proper pipetting technique to avoid air bubbles [38].
- Microplate Scratches: Pipette or automated washer tips can scratch the wells of pre-coated plates, damaging the immobilized capture antibody and preventing binding. Use caution when dispensing and aspirating, and ensure automated washers are correctly calibrated [7] [38].
- Incorrect Plate Type: Using a tissue culture plate instead of a binding-optimized ELISA plate will result in poor adsorption of the capture antibody or antigen [7] [8] [36].
- Plate Reader Wavelength: Ensure the microplate reader is set to the correct wavelength/filter for the substrate being used (e.g., 450 nm for TMB with acid stop) [7].
Research Reagent Solutions for Enhanced ELISA Performance
The following table details key reagents that can be optimized to prevent weak signals and improve overall assay quality.
| Reagent / Material | Function in ELISA | Troubleshooting Application for Weak Signal |
|---|---|---|
| Protein Blockers (e.g., BSA, Casein) | Passive adsorption to all unused binding sites on the microplate well to prevent non-specific antibody binding [36]. | High background noise can mask a weak specific signal. Optimizing the concentration or type of blocker can reduce background and improve the signal-to-noise ratio [38]. |
| Matched Antibody Pairs | A pre-optimized set of capture and detection antibodies that bind to distinct epitopes of the same target antigen [36]. | Prevents the common pitfall in sandwich ELISA where the detection antibody cannot bind because the epitope is blocked by the capture antibody, which is a frequent cause of no signal [36]. |
| HRP-Compatible Buffers | Buffers used for diluting samples and reagents during the detection phase. | Sodium azide inhibits HRP. Using azide-free buffers for HRP-conjugated antibodies is critical to prevent loss of enzyme activity and signal [36]. |
| Enhanced Binding Plates | Microplates specially treated to increase the protein-binding capacity of the well surface. | If the capture antibody or antigen adsorbs poorly to a standard plate, switching to an "enhanced binding" plate can increase the amount of immobilized protein, thereby amplifying the signal [10]. |
| Sensitive Substrates (e.g., TMB, Chemiluminescent) | The chromogenic or chemiluminescent solution that reacts with the enzyme to produce a measurable signal. | If the target concentration is very low, switching to a more sensitive detection system (e.g., from colorimetric to chemiluminescent) can generate a stronger, detectable signal [10] [15]. |
FAQs: Addressing Common Reagent-Related Problems
FAQ 1: My ELISA produced a weak or no signal, even for the positive control. Could my reagents be expired?
Yes, using expired reagents is a primary cause of weak or absent signals. Enzymes (like HRP) in conjugated antibodies or substrate solutions degrade over time, losing their activity. This directly reduces the assay's detection capability [11] [7] [39]. Always check the expiration dates on all kit components, including antibodies, standards, and substrates, before starting your experiment. Do not use reagents that are past their expiration date [7].
FAQ 2: I confirmed my reagents are not expired, but the signal is still low. What else should I check?
Improper storage of reagents can render them inactive before the expiration date [7]. Double-check that you are storing all components according to the manufacturer's instructions; most kits require storage at 2–8°C [7]. Furthermore, ensure all reagents were allowed to equilibrate to room temperature (for 15-20 minutes) before use, as using cold reagents can lead to low signal [7] [39]. Also, verify that buffers do not contain sodium azide if you are using an HRP-based detection system, as azide is an inhibitor of HRP [10] [36].
FAQ 3: How can incorrectly prepared reagents affect my ELISA results?
Incorrect preparation is a major source of error. This includes:
- Incorrect Dilutions: Improperly diluted standards, antibodies, or samples will yield inaccurate results, leading to a poor standard curve or weak signal [7] [36].
- Incorrect Reconstitution: Lyophilized standards or antibodies must be reconstituted with the precise volume and type of diluent specified in the protocol [39].
- Contaminated Reagents: Bacterial contamination in buffers or reagents can interfere with the assay [10] [39].
- Mixed Kit Components: Never mix reagents from different kit batches or manufacturers, as they are not validated to work together [11] [39].
FAQ 4: My positive controls are working, but my samples show no signal. Is this a reagent issue?
Not necessarily. While it could be related to the sample matrix interfering with detection [10], the problem may lie with the sample itself. The target protein may not be expressed in your samples, or may be present at a concentration below the detection limit of the assay [39]. You can spike a sample with a known concentration of the antigen to check for matrix interference [36].
Troubleshooting Guide: Reagent-Related Issues and Solutions
The table below summarizes common reagent-related problems, their causes, and recommended solutions.
| Problem | Possible Reagent-Related Cause | Recommended Solution |
|---|---|---|
| Weak or No Signal [11] [7] [39] | Expired reagents (especially enzyme conjugates or substrate). | Confirm expiration dates; use fresh reagents. |
| Incorrect storage of components (e.g., not at 2-8°C). | Double-check and adhere to storage conditions on the kit label. | |
| Reagents not brought to room temperature before use. | Allow all reagents to sit on the bench for 15-20 minutes prior to the assay. | |
| Buffer contains sodium azide (incompatible with HRP). | Use azide-free buffers or ensure sufficient washing to remove azide [10] [36]. | |
| Incompatible antibody pairs (in sandwich ELISA). | Verify that the capture and detection antibodies recognize distinct epitopes [36]. | |
| High Background [39] [36] | Contaminated substrate or buffer solutions. | Prepare fresh, sterile buffers and substrate solution. |
| Concentration of detection antibody or enzyme conjugate is too high. | Check and optimize the dilution of the conjugate. | |
| Substrate exposed to light prior to use. | Store substrate in the dark and limit light exposure during the assay. | |
| Poor Standard Curve [7] [39] | Incorrect serial dilution of the standard. | Check pipetting technique and double-check dilution calculations. |
| Standard has degraded from improper storage or too many freeze-thaws. | Use a fresh vial of standard; avoid multiple freeze-thaw cycles. | |
| Standard stock solution was improperly reconstituted. | Dilute the lyophilized standard exactly as the protocol suggests [39]. | |
| High Variation Between Replicates [39] [36] | Reagents or samples were not mixed thoroughly before addition. | Vortex or pipette-mix all solutions to ensure homogeneity. |
| Contaminated buffer or pipette tips leading to cross-contamination. | Prepare fresh buffers and use fresh pipette tips for each reagent and sample. | |
| Incorrect pipetting due to uncalibrated pipettes. | Check pipette calibration and ensure tips are properly sealed. |
Experimental Protocol: Verification of Reagent Integrity and Preparation
This protocol provides a systematic methodology to troubleshoot and verify if weak ELISA signals are caused by reagent issues.
Objective: To systematically eliminate reagent-related factors as the cause of a weak or absent signal in an ELISA.
Materials:
- ELISA kit (with fresh reagents and a new vial of standard if possible)
- Calibrated pipettes and sterile tips
- Timer
- Room temperature water bath (if specified in protocol)
Workflow:
Methodology:
- Visual Inspection: Examine all reagents for precipitation, discoloration, or unusual appearance. Contaminated or degraded reagents should be discarded [39].
- Confirm Expiry Dates: Check every vial and bottle in the kit. Do not use any component that is past its expiration date [7].
- Verify Storage Conditions: Confirm that the kit has been stored at 2–8°C consistently, without exposure to freeze-thaw cycles unless specified [7].
- Room Temperature Equilibration: Ensure all reagents, including the microplate, are at room temperature (18–25°C) before starting the assay. This typically takes 15-20 minutes on the bench [7] [39].
- Re-prepare Critical Reagents:
- Standard: If possible, reconstitute a new vial of the lyophilized standard. Centrifuge the vial first to ensure the powder is at the bottom. Use the recommended diluent and volume precisely [39] [36].
- Substrate: Prepare the substrate solution immediately before use, following the manufacturer's instructions. Ensure the stock solutions are in date and have been stored correctly [39].
- Re-run Assay: Using the verified and freshly prepared reagents, repeat the ELISA, meticulously following the protocol for order of addition and incubation times.
Research Reagent Solutions
This table lists essential materials and reagents critical for preventing and resolving reagent-related issues in ELISA.
| Item | Function in Troubleshooting | Key Consideration |
|---|---|---|
| ELISA Kit Components | Provides optimized and validated matched reagents. | Use components only from the same kit and batch; do not mix lots [11]. |
| Protein Stabilizers | Increases shelf-life and stabilizes dried capture protein [40] [15]. | Critical for assay longevity and lot-to-lot consistency. |
| Sample/Assay Diluents | Reduces matrix interferences and non-specific binding [40] [15]. | Using the correct diluent is vital to prevent false positives/negatives. |
| Blocking Buffers | Blocks unused binding sites on the plate to reduce background [36]. | Standard blockers (e.g., BSA) may be insufficient; specialized buffers can be more effective [41]. |
| TMB Substrate | Chromogenic solution for HRP-mediated color development. | Must be clear and colorless before use; prepare fresh [39] [15]. |
| Stop Solution | Acidic solution to halt the enzymatic reaction. | Ensures color reaction is stabilized for accurate reading [39]. |
This guide addresses the critical procedural errors—incubation, washing, and contamination—that are frequent sources of weak signals in ELISA, providing targeted troubleshooting for researchers and drug development professionals.
Frequently Asked Questions (FAQs)
Q1: My ELISA has a weak or absent signal, even though I am sure the target analyte is present. Could my incubation steps be the cause? Yes, improper incubation is a common cause of weak signals. If reagents are not given enough time to bind, or are used at the wrong temperature, the assay sensitivity will be severely reduced. Ensure all reagents are warmed to room temperature (15-20 minutes) before starting the assay and adhere strictly to the recommended incubation times and temperatures in the protocol [7] [10].
Q2: I am getting high background noise. Is this a washing issue? Insufficient washing is a primary cause of high background [7] [8]. It can leave unbound enzymes, like Horseradish Peroxidase (HRP), in the wells, which continue to react with the substrate and generate signal non-specifically. Ensure you are following the correct washing procedure, including a sufficient number of washes and thoroughly draining the plate after each wash by tapping it forcefully on absorbent tissue [7] [40].
Q3: My replicates are inconsistent. What are the most likely procedural errors? Poor replicates are often traced to pipetting inaccuracies, insufficient washing, or contamination from reused materials [7] [8]. Always use fresh plate sealers for each incubation step to prevent cross-contamination between wells and ensure your pipetting technique is precise and calibrated [42].
Q4: How can contamination from reagents lead to a weak signal? Contamination can inhibit the assay. For example, sodium azide, a common preservative, is a potent inhibitor of HRP [10]. If present in buffers used with HRP-conjugated antibodies, it can quench the signal. Always ensure your buffers are compatible, fresh, and not contaminated with bacteria or residual HRP from previous experiments [8] [10].
Troubleshooting Guide: Incubation, Washing, and Contamination Errors
The table below outlines common procedural errors, their impact on your ELISA results, and the recommended solutions.
| Problem Category | Specific Error | Impact on Assay | Recommended Solution |
|---|---|---|---|
| Incubation Errors | Reagents not at room temperature at start of assay [7] | Weak or no signal | Allow all reagents to equilibrate on the bench for 15–20 minutes before use [7]. |
| Incubation times too short or too long [6] | Weak signal (short) or excessive signal/high background (long) | Strictly follow recommended incubation times. Use a timer and avoid deviations [7]. | |
| Inconsistent or incorrect incubation temperature [7] [8] | Poor assay-to-assay reproducibility, edge effects | Use a calibrated incubator. Avoid areas with temperature fluctuations and do not stack plates [7] [8]. | |
| Washing Errors | Insufficient number or volume of washes [7] [43] | High background, too much signal, poor replicates | Follow protocol for wash number/volume. Use an automated plate washer for consistency [43]. |
| Incomplete aspiration of wash buffer [7] [44] | High background, poor standard curve | After washing, invert plate onto absorbent tissue and tap firmly to remove residual fluid [7]. | |
| Overly aggressive washing [10] | Weak signal (bound reagents are removed) | If signal is weak, reduce wash duration and/or use gentler pressure during manual washing [10]. | |
| Washing with contaminated buffers [10] | High background, inconsistent results | Always prepare fresh, sterile wash buffers for each experiment [10]. | |
| Contamination Errors | Reusing plate sealers or reagent reservoirs [7] [8] | High background, too much signal, poor replicates | Use a fresh, clean plate sealer each time the plate is covered. Use fresh reservoirs for reagents [7] [8]. |
| Buffer contamination with sodium azide (for HRP) [10] | Weak or no signal | Use azide-free buffers with HRP-conjugated antibodies [10]. | |
| Contamination with HRP enzyme from previous steps [8] | Excessive signal, high background | Use fresh plastics and make fresh buffers to avoid HRP carryover [8]. | |
| Introduction of air bubbles during pipetting [45] | Poor replicate data (high CV) | Pipette carefully against the side of the well. Remove bubbles before reading the plate [42]. |
The Scientist's Toolkit: Essential Research Reagent Solutions
The following reagents are critical for preventing and troubleshooting procedural errors related to incubation, washing, and contamination.
| Reagent / Material | Function in Preventing Procedure Errors |
|---|---|
| Carbonate-Bicarbonate Coating Buffer (pH 9.6) | Standard buffer for coating plates; optimal pH for protein adsorption to plastic surfaces [6] [43]. |
| Blocking Buffers (e.g., BSA, Casein, Normal Serum) | Critical for reducing background by blocking unused protein-binding sites on the microplate, preventing non-specific binding [44] [43]. |
| Wash Buffer (PBS with Tween-20) | Effectively removes unbound reagents while maintaining assay stability. The detergent Tween-20 helps minimize non-specific interactions [42] [43]. |
| Fresh, Single-Use Plate Sealers | Prevent evaporation (which causes edge effects) and cross-contamination between wells during incubation steps [7] [8]. |
| Azide-Free Buffers | Essential when using HRP-conjugated antibodies, as sodium azide inhibits HRP activity, leading to weak signals [10]. |
| Protein Stabilizers | Commercial stabilizers can improve reagent shelf-life and assay consistency by stabilizing dried proteins and reducing non-specific binding [40]. |
Experimental Workflow: Optimizing Key ELISA Procedures
The following workflow outlines a systematic approach to optimizing and executing the critical washing and incubation steps in an ELISA protocol.
Detailed Protocol for Washes and Incubation
1. Reagent Pre-equilibration
- Purpose: To ensure consistent binding kinetics and prevent temperature-induced variations.
- Procedure: Remove all reagents (including the microplate) from 2–8°C storage and let them stand on the laboratory bench for 15–20 minutes before initiating the assay. Do not warm reagents in a water bath or incubator [7].
2. Controlled Incubation
- Purpose: To ensure complete and specific binding of antibodies and antigens.
- Procedure:
- Time: Use a calibrated timer for all incubation steps. Do not shorten or extend times arbitrarily [7] [44].
- Temperature: Perform incubations in a stable temperature environment as specified by the protocol (e.g., room temperature or 37°C). Use an incubator for 37°C steps to ensure uniformity and prevent "edge effects" [7] [8].
- Sealing: Always cover the plate with a fresh, single-use plate sealer during every incubation to prevent evaporation and contamination [7] [8].
- Stacking: Avoid stacking plates during incubation, as this can create temperature gradients across the plate [7].
3. Thorough Washing
- Purpose: To remove unbound reagents and minimize background signal.
- Procedure:
- Manual Washing: Gently add wash buffer to the wells, avoiding direct forceful streams. Aspirate completely by lowering the tip to the bottom of the well without scratching it.
- Automated Washing: Calibrate the instrument regularly to ensure tips do not touch the well bottom and that all ports are clean and delivering buffer evenly [7] [8].
- Soak Step: Introduce a 30-second soak step after adding the wash buffer to improve the dislodging of weakly bound materials [7] [8].
- Draining: After the final wash and aspiration, invert the plate and blot it firmly onto a stack of clean, absorbent paper towels. Tap the plate forcefully to ensure all residual fluid is removed [7] [44].
4. Contamination Prevention
- Purpose: To avoid non-specific signal and reagent inactivation.
- Procedure:
- Disposables: Use fresh pipette tips, reagent reservoirs, and plate sealers for each step. Never reuse these items [8] [42].
- Buffers: Prepare fresh wash and assay buffers for each experiment. Check that buffers are not cloudy or contaminated [10].
- HRP-specific: Confirm that buffers used with HRP-conjugated antibodies do not contain sodium azide [10].
FAQs: Addressing Common Detection System Failures
Q1: Why is there no signal or a very weak signal in my ELISA, even though I am sure the target analyte is present?
A weak or absent signal often originates from issues with the enzyme conjugate or the detection sequence. Common causes and solutions include:
- Inactive Enzyme Conjugate: The conjugate may be degraded due to improper storage, repeated freeze-thaw cycles, or expiration. Solution: Check expiration dates, ensure proper storage at 2-8°C, and avoid repeated freezing and thawing [7] [46].
- Insufficient Conjugate Concentration: The amount of detector antibody or streptavidin-HRP may be too low. Solution: Check the dilution and titrate if necessary. For assay development, increasing the concentration by 50% to 100% can be a starting point for optimization [47] [8].
- Signal Inhibition: Sodium azide, often used as a preservative in antibody stocks, inhibits Horseradish Peroxidase (HRP) activity. Solution: Ensure all reagents are azide-free or that washing is sufficient to remove any trace azide [36] [48].
- Plate Reader Misconfiguration: The plate may be read at an incorrect wavelength. Solution: Verify that the plate reader is set to the correct wavelength for your substrate (e.g., 450 nm for TMB) [7] [48].
Q2: What causes uniformly high background across the entire plate, and how can it be reduced?
A high uniform background is frequently caused by problems with the substrate or non-specific binding.
- Substrate Contamination or Improper Handling: The TMB substrate can turn blue prematurely if contaminated with trace HRP from reused reservoirs or sealers, exposed to light, or prepared too early. Solution: Use fresh, clean plastics for each step. Prepare substrate immediately before use and protect it from light [36] [49].
- Insufficient Washing: Inadequate washing leaves unbound enzyme-conjugated antibody in the wells, which reacts with the substrate. Solution: Increase the number and/or duration of washes. Ensure the wash buffer soaks in the wells for 30 seconds to 2 minutes to dislodge unbound reagents [7] [46].
- Overly Concentrated Antibody: Using too high a concentration of the detection antibody or enzyme conjugate can lead to non-specific binding. Solution: Titrate the antibody to find the optimal concentration that maximizes signal-to-noise [36] [48].
Q3: My standard curve looks good, but my sample signals are weak or absent. What could be the issue?
This specific problem suggests that the detection system itself is functional, but something in the sample is interfering.
- Matrix Interference: Complex sample matrices (e.g., serum, plasma) can contain substances that mask detection. Solution: Dilute the sample to minimize interference or "spike" a known amount of standard into the sample to check for recovery issues [36] [8].
- Analyte Concentration Too Low: The target analyte may be present below the assay's detection limit. Solution: Concentrate the sample or use a higher sample volume, if the protocol allows [49].
- Presence of Proteases: Biological samples may contain proteases that degrade the target analyte or antibodies during incubation. Solution: Include protease inhibitors during sample collection and storage [46].
Q4: Why am I getting high variation between replicate wells, and how can I improve reproducibility?
Poor replicates often stem from technical errors in liquid handling or inconsistent conditions.
- Pipetting Inaccuracy: Uncalibrated pipettes or inconsistent technique lead to volume differences between wells. Solution: Regularly calibrate pipettes and ensure proper pipetting technique [36] [46].
- Inconsistent Washing: Manual washing can be highly variable. Solution: Use an automated plate washer for uniformity. If washing manually, ensure consistency in filling, soaking, and emptying each well [49] [8].
- Bubbles in Wells: Bubbles can interfere with optical readings in the plate reader. Solution: Centrifuge the plate briefly before reading to remove bubbles [36] [40].
Troubleshooting Guide: Structured Tables for Problem-Solving
For a systematic approach, the following tables summarize common detection system failures, their causes, and validated solutions.
Table 1: Troubleshooting Signal and Background Issues
| Problem | Potential Cause | Recommended Solution |
|---|---|---|
| No Signal or Weak Signal | Inactive enzyme conjugate (degraded/expired) [7] | Use fresh, in-date reagents; avoid improper storage. |
| Signal inhibition (e.g., sodium azide in buffers) [36] | Use azide-free buffers or ensure thorough washing. | |
| Incorrect plate reader wavelength [7] | Verify instrument settings for the substrate used. | |
| Insufficient conjugate or substrate incubation time [8] | Increase incubation time; optimize for your assay. | |
| High Background | Substrate contamination (e.g., from reused plastics) [36] | Use fresh pipette tips, reservoirs, and plate sealers. |
| Incomplete washing leaving unbound conjugate [7] | Increase wash cycles and/or duration; add a soak step. | |
| Substrate overdevelopment or exposure to light [47] [49] | Develop in the dark and stop reaction promptly. | |
| Enzyme conjugate concentration too high [36] | Titrate conjugate to find optimal concentration. | |
| High Variation Between Replicates | Pipetting errors and uncalibrated instruments [49] | Calibrate pipettes; use consistent pipetting technique. |
| Inconsistent washing across the plate [36] | Use an automated plate washer; standardize manual wash steps. | |
| Bubbles in wells during reading [36] | Centrifuge plate prior to reading in the plate reader. | |
| Inadequate mixing of reagents or samples [49] | Thoroughly vortex or mix all solutions before use. |
Table 2: Troubleshooting the Standard Curve and Edge Effects
| Problem | Potential Cause | Recommended Solution |
|---|---|---|
| Poor Standard Curve | Improper serial dilution of the standard [8] | Double-check calculations and pipetting; create a new curve. |
| Degraded standard [36] | Reconstitute a new vial of standard; avoid repeated freeze-thaws. | |
| Incorrect coating of capture antibody [7] | Use validated ELISA plates and ensure coating buffer is at correct pH. | |
| Edge Effects (Drift) | Uneven temperature across the plate [36] | Incubate plates in a stable, temperature-controlled environment. |
| Evaporation from edge wells [7] | Use a high-quality plate sealer during all incubations. | |
| Reagents not at room temperature [7] | Allow all reagents to equilibrate to room temperature before starting the assay. |
Experimental Protocols for Key Investigations
Protocol 1: Optimizing Enzyme Conjugate Concentration
Objective: To determine the optimal working concentration of the enzyme-conjugated detection antibody (or streptavidin-HRP) that provides the strongest specific signal with the lowest background.
Materials:
- Coated and blocked ELISA plate
- Antigen standard
- Detection antibody (if separate from conjugate)
- Enzyme conjugate
- Wash Buffer
- Substrate Solution
- Stop Solution
- Plate reader
Methodology:
- Prepare the Plate: Coat and block the plate according to your standard protocol.
- Add Antigen: Add a mid-range concentration of your antigen standard to all wells, plus background control wells with coating buffer only.
- Dilute Conjugate: Prepare a series of doubling dilutions of the enzyme conjugate in the recommended diluent (e.g., starting from 1:500 to 1:8000).
- Incubate and Wash: Add the different conjugate dilutions to the antigen-containing and background wells. Incubate as per protocol, then wash thoroughly.
- Develop and Read: Add substrate, incubate for a fixed time, stop the reaction, and read the plate immediately.
- Analysis: Plot the signal (OD) for both the antigen and background wells against the conjugate concentration. The optimal concentration is the one that gives a high antigen signal while the background signal remains low, maximizing the signal-to-noise ratio [3].
Protocol 2: Validating Substrate Integrity and Performance
Objective: To confirm that the substrate solution is active and has not degraded or been contaminated.
Materials:
- Freshly prepared substrate solution
- "Questionable" substrate solution to be tested
- Stop Solution
- A 96-well plate
- A positive control (e.g., a small amount of HRP-conjugated antibody in buffer)
Methodology:
- Set Up Wells: Pipette 100 µL of substrate into multiple wells.
- Add Positive Control: Add 1 µL of the HRP-positive control to one well containing fresh substrate and one well containing the "questionable" substrate. Have wells with substrate only as a negative control.
- Observe and Compare: Incubate at room temperature and observe the time it takes for a blue color (for TMB) to develop in the test wells compared to the fresh substrate control.
- Quantify: After a fixed development time (e.g., 5-10 minutes), add stop solution and read the absorbance. A significantly lower signal from the "questionable" substrate indicates degradation or contamination [49] [46].
Visualization: Troubleshooting Logic Pathway
The following diagram outlines a systematic decision-making process for diagnosing common detection system failures in ELISA.
Title: ELISA Detection System Troubleshooting Logic
The Scientist's Toolkit: Research Reagent Solutions
Table 3: Essential Reagents and Materials for ELISA Detection Systems
| Item | Function & Importance | Key Considerations |
|---|---|---|
| HRP Conjugate | Enzyme linked to detection antibody for signal generation. | Highly sensitive but inhibited by azide; requires proper storage at 2-8°C [36] [3]. |
| TMB Substrate | Colorimetric substrate for HRP; turns blue upon reaction. | Light-sensitive; must be clear and colorless before use. Contamination causes high background [36] [49]. |
| Stop Solution | Acidic solution (e.g., 1M H₂SO₄) to halt enzyme-substrate reaction. | Changes TMB from blue to yellow; plate must be read immediately after addition for accuracy [7] [40]. |
| Wash Buffer (PBS/TBS with Tween-20) | Removes unbound reagents to minimize background. | Critical for reducing non-specific binding; Tween-20 concentration is typically 0.05-0.1% [36] [3]. |
| Blocking Buffer (e.g., BSA, Casein) | Coats unused plastic sites to prevent non-specific antibody binding. | Must be optimized for the system; cross-reactivity with assay antibodies can cause high background [3] [48]. |
| ELISA Plate (Polystyrene) | Solid phase for protein binding. | Must be a validated ELISA plate (not tissue culture plate); clear bottom for colorimetric reading [7] [3]. |
| Plate Sealer | Adhesive film to cover plates during incubations. | Prevents evaporation and contamination; a fresh sealer should be used for each incubation step [36] [49]. |
Technical Support Center: ELISA Troubleshooting Guides and FAQs
I am getting a weak signal in my ELISA. How can I optimize multiple assay conditions at once?
A weak or absent signal is a common issue in ELISA development, often stemming from suboptimal concentrations of key reagents like the capture antibody, detection antibody, or antigen [50]. The most efficient and systematic method to diagnose and resolve this is by using a checkerboard titration.
This guide will help you design, execute, and interpret a checkerboard titration experiment to simultaneously optimize multiple variables, thereby enhancing the sensitivity and robustness of your assay.
Checkerboard Titration Protocol
The checkerboard titration is a powerful experimental design that allows you to test a range of concentrations for two critical components (typically the capture antibody and the detection antibody or sample) against each other in a single plate [51]. This approach efficiently identifies the optimal combination that provides the strongest specific signal with the lowest background.
Experimental Workflow
The diagram below outlines the logical workflow for performing a checkerboard titration.
Step-by-Step Methodology
Define Variables and Prepare Dilutions:
- Select the two variables to optimize. A common starting point is the capture antibody and the detection antibody [50].
- Prepare a series of doubling dilutions for each component. A recommended starting concentration for a capture antibody is 1-20 µg/mL, and for a detection antibody, you might start at 500 ng/mL and make serial dilutions [51].
Set Up the Microtiter Plate:
- Coat the plate with the capture antibody dilutions. In the example below, different concentrations of capture antibody are added to columns 1-12 [51].
- Include control wells that receive no capture antibody to assess background.
Run the ELISA Protocol:
- After coating, proceed with the standard steps of blocking, washing, and adding the antigen (using a known positive control or a fixed concentration if optimizing antibodies).
- Add the detection antibody dilutions. In the example below, different concentrations are added to rows A-H [51]. This creates a matrix where each well has a unique combination of capture and detection antibody concentrations.
- Complete the assay by adding the enzyme-conjugated secondary antibody (if needed) and substrate, then read the plate at the appropriate wavelength [52].
Research Reagent Solutions
The table below details the key reagents required for a successful checkerboard titration experiment.
| Item | Function & Specification |
|---|---|
| Coating Buffer | Typically a carbonate/bicarbonate buffer or PBS (pH 9.6) to facilitate passive adsorption of the capture antibody to the plate [52]. |
| Blocking Buffer | A protein-based solution (e.g., 1-5% BSA or casein) that covers any remaining protein-binding sites on the plate to prevent non-specific binding [50]. |
| Wash Buffer | PBS or Tris-based buffer containing a low concentration of a non-ionic detergent (e.g., 0.05% Tween-20) to remove unbound reagents and reduce background [53] [36]. |
| Plate Sealers | Adhesive covers used during all incubation steps to prevent well-to-well contamination and evaporation, which can cause edge effects [7] [53]. |
Data Interpretation and Analysis
After running the assay, you will generate a plate of optical density (OD) values. The goal is to identify the well with the highest signal-to-noise ratio—that is, a high positive signal with a low background from the control wells.
Example Checkerboard Titration Results
The following table simulates possible OD readings from a checkerboard titration. The highlighted cell indicates the optimal combination for further assays.
| Detection Ab: 500 ng/mL | Detection Ab: 250 ng/mL | Detection Ab: 125 ng/mL | Detection Ab: 62.5 ng/mL | |
|---|---|---|---|---|
| Capture Ab: 10 µg/mL | 2.450 (Saturated) | 1.980 | 1.200 | 0.450 |
| Capture Ab: 5 µg/mL | 1.950 | 1.550 (Optimal) | 0.900 | 0.300 |
| Capture Ab: 2.5 µg/mL | 1.200 | 0.950 | 0.600 | 0.200 |
| Capture Ab: 1.25 µg/mL | 0.600 | 0.400 | 0.250 | 0.120 |
| Control (No Capture Ab) | 0.150 (Background) | 0.140 | 0.130 | 0.110 |
In this example, the combination of 5 µg/mL Capture Antibody and 250 ng/mL Detection Antibody provides a strong signal (1.550) that is well above background (0.140), without reaching saturation. This combination should be selected for future assays.
Advanced Applications and Related FAQs
Can I use checkerboard titration for other assay conditions?
Yes. While most commonly used for antibody pairing, the checkerboard design is versatile and can be adapted to optimize other parameters simultaneously, such as:
- Antigen/Standard Concentration vs. Antibody Concentration [51]
- Blocking Buffer Composition across different rows or columns [50]
- Incubation Time vs. Temperature
After optimization, my signal is still high but the background is also high. What should I do?
High background is frequently caused by insufficient washing or inadequate blocking [7] [53] [36].
- Solution: Ensure you are performing an adequate number of wash cycles (typically 3-5 times per step) and that your washing technique is consistent and thorough [7]. You can also try increasing the concentration of your blocking agent (e.g., from 1% BSA to 3% BSA) or extending the blocking time [36] [50].
My replicates show high variability. How can I improve consistency?
Poor replicate data often points to technical errors in liquid handling.
- Solution:
- Use calibrated pipettes and ensure proper pipetting technique [53].
- Thoroughly mix all reagents and samples before adding them to the plate [53] [36].
- Avoid bubbles in wells before reading the plate [53].
- Use a fresh plate sealer for each incubation step to prevent evaporation and contamination [7].
Assay Validation and Comparative Analysis for Reliable Data
Spike-and-Recovery Experiments to Assess Matrix Interference
What is a spike-and-recovery experiment and why is it critical for my ELISA?
A spike-and-recovery experiment is a validation test used to determine if your sample matrix (e.g., serum, plasma, or cell culture media) is interfering with the accurate detection of your target analyte in an ELISA [54] [55]. The sample matrix contains various components like proteins, lipids, salts, and other factors that can sometimes bind to the analyte or the assay antibodies, preventing proper detection [55] [56]. This phenomenon, known as matrix interference, can cause your results to be falsely low or falsely high, compromising the integrity of your data [54] [55].
For researchers and drug development professionals, conducting this experiment is crucial because it verifies that the concentration you are measuring in your samples reflects the true amount of analyte present, rather than an artifact of the sample's composition [37]. When you are investigating weak signals in ELISA, confirming that matrix effects are not the cause is a fundamental troubleshooting step that can save significant time and resources.
How do I perform a spike-and-recovery experiment?
The core of the experiment involves adding a known quantity of your purified standard (the "spike") into your sample matrix and measuring how much of it your ELISA can recover [54] [55]. The following workflow outlines the key steps, from sample preparation to data interpretation.
Detailed Experimental Protocol
- Sample Preparation: Select a representative sample for testing. It is good practice to test more than one sample type if your study uses various matrices (e.g., both serum and cell lysate) [54].
- Split the Sample: Divide the selected sample into two parts [54].
- Unspiked Sample: One part remains unaltered. This will be used to measure the endogenous level of the analyte.
- Spiked Sample: To the other part, add a known, specific concentration of the purified standard analyte. It is crucial to add a small volume of the spike concentrate to avoid significantly altering the original sample matrix [55].
- Run the ELISA: Analyze both the spiked and unspiked samples in your ELISA according to the standard protocol. It is recommended to run these samples in duplicate or triplicate to ensure reproducibility [37].
- Data Analysis: Calculate the percentage recovery using the formula below. The recovery is calculated by subtracting the endogenous concentration (from the unspiked sample) from the total concentration measured in the spiked sample. This difference is then divided by the concentration of the standard you actually added and multiplied by 100 [54] [55].
Data Interpretation Table
After calculating the percent recovery, use the following table to interpret your results and determine the necessary actions.
| Recovery Result | Interpretation | Recommended Action |
|---|---|---|
| 80% - 120% [54] [55] | Minimal matrix interference. The assay is accurate for this sample type. | No action required. Proceed with your study. |
| Below 80% | Significant matrix interference is likely causing false low readings (e.g., weak signal). The matrix is "masking" detection [8]. | Dilute the sample to reduce interference [55] [56] [8] or modify the sample diluent [37]. |
| Above 120% | Significant matrix interference is likely causing false high readings. | Dilute the sample to reduce interference [55] [56] or modify the sample diluent [37]. |
My recovery is outside the acceptable range. How do I fix matrix interference?
If your spike-and-recovery experiment confirms matrix interference, you can employ several practical strategies to mitigate it. The goal of these strategies is to make the sample matrix more closely resemble the buffer used for your standard curve.
- Sample Dilution: This is the most common and straightforward solution [55] [56]. Diluting your sample with the assay's dilution buffer reduces the concentration of the interfering components. You will need to perform a dilution series to find a dilution factor where the measured analyte concentration falls within the dynamic range of the standard curve and shows acceptable recovery [55] [8]. Remember to apply the dilution factor when calculating your final concentration.
- Buffer Exchange: For persistent interference, you can use pre-calibrated buffer exchange columns or dialysis to physically remove interfering substances and transfer your analyte into a compatible buffer [56].
- Matrix-Matched Calibration: Instead of using the kit's standard buffer, create your standard curve by diluting the purified standard in the same matrix as your sample (e.g., normal serum for serum samples) [55] [56]. This can help "balance" the matrix effects across both standards and samples, leading to more accurate quantification [37].
- Protocol Modification: In some cases, simple adjustments such as changing the sample volume, extending incubation times, or using a simultaneous incubation approach can help minimize interference [56].
Essential Toolkit for Spike-and-Recovery Experiments
The table below lists key reagents and materials required to perform a robust spike-and-recovery experiment.
| Item | Function in the Experiment |
|---|---|
| Representative Sample | The test matrix (e.g., serum, plasma, cell lysate) whose interference potential is being evaluated [54]. |
| Purified Standard/Analyte | A known quantity of the target protein used to "spike" the sample [54] [55]. |
| Assay Diluent Buffer | The buffer provided in the kit, used to dilute the standard curve and, potentially, the samples [55]. |
| Microplate Reader | Instrument to measure the ELISA signal (absorbance, fluorescence, or luminescence) for calculating analyte concentrations [5]. |
| Analysis Software | Software (e.g., Excel, plate reader software) to generate a standard curve and calculate percent recovery using the provided formula [37]. |
How does this fit into broader ELISA troubleshooting for weak signals?
A spike-and-recovery experiment is a key diagnostic procedure when you encounter a weak or absent signal in your ELISA. It helps you systematically rule out or confirm sample-specific issues. The following chart illustrates how this experiment integrates into a larger troubleshooting workflow for weak signal problems.
Before concluding that matrix interference is the primary issue, it is essential to first rule out other common causes of weak signal, such as using expired reagents, improper reagent storage, incorrect pipetting, or insufficient incubation times [11] [7]. If the standard curve appears normal but your samples show weak signal, a spike-and-recovery experiment becomes the critical next step to isolate the problem to the sample itself [8].
Dilutional Linearity to Determine Assay Range and Hook Effect
This guide addresses two critical concepts in ELISA validation—Dilutional Linearity and the Hook Effect—which are essential for ensuring the accuracy and reliability of your quantitation data. Understanding these phenomena allows researchers to define a valid assay range and identify situations of analyte excess that can lead to significantly underestimated results.
Frequently Asked Questions (FAQs)
What is dilutional linearity and why is it important?
Dilutional Linearity refers to the ability of an assay to yield proportional and accurate results when a sample is tested at different dilution factors. When linearity is established, the measured concentration of the analyte, when multiplied by its dilution factor, remains relatively constant [57] [58].
This is crucial because it:
- Confirms Assay Accuracy: It verifies that the sample matrix does not interfere with the detection of the analyte and that the assay is providing a true reflection of the analyte's concentration [58].
- Defines the Reportable Range: It establishes the range of concentrations over which your assay provides valid quantitative results [58].
- Ensures Antibody Excess: Successful dilutional linearity confirms that the assay is operating under conditions of antibody excess, which is fundamental for accurate quantification in sandwich ELISA formats [58].
What is the Hook Effect?
The Hook Effect (also known as the prozone or high-dose hook effect) is a phenomenon in one-step sandwich ELISA where excessively high concentrations of the target analyte lead to a falsely low or negative signal [59] [60].
- Mechanism: In a one-step assay, both the sample and the enzyme-linked detection antibody are added simultaneously. At very high analyte concentrations, both the capture antibody on the plate and the detection antibody in solution become saturated. This prevents the formation of the classic "sandwich" complex because the analyte binds to the detection antibody before it can be captured by the plate-bound antibody. During the subsequent wash step, these unanchored detection antibodies are washed away, resulting in little to no signal [59] [60].
- Risk: This effect can cause a researcher to completely miss a very high concentration of their target protein or severely underestimate its value, leading to incorrect conclusions [59].
How are dilutional linearity and the Hook Effect related?
Both concepts are linked to the behavior of an ELISA at the upper end of its concentration range. Poor dilutional linearity can be an indicator of the Hook Effect [58]. If a sample with a very high concentration of analyte is tested, it may fall into the "hook" region. When this sample is serially diluted, the dilution-corrected concentration will appear to increase as you dilute the sample further, until you move out of the hook region and into the assay's linear range. This characteristic pattern is a key sign that the Hook Effect is occurring [58].
How can I detect and correct for the Hook Effect?
The most straightforward method to detect and correct for the Hook Effect is through serial dilution [59] [60].
- Detection: If you suspect the Hook Effect (e.g., a surprisingly low result for a sample expected to have high concentration), test the sample both undiluted and at a higher dilution (e.g., 1:10, 1:100). If the measured concentration from the diluted sample is significantly higher than that from the undiluted sample, the Hook Effect is confirmed [60].
- Correction: Once detected, you can report the result based on the measurement from a dilution that falls within the assay's linear range, applying the appropriate dilution factor [59].
- Prevention: For assays where high analyte concentrations are expected, using a two-step ELISA protocol can eliminate the risk of the Hook Effect. In a two-step assay, the sample is incubated first, allowing the analyte to bind to the capture antibody. After a wash to remove excess analyte, the detection antibody is added. This physical separation prevents the competition that causes the hook effect [59] [60].
Troubleshooting Guides
Poor Dilutional Linearity
Problem: When a sample is serially diluted, the dilution-corrected concentrations (Observed Concentration × Dilution Factor) are not constant and vary by more than ±20% from the expected value [58] [61].
| Possible Cause | Explanation & Solution |
|---|---|
| Hook Effect | Very high analyte concentrations saturate antibodies. Solution: Perform further serial dilutions of the sample to find a range where corrected concentrations stabilize [59] [58]. |
| Matrix Interference | Components in the sample buffer (e.g., salts, lipids, or other proteins) interfere with antibody binding. Solution: Alter the sample diluent or use a standard diluent that more closely matches the sample matrix [57] [58]. |
| Limited Antibody Excess | For complex assays (e.g., HCP ELISAs), one or more analytes may be present at such high levels that they exhaust their specific antibodies. Solution: A higher minimum required dilution (MRD) may be needed to ensure antibody excess for all components [58]. |
Suspected Hook Effect
Problem: The assay signal or calculated concentration decreases at very high analyte concentrations, leading to a false low result.
| Possible Cause | Explanation & Solution |
|---|---|
| One-Step Assay Protocol | The inherent design of one-step sandwich ELISAs makes them susceptible. Solution: Switch to a two-step assay protocol if available for your kit [59]. |
| Extreme Analyte Excess | The analyte concentration is far beyond the assay's reportable range. Solution: Perform a wide range of serial dilutions (e.g., 1:10, 1:100, 1:1000) to find the point where the signal/conc. re-enters the linear range [59] [60]. |
Experimental Protocols & Data Interpretation
How to Perform a Dilutional Linearity Experiment
This experiment establishes the Minimum Required Dilution (MRD) and the valid quantitative range for your sample type [58].
- Preparation: Start with a sample that has a high concentration of the analyte, either endogenous or from a spike of purified standard.
- Serial Dilution: Perform a series of doubling dilutions (e.g., neat, 1:2, 1:4, 1:8...) in your chosen sample diluent [57] [58].
- Run ELISA: Assay each dilution alongside the standard curve.
- Calculate: For each dilution, calculate the dilution-corrected concentration:
Corrected Concentration = Observed Concentration × Dilution Factor. - Determine MRD: The MRD is the lowest dilution at which the % change between successive corrected concentrations is within ±20% [58].
Dilution Linearity Workflow
Example Data: Dilutional Linearity
The table below shows sample data where the neat, 1:2, and 1:4 dilutions show poor linearity. The MRD is determined to be 1:8, as the % change from 1:8 to 1:16 is within the ±20% acceptance criteria. The reportable value would be the average of the corrected concentrations from the 1:8, 1:16, and 1:32 dilutions [58].
| Sample Dilution | Dilution Factor | Observed Conc. (ng/mL) | Corrected Conc. (ng/mL) | % Change | Conclusion |
|---|---|---|---|---|---|
| Neat | 1 | 146 | 146 | - | Poor linearity |
| 1:2 | 2 | 116.5 | 233 | +60% | Poor linearity |
| 1:4 | 4 | 78 | 312 | +34% | Poor linearity |
| 1:8 | 8 | 45.1 | 361 | +16% | MRD |
| 1:16 | 16 | 22.3 | 356 | -1% | Within range |
| 1:32 | 32 | 11.6 | 370 | +4% | Within range |
| 1:64 | 64 | Below 2x LOQ | - | - | Too dilute |
How to Perform a Spike-and-Recovery Experiment
This test evaluates whether the sample matrix affects the detection of the analyte compared to the standard diluent [57].
- Spike: Add a known amount of purified analyte (standard) into both the natural sample matrix and the standard diluent used for the standard curve. Use multiple spike levels (low, medium, high) within the assay range [57].
- Assay: Run the spiked samples in the ELISA.
- Calculate Recovery: For the sample matrix, first subtract the endogenous analyte level (from an unspiked control), then calculate the percent recovery [57]:
% Recovery = (Observed Spike in Sample Matrix / Observed Spike in Standard Diluent) × 100 - Interpretation: Recoveries of 80-120% are generally considered acceptable, indicating minimal matrix interference [57] [61].
Spike and Recovery Workflow
The Scientist's Toolkit: Key Research Reagent Solutions
The following table details essential materials and reagents for performing these validation experiments.
| Item | Function & Importance |
|---|---|
| Appropriate Microplate | Flat-bottomed plates are standard. Clear bottoms for colorimetry, opaque (black/white) for fluorescent/chemiluminescent detection [3]. |
| Standard Diluent | The buffer used to reconstitute and serially dilute the standard curve. It should be optimized to match the sample matrix as closely as possible to minimize matrix effects [57]. |
| Sample Diluent | The buffer used to dilute experimental samples. It may differ from the standard diluent and should be optimized to reduce interference from the sample matrix (e.g., by adding a carrier protein like BSA) [57]. |
| Purified Analyte Standard | A known quantity of the pure protein (often recombinant) used to generate the standard curve. It is essential for both spike-and-recovery and for creating samples to test dilution linearity [57] [3]. |
| Matched Antibody Pair | A pair of antibodies that bind to distinct, non-overlapping epitopes on the target antigen. This is the core of a sandwich ELISA and is critical for specificity and sensitivity [3]. |
| Wash Buffer with Surfactant | Typically PBS or TBS with 0.05% Tween 20. Adequate and consistent washing is critical for removing unbound reagents and reducing background signal [3] [7]. |
Visualizing the Hook Effect
Hook Effect Mechanism
In the context of ELISA weak signal research, a lack of or weak signal in your samples, despite a well-functioning standard curve, can often be traced to a failure in parallelism. Parallelism testing is a critical validation method used to determine whether the endogenous analyte present in your actual sample behaves similarly to the purified standard analyte provided in your kit [61]. When parallelism is poor, the immunoreactivity of your target in the sample matrix differs from that of the standard, which can lead to significant underestimation of concentrations and unreliable data. This guide will help you diagnose and troubleshoot issues related to non-parallelism.
Frequently Asked Questions
What is parallelism testing and why is it critical for my ELISA?
Parallelism testing validates that the dilution curve of a sample containing the endogenous analyte runs parallel to the standard curve [61]. This is crucial for accurate quantification.
- Purpose: It assesses whether the antibody in your assay has comparable binding affinity and selectivity for both the purified standard and the endogenous analyte found in your complex sample matrix (e.g., serum, plasma, cell lysate) [61].
- Why it Matters for Weak Signals: A significant lack of parallelism indicates that the concentration you are calculating for your undiluted sample is likely incorrect. It can manifest as a signal that drops off precipitously upon dilution or is much weaker than expected, suggesting the assay is not accurately detecting the target in your sample's environment [61].
My sample signal is weak but my standard curve is good. Could this be a parallelism issue?
Yes, this is a classic scenario where parallelism should be investigated. A good standard curve confirms that the assay reagents are functioning correctly, but it does not guarantee that the assay is compatible with your specific sample matrix [62] [61]. The weak signal could be due to:
- Matrix Effects: Components in your sample (e.g., salts, lipids, other proteins) could be interfering with antibody binding [62] [61].
- Analyte Differences: The endogenous analyte may have post-translational modifications or exist in complexes that make it less recognizable by the antibodies compared to the recombinant standard [61].
What is the difference between parallelism, spike-and-recovery, and dilutional linearity?
These are three distinct but related assays used for ELISA validation:
| Validation Test | Primary Question | Key Application |
|---|---|---|
| Parallelism [61] | Does my natural sample, with its endogenous analyte, dilute in a manner parallel to the standard? | Validates immuno-reactivity of endogenous analyte; essential for all sample analysis. |
| Spike-and-Recovery [61] | Can I accurately detect a known amount of standard analyte when it is spiked into my sample matrix? | Evaluates matrix interference and helps determine the required sample dilution. |
| Dilutional Linearity [61] | Can I accurately measure an analyte that I have spiked into a matrix at a concentration above the assay's range after dilution? | Confirms assay accuracy across dilutions for a spiked sample, not the endogenous analyte. |
What are the acceptance criteria for a valid parallelism test?
While specific requirements can vary by laboratory, a %CV (Coefficient of Variation) within 20-30% across the dilutions is often considered acceptable for successful parallelism [61]. The exact percentage should be defined based on the criticality of the data.
Experimental Protocols
Protocol 1: Standard Parallelism Testing
This protocol is designed to evaluate the behavior of your samples against the standard curve.
- Sample Preparation: Identify at least 3 samples that contain a high concentration of the endogenous analyte. The concentration of the neat (undiluted) sample should be within the assay's range but not exceed its upper limit [61].
- Serial Dilution: Perform a 1:2 serial dilution of each sample using the same diluent recommended for reconstituting the standard.
- ELISA Execution: Run the neat and diluted samples alongside the standard curve in your ELISA, following the kit's standard protocol.
- Data Analysis: Calculate the concentration of the analyte in each diluted sample using the standard curve. Then, multiply each result by its corresponding dilution factor to obtain the calculated concentration of the neat sample.
- Interpretation: Calculate the mean concentration and the %CV from all dilutions. A low %CV indicates good parallelism, meaning all dilutions point to the same neat concentration [61].
Protocol 2: Troubleshooting with Spike-and-Recovery
If parallelism fails, a spike-and-recovery experiment can help pinpoint matrix interference.
- Spike Preparation: Spike a known quantity of the standard analyte into both the standard diluent and your natural sample matrix. The spike should result in a concentration within the dynamic range of the standard curve [61].
- Control Preparation: Also prepare an unspiked sample of your matrix and the diluent to measure background levels.
- ELISA Execution: Run all samples (spiked diluent, spiked matrix, unspiked diluent, unspiked matrix) in the ELISA.
- Calculation:
Recovery in Matrix (%) = (Concentration of Spiked Matrix - Concentration of Unspiked Matrix) / Known Spike Concentration * 100Recovery in Diluent (%) = (Concentration of Spiked Diluent - Concentration of Unspiked Diluent) / Known Spike Concentration * 100
- Interpretation: Ideal recovery is 100%. Recoveries between 80-120% are generally acceptable. If recovery in your matrix is outside this range but recovery in the diluent is good, it confirms your sample matrix is causing interference [61].
Data Interpretation Tables
Table 1: Example Parallelism Data Interpretation
| Sample Dilution | Observed Concentration (pg/mL) | Dilution Factor | Calculated Neat Concentration (pg/mL) | Notes |
|---|---|---|---|---|
| Neat | 390.8 | 1 | 390.8 | --- |
| 1:2 | 194.6 | 2 | 389.2 | Good recovery |
| 1:4 | 105.1 | 4 | 420.4 | Slight deviation |
| 1:8 | 67.0 | 8 | 536.0 | Poor recovery; suggests non-parallelism |
| 1:16 | 27.9 | 16 | 446.4 | Recovering, but high variance |
| 1:32 | 12.1 | 32 | 387.2 | Good recovery at high dilution |
| Mean ± %CV | Calculate from all "Calculated Neat" values |
In this example, the 1:8 dilution shows a significant deviation (137% recovery), indicating a potential loss of parallelism at that intermediate dilution. The mean and %CV should be calculated from the "Calculated Neat Concentration" column to assess overall acceptability. [61]
Table 2: Troubleshooting Guide for Poor Parallelism
| Observed Problem | Potential Cause | Recommended Solution |
|---|---|---|
| Consistent non-parallelism across all samples | Matrix interference (e.g., salts, pH, detergents) [61] | Increase the sample dilution to minimize matrix effects [61] [63]. |
| Differences in immunoreactivity (e.g., post-translational modifications) [61] | Use a different antibody pair or kit validated for your sample type. | |
| Non-parallelism only in certain sample types | Specific interfering substances in that matrix (e.g., hemoglobin, lipids) | Use a sample clean-up step or find a kit specifically validated for that matrix. |
| Weak signal in neat sample that disappears upon dilution | Analyte concentration is near or below the assay's detection limit [62] | Concentrate your sample or use a more sensitive assay. |
| Good parallelism but consistently low recovery in spike-and-recovery | General matrix suppression or enhancement [61] | Use an alternative diluent that more closely matches your sample matrix for the standard curve [61]. |
The Scientist's Toolkit
Table 3: Essential Research Reagents for Parallelism Testing
| Item | Function in Parallelism Testing |
|---|---|
| High-Endogenous Analyte Samples | Serves as the test subject to evaluate if the endogenous target behaves like the standard [61]. |
| Validated Standard/Calibrator | The reference point against which the sample's dilution behavior is compared [61]. |
| Matrix-Matched Diluent | A diluent that closely mimics the sample matrix (e.g., serum, buffer) to minimize matrix effects during serial dilution [61] [64]. |
| Affinity-Purified Antibodies | Antibodies with high specificity and affinity help reduce non-specific binding and improve the likelihood of comparable recognition of standard and endogenous analyte [3]. |
Troubleshooting Logic for Parallelism Failure
This workflow diagrams the logical process for diagnosing the root cause of poor parallelism in your ELISA assays.
Establishing Controls and Standards for Consistent Performance
FAQ: Fundamentals of Controls and Standards
What is the purpose of a standard curve in an ELISA? A standard curve is essential for converting the optical density (OD) readings from your samples into quantitative concentration values. It is constructed using a series of known concentrations of a purified reference analyte. The relationship between the concentration of these standards and their absorbance is plotted, creating a curve from which the concentrations of unknown samples can be interpolated [3] [2]. A poor standard curve, often identified by low sensitivity or poor discrimination between points, directly compromises the accuracy and reliability of your entire assay [65] [8].
Why are controls necessary, and what types are critical for a sandwich ELISA? Controls are vital for diagnosing assay performance and troubleshooting problems. Key controls include:
- Standard Curve: For quantification [2].
- Blank: A well containing only substrate and stop solution to measure background signal from the substrate itself.
- Positive Control: A known positive sample to confirm the assay is detecting the analyte correctly.
- Negative Control: A known negative sample to establish the baseline signal in the absence of the target analyte. For sandwich ELISAs, ensuring that your capture and detection antibodies are a validated "matched pair" is a form of control, as it confirms the antibodies recognize distinct epitopes on the antigen [3] [21].
My standard curve looks fine, but my sample values are inconsistent or out of range. What should I investigate? When the standard curve is acceptable but sample data is problematic, the issue often lies with the samples themselves or matrix effects.
- Analyte Concentration: The analyte in your samples may be below the assay's detection limit or above the highest standard (saturating the signal). Prepare a series of sample dilutions to find the optimal range [8] [66].
- Matrix Interferences: Components in your sample buffer (e.g., serum, plasma) can mask detection or cause non-specific binding. Perform a spike-and-recovery experiment, where a known amount of standard is added to the sample, to check for interference [3] [40]. Using specialized sample diluents can help reduce these effects [40].
Troubleshooting Guide: Controls and Standards
| Problem | Possible Causes Related to Controls/Standards | Recommended Solutions |
|---|---|---|
| Poor Standard Curve [65] [8] [67] | Incorrect serial dilution of the standard; degraded or improperly reconstituted standard; pipetting errors. | Check pipette calibration and technique; briefly spin the standard vial before opening; prepare standard dilutions fresh shortly before use; ensure standard is stored and handled as recommended. |
| High Background (Uniform) [65] [66] [36] | Standard or detection reagent concentration is too high; insufficient blocking or washing; contaminated buffers. | Titrate antibody and conjugate concentrations; increase blocking time/concentration; add Tween-20 to wash buffers; prepare fresh, clean buffers. |
| Weak or No Signal [65] [8] [67] | Expired or inactivated standard; standard not handled according to directions; enzyme inhibitor (e.g., sodium azide) in buffers. | Confirm expiration dates; use a new vial of standard; centrifuge lyophilized standard before reconstitution; ensure sodium azide is absent from all buffers used with HRP. |
| Poor Replicate Data [65] [8] [66] | Improper mixing of standard or reagent stock solutions; bubbles in wells during reading; inconsistent sample preparation or storage. | Thoroughly mix all reagents and samples before pipetting; ensure no bubbles are present prior to reading; minimize freeze-thaw cycles and use consistent preparation methods. |
| Inconsistent Assay-to-Assay Results [65] [8] [67] | Variations in standard preparation between runs; use of old or contaminated buffer solutions; lot-to-lot inconsistencies in reagents. | Adhere to a strict, standardized protocol for all experiments; prepare fresh solutions for each run; source reagents from suppliers with high lot-to-lot consistency. |
Experimental Protocols for Validation
Protocol 1: Performing a Spike-and-Recovery Experiment
Purpose: To determine if components in your sample matrix (e.g., serum, culture medium) are interfering with the detection of your target analyte [3].
Methodology:
- Prepare a sample pool with a known, low endogenous level of your analyte.
- Spike a known volume of this sample with a known concentration of the standard (the "spike").
- Prepare a parallel dilution of the standard at the same concentration in your standard diluent (the "reference").
- Run both the spiked sample and the reference standard in your ELISA.
- Calculate the percent recovery:
(Concentration of Spiked Sample / Concentration of Reference Standard) * 100.
Interpretation: A recovery rate of 80-120% generally indicates minimal matrix interference. Recovery outside this range suggests interference, and you may need to dilute your samples further or use a different sample diluent [40].
Protocol 2: Optimizing Antibody Pairs for Sandwich ELISA
Purpose: To confirm that your chosen capture and detection antibodies work effectively together without cross-reactivity [3] [21].
Methodology:
- Coat the plate with your capture antibody as usual.
- Block the plate.
- In separate wells, add: a) Your target antigen, b) Detection antibody only, c) Capture antibody only, d) A well with no antibodies after blocking.
- Complete the rest of the ELISA protocol.
Interpretation: Signal should only be present in the well containing both the target antigen and the detection antibody. Signal in the "detection antibody only" well may indicate it is binding non-specifically to the capture antibody. Signal in the "capture antibody only" well may indicate your secondary antibody is cross-reacting with the capture antibody.
Workflow for Control-Based Problem Diagnosis
The following diagram illustrates the logical process of using your controls and standard curve to diagnose common ELISA problems.
The Scientist's Toolkit: Research Reagent Solutions
| Item | Function in Control/Standard Establishment |
|---|---|
| ELISA Microplates | Specialized polystyrene plates with high protein-binding capacity and low well-to-well variation are critical for consistent coating of capture antibodies or standards [3] [34]. |
| Reference Standard | A purified, well-characterized preparation of the target analyte with a known concentration. This is the cornerstone for generating the standard curve and achieving accurate quantification [3]. |
| Matched Antibody Pairs | Validated pairs of antibodies that bind to distinct, non-overlapping epitopes on the target antigen. These are essential for a specific and sensitive sandwich ELISA [3] [21]. |
| Blocking Buffers | Solutions of irrelevant proteins (e.g., BSA, casein) or specialized commercial blockers used to cover any unsaturated binding sites on the plate well. This minimizes non-specific binding, which is crucial for achieving a low background [3] [36]. |
| Protein Stabilizers | Reagents added to antibodies or standards to extend their shelf life and maintain activity, ensuring lot-to-lot consistency and reliable long-term assay performance [40]. |
The Enzyme-Linked Immunosorbent Assay (ELISA) represents an indispensable analytical tool in life sciences and healthcare, routinely used for quantifying biologically relevant molecules at high sensitivity in complex matrices such as proteins, peptides, hormones, and small molecules [68]. For over four decades, ELISA has maintained its popularity among researchers and healthcare professionals due to its specific, sensitive, reliable, and economical nature [68]. This technical support article frames the comparison of ELISA with other immunoassays within the broader context of investigating causes and solutions for weak signal issues in ELISA experiments. We will explore how ELISA's performance characteristics, particularly sensitivity and specificity, measure against alternative immunoassay platforms, providing researchers with comprehensive troubleshooting guidance and methodological insights to optimize their experimental outcomes.
Comparative Analysis of Immunoassay Techniques
Key Performance Parameters
Two critical elements required for a robust immunoassay are sensitivity and specificity [68]. Sensitivity refers to the lowest value of a marker or analyte in an assay buffer where the assay can statistically differentiate from background, determined by comparing readouts from many sample replicates of low standard concentrations and zero concentrations [68]. Specificity, conversely, refers to the assay's ability to exclusively detect the target analyte without cross-reacting with non-target molecules, closely related metabolic products, or homologous interfering molecules [68]. This specificity is primarily conferred by the capture antibody in ELISA systems [68].
Comparison Table of Major Immunoassay Types
The table below provides a systematic comparison of ELISA with other major immunoassay formats across critical performance and operational parameters:
| Assay Type | Basic Principle | Detection Mechanism | Sensitivity | Specificity | Key Applications | Cost & Convenience |
|---|---|---|---|---|---|---|
| ELISA [69] [68] | Uses enzyme-linked antibodies; detection based on color change or light emission from enzyme-substrate reaction | Measures color change (optical density) or light emission | High sensitivity, but generally less than RIA, CLIA, and fluoroimmunoassays | High specificity, but generally less than CLIA; specificity conferred by capture antibody | Widely used in clinical diagnostics and research; versatile for detecting antigens in various biological fluids | Cost-effective; suitable for routine use; can be conducted in standard laboratories |
| RIA [69] | Uses radioisotopes to label antigens | Measures radioactivity emitted by radioisotopes | More sensitive than ELISA | Comparable to ELISA | Historical gold standard for hormone detection | Higher cost due to radioisotopes; requires special handling and disposal |
| CLIA [69] [70] | Uses molecules that emit light when returning from excited state to ground state; enzymes catalyze reactions producing light | Measures light emission (relative light units) | Higher sensitivity than ELISA (92.3-97.8% vs 75.0-84.3% for SARS-CoV-2) [69] | Higher specificity than ELISA [69] | Detecting antigens and antibodies for various diseases (SARS-CoV-2, HIV, HCV, HBV) | More expensive due to specialized equipment; provides rapid results |
| Fluoroimmunoassay [69] | Uses fluorescent labels attached to antibodies | Measures fluorescence intensity | Highly sensitive, suitable for detecting low antigen concentrations | Comparable to ELISA | Applications requiring high sensitivity; research with low antigen concentrations | Requires fluorescence detection equipment |
| Western Blot [69] | Protein separation by electrophoresis followed by immunodetection | Visualizes protein bands on membranes | High sensitivity | High specificity; can confirm presence and purity of specific proteins | Confirming specific targets; analyzing protein size and purity | Complex, time-consuming; requires expertise |
| MicroNT-ELISA [71] | ELISA-based microneutralization for detecting neutralizing antibodies | Colorimetric detection similar to ELISA | High sensitivity (87%) and specificity (73%) for influenza H1N1 [71] | High specificity; detects functional neutralizing antibodies | Serological and epidemiological studies; vaccine evaluation | Requires cell culture facilities; more complex than standard ELISA |
Detailed Methodology: MicroNT-ELISA Protocol
The microNT-ELISA represents a sophisticated combination of neutralization assay with ELISA detection, providing a specific example of how ELISA technology can be adapted for enhanced performance [71]. Below is the detailed experimental protocol:
Principle: This method detects neutralizing antibodies against viral pathogens by combining the conventional serum neutralization test with ELISA detection for virus-infected cells [71].
Materials Preparation:
- Serum samples (heat-inactivated at 56°C for 30 minutes)
- Reference virus strain (e.g., A/California/2009 H1N1 pdm09-like virus)
- MDCK cells (1.5 × 10⁵/ml)
- 96-well microtiter plates
- Anti-influenza A NP mouse monoclonal antibody (1:4000 dilution)
- Horseradish peroxidase-conjugated goat anti-mouse IgG (1:2000 dilution)
- Substrate solution (o-phenylenediamine dihydrochloride in phosphate-citrate buffer)
- Stop solution (0.5 N sulfuric acid)
Procedure:
- Serum Dilution: Twofold serially dilute heat-inactivated serum samples in duplicate in 96-well microtiter plates.
- Virus Incubation: Incubate diluted sera with 50 μl virus suspension (100 TCID₅₀/ml in diluent) at 37°C for 2 hours with 5% CO₂.
- Cell Addition: Add 100 μl of MDCK cells (1.5 × 10⁵/ml) to each well. Include appropriate positive controls (virus + diluent + cells) and cell controls (diluent + cells only).
- Overnight Incubation: Incubate plates at 37°C with 5% CO₂ for 18-20 hours.
- Fixation: Remove medium and fix cell monolayers with cold acetone fixative (80% acetone in PBS 1:5) for 10 minutes.
- Immunodetection:
- Wash fixed plates three times with wash buffer (PBS, 0.1% Tween 20)
- Add anti-influenza A NP mouse monoclonal antibody (100 μl/well, 1:4000 dilution in blocking buffer)
- Incubate 1 hour at room temperature
- Wash four times with PBS
- Add HRP-conjugated goat anti-mouse IgG (100 μl/well, 1:2000 dilution in blocking buffer)
- Incubate 1 hour at room temperature
- Signal Development:
- Wash plates five times with wash buffer
- Add freshly prepared substrate solution (100 μl/well)
- Stop reaction after 5-10 minutes with stop solution (100 μl/well)
- Reading and Interpretation: Measure absorbance at 490 nm using a microplate reader. Calculate virus neutralization endpoint titer using the specified formula [71].
Troubleshooting Guide: ELISA Weak/No Signal Issues
Comprehensive FAQ for Signal Problems
Q: What are the primary causes of weak or no signal in ELISA? A: Weak or no signal typically stems from these technical issues:
- Reagents not at room temperature before starting assay [7]
- Incorrect storage of components or expired reagents [11] [7]
- Missing or incorrect addition of detection antibodies/enzyme conjugates [11]
- Wash buffer containing sodium azide, which inhibits HRP activity [72]
- Target present below detection limits of the assay [72]
- Incompatible sample type or assay buffer incompatibility [72]
- Insufficient incubation time or low incubation temperature [11]
Q: How can I improve sensitivity in my ELISA? A: Sensitivity optimization strategies include:
- Using high-affinity antibodies, particularly monoclonal antibodies for improved specificity [68]
- Implementing signal amplification systems such as biotin-streptavidin-HRP, which offers a 4:1 signal increase [68]
- Utilizing enzymatic amplification systems like the AMP'D ELISA Signal Amplification kit, which can provide up to 50-fold increase in sensitivity [68]
- Ensuring all reagents are at room temperature before starting the assay [7]
- Optimizing incubation times and temperatures according to manufacturer guidelines [11]
Q: What steps can minimize background while maintaining signal? A: Effective background reduction strategies include:
- Implementing sufficient washing procedures with appropriate soaking steps between washes [8] [7]
- Using fresh plate sealers for each step to prevent cross-contamination [72] [8]
- Ensuring effective blocking with appropriate blocking buffers [72]
- Optimizing antibody concentrations to prevent non-specific binding [72]
- Using clean glassware and fresh buffers to prevent contamination [72]
Advanced Techniques: Single-Molecule Colocalization Assay (SiMCA)
Recent technological advances have led to the development of SiMCA, which addresses fundamental limitations of conventional ELISA by employing single-molecule imaging to distinguish specific binding from non-specific background [73].
SiMCA Workflow and Principle
The SiMCA methodology employs the following key steps [73]:
- Surface Preparation: Coverslips are passivated with a mixture of PEG and PEG-biotin to minimize non-specific binding.
- Antibody Immobilization: Biotinylated capture antibodies (cAbs) are immobilized onto neutravidin-coated surfaces, ensuring proper orientation of antigen-binding domains.
- Sample Incubation: A mixture of target antigen (e.g., TNF-α) and fluorescently labeled detection antibody (dAb) is applied.
- Imaging: Two-color Total Internal Reflection Fluorescence (TIRF) microscopy sequentially excites green (cAb) and red (dAb) fluorophores.
- Analysis: Automated image segmentation registers only colocalized cAb and dAb signals as true binding events, eliminating non-specific background.
This approach demonstrates a three-fold lower limit of detection compared to conventional ELISA (7.6 ± 1.9 pM versus 26 ± 5.8 pM for TNF-α) and maintains consistent performance in complex matrices like serum and whole blood [73].
The Scientist's Toolkit: Essential Research Reagents
| Reagent/Category | Function | Specific Examples |
|---|---|---|
| Capture Antibodies [68] | Binds target analyte to solid phase; determines specificity | High-affinity monoclonal antibodies; biotinylated for oriented immobilization |
| Detection Antibodies [68] | Generates measurable signal; often enzyme-conjugated | HRP or AP-conjugated monoclonal antibodies; species-specific secondary antibodies |
| Signal Generation System [68] | Amplifies and detects antibody binding | Streptavidin-HRP; biotinylated secondary antibodies; chromogenic/chemiluminescent substrates |
| Signal Amplification Kits [68] | Enhances sensitivity for low-abundance targets | AMP'D ELISA Signal Amplification Kit (50-fold sensitivity increase) |
| Blocking Buffers [72] | Reduces non-specific binding | 5-10% serum from secondary antibody species; bovine serum albumin; proprietary blocking solutions |
| Specialized Plates [8] [7] | Optimizes antibody binding and assay performance | High-binding ELISA plates (not tissue culture plates) |
| Reference Materials [71] | Provides assay standardization and quality control | International standards; in-house reference preparations; positive/negative controls |
The comparison of ELISA with alternative immunoassay platforms reveals a landscape of complementary technologies, each with distinct advantages for specific applications. While newer methodologies like CLIA and SiMCA offer superior sensitivity and specificity in many cases, ELISA maintains significant relevance due to its cost-effectiveness, simplicity, and adaptability [69] [73]. The ongoing investigation into ELISA weak signal issues continues to drive innovations in both conventional ELISA formats and emerging technologies, ensuring that immunoassays remain indispensable tools for researchers and clinicians alike. Through careful optimization and appropriate technique selection, researchers can overcome sensitivity and specificity challenges to generate robust, reproducible data across diverse experimental contexts.
Conclusion
Addressing weak signals in ELISA requires a holistic approach that integrates a deep understanding of assay fundamentals, meticulous methodological execution, systematic troubleshooting, and rigorous validation. By systematically examining each component—from reagent integrity and antibody compatibility to incubation conditions and detection systems—researchers can transform an unreliable assay into a robust and precise quantitative tool. Mastering these techniques is paramount for generating high-quality, reproducible data that accelerates drug development, advances biomedical research, and ensures accurate clinical diagnostics. Future directions will likely involve further automation to minimize human error and the development of even more sensitive detection chemistries to push the boundaries of quantification.
References
- 1. Overview of Enzyme-Linked Immunosorbent Assay (ELISA) [https://www.cellsignal.com/applications/elisa/elisa-educational?srsltid=AfmBOopwf6AdpzZUXzW4Mi26J00nV1LjpV3hEa3AgBYaeBPYStk0ukQ9]
- 2. An overview of ELISA: a review and update on best laboratory ... [https://pmc.ncbi.nlm.nih.gov/articles/PMC11808753/]
- 3. Factors Affecting Signal Generation in ELISA [https://www.thermofisher.com/us/en/home/life-science/protein-biology/protein-biology-learning-center/protein-biology-resource-library/pierce-protein-methods/overview-elisa/factors-affecting-ELISA-signal.html]
- 4. How To Optimize Your ELISA Experiments [https://www.ptglab.com/news/blog/how-to-optimize-your-elisa-experiments/?srsltid=AfmBOoqESjxsiHYrcM6a-BZzvVW8pglXB1GWdur9ILE93YFybhW6tbQ9]
- 5. Optimizing your ELISA Assays [https://www.bmglabtech.com/en/blog/optimizing-your-elisa-assays/]
- 6. ELISA Troubleshooting: Low Signal or No Detection [https://protocolsandsolutions.com/blogs/elisa-protocols/elisa-troubleshooting-low-signal-or-no-detection]
- 7. ELISA Troubleshooting Guide [https://www.thermofisher.com/us/en/home/life-science/protein-biology/protein-biology-learning-center/protein-biology-resource-library/pierce-protein-methods/overview-elisa/elisa-troubleshooting-guide.html]
- 8. Troubleshooting Guide: ELISA [https://www.rndsystems.com/resources/troubleshooting-guide-elisa-development]
- 9. ELISA Development and Optimization [https://www.thermofisher.com/us/en/home/life-science/protein-biology/protein-biology-learning-center/protein-biology-resource-library/pierce-protein-methods/overview-elisa/elisa-development-optimization.html]
- 10. Difficulty in obtaining signal for ELISA [https://www.abcam.com/en-us/technical-resources/troubleshooting/signal-problems-elisa]
- 11. ELISA Weak/No Signal? Causes & Solutions for Reliable ... [https://www.multisciences.net/elisa-weak-no-signal-causes-solutions-for-reliable-results-44.html]
- 12. ELISA Kit Troubleshooting [https://www.rockland.com/resources/ELISA-Kit-Troubleshooting/?srsltid=AfmBOoqJtHYvEHzfnYUf5M2RGBD597WhJS-4pD9PNR-9GM0vlrXr4dKM]
- 13. ELISA Troubleshooting Tips, Common Issues & Solutions [https://www.cusabio.com/m-307.html?srsltid=AfmBOopZdNYuzwXcwdRB-xKcPjK_OBQTJth8-rwpA4YQhfa0kjIKI8Fn]
- 14. How To Optimize Your ELISA Experiments [https://www.ptglab.com/news/blog/how-to-optimize-your-elisa-experiments/?srsltid=AfmBOoqdT7_FsQpDLxdmrLh_ly8aIlge8j-RijaOfWGZx8M2btfssfFN]
- 15. Elisa Troubleshooting -Technical Issues | Surmodis [https://shop.surmodics.com/elisa-troubleshooting-guide]
- 16. ELISA Coating and Blocking Protocol and Tips [https://diagnopal.ca/elisa-coating-and-blocking-protocol-and-tips/]
- 17. Enhancing ELISA Sensitivity: From Surface Engineering to ... [https://pmc.ncbi.nlm.nih.gov/articles/PMC12293621/]
- 18. ELISA Guide; Part 2: The ELISA Protocol [https://www.jacksonimmuno.com/secondary-antibody-resource/immuno-techniques/elisa-guide-part-2/]
- 19. ELISA: The Complete Guide [https://www.antibodies.com/applications/elisa]
- 20. Sandwich ELISA protocol [https://www.abcam.com/en-us/technical-resources/protocols/sandwich-elisa]
- 21. Introduction to ELISA, Formats and Signal Amplification [https://www.jacksonimmuno.com/secondary-antibody-resource/immuno-techniques/elisa-guide-part-1/]
- 22. Key considerations for ELISA-based quantification of ... [https://www.frontiersin.org/journals/neuroscience/articles/10.3389/fnins.2025.1645952/full]
- 23. Enhanced ELISA detection by target protein enrichment ... [https://www.sciencedirect.com/science/article/abs/pii/S0003267025006361]
- 24. How To Optimize Your ELISA Experiments [https://www.ptglab.com/news/blog/how-to-optimize-your-elisa-experiments/?srsltid=AfmBOooZr1jeFAMkWXzhHaD8Z5sPWf4GMioeYCGpf3KJwV7tNALxH6WG]
- 25. 101 ELISA Troubleshooting Tips for Research in 2024 [https://www.assaygenie.com/101-elisa-troubleshooting-tips?srsltid=AfmBOoox3KRBYPGj1MC4nB6mxSHr3TUP6LMpPn5yakgRF1eixMS7dpsn]
- 26. ELISA Optimization [https://www.cytodiagnostics.com/pages/elisa-optimization?srsltid=AfmBOooZh0mrgLuU4rJDQXPoVhgiZ6iTxdZUNDiUx9lEtXKOTGWENAPh]
- 27. Best Practices for ELISA Sample Handling [https://www.mybiosource.com/learn/best-practices-for-elisa-sample-handling/]
- 28. Help & FAQs: ELISAs [https://www.rndsystems.com/resources/faqs/elisas]
- 29. ELISA Tips and Tricks: An Expert's Guide to Improve Your ... [https://www.alpco.com/tips-tricks?srsltid=AfmBOoqtOKuxaRQ_QWRAnRrOt6tU0KMugPFdEI2PSzQdoyHLGvBv8rZ8]
- 30. Non-Specific Binding and Cross-Reaction of ELISA [https://www.mdpi.com/2304-8158/10/8/1708]
- 31. Common ELISA Problems and Solutions [https://www.myassays.com/common-elisa-problems-and-solutions.html]
- 32. Troubleshooting common problems during ELISA ... [https://www.mybiosource.com/learn/troubleshooting-common-problems-during-elisa-experiments/]
- 33. Enzyme Linked Immunosorbent Assay - StatPearls - NCBI - NIH [https://www.ncbi.nlm.nih.gov/books/NBK555922/]
- 34. ELISA Assay Technique | Thermo Fisher Scientific - US [https://www.thermofisher.com/us/en/home/life-science/protein-biology/protein-biology-learning-center/protein-biology-resource-library/pierce-protein-methods/overview-elisa.html]
- 35. Troubleshooting ELISA - Hycult Biotech [https://www.hycultbiotech.com/troubleshooting-elisa/]
- 36. ELISA Troubleshooting Guide [https://www.bio-techne.com/resources/protocols-troubleshooting/elisa-troubleshooting]
- 37. Guide; Part 3: ELISA ELISA Optimization [https://www.jacksonimmuno.com/secondary-antibody-resource/immuno-techniques/elisa-guide-part-3-elisa-optimization/]
- 38. ELISA Troubleshooting Guide [https://blog.abclonal.com/blog/elisa-troubleshooting-tips]
- 39. Troubleshooting ELISA [https://www.hycultbiotech.com/elisa-test/troubleshooting/]
- 40. What are Some Potential Errors that can Occur in an ELISA? [https://shop.surmodics.com/elisa-test-results-troubleshooting]
- 41. An ELISA protocol to improve the accuracy and reliability of ... [https://pmc.ncbi.nlm.nih.gov/articles/PMC5387895/]
- 42. Elisa Troubleshooting | MyBioSource Learning Center [https://www.mybiosource.com/learn/elisa-troubleshooting/]
- 43. Tips for ELISA Optimization [https://www.southernbiotech.com/tips-for-elisa-optimization/]
- 44. How To Optimize Your ELISA Experiments [https://www.ptglab.com/news/blog/how-to-optimize-your-elisa-experiments/?srsltid=AfmBOorZMQzxENUhpDzPPUBmYDTT_bd6pT6Ckx4ZE9CMoqNS7-WiCiTn]
- 45. ELISA FAQS [https://www.multisciences.net/category/faqs/elisa-faqs]
- 46. ELISA Troubleshooting Guide is Here!_AntibodySystem [https://www.antibodysystem.com/archive/469.html]
- 47. Troubleshooting a Faulty ELISA [https://bitesizebio.com/37935/troubleshooting-faulty-elisa/]
- 48. ELISA Guide; Part 4: Troubleshooting [https://www.jacksonimmuno.com/secondary-antibody-resource/immuno-techniques/elisa-guide-part-4-troubleshooting/]
- 49. 101 ELISA Troubleshooting Tips for Research in 2024 [https://www.assaygenie.com/101-elisa-troubleshooting-tips?srsltid=AfmBOoqL1361qDazHj-NhnhU-i7wPtj_KXdaJKYupIWe5cPsvi2m1UGb]
- 50. How To Optimize Your ELISA Experiments [https://www.ptglab.com/news/blog/how-to-optimize-your-elisa-experiments/?srsltid=AfmBOopZzt6UvEJeZXaht1EDObfIYua-QgpyXxbFQsNDxEDtkPUFpNRo]
- 51. Optimize ELISA Assays with Checkerboard Titration ... [https://www.bosterbio.com/blog/post/how-to-use-checkerboard-titration-to-optimize-your-elisa-immunoassays?srsltid=AfmBOopseoVW7k3jHBtVq1ikS8W8oCWHl074_I6jjtn1V0PpXJ8XByzl]
- 52. ELISA体系组分解读 - 美国APExBIO中文官网 [https://www.apexbio.cn/marketing/170]
- 53. ELISA Kit Troubleshooting [https://www.rockland.com/resources/ELISA-Kit-Troubleshooting/?srsltid=AfmBOor5l-taTgeyWSxzCDtYNgqeYjGsgHKGiDHwla2E5nzrkGEL0otE]
- 54. How should I test for possible matrix interference with my ... [https://www.enzo.com/kb/how-should-i-test-for-possible-matrix-interference-with-my-samples/]
- 55. Managing Matrix Interference in Immunoassays: Tips and ... [https://www.bio-connect.nl/news/managing-matrix-interference-in-immunoassays-tips-and-solutions/]
- 56. What is Matrix Interference and How Does It Affect Testing? [https://www.arborassays.com/what-is-matrix-interference/?srsltid=AfmBOopFl_Xt8EmTyNvRtb1GyWZgnOGusQcYjVjQwgEhMs9lQw3FbYPX]
- 57. Spike and Recovery and Linearity of Dilution Assessment [https://www.thermofisher.com/br/en/home/life-science/protein-biology/protein-biology-learning-center/protein-biology-resource-library/pierce-protein-methods/overview-elisa/spike-recovery-linearity-assessment.html]
- 58. Establishing Dilution Linearity for Your Samples in an ELISA [https://www.cygnustechnologies.com/establishing-dilution-linearity-for-your-samples-in-an-elisa?srsltid=AfmBOor_n0EwsSUL9eo4Ox44dtz-C5tYsGRoFsinem3nnrxDfHubVp-_]
- 59. Understanding the Hook Effect in a One-Step Sandwich ... [https://www.chondrex.com/scientific-articles/understanding-the-hook-effect-in-a-one-step-sandwich-elisa]
- 60. The Hook Effect [https://myadlm.org/science-and-research/clinical-chemistry/clinical-chemistry-trainee-council/pearls-of-laboratory-medicine-in-english/2014/the-hook-effect]
- 61. Dilutional Linearity, Parallelism, Spike-and-Recovery in ... [https://www.enzo.com/note/dilutional-linearity-parallelism-spike-and-recovery-in-elisa-how-to-qc-your-results/]
- 62. ELISA Tips: Troubleshooting Common Challenges - Blog [https://www.arp1.com/blog/post/elisa-kit-troubleshooting-tips.html]
- 63. ELISA Kit Troubleshooting [https://www.rockland.com/resources/ELISA-Kit-Troubleshooting/?srsltid=AfmBOooKlWEYd97prnbuf-e-e70crJiNXkCH6o-NZMtqJMLUbXXdbyYq]
- 64. ELISA Assay Challenges | MyBioSource Learning Center [https://www.mybiosource.com/learn/troubleshooting-elisa-assay-challenges]
- 65. Troubleshooting Guide | Thermo Fisher Scientific - TW ELISA [https://www.thermofisher.com/tw/zt/home/life-science/protein-biology/protein-biology-learning-center/protein-biology-resource-library/pierce-protein-methods/overview-elisa/elisa-troubleshooting-guide.html]
- 66. 101 ELISA Troubleshooting Tips for Research in 2024 [https://www.assaygenie.com/101-elisa-troubleshooting-tips?srsltid=AfmBOooAOXe0zICjXZkTqUrnXkM01GPoB_VGtnaiofsm2ZDvGTlQPe0v]
- 67. ELISA Kit Troubleshooting [https://www.rockland.com/resources/ELISA-Kit-Troubleshooting/?srsltid=AfmBOooc1jMChRc5iOq0hcvHmGHjKqPV_NNwrdNhPOviwrpZnT-0dfcG]
- 68. Why are Sensitivity and Specificity Important Parameters ... [https://www.enzo.com/note/why-are-sensitivity-and-specificity-important-parameters-for-an-elisa/]
- 69. Comparing Other Immunoassay with Elisa [https://www.mybiosource.com/learn/comparing-other-immunoassay-with-elisa/]
- 70. Comparison of chemiluminescent immunoassay and ELISA for... [https://pubmed.ncbi.nlm.nih.gov/26140432/]
- 71. The Comparison of Sensitivity and Specificity of ELISA-based ... [https://pmc.ncbi.nlm.nih.gov/articles/PMC5734969/]
- 72. 101 ELISA Troubleshooting Tips for Research in 2024 [https://www.assaygenie.com/101-elisa-troubleshooting-tips?srsltid=AfmBOopi9ees7MclqgUbxmtRHZ6_zoTJRiK1gAPsEpa__nI1eAdPlQfN]
- 73. Improved immunoassay sensitivity and specificity using ... [https://www.nature.com/articles/s41467-022-32796-x]