Ensuring Reliability in Biosensing: A Comprehensive Guide to Reproducibility and Repeatability
This article provides a systematic framework for evaluating and enhancing the reproducibility and repeatability of biosensors, critical metrics for their adoption in research, drug development, and clinical diagnostics.
Ensuring Reliability in Biosensing: A Comprehensive Guide to Reproducibility and Repeatability
Abstract
This article provides a systematic framework for evaluating and enhancing the reproducibility and repeatability of biosensors, critical metrics for their adoption in research, drug development, and clinical diagnostics. It covers foundational definitions, standard and advanced methodological approaches for assessment, strategic troubleshooting of common variability sources, and robust validation paradigms. Aimed at researchers, scientists, and drug development professionals, this guide synthesizes current best practices and emerging trends to support the development of reliable, high-performance biosensing platforms suitable for rigorous biomedical applications.
Defining the Pillars of Reliability: What Are Reproducibility and Repeatability in Biosensing?
In the development and validation of biosensors, the terms repeatability, reproducibility, and stability are fundamental performance metrics. For researchers, scientists, and drug development professionals, a precise understanding of these concepts is critical for evaluating biosensor quality, ensuring reliable data, and facilitating technology transfer from the lab to clinical or commercial settings. While these terms are related, they describe distinct aspects of a biosensor's performance under different testing conditions. This guide provides a detailed comparison of these core definitions, supported by experimental data and methodologies from contemporary biosensor research.
Defining the Core Metrics
The following definitions establish the conceptual framework for biosensor performance evaluation.
Repeatability describes the precision of a biosensor when measurements are taken repeatedly under the same, unchanged conditions—using the same instrument, the same operator, and within a short period of time. It is a measure of the biosensor's internal consistency and is sometimes referred to as intra-assay precision [1] [2].
Reproducibility assesses the precision of the biosensor measurement when conditions change. This can involve different instruments, different operators, different laboratories, or measurements taken over longer periods. It measures the consistency of results across these varying conditions and is also known as inter-laboratory precision [2] [1].
Stability refers to the ability of a biosensor to maintain its performance characteristics—such as sensitivity and accuracy—over time. This includes its shelf stability before use and its functional stability during operation, encompassing resilience to environmental factors like temperature and pH variations [3].
Table 1: Core Concept Definitions and Key Influences
| Metric | Core Definition | Key Influencing Factors |
|---|---|---|
| Repeatability | Precision under unchanged conditions [1]. | Instrument noise, operator skill, short-term electronic drift. |
| Reproducibility | Precision under changing conditions (inter-laboratory) [2]. | Manufacturing variance, operator technique, environmental differences. |
| Stability | Performance maintenance over time and against environmental stress [3]. | Sensor material degradation, reagent shelf-life, fouling of the recognition element. |
Experimental Protocols for Assessment
Rigorous experimental protocols are required to quantify these metrics accurately. The following methodologies are commonly employed in biosensor research.
Protocol for Assessing Repeatability
This protocol evaluates the sensor's internal consistency.
- Preparation: Select a single biosensor device and a single operator.
- Sample Application: Using a standardized sample (e.g., a control solution with a known analyte concentration), perform the measurement.
- Replication: Repeat this measurement at least 20 times in rapid succession under identical environmental conditions [4].
- Data Analysis: Calculate the mean, standard deviation, and Coefficient of Variation (CV) of the measurements. A lower CV indicates higher repeatability.
Protocol for Assessing Reproducibility
This protocol, often structured as a multicenter study, tests consistency across different settings [4].
- Preparation: Distribute identical biosensor devices and standardized samples (e.g., commercial lyophilized controls) to multiple participating laboratories [4].
- Standardized Training: Provide all operators with a standardized training session to minimize user-induced variability [4].
- Testing: Each laboratory tests each standardized sample repeatedly (e.g., 40 times per control) using their assigned device [4].
- Data Analysis: Statistically compare the results from all devices and sites. Reproducibility is evaluated by calculating the CV across all devices and laboratories and by assessing the correlation of results between different sites [4].
Protocol for Assessing Stability
This protocol evaluates both shelf-life and operational resilience.
- Long-Term Storage Stability: Store multiple biosensors under recommended conditions. At regular intervals, test them using a standardized protocol and compare their performance (e.g., signal output) to their initial baseline performance [3].
- Real-Time/Continuous Monitoring: For biosensors capable of continuous monitoring, run the sensor continuously or perform frequent measurements in a controlled environment over an extended period (e.g., 60 continuous scans) to monitor for signal drift [3].
- Environmental Stress Testing: Expose the biosensor to variations in stress factors such as temperature or pH and measure its performance against controls maintained in optimal conditions.
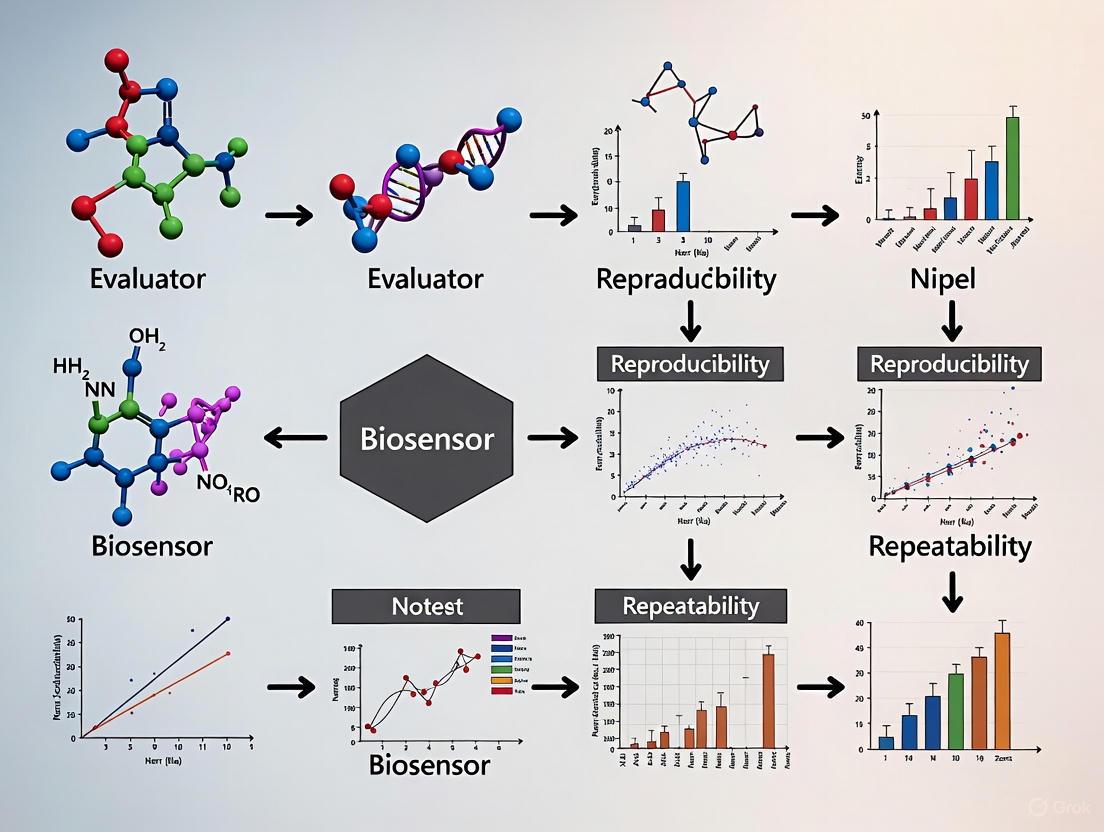
The following workflow visualizes the multi-stage process for fabricating and rigorously testing a biosensor, incorporating quality control checks at critical points to ensure reproducibility and stability.
Diagram 1: Biosensor fabrication, quality control, and assessment workflow.
Comparative Experimental Data
Quantitative data from real-world studies best illustrates the differences between these metrics. The table below summarizes findings from a multicenter study on a handheld G6PD diagnostic biosensor and a study on a quality-controlled Molecularly Imprinted Polymer (MIP) biosensor.
Table 2: Quantitative Comparison from Biosensor Studies
| Study Description | Metric Assessed | Key Quantitative Result | Implication |
|---|---|---|---|
| G6PD Biosensor (Multicenter Study) [4] | Repeatability (Single site) | CV for low activity control: 0.260 | Shows acceptable precision under controlled conditions. |
| Reproducibility (Inter-laboratory) | Correlation with reference method (spectrophotometry) dropped from rs = 0.859 (single site) to rs = 0.604 (multiple labs). | Highlights the significant impact of varying lab environments on result consistency [4]. | |
| MIP Biosensor with QC Strategy [3] | Stability & Reproducibility | QC strategy reduced the Relative Standard Deviation (RSD) for GFAP detection from 11.67% (control) to 1.44% (with QC). | Demonstrates that integrated quality control during fabrication drastically improves both reproducibility and stability [3]. |
Strategies for Performance Enhancement
Achieving high levels of repeatability, reproducibility, and stability requires deliberate engineering and quality control strategies.
Implement Ratiometric Sensing: This design uses two redox-active labels (e.g., methylene blue and ferrocene) to generate an internal reference signal. Variations caused by environmental factors or electrode surface area affect both labels equally, allowing the ratio of the two signals to cancel out errors and significantly improve reliability and reproducibility [5].
Integrate Quality Control (QC) during Fabrication: A key strategy involves embedding redox probes like Prussian Blue Nanoparticles (PB NPs) during the electro-fabrication process. The current intensity of these NPs can be monitored in real-time at critical stages (electrodeposition, polymerization, template extraction) to implement non-destructive QC protocols. This ensures consistent film thickness, conductivity, and extraction efficiency, minimizing batch-to-batch variability [3].
Utilize Robust Biomimetic Receptors: Replacing biological recognition elements (e.g., antibodies) with Molecularly Imprinted Polymers (MIPs) can enhance stability. MIPs offer superior chemical and thermal stability, a longer shelf life, and resistance to enzymatic degradation, which contributes to more reproducible performance over time, especially in point-of-care applications [3].
Essential Research Reagent Solutions
The following reagents and materials are critical for developing and testing biosensors with high repeatability and reproducibility.
Table 3: Key Research Reagents and Materials
| Reagent/Material | Core Function | Application in Biosensor Development |
|---|---|---|
| Prussian Blue Nanoparticles (PB NPs) | Electron mediator and embedded redox probe [3]. | Serves as an internal standard for real-time quality control during sensor fabrication, directly enhancing reproducibility [3]. |
| Methylene Blue (MB) & Ferrocene (Fc) | Redox-active labels with distinct oxidation potentials [5]. | Used as a label pair in ratiometric electrochemical biosensors to provide an internal reference signal, correcting for external variability [5]. |
| Lyophilized Control Samples | Standardized samples with known analyte concentrations [4]. | Essential for conducting repeatability and reproducibility tests across multiple devices and laboratories under blinded conditions [4]. |
| Molecularly Imprinted Polymers (MIPs) | Biomimetic synthetic receptors [3]. | Used as stable, reusable recognition elements to improve sensor stability and shelf-life compared to biological receptors [3]. |
| Screen-Printed Electrodes (SPEs) | Disposable, miniaturized electrochemical cells [5]. | Provide a consistent and portable platform for biosensor deployment; however, batch-to-batch variation in SPEs is a key challenge for reproducibility [5]. |
In summary, repeatability, reproducibility, and stability are distinct yet interconnected pillars of biosensor performance validation. Repeatability ensures internal consistency, reproducibility guarantees consistency across real-world conditions, and stability ensures reliability over time. Data from rigorous multicenter studies and advanced fabrication strategies, such as ratiometric sensing and embedded quality control, demonstrate that these metrics can be quantitatively assessed and significantly improved. A deep understanding of these core definitions enables researchers and drug developers to critically evaluate biosensor technologies, design robust validation protocols, and accelerate the translation of reliable diagnostic tools from the laboratory to the clinic.
For researchers, scientists, and drug development professionals, the analytical performance of biosensors is not merely a technical specification but a fundamental determinant of their real-world utility. Repeatability (intra-assay precision) and reproducibility (inter-assay precision) are pivotal metrics that directly impact diagnostic accuracy, pharmaceutical development pipelines, and ultimate commercial success. Biosensors, which combine a biological recognition element with a physicochemical detector, are revolutionizing healthcare through point-of-care testing and therapeutic drug monitoring [6] [7]. However, their transformative potential is contingent upon overcoming significant challenges related to reliability. Inconsistent performance can lead to false results, which carry profound implications in clinical medicine, from misdiagnosis to incorrect therapeutic drug monitoring [6]. This guide objectively compares the performance of different biosensor technologies, supported by experimental data, and frames the analysis within the broader thesis of evaluating biosensor reproducibility and repeatability research.
Experimental Protocols for Assessing Biosensor Reliability
Standardized experimental protocols are essential for generating comparable data on biosensor reliability. The following methodologies are commonly employed in the field to quantify repeatability and reproducibility.
Protocol for Intra-Laboratory Repeatability Testing
This protocol assesses a biosensor's precision under the same operating conditions, using the same operator and device over a short time span.
- Objective: To determine the coefficient of variation (CV) for a single biosensor device across multiple measurements of the same sample.
- Materials: Single biosensor device, lyophilized quality control samples with high, intermediate, and low analyte concentrations (e.g., G6PD enzyme activities), appropriate buffer solutions [8].
- Procedure:
- Reconstitute lyophilized control samples according to manufacturer specifications.
- Perform 20 consecutive measurements of the high-concentration control using the single biosensor device.
- Repeat step 2 for the intermediate and low-concentration controls.
- Record the measured activity for each replicate.
- Data Analysis: Calculate the mean, standard deviation, and coefficient of variation (CV = [Standard Deviation / Mean] x 100%) for each control level. A lower CV indicates higher repeatability [8].
Protocol for Inter-Laboratory Reproducibility Testing
This protocol evaluates the precision of a biosensor platform across multiple devices, operators, and laboratories.
- Objective: To determine the consistency of results for the same samples across different testing environments.
- Materials: Multiple lots of the same biosensor model (e.g., 10 devices), standardized lyophilized control samples (high, intermediate, low), distributed to multiple testing sites (e.g., 10 laboratories) [8].
- Procedure:
- Dispatch one biosensor device and a standard set of controls to each participating laboratory.
- At each site, a single operator performs 40 measurements for each control level.
- All sites follow an identical, pre-defined testing protocol.
- Results from all sites are collated for central analysis.
- Data Analysis: Compare the results from all devices and sites using statistical methods such as one-way ANOVA to determine if significant differences exist between sites. Spearman's rank correlation (rs) can be used to assess the relationship between biosensor readings and reference method results (e.g., spectrophotometry) [8].
Protocol for Enhancing Reproducibility via Manufacturing and Immobilization
This protocol focuses on engineering and biochemical approaches to improve the fundamental reproducibility of biosensor platforms.
- Objective: To optimize semiconductor manufacturing technology (SMT) production settings and bioreceptor immobilization to enhance reproducibility and accuracy.
- Materials: SMT-produced electrodes, streptavidin biomediator, a unique linker molecule, target analytes (e.g., circulating tumor cells (CTCs), DNA/RNA) [9].
- Procedure:
- Optimize SMT production parameters to create highly uniform electrode surfaces.
- Improve bioreceptor (e.g., antibody) immobilization using a stable linker chemistry to create a consistent and oriented binding surface.
- Construct biosensors for specific POC targets using the optimized platform.
- Validate performance against reference standards to confirm it meets Clinical and Laboratory Standards Institute (CLSI) guidelines for POC devices.
- Data Analysis: Assess reproducibility by measuring the signal variance across multiple production batches of biosensors. Accuracy is determined by comparing biosensor results to gold-standard methods [9].
Comparative Performance Analysis of Biosensor Technologies
The reliability of a biosensor is heavily influenced by its underlying technology and the maturity of its design. The following tables summarize key experimental data on the performance of different biosensor types and formats.
Table 1: Repeatability and Reproducibility Performance of Select Biosensors
| Biosensor Technology / Device | Target Analyte | Repeatability (CV) | Reproducibility (Correlation with Reference) | Key Finding |
|---|---|---|---|---|
| Handheld Quantitative G6PD Diagnostic [8] | G6PD Enzyme | CV: 11.1% (High), 17.2% (Intermediate), 26.0% (Low) | Multi-site correlation (rs): 0.604 (p<0.001) | Good repeatability & reproducibility, but struggled to discriminate intermediate vs. low activities in lyophilized specimens. |
| Electrochemical Platform with SMT & Improved Immobilization [9] | General Platform (e.g., CTCs, DNA) | Meets CLSI POC standards | Meets CLSI POC standards | Optimized production and a unique linker achieved exceptional reproducibility, accuracy, and stability meeting POC guidelines. |
| Advanced Silicon Group (ASG) Protein Sensor [10] | Proteins (e.g., Host Cell Proteins) | Results in 15 minutes | Not explicitly quantified | Designed for 15x speed and cost reduction vs. ELISA; high precision in biomanufacturing quality control claimed. |
Table 2: Impact of Bioreceptor Immobilization Strategies on Biosensor Stability [11]
| Immobilization Method | Key Advantage | Key Drawback for Reliability |
|---|---|---|
| Adsorption | Simple; limited activity loss | Desorption leads to poor reproducibility |
| Covalent Coupling | Stable binding; short response time | Random orientation can cause poor reproducibility |
| Affinity Interaction | Perfect control over orientation | Requires specific groups on the enzyme |
| Entrapment | No chemical reaction with enzyme | Enzyme leakage and diffusion barriers |
The Researcher's Toolkit: Essential Reagents and Materials
Achieving reliable biosensor performance is dependent on the consistent quality of key research reagents and materials. The following table details essential components and their functions in the development and validation process.
Table 3: Key Research Reagent Solutions for Biosensor Development and Validation
| Reagent / Material | Function in Research & Development |
|---|---|
| Lyophilized Quality Controls [8] | Provide stable, standardized samples with known analyte concentrations for assessing repeatability and reproducibility across devices and laboratories. |
| Semiconductor-Manufactured Electrodes [9] | Offer a highly reproducible and uniform solid-state substrate for biosensor construction, forming the foundation for consistent device performance. |
| Streptavidin-Biotin System [9] | A high-affinity binding pair used as a biomediator to immobilize bioreceptors (e.g., antibodies) in a stable and oriented manner, enhancing sensitivity and reproducibility. |
| Nanomaterials (e.g., Nanowires, Nanoparticles) [10] [7] | Used as carriers or transducer elements to increase surface area, improve immobilization efficiency, enhance signal transduction, and boost long-term stability. |
| Blocking Agents (e.g., BSA, PEG) [7] | Used to passivate sensor surfaces, reducing non-specific adsorption of non-target molecules, which is a critical step for minimizing false positives and improving accuracy. |
| Specific Bioreceptors (Antibodies, Enzymes, Aptamers) [7] [11] | The biological component that confers specificity to the biosensor by selectively recognizing and binding to the target analyte. |
Visualizing the Impact of Reliability on Biosensor Applications
The following diagrams illustrate the critical pathways and workflows through which biosensor reliability impacts key sectors.
Reliability Impact Pathways
Reliability Testing Workflow
The data and protocols presented underscore a critical thesis: the repeatability and reproducibility of biosensors are not secondary concerns but are foundational to their value in diagnostics, drug development, and the marketplace. While technologies like the handheld G6PD diagnostic show promise, their limitations in discriminating intermediate deficiency levels highlight the ongoing challenges [8]. Conversely, advances in semiconductor manufacturing and sophisticated bioreceptor immobilization are proving that reproducibility meeting strict POC standards is an achievable goal [9]. For researchers and drug development professionals, a rigorous, data-driven focus on these reliability metrics is essential for selecting, developing, and deploying biosensor technologies that are truly fit-for-purpose, ultimately ensuring that their transformative potential in healthcare is fully realized.
The reliable detection of biological and chemical analytes is fundamental to advancements in medical diagnostics, environmental monitoring, and pharmaceutical development. Biosensors, which integrate a biological recognition element with a physicochemical detector, have emerged as powerful tools in these fields. For these devices to transition from research prototypes to trusted clinical or analytical tools, a rigorous and standardized evaluation of their performance is imperative. This evaluation hinges on three cornerstone metrics: precision (repeatability and reproducibility), accuracy, and the limit of detection (LOD). These parameters form the bedrock of analytical validation, providing researchers and end-users with the quantitative data needed to assess a biosensor's reliability and suitability for a given application. Within the broader thesis of evaluating biosensor reproducibility and repeatability research, this guide provides a framework for the objective comparison of biosensor performance against established standards and alternative technologies.
A profound understanding of these metrics is not merely academic; it directly impacts the credibility of data and the safety of decisions based on that data. For instance, in drug development, an inaccurate or imprecise biosensor could lead to incorrect conclusions about a drug's potency or a biomarker's concentration, with significant financial and clinical consequences. Similarly, in point-of-care diagnostics, the LOD determines the earliest stage of a disease that can be detected. This guide will dissect these key metrics, outline standard experimental protocols for their determination, and provide a comparative analysis of how different biosensor technologies perform against these critical benchmarks.
Defining the Key Metrics
To objectively compare biosensors, a clear and consistent definition of performance parameters is essential. The following metrics are universally recognized in analytical science.
Precision: Repeatability and Reproducibility
Precision quantifies the closeness of agreement between a series of measurements obtained from multiple sampling of the same homogeneous sample under specified conditions. It is a measure of random error and is typically expressed as standard deviation (SD) or coefficient of variation (CV).
Precision is hierarchically categorized into two main types:
- Repeatability (intra-assay precision): The precision under the same operating conditions over a short interval of time. This is assessed using the same instrument, the same operator, and the same laboratory.
- Reproducibility (inter-assay precision): The precision under different conditions, such as different laboratories, different instruments, different operators, or over longer time periods.
A notable study on a handheld quantitative G6PD biosensor demonstrated excellent repeatability, with coefficients of variation of 0.111, 0.172, and 0.260 for high, intermediate, and low activity controls, respectively, when tested at a single site. However, when the same devices and controls were tested across ten different laboratories, the correlation with reference methods decreased, highlighting the distinction between repeatability and the more challenging reproducibility [8] [4].
Accuracy
Accuracy refers to the closeness of agreement between a measured value and a true or accepted reference value. It is a measure of both random and systematic error (bias). A biosensor can be precise but inaccurate if it consistently deviates from the true value due to a systematic bias.
Accuracy is often reported as percent recovery of a known standard or as a correlation coefficient (e.g., Pearson's r or Spearman's rs) when comparing the biosensor's results to those from a reference method. For example, the STANDARD G6PD biosensor showed a strong correlation with spectrophotometry (rs = 0.859, p<0.001) in a controlled setting, indicating good accuracy under those conditions [4].
Limit of Detection (LOD)
The Limit of Detection (LOD) is the lowest concentration of an analyte that can be reliably distinguished from a blank sample (e.g., no analyte present). It is a critical parameter for applications requiring high sensitivity, such as early disease biomarker detection.
The LOD is not a fixed value but is statistically derived. A common approach is to use the formula: LOD = 3.3 × (Standard Deviation of the response of the blank / Slope of the calibration curve). It is crucial to note that the procedure for calculating LOD and measurement uncertainty can vary, making direct comparisons between biosensors challenging if the same model is not used [12]. Advanced biosensors, such as a novel malathion aptasensor, have demonstrated remarkably low LODs, in this case down to 0.219 fM [13].
Table 1: Summary of Key Performance Metrics
| Metric | Definition | What it Measures | Common Expression |
|---|---|---|---|
| Precision | Closeness of agreement between repeated measurements. | Random error | Standard Deviation (SD), Coefficient of Variation (CV) |
| Repeatability | Precision under identical, short-term conditions. | Instrument/assay noise | SD, CV within a run |
| Reproducibility | Precision under varying conditions (labs, operators, time). | Robustness and reliability | SD, CV between runs/labs |
| Accuracy | Closeness of a measurement to the true value. | Systematic and random error | Percent recovery, Correlation coefficient (e.g., r) |
| Limit of Detection (LOD) | Lowest concentration distinguishable from a blank. | Sensitivity | Concentration (e.g., M, g/mL) |
Experimental Protocols for Determination
Standardized experimental protocols are vital for generating comparable and trustworthy data on biosensor performance.
Protocol for Assessing Precision
A standard protocol for evaluating both repeatability and reproducibility involves testing multiple replicates of quality control samples at different concentrations.
Detailed Methodology:
- Sample Preparation: Prepare a set of lyophilized or stable liquid control samples with analyte concentrations spanning the dynamic range of the biosensor (e.g., high, medium, and low). The use of commercial controls, such as those from ACS Analytics, ensures consistency [4].
- Repeatability (Intra-assay):
- A single operator uses one biosensor device to test each control sample 20 times in one sitting.
- The order of testing should be randomized to avoid drift effects.
- Calculate the mean, standard deviation (SD), and coefficient of variation (CV) for each control level.
- Reproducibility (Inter-assay):
- Dispatch multiple devices (e.g., 10) to different laboratories, along with an identical set of control samples.
- Each site, following a standardized operating procedure (e.g., after a one-hour online training), tests each control 40 times [4].
- The results are collated centrally, and CVs are calculated both within and between the sites. Statistical tests (e.g., Kruskal-Wallis) can determine if readings between sites differ significantly.
Protocol for Assessing Accuracy
Accuracy is determined by comparing the biosensor's results to those from a reference method.
Detailed Methodology:
- Reference Method Selection: Choose a well-established reference method, such as spectrophotometry for enzymatic activity or PCR for nucleic acid detection [4] [14].
- Sample Analysis: Analyze a panel of clinical or spiked samples covering the analytical range using both the biosensor and the reference method.
- Data Analysis:
- Perform a correlation analysis (e.g., Spearman's rank correlation) to assess the relationship between the two methods.
- Use Bland-Altman plots to visualize the bias between the methods and identify any concentration-dependent trends.
- Calculate the percent recovery for known standards.
Protocol for Determining Limit of Detection (LOD)
The LOD is determined through a combination of calibration curve data and blank sample measurements.
Detailed Methodology:
- Calibration Curve: Measure the biosensor's response to a series of standard solutions with known, low concentrations of the analyte. The curve should be linear in the range of the LOD.
- Blank Measurement: Measure a blank solution (containing all components except the analyte) multiple times (e.g., 10-20 replicates).
- Calculation:
- Calculate the standard deviation (SD) of the response from the blank measurements.
- Determine the slope (S) of the calibration curve in the low concentration region.
- Apply the formula: LOD = 3.3 × (SD of blank / S) [12].
This workflow for evaluating a biosensor from initial precision testing to final LOD calculation can be summarized in the following diagram.
Comparative Performance Data of Biosensors
The performance of a biosensor is heavily influenced by its underlying transduction technology. The following table compares the general characteristics of the two dominant biosensor types: optical and electrochemical.
Table 2: Comparative Analysis of Optical vs. Electrochemical Biosensors
| Feature | Optical Biosensors | Electrochemical Biosensors |
|---|---|---|
| Mechanism | Detect changes in light properties (intensity, wavelength) [15]. | Detect changes in electrical signals (current, potential, impedance) [15]. |
| Typical LOD | Generally superior sensitivity; e.g., fM range for SERS-based sensors [16]. | Highly sensitive; e.g., fM range for advanced aptasensors [13]. |
| Precision (Repeatability) | Can be high; e.g., RSD of 4.92% achieved with wide-area illumination SERS [16]. | Generally good; CVs <10-15% are common for well-designed assays. |
| Accuracy | High when properly calibrated against reference methods [4]. | High, but can be more susceptible to matrix effects interfering with signal [15]. |
| Cost | Higher due to sophisticated optics and light sources [15]. | Lower, more affordable for point-of-care and mass production [15]. |
| Portability | Generally less portable, often benchtop systems [15]. | Excellent, ideal for handheld, point-of-care devices [15] [17]. |
| Key Advantages | High sensitivity, non-invasive potential, multiplexing [15] [14]. | Cost-effective, portable, easy to use, high throughput [15] [17]. |
| Key Limitations | Cost, size, potential sensitivity to environmental conditions [15]. | Potential interference from other electroactive species, may require surface renewal [15] [17]. |
To illustrate with concrete examples, the table below compiles performance data from recent biosensor studies, showcasing how these metrics are reported in practice.
Table 3: Experimental Performance Data from Representative Biosensors
| Biosensor (Target) | Technology | Precision (Repeatability) | Accuracy | LOD | Reference Method |
|---|---|---|---|---|---|
| STANDARD G6PD Test [4] | Reflectance Photometry | CV: 11.1%-26.0% (depending on level) | rs = 0.859 (p<0.001) | Not specified | Spectrophotometry |
| Malathion Aptasensor [13] | Electrochemiluminescence (SQDs) | Not specified | Good linearity in calibration | 0.219 fM | Calibration Curve |
| rHuEPO Aptasensor [16] | SERS (Au Nanostructures) | RSD: 4.92% (150 measurements) | Selective extraction from plasma demonstrated | Not specified | Handheld Raman |
| IL-6 Immunosensor [13] | Electrochemiluminescence (Co₃O₄) | Not specified | Good selectivity and anti-interference | 0.64 fg mL⁻¹ | Calibration Curve |
The Scientist's Toolkit: Essential Research Reagents and Materials
The development and validation of high-performance biosensors rely on a suite of specialized reagents and materials. The following table details key components used in the featured experiments and the broader field.
Table 4: Essential Research Reagent Solutions for Biosensor Development
| Item | Function in Biosensor Development | Example from Research |
|---|---|---|
| Lyophilized Control Samples | Provide stable, standardized materials with known analyte concentrations for precision and accuracy studies. | Commercial controls (ACS Analytics) used in G6PD biosensor evaluation [4]. |
| Gold Nanoparticles (AuNPs) | Act as excellent transducers for optical (e.g., SERS, SPR) and electrochemical sensors due to their plasmonic properties and conductivity. | Used as a nanostructured substrate for SERS-based EPO detection [16]. Also used in signal amplification [14]. |
| Aptamers | Synthetic single-stranded DNA/RNA molecules that serve as high-affinity, stable biorecognition elements for specific targets. | An EPO-specific aptamer was used for selective capture and label-free SERS detection [16]. |
| Quantum Dots (QDs) | Semiconductor nanocrystals used as fluorescent labels or electrochemiluminescent tags for high-sensitivity detection. | Red-emissive sulfur quantum dots (SQDs) were used in an ECL aptasensor for malathion [13]. |
| Specific Antibodies | Immobilized biorecognition elements that provide high specificity in immunosensors for protein targets. | Used in an interleukin-6 (IL-6) immunosensor for biomarker detection [13]. |
| Screen-Printed Electrodes (SPEs) | Disposable, low-cost, mass-producible electrodes that form the basis of portable electrochemical biosensors. | A MWCNTs/ZnO nanocomposite was used to modify an SPCE for doxorubicin detection [13]. |
The field of biosensing is continuously evolving to overcome challenges such as signal variability, matrix effects, and the need for robust operation in point-of-care settings. A significant trend is the integration of machine learning (ML) and artificial intelligence (AI) to enhance data processing. ML algorithms can improve signal-to-noise ratios, compensate for sensor drift and fouling, and even identify complex patterns from multiplexed sensors, thereby improving both precision and accuracy [17] [14]. Furthermore, the fusion of biosensors with microfluidic technology enables precise fluid handling, reduces sample volume, and automates processes, which enhances reproducibility and allows for the creation of compact "lab-on-a-chip" devices [14].
In conclusion, the rigorous assessment of precision, accuracy, and LOD is non-negotiable for the validation and commercialization of any biosensor. As demonstrated by comparative studies, the choice of transduction technology (optical vs. electrochemical) involves inherent trade-offs between sensitivity, cost, and portability. The standardized protocols and metrics outlined in this guide provide a framework for researchers and drug development professionals to objectively compare biosensor performance. Future advancements, particularly through AI and integrated microsystems, promise to deliver biosensors with even greater reliability, moving these powerful tools deeper into clinical practice and decentralized testing environments.
A biosensor is an analytical device that combines a biological component with a physicochemical detector to measure the presence or concentration of a target analyte [18]. The fundamental architecture of a biosensor comprises two critical components: a bioreceptor, which is a biologically derived or biomimetic element that provides specificity through selective interaction with the target analyte, and a transducer, which converts the biological recognition event into a quantifiable signal [19] [18]. The performance and reliability of any biosensor are governed by the intricate interplay between these components and the methods used to immobilize the bioreceptor onto the transducer surface.
For researchers and drug development professionals, evaluating biosensor reproducibility (the ability to generate identical results for replicated experimental setups) and repeatability (the precision of the sensor to provide alike results upon repeated measurement of a sample) is paramount for clinical translation and commercial success [18] [20]. These reliability metrics are inherently influenced by the choice of bioreceptor, the transducer principle, and the immobilization strategy, which collectively determine critical operational characteristics such as selectivity, sensitivity, stability, and linearity [18]. This guide provides a comparative analysis of these core components, supported by experimental data and protocols, to inform the development of robust biosensing platforms.
Core Biosensor Components and Their Impact on Reliability
Bioreceptor Elements: Mechanisms and Performance Trade-offs
The bioreceptor is the primary source of a biosensor's selectivity. Its function is to specifically recognize and bind the target analyte within a complex sample matrix, initiating the sensing cascade [20]. Different classes of bioreceptors offer distinct advantages and limitations that directly impact biosensor reliability.
Table 1: Comparative Analysis of Bioreceptor Performance Characteristics
| Bioreceptor Type | Binding Mechanism | Key Advantage | Primary Limitation | Impact on Reproducibility |
|---|---|---|---|---|
| Antibody [20] | 3D conformational binding (Affinity-based) | Very high specificity and strong binding affinity | Animal-derived production is costly; stability issues due to denaturation under environmental stress [19] [20] | Moderate; batch-to-batch variation during production can affect consistency [20] |
| Enzyme [19] [20] | Catalytic conversion at active site (Biocatalytic) | Signal amplification via catalysis; reusability as not consumed | Stability limited by enzyme lifespan; sensitive to assay conditions (pH, T°) [19] [20] | High for purified enzymes; can be compromised by enzyme leaching or inactivation over time [20] |
| Aptamer [20] | Induced fit folding of oligonucleotide (Affinity-based) | Synthetic production ensures high batch-to-batch consistency; tunable stability | SELEX discovery process is costly and complex [20] | High; chemical synthesis offers superior lot-to-lot consistency [20] |
| Nucleic Acid [19] [20] | Complementary base pairing (Hybridization) | Extreme predictability and specificity for DNA/RNA targets | Limited application range (primarily for nucleic acid targets) [20] | Very High; synthesis of precise sequences is highly reproducible [20] |
| Molecularly Imprinted Polymer (MIP) [20] | Size, shape, and chemical complementarity in synthetic cavity | High stability and robustness; applicable to a wide range of analytes | Complexity in fabricating identical binding sites across different polymer batches [20] | Low to Moderate; achieving uniformity in synthetic binding sites is challenging [20] |
Transducer Technologies: Signal Conversion and Fidelity
The transducer is the component responsible for converting the biological recognition event into a measurable electronic signal. The choice of transduction principle significantly influences the sensitivity, dynamic range, and ultimately the reliability of the biosensor output.
Table 2: Comparison of Biosensor Transducer Technologies
| Transducer Technology | Detection Principle | Measurable Signal | Sensitivity | Impact on Repeatability & Key Challenges |
|---|---|---|---|---|
| Electrochemical [18] [21] [22] | Measures electrical changes from bio-recognition event (e.g., current, potential, impedance) | Current (Amperometric), Potential (Potentiometric), Conductance (Conductometric) | High (can detect ng/ml to fg/ml) [18] | High repeatability for well-defined systems, but can be susceptible to electronic drift and fouling, requiring robust signal conditioning [18]. |
| Optical [19] [21] [22] | Measures changes in light properties (e.g., absorbance, fluorescence, SPR) | Fluorescence, Luminescence, Absorption, Refractive Index (SPR) | Very High (e.g., for label-free, real-time detection) [21] | Susceptible to ambient light interference and requires precise optical alignment, which can challenge long-term repeatability without careful calibration [18]. |
| Piezoelectric [22] | Measures mass change on sensor surface via frequency shift | Frequency, Resonance | High for mass-based detection | High repeatability in controlled environments, but sensitive to temperature and viscosity changes, which can introduce signal noise [18]. |
| Thermal [22] | Measures enthalpy change from a biochemical reaction | Temperature, Heat | Moderate | Requires excellent thermal insulation and control, as ambient temperature fluctuations can significantly impact signal stability and repeatability [18]. |
Immobilization Strategies: Anchoring the Bioreceptor
The method used to immobilize the bioreceptor onto the transducer surface is a critical factor governing biosensor performance. It directly affects the bioreceptor's activity, orientation, stability, and accessibility to the analyte, thereby heavily influencing the sensor's lifespan, sensitivity, and reproducibility [23].
Table 3: Comparison of Bioreceptor Immobilization Strategies
| Immobilization Strategy | Binding Force/Mechanism | Orientation Control | Impact on Bioreceptor Activity | Influence on Sensor Stability & Reproducibility |
|---|---|---|---|---|
| Physical Adsorption [23] | Weak forces (van der Waals, electrostatic, hydrophobic) | Random | Often reduced due to denaturation or random attachment | Low stability; bioreceptor can leach off, leading to poor reproducibility and short shelf-life [23]. |
| Covalent Binding [23] | Strong, irreversible chemical bonds | Can be controlled | Can be high if active site is preserved | High stability; robust linkage minimizes leaching, enhancing reproducibility and sensor lifetime [23]. |
| Affinity Interactions [23] | Specific bio-interactions (e.g., avidin-biotin, His-tag/NTA) | Oriented | Typically very high due to controlled orientation | High stability and reproducibility; gentle, site-specific binding preserves activity and ensures uniform presentation [23]. |
| Entrapment/Encapsulation [23] [20] | Physical restraint within a polymer matrix or membrane | N/A | Can be reduced due to diffusion limitations | Moderate stability; potential for bioreceptor leakage over time, and diffusion barriers can affect response kinetics and repeatability [23] [20]. |
Experimental Protocols for Reliability Assessment
To systematically evaluate the reliability of a biosensor, standardized experimental protocols focusing on key performance metrics are essential. The following methodologies are commonly employed in the field.
Protocol for Assessing Reproducibility (Precision)
Objective: To determine the biosensor's ability to generate identical responses for a duplicated experimental setup, quantifying its precision and accuracy [18].
Methodology:
- Sensor Fabrication: Fabricate a minimum of five (n=5) biosensors in an identical manner, using the same batch of reagents and materials.
- Calibration Curve: Challenge each sensor with a standard series of the target analyte across the intended working range (e.g., five known concentrations). Record the signal response for each.
- Data Analysis: Plot the individual calibration curves for all sensors. Calculate the mean response and standard deviation for each analyte concentration across the different sensors.
- Calculation: The coefficient of variation (CV = Standard Deviation / Mean × 100%) for the signal at each concentration is a key indicator of reproducibility. A lower CV signifies higher reproducibility [18].
Protocol for Determining Sensitivity (Limit of Detection)
Objective: To establish the minimum amount of analyte that can be reliably detected by the biosensor, defining its Limit of Detection (LOD) [18].
Methodology:
- Blank Measurement: Measure the signal response of the biosensor using a sample matrix that does not contain the target analyte (the "blank"). Repeat this measurement at least 10 times.
- Calibration Curve: As in 3.1, measure the signal response for a series of low analyte concentrations.
- Calculation: Calculate the standard deviation (σ) of the blank measurements. The LOD is typically defined as the mean signal of the blank plus 3σ (LOD = Mean_blank + 3σ). This corresponding analyte concentration can be determined from the calibration curve [18].
Protocol for Evaluating Operational Stability
Objective: To assess the biosensor's degree of susceptibility to ambient disturbances and its functional lifespan, often indicated by signal drift [18].
Methodology:
- Continuous Monitoring: Immerse the biosensor in a buffer or a sample matrix containing a fixed, known concentration of the analyte.
- Signal Recording: Continuously record the output signal over an extended period (hours to days, as applicable).
- Data Analysis: Plot the signal as a function of time. A stable sensor will show a constant signal. The degree of signal drift (e.g., % change per hour) is quantified. Additionally, the number of assays a single sensor can perform before its response falls below 90% of its initial value is a common metric for reusability and stability [18] [20].
The Scientist's Toolkit: Essential Research Reagents and Materials
The development and validation of reliable biosensors require a suite of specialized reagents and materials. The following table details key items and their functions.
Table 4: Essential Research Reagents and Materials for Biosensor Development
| Reagent / Material | Function / Application | Key Considerations for Reliability |
|---|---|---|
| High-Affinity Bioreceptors (e.g., Monoclonal Antibodies, engineered Aptamers) [20] | Provide specific recognition of the target analyte. | Purity and batch-to-batch consistency are paramount for achieving high reproducibility in sensor fabrication [20]. |
| Chemical Cross-linkers (e.g., Glutaraldehyde, EDC-NHS) [23] | Facilitate covalent immobilization of bioreceptors to transducer surfaces. | Freshness, concentration, and reaction time must be optimized and strictly controlled to ensure consistent and stable binding across different sensor batches [23]. |
| Self-Assembled Monolayer (SAM) Kits (e.g., Thiolated gold surfaces) [23] | Create a well-defined, uniform interface on the transducer for subsequent bioreceptor attachment. | Reproducibility of monolayer formation is critical for minimizing noise and ensuring consistent bioreceptor density and orientation [23]. |
| Signal Generating Probes (e.g., Enzymes like HRP, Fluorescent dyes, Electroactive tags) [19] [18] | Used in labeled assays to generate a measurable signal upon biorecognition. | The specific activity and stability of the label (e.g., enzyme) directly impact the sensitivity and repeatability of the assay [20]. |
| Microfluidic Flow Cells & Chips [21] [22] | Provide controlled sample delivery and handling, especially in automated or multiplexed systems. | Precision in manufacturing and the absence of defects are necessary to ensure uniform flow rates and sample-sensor interaction, which affects response repeatability. |
| Reference Electrodes (e.g., Ag/AgCl) [18] | Provide a stable, known potential in electrochemical cells for accurate measurement. | Electrode stability and consistency are fundamental for the repeatability of any electrochemical biosensor measurement [18]. |
The journey toward developing a reliable biosensor with high reproducibility and repeatability is a multifaceted endeavor. As this guide has detailed, success is not contingent on a single component but on a holistic and synergistic design of the bioreceptor, transducer, and immobilization matrix. The choice of bioreceptor dictates the fundamental selectivity and influences long-term stability. The transducer technology defines the sensitivity and susceptibility to environmental noise. Finally, the immobilization strategy is the crucial link that determines the functional activity and operational lifespan of the biological element.
For researchers in drug development and diagnostics, a deep understanding of these inherent components and their performance trade-offs, as summarized in the comparative tables and diagrams, is indispensable. By applying the standardized experimental protocols outlined herein, scientists can quantitatively benchmark their biosensors against these critical reliability metrics. As the field advances, driven by innovations in nanotechnology [18] [21], synthetic biology [20], and microfluidics [21], the principles of robust design and rigorous validation will remain the bedrock upon which clinically successful and commercially viable biosensors are built.
Measuring Consistency: Standard Protocols and Advanced Techniques for Assessment
The reliability of biosensor data is paramount in drug development, where decisions hinge on precise measurements of biological activity. Establishing a rigorous standard testing protocol is therefore critical for assessing biosensor reproducibility (the agreement between measurements conducted under varying conditions, operators, and instruments) and repeatability (the agreement between consecutive measurements under the same conditions) [24]. This guide objectively compares the performance of a featured 96-well microplate biosensor validation assay against alternative methods, providing supporting experimental data to frame the evaluation within the broader context of biosensor reliability research. The protocol's effectiveness is measured through its dynamic range, statistical power, and operational robustness.
Comparative Experimental Data
The following tables summarize quantitative data comparing the featured automated microplate assay against two common alternative methods: traditional manual cuvette assays and simplified well-plate readings without automated microscopy.
Table 1: Performance Comparison of Biosensor Validation Assays
| Performance Metric | Featured Microplate Assay | Traditional Cuvette Assay | Basic Well-Plate Assay |
|---|---|---|---|
| Typical Dynamic Range (FRET Index) | 1.8 - 2.5 [24] | 1.5 - 2.0 [24] | 1.6 - 2.2 (estimated) |
| Minimum Detectable Effect Size | ≤ 10% [24] | ≥ 20% [24] | ~15% (estimated) |
| Sample Throughput (Samples/Day) | 96+ (Full plate) [24] | 20-30 [24] | 48-60 (Limited by manual analysis) |
| Data Point Replicates per Condition | 4-6 (Recommended) [24] | 3 (Typical, due to labor) [24] | 3-4 (Typical) |
| Key Quantitative Controls | Donor-only, Acceptor-only, Biosensor Mutants [24] | Donor-only, Acceptor-only [24] | Often limited to donor-only |
Table 2: Operational and Environmental Factor Comparison
| Factor | Featured Microplate Assay | Traditional Cuvette Assay | Basic Well-Plate Assay |
|---|---|---|---|
| Operator Training Level Required | Medium-High (Automation software operation) | Low-Medium (Manual protocols) | Low (Basic liquid handling) |
| Inter-Operator Variability (Coefficient of Variation) | < 5% (Protocol-driven) | 10-15% [24] | 8-12% (estimated) |
| Critical Environmental Controls | Incubator Temp/CO₂, Scanner Calibration [24] | Ambient Temp, Cuvette Consistency | Incubator Temp/CO₂ |
| Cell Health Monitoring | Visual inspection via automated microscopy [24] | Not available (cells suspended) | Limited visual inspection |
| Assay Development Labor | High initial setup, low per-run | High per-run [24] | Medium per-run |
Detailed Experimental Protocols
The following section outlines the core methodologies for the featured assay and its alternatives, providing the procedural detail necessary for implementation and critique.
Featured Protocol: Automated Microplate Biosensor Validation
This protocol is designed for validating Rho GTPase biosensors but is applicable to any biosensor expressed in adherent cells [24].
- Step 1: Experimental Design and Plate Map Creation. A 96-well plate layout is designed to include all test conditions, necessary controls, and replicates. Essential controls include donor-only and acceptor-only transfections to calculate bleed-through coefficients, and biosensor mutant controls (e.g., permanently activated or inactivated mutants) to establish baseline FRET levels [24].
- Step 2: Cell Seeding and Transfection. Adherent cells are seeded into the 96-well plate. The biosensor DNA is co-transfected with varying concentrations of upstream regulator DNA (e.g., constitutively active GEFs or GAPs). A positive control (e.g., a known activator) and a negative control (e.g., a non-functional regulator) should be included to gauge the specificity of the response [24].
- Step 3: Incubation and Environmental Control. Cells are incubated under standard cell culture conditions (e.g., 37°C, 5% CO₂) for a defined period, typically 24-48 hours, to allow for biosensor expression. Maintaining a consistent and documented environment is crucial for repeatability.
- Step 4: Automated Microscopy and Image Acquisition. The plate is imaged using an automated microscope capable of capturing the required fluorescence channels (e.g., CFP and YFP for FRET). Multiple images per well and multiple wells per condition are captured to ensure statistical power and account for cellular heterogeneity [24].
- Step 5: Image Analysis and Data Processing. Images are analyzed to calculate a FRET index (e.g., corrected FRET/donor ratio). Data from replicates are pooled, and dose-response curves are generated by plotting the FRET index against the relative amount of regulator DNA transfected. The plateau of this curve indicates biosensor saturation [24].
Alternative Protocol: Traditional Cuvette-Based Assay
- Methodology: Cells are transfected in culture dishes, detached, and resuspended for measurement in a spectrofluorometer cuvette. Fluorescence emissions are measured before and after a stimulus is added to the suspension [24].
- Key Differentiator: This method lacks the high-throughput and visual confirmation capabilities of the featured assay. The process of detaching cells can adversely affect cell health and biosensor response, potentially introducing artifacts. The labor-intensive nature often limits the number of replicates and conditions that can be tested [24].
Calibration Protocol for Analytical Biosensors
For biosensors detecting analytes like glucose, a calibration protocol is essential.
- Methodology: The biosensor is exposed to a series of standard solutions with known analyte concentrations (e.g., glucose) covering the expected working range [25].
- Key Differentiator: The response (e.g., electrical current, change in optical properties) is recorded for each concentration. A calibration curve is plotted (response vs. concentration), which is used to interpolate the concentration of unknown samples [25]. This process is critical for defining the analytical performance parameters like linearity and limit of detection.
Visualizing the Validation Workflow
The following diagram illustrates the core workflow and logical structure of the featured automated microplate validation protocol.
Diagram 1: Biosensor validation workflow with essential controls.
The Scientist's Toolkit: Research Reagent Solutions
Table 3: Essential Reagents and Materials for Biosensor Validation
| Item Name | Function / Role in Validation | Specific Example |
|---|---|---|
| Genetically Encoded Biosensor | The core reporting element; senses and reports on specific protein activity. | Rac1 FLARE.dc biosensor (CyPet-Rac1 & YPet-PBD) [24]. |
| Upstream Regulators | Used to stimulate or inhibit the biosensor to define its dynamic range and specificity. | Constitutively active GEFs (stimulate) or GAPs/GDIs (inhibit) [24]. |
| Fluorescent Protein Tags | Serve as the donor and acceptor fluorophores for FRET-based biosensors. | Cyan (CFP, CyPet) and Yellow (YFP, YPet) Fluorescent Proteins [24]. |
| Cell Transfection Reagent | Enables introduction of biosensor and regulator DNA into adherent cells. | Lipid-based or polymer-based transfection reagents. |
| Culture-Ready 96-Well Plates | The platform for high-throughput, automated validation in adherent cells. | Clear-bottom, tissue culture-treated microplates. |
| Calibration Analytes | Used to generate a standard curve for analytical biosensors. | AHL (N-(β-Ketocaproyl)-DL-homoserine lactone) [26] or Glucose [25]. |
Biosensors are analytical devices that integrate a biological recognition element with a physicochemical transducer to produce a measurable signal proportional to the concentration of a specific analyte [27] [28]. The core components of any biosensor include a biorecognition element (such as enzymes, antibodies, nucleic acids, or whole cells) that specifically interacts with the target analyte, and a transducer that converts this biological response into a quantifiable electronic signal [27] [28]. The global biosensor market is projected to grow significantly, with estimates ranging from $37.7 billion by 2033 to $54.4 billion by 2030, reflecting the increasing importance of these technologies across healthcare, environmental monitoring, and biodefense applications [21] [22].
For researchers and drug development professionals, understanding the performance characteristics of different biosensing platforms is crucial for selecting appropriate analytical tools. Electrochemical biosensors currently dominate the commercial market, particularly in medical diagnostics like glucose monitoring, while optical biosensors represent the fastest-growing segment due to their label-free detection capabilities and high sensitivity [21] [22]. Acoustic biosensors, particularly those based on piezoelectric principles, offer complementary advantages for mass-sensitive detection. Evaluating these technologies based on reproducibility and repeatability is essential for their implementation in regulated research and diagnostic environments, where consistent performance across multiple experiments and platforms is paramount.
Comparative Analysis of Biosensor Platforms
Table 1: Performance comparison of major biosensor technologies
| Parameter | Electrochemical | Optical (SPR) | Acoustic (Piezoelectric) |
|---|---|---|---|
| Detection Principle | Measures current, potential, or impedance changes [29] [27] | Measures refractive index changes at metal surface [30] | Measures frequency changes due to mass adsorption [28] |
| Representative Detection Limits | 3.4 nM (DNA), 100 CFU/mL (MTB) [29] | 0.5 nM (FK506 drug) [30] | Mass changes in ng range [28] |
| Assay Time | Real-time to minutes [29] | Real-time (monitors binding as it occurs) [30] | Minutes to hours (dependent on binding kinetics) |
| Sample Volume | Small (μL range) [27] | Moderate (tens of μL) [30] | Variable (μL to mL) |
| Key Advantages | Instrumental simplicity, low cost, portability, high sensitivity [29] | Label-free, real-time kinetic data, high throughput [30] | Label-free, suitable for viscous solutions [28] |
| Limitations | Susceptible to electronic interference, requires redox probes in some configurations [29] [27] | Temperature sensitive, limited penetration depth of evanescent wave [30] | Sensitive to environmental vibrations, non-specific binding issues [28] |
| Reproducibility Challenges | Electrode fouling, enzyme stability [27] | Surface regeneration efficiency, non-specific binding [30] | Crystal instability, mass transfer limitations |
Table 2: Applications in pharmaceutical and diagnostic development
| Application Area | Electrochemical | Optical | Acoustic |
|---|---|---|---|
| Drug Discovery | Secondary screening, metabolic studies [22] | Primary screening, kinetic characterization [30] [22] | Cell adhesion studies, polymer degradation |
| Infectious Disease Diagnostics | Dengue virus, Mycobacterium tuberculosis detection [29] | Epstein-Barr virus infection staging [30] | Pathogen detection in food samples [28] |
| Biomarker Validation | Limited use for complex validation | Yes (affinity, specificity, kinetic analysis) [30] | Limited to mass-based biomarkers |
| Therapeutic Antibody Characterization | Limited resolution for kinetics | Excellent for epitope mapping, kon/koff determination [30] | Complementary for aggregation studies |
| Point-of-Care Potential | High (miniaturization, portability) [29] [21] | Moderate (instrumentation complexity) | Low (instrument sensitivity to environment) |
The comparative analysis reveals that each biosensor platform offers distinct advantages for specific applications in drug development and diagnostic research. Electrochemical biosensors excel in point-of-care settings where cost, portability, and simplicity are paramount, with demonstrated detection limits in the nanomolar range for viral DNA and 100 CFU/mL for bacterial pathogens [29]. Optical biosensors, particularly surface plasmon resonance (SPR) systems, provide superior capabilities for detailed kinetic characterization of molecular interactions, enabling researchers to determine association (k~on~) and dissociation (k~off~) rates without labeling requirements [30]. SPR imaging further enhances throughput by enabling simultaneous study of multiple interactions in array formats [30]. Acoustic biosensors based on piezoelectric effects offer unique advantages for monitoring mass changes in complex biological fluids, though they face greater challenges in achieving reproducible results across experimental conditions.
For research focused on reproducibility and repeatability, several factors must be considered. Electrochemical systems demonstrate excellent analytical reproducibility for simple analyte mixtures but may suffer from electrode fouling in complex biological matrices [27]. Optical platforms like SPR provide highly reproducible kinetic data when surface regeneration is properly optimized, making them valuable for characterizing therapeutic antibody candidates [30]. Acoustic sensors show greater variability in viscous samples, potentially limiting their application in standardized assays. The choice between these technologies should be guided by the specific reproducibility requirements of the research context, with SPR offering advantages for kinetic studies requiring high precision, electrochemical systems being preferable for concentration measurements in resource-limited settings, and acoustic methods providing complementary information about mass changes.
Experimental Protocols for Robust Data Collection
Electrochemical Impedance Spectroscopy for Viral Detection
The following protocol details the implementation of a label-free impedimetric biosensor for dengue virus detection, adapted from Cecchetto et al. with modifications for enhanced reproducibility [29].
Sensor Fabrication:
- Begin with clean gold working electrodes (2 mm diameter) and immerse in piranha solution (3:1 H~2~SO~4~:H~2~O~2~) for 10 minutes, then rinse thoroughly with deionized water.
- Functionalize the electrode surface by incubating with a 1 mM solution of 6-mercaptohexanoic acid in absolute ethanol for 12 hours at room temperature to form a self-assembled monolayer.
- Activate the carboxyl groups by treating with a mixture of 0.4 M EDC (1-ethyl-3-(3-dimethylaminopropyl)carbodiimide) and 0.1 M NHS (N-hydroxysuccinimide) in MES buffer (pH 6.0) for 30 minutes.
- Immobilize anti-NS1 antibodies (dengue virus non-structural protein 1) at a concentration of 50 μg/mL in 10 mM acetate buffer (pH 5.0) for 60 minutes.
- Block non-specific binding sites by treating with 1 M ethanolamine-HCl (pH 8.5) for 30 minutes, followed by rinsing with PBS (pH 7.4).
Data Collection:
- Perform electrochemical measurements using a three-electrode system with Ag/AgCl reference and platinum counter electrodes in the presence of 5 mM K~3~[Fe(CN)~6~]/K~4~[Fe(CN)~6~] (1:1) redox couple in PBS.
- Record impedance spectra over a frequency range of 0.1 Hz to 100 kHz with an AC amplitude of 10 mV at the formal potential of the redox couple.
- Monitor the charge-transfer resistance (R~ct~) changes after incubating with dengue NS1 antigen in neat serum for 15 minutes.
- Include control measurements with non-immunized IgG to account for non-specific binding effects.
- For reproducibility assessment, perform triplicate measurements across three independently fabricated sensors for each concentration.
Data Analysis:
- Extract R~ct~ values by fitting impedance data to the Randles equivalent circuit model.
- Calculate the normalized response as ΔR~ct~/R~ct,0~, where R~ct,0~ is the initial charge-transfer resistance.
- Generate a calibration curve by plotting normalized response against NS1 concentration (log scale).
- Determine the limit of detection (LOD) using the formula 3.3 × σ/S, where σ is the standard deviation of the blank and S is the slope of the calibration curve.
- Assess reproducibility by calculating the coefficient of variation (%CV) across replicate measurements.
Surface Plasmon Resonance for Kinetic Characterization
This protocol outlines the procedure for determining binding kinetics of small molecule-protein interactions using SPR, based on the FK506-FKBP12 characterization with enhancements for repeatability [30].
Sensor Surface Preparation:
- Use a commercial CM5 sensor chip and activate the carboxymethylated dextran surface with a 7-minute injection of a 1:1 mixture of 0.4 M EDC and 0.1 M NHS at a flow rate of 10 μL/min.
- Dilute FKBP12 protein to 30 μg/mL in 10 mM acetate buffer (pH 4.5) and immobilize onto the activated surface via amine coupling until reaching a response of 5000-6000 RU.
- Block remaining active esters with a 7-minute injection of 1 M ethanolamine-HCl (pH 8.5).
- Prepare a reference flow cell using the same procedure but without protein immobilization.
Kinetic Data Collection:
- Maintain a constant flow rate of 30 μL/min in HBS-EP buffer (10 mM HEPES, 150 mM NaCl, 3 mM EDTA, 0.005% surfactant P20, pH 7.4) at 25°C.
- Inject a 2-fold dilution series of FK506 (0.5-64 nM) over both sample and reference flow cells for 3 minutes association phase, followed by 10 minutes dissociation phase.
- Include a blank sample (buffer only) in each cycle to correct for instrumental drift and bulk refractive index changes.
- Regenerate the surface with a 30-second pulse of 10 mM glycine-HCl (pH 2.0) without damaging the immobilized protein.
- Repeat the entire concentration series in triplicate on the same sensor surface to assess intra-experiment variability.
- Perform the same experiment across three different sensor chips prepared on different days to determine inter-experiment reproducibility.
Data Processing:
- Subtract reference flow cell signals and blank injections from all sensorgrams.
- Align sensorgrams to a baseline of zero response units immediately before analyte injection.
- Fit processed data to a 1:1 Langmuir binding model using global fitting algorithms:
- Determine association rate (k~on~) from the concentration-dependent association phase
- Determine dissociation rate (k~off~) from the concentration-independent dissociation phase
- Calculate equilibrium dissociation constant K~D~ = k~off~/k~on~
- Assess fitting quality by examining residuals distribution and χ~2~ values.
- Calculate inter- and intra-assay CV% for all kinetic parameters to establish method reproducibility.
Quartz Crystal Microbalance for Biomolecular Interaction Analysis
This protocol describes the use of QCM for monitoring mass changes during biomolecular interactions, with particular attention to reproducibility in complex fluids.
Crystal Preparation:
- Use AT-cut quartz crystals with gold electrodes (5 MHz fundamental frequency) cleaned by UV-ozone treatment for 30 minutes.
- Mount crystals in flow cells and establish a stable baseline in appropriate running buffer (e.g., PBS, pH 7.4).
- Functionalize gold surfaces by injecting 0.2 mg/mL protein A in acetate buffer for 30 minutes, followed by rinsing to remove loosely adsorbed molecules.
- Block non-specific sites with 1% BSA in running buffer for 15 minutes.
- Immobilize capture antibodies by injecting 50 μg/mL solution in running buffer for 20 minutes, utilizing the protein A-antibody Fc region interaction.
Frequency Measurement:
- Maintain constant temperature (±0.1°C) and flow rate (50 μL/min) throughout the experiment.
- Record baseline frequency until stable (±1 Hz over 5 minutes).
- Inject analyte samples in increasing concentrations (threefold dilutions) for 10 minutes association, followed by buffer-only flow for 15 minutes dissociation.
- Include blank runs between sample injections to confirm surface stability.
- Perform triplicate measurements at each concentration using separately prepared crystals.
Data Analysis:
- Convert frequency shifts to mass uptake using the Sauerbrey equation: Δm = -C·Δf/n, where C is the sensitivity constant (17.7 ng·cm^-2·Hz^-1 for 5 MHz crystals) and n is the overtone number.
- Plot mass change versus time for each concentration to generate binding curves.
- Extract kinetic parameters by fitting data to appropriate binding models.
- Determine LOD from the lowest concentration producing response significantly different from blank (signal-to-noise ratio > 3).
- Assess reproducibility by calculating CV% for equilibrium response values across replicate measurements.
Visualizing Biosensor Architectures and Workflows
Diagram 1: Electrochemical biosensor signaling pathway illustrating the sequence from analyte binding to signal output through various electrochemical transduction mechanisms.
Diagram 2: Surface plasmon resonance experimental workflow highlighting the cyclical nature of data collection and the critical regeneration step for reproducibility.
Essential Research Reagent Solutions
Table 3: Key reagents and materials for biosensor experimentation
| Reagent/Material | Function | Application Notes |
|---|---|---|
| Carboxymethylated Dextran Matrix | Provides hydrophilic surface for ligand immobilization with minimal non-specific binding [30] | Standard for SPR; optimal for protein immobilization via amine coupling |
| EDC/NHS Crosslinking System | Activates carboxyl groups for covalent attachment of biomolecules [29] [30] | Critical for consistent immobilization density; fresh preparation required |
| Self-Assembled Monolayer (SAM) Reagents | Forms organized molecular layer on gold surfaces [29] | Alkanethiols (e.g., 6-mercaptohexanoic acid) provide functional groups for subsequent conjugation |
| Redox Probes | Facilitates electron transfer in electrochemical detection [29] | Ferri/ferrocyanide commonly used for impedimetric sensors; concentration optimization required |
| Surface Regeneration Solutions | Removes bound analyte without damaging immobilized ligand [30] | Mild acidic (10 mM glycine-HCl) or basic solutions; ligand-specific optimization needed |
| Blocking Agents | Reduces non-specific binding [29] [30] | BSA, casein, or ethanolamine; selection depends on sample matrix and biorecognition element |
| High-Purity Buffer Salts | Maintains physiological pH and ionic strength | HEPES or phosphate buffers; filtration and degassing essential for microfluidic systems |
The selection and quality of research reagents significantly impact the reproducibility of biosensor data. For consistent immobilization of biorecognition elements, the EDC/NHS crosslinking system remains the gold standard for carboxyl-functionalized surfaces, though fresh preparation is essential as these compounds hydrolyze rapidly in aqueous solution [29] [30]. The carboxymethylated dextran matrix used in many commercial SPR systems provides a three-dimensional architecture that increases ligand loading capacity while maintaining a hydrophilic environment that minimizes non-specific binding [30]. For electrochemical systems, consistently prepared self-assembled monolayers of alkanethiols on gold electrodes create well-defined interfaces that enhance signal reproducibility [29]. Redox probes such as ferri/ferrocyanide must be prepared at precise concentrations and protected from light to maintain consistent electron transfer properties. Surface regeneration solutions require careful optimization—too harsh conditions damage immobilized ligands, while insufficient regeneration leads to carryover between measurements, particularly problematic in kinetic studies [30]. Blocking agents should be selected based on the sample matrix, with synthetic blockers sometimes preferable to BSA for complex biological samples to avoid potential interactions. All buffer systems should be prepared with high-purity salts, filtered through 0.22 μm membranes, and thoroughly degassed to prevent bubble formation in microfluidic channels, a common source of variability in flow-based systems.
The systematic evaluation of electrochemical, optical, and acoustic biosensor technologies reveals distinct performance characteristics that dictate their appropriate application in research and drug development contexts. Electrochemical platforms offer practical advantages for point-of-care applications and resource-limited settings, with continuous improvements in sensitivity and miniaturization enhancing their utility [29] [21]. Optical biosensors, particularly SPR systems, provide unparalleled capabilities for detailed kinetic analysis of molecular interactions, making them indispensable for characterization of therapeutic candidates [30]. Acoustic biosensors complement these technologies with mass-sensitive detection suitable for complex matrices.
For researchers focused on reproducibility and repeatability, methodological rigor in surface preparation, reagent quality, and data processing emerges as more critical than the specific technology selected. Standardized protocols for immobilization chemistry, reference subtraction, and surface regeneration significantly reduce inter-experiment variability. The growing integration of microfluidics, multiplexed detection, and automated data processing across all biosensor platforms promises enhanced reproducibility through reduced manual intervention [21] [22]. As biosensor technologies continue to converge with advances in materials science and artificial intelligence, the generation of robust, reproducible data across diverse experimental conditions will increasingly become the standard rather than the exception in pharmaceutical research and diagnostic development.
The Role of Multienzymatic Cascade Systems (MCS) and Their Unique Reproducibility Challenges
Multienzymatic Cascade Systems (MCS) represent a rapidly advancing frontier in biosensor research, characterized by the integration of two or more enzymes in an appropriate manner to extend detection range for particular analytes while improving the overall efficiency of biocatalytic cascade reactions [31]. Inspired by nature's ingenuity, these systems leverage the compatible operation of enzymes sourced from unrelated organisms to facilitate single-pot, multistep transformations of simple building blocks into complex chemical structures [32]. In electrochemical biosensors specifically, MCS strategies have gained growing interest due to their potential to enhance key analytical parameters including sensitivity, selectivity, and stability compared to mono-enzyme configurations [31].
The fundamental advantage of MCS lies in their ability to perform complex transformations through sequential enzymatic reactions without requiring isolation of intermediates. This capability has been demonstrated in various applications, from the environmentally benign production of chemicals and materials to highly selective detection of clinically relevant analytes [33]. For instance, in a recently developed lactose biosensor, a cascade system incorporating β-galactosidase (β-Gal) and glucose oxidase (GOx) enabled selective determination of lactose in complex milk samples by hydrolyzing lactose to glucose and galactose, then oxidizing the generated glucose while producing electrochemically measurable H2O2 [34]. This approach eliminated cross-reactivity with other sugars that plagued previous detection methods.
However, the increased complexity of MCS introduces significant reproducibility challenges that distinguish them from single-enzyme biosensors. The coordination of multiple enzymes introduces variables related to enzyme ratios, spatial organization, cofactor dependencies, and cross-interferences that must be carefully controlled to ensure consistent performance across different production batches and applications [31] [32]. Understanding and addressing these challenges is paramount for researchers and drug development professionals seeking to translate MCS-based biosensors from laboratory proof-of-concept to reliable real-world applications.
Comparative Performance Analysis of MCS-Based Biosensing Platforms
Analytical Performance Metrics Across MCS Configurations
The development of MCS-based biosensors has yielded significant enhancements in key analytical performance metrics compared to single-enzyme systems. The synergistic effects of properly configured enzyme cascades can substantially improve sensitivity, selectivity, and operational stability, though these advantages are highly dependent on the specific optimization strategies employed.
Table 1: Performance Comparison of MCS-Based Biosensors for Different Analytes
| Target Analyte | MCS Configuration | Immobilization Strategy | Linear Range | Sensitivity | Stability | Reference |
|---|---|---|---|---|---|---|
| Lactose | β-Gal/GOx | MWCNT-RuO2 nanocomposite | 0.05-20 mM | Not specified | 70% after 30 days | [34] |
| Lactose | β-Gal/GaOx | Conductive polymers | Not specified | Enhanced vs mono-enzyme | Not specified | [34] |
| Dihydroxyacetone phosphate | Glycolytic cascade | Cell-free extract | Not specified | Not specified | Maintained in optimized extracts | [32] |
| Various biomarkers | Multiple configurations | Enzyme-nanozyme integration | Broadened | Significantly enhanced | Improved | [31] |
The data illustrates that proper MCS configuration and immobilization strategies directly influence analytical performance. The MWCNT-RuO2 nanocomposite used in the lactose biosensor contributed to both enhanced sensitivity through increased surface area and improved stability through effective enzyme retention [34]. Similarly, the integration of enzyme cascades with nanozymes in various biomarker detection platforms has demonstrated significant improvements in both sensitivity and stability compared to conventional approaches [31].
MCS Performance Advantages and Trade-offs
The transition from mono-enzyme to multi-enzyme systems introduces both performance advantages and operational trade-offs that researchers must carefully balance based on their specific application requirements.
Table 2: Advantages and Limitations of MCS Versus Mono-enzyme Biosensors
| Performance Parameter | Mono-enzyme Biosensors | MCS-Based Biosensors | Key Factors Influencing MCS Performance |
|---|---|---|---|
| Substrate Selectivity | Limited to enzyme specificity | Enhanced through cascade verification | Enzyme compatibility, intermediate diffusion |
| Detection Range | Limited by substrate saturation | Extended through sequential conversion | Enzyme kinetics matching, rate-limiting steps |
| System Complexity | Low: Single enzyme optimization | High: Multiple enzyme coordination | Optimization strategies, spatial organization |
| Reproducibility Challenges | Moderate: Mainly enzyme activity | High: Multiple variables must align | Enzyme ratios, immobilization consistency, cofactors |
| Cofactor Requirements | Minimal for most oxidoreductases | Often require recycling systems | Cofactor stability, regeneration efficiency |
The comparative analysis reveals that while MCS configurations offer enhanced selectivity and extended detection ranges, they also introduce significantly greater complexity and reproducibility challenges. The "cascade verification" mechanism, where multiple enzymes must sequentially process a target analyte, reduces false positives by requiring the generation of multiple expected products [34]. However, this advantage comes at the cost of managing multiple enzyme kinetics and ensuring balanced activities across the cascade, creating substantial hurdles for reproducible manufacturing and operation [31].
Experimental Protocols for MCS Implementation and Evaluation
Protocol for Lactose Biosensor Fabrication Using β-Gal/GOx Cascade
The development of a reproducible MCS-based lactose biosensor exemplifies the meticulous approach required for successful cascade system implementation [34]:
Step 1: Nanocomposite Preparation
- Synthesize MWCNT-RuO2 nanocomposite with optimal 4.8% RuO2 content to balance mediator function and surface area
- Disperse MWCNTs in dimethylformamide and combine with RuO2 nanoparticles under controlled sonication conditions
- Characterize using SEM and EDX to verify RuO2 cluster distribution and composition
Step 2: Electrode Modification
- Polish glassy carbon electrode (GCE) with alumina slurry to mirror finish
- Deposit MWCNT-RuO2 nanocomposite suspension via drop-casting
- Dry under controlled temperature and humidity conditions
Step 3: Enzyme Immobilization
- Prepare enzyme mixture containing optimized ratios of β-Gal and GOx
- Immobilize onto modified GCE using glutaraldehyde cross-linking
- Apply protective chitosan membrane to enhance operational stability
Step 4: Electrochemical Characterization
- Perform chronoamperometric measurements at +0.3 V vs. Ag/AgCl
- Validate sensor response in standard lactose solutions
- Assess interference resistance using potential interferents (e.g., ascorbic acid, uric acid)
Step 5: Real Sample Application
- Test with diluted milk samples (1:100 in phosphate buffer)
- Compare results with reference HPLC methods for validation
This protocol highlights the multiple critical control points that must be rigorously maintained to ensure reproducibility, particularly in the nanocomposite synthesis and enzyme immobilization stages where minor variations can significantly impact biosensor performance [34].
Protocol for Cell-Free Extract-Based MCS Configuration
For MCS platforms utilizing cell-free extracts rather than isolated enzymes, an alternative methodology has been developed to maintain cofactor balance and enzymatic activity [32]:
Step 1: Extract Preparation
- Culture engineered E. coli strains expressing desired enzymatic activities
- Harvest cells during mid-log phase for optimal enzyme content
- Lyse using homogenization or sonication under controlled conditions
- Clarify by centrifugation to remove cell debris
Step 2: Cofactor System Configuration
- Characterize endogenous ATP/NAD(P)H recycling capabilities
- Supplement with catalytic cofactor amounts if necessary
- Optimize energy substrates (e.g., glucose, glycolytic intermediates)
Step 3: Cascade Reaction Optimization
- Establish optimal enzyme ratios through fractional experimental design
- Determine kinetic parameters for each cascade step
- Identify and address rate-limiting steps through enzyme engineering or supplementation
Step 4: Stability Assessment
- Monitor enzymatic activity retention under operational conditions
- Implement stabilizers if necessary (e.g., substrates, cofactors, polymers)
- Establish storage conditions to maintain viability
This approach leverages endogenous metabolism within the cell-free extract to support the introduced cascade reactions, potentially enhancing reproducibility by maintaining enzymes in a more native-like environment while eliminating cell membrane transport limitations [32].
Visualization of MCS Biosensor Architecture and Workflows
MCS Biosensor Architecture and Signaling Pathway
This architecture visualization illustrates the sequential nature of MCS biosensor operation, highlighting the critical points where reproducibility challenges emerge. The enzyme cascade domain shows the sequential processing of the target analyte through multiple enzymatic steps, while the signal transduction domain demonstrates how the final product is converted to a measurable signal. The reproducibility challenge points indicate where variations can disrupt the entire cascade, emphasizing the need for precise control at each stage [31] [34].
Experimental Workflow for MCS Biosensor Development and Validation
This workflow diagram outlines the comprehensive process required for developing and validating MCS-based biosensors, emphasizing the iterative nature of optimization and the critical reproducibility checkpoints that must be passed for successful implementation. The three-phase structure highlights the progression from initial design through systematic optimization to rigorous validation, with feedback loops enabling refinement of parameters that affect reproducibility [31] [34] [32].
Essential Research Reagent Solutions for MCS Development
The successful implementation of reproducible MCS platforms requires carefully selected research reagents and materials that address the unique challenges of multi-enzyme systems. The following table catalogs key solutions that support the development of robust MCS-based biosensors.
Table 3: Essential Research Reagent Solutions for MCS Development
| Reagent Category | Specific Examples | Function in MCS Development | Considerations for Reproducibility |
|---|---|---|---|
| Enzyme Immobilization Matrices | MWCNT-RuO2 nanocomposite, conductive polymers, sol-gel matrices | Provide high surface area for enzyme loading, enhance electron transfer, stabilize enzyme structure | Batch-to-batch consistency, defined composition ratios, controlled porosity |
| Cross-linking Agents | Glutaraldehyde, genipin, carbodiimide | Form covalent bonds between enzymes and support matrices, stabilize multi-enzyme complexes | Concentration optimization, reaction time control, quenching consistency |
| Cofactor Recycling Systems | ATP/NAD(P)H regeneration enzymes, substrate pairs (e.g., acetyl phosphate/acetate kinase) | Maintain cofactor balance, enable catalytic usage of expensive cofactors | Stability of regeneration systems, matching regeneration capacity with consumption rates |
| Protective Matrices | Chitosan, polyurethane membranes, alginate beads | Shield enzymes from degradation, inhibit fouling, enhance operational stability | Thickness control, permeability specifications, mechanical stability |
| Cell-Free Extract Components | Engineered E. coli lysates, endogenous metabolic pathways | Provide pre-configured enzyme mixtures with natural cofactor support | Standardized preparation protocols, consistent genetic backgrounds, extraction parameter control |
| Nanomaterial Enhancers | Metal nanoparticles, graphene, carbon nanotubes | Facilitate electron transfer, increase effective surface area, mediate redox reactions | Controlled synthesis parameters, purity specifications, functionalization consistency |
The selection and quality control of these reagent solutions directly impacts the reproducibility of MCS-based biosensors. For instance, the MWCNT-RuO2 nanocomposite has demonstrated particular effectiveness in lactose biosensors due to its optimal balance between mediator function (RuO2) and surface area (MWCNTs), but requires precise control of the RuO2 content at approximately 4.8% to prevent either impaired mediator function or reduced surface area [34]. Similarly, standardized preparation protocols for cell-free extracts are essential for maintaining consistent enzymatic activities and cofactor recycling capabilities across different batches [32].
Multienzymatic Cascade Systems represent a significant advancement in biosensor technology, offering enhanced selectivity, extended detection ranges, and improved sensitivity compared to single-enzyme configurations. However, these advantages come with substantial reproducibility challenges stemming from the increased system complexity, including enzyme ratio optimization, spatial organization control, cofactor balance maintenance, and consistent immobilization across production batches.
The comparative analysis presented in this guide demonstrates that while MCS platforms show tremendous promise for applications ranging from clinical diagnostics to environmental monitoring, their translation from laboratory proof-of-concept to reliable real-world applications requires meticulous attention to the identified critical control points. The experimental protocols and reagent solutions outlined provide a framework for researchers to systematically address these reproducibility challenges through standardized methodologies and quality-controlled materials.
Future developments in enzyme engineering, immobilization techniques, and cofactor recycling systems will likely further enhance the reproducibility of MCS-based biosensors. Particularly promising approaches include the use of recombinant cell-free extracts that provide pre-configured enzymatic environments [32] and advanced nanocomposites that offer more consistent immobilization surfaces [34]. As these technologies mature, MCS platforms are poised to become increasingly robust tools for researchers and drug development professionals seeking highly selective and sensitive detection systems for complex analytical challenges.
In biosensor research and development, ensuring that devices produce reliable and consistent results is paramount. The statistical evaluation of reproducibility (precision across different conditions, operators, or laboratories) and repeatability (precision under constant conditions) is fundamental to this process. This guide provides a foundational overview of three core statistical metrics—Standard Deviation, Coefficient of Variation, and Confidence Intervals—and objectively compares their application in evaluating a quantitative biosensor against traditional laboratory methods.
Core Concepts and Formulas
Standard Deviation
Standard Deviation (SD) quantifies the absolute amount of variation or dispersion in a set of data values [35]. A low standard deviation indicates that the data points tend to be close to the mean, while a high standard deviation indicates that the data points are spread out over a wider range.
- Population Standard Deviation (σ): Used when the data represents the entire population.
σ = √[∑(Xᵢ − μ)² / N][35] - Sample Standard Deviation (s): Used when the data is a sample from a larger population.
s = √[∑(Xᵢ − x̄)² / (n − 1)][35]
Where:
Xᵢrepresents each value in the data set.μ(mu) is the population mean andx̄(x-bar) is the sample mean.Nis the population size andnis the sample size.
Coefficient of Variation (CV)
The Coefficient of Variation (CV) is a standardized, dimensionless measure of relative variability [36]. It is defined as the ratio of the standard deviation to the mean, often expressed as a percentage [37]. The CV is particularly useful for comparing the degree of variation between data sets with different units or widely different means [36].
- Formula:
CV = (Standard Deviation / Mean) × 100%[35] - Interpretation: A lower CV suggests less relative variability and higher precision, which is typically desirable for diagnostic devices and assays [37]. In finance, it represents the risk-to-reward ratio, and this concept translates to biosensor evaluation as a balance between performance variability and expected accuracy [35].
Confidence Intervals
A Confidence Interval (CI) provides a range of values that is likely to contain the true population parameter with a certain level of confidence (e.g., 95%). It is calculated from the sample data and gives an estimate of the uncertainty around the mean. While the previous search results do not provide the specific formula, a common calculation for a confidence interval for the mean is:
CI = x̄ ± (t * (s / √n))
Where:
x̄is the sample mean.sis the sample standard deviation.nis the sample size.tis the critical value from the t-distribution for the desired confidence level and degrees of freedom (n-1).
Experimental Protocol: Assessing Biosensor Performance
The following methodology is adapted from a multicenter study evaluating a handheld quantitative G6PD biosensor, which serves as an excellent model for assessing reproducibility and repeatability [4].
Research Reagent Solutions
Table 1: Essential Materials for Biosensor Reproducibility Testing
| Item Name | Function & Description |
|---|---|
| Lyophilized Controls | Commercially prepared, stabilized human blood samples with certified high, intermediate, and low enzyme activity. Serve as standardized samples for testing [4]. |
| Handheld Biosensor | The device under evaluation (e.g., STANDARD G6PD test). It uses reflectance photometry to quantify analyte activity [4]. |
| Single-Use Test Strips | Disposable cartridges inserted into the biosensor. The sample is applied here, and the strip contains reagents for the enzymatic reaction [4]. |
| Spectrophotometer | Reference laboratory instrument for quantitative analyte measurement. Serves as the benchmark for accuracy comparisons [4]. |
| Lysis Buffer | A solution that breaks open red blood cells to release the enzyme for measurement in the biosensor assay [4]. |
Experimental Workflow
The experimental design to comprehensively evaluate biosensor performance typically involves two key phases: repeatability and reproducibility testing.
Data Analysis Procedures
- Calculate Summary Statistics: For the data from each control level (high, intermediate, low) in both Phase A and B, compute the mean and standard deviation.
- Compute Coefficient of Variation (CV): Using the formula
CV = (Standard Deviation / Mean), calculate the CV for each control level across devices and sites. Multiply by 100 to express as a percentage [37] [35]. - Construct Confidence Intervals for the Mean: Calculate the 95% confidence interval for the mean measurement of each control level to understand the precision of the estimated true mean.
- Perform Correlation Analysis: Use correlation coefficients (e.g., Spearman's rank correlation, rs) to assess the strength of the relationship between biosensor readings and the reference spectrophotometry values [4].
Comparative Performance Data
The following tables summarize quantitative data from a study that evaluated a handheld G6PD biosensor, providing a clear comparison of its performance across different conditions [4].
Table 2: Summary of Biosensor Precision (CV) Data
| Control Level | Phase A (Single Site) CV | Phase B (Multiple Sites) CV |
|---|---|---|
| High Activity | 0.111 (11.1%) | Data not specified in search results |
| Intermediate Activity | 0.172 (17.2%) | Data not specified in search results |
| Low Activity | 0.260 (26.0%) | Data not specified in search results |
Table 3: Correlation with Reference Method
| Experimental Phase | Correlation with Spectrophotometry (r*s) | p-value |
|---|---|---|
| Phase A (Single Site) | 0.859 | < 0.001 |
| Phase B (Multiple Sites) | 0.604 | < 0.001 |
Interpreting the Results: A Comparative Analysis
The data from the model study allows for a direct comparison of the biosensor's performance against the benchmark method and across testing conditions.
Analysis of Precision
- CV Trends: The increasing CV from high to low activity controls (11.1% → 26.0%) indicates that precision is concentration-dependent, with higher relative variability at lower analyte activities [4]. This is a common phenomenon in analytical devices.
- Repeatability vs. Reproducibility: The lower correlation with the reference method in the multi-site phase (Phase B, rs = 0.604) compared to the single-site phase (Phase A, rs = 0.859) highlights the impact of introducing real-world variables like different operators and environments. Despite this, the biosensor readings themselves did not differ significantly between sites (p=0.436), whereas the reference spectrophotometry did, suggesting the biosensor may offer more consistent results across laboratories [4].
Performance in Context
- Biosensor as a Viable Alternative: The good repeatability and inter-laboratory reproducibility, combined with its portability and speed, position such biosensors as strong potential replacements for traditional methods like spectrophotometry in point-of-care settings [4].
- Limitation to Note: The study reported that the biosensor did not reliably discriminate between intermediate and low G6PD activities in the lyophilized specimens, a critical distinction for clinical decision-making [4]. This underscores the importance of validation with fresh clinical samples and indicates an area for improvement.
The statistical toolkit of Standard Deviation, Coefficient of Variation, and Confidence Intervals is essential for objectively quantifying the performance of diagnostic devices. The comparative data demonstrates that while handheld biosensors can show excellent repeatability and good reproducibility—sometimes surpassing traditional lab methods in consistency across sites—they may have limitations, such as differentiating between clinically relevant thresholds. For researchers and drug development professionals, these metrics provide the rigorous evidence needed to make informed decisions about device adoption and to guide future development efforts toward more reliable and precise diagnostic tools.
Solving for Variability: Identifying and Mitigating Sources of Error
Biosensor technology has revolutionized biomedical diagnostics, environmental monitoring, and food safety control by providing tools for sensitive, specific, and rapid detection of target analytes. Reproducibility—the ability of a biosensor to generate identical responses for a duplicated experimental setup—stands as a cornerstone of analytical reliability, particularly in drug development and clinical diagnostics where decisions hinge on precise measurement [18]. Despite technological advancements, three persistent phenomena frequently undermine measurement consistency: biofouling, bioreceptor degradation, and electrode passivation. These sources of irreproducibility manifest through different mechanisms yet collectively impair sensor performance by distorting the fundamental relationship between analyte concentration and signal output. This guide objectively compares these challenges, evaluates current mitigation strategies supported by experimental data, and provides standardized protocols for researchers seeking to quantify and control these critical variables in biosensor development and application.
The table below provides a systematic comparison of the three primary sources of biosensor irreproducibility, detailing their causes, impacts on performance, and established mitigation strategies.
Table 1: Comparative Analysis of Key Sources of Biosensor Irreproducibility
| Characteristic | Biofouling | Bioreceptor Degradation | Electrode Passivation |
|---|---|---|---|
| Primary Cause | Nonspecific adsorption of proteins, cells, or other biomolecules from complex samples (e.g., serum, blood) onto the sensor surface [38] [39]. | Denaturation, inactivation, or leaching of the biological recognition element (e.g., enzyme, antibody, aptamer) over time [18] [40]. | Adsorption of electrochemical reaction products or sample matrix components onto the electrode surface, forming an impermeable layer [41] [42]. |
| Impact on Signal | Drift and gradual signal reduction due to physical blockage of the sensing interface, increasing background noise [38] [39]. | Progressive loss of sensitivity and binding capacity, leading to a continuous decrease in signal generation over the sensor's lifespan [18]. | Decrease in peak current and a shift in peak potential, distorting the electrochemical response and calibration [41] [42]. |
| Main Mitigation Strategies | Surface modification with antifouling polymers (e.g., PEG, zwitterionic), hydrogels, or self-assembled monolayers (SAMs) [38]. | Immobilization optimization, stabilization additives, and storage in controlled environments (pH, temperature) [18]. | Use of disposable electrodes, novel materials (e.g., Boron Doped Diamond), or surface renewal methods (mechanical/electrochemical polishing) [41]. |
| Typical Timescale | Minutes to hours during exposure to complex biofluids [38]. | Days to months, depending on the bioreceptor's intrinsic stability and storage conditions [18]. | Seconds to minutes during electrochemical measurement in fouling-prone solutions [41]. |
Experimental Data and Performance Comparison
Quantitative data from published studies highlight the performance losses attributable to these irreproducibility sources and the efficacy of various countermeasures. The following table summarizes key experimental findings.
Table 2: Experimental Performance Data of Mitigation Strategies
| Mitigation Strategy | Experimental Results | Impact on Reproducibility | Reference |
|---|---|---|---|
| SAML Passivation (vs. non-passivated) | SAML-passivated EGT biosensors retained stable operation in PBS over multiple cycles. Non-passivated devices often short-circuit [43]. | Enabled reproducible measurements over multiple operational cycles without performance decay. | [43] |
| Poly(1,3-DAB/resorcinol) Film (vs. uncoated electrode) | The film maintained a negligible response to interferents like acetaminophen for over 9 months, significantly reducing fouling [44]. | Provided stable performance over extended periods, ensuring reproducible results in complex media like serum. | [44] |
| Boron Doped Diamond Electrode (BDDE) | BDDE exhibits high resistance to passivation compared to conventional glassy carbon or metal electrodes, especially with a hydrogen-terminated surface [41]. | Allows for reliable, repeated measurements in fouling-prone samples without surface renewal, enhancing reproducibility. | [41] |
| Polyethylene Glycol (PEG) Polymer Coating | A DNA biosensor with PEGylated polyaniline nanofibers retained 92.17% of its initial current after incubation in undiluted human serum [38]. | Minimizes signal drift caused by biofouling, leading to more accurate and reproducible detection in real biological samples. | [38] |
Detailed Experimental Protocols for Assessing Irreproducibility
Protocol for Quantifying Biofouling Resistance
This protocol evaluates the effectiveness of antifouling surface modifications using electrochemical impedance spectroscopy (EIS).
- Key Reagents: Fetal Bovine Serum (FBS) or 100% bovine serum, Phosphate Buffered Saline (PBS), Potassium ferrocyanide/ferricyanide ([Fe(CN)₆]³⁻/⁴⁻) redox couple.
- Procedure:
- Baseline Measurement: Record the EIS spectrum of the biosensor in a PBS solution containing 5 mM [Fe(CN)₆]³⁻/⁴⁻. The charge transfer resistance (Rₜ) at this stage is the baseline value.
- Fouling Challenge: Incubate the biosensor in 100% FBS for a predetermined period (e.g., 1 hour) at 37°C.
- Post-Fouling Measurement: Gently rinse the sensor with PBS and record a new EIS spectrum in the same [Fe(CN)₆]³⁻/⁴⁻ solution.
- Data Analysis: Calculate the percentage change in Rₜ. A smaller change indicates superior antifouling properties. As shown in Table 2, a high-performance coating like PEG can help the sensor retain over 92% of its signal after exposure to serum [38].
Protocol for Evaluating Bioreceptor Operational Stability
This protocol tests the functional stability of an immobilized enzyme bioreceptor under repeated use.
- Key Reagents: Substrate solution at a defined concentration (e.g., glucose for glucose oxidase), appropriate buffer.
- Procedure:
- Initial Activity: Measure the biosensor's amperometric response to a standard concentration of its target analyte. Record this initial current (I₀).
- Stability Challenge: Continuously operate the biosensor in a flow of substrate solution or perform repeated measurements (e.g., 20 cycles) over several hours.
- Activity Monitoring: At defined intervals, measure the current response (Iₜ) to the same standard analyte concentration.
- Data Analysis: Calculate the percentage of initial activity remaining (Iₜ/I₀ × 100%). Plot this percentage against time or cycle number to determine the operational half-life of the bioreceptor. The use of stabilizing films, such as poly(1,3-DAB/resorcinol), can significantly extend this half-life [44].
Protocol for Testing Electrode Passivation
This protocol uses cyclic voltammetry (CV) to monitor the passivation of an electrode surface in real-time.
- Key Reagents: A solution of a probe molecule known to cause passivation (e.g., phenol or a neurotransmitter like dopamine) or a complex matrix like urine or wastewater.
- Procedure:
- Initial Scan: Perform multiple CV scans of the electrode in a clean buffer solution until a stable, reproducible voltammogram is obtained.
- Passivation Challenge: Add the probe molecule or complex matrix to the solution.
- Continuous Monitoring: Continue running successive CV scans in the fouling environment.
- Data Analysis: Monitor the decrease in the oxidation/reduction peak current and the shift in peak potential over the number of scans. A passivation-resistant material like BDDE will show minimal change compared to conventional electrodes [41].
Visualizing Mechanisms and Workflows
Biosensor Irreproducibility Mechanisms
The following diagram illustrates the core mechanisms of the three irreproducibility sources covered in this guide.
Experimental Workflow for Passivation Assessment
The diagram below outlines a standardized experimental workflow for assessing electrode passivation using cyclic voltammetry, as described in the protocol.
The Scientist's Toolkit: Essential Reagents and Materials
The following table catalogues key reagents and materials essential for researching and mitigating biosensor irreproducibility.
Table 3: Essential Research Reagents and Materials for Irreproducibility Studies
| Reagent/Material | Function in Research | Application Context |
|---|---|---|
| Polyethylene Glycol (PEG) | A "gold standard" hydrophilic polymer used to create antifouling surfaces that resist nonspecific protein adsorption via hydration and steric effects [38]. | Biofouling Mitigation |
| Zwitterionic Polymers | Biomimetic polymers (e.g., pCBMA, pSBMA) that form strong hydration layers to prevent biofouling, often with superior stability compared to PEG in biochemical solutions [38]. | Biofouling Mitigation |
| Boron Doped Diamond (BDD) Electrode | An electrode material known for its high resistance to surface passivation, allowing for stable measurements in complex or fouling-prone samples [41]. | Electrode Passivation Mitigation |
| Self-Assembled Multilayer (SAML) | A multi-layer molecular structure built through self-assembly (e.g., 1,10-decanedithiol, vinyl-POSS) to effectively passivate and protect electrodes in aqueous environments [43]. | Electrode Passivation & Stability |
| Electropolymerized Films (e.g., poly(1,3-DAB/resorcinol)) | A polymer film formed electrochemically on the electrode surface to serve as a permselective barrier, preventing interference and fouling while stabilizing immobilized enzymes [44]. | Multi-threat Mitigation (Fouling & Degradation) |
| Standard Buffer Solutions (pH 4.01, 7.00, 10.00) | Certified reference standards used for the precise calibration of pH sensors, which is critical for maintaining bioreceptor activity and sensor reproducibility [45]. | Sensor Calibration & Maintenance |
For researchers and drug development professionals, the promise of biosensors is often tempered by the challenges of reproducibility and repeatability. A biosensor's performance in a controlled experiment can differ significantly from its function in complex, real-world biological environments, leading to data variability and hindering clinical translation. This guide objectively compares how two emerging material classes—next-generation nanomaterials and 3D porous scaffolds—are addressing these core challenges. By examining their performance data and the experimental protocols used for validation, this article provides a framework for selecting and implementing material solutions that enhance the reliability of biosensing platforms within your research.
Performance Comparison of Material Solutions
The following tables summarize experimental data for emerging nanomaterials and 3D scaffold strategies, highlighting their performance gains in key metrics relevant to biosensor reproducibility.
Table 1: Performance of Next-Generation Nanomaterials in Biosensing
| Material & Description | Key Performance Advantages | Experimental Data & Context | Impact on Reproducibility/Repeatability |
|---|---|---|---|
| Printable Core-Shell Nanoparticles [46] | Mass production via inkjet printing; Dual function (signal transduction & molecular binding). | High reproducibility and accuracy in monitoring biomarkers; Maintained stability over 1,200 bending cycles [46]. | Enables mass production of uniform sensors, reducing device-to-device variability. |
| Core: Prussian blue analog (PBA) for electrochemical signals. Shell: Molecularly imprinted polymer (MIP) for precise molecular recognition [46]. | |||
| DyCoO3@rGO Nanocomposite [46] | High specific capacitance and exceptional electrical conductivity; Forms a stable 3D hybrid structure. | Achieved a peak specific capacitance of 1418 F/g and maintained performance over 5,000 charge-discharge cycles [46]. | Enhanced signal stability and device longevity for electrochemical sensors, ensuring consistent readings over time. |
| A 3D hybrid combining DyCoO3 perovskite with reduced graphene oxide (rGO) [46]. | |||
| Zwitterionic Peptide-Coated Porous Silicon (PSi) [47] | Superior antibiofouling properties against proteins and cells in complex biofluids. | More than an order of magnitude improvement in the limit of detection and signal-to-noise ratio over conventional PEG coatings [47]. | Mitigates nonspecific binding, a major source of signal drift and false positives, thereby improving data fidelity. |
| PSi biosensor coated with a sequence (EKEKEKEKEKGGC) to resist fouling [47]. |
Table 2: Performance of 3D Porous Scaffolds in Biosensing and Cell Monitoring
| Scaffold Platform & Description | Key Functional Advantages | Experimental Data & Context | Impact on Reproducibility/Repeatability |
|---|---|---|---|
| NDGA-Crosslinked Collagen Scaffold [48] | Enhanced biocompatibility and stable porous structure for implantable sensors. | In vivo study showed higher sensitivity and reduced inflammation compared to glutaraldehyde-crosslinked scaffolds over 28 days [48]. | Improves in vivo sensor lifetime and signal consistency by minimizing the foreign body response, a key variable. |
| A biostable, porous collagen scaffold crosslinked with nordihydroguaiaretic acid (NDGA) for implantable glucose sensors [48]. | |||
| Stretchable 3D GRGD/Au NTs/PDMS Scaffold [49] | Integrates 3D cell culture, mechanical loading, and real-time electrochemical sensing. | Successfully monitored nitric oxide release from chondrocytes within seconds of applying mechanical stretch [49]. | Provides a reproducible platform for studying dynamic cellular responses, minimizing the need for endpoint assays and their inherent variability. |
| A porous, elastic polydimethylsiloxane (PDMS) scaffold with peptide-linked gold nanotube networks serving as the sensing element [49]. | |||
| Optimized Gelatin Bioink for 3D Bioprinting [50] | High printability and precision for fabricating complex 3D scaffold architectures. | A Fuzzy Inference System (FIS) optimized parameters to achieve high printability with bioinks containing up to 30 million cells/mL [50]. | Ensures the precise and repeatable fabrication of scaffold-based biosensors and 3D cell culture models. |
Experimental Protocols for Key Studies
Protocol: Fabrication and Testing of Zwitterionic PSi Biosensors
This protocol is adapted from research focused on combating biofouling to improve sensor reliability in complex fluids [47].
- PSi Substrate Preparation: Create a PSi thin film via electrochemical anodization of a silicon wafer.
- Surface Functionalization: Covalently immobilize the zwitterionic peptide (EKEKEKEKEKGGC) onto the PSi surface. The cysteine (C) residue at the C-terminus facilitates anchoring via a thiol bond.
- Aptasensor Fabrication (for specific detection): Immobilize a lactoferrin-specific aptamer onto the peptide-passivated PSi surface.
- Antibiofouling Validation:
- Expose the functionalized PSi to complex biofluids (e.g., gastrointestinal fluid, bacterial lysate).
- Use optical interferometry or similar techniques to quantify non-specific adsorption of biomolecules. Compare against unmodified PSi and PEGylated PSi controls.
- Sensing Performance Test:
- Measure the reflectance spectrum of the PSi aptasensor.
- Introduce lactoferrin at clinically relevant concentrations.
- Monitor the shift in the reflectance spectrum caused by the binding of the target to the aptamer within the protected, antifouling environment.
Protocol: Real-Time Monitoring of Mechanotransduction in a 3D Scaffold
This protocol outlines the methodology for using a multifunctional scaffold to capture dynamic cellular responses, a process often plagued by low temporal resolution and endpoint variability [49].
- Scaffold Fabrication:
- Replicate a porous, elastic PDMS scaffold from a nickel foam template.
- Synthesize a network of gold nanotubes (Au NTs) on the PDMS skeleton via galvanic displacement of silver nanowires.
- Functionalize the Au NTs with a cell-adhesion peptide (GRGD) via thioglycolic acid (TGA) crosslinker to create a biomimetic surface (GRGD/Au NTs/PDMS).
- Cell Seeding and Culture: Seed chondrocytes (or other mechanosensitive cells) onto the 3D scaffold and culture until a stable 3D cell network is established, mimicking native tissue.
- Integrated Stimulation and Sensing:
- Mount the cell-laden scaffold in a stretching device integrated with an electrochemical workstation.
- Apply controlled, cyclical tensile strain (e.g., 10% elongation) to the scaffold to mimic physiological mechanical loading.
- Simultaneously, use the Au NT network as a working electrode to perform amperometric or voltammetric measurements in real-time, monitoring the release of signaling molecules like nitric oxide (NO).
Signaling Pathways and Workflows
The following diagram illustrates the integrated experimental workflow for the 3D stretchable scaffold, highlighting how material design enables direct, real-time observation of cellular activity.
Integrated Workflow of a 3D Stretchable Biosensing Scaffold
The Scientist's Toolkit: Essential Research Reagents and Materials
Table 3: Key Research Reagents and Materials for Advanced Biosensor Development
| Item | Function in Research | Specific Example & Rationale |
|---|---|---|
| Molecularly Imprinted Polymers (MIPs) | Serve as synthetic, stable biorecognition elements on nanoparticles for target binding. [46] | A MIP shell made of nickel hexacyanoferrate on a nanoparticle core creates a printable, target-specific sensing interface. [46] |
| Zwitterionic Peptides | Coating material to create an antifouling surface on biosensors, resisting non-specific protein and cell adsorption. [47] | The sequence EKEKEKEKEKGGC on porous silicon provides broad-spectrum protection, outperforming PEG in complex biofluids. [47] |
| Gold Nanotubes (Au NTs) | Form a conductive, nanostructured network on 3D scaffolds that acts as a transducer for electrochemical sensing. [49] | Au NTs on porous PDMS provide a high-surface-area electrode that remains stable and sensitive under mechanical deformation. [49] |
| Reduced Graphene Oxide (rGO) | Enhances electrical conductivity and structural stability in nanocomposite electrodes. [46] | Combining rGO with DyCoO3 perovskite creates a 3D hybrid material with high specific capacitance and long-term cycling stability. [46] |
| Functional Bioinks (e.g., Gelatin-based) | Used in extrusion bioprinting to fabricate complex, cell-laden 3D scaffold architectures. [50] | Gelatin bioinks, optimized via computational models, enable high-precision printing of scaffolds with high cell density. [50] |
| Nordihydroguaiaretic Acid (NDGA) | A crosslinking agent for biological scaffolds (e.g., collagen) that improves biostability and biocompatibility. [48] | NDGA-crosslinked collagen scaffolds around implants reduce inflammation and improve long-term sensor function in vivo. [48] |
The development of reliable biosensors represents a cornerstone of modern analytical chemistry, with profound implications for medical diagnostics, environmental monitoring, and drug development. A significant obstacle limiting their widespread adoption, however, lies in the challenge of systematic optimization. Traditional one-variable-at-a-time (OVAT) approaches to biosensor development are inherently inefficient and often fail to detect critical interactions between multiple factors that collectively determine analytical performance [51]. Within this context, Design of Experiments (DoE) emerges as a powerful chemometric tool that enables researchers to efficiently navigate complex, multidimensional experimental spaces by systematically varying multiple factors simultaneously according to a predetermined statistical plan [52] [53].
The application of DoE is particularly crucial when viewed through the lens of evaluating biosensor reproducibility and repeatability. Repeatability, defined as the capacity to obtain consistent results under identical conditions, and reproducibility, the ability to achieve consistent results across different operators, instruments, and laboratories, are fundamental indicators of analytical quality [54]. Studies have revealed that more than 70% of researchers have encountered failures in reproducing other scientists' experiments, highlighting a critical trustworthiness gap in scientific research [54]. By implementing DoE methodologies, researchers can develop more robust biosensing systems whose performance is less susceptible to minor variations in manufacturing or operational conditions, thereby directly addressing these reproducibility challenges and accelerating the translation of biosensors from research laboratories to commercial point-of-care applications [51].
Theoretical Foundations: Core Chemometric Principles for Experimental Design
Fundamental DoE Concepts and Terminology
Design of Experiments operates on several key principles that distinguish it from traditional OVAT approaches. The methodology relies on the deliberate and structured variation of input factors (independent variables) to observe and quantify their effect on one or more response variables (outputs or performance metrics) [51]. Unlike happenstance data collected from standard protocols, DoE requires the collection of causal data across a comprehensive grid of experiments covering the entire experimental domain defined by the selected factor ranges [51]. This approach enables the construction of a data-driven mathematical model, typically via linear regression, that elucidates the relationship between experimental conditions and the measured responses, allowing for prediction of system behavior throughout the experimental domain [51].
A particularly powerful aspect of DoE is its ability to detect and quantify factor interactions—situations where the effect of one independent variable on the response depends on the value of another independent variable [51]. Such interactions consistently elude detection in OVAT approaches but are frequently critical determinants of biosensor performance. The model's coefficients are computed using the least squares method, enabling prediction of the response at any point within the experimental domain, including locations where experiments were not directly conducted [51].
The arrangement of experimental points used to explore the spectrum of factors is determined based on the hypothesized mathematical model relating the response to the experimental conditions. Several designs have been established for different experimental objectives:
Full Factorial Designs: These are first-order orthogonal designs requiring 2^k experiments, where k represents the number of variables being studied [51]. In these designs, each factor is assigned two levels (typically coded as -1 and +1) corresponding to the lower and upper bounds of the variable's range. For example, a 2^2 factorial design investigating two factors (X1 and X2) would require four experiments run at the following coded condition combinations: (-1, -1), (+1, -1), (-1, +1), and (+1, +1) [51]. From a geometric perspective, the experimental domain for two factors is a square, for three factors a cube, and for higher numbers of factors, a hypercube.
Central Composite Designs: When the response follows a quadratic function with respect to the experimental variables, second-order models become necessary [51]. Central composite designs can augment initial factorial designs by adding additional points (center points and axial points) to allow estimation of quadratic terms, thereby enhancing the predictive capacity of the model [52].
Mixture Designs: These specialized designs are used when the factors under investigation are components of a mixture and therefore cannot be varied independently [51]. The inherent constraint is that the combined total of all components must equal 100%, meaning that changing the proportion of one component necessitates proportional adjustments to the others [51].
Table 1: Comparison of Common Experimental Designs Used in Biosensor Optimization
| Design Type | Model Order | Number of Experiments | Key Applications | Advantages |
|---|---|---|---|---|
| Full Factorial | First-order | 2^k (where k = factors) | Initial screening of important factors | Estimates all main effects and interactions |
| Central Composite | Second-order | 2^k + 2k + cp (cp = center points) | Response surface modeling; finding optimal conditions | Can model curvature in the response |
| Box-Behnken | Second-order | Fewer than central composite for k ≥ 3 | Response surface modeling when classical designs too large | Economical for 3-5 factors |
| Mixture Designs | Various | Varies by design type | Optimizing composition of reagents, materials | Accounts for mixture constraints |
Practical Implementation: DoE Methodologies for Enhanced Biosensor Performance
Case Study: Optimization of a Whole-Cell Biosensor Using DoE
A compelling example of DoE application in biosensor development comes from the optimization of a whole-cell biosensor responsive to protocatechuic acid (PCA), a catabolic breakdown product of lignin biomass [53]. Researchers faced the challenge of optimizing multiple genetic factors simultaneously: the expression levels of the regulatory components (the PCA-responsive allosteric transcription factor PcaV), and the reporter gene output. Using a Definitive Screening Design—a type of DoE that efficiently explores multidimensional space with minimal experimental runs—the team systematically modified the biosensor's dose-response behavior by varying promoter strengths and ribosome binding sites (RBS) [53].
The experimental matrix incorporated different combinations of genetic elements with varying expression strengths, with each combination represented as a discrete point in the multidimensional experimental space. The results demonstrated the power of this approach: the optimized biosensors showed dramatically enhanced performance with up to a 30-fold increase in maximum signal output, a >500-fold improvement in dynamic range (the ratio of ON to OFF states), and a >1500-fold increase in sensitivity compared to the original construct [53]. Importantly, the DoE approach also enabled the modulation of the biosensor's response curve, yielding designs with both digital (switch-like) and analog (graded) dose-response behaviors suitable for different applications [53].
Experimental Protocol: Implementing a Factorial Design for Biosensor Optimization
For researchers implementing DoE for biosensor development, the following protocol provides a generalized framework:
Problem Formulation and Factor Selection: Identify all factors that may exhibit a causality relationship with the targeted biosensor performance metrics (responses). In biosensor optimization, common factors include bioreceptor immobilization density, blocking agent concentration, incubation time, temperature, and pH [51].
Experimental Domain Definition: Establish appropriate ranges for each factor based on preliminary experiments or literature values. The selection of these ranges is critical—they should be sufficiently wide to detect meaningful effects but not so wide as to render experiments uninformative.
Experimental Matrix Construction: Based on the selected design (e.g., full factorial, central composite), construct the experimental matrix defining the specific conditions for each experimental run. For a 2^2 factorial design, this would consist of four experiments as shown in Table 2.
Table 2: Experimental Matrix for a 2^2 Factorial Design Investigating Biosensor Fabrication Parameters
| Test Number | X1: Immobilization Time (hours) | X2: Bioreceptor Concentration (mg/mL) | Response: Signal Intensity (a.u.) |
|---|---|---|---|
| 1 | -1 (1 hour) | -1 (0.5 mg/mL) | To be measured |
| 2 | +1 (4 hours) | -1 (0.5 mg/mL) | To be measured |
| 3 | -1 (1 hour) | +1 (2.0 mg/mL) | To be measured |
| 4 | +1 (4 hours) | +1 (2.0 mg/mL) | To be measured |
Randomized Experiment Execution: Conduct experiments in random order to mitigate the introduction of unwanted systematic effects from external factors [51].
Data Collection and Model Building: Record responses for each experimental run and use linear regression to construct a mathematical model relating the factors to the responses. For a 2^2 factorial design, the model would take the form: Y = b0 + b1X1 + b2X2 + b12X1X2, where b0 represents the constant term, b1 and b2 the main effects of factors X1 and X2, and b12 their interaction effect [51].
Model Validation and Optimization: Validate the model's predictive capability by comparing predicted and actual responses at additional points within the experimental domain. Use the model to identify optimal factor settings that maximize desired biosensor performance characteristics.
Diagram 1: DoE Implementation Workflow for Biosensor Optimization. This flowchart illustrates the iterative nature of the DoE process, where model validation may necessitate a return to earlier steps.
Complementary Chemometric Tools: Multivariate Regression and Classification
While DoE provides a powerful framework for optimization, its utility is often enhanced when combined with other chemometric tools for data analysis, particularly when dealing with complex biosensor systems with multivariate responses. Partial Least Squares (PLS) regression is a method of multivariate calibration that relates multivariate biosensor responses to analyte concentration values or other sample properties of interest [55]. Unlike ordinary least squares regression, PLS can extract useful chemical information from noisy, overlapped, or otherwise distorted analytical signals by projecting the data into a space where the variance in response is correlated with the variance in the calibration values [55].
For classification tasks, Principal Component Analysis (PCA) provides valuable visualization of multivariate data by projecting initial data points from multivariate space into a lower-dimensional space formed by principal components (PCs) [55]. Similar samples appear as neighboring points in PCA score plots, while dissimilar samples are separated, enabling researchers to assess the ability of biosensor arrays to distinguish between different sample types [55]. More advanced pattern recognition techniques such as Artificial Neural Networks (ANNs) have also been successfully deployed in conjunction with biosensor arrays to discriminate between different analytes in complex mixtures, such as the simultaneous detection and resolution of organophosphorus and carbamate insecticides using multiple enzyme variants [56].
Comparative Analysis: DoE Versus Traditional Optimization Approaches
Quantitative Performance Comparison
The advantages of DoE over traditional OVAT approaches can be quantified across multiple performance dimensions. In the development of whole-cell biosensors for detecting aromatic compounds, the implementation of DoE methodologies resulted in remarkable performance enhancements as summarized in Table 3.
Table 3: Performance Enhancement Through DoE Implementation in Whole-Cell Biosensor Development
| Performance Metric | Traditional Approach | DoE-Optimized System | Enhancement Factor |
|---|---|---|---|
| Maximum Signal Output | Baseline | 30-fold increase | 30x |
| Dynamic Range (ON/OFF) | Baseline | >500-fold improvement | >500x |
| Sensing Range | Limited range | ~4 orders of magnitude expansion | Significant |
| Sensitivity | Baseline | >1500-fold increase | >1500x |
| Experimental Efficiency | Requires testing all combinations | Minimal runs to map space | Highly efficient |
These performance improvements stem directly from DoE's ability to efficiently map complex experimental spaces and identify non-intuitive factor interactions that would remain undetected with OVAT approaches. The resource efficiency of DoE is equally noteworthy—by employing structured experimentation, researchers can explore the effects of multiple factors and their interactions with significantly fewer experimental runs than would be required using traditional approaches [53].
Impact on Reproducibility and Repeatability
The systematic nature of DoE directly addresses key challenges in biosensor reproducibility and repeatability. A fundamental principle of analytical chemistry states that measurements must be both repeatable (same result under identical conditions) and reproducible (consistent results across different operators, instruments, and locations) to be considered reliable [54]. DoE enhances both attributes by identifying optimal factor settings that are robust to minor variations in manufacturing or operational conditions.
Research on hand-held quantitative G6PD diagnostics demonstrates the importance of assessing both repeatability (precision under constant conditions) and reproducibility (precision across different conditions such as devices, operators, and sites) [4]. When evaluating the performance of biosensors, it was found that while single-laboratory testing showed good correlation with reference methods (rs = 0.859, p<0.001), inter-laboratory reproducibility often showed lower correlation (rs = 0.604, p<0.001) [8]. This highlights the critical need for optimization approaches like DoE that explicitly account for the multifactorial nature of such performance variations, ultimately leading to biosensor designs whose performance is more consistent across different implementation contexts.
Essential Research Reagents and Materials for DoE Implementation
Successful implementation of DoE in biosensor development requires careful selection of research reagents and materials. The following table summarizes key solutions and their functions in typical biosensor optimization studies:
Table 4: Essential Research Reagent Solutions for Biosensor Development and Optimization
| Reagent/Material | Function | Application Example |
|---|---|---|
| Lyophilized Controls | Standardized samples with known activity | Assessing repeatability and reproducibility [4] |
| Enzyme Variants | Differing sensitivity patterns | Discrimination of analyte mixtures [56] |
| Biolayer Components | Specific recognition of target molecules | Optimizing biosensor design for improved transduction [51] |
| Chromogenic Substrates | Visual signal generation | Colorimetric detection of analytes [4] |
| Blocking Agents | Minimize nonspecific binding | Improving biosensor selectivity [51] |
| Immobilization Matrices | Stabilize bioreceptor elements | Enhancing biosensor lifetime and stability [51] |
Diagram 2: Modular Architecture of a Biosensor System. The bioreceptor provides specificity, the transducer converts the biological event into a measurable signal, and the output interfaces with detection instrumentation.
The integration of Design of Experiments as a systematic optimization framework represents a paradigm shift in biosensor development that directly addresses critical challenges in reproducibility and repeatability. By enabling efficient exploration of complex multidimensional factor spaces and revealing non-intuitive factor interactions, DoE empowers researchers to develop biosensors with enhanced performance characteristics including superior sensitivity, dynamic range, and most importantly, robustness across different operational environments. When complemented by other chemometric tools such as PLS regression, PCA, and artificial neural networks, DoE forms part of a powerful analytical toolkit that can accelerate the translation of biosensor technology from research laboratories to commercial applications in point-of-care diagnostics, environmental monitoring, and drug development.
As the field continues to advance, the adoption of these systematic approaches will be increasingly essential for meeting the rigorous performance standards required for clinical and commercial implementation. The demonstrated ability of DoE to enhance signal output by 30-fold, improve dynamic range by >500-fold, and increase sensitivity by >1500-fold in whole-cell biosensors underscores the transformative potential of these methodologies [53]. By replacing iterative, resource-intensive optimization tactics with structured, statistically informed experimental strategies, researchers can not only improve biosensor performance but also enhance the reliability and trustworthiness of the resulting analytical data—a critical consideration in an era where reproducible research findings are of paramount importance.
The accurate measurement of analytes, particularly in complex biological matrices, is a cornerstone of effective drug development and clinical diagnostics. For biosensors, a significant challenge to accuracy is the presence of electroactive interfering substances that can generate false positive or negative signals, potentially leading to misdiagnosis or incorrect therapeutic decisions [57]. Among the most prevalent and challenging interferents are ascorbic acid (Vitamin C) and acetaminophen (paracetamol), widely consumed substances that are electroactive at the potentials commonly used in biosensing [58] [59]. The core of this challenge lies in the fundamental operating principles of many electrochemical biosensors, which rely on the detection of hydrogen peroxide produced by enzymatic reactions. At the operating potentials required to oxidize hydrogen peroxide (typically +0.6 V to +0.7 V vs Ag/AgCl), these interfering substances are also readily oxidized, producing a current that is indistinguishable from the target analyte signal [57]. This review systematically compares the strategies employed by leading biosensor manufacturers to mitigate these effects, evaluates the supporting experimental data, and situates these technological advances within the broader context of biosensor reproducibility and repeatability research.
Commercially Available Biosensor Systems and Their Labeled Interferents
The approach to managing interferents varies significantly across different commercially available Continuous Glucose Monitoring (CGM) systems, reflecting their underlying biosensor design principles. Table 1 summarizes the interfering substances explicitly identified in the labeling of major CGM systems, providing a clear comparison of their stated limitations and claims.
Table 1: Labeled Interfering Substances for Marketed Continuous Glucose Monitoring (CGM) Systems
| Manufacturer and CGM Model(s) | Interfering Substance | Manufacturer’s Labeling/Claims | Biosensor Generation |
|---|---|---|---|
| Dexcom G6/G7, Dexcom ONE/ONE+, Stelo | Acetaminophen | Taking higher than maximum dosage (e.g., >1000 mg every 6 hours in adults) may increase sensor readings [60]. | First |
| Hydroxyurea | Sensor readings will be higher than actual glucose [60]. | ||
| Medtronic Simplera | Acetaminophen | May falsely raise sensor glucose readings [60]. | First |
| Hydroxyurea | Do not use CGM if hydroxyurea is taken. Results in higher sensor readings [60]. | ||
| Medtronic Guardian Connect with Guardian Sensor 4 | Acetaminophen | Taking medications with acetaminophen may falsely raise sensor glucose readings [60]. | First |
| FreeStyle Libre 2 Plus, FreeStyle Libre 3 Plus | Ascorbic Acid (Vitamin C) | Taking more than 1000 mg of vitamin C per day may falsely raise sensor readings [60]. | Second |
| FreeStyle Libre 2, FreeStyle Libre 3 | Ascorbic Acid | Taking more than 500 mg of vitamin C per day may affect sensor readings [60]. | Second |
| FreeStyle Libre 14 day | Ascorbic Acid | Taking vitamin C may falsely raise sensor readings [60]. | Second |
| Salicylic Acid | May slightly lower sensor glucose readings [60]. | ||
| Senseonics Eversense E3 | Tetracycline | Antibiotics of the tetracycline class may falsely lower sensor glucose readings [60]. | Optical |
| Mannitol/Sorbitol | May falsely elevate readings when administered intravenously [60]. |
An uncritical review of this table might suggest that some CGM devices are less influenced by interfering substances than others. However, this can often reflect the extent of published literature and commercial longevity, with newer systems having less publicly available interference data [60]. This underscores the need for standardized regulatory guidance to ensure adequate and appropriate interfering substance evaluations are performed and the results made publicly available.
Fundamental Biosensor Designs and Their Relationship to Interference
The susceptibility of a biosensor to interferents is fundamentally tied to its electrochemical design. A common classification system categorizes biosensors into generations based on their electron transfer mechanism [60].
First-Generation Biosensors (Dexcom, Medtronic)
First-generation systems employ oxygen as a natural electron acceptor. The glucose oxidase (GOx) enzyme catalyzes the oxidation of glucose, producing hydrogen peroxide (H₂O₂), which is then oxidized at a polarized electrode (typically platinum). The current generated from H₂O₂ oxidation is proportional to the glucose concentration [60]. The high operating potential required for this reaction (+0.6 V to +0.7 V) also readily oxidizes common interferents like ascorbic acid and acetaminophen. To mitigate this, these sensors incorporate sophisticated membrane architectures with permselective layers designed to reduce the flux of interfering substances to the working electrode [60] [57]. For instance, Dexcom's designs feature multiple membranes, including an "interference domain" and a "bioprotective membrane," which are engineered to be selectively permeable [60].
Second-Generation Biosensors (FreeStyle Libre)
Second-generation systems replace oxygen with an artificial, non-physiological redox mediator. This mediator shuttles electrons from the reduced enzyme to the electrode surface. A key advantage is that the mediator can be oxidized at a much lower operating potential, thereby avoiding the electrochemical oxidation of many common interferents [60] [57]. Abbott's FreeStyle Libre systems, which use this design, primarily list ascorbic acid as an interferent, but not acetaminophen, highlighting how a design change alters the interference profile.
Third-Generation Biosensors (Sinocare iCan i3)
Third-generation systems are engineered for direct electron transfer (DET) between the enzyme's redox cofactor and the electrode surface, eliminating the need for both natural and artificial mediators. An example is the Sinocare iCan i3 system, which claims no interference from acetaminophen or vitamin C and no oxygen interference [60]. This represents a significant potential advance in specificity.
Optical Biosensors (Senseonics Eversense)
The Senseonics Eversense system employs a completely different mechanism. It uses a fully implantable subcutaneous sensor that relies on a synthetic glucose-recognition ligand coupled to a fluorescent agent. Changes in glucose concentration alter the fluorescence signal, which is detected by an optical reader worn over the sensor [60]. This non-amperometric approach results in a unique interference profile, with tetracycline antibiotics and intravenous mannitol/sorbitol listed as interferents, but not the common electrochemical interferents.
The logical relationship between biosensor design and interference susceptibility is illustrated below.
Experimental Protocols for Evaluating Biosensor Interference
Robust experimental protocols are essential for reliably assessing a biosensor's susceptibility to interferents. The following section outlines standard methodologies cited in the literature.
Standardized In Vitro Interference Screening
A key protocol involves in vitro testing according to established clinical laboratory standards, such as the EP7-A2 guideline from the Clinical and Laboratory Standards Institute (CLSI) [61]. A typical experiment involves:
- Preparation of Solutions: Preparing solutions with two distinct concentrations of the target analyte (e.g., low and high glucose).
- Spiking with Interferents: Adding potential interferents to these solutions at two different concentrations—one within a physiological or supra-physiological range and another at a higher, stress-test level.
- Measurement and Comparison: Measuring the sensor signal in the spiked solutions and comparing it to the signal in an unspiked control solution with the same analyte concentration.
- Data Analysis: A significant deviation in the sensor signal (e.g., >10% or statistically significant) indicates interference.
This method was used to screen 22 potential interferents for the GlucoMen Day CGM system, which uniquely employs a microdialysis-based sampling method. The study found no significant interference from common substances like ascorbic acid, acetaminophen, and salicylic acid, except for dopamine at very high, non-physiological concentrations [61]. The workflow for such a standardized assessment is detailed below.
In Vivo Validation in Animal Models and Humans
After in vitro screening, promising sensor designs require in vivo validation. A seminal study by Moatti-Sirat et al. (1994) demonstrated this process for a Nafion-coated glucose sensor designed to reduce acetaminophen interference [58].
- Animal Model (Rats): Researchers implanted both a Nafion-coated sensor and a non-Nafion control sensor in each animal. They then infused acetaminophen to achieve a plasma plateau of ~140 μmol/L. The non-Nafion sensors showed a significant current increase (2.0 ± 0.7 nA), while the Nafion sensors showed a markedly reduced signal (0.5 ± 0.3 nA), confirming the membrane's efficacy in vivo [58].
- Human Volunteers: Nafion sensors were implanted subcutaneously in healthy volunteers. After an oral 500 mg dose of acetaminophen (plasma peak: 35 ± 6 μmol/L), no significant change in sensor current was observed. In contrast, the sensor successfully tracked glucose fluctuations during a subsequent oral glucose tolerance test, demonstrating both its specificity and sensitivity in a clinical setting [58].
Assessing Repeatability and Reproducibility
Evaluating the precision of a biosensor under interfering conditions is a critical component of reliability research. A multicenter study on a handheld quantitative G6PD diagnostic (STANDARD G6PD test) provides a template for such an assessment [8].
- Repeatability: Twenty replicate measurements of lyophilized controls with high, intermediate, and low G6PD activity were performed on each of 10 Biosensor devices at a single site. The coefficient of variation (CV) was calculated for each control level, yielding values of 0.111, 0.172, and 0.260, respectively, indicating good repeatability [8].
- Reproducibility (Inter-laboratory): Each of the 10 devices was dispatched to a different laboratory. A single user at each site then performed 40 measurements of each control. While the Biosensor readings between sites did not differ significantly (p=0.436), the correlation with spectrophotometry was lower than in the single-site test, and the device could not reliably discriminate between intermediate and low G6PD activities in the lyophilized specimens [8]. This highlights how reproducibility testing can reveal challenges not apparent in a controlled, single-site repeatability study.
Quantitative Data Comparison of Interference Mitigation Strategies
Table 2 consolidates quantitative data from key studies, allowing for a direct comparison of the performance of various interference mitigation strategies.
Table 2: Quantitative Comparison of Interference Mitigation Strategies from Experimental Studies
| Study / Biosensor System | Interferent Tested | Concentration Tested | Impact on Signal (vs Control) | Mitigation Strategy |
|---|---|---|---|---|
| GlucoMen Day CGM (2012) [61] | Ascorbic Acid, Acetaminophen, Salicylic Acid | Two concentrations (not specified) | No significant interference observed for any common electrochemical interferent. | Microdialysis sampling + Low operating potential + Hydrogen peroxide detection. |
| Nafion-Membrane Sensor (1994) [58] | Acetaminophen | 140 μmol/L (rat in vivo) | ~75% reduction in interferent signal (0.5 nA vs 2.0 nA in non-Nafion sensor). | Composite Nafion membrane as a permselective barrier. |
| Nafion-Membrane Sensor (1994) [58] | Acetaminophen | 35 μmol/L (human in vivo) | No significant change in sensor current after oral dose. | Composite Nafion membrane as a permselective barrier. |
| G6PD Biosensor (2022) [8] | N/A (Precision Study) | Lyophilized Controls | CV for low activity control: 0.260 (repeatability). | Handheld quantitative design. |
| G6PD Biosensor (2022) [8] | N/A (Precision Study) | Lyophilized Controls | Lower correlation with spectrophotometry in inter-lab test (rₛ = 0.604 vs 0.859 at single site). | Handheld quantitative design. |
| Artemether-Lumefantrine Study (2024) [59] | Artemether, Lumefantrine | Various concentrations | Mild interference reported in some glucometers; molecular docking suggested binding interactions. | Varies by glucometer (GOx, GDH-FAD, GDH-PQQ). |
The Scientist's Toolkit: Key Research Reagents and Materials
The experimental work cited relies on a suite of essential reagents and materials. The following table details these key items and their functions in interference research.
Table 3: Essential Research Reagents and Materials for Biosensor Interference Studies
| Reagent / Material | Function in Experimental Protocols |
|---|---|
| Lyophilized Blood Controls | Provide stable, standardized samples with known analyte activity (e.g., G6PD) for precision testing across multiple sites and days [8]. |
| Lithium Heparin Tubes | Act as an anticoagulant for whole blood collection, preserving blood samples for in vitro interference testing [59]. |
| Pure Drug Powders (e.g., Acetaminophen, Ascorbic Acid, Artemether) | Used to create precise stock solutions for spiking blood or buffer samples to study specific interference effects [61] [59]. |
| Permselective Membranes (e.g., Nafion, Poly(phenylene diamine) - PPD) | Key sensor components evaluated for their ability to selectively block interferents while allowing glucose passage. Often applied as a coating on the working electrode [57] [58]. |
| Spectrophotometer | Serves as a reference method for quantifying analyte concentration (e.g., G6PD activity, glucose) against which biosensor performance is benchmarked [8]. |
| Molecular Docking Software (e.g., Schrödinger Suite) | Computational tool used to model and predict the binding interactions between potential interferents (e.g., artemether) and the enzyme's active site (e.g., GOx, GDH), providing a theoretical mechanism for observed interference [59]. |
The mitigation of interferents like ascorbic acid and acetaminophen remains a dynamic and critical field in biosensor development. Strategies have evolved from the use of simple outer membranes to sophisticated designs involving low-potential mediators, direct electron transfer, and entirely optical sensing modalities. The experimental data clearly shows that while no system is entirely free from potential interference, modern designs have significantly improved specificity. A critical insight from reproducibility research is that a sensor's performance, including its resistance to interferents, must be validated not only under controlled repeatability conditions but also across the broader, more variable conditions of real-world reproducibility. This ensures that the strategies developed in the laboratory translate into reliable and trustworthy performance in the hands of clinicians and researchers, ultimately supporting accurate diagnostic and therapeutic decisions.
Proving Performance: Validation Frameworks and Benchmarking Against Gold Standards
Developing a Validation Master Plan for Broad-Spectrum and Single-Analyte Biosensors
The translation of biosensors from research laboratories to clinical and commercial settings hinges on robust validation frameworks that ensure reliability, accuracy, and consistency. For single-analyte biosensors, which detect a specific target, and broad-spectrum biosensors, capable of identifying diverse analytes using a unified platform, the validation requirements differ significantly [62]. This guide objectively compares the validation performance of these two biosensor classes, focusing on reproducibility (precision under varying conditions) and repeatability (precision under constant conditions) [4]. Framed within a broader thesis on biosensor replicability, this document provides researchers, scientists, and drug development professionals with a structured approach to developing a comprehensive Validation Master Plan (VMP). The critical importance of such rigorous validation is highlighted by the fact that false positives and negatives can still occur even in AI-powered biosensors, with significant potential implications in clinical medicine [6].
Comparative Performance Data: Broad-Spectrum vs. Single-Analyte Biosensors
Performance validation requires quantifying key metrics across different biosensor architectures. The data below summarizes comparative findings for single-analyte and broad-spectrum biosensors from recent studies.
Table 1: Performance Comparison of Representative Biosensors
| Biosensor Type | Specific Technology | Target Analyte / Class | Key Performance Metrics | Inter-Assay CV | Reference |
|---|---|---|---|---|---|
| Single-Analyte | SiP MRR with polydopamine/spotting | Spike protein (1 µg mL⁻¹) | Signal improved 8.2x vs. flow-based | < 20% | [63] |
| Single-Analyte | Handheld electrochemical (STANDARD G6PD) | G6PD Enzyme Activity | High correlation with spectrophotometry (rₛ=0.859) | CVs: 0.111 (High), 0.172 (Int.), 0.260 (Low) | [4] |
| Broad-Spectrum | PCR/ESI-MS (Conserved site PCR) | Universal Bacterial Detection | Breadth limited by primer design | Requires representative analyte validation | [62] |
| Broad-Spectrum | 16S ribosomal gene sequencing | Universal Bacterial Identification | Identification via bioinformatic signature-matching | Defined by database and algorithm fidelity | [62] |
The data illustrates a fundamental distinction: the reproducibility of single-analyte biosensors is typically quantified using traditional metrics like Coefficient of Variation (CV), whereas for broad-spectrum biosensors, reproducibility is inherently linked to the breadth of coverage and the fidelity of its bioinformatic identification system [62].
Experimental Protocols for Assessing Repeatability and Reproducibility
Protocol for Single-Analyte Biosensor Validation
The following detailed protocol is adapted from a study on the repeatability and reproducibility of a handheld quantitative G6PD diagnostic [4].
- Aim: To determine the repeatability (intra-assay precision) and reproducibility (inter-device, inter-operator, inter-site precision) of a quantitative G6PD biosensor.
- Materials:
- Test Device: STANDARD G6PD Biosensor (SD Biosensor) and single-use test strips.
- Sample Type: Commercial lyophilized human blood controls reconstituted to specified G6PD activity levels (categorized as High, Intermediate, and Low).
- Reference Method: Spectrophotometry (Pointe Scientific) as the reference standard.
- Equipment: Pipettes, timers, and data recording sheets.
- Procedure:
- Phase A: Intra-Site Repeatability & Inter-Device Reproducibility
- A single trained technician tests each of the three control levels 20 times on each of 10 different Biosensor devices.
- All testing is performed in a single laboratory under identical environmental conditions.
- Results are compared against spectrophotometry readings for the same controls.
- Phase B: Inter-Laboratory Reproducibility
- Ten identical Biosensor devices are dispatched to 10 different participating laboratories.
- A single technician at each site, who has received a standardized one-hour online training, tests each control 40 times.
- All sites follow an identical, pre-defined protocol.
- Phase A: Intra-Site Repeatability & Inter-Device Reproducibility
- Data Analysis:
- Calculate the mean, standard deviation, and Coefficient of Variation (CV) for each control level at each site and across all sites.
- Use Spearman's rank correlation (rₛ) to assess the relationship between Biosensor readings and spectrophotometry.
- Apply Kruskal-Wallis tests to evaluate the significance of differences in readings between sites.
This study demonstrated that the Biosensor's measurements did not differ significantly across devices or sites, indicating high reproducibility, whereas the reference spectrophotometry readings showed marked inter-site variation [4].
Protocol for Broad-Spectrum Biosensor Validation
The generalized protocol for broad-spectrum biosensors focuses on its unique "general" nature, as outlined for nucleic acid-based systems [62].
- Aim: To validate the detection sensitivity and identification accuracy of a broad-spectrum biosensor across its entire claimed range of coverage.
- Materials:
- Test Device: The broad-spectrum biosensor platform (e.g., PCR/ESI-MS, sequencing platform).
- Sample Type: A panel of nucleic acids or other relevant signatures from a representative subset of organisms spanning the biosensor's detectable range (e.g., different bacterial genera for a universal bacterial sensor).
- Reference Method: Gold-standard identification methods (e.g., culture, specific PCR) for each organism in the panel.
- Procedure:
- Define Breadth of Coverage: Bioinformatic analysis establishes the theoretical range of detectable organisms based on the conserved elements targeted (e.g., 16S rRNA gene primers).
- Analyte Testing: The representative panel of analytes is processed using the standardized, non-specific reagents and protocols of the biosensor.
- Signature Analysis & Identification: The generated signals (e.g., mass spectra, sequence reads) are processed by the platform's bioinformatic algorithms and matched against a pre-computed signature database for identification.
- Reporting Filter Application: Results are passed through defined reporting filters (e.g., cut-offs for contaminants, pathways for biothreat agents) to generate the final report.
- Data Analysis:
- Sensitivity (Limit of Detection): Determined using the representative analytes and expressed as the lowest concentration reliably detected across the group.
- Specificity (Identification Accuracy): Assessed by the accuracy of bioinformatic signature matching against the reference database for all tested analytes.
- The performance metrics (sensitivity, specificity) derived from the representative subset are considered indicative of the biosensor's performance for all organisms within its designed breadth of coverage [62].
Visualizing Validation Workflows
The fundamental difference in validation philosophy between the two biosensor types can be visualized as distinct workflows.
Single-Analyte Biosensor Validation
The validation of a single-analyte biosensor is a linear process focused on a single target, with reproducibility assessed across multiple physical instances of the assay.
Broad-Spectrum Biosensor Validation
In contrast, the validation of a broad-spectrum biosensor is a parallel process that relies on testing a representative subset of analytes to infer performance across the entire spectrum.
The Scientist's Toolkit: Essential Reagents and Materials
Successful execution of validation protocols depends on key research reagents and materials. The following table details critical components for biosensor validation, drawing from the experimental contexts provided.
Table 2: Key Research Reagent Solutions for Biosensor Validation
| Item | Function in Validation | Example from Context |
|---|---|---|
| Lyophilized Controls | Provide stable, standardized samples with known analyte activity for precision testing across devices and sites. | Commercial human blood controls for G6PD activity (High, Intermediate, Low) [4]. |
| Functionalization Reagents | Immobilize bioreceptors onto the sensor surface; chemistry choice critically impacts signal and variability. | Polydopamine vs. Protein A for antibody immobilization on SiP biosensors [63]. |
| Surfactant Solutions | Mitigate bubble formation in microfluidic channels, a major source of operational instability and variability. | Used in microchannel pre-wetting for SiP biosensor bubble mitigation [63]. |
| Bioinformatic Databases | Curated libraries of digital signatures enabling identification in broad-spectrum biosensors. | Pre-computed signature database for organism identification via BLAST or similar tools [62]. |
| Reference Method Kits | Gold-standard assays used as a benchmark to validate the accuracy of the new biosensor. | Spectrophotometry kit for quantitative G6PD measurement [4]. |
Developing a Validation Master Plan for biosensors requires a strategic approach tailored to the technology's inherent design. For single-analyte biosensors, the VMP must emphasize rigorous, traditional statistical analysis of precision and accuracy against a reference method, focusing on controlling physical and operational variables [4]. For broad-spectrum biosensors, the VMP must prioritize the validation of its universal process and the bioinformatic pipeline, establishing performance through a representative subset of analytes to support claims of generalizability [62]. Ultimately, a well-constructed VMP is not merely a regulatory hurdle but a crucial roadmap that builds foundational confidence in biosensor data, thereby accelerating the translation of these promising technologies from research into reliable clinical and commercial applications.
The evaluation of diagnostic technologies hinges on their performance relative to established benchmarks. For decades, enzyme-linked immunosorbent assay (ELISA) and polymerase chain reaction (PCR) have served as cornerstone methodologies in clinical and research laboratories for detecting proteins and nucleic acids, respectively. This guide provides an objective comparison of these conventional methods against emerging biosensor platforms, with a particular focus on the critical parameters of reproducibility and repeatability. The analysis is structured to assist researchers, scientists, and drug development professionals in making informed decisions by providing structured quantitative data, detailed experimental protocols, and clear visualizations of the technological landscape and operational workflows.
Established methods like ELISA and PCR are characterized by well-understood protocols and robust instrumentation, whereas emerging biosensor platforms often leverage nanomaterials and novel transduction mechanisms to achieve gains in sensitivity and speed.
Table 1: Comparative Analysis of Established and Emerging Detection Technologies
| Technology | Typical Detectable Range | Key Advantages | Inherent Limitations | Common Applications |
|---|---|---|---|---|
| Standard Sandwich ELISA [64] [65] | 1 - 100 pg/mL (Protein A ELISA LOD: 9.0 pg/mL) [66] | High specificity (two antibodies); Cost-effective; Simple data interpretation [64] [65] | Limited sensitivity; Lower throughput; Requires relatively large sample volumes (~100 µL) [64] | Protein quantification in serum, plasma, cell lysates [65] |
| Advanced ELISA (IQELISA, SIMOA) [64] | IQELISA: ~23x more sensitive than sELISA; SIMOA: Femtomolar (10 fg/mL - 1 pg/mL), ~465x more sensitive than sELISA [64] | Ultra-high sensitivity (esp. SIMOA); Low sample volume (IQELISA: 10-25 µL) [64] | High cost; Specialized instrumentation; Technical expertise required [64] | Detection of low-abundance biomarkers; Limited sample volume studies [64] |
| RT-PCR [67] [68] | Detects down to ~17 zM ( nucleic acids); ~1 copy per 100 μL [69] | Extremely high sensitivity and specificity; Considered gold standard for nucleic acid detection [67] [68] | Requires specialized equipment and trained staff; Lengthy process; Expensive for large volumes [67] [68] | Detection of viral RNA (e.g., SARS-CoV-2), bacterial DNA, genetic biomarkers [67] |
| Field-Effect Transistor (FET) Biosensors [69] | Proteins: ~20 zM in buffer; Nucleic Acids: 17 zM in buffer [69] | Ultrahigh sensitivity; Label-free detection; Potential for portability and real-time monitoring [69] | Challenging to commercialize; Susceptible to Debye screening in physiological ionic strength [69] | Point-of-care diagnostics; Continuous monitoring of biomarkers [69] |
| Aptamer-based Electrochemical Biosensors (AEBs) [70] | Femtomolar (fM) to attomolar (aM) range [70] | High specificity and sensitivity; Aptamers offer stability and ease of synthesis; Real-time detection [70] | Susceptibility to nuclease degradation; Sample matrix effects can cause interference [70] | Cancer biomarker detection (e.g., PSA, CEA); Cardiovascular and infectious disease diagnosis [70] |
The performance gap between conventional and emerging methods is clearly demonstrated in real-world applications. For instance, in meat species authentication, real-time PCR demonstrated significantly higher sensitivity than a USDA-approved ELISA method, consistently detecting pork at 1.0% w/w in ground meat mixtures where ELISA failed below 10.0% w/w [71]. Similarly, during the COVID-19 pandemic, RT-PCR maintained its status as the gold standard for viral RNA detection due to its high sensitivity and specificity, while rapid antigen tests (a form of immunoassay) offered speed but with lower sensitivity [67] [68].
Experimental Protocols for Key Assays
Principle: A capture antibody is immobilized on a microplate. The target antigen in the sample binds to this antibody and is subsequently "sandwiched" by an enzyme-conjugated detection antibody. A substrate is added, producing a colorimetric signal proportional to the antigen concentration [65].
Detailed Workflow:
- Coating: Coat a 96-well microtiter plate with a specific capture antibody (monoclonal or polyclonal). Incubate, then wash to remove excess antibody.
- Blocking: Add a blocking buffer (e.g., containing BSA or protein) to cover any unsaturated binding sites on the plate to prevent non-specific binding. Incubate and wash.
- Sample & Standard Incubation: Add the sample (serum, plasma, lysate) and a dilution series of the standard (calibrator) to the wells. During incubation, the target antigen binds to the immobilized capture antibody. Wash.
- Detection Antibody Incubation: Add a detection antibody that is conjugated to an enzyme (e.g., Horseradish Peroxidase, HRP). This antibody binds to a second epitope on the captured antigen, forming the "sandwich". Incubate and wash thoroughly.
- Substrate Addition: Add an enzyme-specific substrate (e.g., TMB for HRP). The enzyme catalyzes a reaction that produces a color change.
- Signal Measurement & Analysis: Stop the reaction with acid and measure the absorbance (optical density) at a specific wavelength (e.g., 450 nm) using a microplate reader. Generate a standard curve from the calibrators and interpolate the sample concentrations [65].
Principle: This method combines the principles of nucleic acid hybridization with ELISA-based detection to identify genomic DNA without amplification.
Detailed Workflow:
- DNA Extraction & Denaturation: Extract genomic DNA from the sample (e.g., bacterial culture). Denature the DNA using an alkaline solution (e.g., containing NaOH) to produce single-stranded DNA.
- Hybridization: Mix the denatured DNA with two specific probes:
- A biotin-labelled capture probe that hybridizes to a specific sequence of the target gene (e.g., 16s rRNA of E. coli).
- A digoxigenin (dig)-labelled detector probe that hybridizes to an adjacent region of the same target gene.
- Immobilization: Transfer the hybridization mixture to a streptavidin-coated microplate. The biotin on the capture probe binds to streptavidin, immobilizing the entire hybrid complex.
- Enzyme Conjugate Binding: After washing, add an HRP-conjugated anti-digoxigenin antibody (HRP-anti-dig). This binds to the dig-labelled detector probe.
- Signal Detection & Measurement: Add a substrate for HRP (e.g., ABTS). The resulting color change, measured by absorbance at 405 nm, indicates the presence of the target DNA [72].
Principle: Viral RNA is first reverse transcribed into complementary DNA (cDNA), which is then amplified exponentially using target-specific primers and a DNA polymerase. The accumulation of amplified DNA is monitored in real-time using fluorescent probes.
Detailed Workflow:
- Sample Collection & RNA Extraction: Collect patient sample (e.g., nasopharyngeal swab). Extract and purify total RNA from the sample.
- Reverse Transcription (RT): Mix the extracted RNA with reverse transcriptase enzyme, primers (often random hexamers or gene-specific), and nucleotides to synthesize cDNA.
- Real-time PCR Amplification: Combine the cDNA with a PCR master mix containing:
- Thermostable DNA polymerase (e.g., Taq polymerase).
- Target-specific forward and reverse primers (e.g., targeting viral genes like RdRp, E, S, or N).
- A target-specific fluorescent probe (e.g., TaqMan probe).
- Nucleotides and buffer.
- Thermal Cycling & Fluorescence Detection: Run the plate in a real-time PCR instrument through 35-45 cycles of:
- Denaturation (high temperature, ~95°C) to separate DNA strands.
- Annealing (lower temperature, ~55-60°C) for primers to bind.
- Extension (~72°C) for the polymerase to synthesize new DNA strands. The probe is cleaved during amplification, releasing a fluorescent signal measured at each cycle.
- Data Analysis: The cycle threshold (Ct), at which the fluorescence exceeds a background level, is determined. The Ct value is inversely proportional to the amount of target nucleic acid in the original sample [67] [68].
Visualizing Biosensor Signaling and Workflows
Comparative Biosensor Sensitivity Hierarchy
This diagram illustrates the hierarchy of analytical sensitivity for the detection technologies discussed, from the least to the most sensitive.
FET Biosensor Detection Mechanism
This diagram outlines the working principle of a Field-Effect Transistor (FET) biosensor, an example of a novel detection platform.
The Scientist's Toolkit: Essential Research Reagents and Materials
Table 2: Key Reagent Solutions for Diagnostic Assay Development
| Reagent/Material | Function in Assay | Application Examples |
|---|---|---|
| Capture & Detection Antibodies [65] | Form the core of an immunoassay; provide specificity by binding to the target antigen at distinct epitopes. | Sandwich ELISA; Lateral Flow Immunoassays [65]. |
| DNA/RNA Oligonucleotides | Serve as primers for amplification (PCR) or as probes (e.g., for hybridization in DNA-ELISA or real-time PCR) [72] [67]. | RT-PCR (primers for RdRp, N genes); DNA-ELISA (capture and detector probes) [72] [67]. |
| Enzyme Conjugates (e.g., HRP-anti-dig) | Enzymes (HRP) catalyze a reaction with a substrate to generate a detectable (colorimetric, chemiluminescent) signal. The conjugate (e.g., to an antibody) delivers the enzyme to the target [72] [64]. | ELISA (HRP-linked detection antibody); DNA-ELISA (HRP-anti-dig) [72] [64]. |
| Functional Nanomaterials (AuNPs, Graphene, CNTs) [69] [70] | Enhance biosensor performance by improving electron transfer, increasing surface area for bioreceptor immobilization, and amplifying the detection signal. | FET biosensors (SiNW, CNT channels); Electrochemical aptasensors (AuNP-modified electrodes) [69] [70]. |
| Aptamers [70] | Single-stranded DNA/RNA oligonucleotides that bind specific targets (proteins, ions) with high affinity; serve as synthetic recognition elements. | Aptamer-based Electrochemical Biosensors (AEBs) for disease biomarkers [70]. |
The comparative analysis reveals a dynamic diagnostic technology landscape. While ELISA and PCR remain robust, well-understood, and essential for many applications, emerging biosensor technologies offer compelling advantages in sensitivity, speed, and potential for point-of-care use. The successful integration of these novel platforms into clinical and research settings will hinge on overcoming challenges related to reproducibility in complex sample matrices, scalability of manufacturing, and rigorous validation against established benchmarks. Future development will likely focus on multiplexing capabilities, miniaturization for portable and wearable diagnostics, and the integration of smart data analytics, further bridging the gap between laboratory research and real-world clinical application.
For researchers and developers in the biosensor field, navigating the regulatory landscape is a critical step in translating innovative technology from the laboratory to clinical use. The FDA (Food and Drug Administration) in the United States and the CE (Conformité Européenne) marking process in the European Union represent two distinct regulatory frameworks with different philosophical approaches and technical requirements. Understanding these pathways is essential for strategic planning, as regulatory approvals not only validate safety and efficacy but also significantly influence global market access and commercial success.
The development of biosensors represents a rapidly advancing frontier at the intersection of diagnostics, therapeutics, and digital health. Recent innovations include insertion-free glucose sensors [73], handheld quantitative diagnostic devices [8], and sophisticated laboratory-based analysis systems [74]. Regardless of their technological sophistication, all biosensors intended for clinical use must undergo rigorous regulatory scrutiny to demonstrate analytical and clinical validity, as well as safety for their intended use. This guide examines the key considerations for navigating these complex regulatory landscapes, with a specific focus on how reproducibility and repeatability data factor into regulatory submissions.
FDA Approval Pathway for Biosensors
Framework and Key Considerations
The FDA's regulatory approach for biosensors has evolved to balance rigorous safety evaluation with efficient access to innovative technologies. The agency has recently demonstrated flexibility through updated guidance documents that acknowledge advances in analytical science. Notably, a 2025 draft guidance proposes a streamlined framework for demonstrating biosimilarity for certain therapeutic protein products, reflecting the FDA's growing confidence in comparative analytical assessments over traditional clinical efficacy studies [75]. While this specific guidance addresses biologics, it signals a broader regulatory trend that may influence device evaluation: when highly sensitive analytical methods can adequately characterize a product, the extent of clinical data required may be reduced.
For biosensors, the FDA categorizes devices based on risk, with Class I devices representing lowest risk and Class III representing highest risk. The regulatory pathway—whether 510(k) premarket notification, De Novo classification, or Premarket Approval (PMA)—depends on this classification and whether the device has a valid predicate. A significant development in biosensor regulation came in September 2025, when the FDA approved the Biolinq Shine, described as "the first insertion-free glucose sensor" [73]. This approval established a new regulatory category for wearable glucose sensors intended for non-insulin using populations, demonstrating the FDA's adaptability to emerging technologies and new use cases.
Demonstrating Analytical Validity
For biosensors, a cornerstone of FDA submissions is demonstrating analytical validity—the ability to accurately and reliably measure the analyte of interest. Key performance characteristics include:
- Accuracy: Closeness of agreement between measured value and true value
- Precision: Including repeatability and reproducibility
- Analytical sensitivity: Lower limit of detection and quantification
- Analytical specificity: Ability to measure analyte without interference
- Reportable range: Span of reliable results from low to high concentration
Recent regulatory developments indicate that for well-characterized platforms where "the relationship between quality attributes and clinical efficacy is generally understood," a streamlined approach may be acceptable [75]. This potentially reduces the need for extensive clinical efficacy studies when robust analytical data is available.
CE Marking Process for Biosensors
Framework and Key Considerations
The CE marking process indicates that a product meets the requirements of all relevant European Regulations and is a legal prerequisite for placing a medical device on the market in the European Union. Unlike the FDA's product-specific review, CE marking relies on a manufacturer's self-declaration of conformity, though typically with oversight by a Notified Body—an independent organization designated by an EU member state to assess conformity with applicable requirements [76] [77].
The CE marking process operates under the Medical Device Regulation (MDR) and In Vitro Diagnostic Regulation (IVDR), which have substantially increased the rigor of European device regulation. These regulations emphasize:
- Technical documentation demonstrating conformity with General Safety and Performance Requirements (GSPR)
- Clinical evidence supporting intended use and demonstrating safety and performance
- Post-market surveillance and vigilance systems
- Quality management system implementation
As stated by BSI, a leading Notified Body, "CE marking is the medical device manufacturer's claim that a product meets the General Safety and Performance Requirements (GSPR) of all relevant European Medical Device Regulations" [76]. For biosensors, conformity with multiple directives may be required, including potentially the MDR/IVDR, Electromagnetic Compatibility Directive, and Low Voltage Directive, depending on the device's characteristics and intended use [78].
Device Classification and Conformity Assessment
A critical first step in CE marking is proper device classification, which determines the conformity assessment route and level of Notified Body involvement. Under MDR/IVDR, devices are classified based on risk, with Class I representing lowest risk and Class III representing highest risk. The classification rules consider multiple factors including duration of use, degree of invasiveness, and whether the device delivers energy or drugs.
For many biosensors, involvement of a Notified Body is mandatory. As emphasized by the European Commission, "If you need to involve a notified body, the CE marking must be accompanied by the identification number of the notified body" [77]. This identification number provides traceability and indicates that an independent assessment has been completed.
Comparative Analysis: FDA vs. CE Marking
Table 1: Key Differences Between FDA and CE Marking Pathways
| Aspect | FDA Approval (U.S.) | CE Marking (EU) |
|---|---|---|
| Philosophical Approach | Product-specific review and approval by regulatory agency | Manufacturer declaration with independent assessment by Notified Body |
| Legal Basis | Food, Drug, and Cosmetic Act | Medical Device Regulation (MDR) / In Vitro Diagnostic Regulation (IVDR) |
| Primary Focus | Safety and effectiveness for intended use | Conformity with General Safety and Performance Requirements |
| Review Structure | Centralized with FDA | Decentralized with Notified Bodies |
| Clinical Evidence Requirements | Typically requires clinical data for moderate and high-risk devices | Requires clinical evidence commensurate with device classification and risk |
| Timeline | Often longer review times | Typically faster time to market |
| Cost | Generally higher costs due to clinical trials | Generally lower upfront costs |
| Post-Market Surveillance | Required with periodic reporting | Required with periodic reporting and post-market clinical follow-up |
Reproducibility and Repeatability in Regulatory Submissions
Methodologies for Assessing Precision
Reproducibility and repeatability represent fundamental analytical performance parameters that regulatory bodies scrutinize closely. These metrics evaluate the precision of a biosensor under different conditions. A well-designed precision study should include:
- Repeatability: Assessment of precision under the same operating conditions over a short time interval (same instrument, same operator, same day)
- Intermediate precision: Evaluation of variations within a laboratory (different days, different operators, different instruments)
- Reproducibility: Assessment of precision between different laboratories
A 2022 multicenter study of a handheld quantitative G6PD diagnostic provides an exemplary methodology for such assessments [8] [4]. In this study, commercial lyophilized controls with high, intermediate, and low G6PD activities were tested to evaluate both repeatability and reproducibility across multiple sites and devices.
Case Study: G6PD Biosensor Precision Evaluation
Table 2: Precision Data from G6PD Biosensor Multicenter Study [8] [4]
| Control Level | Within-Site CV (Repeatability) | Between-Site CV (Reproducibility) | Correlation with Reference Method (rs) |
|---|---|---|---|
| High Activity | 0.111 | Not separately reported | 0.859 (p<0.001) |
| Intermediate Activity | 0.172 | Overlap between low and intermediate controls | 0.604 (p<0.001) |
| Low Activity | 0.260 | Overlap between low and intermediate controls | 0.604 (p<0.001) |
The experimental protocol involved two distinct phases:
- Phase A (Single-site): Ten Biosensor devices were tested repeatedly in a single laboratory by a single technician using commercial controls with varying G6PD activity levels.
- Phase B (Multi-site): Each of the ten devices was dispatched to a different laboratory, where a single user tested each control repeatedly following standardized training.
This comprehensive study design allowed researchers to isolate different sources of variability and provide regulators with a complete picture of the device's real-world performance. The findings demonstrated that "Biosensor G6PD readings between sites did not differ significantly (p = 0.436), whereas spectrophotometry readings differed markedly between sites (p<0.001)" [4], highlighting the potential advantages of standardized biosensor platforms over more variable reference methods.
Experimental Design and Protocols
Standardized Protocols for Reproducibility Assessment
Designing robust experiments to generate regulatory-grade reproducibility data requires careful planning and execution. Key elements include:
- Sample selection: Use of well-characterized controls spanning the analytical measurement range
- Site selection: Inclusion of multiple testing sites representing different environments and operator skill levels
- Standardization: Implementation of standardized training protocols and procedures across all sites
- Blinding: Prevention of operator bias through blinding techniques
- Statistical analysis plan: Pre-specified analysis methods with appropriate sample size justification
The G6PD biosensor study exemplifies this approach, utilizing "commercial lyophilised controls (ACS Analytics, USA) with high, intermediate, and low G6PD activities" that were "assessed 20 times on 10 Biosensor devices" initially, then dispatched to 10 different laboratories where "each control was tested 40 times at each laboratory by a single user" [8]. This design generated substantial data points for robust statistical analysis of both within-device and between-laboratory variability.
Common Pitfalls in Reproducibility Studies
Researchers should be aware of several common limitations when designing reproducibility studies:
- Sample matrix effects: Lyophilized controls may behave differently from fresh clinical samples, as noted in the G6PD study where "the use of lyophilised human blood samples rather than fresh blood may have affected these findings" [8]
- Inadequate sample size: Insufficient replication may fail to detect important sources of variation
- Over-standardization: Excessive control of testing conditions may yield artificially optimistic precision estimates
- Operator training variability: Inconsistent training across sites can introduce unnecessary variability
The Scientist's Toolkit: Essential Research Reagents and Materials
Table 3: Essential Research Reagents for Biosensor Reproducibility Studies
| Reagent/Material | Function in Reproducibility Assessment | Example from Literature |
|---|---|---|
| Lyophilized Controls | Provide stable, standardized samples for repeatability testing across multiple sites and timepoints | Commercial lyophilised controls (ACS Analytics, USA) with defined G6PD activities [8] |
| Reference Method Materials | Enable method comparison and validation against established techniques | Spectrophotometry system (Pointe Scientific, USA) as reference method [4] |
| Lysis Buffers | Prepare samples for analysis by releasing target analytes | Blood lysis buffer for G6PD biosensor [4] |
| Test Striits/Cartridges | Provide consistent reaction platform for biosensor measurements | Single-use test strips with BCIP/NBT chemistry [4] |
| Quality Control Materials | Monitor assay performance and detect drift or deterioration | High, intermediate, and low activity controls [8] |
| Standardized Buffers | Maintain consistent chemical environment across tests | Not specified in studies but critical for reproducibility |
| Data Analysis Software | Statistical evaluation of precision metrics | Correlation analysis (Spearman's rank) [8] |
Navigating the regulatory landscapes for biosensors requires a strategic approach that integrates regulatory requirements early in the development process. The FDA and CE marking pathways, while distinct in their philosophical approaches and procedural details, share a common emphasis on robust analytical performance data, particularly regarding reproducibility and repeatability.
As demonstrated by the G6PD biosensor case study, comprehensive precision studies that evaluate both within-site repeatability and between-site reproducibility provide critical evidence for regulatory submissions. These studies should be carefully designed to reflect real-world conditions while controlling for extraneous sources of variability. The evolving regulatory landscape, including recent FDA guidance on streamlined approaches [75] and new device categories for innovative technologies like insertion-free sensors [73], offers opportunities for efficient development pathways when supported by strong analytical data.
For researchers and developers, success in regulatory navigation hinges on understanding both the technical requirements for biosensor performance and the regulatory frameworks that govern market access. By designing comprehensive reproducibility studies and strategically engaging with regulatory bodies early in development, innovators can accelerate the translation of promising biosensor technologies to clinical use while ensuring patient safety and diagnostic efficacy.
Biosensors represent a rapidly advancing field at the intersection of diagnostics, materials science, and biotechnology. As defined by the International Union of Pure and Applied Chemistry (IUPAC), a biosensor is "a self-contained integrated device which is capable of providing specific quantitative or semi-quantitative analytical information using a biorecognition element (biochemical receptor) which is in direct spatial contact with a transducer element" [79]. The core components of any biosensor include a biorecognition element (such as an antibody, enzyme, aptamer, or nucleic acid) that specifically interacts with the target analyte, a transducer that converts the biological response into a measurable signal, and a reader device that processes and displays the results [6] [80] [79].
For researchers, scientists, and drug development professionals, the transition of biosensors from laboratory prototypes to clinically viable tools depends critically on rigorous validation of their reproducibility and repeatability. These parameters, essential components of the broader assessment of biosensor reliability, determine whether a measurement can be consistently replicated under the same conditions over time (repeatability) and across different operators, instruments, or laboratories (reproducibility) [80]. This case study analysis objectively compares validation successes across three pivotal application areas: glucose monitoring, infectious pathogen detection, and cancer biomarker sensing, synthesizing quantitative performance data and the experimental methodologies that underpin them.
Glucose Monitoring Biosensors: A Paradigm of Commercial Translation
Performance Validation and Generational Evolution
Glucose biosensors dominate the commercial biosensor market, and their development history provides a clear framework for assessing validation milestones [81]. The performance of these systems is typically quantified by metrics such as sensitivity (the magnitude of signal change per unit concentration of analyte), limit of detection (LOD) (the lowest analyte concentration that can be reliably detected), and clinical accuracy, often measured by the Mean Absolute Relative Difference (MARD) [82].
Table 1: Performance Metrics of Glucose Monitoring Technologies
| Technology Type | Representative Platform | Key Performance Metrics | Reproducibility/Repeatability Data |
|---|---|---|---|
| Self-Monitoring Blood Glucose (SMBG) | Enzymatic amperometric biosensors | LOD: ~3.1 μM; Sensitivity: 48.98 μA mM⁻¹ cm⁻² [83] | Current remained at 85.83% after 200 cycles [83] |
| Continuous Glucose Monitoring (CGM) | Subcutaneous enzyme electrodes | MARD: 9-11% for advanced systems [82] | Requires frequent calibration; performance can vary with individual physiological factors [82] |
| Non-Invasive Optical | Raman/NIR Spectroscopy | Challenging in vivo accuracy; limited by tissue heterogeneity [82] | High signal variability due to skin perfusion, temperature [82] |
| Non-Invasive Microwave | Resonator-based sensors | Detects dielectric property changes in tissues [82] | Affected by water content, movement, and environmental interference [82] |
The evolution of electrochemical glucose biosensors is categorized into generations, each overcoming specific reproducibility challenges. First-generation sensors relied on the native oxygen cofactor, making their signals susceptible to fluctuation in environmental oxygen concentration [83]. Second-generation biosensors incorporated synthetic redox mediators (e.g., ferrocene derivatives, ferricyanide) to shuttle electrons, which reduced oxygen dependence and allowed operation at lower potentials, minimizing interference from other electroactive species [83]. A key validation success in this generation was demonstrated by Lin et al., who used a poly-L-lysine substrate to co-immobilize glucose oxidase and ferric cyanide on a screen-printed carbon electrode (SPCE), achieving a significant sensitivity enhancement from 117.4 to 212.1 nA/mM mm² in human serum samples [83]. Third-generation systems aim for direct electron transfer (DET) between the enzyme and the electrode, eliminating the need for mediators and enhancing stability. A major hurdle has been the deeply embedded redox center of glucose oxidase (FAD), which hinders DET. Innovative solutions, such as the use of nanostructured materials with high conductivity and specific surface areas, are actively being validated to overcome this barrier [83].
Experimental Protocols for Validation
Standard protocols for validating glucose biosensors involve:
- Linear Range Calibration: The sensor's response is measured in standard solutions with known glucose concentrations (e.g., 0.03–16.5 mM) to establish a calibration curve [83].
- Interference Testing: The sensor is exposed to common interferents like ascorbic acid, uric acid, and acetaminophen to assess selectivity. Selective membranes (e.g., Nafion, polyphenylenediamine) are often used to minimize interference [83].
- Stability and Reproducibility Testing: Long-term stability is assessed by monitoring signal retention over time (e.g., 85% after 200 cycles) and under different storage conditions. Reproducibility is evaluated by calculating the relative standard deviation (RSD) of signals from multiple sensors or measurements for the same glucose concentration [83].
- Clinical Correlation: For CGM and non-invasive systems, sensor readings are correlated with blood glucose levels measured via reference methods (e.g., YSI STAT analyzer) across a diverse patient population to calculate MARD [82].
Diagram 1: Electron transfer pathways across three generations of glucose biosensors. Key challenges for each generation, such as oxygen dependence (1st) and mediator toxicity (2nd), have driven innovation toward direct electron transfer (3rd).
Pathogen Detection Biosensors: Ensuring Specificity in Complex Matrices
Performance Benchmarks for Bacterial and Viral Sensing
The reproducibility of pathogen detection biosensors is challenged by the complexity of clinical and environmental samples. Key performance parameters include sensitivity (LOD), often required to be as low as a single colony-forming unit (CFU), and specificity in distinguishing between target and non-target organisms [80] [79]. The REASSURED criteria (Real-time connectivity, Ease of specimen collection, Affordable, Sensitive, Specific, User-friendly, Rapid and robust, Equipment-free, and Deliverable to end-users) provide a framework for evaluating POC infectious disease diagnostics [84].
Table 2: Validation Data for Pathogen Detection Biosensors
| Pathogen | Biosensor Type & Biorecognition Element | Detection Limit & Linear Range | Reproducibility/Repeatability Data |
|---|---|---|---|
| Vibrio cholerae | Electrochemical (DNA probe on NanoZrO₂) [80] | Not specified | Stable for 15 weeks at 4°C [80] |
| Escherichia coli | Microfluidic chemiresistive (Antibody-AuNP/Graphene) [80] | Low CFU/mL range | Portable system; rapid in-situ electric readout [80] |
| White Spot Syndrome Virus | Piezoelectric (GST-WBP immobilized on gold) [80] | Not specified | Specific binding to virus in pond water samples [80] |
| Foodborne Pathogens | Fluorescent microfluidic (Aptamer-based) [79] | High sensitivity in complex food matrices | High integration; "sample-in-answer-out" capability [79] |
| Staphylococcus aureus | Optical chromatic (Polymer fiber composites) [80] | Not specified | Promising potential for rapid infection alert [80] |
Experimental Protocols for Validation
Robust validation of pathogen biosensors requires rigorous methodologies:
- Specificity and Cross-Reactivity Testing: The biosensor is challenged with a panel of related non-target pathogens and abundant non-pathogenic molecules present in the sample matrix (e.g., food homogenates, blood) to confirm specific binding and minimal false positives [79].
- Spiked Sample Recovery: Known quantities of the target pathogen (in CFU) are introduced into a real sample matrix (e.g., saliva, serum, food slurry). The recovery rate is calculated by comparing the measured concentration to the spiked concentration, validating accuracy in complex environments [85] [79].
- Intra- and Inter-assay Precision: The coefficient of variation (CV) is determined by repeatedly testing replicates of the same sample within the same run (intra-assay) and across different runs, operators, or device lots (inter-assay) [80].
- Long-Term Stability: The biosensor's performance, including the activity of the biological recognition element, is assessed over weeks or months under defined storage conditions to establish shelf-life [80].
Cancer Biomarker Biosensors: The Quest for Ultra-Sensitivity and Specificity
Validation of Sensitivity for Early Detection
The low abundance of circulating cancer biomarkers in biofluids demands exceptionally high sensitivity and robust performance from biosensors. Reproducibility here is critical for reliable early diagnosis, prognosis, and treatment monitoring. Key biomarkers include proteins (e.g., CEA, HER2/neu), circulating tumor DNA (ctDNA), and microRNAs (miRNAs) [86].
Table 3: Performance Metrics of Cancer Biomarker Biosensors
| Cancer/Biomarker | Biosensor Platform | Reported Sensitivity (LOD) | Key Validation Findings |
|---|---|---|---|
| General (e.g., CEA, HER2) | Electrochemical (Aptamer-functionalized nanomaterials) [86] | Femtomolar (fM) level | High sensitivity and specificity for protein biomarkers [86] |
| Multiple Cancers (miRNAs) | Quantum dot-based nano-biosensors [86] | Detection of circulating miRNAs | Promising for early-stage cancer detection [86] |
| Clinical Samples | AI-integrated POC and wearable systems [86] | As low as 8 fg/mL | Quantitative detection of ctDNA, exosomes in biofluids [86] |
| Colorectal, Gastric, etc. (miR-150) | Various nucleic acid-based biosensors [86] | Not specified | Demonstrated molecular association with cancer onset/progression [86] |
Experimental Protocols for Validation
Validation of cancer biomarker biosensors involves sophisticated and multi-step protocols:
- Analysis in Complex Biofluids: Biosensor performance is tested directly in clinically relevant samples such as serum, plasma, or urine, rather than just buffer solutions, to evaluate the impact of the complex biofluid matrix on the assay [86].
- Comparison with Gold Standard Methods: The results from the biosensor are rigorously compared with those from established clinical methods like ELISA, PCR, or mass spectrometry using correlation analyses (e.g., Pearson correlation coefficient) and Bland-Altman plots [86].
- Determination of Clinical Sensitivity and Specificity: These are calculated by testing the biosensor on confirmed patient cohorts and healthy controls. Clinical sensitivity is the proportion of true positives correctly identified, while clinical specificity is the proportion of true negatives correctly identified [86]. Values exceeding 90% are often reported for advanced platforms [86].
- Multiplexing Capability: For panels of biomarkers, the biosensor's ability to simultaneously and independently detect multiple targets without cross-talk is validated [86].
Diagram 2: Core operational principle of a biosensor, highlighting the key components and common options for biorecognition elements and signal transduction mechanisms that define a biosensor's specificity and analytical principle.
The Scientist's Toolkit: Essential Reagents and Materials
The reproducibility of biosensor research and development is fundamentally dependent on the consistent quality and performance of key reagents and materials.
Table 4: Essential Research Reagent Solutions for Biosensor Development
| Reagent/Material | Core Function | Examples in Context |
|---|---|---|
| Glucose Oxidase (GOx) | Biorecognition element for glucose; catalyzes oxidation of β-D-glucose [81] [83]. | Core enzyme in first-, second-, and third-generation electrochemical glucose biosensors. |
| Redox Mediators | Shuttle electrons between the enzyme's active site and the electrode surface [83]. | Ferrocene derivatives, ferricyanide in second-generation glucose sensors. |
| Nanomaterials | Enhance signal, increase surface area for immobilization, and facilitate electron transfer [84] [83]. | Gold nanoparticles (AuNPs), graphene, carbon nanotubes, metal oxides (e.g., NanoZrO₂). |
| Specific Bioreceptors | Provide high specificity and affinity for the target analyte. | Antibodies (for pathogens, proteins) [80] [79], aptamers (for small molecules, cells) [84] [86], DNA probes (for nucleic acids) [80]. |
| Immobilization Matrices | Entrap or covalently bind the bioreceptor to the transducer surface, maintaining its activity and stability [84]. | Polymers (e.g., Nafion, polypyrrole), hydrogels, sol-gel matrices, self-assembled monolayers (SAMs). |
The validation successes in biosensor development across glucose monitoring, pathogen detection, and cancer diagnostics underscore a consistent trajectory toward higher sensitivity, greater specificity, and most importantly, enhanced reproducibility and reliability. Key strategies enabling this progress include the sophisticated design of biorecognition elements (e.g., engineered aptamers, modified enzymes), the integration of nanomaterials to amplify signals and stabilize biological components, and the adoption of microfluidic systems for automated and consistent sample processing. The growing incorporation of artificial intelligence for data analysis and calibration further promises to mitigate variability and improve predictive accuracy.
For researchers and drug development professionals, this analysis highlights that while the application dictates the specific validation protocol—from MARD calculations for glucose sensors to clinical sensitivity/specificity for cancer biosensors—the fundamental principles of rigorous, statistically powered testing in relevant matrices remain universal. The continued focus on overcoming reproducibility challenges, such as material stability, fouling in complex samples, and standardization across manufacturing batches, will be pivotal in translating the next generation of biosensors from robust laboratory prototypes to indispensable tools in clinical practice and personalized medicine.
Conclusion
The path to reliable biosensors hinges on a rigorous, multifaceted approach to reproducibility and repeatability, treating them not as afterthoughts but as core design principles from the outset. By integrating robust foundational definitions, systematic methodological assessments, strategic troubleshooting of variability, and comprehensive validation frameworks, researchers can significantly enhance biosensor performance. Future advancements will be driven by the synergistic application of novel materials, sophisticated statistical optimization via Design of Experiments, and the integration of artificial intelligence for data analysis and error prediction. Ultimately, mastering these reliability metrics is paramount for translating innovative biosensing technologies from the laboratory into trustworthy tools that advance biomedical research and improve patient clinical outcomes.
References
- 1. Sensor repeatability versus sensor reproducibility [https://www.zimmerpeacock.com/2023/03/03/sensor-repeatability-versus-sensor-reproducibility/]
- 2. Reproducibility - an overview | ScienceDirect Topics [https://www.sciencedirect.com/topics/agricultural-and-biological-sciences/reproducibility]
- 3. A novel strategy for controllable electrofabrication of molecularly imprinted polymer biosensors utilizing embedded Prussian blue nanoparticles | Scientific Reports [https://www.nature.com/articles/s41598-025-93025-1]
- 4. and Repeatability of a handheld quantitative G6PD... reproducibility [https://journals.plos.org/plosntds/article?id=10.1371/journal.pntd.0010174]
- 5. Ratiometric Electrochemistry: Improving the Robustness... [https://pmc.ncbi.nlm.nih.gov/articles/PMC8068091/]
- 6. Biosensors, Artificial Intelligence Biosensors, False Results and Novel Future Perspectives - PMC [https://pmc.ncbi.nlm.nih.gov/articles/PMC12025796/]
- 7. Innovations in Biosensor Technologies for Healthcare Diagnostics and Therapeutic Drug Monitoring: Applications, Recent Progress, and Future Research Challenges - PMC [https://pmc.ncbi.nlm.nih.gov/articles/PMC11360123/]
- 8. and reproducibility of a handheld quantitative G6PD... Repeatability [https://pubmed.ncbi.nlm.nih.gov/35176015/]
- 9. Improving the reproducibility, accuracy, and stability of an electrochemical biosensor platform for point-of-care use - PubMed [https://pubmed.ncbi.nlm.nih.gov/32217334/]
- 10. Startup’s biosensor makes drug development and manufacturing cheaper | MIT News | Massachusetts Institute of Technology [https://news.mit.edu/2025/startup-biosensor-makes-drug-development-and-manufacturing-cheaper-0615]
- 11. Trends in Protein-Based Biosensor Assemblies for Drug Screening and Pharmaceutical Kinetic Studies - PMC [https://pmc.ncbi.nlm.nih.gov/articles/PMC6270898/]
- 12. On the Determination of Uncertainty and Limit in... of Detection [https://pubmed.ncbi.nlm.nih.gov/29949904/]
- 13. Biosensors | January 2025 - Browse Articles [https://www.mdpi.com/2079-6374/15/1]
- 14. Microfluidic biosensors for biomarker detection in body fluids: a key... [https://biomarkerres.biomedcentral.com/articles/10.1186/s40364-024-00697-4]
- 15. Analysis of Comparative Market Technologies: Optical vs.... Biosensor [https://www.linkedin.com/pulse/comparative-analysis-biosensor-market-9tkcc]
- 16. and label-free Reproducible for the selective extraction and... biosensor [https://jnanobiotechnology.biomedcentral.com/articles/10.1186/s12951-015-0102-8]
- 17. Machine‐Learning‐Aided Advanced Electrochemical Biosensors - PMC [https://pmc.ncbi.nlm.nih.gov/articles/PMC12369699/]
- 18. Introduction to biosensors - PMC [https://pmc.ncbi.nlm.nih.gov/articles/PMC4986445/]
- 19. Biosensor - Wikipedia [https://en.wikipedia.org/wiki/Biosensor]
- 20. Guide to Selecting a Biorecognition Element for Biosensors - PMC [https://pmc.ncbi.nlm.nih.gov/articles/PMC6416154/]
- 21. Biosensors Market Size, Share, Trends & Growth 2030 [https://www.marketsandmarkets.com/Market-Reports/biosensors-market-798.html]
- 22. Global Biosensor Devices Market $37.7 Billion by 2033 [https://www.ihealthcareanalyst.com/low-cost-non-invasive-medical-applications-biosensors-market/]
- 23. Biomolecule immobilization in biosensor development: tailored... [https://pubmed.ncbi.nlm.nih.gov/18855745/]
- 24. A high content assay for biosensor validation and for examining stimuli... [https://pmc.ncbi.nlm.nih.gov/articles/PMC4324324/]
- 25. Advancements in food quality monitoring: integrating biosensors for... [https://pubs.rsc.org/en/content/articlehtml/2024/fb/d4fb00094c]
- 26. IGEM:IMPERIAL/2006/ Protocols /Biosensortest - OpenWetWare [https://openwetware.org/wiki/IGEM:IMPERIAL/2006/Protocols/Biosensortest]
- 27. - Sensor Principles and Architectures... Electrochemical Biosensors [https://pmc.ncbi.nlm.nih.gov/articles/PMC3663003/]
- 28. ppt | PDF Biosensor [https://www.slideshare.net/slideshow/biosensor-ppt/40060599]
- 29. sciencedirect.com/topics/engineering/ electrochemical - biosensors [https://www.sciencedirect.com/topics/engineering/electrochemical-biosensors]
- 30. - PMC Optical biosensors [https://pmc.ncbi.nlm.nih.gov/articles/PMC4986466/]
- 31. Synergistic optimization strategies for the development of... [https://pubmed.ncbi.nlm.nih.gov/39908851/]
- 32. In vitro multi - enzymatic using recombinant lysates of E. coli... cascades [https://link.springer.com/article/10.1007/s12551-020-00618-3]
- 33. Multienzyme Cascade Reactions-Status and Recent Advances - Peeref [https://www.peeref.com/works/5973643]
- 34. An enzyme cascade biosensor based on multiwalled carbon nanotube-RuO2 nanocomposite for selective amperometric determination of lactose in milk samples - ScienceDirect [https://www.sciencedirect.com/science/article/abs/pii/S0026265X24012505]
- 35. - GeeksforGeeks Coefficient of Variation Formula [https://www.geeksforgeeks.org/maths/coefficient-of-variation-formula/]
- 36. - Wikipedia Coefficient of variation [https://en.wikipedia.org/wiki/Coefficient_of_variation]
- 37. Calculator - Inch Calculator Coefficient of Variation [https://www.inchcalculator.com/coefficient-of-variation-calculator/]
- 38. Antifouling (Bio)materials for Electrochemical (Bio)sensing - PMC [https://pmc.ncbi.nlm.nih.gov/articles/PMC6358752/]
- 39. Video: Optical and Electrochemical Biosensors and Biofouling [https://www.jove.com/v/5794/optical-and-electrochemical-biosensors-and-biofouling]
- 40. A review on recent advancement in portable biosensor for health... [https://ijpsr.com/bft-article/a-review-on-recent-advancement-in-portable-biosensor-for-health-monitoring/?view=fulltext]
- 41. How to Improve the Performance of Electrochemical Sensors via Minimization of Electrode Passivation [https://www.mdpi.com/2227-9040/9/1/12]
- 42. Electrode Passivation | Encyclopedia MDPI [https://encyclopedia.pub/8111]
- 43. Highly Effective and Efficient Self-Assembled Multilayer-Based... [https://pubmed.ncbi.nlm.nih.gov/37713500/]
- 44. (PDF) Electropolymerized films to prevent interferences and electrode ... [https://www.academia.edu/57471702/Electropolymerized_films_to_prevent_interferences_and_electrode_fouling_in_biosensors]
- 45. Bioreactor Calibration: Ensuring Accuracy of Process Measurements [https://ritaibioreactor.com/bioreactor-calibration/]
- 46. Top 5 Emerging Trends in Nanotechnology for [https://www.azonano.com/article.aspx?ArticleID=6865]
- 47. silicon Porous meet zwitterionic peptides: tackling... biosensors [https://pubs.rsc.org/en/content/articlelanding/2025/nh/d5nh00478k]
- 48. A novel porous collagen scaffold around an implantable biosensor ... [https://pubmed.ncbi.nlm.nih.gov/19235209/]
- 49. A Stretchable Scaffold with Electrochemical Sensing for 3D Culture, Mechanical Loading, and Real‐Time Monitoring of Cells - PMC [https://pmc.ncbi.nlm.nih.gov/articles/PMC8327466/]
- 50. Approximating Scaffold Printability Utilizing Computational Methods - PMC [https://pmc.ncbi.nlm.nih.gov/articles/PMC10123880/]
- 51. Perspectives on systematic optimization of ultrasensitive biosensors through experimental design - PMC [https://pmc.ncbi.nlm.nih.gov/articles/PMC11403992/]
- 52. Machine learning and chemometrics for electrochemical sensors... [https://pubs.rsc.org/en/content/articlelanding/2021/an/d1an01148k]
- 53. Development of High-Performance Whole Cell Biosensors Aided by Statistical Modeling - PMC [https://pmc.ncbi.nlm.nih.gov/articles/PMC7146887/]
- 54. and Repeatability in Analytical Chemistry Reproducibility [https://www.azolifesciences.com/article/Importance-of-Repeatability-and-Reproducibility-in-Analytical-Chemistry.aspx]
- 55. Application of Chemometrics in Biosensing: A Brief Review - PMC [https://pmc.ncbi.nlm.nih.gov/articles/PMC7460467/]
- 56. Advances in Enzyme-Based Biosensors for Pesticide Detection - PMC [https://pmc.ncbi.nlm.nih.gov/articles/PMC6022933/]
- 57. How to Design a Biosensor - PMC [https://www.ncbi.nlm.nih.gov/pmc/articles/PMC2771472/]
- 58. Reduction of acetaminophen interference in glucose sensors by a composite Nafion membrane: demonstration in rats and man | Diabetologia [https://link.springer.com/article/10.1007/BF00403381]
- 59. Study of Glucometer Precision and Antimalarial Therapy Interference... [https://clinicsearchonline.org/article/study-of-glucometer-precision-and-antimalarial-therapy-interference-on-glucose-readings-in-nigeria]
- 60. The Impact of Interfering Substances on Continuous Glucose Monitors: Part 2: Marketed CGM Designs, Labeled Interfering Substances, and Design Mitigations - PMC [https://pmc.ncbi.nlm.nih.gov/articles/PMC12531190/]
- 61. GlucoMen Day continuous glucose monitoring system: a screening for... [https://pubmed.ncbi.nlm.nih.gov/23063044/]
- 62. The value and validation of broad for... spectrum biosensors [https://pmc.ncbi.nlm.nih.gov/articles/PMC3925709/]
- 63. Resonating with replicability: factors shaping assay yield and variability... [https://pubs.rsc.org/en/content/articlehtml/2025/lc/d5lc00575b]
- 64. . Immuno- ELISA . SIMOA: vs of... | RayBiotech PCR vs Comparison [https://www.raybiotech.com/elisa-immunopcr-simoa]
- 65. How to Obtain Reproducible ELISA Assay Results | Biomedica [https://www.bmgrp.com/how-to-obtain-reproducible-elisa-assay-results/]
- 66. Why is ELISA lot-to-lot Reproducibility Critical for your Research? - Enzo [https://www.enzo.com/note/why-is-elisa-lot-to-lot-reproducibility-critical-for-your-research/]
- 67. Biosensor and molecular-based methods for the detection of human coronaviruses: A review - PMC [https://pmc.ncbi.nlm.nih.gov/articles/PMC7477626/]
- 68. Coronavirus: a comparative analysis of detection technologies in the wake of emerging variants | Infection [https://link.springer.com/article/10.1007/s15010-022-01819-6]
- 69. Advances in field-effect biosensors towards point-of-use - PMC [https://pmc.ncbi.nlm.nih.gov/articles/PMC10523595/]
- 70. Advances in aptamer-based electrochemical biosensors for disease... [https://pubs.rsc.org/en/content/articlehtml/2025/nh/d5nh00368g]
- 71. Comparison of real-time PCR and ELISA-based methods for the detection of beef and pork in processed meat products - ScienceDirect [https://www.sciencedirect.com/science/article/abs/pii/S0956713516303802]
- 72. Designing a new biosensor “DNA ELISA” to detect Escherichia coli using genomic DNA and comparison of this method to PCR-ELISA - PMC [https://pmc.ncbi.nlm.nih.gov/articles/PMC6010088/]
- 73. : New FDA for Sleep, Activity... | Beyond Type 1 Approved Biosensor [https://beyondtype1.org/biolinq-fda-approval/]
- 74. Frontiers | Insights in Biosensors and Biomolecular Electronics 2024: Novel Developments, Current Challenges, and Future Perspectives [https://www.frontiersin.org/journals/bioengineering-and-biotechnology/articles/10.3389/fbioe.2025.1668411/abstract]
- 75. New FDA Guidance Aims to Simplify the Biosimilar Approval Process [https://www.bigmoleculewatch.com/2025/11/14/new-fda-guidance-aims-to-simplify-the-biosimilar-approval-process/]
- 76. CE Marking | BSI [https://www.bsigroup.com/en-US/products-and-services/medical-devices/ce-marking/]
- 77. CE marking – obtaining the certificate, EU requirements - Your Europe [https://europa.eu/youreurope/business/product-requirements/labels-markings/ce-marking/index_en.htm]
- 78. List of CE Marking Directives and Regulations: An Overview [https://www.compliancegate.com/ce-marking-directives/]
- 79. Frontiers | Microfluidic biosensors for rapid detection of foodborne... [https://www.frontiersin.org/journals/chemistry/articles/10.3389/fchem.2025.1536928/full]
- 80. Biosensors for the Detection of Bacterial and Viral Clinical Pathogens - PMC [https://pmc.ncbi.nlm.nih.gov/articles/PMC7730340/]
- 81. Glucose Biosensors: An Overview of Use in Clinical Practice - PMC [https://pmc.ncbi.nlm.nih.gov/articles/PMC3292132/]
- 82. A comprehensive review of non-invasive optical and microwave biosensors for glucose monitoring - ScienceDirect [https://www.sciencedirect.com/science/article/abs/pii/S0956566324010881]
- 83. Frontiers | Recent advances in glucose utilizing oxidase... monitoring [https://www.frontiersin.org/journals/chemistry/articles/10.3389/fchem.2025.1591302/full]
- 84. Point-of-care biosensors for infectious disease diagnosis: recent... [https://pubs.rsc.org/en/content/articlehtml/2025/ra/d5ra03897a]
- 85. Recent advancements in microfluidic chip biosensor of... detection [https://pubmed.ncbi.nlm.nih.gov/35064302/]
- 86. From detection to drug delivery: innovations in cancer ... biosensors [https://biotechsustainablematerials.biomedcentral.com/articles/10.1186/s44316-025-00040-3]