Enzymatic vs. Affinity Biosensors: A Comprehensive Guide for Biomedical Research and Development
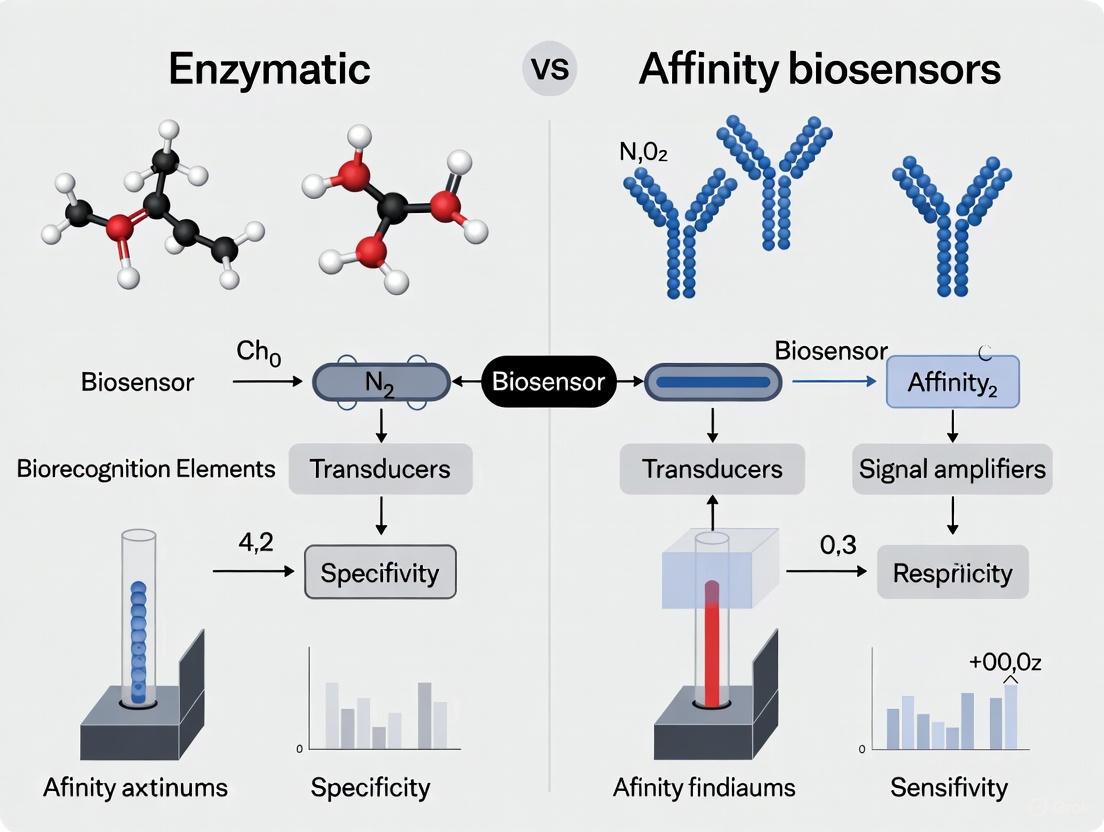
This article provides a detailed comparative analysis of enzymatic and affinity biosensors, two pivotal technologies in biomedical diagnostics and drug development.
Enzymatic vs. Affinity Biosensors: A Comprehensive Guide for Biomedical Research and Development
Abstract
This article provides a detailed comparative analysis of enzymatic and affinity biosensors, two pivotal technologies in biomedical diagnostics and drug development. Tailored for researchers and scientists, it explores the foundational principles, core components, and distinct working mechanisms of each biosensor type. The scope extends to their methodological applications across medical diagnostics, environmental monitoring, and food safety, addressing key challenges in troubleshooting, optimization, and sensor stability. A critical validation and comparative evaluation equips professionals with the knowledge to select the appropriate biosensor technology based on sensitivity, specificity, cost, and suitability for point-of-care applications, synthesizing current trends and future prospects in the field.
Core Principles and Biorecognition Elements: Understanding the Engine of Biosensors
Biosensors are analytical devices that integrate a biological recognition element with a physicochemical transducer to detect a specific analyte, converting a biological response into a measurable electrical signal [1] [2] [3]. The core of every biosensor is a synergistic trio: a bioreceptor that recognizes the target, a transducer that converts the interaction into a signal, and a signal processor that delivers a readable output [4] [5] [2].
This guide provides a detailed comparison of two major biosensor classes—enzymatic and affinity-based—focusing on their performance, underlying principles, and practical applications in pharmaceutical research and development.
Core Components of a Biosensor
The function of a biosensor relies on the seamless integration of three distinct components [4] [5] [2]:
- Bioreceptor: A biological or biomimetic element (e.g., enzyme, antibody, nucleic acid, cell) that specifically interacts with the target analyte. This interaction is called biorecognition.
- Transducer: Converts the biorecognition event into a quantifiable signal. Transducers can be electrochemical, optical, piezoelectric, or thermal.
- Signal Processor: The electronic system that amplifies, conditions, and displays the transducer's signal in a user-friendly format (e.g., numbers or graphs on a screen).
The following diagram illustrates the workflow and logical relationships between these core components.
Enzymatic vs. Affinity Biosensors: A Comparative Analysis
Enzymatic and affinity biosensors are distinguished by their biorecognition mechanisms. Enzymatic biosensors rely on the catalytic activity of enzymes to convert the analyte, while affinity biosensors depend on selective binding without catalysis, using elements like antibodies or DNA [1] [6] [3].
Table 1: Core Characteristics and Research Applications
| Feature | Enzymatic Biosensors | Affinity Biosensors |
|---|---|---|
| Bioreceptor | Enzymes (e.g., Glucose Oxidase) [7] | Antibodies (Immunosensors), Aptamers (Aptasensors), Nucleic Acids (Genosensors) [1] [3] |
| Recognition Principle | Catalytic: Recognizes and transforms the analyte into a product [1] [6]. | Binding: High-affinity, non-catalytic binding to the analyte [1] [3]. |
| Key Advantages | High catalytic activity, lower limits of detection, reusable bioreceptor [1] [7]. | Extreme specificity, broad target range (ions, proteins, viruses, whole cells) [1] [3]. |
| Key Limitations | Limited by enzyme stability and lifetime; sensitivity to assay conditions (pH, temperature) [1] [6]. | Binding can be robust but may be disrupted; antibodies can be expensive and have limited stability [1] [3]. |
| Primary Research Use | Monitoring metabolic parameters (glucose, lactate, glutamate, glutamine) in cell culture and drug screening [7]. | Detecting specific biomarkers (proteins, DNA methylation), pathogen identification, and diagnostic serology [1] [8]. |
Table 2: Analytical and Operational Performance Comparison
| Performance Criterion | Enzymatic Biosensors | Affinity Biosensors |
|---|---|---|
| Sensitivity | Very high due to catalytic amplification [1]. | High, but may require signal amplification for low-concentration targets [8] [9]. |
| Specificity | High for the enzyme's substrate, but can be affected by enzyme inhibitors [6]. | Extremely high, driven by lock-and-key antibody-antigen or aptamer-target interactions [1] [3]. |
| Response Time | Fast (seconds to minutes), dependent on enzyme kinetics and diffusion [7]. | Can be slower (minutes), as it depends on binding kinetics and may involve multiple incubation steps [8]. |
| Reusability | Good, as enzymes are not consumed [1] [3]. | Often single-use, as the binding event can be nearly irreversible [1]. |
| Assay Complexity | Generally simpler, often direct detection. | Can be more complex, often using sandwich-type or competitive assays [8]. |
Experimental Insights and Supporting Data
Case Study 1: Enzymatic Biosensor for Bioprocess Monitoring
Protocol: A study demonstrated the use of a multi-parameter enzymatic biosensor (LV5 array) for online monitoring of glucose, lactate, glutamate, and glutamine in a Chinese Hamster Ovary (CHO) cell bioreactor [7]. The sensors, based on oxidases immobilized on platinum electrodes, were sterilized via gamma irradiation and installed in the bioreactor for continuous operation.
Data: The biosensors provided a measurement point every second over several days of cultivation. Results showed a strong correlation with offline reference methods (HPLC and Bioprofile Analyzer), successfully tracking the dynamic consumption of glucose and production of lactate during the batch culture [7]. This highlights the application of enzymatic biosensors in optimizing feeding strategies and cell culture conditions for biopharmaceutical production.
Case Study 2: Affinity Biosensor for DNA Methylation Detection
Protocol: An electrochemical DNA sensor was developed for the PCR-free detection of gene-specific methylation, an important cancer biomarker [8]. The protocol involved:
- Immobilizing a biotinylated DNA capture probe on streptavidin-modified magnetic beads.
- Hybridizing with the target methylated DNA sequence.
- Detecting methylation via a specific anti-5-methylcytosine antibody and a secondary HRP-conjugated antibody.
- Amperometric transduction using the H₂O₂/hydroquinone system at a screen-printed carbon electrode (SPCE).
Data: The biosensor demonstrated high sensitivity and reproducibility, allowing for the 1-hour analysis of specific methylation in the tumor suppressor genes RASSF1A and MGMT in spiked biological fluids and genomic DNA from human glioblastoma cells [8]. This showcases the potential of affinity biosensors for rapid, sensitive, and specific diagnostics in drug development and clinical oncology.
The Scientist's Toolkit: Key Research Reagents and Materials
Table 3: Essential Materials for Biosensor Research and Development
| Item | Function/Description | Example Applications |
|---|---|---|
| Screen-Printed Electrodes (SPEs) | Disposable, cost-effective three-electrode systems (Working, Reference, Counter) on a plastic or ceramic substrate. Ideal for portability and high-throughput development [8] [9]. | Primary platform for electrochemical biosensors; used in both enzymatic and affinity formats [8]. |
| Glucose Oxidase (GOx) | The model enzyme for enzymatic biosensors. Catalyzes the oxidation of glucose to gluconolactone and hydrogen peroxide [7]. | The foundational bioreceptor for glucose monitoring in biotechnology and clinical diagnostics [7]. |
| Magnetic Microparticles/Beads | Micron-sized particles with functionalized surfaces (e.g., streptavidin, carboxylic acid). Used to immobilize bioreceptors and separate bound from unbound analytes via a magnetic field [8]. | Used to concentrate the target and simplify washing steps in complex sample matrices, as in the DNA methylation sensor [8]. |
| Anti-5-Methylcytosine Antibody | A specific antibody that recognizes and binds to 5-methylcytosine, an epigenetic marker in DNA [8]. | Key bioreceptor in affinity biosensors for detecting DNA methylation patterns linked to cancer [8]. |
| Horseradish Peroxidase (HRP) | A common enzyme label conjugated to secondary antibodies or other bioreceptors. Catalyzes a reaction with a substrate to produce a detectable colorimetric, fluorescent, or electrochemical signal [8]. | Widely used signal amplifier in affinity biosensors, including sandwich immunoassays and DNA hybridization assays [8]. |
The choice between enzymatic and affinity biosensors is dictated by the analytical goal. Enzymatic biosensors are the superior tool for continuously monitoring specific metabolites like glucose and lactate in dynamic systems such as bioreactors. Their catalytic nature provides excellent sensitivity for tracking metabolic pathways in real-time [7]. In contrast, affinity biosensors are indispensable for detecting specific molecular structures, from proteins and antibodies to nucleic acid sequences and epigenetic markers. Their unparalleled specificity makes them ideal for diagnostic applications, biomarker validation, and pathogen detection in drug discovery and development [1] [8].
The convergence of these technologies with nanomaterials and artificial intelligence is pushing the boundaries of sensitivity and multiplexing, paving the way for advanced diagnostic platforms and personalized medicine solutions [4] [5] [10].
Enzymatic biosensors are analytical devices that integrate a biological enzyme as the recognition element with a physico-chemical transducer to generate a measurable signal proportional to the concentration of a target analyte [11]. These sensors leverage the exceptional catalytic properties of enzymes, which enable them to accelerate the conversion of specific substrates into products, thereby facilitating highly selective and often amplified detection [12]. The fundamental operational principle hinges on the catalytic generation of a detectable signal—be it electrical, optical, or thermal—resulting from the biochemical reaction between the enzyme and its target substrate [2].
The development of enzymatic biosensors represents a cornerstone in analytical chemistry, tracing its origins to Clark's pioneering oxygen electrode in 1956 and his subsequent description of an amperometric enzyme electrode for glucose detection in 1962 [5] [13]. This established the foundational model for a device that could quantitatively measure biologically important compounds, a concept that was later materialized with the first commercial glucose meter in 1975 [13]. Within the broader context of biosensor research, enzymatic biosensors are often directly compared with affinity-based biosensors (e.g., those using antibodies, nucleic acids, or aptamers), which rely on binding events rather than catalysis [10] [2]. This comparison is critical for researchers and drug development professionals selecting the optimal sensing platform for specific applications, weighing factors such as sensitivity, specificity, signal amplification, and operational stability.
Fundamental Principles of Enzymatic Biosensors
Core Components and Mechanism
A typical enzymatic biosensor consists of three essential components: a biological recognition element (the enzyme), a transducer, and a signal processing system [5] [2]. The mechanism of action involves a sequential process:
- Biorecognition: The target analyte (substrate) specifically binds to the active site of the enzyme immobilized on the sensor surface [11].
- Catalytic Reaction: The enzyme catalyzes the conversion of the substrate into one or more products. This reaction often involves the consumption or generation of electroactive or optically active species [12].
- Signal Transduction: The transducer detects a physicochemical change associated with the reaction (e.g., production of hydrogen peroxide, change in proton concentration, consumption of oxygen, or light emission) and converts it into a quantifiable electrical or optical signal [5] [13].
- Output: The signal processor amplifies, filters, and displays the result in a user-readable format [2].
The following diagram illustrates the core signaling pathway and component interaction in a first-generation enzymatic biosensor.
Generations of Enzymatic Biosensors
Enzymatic biosensors are classified into generations based on the electron transfer mechanism from the active site of the enzyme to the transducer surface [12] [5].
- First Generation: These are mediatorless biosensors that rely on the diffusion of natural co-substrates or products (e.g., oxygen or hydrogen peroxide) to the transducer. For example, oxidase enzymes use oxygen as an electron acceptor, producing hydrogen peroxide, which is then detected amperometrically [12]. A key limitation is the dependence on ambient oxygen concentrations, which can affect performance [12].
- Second Generation: These biosensors incorporate artificial, non-toxic redox mediators (e.g., ferrocene, ferricyanide) to shuttle electrons from the enzyme's redox center to the electrode surface [5]. This reduces the operating potential, minimizing interference from other electroactive species in complex samples like blood serum [12].
- Third Generation: This generation represents the most advanced design, where the enzyme is directly immobilized on the electrode in a way that facilitates direct electron transfer (DET) between the enzyme's active site and the transducer, without the need for mediators or diffusing substrates [5].
Table 1: Comparison of Enzymatic Biosensor Generations
| Generation | Electron Transfer Mechanism | Key Features | Common Examples |
|---|---|---|---|
| First | Diffusion of natural reactants/products (e.g., O₂, H₂O₂) | Simplicity; subject to oxygen dependence and interferents [12]. | Glucose oxidase sensor detecting H₂O₂ [12]. |
| Second | Artificial redox mediators | Lower operating potential; reduced interference [5]. | Mediated glucose sensors using ferrocene [5]. |
| Third | Direct Electron Transfer (DET) | No mediators required; highly efficient [5]. | Biosensors based on cytochrome c or peroxidases [5]. |
Performance Comparison: Enzymatic vs. Affinity Biosensors
The choice between enzymatic (catalytic) and affinity (binding) biosensors is fundamental and depends on the analytical requirements. The following table provides a direct, objective comparison of their core characteristics.
Table 2: Performance Comparison of Enzymatic vs. Affinity Biosensors
| Parameter | Enzymatic Biosensors | Affinity Biosensors (e.g., Immunosensors, DNA) |
|---|---|---|
| Basis of Detection | Catalytic conversion of substrate [11] | Specific binding event (e.g., antigen-antibody, DNA hybridization) [2] |
| Signal Amplification | Inherently amplified via enzyme turnover; each enzyme molecule processes multiple substrates [14] | Typically no inherent amplification; requires secondary labels (e.g., enzymes, nanoparticles) for signal enhancement [13] |
| Specificity | High for the enzyme's specific substrate [2] | Extremely high; can distinguish between highly similar molecules (e.g., single-base mismatch in DNA) [10] |
| Analyte Types | Primarily small molecules (metabolites, toxins, nutrients) [12] | Broad range (small molecules, proteins, viruses, whole cells) [10] [13] |
| Regeneration & Reusability | Often limited due to enzyme instability over repeated catalytic cycles | Good; binding events are often reversible, allowing surface regeneration [10] |
| Response Time | Typically fast (seconds to minutes) due to rapid catalysis [2] | Can be slower (minutes to hours), dependent on binding kinetics and diffusion [13] |
| Stability | Moderate; activity can degrade with temperature, pH, and time [12] | Generally high; antibodies and DNA are more robust than enzymes [10] |
Key Experimental Protocols in Enzymatic Biosensing
To illustrate the practical application of the principles discussed, below are detailed methodologies for two pivotal experiments that highlight different transduction mechanisms and sensor designs.
Protocol 1: Amperometric Detection of Glucose with a First-Generation Biosensor
This protocol outlines the construction and testing of a classic first-generation biosensor for glucose, based on the immobilization of Glucose Oxidase (GOx) and amperometric detection of hydrogen peroxide [12].
- Objective: To detect and quantify glucose concentration by measuring the anodic current generated from the enzymatic production of H₂O₂.
- Principle: GOx catalyzes the oxidation of β-D-glucose to D-glucono-1,5-lactone, while simultaneously reducing its FAD cofactor to FADH₂. The enzyme is then re-oxidized by oxygen, producing hydrogen peroxide. The H₂O₂ is oxidized at a platinum electrode (typically at +0.7 V vs. Ag/AgCl), generating a current proportional to the glucose concentration [12].
- Reactions:
- Glucose + GOx(FAD) → Gluconolactone + GOx(FADH₂)
- GOx(FADH₂) + O₂ → GOx(FAD) + H₂O₂
- H₂O₂ → O₂ + 2H⁺ + 2e⁻ (at the electrode)
- Reactions:
Experimental Workflow:
- Step-by-Step Procedure:
- Electrode Preparation: Clean and polish a platinum working electrode, along with its counter and reference electrodes, to ensure a fresh, active surface.
- Enzyme Immobilization: Immobilize Glucose Oxidase (GOx) onto the surface of the Pt electrode. This can be achieved via cross-linking with glutaraldehyde, entrapment within a polymer matrix (e.g., Nafion), or adsorption.
- Apparatus Setup: Place the modified working electrode, an Ag/AgCl reference electrode, and a platinum counter electrode into an electrochemical cell containing a buffer solution (e.g., phosphate buffer, pH 7.4).
- Applied Potential: Apply a constant potential of +0.7 V versus the Ag/AgCl reference electrode to the working electrode using a potentiostat.
- Baseline Stabilization: Allow the background current to stabilize.
- Calibration and Measurement: Inject known concentrations of glucose standard solutions into the cell. The enzyme catalyzes the reaction, producing H₂O₂, which is oxidized at the electrode surface, resulting in a measurable current spike.
- Data Recording: Record the steady-state current for each glucose addition.
- Analysis: Plot the current response versus glucose concentration to obtain a calibration curve. The concentration of an unknown sample can be determined from this curve.
Protocol 2: Colorimetric Detection of Glucose via Nanoparticle Generation
This protocol describes a modern, dual-path colorimetric biosensor that induces the enzyme-catalyzed formation of Prussian Blue Nanoparticles (PBNPs) for the sensitive detection of glucose, demonstrating a non-electrochemical transduction method [14].
- Objective: To detect glucose by quantifying the formation of PBNPs through a UV-Vis spectrophotometer.
Principle: Glucose oxidase (GOx) catalyzes the oxidation of glucose, generating gluconic acid and H₂O₂. The H₂O₂ then reduces Fe³⁺ to Fe²⁺. Simultaneously, the GOx catalytic turnover can involve K₃Fe(CN)₆, leading to the generation of K₄Fe(CN)₆. The resulting Fe²⁺ ions and [Fe(CN)₆]⁴⁻ ions combine to form Prussian Blue Nanoparticles (PBNPs), which have a strong absorption in the visible region, turning the solution from light yellow to blue [14]. This dual-path mechanism enhances the yield of PBNPs and improves detection sensitivity.
Step-by-Step Procedure:
- Reagent Preparation: Prepare a solution containing GOx, FeCl₃, and K₃Fe(CN)₆ in a suitable buffer.
- Sample Introduction: Add the glucose-containing sample (e.g., white grape wine) to the reaction solution.
- Incubation: Allow the reaction to proceed for a fixed time (e.g., 10 minutes) at room temperature.
- Color Development: Observe the color change of the solution from light yellow to deep blue, indicating the formation of PBNPs.
- Signal Measurement: Transfer an aliquot of the solution to a cuvette and measure the absorbance using a UV-Vis spectrophotometer at a wavelength of ~700 nm.
- Quantification: Construct a calibration curve by plotting the absorbance against known glucose concentrations. The concentration of the unknown sample is interpolated from this curve.
- Validation: Compare the results with a standard method such as HPLC to validate accuracy [14].
The Scientist's Toolkit: Essential Research Reagents and Materials
The following table catalogs key reagents, materials, and instruments essential for developing and conducting experiments with enzymatic biosensors, as derived from the cited protocols and reviews.
Table 3: Research Reagent Solutions for Enzymatic Biosensor Development
| Item | Function/Application | Example from Protocols |
|---|---|---|
| Glucose Oxidase (GOx) | Model enzyme for biorecognition of glucose [12] [14]. | Core bioreceptor in both amperometric and colorimetric glucose sensors. |
| Alkaline Phosphatase (AlkP) | Model enzyme used in assays and for enzyme protection studies with nanoparticles [15]. | Au@Ag₂O core-shell nanoparticles can protect AlkP activity in hostile environments [15]. |
| Redox Mediators (e.g., Ferrocene) | To shuttle electrons in second-generation biosensors, lowering operating potential [5]. | Used to improve performance and reduce interference from ascorbate, urate, etc. |
| Prussian Blue (PB) | An artificial peroxidase; also a product of colorimetric detection [14]. | Detection nanoparticle formed in the colorimetric glucose assay. |
| Nafion Polymer | A cation-exchange polymer used for enzyme immobilization and electrode modification [12]. | Entraps enzymes on the electrode surface while allowing diffusion of small molecules. |
| Screen-Printed Electrodes (SPEs) | Disposable, mass-producible electrodes for portable, low-cost biosensing [13]. | Platform for commercial and lab-scale electrochemical biosensors. |
| Potentiostat/Galvanostat | Instrument for applying potential and measuring current in electrochemical experiments [12]. | Essential for amperometric, potentiometric, and impedimetric measurements. |
| UV-Vis Spectrophotometer | Instrument for measuring absorbance in colorimetric and optical biosensors [14]. | Used to quantify the intensity of the color change in the PBNP-based assay. |
Enzymatic biosensors, with their foundation in catalytic signal generation, offer a powerful and well-established platform for the detection of a wide array of analytes. Their key advantages, including inherent signal amplification and rapid response times, make them indispensable in fields ranging from clinical diagnostics to food safety and environmental monitoring. However, their performance is intrinsically linked to the stability of the enzymatic component. The direct comparison with affinity biosensors reveals a trade-off: enzymatic biosensors provide catalytic amplification but can lack the long-term stability and broad target range of their affinity-based counterparts. The ongoing integration of nanomaterials and novel immobilization strategies, as evidenced by the cited research, continues to push the boundaries of sensitivity, stability, and miniaturization, ensuring that enzymatic biosensors will remain a vital tool for researchers and drug development professionals in the quest for advanced analytical solutions.
Biosensors are analytical devices that integrate a biorecognition element with a transducer to produce a measurable signal for detecting specific analytes. Within this field, a fundamental distinction exists between enzymatic biosensors and affinity biosensors. Enzymatic biosensors, the focus of this guide, utilize biological catalysts, such as enzymes, that convert the target analyte into a detectable product. The signal generated is typically proportional to the catalytic reaction rate and, thus, the analyte concentration. In contrast, affinity biosensors (e.g., those using antibodies, aptamers, or molecularly imprinted polymers) rely on binding events between the bioreceptor and the analyte to form a stable complex, which is then measured without consuming the analyte. [16]
This guide provides a comparative analysis of four key enzymes—glucose oxidase, urease, acetylcholinesterase, and lactate oxidase—within the context of enzymatic biosensing. We objectively compare their performance based on experimental data, detail standard experimental protocols, and situate their utility within the broader research landscape opposing enzymatic and affinity-based approaches.
Performance Comparison of Key Enzymes
The performance of enzymatic biosensors is quantified by several key metrics, including sensitivity, detection limit, linear range, and stability. The table below summarizes experimental data for the four key enzymes, illustrating their performance in detecting various analytes.
Table 1: Performance Comparison of Enzymatic Biosensors
| Enzyme | Analyte | Detection Principle | Linear Range | Detection Limit | Stability/Other Features | Citation |
|---|---|---|---|---|---|---|
| Glucose Oxidase (GOx) | Glucose | Electrochemical (Mediated) | 0.6 - 26.3 mM | - | Narrower linear range for PEDOT-based sensors | [17] |
| Glucose Oxidase (GOx) | Glucose | Electrochemical (H2O2) | 0.03 - 16.5 mM | 3.1 µM | 85.83% current after 200 cycles | [17] |
| Urease | Urea | Potentiometric | - | - | 70-day validity, 15.2 mV/dec sensitivity | [18] |
| Urease | Urea | EIS / DNA Conformational Change | 0.01 - 50 U/L | 0.0028 U/L | - | [19] |
| Acetylcholinesterase (AChE) | Organophosphorus Pesticides | Electrochemical (MWCNT-IL1) | - | 3.3 × 10⁻¹¹ M | 98.5% reactivity over two weeks | [18] |
| Acetylcholinesterase (AChE) with HRP | Organophosphorus Pesticides | Electrochemical (Cl/MWCNTs) | 1.0 × 10⁻¹¹ – 1.0 × 10⁻⁷ mol/L | 4.5 × 10⁻¹² mol/L | >96.5% stability within four weeks | [18] |
| Lactate Oxidase (LOx) | Lactate | Electrochemical (SPB) | - | - | Used in self-powered biosensors for sweat analysis | [20] |
Experimental Protocols and Workflows
Generalized Enzyme Immobilization Techniques
A critical step in biosensor fabrication is the effective immobilization of the enzyme onto the transducer surface. Common techniques include:
- Physical Adsorption: The enzyme is attached to the material surface through weak forces (van der Waals, ionic, hydrogen bonds). It is simple but can lead to enzyme leaching. [20]
- Covalent Binding: Enzymes are tethered to a functionalized surface (e.g., with -NH2, -COOH) via stable covalent bonds. This method enhances operational stability and prevents leaching. [18] [20]
- Entrapment: The enzyme is physically confined within a polymeric network (e.g., conducting polymers, hydrogels, silica gels) or a membrane. This protects the enzyme but can introduce diffusion barriers. [18] [20]
- Cross-linking: Enzymes are linked to each other or to other proteins (e.g., Bovine Serum Albumin) using bifunctional reagents (e.g., glutaraldehyde) to form a stable, insoluble matrix. [18] [20]
Specific Experimental Workflows
Workflow 1: Acetylcholinesterase (AChE) Sensor for Pesticide Detection
This protocol details the creation of a high-sensitivity sensor for organophosphorus pesticides using functionalized multi-walled carbon nanotubes (MWCNTs). [18]
Diagram 1: AChE pesticide sensor workflow.
Key Steps:
- Carrier Preparation: Multi-walled carbon nanotubes (MWCNTs) are functionalized with various groups (-SH, -NH2
- Enzyme Immobilization: Acetylcholinesterase (AChE) is immobilized onto the functionalized MWCNTs. The ionic liquid-modified MWCNTs (IL1-MWCNTs) were found to be optimal carriers. [18]
- Electrode Fabrication: The AChE/MWCNTs suspension is cast onto the surface of a Glassy Carbon Electrode (GCE) and dried. [18]
- Inhibition and Measurement: Under optimal conditions (pH 7.0, 0.25 U AChE, 14 min inhibition), the biosensor is exposed to the sample. Pesticides inhibit AChE, and the decrease in electrochemical current, measured via the enzymatic reaction, is proportional to the pesticide concentration. [18]
Workflow 2: Urease/GOx Detection via DNA Conformational Change
This innovative protocol detects enzyme activity indirectly by coupling the enzymatic reaction to a pH-induced DNA conformational switch, measured by Electrochemical Impedance Spectroscopy (EIS). [19]
Diagram 2: Urease/GOx DNA conformational-change sensor.
Key Steps:
- DNA Synthesis: A C-rich DNA strand is catalytically synthesized using Terminal Deoxynucleotidyl Transferase (TdT). [19]
- Enzymatic Reaction & pH Change:
- DNA Conformational Change: In an acidic environment, cytosines in the DNA strand are protonated, forming a compact i-motif structure. In an alkaline environment, the structure deprotonates and unfolds. [19]
- Electrochemical Detection: The conformational change of the DNA on the electrode surface alters the interfacial properties, which is measured as a change in electrochemical impedance (EIS). The impedance change is proportional to the activity of GOx or urease. [19]
The Scientist's Toolkit: Essential Research Reagents
The development and fabrication of high-performance enzymatic biosensors rely on a suite of specialized materials and reagents. The following table details key components and their functions in a typical biosensor research and development process.
Table 2: Essential Reagents for Enzymatic Biosensor Research
| Category | Item | Primary Function in Biosensor Development |
|---|---|---|
| Enzymes | Glucose Oxidase (GOx), Urease, Acetylcholinesterase (AChE), Lactate Oxidase (LOx) | Biorecognition Element: The core biological component that specifically catalyzes a reaction with the target analyte. |
| Electrode Materials | Glassy Carbon Electrode (GCE), Screen-Printed Carbon Electrodes (SPCE), Pt wire, Ag/AgCl reference electrode | Transducer Platform: Provides the conductive surface for electron transfer and enzyme immobilization. |
| Nanomaterials | Multi-Walled Carbon Nanotubes (MWCNTs), Graphene, MXene, Metal Nanoparticles (Au, Pt) | Signal Enhancement: Increase electrode surface area, improve electron transfer kinetics, and provide a stable matrix for enzyme immobilization. |
| Immobilization Reagents | Glutaraldehyde, Chitosan, Nafion, Ionic Liquids, Bovine Serum Albumin (BSA) | Enzyme Stabilization: Used to cross-link, entrap, or covalently bind enzymes to the electrode surface, enhancing stability and reusability. |
| Electrochemical Mediators | Ferrocene derivatives, Ferricyanide, Methylene Blue | Electron Shuttling: Facilitate electron transfer between the enzyme's active site and the electrode surface, especially in 2nd generation biosensors. |
| Buffer Components | Phosphate Buffered Saline (PBS), KCl | Reaction Environment: Maintain optimal pH and ionic strength for enzymatic activity and electrochemical stability. |
The selection of an appropriate enzyme is paramount in designing effective biosensors. As demonstrated, glucose oxidase, urease, acetylcholinesterase, and lactate oxidase each enable highly sensitive and specific detection of their respective analytes, from metabolic markers to environmental toxins. The choice between an enzymatic biosensor and an affinity biosensor ultimately depends on the application's requirements. Enzymatic sensors are ideal when the target is a substrate that can be catalytically converted, offering the advantage of signal amplification and continuous monitoring. In contrast, affinity biosensors are indispensable for detecting non-catalytic targets like proteins or whole cells. Future advancements will continue to rely on interdisciplinary innovation in enzyme engineering, nanomaterial science, and signal transduction mechanisms to push the boundaries of sensitivity, stability, and real-world applicability.
Affinity biosensors constitute a powerful class of analytical devices that exploit the specific binding interactions between a biological recognition element and a target analyte. Unlike their enzymatic counterparts, which rely on catalytic conversion of a substrate, affinity biosensors are founded on molecular recognition events—such as antibody-antigen binding, aptamer-target complexation, or nucleic acid hybridization—to generate a measurable signal [1]. This fundamental distinction underpins their application in detecting a vast array of substances, from small molecules and proteins to entire cells and viruses. The core strength of affinity biosensors lies in their exceptional specificity and high affinity, often rivaling or even surpassing that of enzymatic biosensors, particularly for targets where no suitable enzyme exists [21] [22].
The field is being propelled by several key trends, including the integration of nanomaterials to enhance signal transduction and sensitivity, the miniaturization of devices for point-of-care testing, and the growing use of synthetic bioreceptors like aptamers [23] [5]. Furthermore, the emergence of artificial intelligence is beginning to augment biosensor functionality by processing complex data to improve sensitivity and provide predictive insights, though this integration also introduces new considerations for diagnostic accuracy [4]. This guide provides a detailed comparison of the primary affinity bioreceptors—antibodies, aptamers, and nucleic acid probes—framed within the broader context of biosensor research and development.
Comparative Analysis of Affinity Bioreceptors
The performance of an affinity biosensor is largely dictated by the properties of its bioreceptor. The table below provides a structured comparison of the three major types.
Table 1: Performance Comparison of Key Affinity Bioreceptors
| Feature | Antibody-Based | Aptamer-Based | Nucleic Acid Probes (Genosensors) |
|---|---|---|---|
| Bioreceptor Type | Immunoglobulin proteins | Single-stranded DNA or RNA oligonucleotides | Single-stranded DNA or RNA oligonucleotides |
| Target Examples | Proteins, viruses, cells [1] | Ions, small molecules, proteins, cells [1] [21] | Complementary DNA or RNA sequences [1] |
| Binding Mechanism | High-specificity lock-and-key interaction with antigens [1] | Structure-forming recognition via induced fit [1] [22] | Complementary base-pairing (A-T, C-G) [1] |
| Key Advantage | Exceptional specificity; well-established protocols | Superior stability; design flexibility; in-vitro selection [21] [22] | High predictability; universal base-pairing rules |
| Key Limitation | Sensitive to conditions (pH, temperature); expensive production [1] | Susceptible to nuclease degradation (RNA aptamers) | Limited to nucleic acid targets or tagged molecules |
| Typical Binding Constant (K_d) | Often >10⁸ L/mol (near-irreversible) [1] | Picomolar to micromolar range [22] | N/A (Hybridization efficiency is key) |
| Development & Production | In vivo (animal hosts); batch-to-batch variation | In vitro (SELEX process); synthetic; high reproducibility [21] [22] | Chemical synthesis; highly reproducible |
Experimental Protocols in Affinity Biosensing
Robust experimental protocols are critical for developing reliable affinity biosensors. The following sections detail common methodologies for sensor fabrication and signal detection.
Bioreceptor Immobilization and Sensor Fabrication
The stable and oriented attachment of bioreceptors onto a transducer surface is a crucial first step. Key techniques include:
- Covalent Binding: Biomolecules are immobilized via stable covalent bonds between functional groups on the receptor (e.g., -NH₂, -COOH) and the sensor surface, often activated by chemicals like glutaraldehyde or EDC/NHS. This method provides high stability and minimizes leaching [18].
- Physical Adsorption: Relies on non-specific interactions like hydrophobic forces or van der Waals forces. While simple and cost-effective, it can lead to random orientation and desorption of the bioreceptor [5].
- Avidin-Biotin Interaction: Exploits one of the strongest known non-covalent bonds. Biotinylated bioreceptors (antibodies, aptamers) are attached to avidin- or streptavidin-coated surfaces. This method offers precise orientation and high binding strength [1].
- Self-Assembled Monolayers (SAMs): Used on gold surfaces, where thiolated nucleic acid probes or aptamers form dense, highly ordered layers, facilitating efficient hybridization and target recognition [23].
Signal Transduction and Detection Methods
The binding event is converted into a quantifiable signal through various transduction mechanisms:
- Electrochemical Transduction: This is the most prevalent method in affinity biosensing. It measures changes in electrical properties (current, potential, impedance) due to the binding event [18] [10]. For instance, electrochemical impedance spectroscopy (EIS) is highly sensitive to surface changes upon target binding, often used in label-free detection [23].
- Optical Transduction: Measures changes in light properties. This includes surface plasmon resonance (SPR), which detects refractive index changes near a metal surface, and fluorescence, where a labeled bioreceptor emits light upon binding [1].
- Mass-Sensitive Transduction: Devices like piezoelectric crystals (e.g., quartz crystal microbalances) measure the change in oscillating frequency when a mass (the bound target) is added to the sensor surface [1].
The Scientist's Toolkit: Essential Research Reagents
The development and application of affinity biosensors rely on a suite of specialized reagents and materials.
Table 2: Key Reagents and Materials for Affinity Biosensor Development
| Reagent/Material | Function | Example Applications |
|---|---|---|
| Nanomaterials (CNTs, Graphene, Metal NPs) [18] [5] | Enhance electron transfer, increase surface area for immobilization, act as signal labels. | MWCNTs used for immobilizing acetylcholinesterase in organophosphorus pesticide sensors [18]. |
| Immobilization Reagents (Glutaraldehyde, EDC/NHS) [18] | Create covalent bonds between bioreceptors and transducer surfaces. | Cross-linking enzymes to electrodes; functionalizing surfaces for antibody attachment. |
| Signal Labels (Enzymes, Fluorescent Dyes, Metal Nanoparticles) [1] | Generate or amplify the detectable signal in labeled assay formats. | Horseradish peroxidase (HRP) used for signal amplification in electrochemical immunosensors. |
| Affinity Pairs (Avidin-Biotin, Thiol-Gold) [1] | Provide a robust and specific method for immobilizing bioreceptors with controlled orientation. | Attaching thiolated DNA aptamers to gold electrodes for genosensors. |
| Blocking Agents (BSA, Casein) [18] | Cover non-specific binding sites on the sensor surface to reduce background noise. | Used in immunosensors to prevent non-specific adsorption of proteins to the electrode. |
Signaling Pathways and Experimental Workflows
The fundamental working principle of an affinity biosensor involves a cascade of steps from biorecognition to signal output. The following diagram visualizes this core pathway.
A critical experimental workflow in this field involves the development and testing of nanomaterial-enhanced biosensors. This process, outlined below, integrates material science with analytical biochemistry to create highly sensitive devices.
The strategic selection of a bioreceptor—be it an antibody, aptamer, or nucleic acid probe—is paramount in the design of affinity biosensors, as it directly dictates the sensor's specificity, applicability, and overall performance. Antibodies remain the gold standard for many immunoassays due to their mature technology and high specificity, while aptamers offer a powerful, synthetic alternative with superior stability and design flexibility [21] [22]. Nucleic acid probes provide an indispensable tool for genetic analysis. The ongoing integration of advanced nanomaterials and sophisticated immobilization techniques continues to push the boundaries of sensitivity and miniaturization, particularly for point-of-care diagnostics [23] [18] [5].
Looking forward, the convergence of affinity biosensors with artificial intelligence promises to unlock new capabilities in data analysis and diagnostic accuracy, though it also necessitates careful validation to mitigate risks of false results [4]. Furthermore, the exploration of novel synthetic binding proteins and the refinement of direct electron transfer mechanisms on nano-structured surfaces [20] represent exciting frontiers. As the field evolves, the comparative framework presented here will aid researchers and drug development professionals in making informed choices, ultimately accelerating the development of next-generation biosensing platforms for healthcare, environmental monitoring, and beyond.
Biosensors are powerful analytical devices that combine a biorecognition element with a transducer to produce a measurable signal for detecting specific analytes. The core of every biosensor is its biorecognition mechanism, which fundamentally operates through one of two principles: catalysis or binding. Catalytic mechanisms, primarily employing enzymes, convert the target analyte into a measurable product. In contrast, binding mechanisms, utilizing elements like antibodies or aptamers, rely on specific affinity interactions to form stable complexes with the target. Understanding the distinctions between these mechanisms is crucial for researchers, scientists, and drug development professionals to select the optimal biosensor paradigm for their specific applications, whether in clinical diagnostics, environmental monitoring, or biotechnological development. This guide provides a comprehensive comparison of these mechanisms, supported by experimental data and methodological protocols, to inform strategic decision-making in biosensor development and application.
Fundamental Principles and Mechanisms
Catalytic Biorecognition Elements
Catalytic biosensors predominantly use enzymes as their biorecognition elements. Enzymes are proteinaceous molecules that act as biocatalysts, significantly accelerating the conversion of a specific substrate (the target analyte) into a product while remaining unchanged themselves [24]. The mechanism of action involves the substrate binding to the enzyme's active site to form a transient enzyme-substrate complex. This complex lowers the activation energy required for the reaction, facilitating the formation of products, which are then released, freeing the enzyme for another catalytic cycle [24]. The "Lock and Key" hypothesis, proposed by Emil Fischer, suggests the active site is geometrically complementary to the substrate. In contrast, the more contemporary "Induced Fit" hypothesis, proposed by Koshland, posits that the active site is flexible and adjusts its conformation to optimally bind the substrate [24]. In biosensors, this catalytic conversion is coupled to a transducer that quantifies the reaction, for instance, by measuring the consumption of a co-substrate (e.g., oxygen), the generation of a product (e.g., hydrogen peroxide), or the transfer of electrons [17].
caption: Catalytic cycle of an enzyme-based biosensor.
Affinity-Based Biorecognition Elements
Affinity-based biosensors rely on the specific binding between a biorecognition element and the target analyte to form a stable complex, without catalyzing a chemical transformation of the target. The formation and dissociation of this complex are the critical events monitored by the transducer. Common affinity elements include antibodies, aptamers, and nucleic acids [16] [25]. Antibodies are Y-shaped proteins that recognize and bind to specific regions (epitopes) on antigens with high specificity. Aptamers are single-stranded oligonucleotides (DNA or RNA) selected through the SELEX (Systemic Evolution of Ligands by Exponential Enrichment) process to bind with high affinity to a wide range of targets, from small molecules to whole cells [16]. The binding event itself is the source of specificity, and signal transduction often relies on measuring a physical change upon complex formation, such as mass, refractive index, or electrical impedance [25].
caption: Affinity-based biosensor binding mechanism.
Performance Comparison and Experimental Data
The choice between catalytic and affinity-based mechanisms profoundly impacts key biosensor performance characteristics, including sensitivity, selectivity, and reusability. The table below summarizes the comparative performance of these two paradigms.
Table 1: Performance Comparison of Catalytic vs. Affinity-Based Biosensors
| Performance Characteristic | Catalytic (Enzymatic) Biosensors | Affinity-Based Biosensors |
|---|---|---|
| Fundamental Mechanism | Biocatalytic conversion of analyte [16] | Affinity-based formation of a stable complex [16] |
| Primary Biorecognition Elements | Enzymes (e.g., Glucose Oxidase) [17] | Antibodies, Aptamers, Nucleic Acids [16] [25] |
| Typical Transduction Methods | Amperometric, Potentiometric [17] | Piezometric, Impedimetric, Optical (e.g., SPR) [16] [25] |
| Sensitivity | High; can be amplified by catalytic turnover [16] | Very high; dependent on binding affinity [16] |
| Selectivity | High for specific substrates [17] | Very high; can distinguish molecular epitopes [16] |
| Reproducibility | Can be impacted by enzyme stability [16] | Generally high with stable biorecognition elements [26] |
| Reusability | Limited if enzyme is inactivated [16] | Possible with efficient regeneration protocols [16] |
| Key Advantage | Signal amplification via catalytic turnover | Wide applicability to non-catalytic targets (cells, proteins) [25] |
| Key Limitation | Limited to substrates of enzymatic reactions | Binding event may require secondary labeling |
Quantitative data further illuminates these differences. For instance, a global benchmark study using affinity-based biosensors demonstrated high reproducibility across multiple laboratories and platforms. When analyzing a Fab-GST protein interaction, the reported affinity was 620 pM with a standard deviation of 980 pM after optimizing assay design and removing outliers, underscoring the reliability of well-executed affinity-based methods [26]. In catalytic sensors, performance is often described by the Michaelis-Menten parameters ( k{cat} ) (catalytic rate constant) and ( KM ) (Michaelis constant, inversely related to binding affinity) [27]. A high catalytic efficiency (( k{cat}/KM )) can be achieved either through a high ( k{cat} ) (fast catalysis) or a low ( KM ) (tight binding). This distinction is critical for applications; a high ( k_{cat} ) is essential for achieving high reaction rates at elevated substrate concentrations common in industrial settings [27].
Table 2: Representative Experimental Data from Biosensor Studies
| Biosensor Type | Target / Application | Key Performance Metric | Reported Result | Source |
|---|---|---|---|---|
| Affinity-Based | Protein-Protein Interaction (Fab-GST) | Binding Affinity (KD) | 620 ± 980 pM | [26] |
| Catalytic (3rd Gen) | Glucose Detection | Linear Range / LOD | 0.03–16.5 mM / 3.1 µM | [17] |
| Catalytic (3rd Gen) | Glucose Detection | Sensitivity | 48.98 µA mM⁻¹ cm⁻² | [17] |
| Catalytic | De Novo Luciferase | Catalytic Efficiency (( k{cat}/KM )) | ~ 10⁶ M⁻¹s⁻¹ | [27] |
Experimental Protocols and Methodologies
Development of a Catalytic Glucose Biosensor
The development of enzymatic glucose biosensors has evolved through three primary generations, each refining the electron transfer mechanism [17].
First-Generation Biosensors: These sensors utilize oxygen as a natural electron acceptor. Glucose oxidase (GOx) catalyzes the oxidation of glucose, consuming oxygen and producing hydrogen peroxide (H₂O₂). The sensor signal is generated by amperometrically measuring the decrease in oxygen or the increase in H₂O₂ at a fixed potential. A key challenge is interference from dissolved oxygen fluctuations and the need for a high working potential to detect H₂O₂, which can also oxidize other interfering species in the sample (e.g., ascorbic acid, acetaminophen). Solutions have included the use of mass transport-limiting membranes or oxygen-rich carbon paste electrodes [17].
Second-Generation Biosensors: This generation introduced synthetic redox mediators (e.g., ferrocene derivatives, ferricyanide) to replace oxygen as the electron shuttle. The mediator accepts electrons from the reduced enzyme and is then re-oxidized at the electrode, generating the measurable current. This allows the sensor to operate at a lower, more selective potential, minimizing electrochemical interferences. However, potential mediator toxicity and leaching can be limitations [17].
Third-Generation Biosensors: The goal of this paradigm is Direct Electron Transfer (DET), where electrons move directly between the enzyme's redox center (e.g., FAD in GOx) and the electrode surface, without mediators. This simplifies the design and improves stability. The major challenge is that the redox center is often deeply embedded within the enzyme's protein structure. Nanomaterials like carbon nanotubes and graphene are frequently employed to facilitate closer contact and enhance DET [17].
Benchmarking an Affinity-Based Biosensor
A comprehensive protocol for benchmarking an affinity biosensor, as derived from a global study, involves several critical steps to ensure accurate and reproducible determination of kinetic parameters like association (( ka )) and dissociation (( kd )) rate constants, and the equilibrium dissociation constant (( K_D )) [26].
- Ligand Immobilization: One interacting partner (the ligand) must be immobilized on the sensor surface in a way that preserves its activity and minimizes non-specific binding. Common strategies include covalent coupling via amine, thiol, or carboxyl groups. The immobilization level must be optimized, as excessively high density can lead to steric hindrance and mass transport limitations, distorting the kinetic analysis.
- Analyte Titration: The other partner (the analyte) is injected over the sensor surface in a series of concentrations (typically at least a 5-10 fold range). The injection time must be long enough to observe saturating binding, which is critical for accurate kinetic fitting.
- Surface Regeneration: After each analyte injection, the sensor surface must be regenerated—meaning the bound analyte is removed without damaging the immobilized ligand. This allows the same sensor surface to be reused for multiple analyte cycles. Finding a suitable regeneration condition (often a low or high pH buffer) is a crucial and often empirical step in assay development.
- Data Fitting and Analysis: The resulting sensorgrams (plots of response vs. time) are fitted to an appropriate interaction model (e.g., 1:1 Langmuir binding) using specialized software to extract the kinetic rate constants. The quality of the fit and the consistency of the derived parameters across a range of analyte concentrations and immobilization levels are key indicators of a robust assay.
The Scientist's Toolkit: Essential Research Reagents and Materials
The following table details key reagents and materials essential for developing and working with both catalytic and affinity-based biosensors.
Table 3: Essential Research Reagent Solutions for Biosensor Development
| Item | Function / Description | Relevance |
|---|---|---|
| Glucose Oxidase (GOx) | A model oxidoreductase enzyme that catalyzes glucose oxidation. | Core biorecognition element for catalytic glucose biosensors [17]. |
| Redox Mediators (e.g., Ferrocene) | Small molecules that shuttle electrons between the enzyme and electrode. | Enables second-generation biosensor design, mitigating oxygen dependence [17]. |
| Monoclonal Antibodies | Antibodies with monospecificity towards a single epitope. | High-quality affinity reagents for immunosensors; provide superior specificity [16]. |
| Aptamers | Single-stranded DNA or RNA oligonucleotides selected for high-affinity binding. | Synthetic affinity biorecognition elements; can target a wide range of analytes, from ions to cells [16]. |
| Carbon Nanomaterials (CNTs, Graphene) | Nanostructures with high surface area and excellent conductivity. | Enhance electron transfer in DET-based catalytic sensors; improve immobilization capacity [20] [17]. |
| N-Hydroxysuccinimide (NHS) / EDC | Carbodiimide crosslinker chemistry. | Standard method for covalent immobilization of proteins (enzymes, antibodies) onto sensor surfaces [16]. |
| Regeneration Buffers (e.g., low pH Glycine) | Solutions used to dissociate bound complexes from affinity surfaces. | Critical for reusing affinity-based biosensor chips in multiple analysis cycles [26]. |
Application Contexts and Selection Guidelines
The choice between catalytic and affinity-based biosensors is heavily influenced by the target analyte and the application's requirements.
Catalytic biosensors are ideal when the target is a specific substrate for an enzymatic reaction. Their most prominent success is in clinical monitoring of metabolites like glucose, lactate, and cholesterol, where the catalytic turnover provides a strong, amplifiable signal [17]. They are also the core of enzymatic biofuel cells (EBFCs) for self-powered sensors, which generate electricity from biological fuels [20].
Affinity biosensors are indispensable when the target is not a substrate for an enzyme but needs to be identified and bound. They are the preferred choice for detecting whole bacterial cells [25], specific proteins (e.g., antibodies, cytokines), nucleic acid sequences, and biomarkers for disease diagnosis. Their ability to be highly specific without requiring a catalytic reaction makes them universally applicable. For instance, they are crucial for rapid point-of-care diagnosis of infectious diseases like meningitis or sexually transmitted infections, where speed and specificity are critical for patient outcomes and preventing disease spread [25].
In conclusion, the decision to use a catalytic or affinity-based biosensor hinges on a careful evaluation of the target's nature, the required sensitivity and specificity, and the operational environment. Catalytic sensors excel in continuous monitoring of metabolites, while affinity sensors provide unmatched versatility for detecting a vast array of molecular and cellular targets. A deep understanding of their underlying mechanisms and performance characteristics, as outlined in this guide, is fundamental to advancing biosensor technology and its applications in drug development and clinical diagnostics.
Biosensors are analytical devices that integrate a biological recognition element with a physicochemical transducer to produce a measurable signal proportional to the concentration of a target analyte [2]. The core architecture of any biosensor comprises three essential components: a bioreceptor that specifically interacts with the target analyte, a transducer that converts the biological response into a quantifiable signal, and the electronic system that processes and displays this signal [5] [4]. Within this framework, biosensors are predominantly categorized into two principal classes based on their mechanism of biorecognition: enzymatic biosensors and affinity biosensors.
Enzymatic biosensors rely on biocatalytic receptors, typically enzymes, which recognize and convert a specific substrate into a product, generating a detectable signal in the process [2]. In contrast, affinity biosensors utilize biological affinity interactions—such as antibody-antigen, DNA-DNA, or aptamer-target binding—where the binding event itself is transduced into a signal without catalyzing a chemical reaction [2] [28]. This fundamental distinction in biorecognition strategy dictates the choice of electrodes, immobilization matrices, and transducers, ultimately shaping the performance, application, and limitations of the biosensing platform. This guide provides a structured comparison of these core components, underpinned by experimental data and methodologies, to inform their selection and optimization in research and development.
Performance Comparison: Enzymatic vs. Affinity Biosensors
The strategic choice between an enzymatic and an affinity-based approach hinges on the specific analytical requirements. The table below summarizes the characteristic performance metrics of well-developed examples from both categories.
Table 1: Performance Comparison of Representative Enzymatic and Affinity Biosensors
| Feature | Enzymatic Biosensor (Glucose Oxidase-Based) | Affinity Biosensor (COVID-19 Antibody Detection) |
|---|---|---|
| Bioreceptor | Glucose Oxidase (GOx) enzyme [17] | SARS-CoV-2 Spike (S) Protein [28] |
| Mechanism | Catalytic conversion of glucose to gluconolactone and H₂O₂ [17] | Affinity binding of anti-S antibodies in serum [28] |
| Typical Transducer | Electrochemical (Amperometric) [17] | Electrochemical (Impedimetric) [28] |
| Sensitivity | 48.98 µA mM⁻¹ cm⁻² (for a mGOx/MXene composite) [17] | 72% (relative to ELISA gold standard) [28] |
| Linear Range | 0.03 – 16.5 mM [17] | Qualitative (Positive/Negative discrimination demonstrated) [28] |
| Detection Limit | 3.1 µM [17] | Not specified; designed for serological status [28] |
| Assay Time | Real-time (seconds to minutes) [17] | ~2 hours [28] |
| Key Advantage | Continuous, real-time monitoring; high catalytic turnover [17] | High specificity for structural proteins; identifies immune response [28] |
| Key Limitation | Dependent on enzyme stability and activity [17] | Longer assay time; often requires a secondary probe [28] |
Table Legend: This table contrasts the operational parameters of a high-performance nanostructured glucose biosensor against an impedimetric affinity biosensor for detecting SARS-CoV-2 antibodies, highlighting the trade-offs between speed/sensitivity and specific identification.
The performance of a biosensor is intrinsically linked to the materials and design of its core components. The following table compares the typical elements used in the construction of these two biosensor classes.
Table 2: Comparison of Core Components in Enzymatic vs. Affinity Biosensors
| Core Component | Enzymatic Biosensor | Affinity Biosensor |
|---|---|---|
| Bioreceptor | Enzymes (e.g., Glucose Oxidase, Lactase) [29] [17] | Antibodies, Aptamers, Nucleic Acids, Proteins (e.g., Protein G) [2] [28] |
| Common Electrode Materials | Carbon-based materials (paste, nanotubes), Gold, Platinum [17] [5] | Gold, Gold nanoparticles, functionalized Silicon, printed electrodes (PET, PEN) [28] [30] |
| Common Immobilization Matrices | Polyacrylamide gel, Langmuir-Blodgett (LB) films, conducting polymers (e.g., polyaniline, PATs), Nafion/cellulose acetate composites [29] [17] | Self-Assembled Monolayers (SAMs), PEG-based linkers, dextran surfaces, silanized layers [31] [28] |
| Common Transducers | Amperometric (H₂O₂ detection), Potentiometric (ion concentration), Conductometric [17] [5] | Impedimetric, Surface Plasmon Resonance (SPR), Optical (Ellipsometry) [31] [28] |
Table Legend: This table outlines the standard toolkits of materials and transducers associated with enzymatic and affinity biosensors, reflecting their different operational principles and requirements.
Operational Mechanisms and Signaling Pathways
The fundamental distinction between enzymatic and affinity biosensors is evident in their signaling pathways. The following diagram illustrates the sequential biological and transduction events for each type.
Biosensor Signaling Pathways
Experimental Protocols for Biosensor Characterization
To obtain the performance data cited in this guide, researchers follow rigorous experimental protocols. Below are detailed methodologies for key experiments used to characterize and validate the two types of biosensors.
Protocol for a Nanostructured Enzymatic Glucose Biosensor
This protocol is adapted from the construction of a polygel glucose oxidase (PGOx) and MXene nanocomposite sensor [17].
- Electrode Preparation: A glassy carbon electrode is polished sequentially with alumina slurry (1.0, 0.3, and 0.05 µm) on a microcloth and thoroughly rinsed with deionized water. It is then sonicated in ethanol and water to remove any adsorbed particles.
- Nanocomposite Fabrication: Glucose oxidase polygels (PGOx) are synthesized via a radical polymerization process. Separately, MXene nanosheets (Ti₃C₂Tₓ) are prepared by selective etching of the MAX phase. The PGOx and MXene are then mixed in a defined ratio with a chitosan solution to form a homogeneous nanocomposite ink.
- Enzyme Immobilization: A precise volume (e.g., 5 µL) of the PGOx@MXene/CS ink is drop-cast onto the clean surface of the glassy carbon electrode and allowed to dry under ambient conditions, forming a stable, nanostructured enzymatic film.
- Electrochemical Measurement (Amperometry): The modified electrode is placed in an electrochemical cell containing a standard phosphate buffer saline (PBS, pH 7.4) as the supporting electrolyte. A constant potential (e.g., +0.6 V vs. Ag/AgCl) is applied. Aliquots of a stock glucose solution are successively added to the stirred buffer.
- Data Analysis: The steady-state current generated from the enzymatic oxidation of glucose and subsequent reduction of H₂O₂ is recorded after each addition. The current response is plotted against glucose concentration to establish the calibration curve, from which sensitivity, linear range, and limit of detection are calculated.
Protocol for an Impedimetric Affinity Biosensor for Antibodies
This protocol is adapted from the development of a SARS-CoV-2 antibody sensor using gold interdigitated electrodes (IDEs) [28].
- Surface Functionalization: Gold IDEs are subjected to an oxygen plasma treatment to create a clean, hydrophilic surface. The silica gaps between the gold fingers are silanized using an organosilane reagent (e.g., (3-aminopropyl)triethoxysilane, APTES) to introduce amine groups.
- Antigen Immobilization: The purified SARS-CoV-2 Spike (S) protein is activated using a crosslinking solution containing EDC (1-ethyl-3-(3-dimethylaminopropyl)carbodiimide) and NHS (N-hydroxysuccinimide). The activated S protein is then incubated with the aminated IDE surface, forming stable amide bonds and creating a monolayer of immobilized antigen.
- Blocking: The functionalized IDE is treated with a blocking agent, such as poly(vinyl alcohol) or bovine serum albumin (BSA), to cover any remaining non-specific binding sites on the surface.
- Sample Incubation and Signal Amplification: Serum samples (diluted in an appropriate buffer) are applied to the sensor surface and incubated to allow specific antibodies to bind to the immobilized S protein. After washing, a solution of Gold Nanoparticles (GNP) conjugated to Protein G is added. Protein G binds specifically to the Fc region of captured IgG antibodies, introducing GNPs onto the surface as an amplifying element.
- Impedance Measurement (EIS): Electrochemical Impedance Spectroscopy (EIS) is performed in a solution containing a redox probe, such as [Fe(CN)₆]³⁻/⁴⁻. The charge-transfer resistance (Rₑₜ) is measured before and after antibody capture and GNP-Protein G binding. A significant increase in Rₑₜ indicates the presence of the target antibody.
The workflow for this affinity biosensor is visualized below, detailing the key surface chemistry and detection steps.
Affinity Biosensor Workflow
The Scientist's Toolkit: Key Research Reagent Solutions
The development and fabrication of advanced biosensors rely on a specific set of materials and reagents. This table details essential items and their critical functions in biosensor research.
Table 3: Essential Research Reagents and Materials for Biosensor Development
| Reagent / Material | Function in Biosensor Development | Example Use Case |
|---|---|---|
| Gold Nanoparticles (GNP) | Signal amplification tags; enhance electron transfer; platform for bioreceptor conjugation [28]. | Conjugated to Protein G for sensitive detection of bound antibodies in impedimetric sensors [28]. |
| Carbon Nanotubes (CNTs) | Electrode nanomaterial; provide high surface area, excellent electrical conductivity, and good biocompatibility for enzyme immobilization [5]. | Used in nanocomposites to create high-sensitivity amperometric enzymatic electrodes [17]. |
| EDC / NHS Chemistry | Crosslinking system for covalent immobilization of biomolecules; activates carboxyl groups for coupling with amines [28]. | Used to form stable amide bonds between the S-protein antigen and an aminated sensor surface [28]. |
| Langmuir-Blodgett (LB) Films | A technique for creating highly ordered, ultra-thin films of amphiphilic molecules for precise immobilization of bioreceptors [29]. | Used to create organized films of conducting polymers like poly-3-hexylthiophene for enzyme (e.g., glucose oxidase) immobilization [29]. |
| Self-Assembled Monolayers (SAMs) | Spontaneously form organized molecular assemblies on surfaces (e.g., gold); provide a well-defined interface for bioreceptor attachment [29] [30]. | Alkanethiols on gold electrodes used to immobilize DNA aptamers or antibodies via thiol-gold chemistry [30]. |
| Redox Mediators (e.g., Ferrocene) | Shuttle electrons between the bioreceptor's active site and the electrode surface, overcoming dependence on oxygen [17]. | Essential for second-generation glucose biosensors to facilitate efficient electron transfer from FADH₂ in GOx [17]. |
| Specific Aptamers (e.g., Tro4, Tro6) | Single-stranded DNA or RNA molecules that bind targets with high affinity and specificity; serve as synthetic bioreceptors [30]. | Immobilized on gold electrodes via a thiol linker for label-free electrochemical detection of cardiac troponin I (cTnI) [30]. |
Table Legend: This toolkit lists critical reagents that enable the fabrication of modern, high-performance biosensors, from nanomaterials that enhance signal transduction to chemical linkers that ensure stable bioreceptor immobilization.
Applications in Action: From Medical Diagnostics to Industrial and Environmental Monitoring
Biosensors are analytical devices that combine a biological recognition element with a physicochemical detector to provide specific quantitative or semi-quantitative analytical information [1]. These devices have revolutionized medical diagnostics by enabling rapid, sensitive, and often decentralized testing for various health biomarkers. The two primary categories of biosensors—enzymatic and affinity-based—operate on fundamentally different principles, each with distinct advantages and limitations that make them suitable for specific diagnostic applications [32] [33]. Enzymatic biosensors typically utilize biological catalysts (enzymes) to recognize their specific substrate molecules, while affinity-based biosensors employ binding agents such as antibodies, aptamers, or nucleic acids to capture target analytes through specific molecular interactions [33].
The selection between enzymatic and affinity biosensing approaches represents a critical decision point in diagnostic development, with implications for analytical performance, operational stability, and practical implementation in clinical or point-of-care settings. This comparison guide examines both biosensor classes through the lens of three essential diagnostic applications: glucose monitoring, cholesterol detection, and biomarker identification. By objectively evaluating their respective performance characteristics, methodological requirements, and technological advancements, this analysis provides researchers and drug development professionals with evidence-based insights for selecting appropriate biosensing platforms for specific diagnostic challenges.
Fundamental Operating Principles and Signaling Pathways
Core Mechanisms of Enzymatic Biosensors
Enzymatic biosensors function through the catalytic activity of enzymes immobilized on a transducer surface [32]. When the target analyte (substrate) interacts with the enzyme, it triggers a biochemical reaction that consumes the substrate and generates products. This reaction leads to measurable changes in proton concentration, gas release/uptake, light emission, absorption, or heat generation [32]. The transducer then converts these changes into quantifiable electrical, optical, or thermal signals proportional to the analyte concentration.
Electrochemical enzymatic biosensors have evolved through three generations based on electron transfer mechanisms [32]. First-generation biosensors detect enzymatic products (e.g., H₂O₂) or co-factor consumption (e.g., oxygen). Second-generation systems employ artificial mediators to shuttle electrons between the enzyme and electrode, reducing dependence on oxygen. Third-generation biosensors achieve direct electron transfer between the enzyme's active site and the electrode without mediators [32].
Core Mechanisms of Affinity Biosensors
Affinity biosensors operate through specific molecular recognition events between a capture agent and its target analyte without catalytic transformation [34] [33]. These systems utilize biological binding elements such as antibodies, aptamers, single-stranded DNA, or artificial binding proteins that specifically capture the target molecule [1] [33]. The binding event induces physicochemical changes at the transducer interface, which are converted into measurable signals.
Unlike enzymatic biosensors that consume their targets, affinity biosensors typically form stable complexes that can be detected through various mechanisms including introduction of photoactive species, generation of electron/hole donors, steric hindrance effects, in situ induction of light, or resonance energy transfer [33]. This binding-based approach enables the detection of a wider range of targets, including non-catalytic molecules and complex structures like whole cells or viruses [1].
Comparative Performance Analysis for Diagnostic Applications
Analytical Performance Metrics for Key Diagnostic Targets
Table 1: Performance comparison of enzymatic vs. affinity biosensors for medical diagnostics
| Diagnostic Target | Biosensor Type | Detection Limit | Linear Range | Response Time | Stability | Key Advantages |
|---|---|---|---|---|---|---|
| Glucose | Enzymatic (Glucose oxidase) | ~0.1-10 μM [32] | 1 μM - 30 mM [32] | <30 seconds [32] | 2-4 weeks [32] | High specificity, continuous monitoring capability |
| Glucose | Affinity (Concanavalin A) | Not specified | 4.4-6.1 mmol/L [1] | Slower than enzymatic | Higher stability [1] | Reversible binding, does not consume analyte |
| Cholesterol | Enzymatic (Cholesterol oxidase) | ~0.5-5 μM [32] | 5 μM - 10 mM [32] | 1-5 minutes [32] | 2-4 weeks [32] | High catalytic turnover, excellent specificity |
| Protein Biomarkers | Affinity (Antibody/aptamer) | fM-pM range [34] [35] | pM-nM range [34] [35] | 5-30 minutes [34] | Days to weeks [34] | Broad detection capability, high sensitivity |
| Pathogens | Affinity (Nucleic acid) | ~10 fM [34] | fM-nM range [34] | 30-90 minutes [34] | Months (dry storage) [34] | Extreme specificity, multiplexing capability |
Experimental Protocols and Methodologies
Standard Protocol for Enzymatic Glucose Biosensing
Enzymatic glucose biosensors typically employ glucose oxidase (GOx) immobilized on an electrochemical transducer. The standard methodology involves:
- Electrode Preparation: Working electrodes (often gold, carbon, or platinum) are cleaned and functionalized to create reactive groups for enzyme immobilization [32] [36].
- Enzyme Immobilization: GOx is immobilized onto the electrode surface using techniques such as adsorption, covalent bonding, entrapment, or cross-linking [32]. Covalent immobilization via glutaraldehyde cross-linking provides stable enzyme layers with controlled orientation.
- Membrane Application: A semi-permeable membrane (e.g., Nafion or polyurethane) may be applied to limit substrate diffusion, reduce interference, and enhance operational stability [32].
- Electrochemical Measurement: Upon sample introduction, glucose diffuses to the enzyme layer where it is oxidized by GOx, producing gluconolactone and hydrogen peroxide. The generated H₂O₂ is detected amperometrically at +0.6V to +0.8V (vs. Ag/AgCl) [32]. Alternative detection strategies measure oxygen consumption or employ electron mediators to lower operating potentials.
- Calibration: Sensor response is calibrated against standard glucose solutions to establish the concentration-response relationship [32].
Standard Protocol for Affinity-Based Biomarker Detection
Affinity biosensors for protein biomarkers typically utilize antibody or aptamer recognition elements in various assay formats:
- Surface Functionalization: The transducer surface (often screen-printed electrodes or thin-film gold) is modified with self-assembled monolayers (e.g., thiols on gold) to create reactive interfaces for bioreceptor immobilization [34] [36].
- Bioreceptor Immobilization: Specific antibodies or aptamers are immobilized onto the functionalized surface through covalent coupling, adsorption, or affinity interactions (e.g., biotin-streptavidin) [34].
- Blocking: Non-specific binding sites are blocked with inert proteins (e.g., BSA) or polymer solutions to minimize background signal [34].
- Sample Incubation: The sample containing the target biomarker is applied and incubated to allow specific binding to the immobilized bioreceptor. Incubation times typically range from 10-30 minutes [34].
- Signal Generation and Detection: Direct label-free detection measures changes in electrical parameters (e.g., impedance, capacitance) upon target binding [34]. Sandwich formats use enzyme-labeled or nanomaterial-tagged secondary antibodies for signal amplification, followed by electrochemical (amperometric, voltammetric) or photoelectrochemical detection [34] [33].
- Regeneration: For reusable sensors, bound analytes are dissociated using low-pH buffers or chaotropic agents to regenerate the binding surface [34].
Research Reagent Solutions and Essential Materials
Table 2: Essential research reagents and materials for biosensor development
| Category | Specific Examples | Function in Biosensor Development |
|---|---|---|
| Biological Recognition Elements | Glucose oxidase, Cholesterol oxidase [32] | Enzyme substrates for catalytic detection of specific metabolites |
| Antibodies (monoclonal, polyclonal) [34] [1] | High-affinity capture agents for specific protein epitopes | |
| Aptamers (DNA/RNA) [34] [1] | Synthetic oligonucleotide recognition elements with high stability | |
| Single-stranded DNA probes [34] [33] | Specific sequence recognition for nucleic acid targets | |
| Transducer Materials | Screen-printed electrodes (gold, carbon) [36] | Disposable, cost-effective electrochemical platforms |
| Gold nanoparticles, Carbon nanotubes [34] [35] | Nanomaterials for signal amplification and enhanced electron transfer | |
| Quantum dots, Metal oxides [35] [33] | Semiconductor materials for photoelectrochemical and optical detection | |
| Immobilization Reagents | Glutaraldehyde [32] | Cross-linking agent for enzyme and protein immobilization |
| Self-assembled monolayers (thiols, silanes) [36] | Molecular layers for controlled surface functionalization | |
| NHS/EDC chemistry [32] [36] | Carbodiimide cross-linking for covalent immobilization | |
| Streptavidin-biotin systems [34] | High-affinity pairing for oriented immobilization | |
| Signal Generation Reagents | Horseradish peroxidase, Alkaline phosphatase [34] | Enzyme labels for catalytic signal amplification |
| Ferrocene derivatives, Methylene blue [34] [32] | Redox mediators for facilitated electron transfer | |
| Metal nanoparticles (Au, Ag) [35] | Nanomaterial labels for enhanced electrochemical signal |
Technological Advancements and Future Perspectives
Nanomaterial Integration in Biosensing Platforms
The integration of nanomaterials has significantly enhanced the performance of both enzymatic and affinity biosensors [35]. Nanostructures including metal nanoparticles, carbon nanotubes, graphene, and quantum dots provide high surface-to-volume ratios for increased bioreceptor loading, enhanced mass transport, and improved electrochemical properties [34] [35]. For enzymatic biosensors, nanomaterials facilitate direct electron transfer between enzyme active sites and electrode surfaces, enabling third-generation biosensing platforms with oxygen-independent operation [32]. In affinity biosensors, nanomaterials serve as efficient immobilization scaffolds and signal amplification tags, enabling ultrasensitive detection of biomarkers at fM concentrations [34] [35]. For instance, the incorporation of gold nanoparticles in DNA sensors has demonstrated 50-fold improvements in detection limits compared to non-amplified systems [35].
Emerging Trends: Artificial Intelligence and Multiplexing Capabilities
The convergence of biosensing technologies with artificial intelligence (AI) represents a transformative trend in medical diagnostics [4]. AI algorithms enhance biosensor functionality by processing complex biological data, recognizing patterns, and providing predictive insights that would be challenging to derive manually [4]. This synergy has led to breakthroughs in oncology and cardiology, where AI-enabled biosensors can identify critical biomarkers and monitor conditions in real time. Additionally, multiplexed detection platforms capable of simultaneously measuring multiple analytes are advancing personalized medicine approaches [35]. These systems employ array-based configurations with spatially resolved capture elements, allowing comprehensive biomarker profiling from minimal sample volumes—a capability particularly advantageous for affinity biosensors in complex diagnostic applications [34] [35].
The comparative analysis of enzymatic and affinity biosensors reveals complementary strengths that dictate their suitability for specific diagnostic applications. Enzymatic biosensors excel in monitoring metabolic biomarkers like glucose and cholesterol, offering rapid response, high specificity for their substrates, and well-established commercialization pathways [32]. Their limitations include restricted target scope (primarily enzyme substrates) and moderate stability due to enzyme denaturation. Conversely, affinity biosensors provide versatile platforms for detecting diverse targets including proteins, nucleic acids, and pathogens with exceptional sensitivity and specificity [34] [33]. While typically slower than enzymatic systems and often requiring multiple assay steps, their broad target recognition capabilities make them indispensable for comprehensive diagnostic panels.
The future trajectory of medical biosensing points toward integrated systems that leverage the advantages of both technologies. Hybrid approaches incorporating enzymatic amplification in affinity assays, continuous monitoring platforms for dynamic biomarker tracking, and AI-enhanced data analytics will advance diagnostic precision and accessibility [4] [35]. These developments will increasingly blur the traditional boundaries between enzymatic and affinity biosensors, creating multifunctional platforms capable of addressing the complex challenges of modern medical diagnostics.
Alanine aminotransferase (ALT) is a crucial enzyme primarily found in the liver, where it catalyzes the conversion of alanine and α-ketoglutarate to pyruvate and glutamate, playing a vital role in cellular nitrogen metabolism and liver gluconeogenesis [37]. Under normal physiological conditions, ALT levels in the bloodstream remain low (typically 4-36 U/L) [38]. However, when liver cells are damaged due to conditions such as hepatitis, liver cirrhosis, non-alcoholic fatty liver disease, or drug-induced liver injury, ALT is released into the bloodstream, causing its levels to rise significantly—sometimes reaching 8 to 35 times above the normal range [39] [38]. This elevation makes ALT one of the most sensitive and relatively specific biomarkers for liver health assessment, capable of indicating hepatocellular damage before clinical symptoms manifest [40] [38].
Traditional methods for ALT quantification, primarily spectrophotometric techniques, face significant limitations in modern clinical practice. These methods require physically large and expensive instruments, skilled technicians, and relatively large sample volumes (up to a few milliliters), making them unsuitable for point-of-care testing or home-use detection of ALT [37]. Consequently, substantial research efforts have focused on developing biosensor technologies that offer rapid, cost-effective, and decentralized testing capabilities. This case study provides a comprehensive comparison of enzymatic biosensor strategies for ALT detection, with particular emphasis on the analytical performance of pyruvate oxidase (POx) and glutamate oxidase (GlOx) based systems, while contextualizing their development within the broader landscape of biosensor research, including emerging affinity-based approaches.
Technical Foundations: Enzymatic Biosensor Architectures for ALT Detection
Fundamental Biosensor Principles and Components
A biosensor is universally defined as "a self-contained analytical device that combines a biological component with a physicochemical device for the detection of an analyte of biological importance" [12]. All biosensors consist of five essential components: (1) the analyte (the substance to be detected, in this case ALT); (2) bioreceptors (molecules that specifically recognize the analyte, such as enzymes); (3) transducers (devices that convert the biological interaction into a measurable signal); (4) electronics (for signal processing); and (5) display interfaces that present the results in a user-comprehensible format [4].
Enzymatic biosensors for ALT detection exploit the enzyme's natural catalytic activity, but since ALT itself lacks strong electroactive properties, its activity must be measured indirectly through reaction products [39]. This is accomplished through coupled enzyme systems that generate electrochemically detectable signals, primarily through hydrogen peroxide (H₂O₂) production.
Signaling Pathways for ALT Detection
The two primary enzymatic pathways for ALT detection utilize different biorecognition elements but converge on the production of H₂O₂, which can be electrochemically quantified. The fundamental signaling logic for these pathways is illustrated below.
Pathway 1: Pyruvate Oxidase (POx) System This approach utilizes a two-step reaction mechanism. First, ALT catalyzes the transamination between L-alanine and α-ketoglutarate, producing pyruvate and L-glutamate. Second, pyruvate oxidase (POx) catalyzes the oxidation of pyruvate in the presence of oxygen and phosphate, generating acetyl phosphate, CO₂, and H₂O₂. The H₂O₂ is then electrochemically oxidized at the electrode surface, producing a measurable current signal proportional to ALT concentration [37] [39].
Pathway 2: Glutamate Oxidase (GlOx) System This alternative approach also begins with the ALT-catalyzed production of pyruvate and L-glutamate. However, instead of detecting pyruvate, glutamate oxidase (GlOx) catalyzes the oxidation of L-glutamate to α-ketoglutarate, ammonium, and H₂O₂. Similarly, the generated H₂O₂ is electrochemically detected, providing an indirect measurement of ALT activity [37] [39].
Both systems represent first-generation biosensors, which measure the concentration of products from enzymatic reactions that diffuse to the transducer surface to generate an electrical response [12]. These systems rely on the natural electron acceptor (oxygen) and do not require additional mediators.
Comparative Experimental Evaluation: POx vs. GlOx Biosensor Designs
Biosensor Fabrication and Optimization Protocols
Recent research has systematically compared these two enzymatic approaches using standardized fabrication methodologies and assessment parameters [39]. The construction of each biosensor type involves distinct immobilization strategies tailored to the specific enzyme properties:
POx-Based Biosensor Fabrication: For pyruvate oxidase immobilization, researchers employed an entrapment method using a photopolymerizable polymer. The protocol involves:
- Preparing an enzyme gel containing 10% glycerol, 5% BSA, and 4.86 U/µL POx in 25 mM HEPES buffer (pH 7.4)
- Mixing the gel with 19.8% PVA-SbQ photopolymer in a 1:2 ratio
- Applying 0.15 µL of the mixture per electrode surface
- Photopolymerizing under UV light (365 nm) for approximately 8 minutes until 2.4 J is reached [39]
GlOx-Based Biosensor Fabrication: Glutamate oxidase immobilization utilized covalent crosslinking with glutaraldehyde:
- Preparing a gel in 100 mM phosphate buffer (pH 6.5) containing 10% glycerol, 4% BSA, and 8% GlOx
- Mixing with 0.5% glutaraldehyde solution in a 1:2 ratio
- Depositing 0.05 µL of the mixture per electrode surface
- Air-drying for 35 minutes to complete the crosslinking process [39]
Both biosensor designs incorporated a semi-permeable poly(meta-phenylenediamine) membrane to minimize interference from electroactive compounds like ascorbic acid present in biological samples. This membrane permits H₂O₂ diffusion while blocking larger molecules, significantly enhancing measurement accuracy in complex fluids [39].
Analytical Performance Comparison
The table below summarizes the comprehensive performance characteristics of both biosensor designs based on direct comparative studies:
Table 1: Performance Comparison of POx vs. GlOx Biosensors for ALT Detection
| Analytical Parameter | POx-Based Biosensor | GlOx-Based Biosensor |
|---|---|---|
| Linear Range (U/L) | 1-500 U/L | 5-500 U/L |
| Limit of Detection | 1 U/L | 1 U/L |
| Sensitivity at 100 U/L | 0.75 nA/min | 0.49 nA/min |
| Optimal pH | 7.4 | 6.5 |
| Immobilization Method | Entrapment in PVA-SbQ | Covalent crosslinking with glutaraldehyde |
| Key Advantage | Higher sensitivity | Greater stability in complex solutions |
| Primary Limitation | More complex working solution | Potential interference from AST activity |
| Assay Cost | Higher due to additional cofactors | Lower due to simpler working solution |
The experimental data reveal a clear trade-off between sensitivity and robustness. The POx-based system demonstrates approximately 53% higher sensitivity (0.75 nA/min vs. 0.49 nA/min at 100 U/L ALT) and a wider linear range, extending to lower ALT concentrations [39]. This enhanced sensitivity makes the POx-based biosensor particularly valuable for detecting mildly elevated ALT levels in early-stage liver disease.
Conversely, the GlOx-based biosensor exhibits superior stability in complex biological matrices like serum and reduced assay costs due to its simpler working solution formulation [39]. However, a significant limitation of the GlOx system is its potential susceptibility to interference from aspartate aminotransferase (AST) activity in clinical samples, as AST also produces glutamate in its catalytic reaction [39]. This cross-reactivity may reduce specificity in patients with conditions causing concurrent elevation of both enzymes.
Methodological Workflow for ALT Biosensing
The complete experimental procedure for ALT detection using enzymatic biosensors follows a systematic workflow encompassing sensor preparation, measurement, and data analysis, as illustrated below.
The standard experimental workflow consists of the following critical stages:
- Electrode Preparation: Platinum disc working electrodes are polished and cleaned to ensure a consistent surface [39].
- PPD Membrane Application: A poly(meta-phenylenediamine) membrane is electrochemically deposited to enhance selectivity by blocking interferents [39].
- Enzyme Immobilization: POx or GlOx is immobilized using their respective optimized methods (entrapment for POx, covalent crosslinking for GlOx) [39].
- Sample Preparation: Testing solutions are prepared containing L-alanine, α-ketoglutarate, necessary cofactors (Mg²⁺, TPP, FAD for POx system), PyOx or GlOx, and the ALT sample in phosphate buffer [37] [39].
- Amperometric Measurement: The biosensor is inserted into the testing solution, and a fixed potential of +0.6V (vs. Ag/AgCl) is applied to oxidize the generated H₂O₂. The current is typically measured after 60 seconds when a steady-state response is reached [37] [39].
- Data Analysis: The oxidation current is measured and correlated with ALT concentration using a predetermined calibration curve [37].
- Result Interpretation: ALT activity in the sample is quantified and reported in U/L, with elevated levels indicating potential liver cell damage [38].
The Scientist's Toolkit: Essential Research Reagents and Materials
Successful development and implementation of enzymatic biosensors for ALT detection requires carefully selected reagents and materials. The following table catalogues key components and their specific functions in biosensor construction and operation.
Table 2: Essential Research Reagents for ALT Enzymatic Biosensor Development
| Reagent/Material | Function in Biosensor System | Specification Notes |
|---|---|---|
| Pyruvate Oxidase (POx) | Biorecognition element for pyruvate detection | Source: Aerococcus viridans; ~35 U/mg [39] |
| Glutamate Oxidase (GlOx) | Biorecognition element for glutamate detection | Recombinant from Streptomyces sp.; ~7 U/mg [39] |
| Alanine Aminotransferase (ALT) | Calibration standard | Source: porcine heart; ~84 U/mg [39] |
| L-Alanine | Native substrate for ALT reaction | Required in testing solution (~250 mM) [37] |
| α-Ketoglutarate | Co-substrate for ALT reaction | Disodium salt; required in testing solution (~2.5 mM) [37] |
| Thiamine Pyrophosphate (TPP) | Cofactor for POx activity | Required at ~0.2 mM for POx-based systems [37] [39] |
| Flavin Adenine Dinucleotide (FAD) | Cofactor for POx activity | Required at ~15 μM for POx-based systems [37] [39] |
| Pyridoxal Phosphate (PLP) | Cofactor for ALT activity | Enhances ALT enzymatic reaction [39] |
| Polyvinyl Alcohol with Styrylpyridinium Groups (PVA-SbQ) | Photopolymerizable matrix for POx immobilization | Used at 13.2% concentration [39] |
| Glutaraldehyde | Crosslinker for GlOx immobilization | Used at 0.3% concentration [39] |
| meta-Phenylenediamine | Electropolymerized membrane for interference suppression | Forms semi-permeable membrane to block ascorbic acid [39] |
| Platinum Electrodes | Transducer surface for H₂O₂ oxidation | Preferred for efficient H₂O₂ electro-oxidation [12] |
This reagent toolkit highlights the complexity of biosensor assembly, particularly for the POx-based system, which requires multiple cofactors (TPP, FAD) to function optimally [37] [39]. The GlOx-based system offers relative simplicity with fewer required cofactors, contributing to its lower overall assay cost [39].
Broader Context: Enzymatic vs. Affinity Biosensors in ALT Detection
While enzymatic biosensors currently dominate ALT detection research, affinity-based biosensors represent an emerging alternative with distinct advantages and limitations. Understanding this broader context is essential for evaluating future research directions.
Enzymatic biosensors, as detailed in this study, offer excellent sensitivity and well-established protocols but face challenges related to enzyme stability, oxygen dependence, and interference from complex biological matrices [12]. The requirement for multiple enzymes and cofactors in systems like the POx-based biosensor adds complexity and cost to the assay design [39].
Affinity biosensors, particularly those utilizing aptamers (short single-stranded DNA or RNA oligonucleotides), are gaining attention as promising alternatives. These bioreceptors are selected through Systematic Evolution of Ligants by EXponential enrichment (SELEX) to bind specific targets with high affinity and specificity [40]. Aptasensors offer potential advantages including greater stability, easier production, lower cost, and enhanced flexibility in chemical modification compared to antibody-based systems or enzyme-based detection [40].
However, significant challenges remain in aptamer development for ALT detection. To date, no aptamers specifically targeting ALT or AST enzymes have been reported, highlighting a critical research gap [40]. Additionally, aptamers face hurdles related to susceptibility to serum nucleases, potential cross-reactivity with structurally similar molecules, and conformational differences between purified recombinant proteins used in selection versus native proteins in clinical samples [40].
The integration of artificial intelligence (AI) with biosensing represents another frontier in diagnostic technology. AI algorithms can process complex biological data from biosensors to enhance sensitivity, enable real-time analysis, and provide predictive insights [4]. For instance, AI-powered population profiling in bacterial susceptibility testing demonstrates how machine learning can extract additional layers of information from biosensor data, potentially leading to more accurate diagnostic classifications [41]. However, AI-biosensor systems also face challenges regarding false results arising from algorithmic limitations, insufficient training data, or technical artifacts in sensor measurements [4].
This clinical case study demonstrates that both POx and GlOx enzymatic biosensors offer viable pathways for ALT detection, with a clear performance trade-off between sensitivity and robustness. The POx-based system provides superior sensitivity (0.75 nA/min at 100 U/L) and lower detection limits, making it suitable for applications requiring precise quantification at near-normal ALT concentrations [39]. Conversely, the GlOx-based system offers enhanced stability in complex biological fluids and reduced assay costs, advantageous for routine screening applications despite its slightly reduced sensitivity and potential interference from AST [39].
Future research directions should focus on optimizing biosensor performance in clinically relevant conditions. This includes enhancing selectivity further through advanced membrane technologies, improving enzyme stability through novel immobilization approaches, and developing multiplexed systems capable of simultaneously detecting ALT alongside other liver biomarkers like AST and GGT [39]. The successful development of affinity-based aptasensors for ALT would represent a significant advancement, potentially combining the specificity of enzymatic systems with the stability and cost-effectiveness of nucleic acid-based receptors [40].
As biosensor technologies continue to evolve, their integration into point-of-care devices and telehealth platforms will play an increasingly important role in decentralized liver health monitoring, enabling earlier detection of hepatic dysfunction and personalized intervention strategies for patients at risk of liver disease.
The analysis of DNA methylation, a key epigenetic modification, has become indispensable in cancer research and diagnostics. Aberrant methylation patterns are recognized as early events in carcinogenesis and powerful biomarkers for tumor identification and prognosis [8] [42]. Traditional detection methods often rely on bisulfite conversion of DNA and PCR amplification, processes that are time-consuming, can damage DNA, and introduce biases [43]. In response, the field is advancing towards PCR-free and bisulfite-free strategies. Among the most promising are affinity biosensors, which use proteins or antibodies to directly recognize methylated sites. This guide provides a objective comparison of these emerging affinity-based methods, contrasting them with enzymatic conversion techniques and detailing the experimental protocols that underpin their performance.
Fundamental Principles and Technological Comparison
Affinity biosensors for DNA methylation detection primarily utilize anti-5-methylcytosine (5-mC) antibodies or methyl-binding domain (MBD) proteins as biorecognition elements. These elements selectively bind to methylated cytosines, allowing for the direct capture and detection of methylated DNA without the need for prior chemical conversion or amplification [8] [44]. The binding event is typically transduced into a measurable signal, most commonly through electrochemical detection, though optical methods also exist.
A key technological competitor to affinity-based methods is enzymatic conversion, which uses specific enzymes to treat DNA before sequencing. Techniques like Enzymatic Methyl-Seq (EM-seq) leverage enzymes such as TET2 and APOBEC3A to distinguish and convert modified cytosines, enabling high-sensitivity sequencing without the DNA damage associated with bisulfite [45] [43].
The table below summarizes the core characteristics of these two approaches.
Table 1: Core Technology Comparison: Affinity Biosensors vs. Enzymatic Conversion
| Feature | Affinity Biosensors | Enzymatic Conversion (e.g., EM-seq) |
|---|---|---|
| Core Principle | Immunorecognition or protein affinity binding to 5-mC | Enzymatic conversion of bases to enable sequencing-based discrimination |
| Key Reagents | Anti-5-mC antibody, MBD proteins, reporter enzymes (e.g., GOx, HRP) | TET2, T4-BGT, APOBEC3A enzymes |
| DNA Input | Very low (e.g., 15 pg - 100 ng) [44] [8] | Low (e.g., 100 pg and above) [45] |
| Typical Assay Time | Fast (e.g., 70 minutes) [44] | Longer (library preparation for sequencing) |
| Resolution | Global or gene-specific (depending on design) [8] | Single-base resolution [45] [43] |
| Throughput | Low to medium (suitable for targeted analysis) | Very high (whole-genome and targeted sequencing) |
| Primary Advantage | Speed, simplicity, no DNA conversion | Comprehensive data, high sensitivity, minimal DNA damage |
| Primary Limitation | Limited multiplexing scale | Higher cost, complex data analysis |
Experimental Protocols for Affinity Biosensors
The performance of affinity biosensors is demonstrated through specific, reproducible experimental workflows. Below are detailed protocols for two prominent electrochemical biosensor designs.
Protocol 1: Magnetic Immunosensor for Global DNA Methylation
This method quantifies the overall methylation level in genomic DNA using antibody-modified magnetic beads for enrichment and an enzymatic signal for detection [44].
Core Reagents:
- Biotinylated anti-5-mC antibody: For specific capture of methylated DNA.
- Streptavidin Magnetic Beads (MBs): Solid-phase support for easy separation and washing.
- Anti-DNA-GOx conjugate: A detector antibody bound to glucose oxidase.
- PB-doped screen-printed carbon electrode: Transducer for electrochemical measurement.
- Glucose substrate: For the enzymatic reaction.
Step-by-Step Workflow:
- MBs Modification: Incubate streptavidin MBs with biotinylated anti-5-mC antibody for 30 minutes at 37°C to create "anti-5mC-MBs" [44].
- DNA Denaturation: Heat the extracted genomic DNA at 95°C for 10 minutes and immediately cool on ice to obtain single-stranded DNA [44].
- Immunocapture: Incubate the denatured DNA with the anti-5mC-MBs for 15 minutes at 37°C. Methylated DNA fragments are captured on the beads [44].
- Washing: Perform magnetic separation and wash the beads to remove unmethylated DNA and other contaminants.
- Signal Generation: Incubate the DNA-MB complex with anti-DNA-GOx for 15 minutes at 37°C. After washing, incubate the MBs with a glucose solution. The GOx enzyme catalyzes the oxidation of glucose, producing hydrogen peroxide (H₂O₂) [44].
- Detection: Transfer the supernatant to the PB-doped electrode. Measure the reduction current of H₂O₂ at a low voltage using chronoamperometry. The current is directly proportional to the global methylation level in the original sample [44].
Diagram 1: Magnetic Immunosensor Workflow for Global Methylation Detection.
Protocol 2: DNA Sensor for Gene-Specific Methylation
This strategy enables the detection of methylation within a specific gene sequence, such as the tumor suppressor RASSF1A or MGMT [8].
Core Reagents:
- Biotinylated DNA capture probe: A sequence complementary to the target gene region.
- Streptavidin Magnetic Beads (MBs): Solid-phase support.
- Anti-5-mC antibody: The primary detector antibody.
- HRP-conjugated secondary antibody: For signal amplification.
- Screen-printed carbon electrode (SPCE): Transducer.
- H₂O₂/Hydroquinone (HQ): The enzyme substrate/mediator system.
Step-by-Step Workflow:
- Probe Immobilization: Immobilize a biotinylated DNA capture probe specific to the target gene on streptavidin-coated MBs [8].
- Target Hybridization: Incubate the denatured DNA sample with the probe-modified MBs. The target DNA sequence hybridizes with the complementary probe [8].
- Methylation Recognition: Add an anti-5-mC antibody to recognize methylated cytosines on the captured DNA, followed by an HRP-conjugated secondary antibody [8].
- Amperometric Detection: Magnetically capture the modified MBs on the SPCE. In the presence of H₂O₂ and HQ, HRP catalyzes a reduction reaction. The cathodic current generated is measured and is proportional to the amount of methylated target DNA present [8].
Diagram 2: DNA Sensor Workflow for Gene-Specific Methylation Detection.
Performance Data and Comparison
To objectively evaluate these technologies, the following tables consolidate key performance metrics from published studies.
Table 2: Quantitative Performance of Featured Affinity Biosensors
| Biosensor Type | Target | Detection Limit | DNA Input | Assay Time | Linear Range | Reference |
|---|---|---|---|---|---|---|
| Magnetic Immunosensor (Global) | Global 5-mC | 5% Methylation Level | 15 pg | ~70 min | 0-100% Methylation | [44] |
| Electrochemical DNA Sensor (Gene-Specific) | RASSF1A / MGMT | Not Specified | 100 ng | ~60 min | Not Specified | [8] |
| Electrochemical Immunosensor (Global) | Global 5-mC | Not Specified | Not Specified | Fast | Not Specified | [46] |
Table 3: Cross-Technology Performance Benchmarking
| Method | Technology Category | Key Performance Advantage | Key Performance Limitation | Multiplexing Potential |
|---|---|---|---|---|
| Affinity Biosensors (e.g., [8] [44]) | Affinity / Electrochemical | Ultra-low DNA input (pg level), rapid results (<1.5h) | Mostly low-plex, global or single-gene focus | Low |
| Enzymatic Methyl-Seq (EM-seq) [45] [43] | Enzymatic / Sequencing | Single-base resolution, minimal DNA damage, high sensitivity | High cost, complex data analysis, longer turnaround | Very High (Whole genome) |
| Bisulfite Sequencing (WGBS) [43] | Chemical Conversion / Sequencing | Gold standard, single-base resolution | Significant DNA fragmentation, biased sequencing data | Very High (Whole genome) |
| Fluorescent Biosensor [47] | Affinity / Fluorescence | Ultra-sensitive (0.4 fM LOD) | Requires bisulfite conversion, complex probe design | Low |
The Scientist's Toolkit: Essential Research Reagents
Successful implementation of these biosensors requires a set of core reagents. The following table details these essential components.
Table 4: Key Research Reagent Solutions for Affinity Biosensors
| Reagent / Material | Function in the Assay | Example from Research |
|---|---|---|
| Anti-5-Methylcytosine (5-mC) Antibody | Primary biorecognition element; specifically binds to methylated cytosines. | Biotinylated mouse anti-5mC monoclonal antibody used for capture on magnetic beads [44]. |
| Magnetic Beads (Streptavidin or Carboxylic-Modified) | Solid-phase support for immobilizing biorecognition elements (antibodies, DNA probes), enabling easy separation and washing. | Streptavidin magnetic beads (1 μm) used as a platform for building the detection complex [8] [44]. |
| Screen-Printed Electrode (SPE) | Low-cost, portable, and disposable platform for electrochemical transduction. Can be carbon-based or gold, and doped with mediators like Prussian Blue (PB). | PB-doped carbon electrode used for sensitive H₂O₂ detection [44]; bare SPGE for direct DNA adsorption [46]. |
| Enzyme Labels (GOx, HRP) | Signal generators. Catalyze a reaction that produces a measurable electrochemical signal. | Glucose oxidase (GOx) used to generate H₂O₂ [44]; Horseradish peroxidase (HRP) used with the H₂O₂/HQ system [8]. |
| Specific DNA Probes | For gene-specific sensors; a synthetic oligonucleotide complementary to the target methylated sequence. | Biotinylated DNA capture probe specific for the RASSF1A promoter region [8]. |
The experimental data clearly illustrates that PCR-free affinity biosensors occupy a crucial niche in the DNA methylation detection landscape. Their standout advantages are remarkable speed and minimal DNA input requirements, making them exceptionally suitable for applications like rapid clinical screening or analysis of precious, limited samples such as liquid biopsies [8] [44]. Furthermore, their design flexibility allows for both global methylation assessment and gene-specific analysis, as demonstrated by the two distinct protocols.
However, the choice of technology must be guided by the research question. For discovery-phase research requiring genome-wide mapping of methylation marks at single-base resolution, enzymatic sequencing methods (EM-seq) are superior, despite their higher cost and complexity [45] [43]. In contrast, for focused, rapid, and cost-effective detection of specific methylation biomarkers, electrochemical affinity biosensors present a powerful and compelling alternative. The ongoing development of multiplexed biosensor arrays and integration with portable readers will further solidify their role in the future of cancer epigenetics, potentially enabling point-of-care diagnostic applications.
Biosensors have emerged as indispensable analytical tools that combine a biological recognition element with a physicochemical transducer to detect target analytes with high specificity and sensitivity. In the field of environmental monitoring, two primary classes of biosensors have developed: enzymatic biosensors and affinity biosensors. These systems differ fundamentally in their recognition mechanisms and operational principles. Enzymatic biosensors typically rely on the catalytic activity of enzymes that convert a substrate into a product, with the reaction rate often measured electrochemically. In contrast, affinity biosensors utilize specific binding interactions between molecules, such as antibody-antigen complexes or DNA hybridization, without catalytic conversion. The growing concerns over environmental pollutants, including pesticides, heavy metals, and nerve agents, have accelerated the development of both biosensor types for field-deployable, rapid, and sensitive detection platforms. This comparison guide objectively evaluates the performance characteristics, operational parameters, and practical applications of enzymatic versus affinity biosensors for environmental monitoring, providing researchers with experimental data and methodologies to inform their sensor selection and development strategies.
Comparative Analysis: Enzymatic vs. Affinity Biosensors
The table below summarizes the key performance characteristics and experimental data for enzymatic and affinity biosensors in detecting environmental pollutants:
Table 1: Performance comparison of enzymatic and affinity biosensors for environmental monitoring
| Parameter | Enzymatic Biosensors | Affinity Biosensors |
|---|---|---|
| Detection Principle | Catalytic conversion of substrate | Specific binding (e.g., antibody-antigen, DNA hybridization) |
| Typical Recognition Elements | Enzymes (e.g., acetylcholinesterase, organophosphorus hydrolase, glucose oxidase) | Antibodies, DNA probes, aptamers, molecularly imprinted polymers [48] [49] |
| Detection Mechanism | Measurement of reaction products, enzyme inhibition, or catalytic activity | Measurement of binding events via signal transduction |
| Primary Transducers | Electrochemical (amperometric, potentiometric), optical, thermal [50] | Electrochemical, optical (SPR, fluorescence), acoustic [48] |
| Detection Limits for Pesticides | Organophosphorus: nM to pM range (via inhibition) [50] | Varies by pesticide: pM to fM range (via direct binding) [51] |
| Detection Limits for Heavy Metals | μM to nM range (via enzyme inhibition) | nM to pM range (e.g., Hg²⁺: 5-45 μM with AgNP-MD) [52] |
| Analysis Time | Minutes to tens of minutes | Minutes to hours (depending on assay format) |
| Regeneration/Reusability | Limited for inhibition-based sensors | Possible with appropriate elution conditions |
| Key Advantages | High catalytic activity, signal amplification, real-time monitoring | Exceptional specificity, adaptable to various targets, quantitative binding data |
| Major Limitations | Enzyme stability, inhibition reversibility, limited to enzyme-related targets | Binding kinetics limitations, non-specific binding, more complex immobilization |
Experimental Protocols for Biosensor Development
Enzyme-Based Detection of Organophosphorus Pesticides
Principle: This protocol utilizes the inhibition of acetylcholinesterase (AChE) by organophosphorus (OP) compounds. The residual enzyme activity after exposure to the sample is measured electrochemically, with the degree of inhibition proportional to the pesticide concentration [50].
Materials:
- Acetylcholinesterase (AChE) from electrophorus electricus
- Acetylthiocholine chloride (ATCl) or acetylthiocholine iodide (ATCH) as substrate
- Phosphate buffer (0.1 M, pH 7.4)
- Screen-printed carbon electrodes (SPCEs)
- 5,5'-dithio-bis-(2-nitrobenzoic acid) (DTNB) for thiocholine detection
- Magnetic stirrer and electrochemical cell
Procedure:
- Enzyme Immobilization: Immobilize AChE on the SPCE surface using glutaraldehyde cross-linking or entrapment in a polymer matrix (e.g., Nafion or chitosan).
- Baseline Measurement: Place the modified electrode in phosphate buffer containing 0.5 mM ATCl and 0.5 mM DTNB. Apply a potential of +0.4 V vs. Ag/AgCl and record the amperometric current for 2 minutes to establish baseline enzyme activity.
- Inhibition Step: Incubate the biosensor in the sample solution containing suspected OP compounds for 10-15 minutes at 25°C.
- Activity Measurement: Transfer the biosensor back to the substrate solution and record the current again under identical conditions.
- Quantification: Calculate the percentage inhibition using the formula: % Inhibition = [(I₀ - I₁)/I₀] × 100, where I₀ is the initial current and I₁ is the current after inhibition.
- Calibration: Generate a calibration curve by plotting % inhibition against known concentrations of standard OP compounds.
Affinity-Based Detection of Heavy Metals Using DNA Biosensors
Principle: This protocol employs specific DNA sequences or aptamers that undergo conformational changes or damage upon binding to heavy metal ions, with detection achieved through electrochemical signals [51] [52].
Materials:
- Thiolated or biotinylated DNA probes specific to target heavy metals
- Gold electrodes or screen-printed gold electrodes
- Streptavidin-modified magnetic beads (for biotinylated probes)
- Electrochemical redox indicators (e.g., methylene blue, ferricyanide)
- Tris-EDTA buffer (10 mM Tris, 1 mM EDTA, pH 8.0)
- Voltammetric analyzer
Procedure:
- Probe Immobilization:
- For thiolated probes: Incubate gold electrodes with 1 μM thiolated DNA in Tris-EDTA buffer for 16 hours at 4°C.
- For biotinylated probes: Immobilize on streptavidin-modified magnetic beads for 30 minutes at room temperature with gentle mixing.
- Blocking: Treat the functionalized surface with 1 mM 6-mercapto-1-hexanol (for thiolated probes) or 1% BSA (for biotinylated probes) for 1 hour to minimize non-specific binding.
- Hybridization/Recognition: Incubate the DNA sensor with the sample solution for 20 minutes at optimal temperature (typically 25-37°C).
- Signal Transduction: Transfer the biosensor to an electrochemical cell containing appropriate buffer and redox indicator. Perform square wave voltammetry or electrochemical impedance spectroscopy.
- Quantification: Measure the change in peak current or charge transfer resistance relative to a control without heavy metals.
- Regeneration (Optional): For reusable sensors, regenerate the surface by washing with 10 mM EDTA or low pH buffer to dissociate metal ions.
Electrochemical Affinity Biosensor for Gene-Specific Methylations
Principle: This method detects specific DNA methylations using anti-5-methylcytosine antibody as a biorecognition element, implemented on magnetic microparticles with amperometric transduction [8].
Materials:
- Anti-5-methylcytosine antibody (anti-5-mC)
- Carboxylic acid-modified magnetic beads (HOOC-MBs)
- Streptavidin-modified magnetic beads (Strep-MBs)
- Biotinylated DNA capture probe
- Target methylated DNA sequences
- HRP-conjugated secondary antibodies
- Screen-printed carbon electrodes (SPCEs)
- Hydrogen peroxide/hydroquinone (H₂O₂/HQ) system
Procedure:
- Biosensor Preparation (Two Approaches):
- Immunosensor Approach: Immobilize anti-5-mC on HOOC-MBs using EDC/NHS chemistry. Incubate with ss-DNA samples bearing methylation. Add HRP-anti-ssDNA detector antibody.
- DNA Sensor Approach: Immobilize biotinylated DNA capture probe on Strep-MBs. Hybridize with target methylated DNA. Detect methylation using anti-5-mC primary antibody and HRP-conjugated secondary antibody.
- Amperometric Detection: Capture modified MBs on SPCE surface. Measure cathodic current generated by enzymatic reduction of H₂O₂ mediated by HQ at -0.20 V vs. Ag pseudo-reference electrode.
- Quantification: Current is proportional to methylated DNA concentration. The DNA sensor approach demonstrates higher sensitivity for gene-specific methylations compared to the immunosensor approach for global DNA methylation [8].
Biosensor Signaling Pathways and Workflows
Enzymatic Biosensor Signaling Pathway
Diagram Title: Enzymatic Biosensor Detection Mechanism
Affinity Biosensor Workflow
Diagram Title: Affinity Biosensor Detection Mechanism
Research Reagent Solutions
The table below outlines essential research reagents and materials for developing biosensors for environmental monitoring applications:
Table 2: Key research reagents for biosensor development in environmental monitoring
| Reagent/Material | Function | Application Examples |
|---|---|---|
| Acetylcholinesterase | Enzyme for catalytic detection of neurotoxic compounds | Detection of organophosphorus pesticides and nerve agents via inhibition [50] |
| Anti-5-methylcytosine antibody | Affinity recognition element for methylated DNA | Detection of DNA methylation patterns in environmental toxicology [8] |
| Screen-printed carbon electrodes | Disposable electrochemical transducers | Low-cost, portable biosensor platforms for field detection [8] [50] |
| Magnetic beads (functionalized) | Solid support for immobilization and separation | Efficient capture and concentration of target analytes [8] |
| Carbon nanotubes | Signal amplification and enhanced electron transfer | Improving sensitivity in electrochemical biosensors [49] [50] |
| Hydrogen peroxide/hydroquinone | Enzyme substrate/mediator system | Amperometric detection in horseradish peroxidase-based systems [8] [50] |
| Gold nanoparticles | Signal enhancement and immobilization matrix | Colorimetric and electrochemical signal amplification [49] [52] |
| Molecularly imprinted polymers | Artificial affinity receptors | Detection of pesticides and heavy metals when natural receptors are unavailable [49] |
Enzymatic and affinity biosensors offer complementary approaches for environmental monitoring of pesticides, heavy metals, and nerve agents. Enzymatic biosensors provide excellent sensitivity for neurotoxic compounds through catalytic amplification and inhibition mechanisms, with detection limits in the nM to pM range for organophosphorus pesticides. Affinity biosensors demonstrate exceptional specificity for diverse targets, including heavy metals and specific DNA sequences, with detection capabilities reaching pM to fM ranges for certain applications. The selection between these platforms depends on the specific analytical requirements, including needed sensitivity, specificity, analysis time, and operational stability. Future developments in nanomaterial integration, miniaturization, and multiplexing capabilities will further enhance the applicability of both biosensor types for environmental monitoring, potentially enabling real-time, on-site detection of multiple contaminants simultaneously. Researchers should consider these performance characteristics and experimental approaches when designing monitoring strategies for environmental pollutants.
Biosensors represent a powerful class of analytical devices that integrate biological recognition elements with physicochemical transducers to detect target analytes with high specificity and sensitivity. These devices are primarily categorized based on their biological recognition elements and transduction mechanisms. Enzymatic biosensors utilize enzymes as biorecognition elements that catalyze specific biochemical reactions, generating measurable products proportional to the target analyte concentration. In contrast, affinity-based biosensors rely on specific binding interactions between molecules without catalyzing chemical reactions, using biological elements such as antibodies, aptamers, or nucleic acids that form stable complexes with their targets [2].
The fundamental architecture of all biosensors comprises three essential components: a biological recognition element that specifically interacts with the target analyte, a transducer that converts the biological response into a measurable signal, and a signal processor that interprets and displays the results in a user-readable format [2]. This comparative analysis examines the operational principles, performance characteristics, and practical applications of both enzymatic and affinity biosensors, providing researchers with evidence-based guidance for selecting appropriate technologies for specific analytical challenges in contaminant and metabolite analysis.
Fundamental Principles and Mechanisms
Enzymatic Biosensors
Enzymatic biosensors function based on the catalytic activity of enzymes, which are biological catalysts that accelerate specific biochemical reactions. When the target analyte (substrate) interacts with the enzyme, it undergoes conversion to a product through a highly specific biochemical reaction. This reaction generates measurable changes in various parameters such as electron transfer, proton concentration, heat transfer, light absorption, or emission, which are then detected by the transducer [53]. For instance, glucose biosensors utilize the enzyme glucose oxidase to catalyze the oxidation of glucose to gluconolactone and hydrogen peroxide, producing an electrical current proportional to glucose concentration [2].
The specificity of enzymatic biosensors derives from the selective catalytic activity of enzymes toward their substrates. Enzymes possess active sites with specific three-dimensional structures that complement their intended substrates, enabling remarkable molecular discrimination. The kinetics of enzymatic reactions typically follow Michaelis-Menten principles, where the reaction rate depends on substrate concentration and the enzyme's affinity for its substrate [54]. This relationship allows for quantitative analysis of target analytes across defined concentration ranges.
Affinity Biosensors
Affinity biosensors operate based on specific molecular recognition without catalytic conversion. These systems rely on the formation of stable complexes between the biorecognition element and the target analyte through non-covalent interactions such as hydrogen bonding, van der Waals forces, electrostatic interactions, and hydrophobic effects [34] [55]. Common affinity-based recognition elements include antibodies (for immunosensors), single-stranded DNA or RNA aptamers, and nucleic acid probes [34].
The binding event in affinity biosensors causes physicochemical changes at the transducer interface, which are converted into measurable signals. For example, in electrochemical immunosensors, antibody-antigen binding may alter electron transfer resistance at the electrode surface, which can be quantified using techniques like electrochemical impedance spectroscopy [34]. Similarly, aptamer-based sensors often undergo conformational changes upon target binding, modulating electrochemical or optical signals [34]. The binding kinetics in affinity biosensors typically follow Langmuir isotherm models, where the equilibrium response depends on the affinity constant and analyte concentration.
Performance Comparison: Experimental Data
The analytical performance of enzymatic and affinity biosensors varies significantly depending on their design, transduction mechanism, and application context. The following tables summarize key performance metrics derived from experimental studies across different application domains.
Table 1: Performance metrics of enzymatic biosensors for various applications
| Target Analyte | Enzyme Used | Linear Range | Detection Limit | Application | Reference |
|---|---|---|---|---|---|
| Sucralose | Laccase | 0.025–1.0 mM | 0.32 μM | Food analysis | [56] |
| Phenolic compounds | Polyphenol oxidase | Not specified | 0.13 μM (catechin) | Food quality control | [53] |
| D-2-hydroxyglutaric acid | D-2-hydroxyglutarate dehydrogenase | 0.5–120 μM | Not specified | Clinical diagnostics | [53] |
| Neurotoxic insecticides | Acetylcholinesterase | 0–20 μg/L | <1 μg/L | Environmental monitoring | [57] |
| Glucose | Glucose oxidase | Not specified | Not specified | Clinical diagnostics | [2] |
Table 2: Performance metrics of affinity biosensors for various applications
| Target Analyte | Biorecognition Element | Linear Range | Detection Limit | Application | Reference |
|---|---|---|---|---|---|
| Saxitoxin (STX) | DNA aptamer | 0.9–30 nM | 0.38 nM | Shellfish safety | [34] |
| Brevetoxin-2 (BTX-2) | DNA aptamer | Not specified | 106 pg/mL | Shellfish safety | [34] |
| Fab-GST interaction | Antibody | Not specified | 620 pM (affinity) | Protein interaction studies | [58] |
| Paraoxon, Carbofuran | Acetylcholinesterase (inhibition-based) | 0–5 μg/L | 0.4–1.6 μg/L | Environmental monitoring | [57] |
Table 3: Comparative advantages and limitations of enzymatic vs. affinity biosensors
| Parameter | Enzymatic Biosensors | Affinity Biosensors |
|---|---|---|
| Specificity | High for substrate specificity | Very high for molecular recognition |
| Sensitivity | Moderate to high | High to very high |
| Response Time | Fast (seconds to minutes) | Variable (minutes to hours) |
| Regeneration | Often not required | Often requires regeneration steps |
| Stability | Moderate (enzyme denaturation) | Generally high |
| Measurement Type | Typically quantitative | Quantitative and qualitative |
| Target Range | Mostly small molecules | Small molecules to whole cells |
| Development Cost | Moderate | Moderate to high |
Experimental Protocols and Methodologies
Protocol for Enzymatic Biosensor Construction: Laccase-Based Sucralose Detection
The development of enzymatic biosensors requires careful immobilization of the biological recognition element while maintaining its catalytic activity. A representative protocol for constructing a laccase-based biosensor for sucralose detection involves the following steps [56]:
Electrode Modification: Begin by modifying a glassy carbon electrode (GCE) with graphene oxide (GO) to create a high-surface-area platform for enzyme immobilization. Deposit zinc oxide nanoparticles (ZnONPs) capped with p-amino thiophenol (ATP) onto the GO-modified surface to facilitate covalent attachment of enzymes.
Enzyme Immobilization: Immobilize laccase enzyme onto the ZnONPs-ATP-GO modified electrode through covalent bonding. The high isoelectric point of ZnONPs promotes firm binding of laccase while preserving enzymatic activity.
Electrochemical Characterization: Characterize the fabricated biosensor using cyclic voltammetry and electrochemical impedance spectroscopy in 0.1 M phosphate buffer (pH 5.0). The biosensor should exhibit enhanced electron transfer properties compared to unmodified electrodes.
Calibration and Detection: Perform differential pulse voltammetry measurements with increasing concentrations of sucralose (typically 0.025–1.0 mM). The anodic peak current at +0.25 V (vs. Ag/AgCl) increases linearly with sucralose concentration due to the enzymatic catalytic activity toward sucralose oxidation.
Validation: Validate biosensor performance using computational modeling tools such as density functional theory (DFT) calculations and molecular docking studies to confirm interaction mechanisms between sucralose and laccase enzyme.
Protocol for Affinity Biosensor Construction: Aptamer-Based Saxitoxin Detection
Affinity biosensors require optimization of binding conditions and surface chemistry to ensure specific molecular recognition. A typical protocol for developing an aptamer-based biosensor for saxitoxin detection includes [34]:
Surface Functionalization: Modify a gold electrode surface by depositing an octadecanethiol monolayer followed by coating with multiwalled carbon nanotubes (MWCNTs) to enhance surface area and electron transfer properties.
Bioreceptor Immobilization: Covalently conjugate a saxitoxin-specific aptamer to the carboxylated MWCNTs. Ensure proper orientation of aptamers to facilitate target binding.
Indicator Binding: Electrostatically anchor methylene blue (MB) to the carboxylated MWCNTs as an electrochemical indicator. In the absence of target, MB binds to guanine bases of the aptamer, producing a strong differential pulse voltammetric signal.
Target Detection Principle: When saxitoxin is present, it binds to the aptamer, inducing a conformational change that prevents MB exposure to guanine bases. This establishes a barrier for electron transfer, resulting in a decreased electrochemical signal proportional to toxin concentration.
Measurement Conditions: Measure the oxidation peak current of methylene blue at −0.27 V (vs. Ag/AgCl) using differential pulse voltammetry. The signal decrease correlates with saxitoxin concentration in the 0.9–30 nM range.
Sample Analysis: Apply the biosensor to real sample analysis (e.g., mussel samples) using appropriate sample preparation and matrix-matching calibration standards to account for complex sample effects.
Global Benchmark Study Protocol for Affinity Biosensors
A comprehensive global benchmark study involving 150 participants from 20 countries established standardized protocols for evaluating affinity biosensor performance [58]:
Reagent Preparation: Distribute aliquots of two protein binding partners (50-kDa Fab and 60-kDa GST-tagged antigen at 10 μM concentration in HBS-P buffer, pH 7.4) to participants.
Assay Design: Participants design their own experiments to determine kinetic parameters at 25°C in HBS-P supplemented with 0.1 mg/mL BSA. Key parameters to optimize include:
- Choice of immobilized partner (ligand) vs. analyte
- Immobilization chemistry (amine coupling, capture methods, direct adsorption)
- Ligand density (typically low densities to minimize crowding effects)
- Regeneration conditions (acidic solutions, dilute base, SDS, guanidine)
- Analyte concentration range and injection parameters
Data Collection: Participants collect binding responses using various biosensor platforms, with most employing surface plasmon resonance-based systems.
Data Analysis: Participants fit response data to appropriate binding models to extract kinetic parameters (association rate ka, dissociation rate kd, and equilibrium constant K_D).
Quality Assessment: Evaluate data quality based on consistency across participants, proper experimental design, and appropriate data fitting procedures.
Signaling Pathways and Experimental Workflows
The operational principles of enzymatic and affinity biosensors involve distinct signaling pathways and experimental workflows that directly impact their application suitability and performance characteristics.
Diagram 1: Signaling pathways for enzymatic vs. affinity biosensors
Research Reagent Solutions
Successful development and implementation of biosensor technologies require specific research reagents and materials tailored to each biosensor type. The following table outlines essential research reagents for both enzymatic and affinity biosensor platforms.
Table 4: Essential research reagents for biosensor development and application
| Reagent/Material | Function | Biosensor Type | Specific Examples |
|---|---|---|---|
| Enzymes | Biological recognition element catalyzing specific reactions | Enzymatic | Glucose oxidase, laccase, acetylcholinesterase, tyrosinase [53] [56] [57] |
| Antibodies | Biological recognition element for specific molecular binding | Affinity | Anti-GST, anti-Fab antibodies for capture systems [58] |
| Aptamers | Synthetic oligonucleotides for specific target recognition | Affinity | Saxitoxin-specific, brevetoxin-specific DNA aptamers [34] |
| Nanomaterials | Signal amplification and enhanced immobilization | Both | Graphene oxide, zinc oxide nanoparticles, multiwalled carbon nanotubes [34] [56] [10] |
| Transducer Elements | Signal conversion from biological event to measurable output | Both | Gold electrodes, screen-printed electrodes, surface plasmon resonance chips [53] [34] [58] |
| Immobilization Matrices | Stable attachment of biological elements | Both | Carboxylated surfaces, amine-reactive chemistries, streptavidin-biotin systems [34] [58] |
| Electrochemical Mediators | Facilitation of electron transfer in electrochemical detection | Primarily enzymatic | Methylene blue, ferricyanide, quinone derivatives [53] [34] |
| Regeneration Solutions | Dissociation of bound complexes for surface reuse | Primarily affinity | Acidic solutions (pH 1.5-2.5), basic solutions, surfactants (SDS), chaotropic agents [58] |
Enzymatic and affinity biosensors represent complementary analytical technologies with distinct advantages for specific applications in contaminant and metabolite analysis. Enzymatic biosensors excel in scenarios requiring rapid, quantitative analysis of specific substrates, particularly in clinical diagnostics (e.g., glucose monitoring) and environmental monitoring where catalytic amplification enhances sensitivity [53] [2]. Their relatively simple construction and operation make them suitable for point-of-care testing and continuous monitoring applications.
Conversely, affinity biosensors offer superior specificity for molecular recognition applications, enabling detection of diverse targets from small toxins to large proteins and whole cells [34] [58]. These systems are particularly valuable for food safety applications (e.g., toxin detection), pharmaceutical development (e.g., biomolecular interaction analysis), and diagnostic applications requiring exceptional specificity. While generally more complex in design and operation, affinity biosensors provide fundamental information about molecular interactions that extends beyond mere detection.
The continuing evolution of both biosensor classes increasingly incorporates nanomaterial enhancements, hybrid designs, and multiplexing capabilities that blur traditional distinctions between these platforms [10]. Future developments will likely focus on integrating both enzymatic and affinity elements in single devices, leveraging the advantages of both approaches to create increasingly sophisticated analytical tools for research and diagnostic applications.
The landscape of medical diagnostics is undergoing a fundamental transformation, shifting from centralized laboratories to decentralized point-of-care and wearable settings. This transition is largely driven by advancements in biosensor technology—analytical devices that combine a biological recognition element with a physicochemical transducer to produce measurable signals [2]. These devices are increasingly enabling real-time health monitoring outside clinical environments, potentially revolutionizing the management of chronic diseases, early disease detection, and personalized medicine [59] [60].
Two principal classes of biosensors form the backbone of this technological shift: enzymatic biosensors and affinity biosensors. While both share the common goal of converting biological information into quantifiable signals, they diverge significantly in their recognition mechanisms, performance characteristics, and optimal applications [2]. Enzymatic biosensors typically employ biological catalysts (enzymes) that recognize substrates through catalytic reactions, often generating electroactive products. In contrast, affinity biosensors utilize binding molecules (antibodies, aptamers, nucleic acids) that form stable complexes with targets without modifying them [2] [61]. Understanding the comparative strengths, limitations, and appropriate implementations of these distinct biosensing paradigms is essential for researchers, scientists, and drug development professionals working to advance decentralized healthcare solutions.
Fundamental Biosensor Architectures and Working Principles
Core Components of a Biosensor
All biosensors, regardless of type, consist of three fundamental components that work in concert to detect and quantify analytes:
- Biorecognition Element: The biological moiety (enzyme, antibody, nucleic acid, cell, etc.) responsible for specific interaction with the target analyte [2] [60].
- Transducer: The component that converts the biological response into a measurable signal (electrochemical, optical, thermal, mechanical) [2].
- Signal Processor: The system that amplifies, processes, and presents the transducer output as interpretable data [2].
The critical distinction between biosensor types lies in the nature of the biorecognition element and its interaction mechanism with the target analyte, which directly influences transducer selection and overall device design [60].
System Architectures for Mobile Health Integration
As biosensors evolve for wearable and point-of-care applications, their integration with mobile platforms has led to distinct system architectures classified by the location of biosensing and data processing functions [62]:
These architectural decisions significantly impact device portability, power consumption, connectivity requirements, and real-time processing capabilities [62]. On-phone sensing leverages built-in smartphone capabilities (cameras, ambient light sensors) but may be limited in sensing modalities, while off-phone sensing enables specialized detection but requires additional hardware and connectivity solutions [62].
Enzymatic Biosensors: Principles, Applications, and Performance
Fundamental Mechanisms and Design Considerations
Enzymatic biosensors operate on the principle of catalytic recognition, where an enzyme specifically catalyzes the conversion of a target substrate into a detectable product [2]. The most common implementation involves oxidoreductases (e.g., glucose oxidase) that produce electrochemically active species (hydrogen peroxide or electrons) measurable at an electrode surface [61] [54]. The reaction kinetics typically follow Michaelis-Menten principles, where the reaction rate depends on substrate concentration and the enzyme's kinetic parameters (Km, Vmax) [54].
A critical advancement in enzymatic biosensor design has been the integration of nanomaterials to enhance performance characteristics. For instance, zinc oxide nanoparticles (ZnONPs) functionalized with graphene oxide have demonstrated 8-fold signal enhancement in laccase-based sucralose detection systems by providing increased surface area for enzyme immobilization and improved electron transfer efficiency [56]. Similarly, carbon nanotube-based enzyme field-effect transistors (FETs) have shown improved sensitivity and response times for acetylcholine detection [54].
Performance Characteristics and Experimental Data
Enzymatic biosensors typically exhibit excellent sensitivity for their specific substrates, with detection limits often reaching micromolar or even nanomolar ranges [56]. The following table summarizes performance data for representative enzymatic biosensors from recent research:
Table 1: Performance Metrics of Representative Enzymatic Biosensors
| Target Analyte | Enzyme Used | Linear Range | Detection Limit | Response Time | Reference |
|---|---|---|---|---|---|
| Sucralose | Laccase | 0.025-0.1 mM & 0.25-1.0 mM | 0.32 μM | Not specified | [56] |
| Glucose | Glucose oxidase | Not specified | Not specified | 36 seconds | [54] |
| Acetylcholine | Acetylcholinesterase | Not specified | Not specified | Not specified | [54] |
Experimental Protocols for Enzymatic Biosensor Development
Fabrication of Laccase-Based Electrochemical Biosensor for Sucralose Detection [56]:
- Electrode Modification: Glassy carbon electrode (GCE) polished and modified with graphene oxide (GO) to create a high-surface-area platform.
- Nanoparticle Integration: Zinc oxide nanoparticles (ZnONPs) capped with p-amino thiophenol (ATP) are covalently attached to the GO-modified electrode.
- Enzyme Immobilization: Laccase enzyme is immobilized onto the ZnONPs-ATP-GO nanocomposite through physical adsorption and covalent binding.
- Electrochemical Characterization: The fabricated biosensor (Lac/ZnONPs-ATP-GO/GCE) is characterized using differential pulse voltammetry in pH 5.0, 0.1 M phosphate buffer.
- Analytical Performance Assessment: Sucralose solutions of varying concentrations (0.025-1.0 mM) are tested to establish calibration curves, detection limits, and sensitivity.
Computational Validation [56]:
- Density Functional Theory (DFT) calculations performed to determine HOMO-LUMO energy gaps of sucralose.
- Molecular docking studies conducted to analyze binding interactions between sucralose and laccase active sites.
- Identification of specific amino acid residues (ILE 230, GLN 228) involved in hydrogen bonding with sucralose.
Affinity Biosensors: Principles, Applications, and Performance
Fundamental Mechanisms and Design Considerations
Affinity biosensors operate on the principle of molecular recognition, relying on the specific binding between complementary structures without modifying the target analyte [2]. This category includes antibody-based (immunosensors), aptamer-based, nucleic acid-based, and ligand-receptor biosensors. The binding event itself generates the detectable signal, typically through changes in mass, refractive index, or electrical properties [58].
Surface plasmon resonance (SPR) represents a classic affinity biosensing technique that detects binding-induced refractive index changes near a metal surface [58]. However, recent innovations have focused on electrochemical affinity biosensors that offer superior portability and lower cost [61]. A global benchmark study evaluating affinity biosensor performance demonstrated that when properly designed and executed, these sensors can achieve remarkable consistency across different platforms and users, with reported affinities for a protein-protein interaction showing a standard deviation of 980 pM around a 620 pM mean [58].
Performance Characteristics and Experimental Data
Affinity biosensors typically provide excellent specificity and are suitable for detecting a wide range of analytes, from small molecules to whole cells [58] [61]. The following table summarizes performance data for representative affinity biosensors:
Table 2: Performance Metrics of Representative Affinity Biosensors
| Target Analyte | Biorecognition Element | Detection Platform | Analytical Range | Detection Limit | Reference |
|---|---|---|---|---|---|
| Fab-GST Protein Complex | Antibody | Multiple SPR platforms | Not specified | 620 pM (average affinity) | [58] |
| Gram-negative bacteria | Not specified | LifeScale AST | Not applicable | 4.5-hour detection | [63] |
| Cardiac Troponins | Antibodies | Electrochemical | Not specified | Not specified | [64] |
| C-reactive protein | Aptamers | Optical fiber SPR | Not specified | Not specified | [64] |
The LifeScale AST system for Gram-negative bacteria detection exemplifies modern affinity biosensor technology, providing results in approximately 4.5 hours with categorical agreement exceeding 94% compared to standard methods [63]. This system utilizes automated inoculation, incubation, and reading processes, requiring less than 10 minutes of hands-on time, making it suitable for clinical laboratory settings [63].
Experimental Protocols for Affinity Biosensor Development
Surface Plasmon Resonance (SPR) Kinetic Analysis Protocol [58]:
Ligand Selection and Immobilization:
- Perform preliminary tests for nonspecific binding and pH scouting.
- Select appropriate binding partner for immobilization (considering stability and orientation).
- Immobilize ligand using suitable chemistry (amine coupling, capture methods, direct adsorption).
- Optimize ligand density to minimize crowding and mass transport effects.
Regeneration Scouting:
- Identify regeneration conditions that completely dissociate complexes without damaging the ligand.
- Test various solutions (acidic, basic, SDS, guanidine, cocktails) for efficacy.
- For single-cycle kinetics formats, omit regeneration step.
Kinetic Data Collection:
- Inject analyte across a range of concentrations (typically 2-3 fold dilutions).
- Use appropriate flow rates (determined through preliminary flow tests).
- Collect association and dissociation phases with sufficient duration.
- Include reference surface data for background subtraction.
Data Analysis:
- Fit sensorgrams to appropriate binding models (1:1 Langmuir, two-state, conformational change).
- Calculate kinetic parameters (association rate ka, dissociation rate kd) and equilibrium constants (KD).
- Validate results by comparing multiple ligand densities and/or orientations.
Comparative Analysis: Enzymatic vs. Affinity Biosensors
Technical and Performance Comparison
The selection between enzymatic and affinity biosensor platforms involves careful consideration of their respective advantages and limitations for specific applications:
Table 3: Comprehensive Comparison of Enzymatic and Affinity Biosensors
| Parameter | Enzymatic Biosensors | Affinity Biosensors |
|---|---|---|
| Recognition Mechanism | Catalytic conversion | Binding without modification |
| Common Transduction Methods | Electrochemical (amperometric, potentiometric) | Optical (SPR, fluorescence), electrochemical |
| Typical Analytes | Metabolites (glucose, lactate, cholesterol) | Proteins, antibodies, cells, nucleic acids |
| Specificity | High for specific substrates | Very high (molecular recognition) |
| Sensitivity | High (micromolar to nanomolar) | Very high (picomolar to femtomolar) |
| Response Time | Seconds to minutes | Minutes to hours |
| Reusability | Limited (enzyme stability) | Good (with regeneration) |
| Lifetime/Stability | Limited (enzyme degradation) | Good to excellent |
| Design Complexity | Moderate | Moderate to high |
| Cost | Generally lower | Generally higher |
Applications in Healthcare Monitoring
The distinct characteristics of enzymatic and affinity biosensors make them suitable for different healthcare monitoring applications:
Enzymatic biosensors dominate applications requiring continuous monitoring of dynamic analytes, such as glucose monitoring for diabetes management, where their rapid response and reversible nature are advantageous [59] [54]. In contrast, affinity biosensors excel in diagnostic applications requiring high specificity and sensitivity for proteins, pathogens, or other complex biomarkers, such as cardiac troponin detection for myocardial infarction or bacterial identification in positive blood cultures [63] [64].
The Researcher's Toolkit: Essential Materials and Reagents
Successful development of point-of-care and wearable biosensors requires careful selection of materials and reagents optimized for specific sensing platforms:
Table 4: Essential Research Reagents for Biosensor Development
| Reagent/Material | Function | Examples/Alternatives | Considerations |
|---|---|---|---|
| Enzymes | Biorecognition element for catalytic biosensing | Glucose oxidase, laccase, horseradish peroxidase | Purity, specific activity, stability, immobilization method |
| Antibodies/Aptamers | Biorecognition element for affinity biosensing | Monoclonal antibodies, single-domain antibodies, DNA/RNA aptamers | Specificity, affinity, cross-reactivity, orientation for immobilization |
| Nanomaterials | Signal amplification, enzyme immobilization, electron transfer enhancement | Graphene oxide, zinc oxide nanoparticles, carbon nanotubes, metal nanoparticles | Biocompatibility, functionalization chemistry, dispersion stability |
| Transducer Materials | Signal transduction platform | Gold electrodes (SPR), screen-printed carbon electrodes, field-effect transistors | Surface chemistry, reproducibility, cost, manufacturing scalability |
| Immobilization Matrices | Bioreceptor stabilization and surface attachment | Hydrogels, sol-gels, conducting polymers, self-assembled monolayers | Porosity, stability, biocompatibility, interference rejection |
| Membrane Materials | Analyte selectivity, interference rejection, biofouling prevention | Nafion, polyurethane, cellulose acetate, chitosan | Permselectivity, biocompatibility, long-term stability |
Future Perspectives and Research Directions
The field of point-of-care and wearable biosensors continues to evolve rapidly, with several emerging trends shaping future research directions. Multiplexed biosensing platforms that simultaneously detect multiple analytes represent a growing focus, particularly for comprehensive disease diagnosis and management [59] [61]. The integration of artificial intelligence and machine learning for advanced signal processing and data interpretation is another significant trend, enabling more accurate prediction and decision support in decentralized settings [62].
Materials science continues to drive innovations, with increased emphasis on flexible, stretchable, and biocompatible materials that enhance wearability and user compliance [59] [60]. Similarly, the development of more stable synthetic biorecognition elements (aptamers, peptide arrays, molecularly imprinted polymers) addresses limitations associated with biological receptors, particularly for long-term monitoring applications [61] [60].
Despite remarkable progress, challenges remain in understanding correlations between analyte concentrations in blood and alternative biofluids (sweat, tears, saliva), sensor calibration in uncontrolled environments, and demonstrating clinical utility through large-scale validation studies [59]. Overcoming these limitations will require continued multidisciplinary collaboration between engineers, biologists, material scientists, and clinical researchers to fully realize the potential of decentralized healthcare through advanced biosensing technologies.
Overcoming Technical Hurdles: Strategies for Enhanced Stability, Sensitivity, and Reproducibility
Addressing Enzyme Instability and Limited Operational Lifespan
A biosensor's performance is intrinsically tied to the stability of its biological recognition element. For enzyme-based biosensors, the limited operational lifespan, often cited as a key barrier to widespread commercialization, primarily stems from the inherent instability of the enzyme itself [65]. Over fifty-five years since the development of the first electrochemical enzyme biosensor, the central challenge remains the gradual loss of enzymatic activity under operational conditions, such as extremes of pH, temperature, or the presence of organic solvents [65] [32]. In contrast, affinity-based biosensors (e.g., those using antibodies, aptamers, or DNA), which rely on binding events rather than catalytic conversion, often demonstrate superior longevity, though they face their own unique set of challenges regarding specificity and regeneration [66] [1]. This guide provides a structured comparison of these two biosensor classes, focusing on their stability, and equips researchers with the experimental data and protocols needed to make informed decisions for their specific applications.
Table: Fundamental Comparison of Biosensor Classes
| Feature | Enzymatic Biosensors (Catalytic) | Affinity-Based Biosensors |
|---|---|---|
| Core Mechanism | Catalytic conversion of analyte [32] | Specific binding (e.g., antibody-antigen, aptamer-target) [1] |
| Primary Stability Challenge | Enzyme denaturation and inactivation over time [65] | Binding capacity dependence on assay conditions; robust but disruptable interactions [1] |
| Typical Lifespan | Days to a few weeks [67] | Often longer, but can be limited by fouling or degradation of the binding agent |
| Key Advantage | High catalytic efficiency and signal amplification [67] | High specificity for a wide range of targets, including non-catalytic analytes [66] |
| Regeneration Potential | Limited, as substrates are consumed | Often possible, depending on the binding strength and elution conditions [1] |
Stability Challenges and Stabilization Strategies
The degradation pathways and corresponding stabilization strategies differ significantly between enzymatic and affinity-based biosensors.
Enzymatic Biosensors: A Fight Against Denaturation
The operational life of an enzyme biosensor is a function of the enzyme's stability under working conditions. The bulk of research has focused on increasing sensitivity and selectivity, with a surprisingly small number of publications dealing directly with stability or stabilization, despite this being the key to successful application [65]. The primary failure modes are the irreversible denaturation of the enzyme's three-dimensional structure and the loss of cofactors.
A primary strategy to combat this is enzyme immobilization. The method of immobilization critically influences the stability, activity, and overall performance of the biosensor [32] [67].
Table: Common Enzyme Immobilization Techniques and Their Impact on Stability
| Immobilization Method | Mechanism | Advantages for Stability | Drawbacks |
|---|---|---|---|
| Covalent Binding | Forms stable covalent bonds between enzyme and support [32] | Strong binding prevents enzyme leaching; excellent operational stability [32] [68] | Chemical reaction can modify active site, leading to activity loss [32] [68] |
| Cross-Linking | Enzymes are linked to each other via bifunctional reagents (e.g., glutaraldehyde) [69] [68] | Prevents enzyme loss; good reproducibility; carrier-free methods like CLEAs enhance stability [69] [68] | Cross-linking can cause conformational changes and decrease activity [32] [68] |
| Entrapment/Encapsulation | Enzyme is physically confined within a porous matrix [32] | Protects enzyme from the external environment (e.g., proteases, denaturants) [32] | Diffusion barriers can limit substrate access; risk of enzyme leakage [32] [68] |
| Adsorption | Enzyme is attached via weak interactions (van der Waals, ionic) [32] | Simple, inexpensive, and less destructive to enzyme activity [32] | Weak bonding leads to easy desorption and poor stability with changes in pH or temperature [32] |
Emerging nanomaterial-based supports, such as covalent organic frameworks (COFs), graphene oxide, and magnetic nanoparticles, are redefining enzyme immobilization. These materials offer exceptional surface area, tunable porosity, and customizable functionalities, providing a more favorable microenvironment to prevent enzyme deactivation under hostile conditions [69].
Affinity Biosensors: The Specificity-Stability Balance
Affinity biosensors face different stability challenges. While the antibody-antigen interaction is typically robust, the binding capacity is strongly dependent on assay conditions like pH and temperature [1]. Furthermore, these interactions, while high-affinity, can be disrupted by chaotropic reagents, organic solvents, or ultrasonic radiation [1].
To overcome the limitations of traditional antibodies (e.g., high molecular weight, limited stability, disulfide bonds), researchers are developing artificial binding proteins. These are small, stable protein scaffolds (less than 100 amino-acid residues) that lack disulfide bonds and can be expressed in high yield in bacterial systems, making them especially suitable for creating stable biosensors [1]. Another approach is the use of nucleic acid-based aptamers, which can be selected for specific targets and are generally more stable than proteins under a wider range of conditions [66] [1].
Experimental Data and Performance Comparison
Direct comparisons of biosensor platforms reveal trade-offs between data reliability, stability, and throughput.
Table: Experimental Comparison of Biosensor Platform Performance
| Biosensor Platform / Type | Key Performance Metric | Experimental Results & Stability Data | Reference & Context |
|---|---|---|---|
| Biacore T100 (Affinity, SPR) | Data Quality & Consistency | Excellent data quality and consistency for antibody-antigen kinetics; lower throughput [70] | Comparative study of 10 mAbs on 4 platforms [70] |
| ProteOn XPR36 (Affinity) | Data Consistency | Excellent data quality and consistency, following Biacore [70] | Comparative study of 10 mAbs on 4 platforms [70] |
| Octet RED384 (Affinity, BLI) | Throughput vs. Accuracy | High flexibility and throughput with compromises in data accuracy and reproducibility [70] | Comparative study of 10 mAbs on 4 platforms [70] |
| HRP-based Biosensor (Enzymatic) | Operational Stability | HRP immobilized on modified carbon nanotubes retained activity over multiple uses, with LOD of 0.13 µM for H₂O₂ [67] | Showcases stability through effective covalent immobilization [67] |
| Cross-Linked Enzyme Aggregates (CLEAs) | Stability & Reusability | Horseradish peroxidase CLEAs maintained ~60% activity after 7 cycles of dye degradation [69]. Multi-CLEAs showed improved thermal stability and reusability [69] | Demonstrates carrier-free immobilization as a stabilization strategy [69] |
| Tyrosinase Biosensor (Enzymatic) | Immobilization Efficiency | Cross-linking, often with glutaraldehyde, is a frequent and high-performing strategy for tyrosinase immobilization [68] | Review of immobilization strategies for a specific enzyme [68] |
Detailed Experimental Protocols
To facilitate replication and further research, here are detailed methodologies for key experiments cited in this guide.
Protocol: Preparation of Cross-Linked Enzyme Aggregates (CLEAs)
This carrier-free immobilization technique enhances enzyme stability and reusability [69].
- Precipitation: Add a precipitant (e.g., ammonium sulfate or acetone) to a crude enzyme preparation or fermentation broth cell lysate. Highly pure enzymes are not necessary. This step causes the enzyme to aggregate out of solution.
- Cross-Linking: Add a bifunctional cross-linker, typically glutaraldehyde, to the precipitated enzyme aggregates. The cross-linker forms covalent bonds between the enzyme molecules, creating a stable, insoluble complex.
- Optimization: The ratio of precipitant to enzyme, the concentration of the cross-linker, and the cross-linking time must be optimized for each specific enzyme to balance stability with retained catalytic activity.
- Washing and Storage: The resulting CLEAs are washed thoroughly with buffer to remove unreacted cross-linker and precipitant. They can be stored in a buffer at 4°C until use.
Protocol: Comparative Kinetic Analysis of Antibody-Antigen Interactions
This protocol is adapted from a study comparing multiple biosensor platforms for evaluating high-affinity binding kinetics [70].
- Sample Preparation: A panel of monoclonal antibodies (e.g., 10 mAbs) is prepared against the same antigen. Samples are diluted in a suitable running buffer (e.g., HBS-EP).
- Platform Setup: The same set of antibody-antigen pairs is simultaneously evaluated on different biosensor platforms (e.g., Biacore T100, ProteOn XPR36, Octet RED384, IBIS MX96).
- Immobilization: The antigen is immobilized onto the sensor surface of each instrument according to the manufacturer's standard protocols.
- Kinetic Measurement: A series of concentrations for each antibody is flowed over the antigen-coated surface. The association and dissociation rates are measured in real-time.
- Data Analysis: Binding kinetics (association rate constant, kₐ; dissociation rate constant, kd; and equilibrium dissociation constant, KD) are calculated for each platform using integrated software. The rank order of the kinetic constants and the reproducibility between instruments are then compared.
Signaling Pathways and Experimental Workflows
The fundamental working principles of enzymatic and affinity biosensors can be visualized as distinct signaling pathways. The diagram below illustrates the core steps from analyte introduction to signal generation for each type.
Diagram: Biosensor Signaling Pathways. This illustrates the core mechanistic difference: catalytic conversion (Enzymatic) vs. binding-induced change (Affinity).
The experimental workflow for evaluating biosensor stability, particularly for enzymes, involves a cycle of immobilization, testing, and analysis, as shown below.
Diagram: Stability Assessment Workflow. A generalized protocol for testing the operational stability of an immobilized enzyme biosensor.
The Scientist's Toolkit: Essential Research Reagents and Materials
Selecting the right materials is fundamental to developing a stable and reliable biosensor. The following table details key reagents and their functions in biosensor construction and stabilization.
Table: Key Research Reagent Solutions for Biosensor Development
| Reagent / Material | Function in Biosensor Development | Specific Role in Enhancing Stability |
|---|---|---|
| Glutaraldehyde | Bifunctional cross-linking agent [69] [68] | Forms stable covalent bonds between enzymes (in CLEAs) or between enzyme and support, preventing leaching and improving mechanical stability [69] [68]. |
| Covalent Organic Frameworks (COFs) | Porous crystalline support material for immobilization [69] | Provides a high-surface-area, tunable microenvironment that protects enzymes from denaturation by harsh conditions (pH, solvents) and minimizes leaching [69]. |
| Gold Nanoparticles (AuNPs) | Nanomaterial for electrode modification and enzyme attachment [67] | High surface area and biocompatibility facilitate high enzyme loading and can enhance electron transfer, improving signal stability and sensitivity [67]. |
| Concanavalin A | Affinity binding protein (lectin) [1] | Acts as a reversible affinity receptor for sugars like glucose, enabling biosensing without analyte consumption, which can improve long-term stability [1]. |
| Artificial Binding Proteins (AgBPs) | Engineered bioreceptors (e.g., from phage display) [1] | Small, stable, and lack disulfide bonds, making them more robust than traditional antibodies under a wider range of conditions for affinity-based sensing [1]. |
| Ionic Liquids (ILs) | Green solvents / immobilization matrix components [69] | Can be used in composite materials to create a favorable microenvironment for enzymes, enhancing their stability, activity, and reusability [69]. |
The integration of a biological recognition element with a physicochemical transducer is the cornerstone of any biosensor [1]. Enzyme immobilization is a crucial process that restricts the movement of enzyme molecules to a solid support, thereby enabling their multiple or repetitive use and preventing the product from being contaminated with the enzyme [71]. This technology significantly improves biocatalyst characteristics and productivity, making them attractive for various applications in the medical, environmental, and food industries [72]. The choice of immobilization technique directly impacts key biosensor performance parameters, including stability, sensitivity, limit of detection, and reusability [73].
Within the broader context of biosensor research, immobilization strategies play a pivotal role in mediating the performance of both enzymatic biosensors, which rely on catalytic bioreceptors, and affinity biosensors, which utilize binding elements like antibodies or DNA [1] [74]. Enzymatic biosensors primarily function through substrate detection or enzyme inhibition mechanisms, where the analyte is either converted by the enzyme or suppresses its activity [75]. Affinity biosensors, in contrast, depend on selective binding events between the bioreceptor and the target analyte, without catalyzing a chemical reaction [74] [33]. The optimal immobilization method can differ significantly between these two classes, influencing electron transfer efficiency, bioreceptor orientation, and stability, which are critical for developing reliable biosensing platforms for researchers and drug development professionals.
Core Principles of Immobilization Techniques
Classification and Workflow
Biosensors can be broadly classified based on their biorecognition principle into catalytic biosensors (e.g., enzymatic biosensors) and affinity biosensors (e.g., immunosensors, DNA sensors) [74] [33]. Despite this fundamental difference, both types require the effective immobilization of their biological element (enzyme, antibody, nucleic acid, etc.) onto a transducer surface. The general workflow for developing an immobilized bioreceptor layer involves: selection of a support material, choice of immobilization technique, execution of the immobilization process, and finally, characterization of the immobilized layer's performance.
The following diagram illustrates the logical decision pathway for selecting an appropriate immobilization technique based on the nature of the bioreceptor and the desired outcome.
Figure 1: Logical workflow for selecting an immobilization technique, highlighting the three advanced methods and their core characteristics.
Detailed Mechanism of Action
Covalent Bonding
This robust method involves the formation of stable covalent linkages between functional groups on the enzyme surface (e.g., amino, carboxyl, thiol) and reactive groups on the support material [72] [73]. Porous silica, polyacrylamide, agarose, or functionalized polymers are commonly used as supports [72]. The process typically requires a two-step approach where the support surface is first activated using linker molecules like glutaraldehyde or carbodiimide, which then form bridges to the enzyme [72]. A key advantage is the strong binding that prevents enzyme leakage, leading to enhanced durability and efficient recovery for reuse [72] [71]. A potential drawback is the risk of enzyme denaturation if the chemical modification involves functional groups near the active site, which can lead to a loss of activity [72] [73].
Entrapment
This technique involves physically enclosing enzyme molecules within the interstitial spaces of a porous polymer matrix, such as alginate, polyacrylamide, or sol-gel, or within semi-permeable membranes like lipid films [72] [71]. The bonds holding the matrix can be covalent or non-covalent. The pore size of the matrix is critical, as it must be large enough to allow the substrate and products to diffuse freely but small enough to prevent the escape of the enzyme [71]. The main advantages are its simplicity, low cost, and the mild conditions required, which help preserve the enzyme's native conformation [71]. However, challenges include the potential for enzyme leakage from larger pores, diffusion limitations that can slow the reaction rate, and the risk of microbial contamination within the matrix [71].
Cross-Linking
Cross-linking, or copolymerization, creates a network by forming covalent bonds between enzyme molecules using bi- or multi-functional reagents (e.g., glutaraldehyde) without an inert support matrix [72] [71]. This results in large, insoluble enzyme aggregates. While this method is simple, cheap, and commonly used commercially, the use of polyfunctional reagents can be harsh and may lead to significant conformational changes and a consequent loss of enzymatic activity [71]. Due to the potential for high activity loss, cross-linking is often used in combination with other methods, such as adsorption or entrapment, to stabilize the enzyme further [72].
Comparative Performance Analysis
Qualitative and Quantitative Comparison
The selection of an immobilization technique involves trade-offs between binding strength, activity retention, ease of preparation, and cost. The following table provides a structured comparison of the three advanced techniques, highlighting their key characteristics, advantages, and disadvantages.
Table 1: Comparative analysis of covalent bonding, entrapment, and cross-linking immobilization techniques.
| Feature | Covalent Bonding | Entrapment | Cross-Linking |
|---|---|---|---|
| Binding Force | Strong covalent bonds [72] | Physical confinement (covalent/non-covalent matrix bonds) [71] | Covalent bonds between enzyme molecules [72] [71] |
| Stability | Very high; minimal enzyme leakage [72] [71] | Moderate; potential for enzyme leakage [71] | High; no leakage, but enzyme may be denatured [71] |
| Activity Retention | Variable; risk of active site distortion [72] [73] | High; native conformation is maintained [71] | Often low; chemical modification can denature enzyme [71] |
| Procedure Complexity | Moderate to high; requires support activation [72] | Low; simple and fast [71] | Low; simple and cheap [71] |
| Cost | Moderate to high | Low [71] | Low [71] |
| Best Suited For | Applications requiring high operational stability and reusability [72] | Labile enzymes where conformational integrity is paramount [71] | Commercial applications where cost is a major driver [71] |
The performance of these techniques can be quantified through key sensor metrics. Experimental data from research studies show how different methods impact analytical performance.
Table 2: Experimental performance data of biosensors using different immobilization techniques.
| Bioreceptor | Target Analyte | Immobilization Technique | Limit of Detection (LOD) | Linear Range | Stability/Reusability | Citation |
|---|---|---|---|---|---|---|
| Lactate Oxidase | Lactate | Adsorption (Chitosan/MWCNT composite) | Not Specified | Not Specified | Excellent | [75] |
| Cholesterol Oxidase | Cholesterol | Covalent Binding (on lnN QDs) | High Sensitivity | Logarithmic | Rapid response | [75] |
| Tyrosinase | Catechol | Cross-linking (on Au nanowires) | Lower LOD | Wider Linear Range | Good | [75] |
| L-ascorbic acid oxidase | L-ascorbic acid | Cross-linking (on ZnO nanorods) | Wide Linear Range | Good Sensitivity | Fast response, good reproducibility | [75] |
Impact on Biosensor Type: Enzymatic vs. Affinity
The choice of immobilization method has distinct implications for enzymatic and affinity biosensors, driven by their different operational principles.
Enzymatic Biosensors: For these catalytic devices, the immobilization technique must preserve the enzyme's three-dimensional structure and accessibility of its active site. Covalent bonding is widely used as it prevents enzyme leaching into the solution, which is critical for continuous monitoring and reusability [72] [75]. However, if the covalent attachment induces conformational changes or blocks the active site, activity can plummet. Entrapment is advantageous here, as it minimizes protein distortion, maintaining high catalytic activity, though substrate diffusion can become rate-limiting [71]. Cross-linking is often employed to stabilize enzymes already adsorbed or entrapped, enhancing the overall robustness of the catalytic layer [72].
Affinity Biosensors: For sensors relying on binding molecules like antibodies, aptamers, or nucleic acids, the orientation and density of the bioreceptor are paramount. Covalent bonding allows for controlled orientation if specific functional groups are targeted, which can increase the density of available binding sites and improve sensitivity [1] [33]. The strong binding also ensures the receptor remains in place during repeated regeneration cycles. Entrapment is less common for affinity receptors because the porous matrix could hinder the access of larger target molecules (e.g., proteins, cells) to the capture agent. Self-Assembled Monolayers (SAMs), a refined form of covalent attachment, are particularly valuable for affinity biosensors as they provide a well-ordered, dense layer for precisely controlling bioreceptor orientation on transducer surfaces like gold [73].
Experimental Protocols and Methodologies
Standardized Immobilization Protocols
To ensure reproducibility in biosensor development, following detailed and standardized protocols is essential. Below are generalized methodologies for each technique, which can be adapted based on the specific bioreceptor and support material.
Protocol 1: Covalent Bonding via Glutaraldehyde Cross-linker
- Principle: Activation of hydroxyl-rich supports (e.g., cellulose, sepharose) with cyanogen bromide or amine-bearing supports with glutaraldehyde to create a reactive intermediate that covalently links to enzyme amino groups [72] [71].
- Procedure:
- Support Activation: Incubate the purified support material (e.g., amino-silanized magnetic beads) with a 2.5% (v/v) glutaraldehyde solution in phosphate buffer (0.1 M, pH 7.0) for 1 hour at room temperature with gentle agitation.
- Washing: Thoroughly wash the activated support with the same buffer to remove any unbound glutaraldehyde.
- Enzyme Coupling: Incubate the activated support with the enzyme solution (in 0.1 M phosphate buffer, pH 7.0-8.0) for 2-4 hours at 25°C. The optimal enzyme concentration must be determined empirically.
- Quenching & Washing: Block any remaining reactive groups by incubating with 1 M Tris-HCl buffer (pH 8.0) or ethanolamine for 1 hour. Wash the immobilized enzyme preparation extensively with buffer to remove any physically adsorbed enzyme.
- Validation: Measure the enzymatic activity of the supernatant and wash fractions to calculate immobilization yield. Compare the activity of the immobilized enzyme with that of the free enzyme.
Protocol 2: Entrapment within a Polymeric Matrix (e.g., Alginate)
- Principle: Physical confinement of enzyme molecules within a cross-linked calcium alginate hydrogel [71].
- Procedure:
- Gel Formation: Prepare a 2-4% (w/v) sodium alginate solution in a suitable buffer. Gently mix this solution with the enzyme to achieve a homogeneous suspension.
- Droplet Formation: Using a syringe pump, drip the enzyme-alginate mixture into a cold solution of calcium chloride (50-100 mM). Alternatively, the mixture can be spread on a surface and allowed to gel.
- Gelation: Allow the beads or film to harden in the calcium chloride solution for 30-60 minutes to form stable, insoluble calcium alginate beads entrapping the enzyme.
- Washing: Collect the beads by filtration or decanting and wash them thoroughly with buffer to remove enzyme molecules attached to the surface.
- Validation: Assess the mechanical stability of the beads. Monitor the release of enzyme into the supernatant during washing and operation to check for leakage.
The Scientist's Toolkit: Essential Research Reagents
The successful application of these protocols relies on a set of key reagents and materials.
Table 3: Essential reagents and materials for advanced immobilization techniques.
| Reagent/Material | Function | Common Examples |
|---|---|---|
| Support Matrices | Provides a solid surface for attachment or a framework for entrapment. | Porous silica, agarose, chitosan, alginate, polyacrylamide, gold nanoparticles, carbon nanotubes [72] [73] [5]. |
| Activation Reagents | Modifies the support surface to create reactive groups for covalent attachment. | Cyanogen bromide (for glycol groups), glutaraldehyde, carbodiimide (EDAC/NHS) [72] [71]. |
| Cross-linking Agents | Creates covalent bridges between enzyme molecules or between enzyme and support. | Glutaraldehyde, diazonium salt, hexamethylene diisocyanate [72] [71]. |
| Nanomaterials | Enhances surface area, conductivity, and catalytic properties of the transducer. | Metal nanoparticles (Au, Ag), metal oxides (ZnO, Fe₂O₃), carbon nanotubes (MWCNT), quantum dots [75] [73] [5]. |
The strategic selection of an immobilization technique—covalent bonding, entrapment, or cross-linking—is a fundamental determinant in the performance and applicability of a biosensor. Covalent bonding offers superior stability for reusable devices, entrapment excels in preserving the activity of sensitive biocatalysts, and cross-linking provides a cost-effective means of enzyme stabilization, albeit often at the cost of initial activity.
For enzymatic biosensors, the primary challenge is balancing stability with the retention of high catalytic activity. For affinity biosensors, the focus shifts to optimizing bioreceptor orientation and density to maximize binding efficiency and signal transduction. The ongoing integration of nanomaterials and the development of hybrid techniques (e.g., adsorption followed by cross-linking) are pushing the boundaries of what is possible, leading to biosensors with unprecedented sensitivity, stability, and miniaturization potential [72] [5]. As the field progresses towards multiplexed detection, point-of-care diagnostics, and continuous monitoring, the rational design of the immobilized bioreceptor layer will continue to be a critical area of research for scientists and drug development professionals aiming to solve complex analytical challenges.
The integration of nanomaterials into biosensing platforms has revolutionized the field of diagnostic medicine and biological research. Among the most promising nanomaterials are graphene, carbon nanotubes (CNTs), and metal-organic frameworks (MOFs), each offering unique properties that significantly enhance biosensor performance. These materials improve key sensor parameters including sensitivity, selectivity, response time, and limit of detection (LOD) by providing high surface area for bioreceptor immobilization, excellent electrical conductivity, and tunable chemical functionality [76] [77]. This comparison guide objectively evaluates how these nanomaterials boost performance in both enzymatic and affinity-based biosensors, providing researchers and drug development professionals with critical insights for material selection in sensor design.
Table 1: Key Property Comparison of Graphene, CNTs, and MOFs for Biosensing
| Property | Graphene | Carbon Nanotubes (CNTs) | Metal-Organic Frameworks (MOFs) |
|---|---|---|---|
| Surface Area (m²/g) | ~2630 [78] | ~1300 [79] | Often >5000 [80] |
| Electrical Conductivity | Excellent (~10⁶ S/m) [81] | Metallic or semiconducting [79] | Typically insulating [82] |
| Bioreceptor Immobilization | Covalent/Non-covalent functionalization [83] [81] | Covalent/Non-covalent functionalization [77] | Pore encapsulation/surface grafting [82] [80] |
| Band Gap | Tunable (zero inherent) [78] | Dependent on chirality [79] | Wide, insulator-like [82] |
| Optical Properties | Transparency, fluorescence quenching [83] | Photoluminescence (NIR) [79] | Intrinsic luminescence [80] |
Performance Comparison in Enzymatic Biosensors
Enzymatic biosensors rely on the catalytic activity of immobilized enzymes to generate a measurable signal upon interaction with a target analyte. The enhanced electron transfer and large surface area provided by nanomaterials directly improve the performance of these biocatalytic sensors.
Graphene in Enzymatic Sensing
Graphene promotes fast electron transfer between the redox-active center of enzymes and the electrode surface, facilitating direct electrochemistry without mediators. This is particularly valuable because the active centers of many enzymes are typically surrounded by a thick protein layer, making direct electron transfer difficult [77] [81]. Graphene's large surface area enables high enzyme loading capacity, while its excellent biocompatibility helps maintain enzymatic activity. For instance, graphene-based glucose biosensors utilizing glucose oxidase demonstrate high repeatability and stability compared to carbon nanotube-based electrodes [81].
CNTs in Enzymatic Sensing
Carbon nanotubes serve as excellent electrical connectors, enhancing the transportation of electrons to and from enzyme redox centers. Their nanodimensions and graphitic surface chemistry make them particularly attractive for electrochemical enzymatic biosensors [77]. Both single-walled CNTs (SWNTs) and multi-walled CNTs (MWNTs) can be functionalized to improve dispersion and biocompatibility. The high surface-to-volume ratio of CNTs allows for substantial enzyme immobilization, increasing sensor sensitivity and stability across multiple detection cycles [77] [79].
MOFs in Enzymatic Sensing
MOFs provide a protective microenvironment for enzymes, preventing denaturation under harsh conditions while maintaining enzymatic activity. Their tunable pore sizes can be engineered to match the dimensions of specific enzymes, enabling selective encapsulation. MOFs like ZIF-8 create porous cages that immobilize enzymes while allowing substrate and product diffusion [80]. This protective effect enhances operational stability, with some MOF-immobilized enzymes maintaining significant activity after multiple reuse cycles [69]. The crystalline and ordered structure of MOFs facilitates reproducible enzyme orientation, leading to more consistent sensor performance.
Table 2: Experimental Performance in Enzymatic Biosensors
| Nanomaterial | Target Analyte | Immobilized Enzyme | Detection Limit | Linear Range | Key Advantage |
|---|---|---|---|---|---|
| Graphene [81] | Glucose | Glucose Oxidase | Not specified | Not specified | High repeatability and stability vs. CNTs |
| CNTs [77] | General analytes | Various enzymes | Not specified | Not specified | Enhanced electron transfer to enzyme centers |
| MOFs (ZIF-8) [69] | Microalgae lipids | Celluclast, Alcalase | Not specified | Not specified | 10x higher stability than free enzymes |
Performance Comparison in Affinity Biosensors
Affinity biosensors rely on specific molecular recognition events between complementary entities such as antibody-antigen, aptamer-target, or DNA-DNA interactions. Nanomaterials enhance these platforms by increasing probe density, improving signal transduction, and reducing non-specific binding.
Graphene in Affinity Sensing
Graphene's tunable band gap through surface modification makes it particularly suitable for field-effect transistor (FET) biosensors, where it can detect gate voltage changes from small amounts of charged biomolecules like single-stranded DNA [81]. In electrochemical immunosensors, graphene provides a large surface area for nanoparticle and antibody immobilization, creating better electron transfer pathways. For example, graphene functionalized with gold nanoparticles significantly improved the detection sensitivity for the cancer biomarker alpha-fetoprotein (AFP) [81]. Graphene and its derivatives also function as highly efficient fluorescence quenchers in FRET-based affinity assays, enabling highly sensitive detection of nucleic acids and proteins [83].
CNTs in Affinity Sensing
CNTs excel in bioaffinity sensors due to their high aspect ratio and ability to be functionalized with various recognition elements through both covalent and non-covalent bonding [77]. Their 1D structure facilitates electron transport along the tube axis, enhancing electrochemical signal generation. Semiconducting SWNTs exhibit near-infrared photoluminescence that is sensitive to environmental changes, enabling label-free detection of biomolecular interactions. CNT-FET devices can detect cancer biomarkers with high sensitivity by monitoring conductance changes upon target binding [79]. The functionalization of CNTs with biochemical molecules like 1-pyrenebutanoic acid succinimidyl ester enables efficient immobilization of antibodies and aptamers for specific target recognition [77].
MOFs in Affinity Sensing
MOFs offer exceptional versatility in affinity biosensing due to their structural and chemical tunability. Their high surface areas and customizable pore environments allow for efficient immobilization of affinity reagents like aptamers, antibodies, and DNA strands [82] [80]. Core-shell MOF nanostructures provide significant advantages in electrochemical aptasensors for cancer biomarker detection, offering improved selectivity, sensitivity, and signal strength [82]. MOFs can be engineered with structural defects or controlled pore sizes to enhance biomolecule accessibility, as demonstrated by CuxO NPs@ZIF-8, which showed high selectivity for H₂O₂ detection even in the presence of interfering compounds [82]. In optical biosensing, luminescent MOFs enable sensitive detection through mechanisms like FRET and inner filter effects [80].
Table 3: Experimental Performance in Affinity Biosensors
| Nanomaterial | Bioreceptor Type | Target Analyte | Detection Limit | Detection Method | Reference |
|---|---|---|---|---|---|
| Graphene [81] | Antibody | Alpha-fetoprotein (AFP) | Not specified | Electrochemical | [81] |
| Graphene [83] | DNA/ Antibody | Pathogens, Disease biomarkers | Not specified | Fluorescence quenching | [83] |
| CNTs [79] | Aptamer | Cancer biomarkers | Not specified | Photoluminescence | [79] |
| Core-shell MOF [82] | Aptamer | Prostate-specific antigen (PSA) | 0.145 fg/mL | Photoluminescence | [82] |
| MOF [80] | DNA | Brucella strains | 6.4 × 10⁻¹⁰ M | Fluorescence | [80] |
Experimental Protocols and Methodologies
Functionalization and Bioconjugation Protocols
Graphene Functionalization: Graphene can be functionalized via covalent or non-covalent methods. The most common covalent approach uses EDC/NHS (1-ethyl-3-(3-dimethylaminopropyl) carbodiimide hydrochloride/N-hydroxysuccinimide) chemistry to form amide bonds between carboxyl groups on graphene oxide (-COOH) and amine groups (-NH₂) on antibodies or DNA [83]. Non-covalent functionalization employs π-π stacking using molecules like 1-pyrenebutanoic acid succinimidyl ester, which strongly interacts with graphene's basal plane while presenting reactive groups for biomolecule attachment [77].
CNT Functionalization: CNTs require functionalization to improve dispersion and biocompatibility. Covalent oxidation with nitric acid/sulfuric acid mixtures introduces carboxyl groups at tube ends and defect sites, enabling further bioconjugation [77]. Non-covalent functionalization using surfactants (SDS, CTAB) or polymers (chitosan) preserves CNTs' electronic properties while enhancing aqueous solubility [77]. Biofunctionalization with specific recognition elements is achieved using 1-pyrenebutanoic acid succinimidyl ester, which adsorbs onto CNT sidewalls via π-π stacking [77].
MOF Functionalization: MOFs can be functionalized through direct synthesis incorporating functionalized linkers or via post-synthetic modification. Biomolecules can be immobilized through pore encapsulation, surface adsorption, or covalent grafting to functional groups on the MOF framework [82] [80]. For biosensing applications, aptamers or antibodies are often grafted onto MOF surfaces through carbodiimide chemistry or click reactions, preserving both biorecognition capability and MOF porosity [82].
Biosensor Fabrication and Measurement
Electrochemical Biosensors: Nanomaterial-modified electrodes are typically prepared by drop-casting nanomaterial suspensions onto glassy carbon or screen-printed electrodes [83] [77]. After bioreceptor immobilization and blocking with BSA or casein to prevent non-specific binding [83], measurements are performed using techniques such as cyclic voltammetry, electrochemical impedance spectroscopy, or amperometry in buffer or diluted serum samples [83].
Optical Biosensors: For fluorescence-based sensors, nanomaterials like graphene or MOFs are integrated into detection platforms where they function as quenchers or emitters [83] [80]. Measurements typically involve monitoring intensity changes, spectral shifts, or FRET efficiency upon target binding using spectrophotometers or customized optical setups, sometimes with smartphone integration for point-of-care applications [80].
FET Biosensors: Devices are fabricated by depositing nanomaterials like graphene or CNTs between source and drain electrodes on silicon/silicon oxide substrates [81]. After bioreceptor functionalization, conductance changes are measured in response to target binding using semiconductor parameter analyzers, often in liquid gating configurations for biological samples [81].
Signaling Pathways and Experimental Workflows
The following diagram illustrates the general experimental workflow for developing nanomaterial-enhanced biosensors, highlighting the parallel pathways for different nanomaterial types and their convergence in biosensing applications.
The Scientist's Toolkit: Essential Research Reagents
Table 4: Key Research Reagent Solutions for Nanomaterial-Enhanced Biosensing
| Reagent/Material | Function | Application Examples |
|---|---|---|
| EDC/NHS Chemistry | Covalent coupling of biomolecules to carboxylated nanomaterials | Antibody immobilization on GO [83]; DNA attachment to CNTs [77] |
| 1-Pyrenebutanoic Acid Succinimidyl Ester | Non-covalent functionalization via π-π stacking | Immobilization of proteins and DNA on graphene/CNTs [77] |
| Glutaraldehyde | Cross-linking agent for enzyme immobilization | Formation of Cross-Linked Enzyme Aggregates (CLEAs) [69] |
| Bovine Serum Albumin (BSA) | Blocking agent to prevent non-specific binding | Surface passivation in immunosensors [83] |
| Chitosan | Biopolymer for non-covalent nanomaterial functionalization | CNT dispersion and enzyme entrapment [77] |
| ZIF-8 MOF Precursors | Zinc nitrate & 2-methylimidazole for MOF synthesis | Creating porous enzyme immobilization matrices [80] |
Graphene, CNTs, and MOFs each offer distinct advantages for enhancing biosensor performance, with selection criteria depending on the specific application requirements. Graphene excels in electrochemical and FET-based biosensors due to its excellent conductivity and tunable band gap. CNTs provide exceptional properties for both electrochemical and optical biosensing, with their 1D structure facilitating electron transport and near-infrared photoluminescence enabling label-free detection. MOFs offer unparalleled versatility through their structural and chemical tunability, creating protective environments for enzymes and serving as excellent scaffolds for affinity reagents. The integration of these nanomaterials continues to push the boundaries of biosensing capabilities, enabling more sensitive, specific, and robust detection platforms for healthcare, environmental monitoring, and diagnostic applications. Future developments will likely focus on hybrid approaches that combine the strengths of multiple nanomaterials to create even more powerful biosensing systems.
Mitigating Interference in Complex Biological Matrices
The accurate detection of analytes within complex biological matrices—such as serum, blood, and cell culture media—is a fundamental challenge in diagnostic medicine and pharmaceutical development. These matrices are composed of countless biomolecules that can interfere with detection systems, leading to inaccurate results. Biosensor technology has emerged as a powerful solution, with enzymatic and affinity-based biosensors representing two predominant approaches. While both leverage biological recognition, their underlying principles and strategies for mitigating interference differ significantly. Enzymatic biosensors typically rely on catalytic reactions, whereas affinity biosensors depend on specific binding events. This guide provides a objective comparison of these platforms, focusing on their performance in complex environments, supported by experimental data and detailed methodologies to inform researcher selection for specific applications.
Biosensor Fundamentals and Interference Challenges
Core Principles and Classifications
A biosensor is an analytical device that integrates a biological recognition element (bioreceptor) with a physicochemical transducer to produce a measurable signal proportional to the concentration of a target analyte [4] [2]. The five essential components are the analyte, the bioreceptor, the transducer, electronics, and a display interface [4].
Biosensors are broadly classified by their biorecognition principle:
- Enzymatic Biosensors: These use enzymes as bioreceptors, which catalyze a reaction involving the target analyte. The resulting biochemical products are then measured by the transducer [2]. A classic example is the glucose biosensor using glucose oxidase [17].
- Affinity Biosensors: These utilize biological affinity interactions, such as antigen-antibody, ligand-receptor, or DNA complementary strand pairing. The binding event itself is detected, without necessarily causing a chemical change in the target [2]. Proximity biosensors and focal molography are advanced examples [84] [85].
The transducer, which converts the biological event into a quantifiable signal, can be electrochemical, optical, thermal, or piezoelectric. Electrochemical transducers are particularly prominent due to their sensitivity, simplicity, and cost-effectiveness [18] [86].
Major Interference Mechanisms in Complex Matrices
Complex biological samples like serum, blood, and food homogenates present several key challenges that can cause false positives or negatives [4]:
- Non-Specific Binding (NSB): Non-target molecules (e.g., albumin, immunoglobulins) in the sample can adsorb onto the sensor surface or the bioreceptor, generating a false signal [85].
- Matrix Effects: The bulk properties of the sample (viscosity, refractive index, ionic strength, pH) can alter the efficiency of the biorecognition reaction or the physical response of the transducer [87] [85].
- Fouling: The accumulation of cells, lipids, or other components on the sensor surface can block the active sites and reduce sensitivity over time.
Comparative Analysis: Enzymatic vs. Affinity Biosensors
The table below summarizes the core characteristics and interference mitigation strategies of enzymatic and affinity biosensors.
Table 1: Fundamental comparison of enzymatic and affinity biosensors.
| Aspect | Enzymatic Biosensors | Affinity Biosensors |
|---|---|---|
| Basis of Detection | Catalytic reaction & substrate turnover [2] | Binding affinity & molecular recognition [2] |
| Key Bioreceptor | Enzymes (e.g., Glucose oxidase, Acetylcholinesterase) [18] [17] | Antibodies, Aptamers, DNA probes [2] [9] |
| Primary Signal | Consumption of co-substrate or generation of product (e.g., H₂O₂) [17] | Formation of a bioreceptor-analyte complex [9] |
| Common Transducers | Amperometric, Potentiometric [18] | Electrochemical, Optical (SPR, BLI) [85] [9] |
| Mitigation via Bioreceptor | Enzyme engineering for stability; substrate specificity [17] | High-specificity antibodies; optimized immobilization [9] |
| Mitigation via Transducer | Applied potential discrimination; use of redox mediators [17] | Label-free detection; internal referencing [85] |
| Mitigation via Nanomaterials | CNTs, graphene for enhanced electron transfer & enzyme stabilization [18] [86] | Nanomaterials for signal amplification and reduced fouling [18] |
Performance Data in Complex Matrices
Recent studies provide quantitative data on the performance of different biosensor strategies in challenging environments. The following table compares several platforms based on published experimental results.
Table 2: Experimental performance data of various biosensors in complex matrices.
| Biosensor Technology / Platform | Target Analytic | Complex Matrix | Key Performance Metric | Result | Reference / Example |
|---|---|---|---|---|---|
| Focal Molography (Affinity) | soluble CD4 (sCD4) | 50% Bovine Serum | Dissociation Constant (KD) | Within 1.8-fold of KD in buffer [85] | Biosensors 2025, 15(2), 66 |
| Focal Molography (Affinity) | sCD4 | Cell culture media, 50% FBS | Analyte Recovery Rate | 97.8–100.3% [85] | Biosensors 2025, 15(2), 66 |
| Cl/MWCNTs/AChE/GCE (Enzymatic) | Organophosphorus (OP) pesticides | Vegetables | Detection Limit | 3.3 × 10⁻¹¹ M [18] | Foods 2025, 14(7), 1254 |
| Cl/MWCNTs/HRP/AChE/GCE (Enzymatic) | OP pesticides | Vegetables | Detection Limit | 4.5 × 10⁻¹² M [18] | Foods 2025, 14(7), 1254 |
| IL1-MWCNTs/AChE/GCE (Enzymatic) | OP pesticides | Vegetables | Reactivity after 2 weeks | 98.5% [18] | Foods 2025, 14(7), 1254 |
| LifeScale AST (Affinity-based) | Gram-negative bacteria | Positive blood culture | Time to Result | ~4.5 hours [63] | Affinity Biosensors |
Detailed Experimental Protocols
To illustrate the practical implementation of interference mitigation strategies, here are detailed protocols for two key experiments cited in the comparison tables.
Protocol: Enzymatic Biosensor for Pesticide Detection in Vegetables
This protocol is adapted from the development of a high-sensitivity acetylcholinesterase (AChE) biosensor for organophosphorus pesticides in vegetables [18].
1. Sensor Fabrication:
- Working Electrode Preparation: A glassy carbon electrode (GCE) is polished and cleaned. Multi-walled carbon nanotubes (MWCNTs) are functionalized with ionic liquid (IL1) to create a stable, high-surface-area carrier material.
- Enzyme Immobilization: Acetylcholinesterase (AChE) is immobilized onto the IL1-MWCNTs nanohybrid via cross-linking or physical adsorption. For enhanced sensitivity, horseradish peroxidase (HRP) can be co-immobilized to create a dual-enzyme system (Cl/MWCNTs/HRP/AChE/GCE).
2. Sample Preparation:
- Vegetable samples are homogenized, and pesticides are extracted using a standard solvent like acetone or ethyl acetate.
- The extract is evaporated, and the residue is re-dissolved in a suitable buffer for analysis.
3. Measurement and Detection:
- Principle: The assay is based on the inhibition of AChE activity by pesticides. The normal enzymatic hydrolysis of acetylthiocholine produces thiocholine, which is electrochemically oxidized to produce a measurable current. Pesticide presence inhibits AChE, leading to a reduction in this current signal.
- Procedure: The biosensor is immersed in the sample extract. After a defined incubation period (e.g., 14 minutes [18]), the substrate (acetylthiocholine) is added, and the amperometric current is measured.
- The percentage of enzyme inhibition is calculated and correlated with pesticide concentration using a pre-established calibration curve.
4. Interference Mitigation:
- The functionalized MWCNTs optimize the microenvironment for AChE, enhancing stability and electron transfer.
- The ionic liquid modification reduces fouling and improves selectivity.
- The applied potential can be tuned to minimize oxidation of interfering compounds.
Protocol: Affinity-Based Detection with Focal Molography in Serum
This protocol outlines the use of Focal Molography (FM) for robust affinity and kinetic measurements in serum [85].
1. Sensor Chip Preparation:
- Mologram Patterning: A sensor chip is pre-fabricated with an array of molograms—nanoscale diffraction gratings. The "ridges" of the grating are coated with a specific ligand (e.g., a single-domain antibody against the target protein).
- Backfilling: The "grooves" of the grating are "backfilled" with a control protein (e.g., a non-specific antibody) that has similar biochemical properties to the ligand but no affinity for the target. This crucial step ensures that non-specific binding affects ridges and grooves equally.
2. Sample Preparation:
- The target analyte (e.g., soluble CD4) is spiked into a complex matrix such as 50% bovine serum.
- No extensive pre-processing or analyte-depleted matrix matching is required.
3. Measurement and Detection:
- Principle: Coherent laser light illuminates the mologram. Only molecules that bind in an ordered fashion on the patterned ridges diffract light coherently to form a bright focal spot. Random, non-specific binding scatters light in all directions and does not contribute to the signal.
- Procedure: The serum sample is flowed over the sensor chip. The intensity of the focal spot is monitored in real-time as the analyte binds to the ridges. The signal, termed "coherent mass density," is intrinsically referenced against the grooves.
- Kinetic Analysis: Association and dissociation phases are recorded by introducing and then removing the sample. The kinetic rate constants (kon, koff) and equilibrium dissociation constant (KD) are calculated from this binding curve.
4. Interference Mitigation:
- The core technology provides intrinsic referencing via the ridge-groove pattern, physically rejecting signals from random NSB.
- The backfilling step with a matched control protein further neutralizes the effect of coherent NSB.
- The evanescent field of the laser only probes ~100 nm from the surface, making the system insensitive to bulk matrix effects.
Visualizing Signaling Pathways and Workflows
Interference Mitigation Logic in Focal Molography
The following diagram illustrates the core logical principle that enables Focal Molography to distinguish specific signal from non-specific interference.
Generalized Workflow for Biosensor Development and Testing
This diagram provides a high-level overview of the key stages involved in developing and validating a biosensor for complex matrices.
The Scientist's Toolkit: Key Research Reagents and Materials
The table below lists essential materials and reagents commonly used in the development of advanced biosensors for complex matrices, as cited in the referenced research.
Table 3: Key research reagent solutions for biosensor development.
| Reagent / Material | Function / Application | Example Use Case |
|---|---|---|
| Functionalized MWCNTs (e.g., -SH, -NH₂, -Cl, IL-modified) | Nano-carrier for enzyme immobilization; enhances electron transfer and stability [18]. | Acetylcholinesterase biosensor for pesticide detection [18]. |
| Single-Domain Antibodies (VHHs) | High-affinity, stable bioreceptors for affinity-based detection [85]. | Focal Molography sensor for sCD4 and Granzyme B [85]. |
| Screen-Printed Electrodes (SPEs) | Disposable, cost-effective, mass-producible electrode platforms for PoC sensors [9]. | Electrochemical biosensors for glucose, uric acid, and biomarkers [9]. |
| Ionic Liquids (ILs) | Modify electrode surface to create a favorable microenvironment for biomolecules, reducing fouling [18]. | IL-modified MWCNTs for AChE stabilization [18]. |
| Cross-linkers (e.g., Glutaraldehyde) | Covalently bind enzymes or other bioreceptors to solid supports or nanomaterials [18] [86]. | Creating stable enzyme-nanomaterial conjugates [18]. |
| Blocking Proteins (e.g., BSA) | Reduce non-specific binding by occupying uncovered sites on the sensor surface [85]. | Standard step in immunoassays and surface preparation [85]. |
Optimizing Electrode Materials and Surface Functionalization
The performance of electrochemical biosensors is fundamentally governed by the careful selection of electrode materials and their subsequent surface functionalization. These elements determine critical analytical parameters including sensitivity, selectivity, stability, and the limit of detection. Within the broader context of biosensor research, a key distinction exists between enzymatic biosensors, which rely on catalytic biorecognition elements, and affinity biosensors, which depend on binding events. This guide provides a detailed comparison of how electrode optimization strategies diverge for these two biosensor classes, supported by experimental data and protocols to aid researchers in selecting and implementing the most appropriate materials and methods for their specific applications.
Comparative Analysis: Enzymatic vs. Affinity Biosensors
The core operational principles of enzymatic and affinity biosensors necessitate different optimization priorities for their electrode interfaces. The table below summarizes their key characteristics and performance determinants.
Table 1: Fundamental Comparison between Enzymatic and Affinity Biosensors
| Aspect | Enzymatic Biosensors | Affinity Biosensors |
|---|---|---|
| Biorecognition Element | Enzymes (e.g., Glutamate Oxidase, Glucose Oxidase) [88] [17] | Antibodies, DNA probes, or aptamers [2] [8] |
| Transduction Mechanism | Detection of enzyme-generated products (e.g., H₂O₂) [88] | Detection of binding events (e.g., antigen-antibody, DNA hybridization) [8] |
| Key Performance Metrics | Sensitivity, Response Time, Catalytic Efficiency [88] | Limit of Detection (LOD), Specificity, Assay Robustness [26] [8] |
| Primary Electrode Focus | Maximizing mass transfer and electron shuttle [88] [89] | Maximizing probe density and binding accessibility [8] [90] |
| Common Electrode Materials | Platinum, Carbon-based nanomaterials (CNTs, Graphene) [88] [17] | Gold, Screen-printed Carbon Electrodes (SPCEs) [8] [91] |
| Typical Functionalization | Enzyme entrapment in polymers (e.g., Nafion, PPD) or hydrogels [88] | Covalent immobilization (e.g., APTES/Glutaraldehyde) or Streptavidin-Biotin systems [8] [91] [90] |
Performance Data and Optimization Strategies
Optimizing Enzymatic Biosensors
For enzymatic biosensors, the physical architecture of the enzyme and permselective layers is a critical determinant of performance. A mathematical model of a glutamate biosensor demonstrated that layer thickness directly controls the trade-off between sensitivity and response time [88].
Table 2: Simulated Performance of a Glutamate Biosensor vs. Layer Thickness
| Permselective Layer Thickness (μm) | Enzyme Layer Thickness (μm) | Sensitivity (nA/μM/cm²) | Response Time (s) |
|---|---|---|---|
| 10 | 20 | 60.7 | 0.73 |
| 2 | 5 | ~360 (6x increase) | ~0.1 (7x decrease) |
Key Findings:
- Thinner layers significantly enhance performance by reducing diffusion barriers for the substrate and reaction products [88].
- Mass transfer limitations can mask intrinsic enzyme kinetics at commonly used layer thicknesses [88].
- H₂O₂ capture efficiency can be very low (~3.6%) in sub-optimal designs, leading to poor sensitivity [88].
Optimizing Affinity Biosensors
Affinity biosensors, such as those for detecting DNA methylation, require strategies that ensure a high density of accessible capture probes. A study on an electrochemical DNA sensor for cancer-related gene methylation achieved a detection limit in the femtogram-per-milliliter range by optimizing the surface chemistry on magnetic microparticles [8].
Critical Optimization Variables:
- Probe Immobilization Density: Maximizing the number of available capture probes without causing steric hindrance [8].
- Assay Format: Sandwich-type assays can improve specificity and signal amplification [8].
- Surface Passivation: Using polymer brushes like poly(oligo(ethylene glycol) methacrylate) (POEGMA) minimizes non-specific binding, eliminating the need for blocking steps and reducing background noise [92].
Experimental Protocols
Protocol: Optimization of an Electroenzymatic Glutamate Biosensor
This protocol is based on a detailed model for optimizing sensors using glutamate oxidase (GlutOx) [88].
- Electrode Preparation: Start with a platinum (Pt) microelectrode.
- Permselective Coating: Deposit a thin, uniform layer of a polymer like Nafion or poly(o-phenylenediamine) (PPD) via dip-coating or electrodeposition. The target thickness should be in the low micrometer range (e.g., 2-5 μm) [88].
- Enzyme Immobilization: Prepare a mixture of GlutOx and Bovine Serum Albumin (BSA). Spread this mixture over the permselective layer and cross-link it using glutaraldehyde vapor. Optimize the enzyme layer to be thin (e.g., ~5 μm) to minimize mass transfer resistance [88].
- Calibration and Testing: Characterize the biosensor by performing amperometry in a standard buffer. Apply a constant potential suitable for H₂O₂ oxidation (e.g., +0.7 V vs. Ag/AgCl) and record the current response to step changes in glutamate concentration (e.g., 0 to 10 μM).
- Performance Metrics: Calculate sensitivity (nA/μM) from the steady-state current and measure the response time as the time to reach 90% of the steady-state current after a concentration step [88].
Protocol: Fabrication of an Electrochemical DNA Methylation Biosensor
This protocol outlines the steps for creating an affinity biosensor for detecting gene-specific methylations without bisulfite conversion [8].
- Probe Immobilization: Incubate streptavidin-modified magnetic beads (Strep-MBs) with a biotinylated DNA capture probe that is complementary to the target methylated DNA sequence.
- Target Hybridization: Mix the probe-modified beads with the denatured sample DNA (e.g., extracted genomic DNA). Allow hybridization to occur.
- Methylation Recognition: Add a primary anti-5-methylcytosine antibody (anti-5-mC), which will bind to the methylated cytosine residues in the captured DNA.
- Signal Amplification: Introduce a secondary horseradish peroxidase (HRP)-conjugated antibody (e.g., HRP-anti-mouse IgG) that binds to the primary antibody.
- Amperometric Detection: Capture the magnetic beads on the surface of a screen-printed carbon electrode (SPCE). Add a solution containing hydrogen peroxide (H₂O₂) and hydroquinone (HQ). Measure the cathodic current generated by the enzymatic reduction of H₂O₂, which is mediated by HQ. The current is proportional to the concentration of methylated DNA [8].
Signaling Pathways and Workflows
The diagrams below illustrate the core operational principles and experimental workflows for the two biosensor types.
Diagram 1: Core Signaling Principles
Diagram 2: Key Experimental Workflows
The Scientist's Toolkit: Research Reagent Solutions
The table below lists essential materials and their functions for developing and optimizing biosensors, as cited in the referenced research.
Table 3: Essential Research Reagents for Biosensor Development
| Reagent/Material | Function/Brief Explanation | Example Application |
|---|---|---|
| Glutamate Oxidase (GlutOx) | Molecular recognition element; catalyzes glutamate oxidation, producing H₂O₂ [88]. | Enzymatic biosensor for neurotransmitter monitoring [88]. |
| Nafion / PPD | Permselective polymer; blocks interferents (e.g., ascorbic acid) while allowing H₂O₂ to pass [88]. | Coating for platinum electrodes to enhance selectivity [88]. |
| Bovine Serum Albumin (BSA) | Used as a carrier protein to stabilize enzymes during cross-linking immobilization [88]. | Part of the GlutOx/BSA mixture for enzyme layer formation [88]. |
| Glutaraldehyde | Crosslinking agent; creates covalent bonds to form a stable, networked enzyme-polymer layer [88] [91]. | Immobilization of GlutOx/BSA on electrode surface [88]. |
| Anti-5-Methylcytosine Antibody | Biorecognition element; specifically binds to methylated cytosine residues in DNA [8]. | Affinity biosensor for detecting DNA methylation in cancer genes [8]. |
| Streptavidin-Magnetic Beads (Strep-MBs) | Solid support; allows for immobilization of biotinylated probes and easy magnetic separation [8]. | Platform for DNA probe immobilization in methylation detection assays [8]. |
| 3-Aminopropyltriethoxysilane (APTES) | Silane coupling agent; forms a self-assembled monolayer with terminal amine groups for further functionalization [91] [90]. | Creating an amine-functionalized surface on glass/silica for probe attachment [90]. |
| Screen-Printed Carbon Electrodes (SPCEs) | Low-cost, disposable electrode platforms; ideal for decentralized testing and amperometric detection [8]. | Transducer for electrochemical affinity biosensors [8]. |
Improving Signal Generation and Amplification in Affinity Assays
Biosensors are analytical devices that convert a biological response into a measurable signal, typically comprising a biological recognition element (e.g., enzyme, antibody, DNA), a transducer, and a signal processor [2]. Within this field, a fundamental distinction exists between enzymatic and affinity biosensors, each with unique mechanisms for signal generation and amplification. Enzymatic biosensors rely on the catalytic activity of enzymes to recognize and convert a target analyte, often generating multiple product molecules per enzyme to achieve signal amplification [7]. In contrast, affinity biosensors are based on specific, non-catalytic binding interactions between molecular pairs, such as antibody-antigen, ligand-receptor, or DNA complementary strands [2] [10]. The core challenge in affinity assays has been the 1:1 binding stoichiometry, which inherently limits signal generation and necessitates sophisticated amplification strategies to achieve high sensitivity [84] [93]. This guide provides a comparative analysis of modern signal enhancement strategies, evaluating their performance, experimental protocols, and applicability for researchers in diagnostics and drug development.
Performance Comparison: Key Assay Formats and Metrics
The table below summarizes the core performance characteristics of prominent affinity and enzymatic assay formats, highlighting their typical detection limits, dynamic ranges, and primary amplification mechanisms.
Table 1: Performance Comparison of Affinity and Enzymatic Biosensor Assays
| Assay Format | Detection Principle | Key Amplification Strategy | Typical LOD/Detection Limit | Dynamic Range | Assay Time |
|---|---|---|---|---|---|
| Conventional ELISA (Affinity) | Antibody-Antigen Binding + Enzyme Label | Enzymatic turnover of chromogenic substrate [10] | ~ pM range [10] | 3-4 log [10] | Several hours [10] |
| Nanoparticle-based Affinity Sensor | Antibody-Antigen Binding | Electrocatalytic activity of nanoparticle labels (e.g., Au, Pt) [93] | fM - aM [93] | >5 log [93] | ~1-2 hours [93] |
| Proximity Biosensor (CDN-based) | DNA Assembly induced by target binding | Constitutional Dynamic Network minimizing background [84] | Not specified | Not specified | Not specified |
| Automatic ICA with Polymer | Immunochromatography | Water-swellable polymer for automated reagent release [94] | Comparable to ELISA for CRP [94] | Comparable to ELISA for CRP [94] | Minutes [94] |
| Enzymatic Glucose Sensor (GOx-based) | Catalytic oxidation of glucose | Natural enzyme turnover; Mediators or direct electron transfer [17] | ~3.1 μM [17] | 0.03–16.5 mM [17] | Seconds to minutes [7] |
| AChE Sensor for Pesticides | Enzymatic inhibition | Nanomaterial carriers (e.g., IL-MWCNTs) for enhanced electron transfer [18] | 3.3 × 10⁻¹¹ M for OP [18] | 1.0 × 10⁻¹¹ –1.0 × 10⁻⁷ mol/L [18] | 14 min inhibition time [18] |
The following table provides a head-to-head comparison of critical attributes for researchers selecting an assay platform.
Table 2: Strategic Comparison of Affinity and Enzymatic Biosensor Platforms
| Attribute | Affinity Biosensors | Enzymatic Biosensors |
|---|---|---|
| Primary Basis | Binding (Affinity) [2] | Catalysis [7] |
| Key Advantage | High specificity for a wide range of targets (ions, proteins, cells) [2] | Built-in signal amplification via substrate turnover [7] |
| Key Disadvantage | Often requires external labels or complex schemes for amplification [84] [93] | Limited to substrates of the enzyme; Stability issues [18] |
| Best For | Detecting specific proteins, DNA, or whole cells without a catalytic function [84] [2] | Detecting metabolites and small molecules (e.g., glucose, lactate, pesticides) [18] [7] |
| Robustness in Complex Matrices | Can suffer from non-specific binding; New designs (e.g., CDN) improve robustness [84] | Can be affected by inhibitors or interfering substances in the sample [18] |
Experimental Protocols for Key Assay Types
Protocol: Water-Swellable Polymer for Automated Immunochromatographic Assay
This protocol details the setup for an automated, self-amplifying lateral flow assay as described in the research [94].
Sensor Assembly:
- Fabricate a standard nitrocellulose membrane with test and control lines.
- Prepare a separate reagent pad containing signal-generating materials (e.g., enzyme substrates, signal-enhancing materials) in a dry state.
- Physically separate this reagent pad from the test membrane during storage using a spacer.
- Integrate a water-swellable polymer (e.g., a specific hydrogel) in a location where it will contact the fluid front from the sample pad.
Assay Operation and Signal Amplification:
- Apply the liquid sample (e.g., human serum) to the sample pad.
- The sample migrates through the strip, hydrating and causing the water-swellable polymer to expand.
- The swelling polymer creates mechanical force, which automatically pushes or connects the previously separated reagent pad onto the test membrane.
- The pre-loaded reagents on the pad are rehydrated and interact with the captured analyte on the test line, generating or amplifying the signal automatically without user intervention.
Detection:
- Read the signal on the test line. The research demonstrated this with colorimetric, chemiluminescence, and metal-ion amplification methods [94].
Protocol: Nanomaterial-Enhanced Electrochemical Affinity Biosensor
This protocol is adapted from studies on using nanomaterials for signal amplification in immunosensors and DNA sensors [18] [93].
Electrode Modification and Bioreceptor Immobilization:
- Clean the working electrode (e.g., Glassy Carbon Electrode, GCE).
- Prepare a dispersion of functionalized nanomaterials (e.g., Ionic Liquid-modified Multi-Walled Carbon Nanotubes (IL-MWCNTs), gold nanoparticles).
- Drop-cast the nanomaterial dispersion onto the electrode surface and allow it to dry, forming a conductive, high-surface-area network.
- Immobilize the biorecognition element (e.g., antibody, DNA probe) onto the modified electrode. This can be achieved via adsorption, covalent coupling using EDC/NHS chemistry, or affinity-based binding (e.g., using streptavidin-biotin).
Assay Execution and Signal Amplification:
- Incubate the modified electrode with the sample solution containing the target analyte (e.g., a protein, DNA sequence).
- Wash the electrode thoroughly to remove unbound substances.
- For signal amplification, incubate the electrode with a detection antibody or DNA probe that is labeled with electrocatalytic nanoparticles (e.g., Pt nanoparticles, enzymatic labels like Horseradish Peroxidase - HRP).
- The nanoparticles catalyze a subsequent electrochemical reaction, leading to a significant amplification of the measured current.
Measurement and Analysis:
- Perform the electrochemical measurement (e.g., Amperometry or Electrochemical Impedance Spectroscopy) in an appropriate electrolyte.
- The resulting electrical signal (current, impedance) is proportional to the target concentration. The nanomaterial carrier enhances electron transfer and increases the loading of labels, dramatically improving sensitivity [18] [93].
Signaling Pathways and Workflow Visualization
Affinity Biosensor Signal Amplification Logic
The following diagram illustrates the core logical framework for signal amplification in affinity biosensors, contrasting the inherent 1:1 binding limitation with common nanoparticle-based and enzymatic enhancement strategies.
Automated Immunochromatographic Assay Workflow
This diagram outlines the sequential steps and key components in the operation of an immunochromatographic biosensor that uses a water-swellable polymer for automated signal generation [94].
The Scientist's Toolkit: Key Research Reagent Solutions
This table lists essential materials and reagents used in the development of advanced affinity and enzymatic biosensors, as cited in the research.
Table 3: Essential Reagents for Biosensor Development and Signal Amplification
| Research Reagent / Material | Function in Assay Development | Example Application |
|---|---|---|
| Gold Nanoparticles (AuNPs) | High-conductivity labels for electrochemical signal amplification; carriers for antibody immobilization [18] [93]. | Used in an immunosensor for Cancer Antigen 125 (CA125) to enhance electron transfer [86]. |
| Functionalized Carbon Nanotubes (e.g., IL-MWCNTs) | Nanomaterial carriers that provide a large surface area, enhance electron transfer, and optimize the enzyme immobilization microenvironment [18]. | Carrier for acetylcholinesterase (AChE) in a sensor for organophosphorus pesticides [18]. |
| Water-Swellable Polymer (Hydrogel) | Acts as an automatic actuator in lateral flow devices, switching reagent states from separated to connected upon hydration [94]. | Enables automatic sequential reaction and signal amplification in an immunochromatographic CRP sensor [94]. |
| Enzyme Labels (e.g., HRP, GOx) | Catalyze the turnover of a substrate to generate an amplified, measurable signal (color, light, current) in affinity assays [18] [10]. | HRP used in a dual-enzyme electrode to increase sensitivity for choline oxidation [18]. |
| Redox Mediators (e.g., Ferrocene) | Shuttle electrons between the enzyme's active site and the electrode surface, reducing reliance on dissolved oxygen [17]. | Key component in second-generation glucose biosensors to facilitate electron transfer [17]. |
| Constitutional Dynamic Networks (CDNs) | Synthetic DNA-based systems that use dynamic equilibria to minimize background noise and improve assay robustness in proximity biosensors [84]. | Used in a proximity biosensor for sensitive, wash-free protein detection in human serum [84]. |
Head-to-Head Comparison: Selecting the Right Biosensor for Your Application
Biosensors are analytical devices that integrate a biological recognition element with a physicochemical transducer to detect a specific analyte [2]. The performance of any biosensor is primarily evaluated through three key parameters: sensitivity (the magnitude of signal change per unit concentration of analyte), limit of detection (LOD) (the lowest analyte concentration that can be reliably distinguished from background noise), and linear range (the concentration interval over which the sensor response changes linearly with concentration) [5] [4]. In diagnostic and research applications, two major classes of biosensors dominate: enzymatic biosensors and affinity biosensors. Enzymatic biosensors rely on the catalytic activity of enzymes, where the analyte (often the enzyme's substrate) is converted, and this reaction generates a measurable signal [50]. In contrast, affinity biosensors are based on specific, non-catalytic binding events between a bioreceptor (e.g., antibody, aptamer) and the target analyte, with the formation of the stable complex being the signal-generating event [95] [96]. This guide provides a direct, data-driven comparison of these two biosensing strategies to inform selection for specific research and development applications.
Performance Comparison at a Glance
The table below summarizes representative performance data for enzymatic and affinity biosensors targeting various analytes, as reported in recent literature.
Table 1: Performance Metrics of Selected Enzymatic and Affinity Biosensors
| Analyte | Biosensor Type / Recognition Element | Sensitivity | Limit of Detection (LOD) | Linear Range | Transduction Method |
|---|---|---|---|---|---|
| Cholesterol | Non-enzymatic (Metal Oxide Composite) | Not Specified | Not Specified | Up to 6.2 mM (Clinical Range) [97] | Electrochemical (Amperometric) |
| Putrescine | Enzymatic (Diamine Oxidase) | 2.04 nm/lg(µM) | 0.267 µM | 0 - 100 µM [98] | Optical (LSPR) |
| Ricin | Affinity (DNA Ligand vs. Antibody Fc) | Response Slope: 0.329 lg(C)⁻¹ | 30.5 ng/mL | Logarithmic Linear Range [96] | Bio-Layer Interferometry (BLI) |
| General Small Molecules | Enzymatic (e.g., Glucose Oxidase) | High (from catalytic amplification) | Low (nM-µM possible) | Moderate [5] [99] | Primarily Electrochemical |
| Proteins, Viruses | Affinity (Antibody, Aptamer) | High (from strong binding) | Very Low (pM-fM possible) | Wide [95] [9] | Optical, Electrochemical |
Underlying Mechanisms and Experimental Workflows
The distinct performance characteristics of enzymatic and affinity biosensors are a direct consequence of their fundamentally different operating principles and experimental setups.
Fundamental Signaling Pathways
The following diagrams illustrate the core signal generation mechanisms for each biosensor type.
Enzymatic Biosensor Signaling Pathway
Affinity Biosensor Signaling Pathway
Characteristic Experimental Protocols
Standardized experimental workflows are critical for achieving reproducible performance metrics.
Protocol for Electrochemical Enzymatic Biosensor (e.g., for Cholesterol) [97] [9]
- Electrode Modification: The working electrode (e.g., screen-printed carbon or gold electrode) is modified with a nanocomposite material (e.g., metal oxides, carbon nanotubes, polymers) to create a high-surface-area, conductive platform.
- Enzyme Immobilization: The cholesterol-oxidizing enzyme (e.g., cholesterol oxidase) is immobilized onto the modified electrode surface via methods such as physical adsorption, cross-linking with glutaraldehyde, or entrapment within a polymer matrix.
- Calibration and Measurement: The biosensor is incubated in standard solutions with known cholesterol concentrations. The enzymatic reaction produces hydrogen peroxide (H₂O₂), which is oxidized at the electrode surface, typically at a applied potential of +0.4V to +0.6V vs. Ag/AgCl. The resulting amperometric current is measured.
- Data Analysis: The measured current is plotted against cholesterol concentration to establish a calibration curve, from which sensitivity, LOD, and linear range are calculated.
Protocol for Optical Affinity Biosensor (e.g., for Ricin) [96]
- Surface Functionalization: A biosensor tip (e.g., Streptavidin-coated for BLI) is activated and incubated with a biotinylated affinity ligand (e.g., the A-DNAFL or Protein A) that specifically binds the Fc region of an antibody.
- Oriented Antibody Immobilization: The capture antibody (e.g., mouse anti-ricin) is loaded onto the tip in a directional manner via its Fc region, leaving the antigen-binding sites free.
- Analyte Binding and Detection: The functionalized biosensor is dipped into the sample solution containing the target analyte (ricin). The binding event causes a shift in the interference pattern of reflected light, which is measured in real-time.
- Regeneration: After each measurement, the sensor surface is regenerated using a mild acidic glycine buffer (e.g., pH 1.7) to dissociate the antigen-antibody complex, allowing for multiple reuses.
The Scientist's Toolkit: Key Research Reagents and Materials
The performance of a biosensor is heavily dependent on the materials used in its construction. The table below lists essential components and their functions.
Table 2: Essential Research Reagents for Biosensor Development
| Component | Function | Examples & Notes |
|---|---|---|
| Screen-Printed Electrodes (SPEs) | Low-cost, disposable, mass-producible transducer platform for electrochemical biosensors. | Carbon, gold, or platinum inks printed on ceramic or plastic substrates [9]. |
| Enzymes | Biocatalyst that provides selectivity and signal amplification for enzymatic biosensors. | Glucose oxidase, Cholesterol oxidase, Diamine oxidase. Source and purity affect specificity and stability [50] [99]. |
| Antibodies | High-affinity biorecognition element for affinity biosensors (immunosensors). | Monoclonal antibodies offer high specificity. Orientation on the sensor surface is critical for performance [96]. |
| Aptamers & DNA Ligands | Synthetic oligonucleotide affinity ligands; alternatives to antibodies. | A-DNAFL is a promising alternative to Protein A for antibody orientation [96]. |
| Nanomaterials | Enhance signal, increase surface area for bioreceptor immobilization, and improve electron transfer. | Gold nanoparticles (AuNPs), carbon nanotubes (CNTs), MXenes (e.g., Nb₂CTₓ), graphene [97] [5] [98]. |
| Permselective Membranes | Coating used on electrochemical biosensors to block interferents from reaching the electrode surface. | Nafion (charge-selective), cellulose acetate (size-selective). Improves selectivity in complex samples [99]. |
Discussion: Strategic Selection for Application Needs
The choice between an enzymatic and an affinity biosensor is dictated by the analytical problem.
- For Small Molecule Detection (Metabolites, Sugars): Enzymatic biosensors are often superior due to the inherent catalytic amplification provided by the enzyme, which can lead to high sensitivity and low LODs for specific substrates [99]. Their primary limitation can be selectivity, as some enzymes have group specificity, and they can be susceptible to inhibition or activation by other compounds in the sample [99].
- For Large Molecule Detection (Proteins, Viruses): Affinity biosensors are the established choice. The strong, specific binding of antibodies or aptamers allows for the detection of targets that are not enzymatically converted. Modern affinity sensors can achieve extremely low LODs (down to pM or fM) and, with careful design (e.g., oriented immobilization), wide linear ranges [95] [96] [9].
- The Rise of Non-Enzymatic Sensors: For some small molecules, like cholesterol, non-enzymatic electrochemical sensors are a growing trend. These use nanomaterial-modified electrodes to directly oxidize the analyte, offering enhanced stability and lower cost by avoiding the fragile enzyme component, though this can sometimes come at the cost of absolute selectivity [97].
In conclusion, enzymatic biosensors leverage catalytic turnover for signal amplification, while affinity biosensors rely on the high stability and specificity of molecular complexes. The optimal platform is a function of the target analyte, the required detection limits, the complexity of the sample matrix, and constraints regarding cost, stability, and ease of use.
Analyzing Specificity and Cross-Reactivity in Complex Samples
Biosensors are analytical devices that combine a biological recognition element with a physicochemical detector to quantify a specific analyte [1]. The core of a biosensor's functionality lies in its bioreceptor, which is responsible for the selective interaction with the target molecule. In diagnostic and research applications, two primary classes of biosensors have emerged as predominant: enzymatic biosensors and affinity biosensors [50] [100] [101]. These systems differ fundamentally in their recognition mechanisms and operational principles, leading to distinct performance characteristics, particularly regarding specificity and cross-reactivity in complex sample matrices.
Enzymatic biosensors utilize biologically derived catalysts, primarily enzymes, as their recognition elements. These devices typically operate through catalytic mechanisms, where the enzyme transforms its target substrate, generating a measurable product [1] [102]. The most renowned example is the glucose biosensor, which employs glucose oxidase to catalyze the oxidation of glucose, producing a detectable electrical signal [103]. In contrast, affinity biosensors rely on molecular binding events without consuming the analyte. This category includes immunosensors (using antibody-antigen interactions), DNA biosensors (based on nucleic acid hybridization), and aptasensors (employing engineered nucleic acid or peptide binders) [100] [1] [101]. The choice between these platforms involves significant trade-offs between specificity, stability, detection limits, and applicability to different analyte classes, making a comparative analysis essential for selecting the appropriate technology for specific applications in drug development and clinical diagnostics.
Fundamental Principles and Recognition Mechanisms
Enzymatic Biosensors: Catalytic Recognition
Enzymatic biosensors exploit the exceptional catalytic properties and substrate specificity of enzymes. The biorecognition event involves the enzyme converting its target substrate into a product, with the reaction rate being proportional to the analyte concentration [1]. This catalytic cycle enables signal amplification, as a single enzyme molecule can process numerous substrate molecules, potentially enhancing sensitivity [102].
The operational principle can follow direct detection of reaction products or indirect detection through enzyme inhibition or activation [1]. For example, oxidase enzymes (e.g., glucose oxidase) consume oxygen and generate hydrogen peroxide during substrate oxidation, both of which are electrochemically detectable [103]. Dehydrogenases, alternatively, often require co-factors like NAD+, whose redox state changes during the reaction [104]. A significant challenge for enzymatic biosensors is that the enzyme's active site may be buried within the protein structure, hindering direct electron transfer to the electrode. This limitation is often addressed using redox mediators—molecules such as ferrocene derivatives or organic dyes that shuttle electrons between the enzyme and the transducer [102]. The catalytic mechanism provides continuous signal generation but consumes the analyte, which may be problematic for limited sample volumes or continuous monitoring applications.
Affinity Biosensors: Binding-Based Recognition
Affinity biosensors function through specific molecular binding between the bioreceptor and the target analyte, forming a stable complex without chemically altering the target [100] [1]. This binding event produces a physicochemical change (e.g., mass, refractive index, or electrical charge) that the transducer converts into a quantifiable signal.
Immunosensors, the most prevalent affinity biosensors, utilize the precise lock-and-key interaction between an antibody and its antigen [100]. This interaction is characterized by very high binding constants (often exceeding 10⁸ L/mol), leading to nearly irreversible binding under appropriate conditions [1]. Nucleic acid-based sensors include genosensors, which rely on complementary base pairing (hybridization) to detect specific DNA or RNA sequences, and aptasensors, which use engineered single-stranded DNA or RNA molecules (aptamers) that fold into specific three-dimensional structures to bind diverse targets, including proteins, small molecules, and cells [1]. Biomimetic receptors represent a newer class, employing artificial binding proteins or molecularly imprinted polymers designed to mimic natural affinity interactions [1] [101]. Unlike enzymatic sensors, affinity-based detection is typically reversible only under specific conditions (e.g., chaotropic reagents, pH shift), allowing for single-use measurements unless special regenerative protocols are implemented [1].
Table 1: Core Principles of Enzymatic vs. Affinity Biosensors
| Feature | Enzymatic Biosensors | Affinity Biosensors |
|---|---|---|
| Recognition Element | Enzymes (e.g., oxidase, dehydrogenase) | Antibodies, aptamers, nucleic acids, artificial proteins |
| Recognition Mechanism | Catalytic conversion of substrate | Selective binding to form a stable complex |
| Analyte Consumption | Yes (in most configurations) | No (analyte remains unmodified) |
| Signal Basis | Reaction rate or product formation | Occupancy of binding sites |
| Key Advantage | Signal amplification through catalysis | Extremely high specificity and affinity |
| Common Transduction | Amperometry, potentiometry | Electrochemical, optical, piezoelectric |
Diagram 1: Fundamental working principles of enzymatic and affinity biosensors, highlighting their distinct interaction mechanisms with target analytes and potential interferents in complex samples.
Comparative Analysis of Performance in Complex Matrices
Specificity and Cross-Reactivity Profiles
The architectural differences between enzymatic and affinity biosensors directly translate to distinct specificity and cross-reactivity profiles, which are critical in complex samples like blood, urine, or environmental extracts.
Enzymatic biosensors exhibit class selectivity rather than absolute specificity for a single molecule [104]. The enzyme's active site is often designed by nature to recognize a functional group common to several related compounds. For instance, alcohol oxidase (AOX) catalyzes the oxidation of both methanol and ethanol, albeit with different affinities [104]. This group selectivity can be advantageous for screening classes of compounds (e.g., total organophosphate pesticides) but problematic when precise quantification of a single analyte is required. Furthermore, their performance is susceptible to enzyme inhibitors and activators present in the sample. Heavy metals or other pesticides can inhibit enzyme activity, leading to false-positive signals in inhibition-based assays [104] [102]. Electroactive interfering compounds (e.g., ascorbic acid, uric acid, acetaminophen) that oxidize or reduce at the working potential of the electrode can also generate false signals [104].
Affinity biosensors, particularly immunosensors, are renowned for their high specificity, capable of distinguishing between structurally similar molecules, even enantiomers [100]. This stems from the antibody's paratope interacting with a specific epitope on the antigen. However, this specificity is not absolute. Cross-reactivity can occur with molecules sharing similar epitopes, which is a known limitation in serological tests and hormone assays [100] [1]. For example, an antibody raised against a specific pesticide might also bind to its metabolites or structurally analogous compounds. Aptamers, while also highly specific, can have their binding affinity influenced by the sample matrix (e.g., ionic strength) [1]. The binding event itself is generally less affected by the sample matrix than enzymatic activity, but non-specific adsorption of other proteins or components to the sensor surface can be a significant source of error.
Sensitivity and Limit of Detection
Sensitivity defines the smallest change in analyte concentration that produces a measurable change in signal, while the limit of detection (LOD) is the lowest concentration that can be reliably distinguished from a blank.
Enzymatic biosensors can achieve high sensitivity through catalytic amplification. A single enzyme molecule turns over many substrate molecules, leading to the accumulation of a detectable product (e.g., H₂O₂) and thus signal amplification [1]. This can result in very low LODs, particularly when coupled with sensitive electrochemical techniques like amperometry. The use of nanomaterials can further enhance sensitivity by increasing the surface area for enzyme immobilization and facilitating electron transfer [103] [10].
Affinity biosensors do not benefit from catalytic amplification. Their sensitivity is intrinsically linked to the affinity constant (Kd) of the bioreceptor and the efficiency of the transducer [100]. To achieve high sensitivity, sandwich-type assays (e.g., sandwich ELISA) are often employed, which use a second labeled antibody for signal generation, providing one level of amplification [100]. The incorporation of enzymatic labels (e.g., in ELISA-style immunosensors) or nanomaterial labels (e.g., gold nanoparticles, quantum dots) can provide significant signal enhancement, pushing LODs to the pg/mL range for proteins [100] [10]. Label-free affinity sensors, while simpler, typically have higher LODs.
Stability, Lifetime, and Robustness
The operational and shelf lifetime of a biosensor is a key practical consideration.
Enzymatic biosensors are limited by the inherent stability of the enzyme. Enzymes can denature under non-physiological conditions of temperature, pH, or ionic strength, leading to a gradual loss of activity [1] [102]. This can result in signal drift and a shortened usable lifetime, especially under harsh operating conditions or in field deployments. The stability is highly dependent on the enzyme source, purity, and, critically, the immobilization method [102].
Affinity biosensors generally offer superior longevity because antibodies, aptamers, and nucleic acids are typically more stable than enzymes [1]. Antibodies are robust proteins, and DNA-based aptamers are especially resilient to variations in temperature and can be regenerated more easily after binding [1]. DNA sensors (genosensors) rely on the hybridization of oligonucleotides, which is a highly stable and predictable process. Consequently, affinity biosensors often have longer shelf lives and can withstand a wider range of storage conditions.
Table 2: Performance Comparison in Complex Sample Analysis
| Performance Metric | Enzymatic Biosensors | Affinity Biosensors |
|---|---|---|
| Specificity | Class selectivity (for a group of substrates) | High molecular specificity (for a single molecule/epitope) |
| Primary Cross-Reactivity Risk | Substrates with similar functional groups; Enzyme inhibitors/activators | Molecules with shared structural epitopes (e.g., metabolites) |
| Key Interferences | Electroactive species (Ascorbate, Urate, Acetaminophen); Enzyme inhibitors | Matrix effects; Non-specific adsorption to the surface |
| Typical LOD Range | nM to µM | fM to pM (for labeled assays) |
| Signal Amplification | Intrinsic (catalytic turnover) | Requires labels (enzymes, nanoparticles) for high sensitivity |
| Operational Lifetime | Shorter (limited by enzyme denaturation) | Longer (bioreceptors are more stable) |
| Regenerability | Not typically designed for regeneration | Possible for some systems (e.g., aptasensors), depending on binding strength |
Experimental Data and Case Studies
Experimental Protocols for Specificity Assessment
Evaluating specificity and cross-reactivity is a critical step in biosensor validation. Below are generalized protocols for testing both biosensor types.
Protocol for Evaluating Enzymatic Biosensor Specificity:
- Biosensor Preparation: Immobilize the purified enzyme (e.g., acetylcholinesterase for pesticide detection) onto the transducer surface via a chosen method (e.g., covalent bonding on a screen-printed carbon electrode modified with carbon nanotubes) [102].
- Calibration: Obtain a calibration curve by measuring the amperometric response (e.g., H₂O₂ oxidation current at +0.6 V vs. Ag/AgCl) in standard solutions of the target substrate (e.g., acetylcholine) across a concentration range (e.g., 1 µM to 100 µM) in a suitable buffer (e.g., 0.1 M phosphate buffer, pH 7.4) [104] [102].
- Specificity/Cross-Reactivity Test: Measure the biosensor response in separate solutions of potential interferents. These should include:
- Structural analogs: Compounds similar to the target (e.g., other choline esters for an acetylcholinesterase sensor).
- Electroactive species: Common biological interferents like ascorbic acid, uric acid, and acetaminophen at their physiologically relevant maximum concentrations [104].
- Enzyme inhibitors: Compounds known to affect the enzyme (e.g., other classes of pesticides).
- Data Analysis: Calculate the cross-reactivity (CR) percentage for each interferent as: CR (%) = (Signal from Interferent / Signal from Target Analyte at same molar concentration) × 100%. A value < 5% is typically considered acceptable [104].
Protocol for Evaluating Affinity Biosensor Specificity (Immunosensor):
- Immunosensor Preparation: Immobilize the capture antibody (e.g., monoclonal anti-E. coli O157:H7) on a gold electrode or a screen-printed interdigitated electrode, often using a self-assembled monolayer (e.g., of cysteamine) for oriented immobilization [100] [101].
- Calibration: Perform a label-free measurement (e.g., electrochemical impedance spectroscopy, EIS) in standard solutions of the target antigen. The increase in electron-transfer resistance (Rₑₜ) is correlated with antigen concentration [101].
- Specificity/Cross-Reactivity Test: Challenge the immunosensor with:
- Target antigen: The specific target (e.g., E. coli O157:H7 cells).
- Non-target strains: Other bacterial strains (e.g., E. coli K12, Salmonella typhimurium) at the same cell count.
- Structurally similar molecules: Relevant proteins or metabolites that might share epitopes.
- Data Analysis: The signal for the target should be significantly higher than for non-targets. Cross-reactivity is calculated similarly to the enzymatic method. A successful sensor will show minimal impedance change for non-target strains [101].
Table 3: Experimental Case Studies Demonstrating Specificity and Cross-Reactivity
| Biosensor Type / Target | Biorecognition Element | Sample Matrix | Reported Cross-Reactivity / Specificity Findings | Reference |
|---|---|---|---|---|
| Enzymatic: Pesticides | Acetylcholinesterase (AChE) | Water, Food extracts | Susceptible to inhibition by various organophosphates (e.g., paraoxon) AND carbamates (e.g., carbofuran). Cannot distinguish between inhibitors within a class without separation. | [104] [102] |
| Enzymatic: Alcohols | Alcohol Oxidase (AOX) | Alcoholic beverages | Oxidizes both methanol and ethanol. Can be designed to exploit different kinetic affinities (AOX has higher affinity for methanol) to discriminate, but requires complex data processing. | [104] |
| Affinity: E. coli O157:H7 | Anti-E. coli Antibody | Buffer, Food samples | A label-free impedance immunosensor showed a clear, measurable signal for the target pathogen (~10⁴ CFU/mL) while exhibiting negligible response to non-target species like Salmonella. | [101] |
| Affinity: Protein-Flavonoid | Human Serum Albumin (HSA) | Buffer | An SPR-based affinity sensor showed HSA has a high-affinity binding site for flavonoids. Affinities varied significantly (KD: Quercetin = 63 nM, Kaempferol = 37 nM), demonstrating the ability to quantify specific interactions. | [101] |
Research Reagent Solutions and Material Toolkits
The development and deployment of reliable biosensors for complex sample analysis require a standardized set of high-quality reagents and materials. The following toolkit details essential components.
Table 4: Essential Research Reagent Toolkit for Biosensor Development
| Reagent / Material | Function | Key Considerations | |
|---|---|---|---|
| Pure Enzyme Preparations | Bioreceptor for enzymatic biosensors. | High specific activity, substrate specificity. Source (microbial, mammalian) can affect performance. | [102] |
| Monoclonal/Polyclonal Antibodies | Bioreceptor for immunosensors. | Affinity, specificity (monoclonal preferred for single epitope), low cross-reactivity. | [100] [1] |
| Synthetic DNA/RNA Aptamers | Bioreceptor for aptasensors. | Stability, selectivity, can be chemically modified for immobilization. | [1] |
| Carbon Nanomaterials (CNTs, Graphene) | Electrode modification to enhance surface area and electron transfer. | Purity, functionalization (e.g., -COOH for covalent enzyme immobilization). | [103] [10] |
| Redox Mediators (e.g., Ferrocene, Methylene Blue) | To shuttle electrons between enzyme active site and electrode. | Redox potential (should be low to avoid interferents), solubility, stability. | [102] |
| Cross-Linkers (e.g., Glutaraldehyde, EDC/NHS) | To covalently immobilize bioreceptors on transducer surfaces. | Efficiency, potential to denature the biomolecule during immobilization. | [102] |
| Permselective Membranes (e.g., Nafion, Cellulose Acetate) | To block anionic (e.g., ascorbate, urate) or neutral interferents. | Charge, porosity, stability in the sample matrix. | [104] |
| Blocking Agents (e.g., BSA, Casein) | To minimize non-specific adsorption on unused sensor surface areas. | Inertness, effectiveness in the specific sample matrix (e.g., serum). | [104] [100] |
Diagram 2: A decision framework for selecting between enzymatic and affinity biosensors based on the nature of the target analyte and the sample matrix.
Assessment of Assay Time, Cost-Effectiveness, and Scalability
The selection of an appropriate biosensing platform is a critical decision in research and diagnostic development, with enzymatic and affinity biosensors representing two predominant classes. These systems are fundamentally differentiated by their biorecognition elements and their operational mechanisms. Enzymatic biosensors typically utilize biological catalysts, such as glucose oxidase or lactate oxidase, to detect substrates by catalyzing a reaction that produces a measurable electrochemical signal [105] [7]. In contrast, affinity biosensors rely on binding molecules like antibodies, aptamers, or DNA probes to specifically capture a target analyte, with the binding event itself being transduced into a signal [9] [106]. This guide provides a objective, data-driven comparison of these platforms, focusing on the critical performance parameters of assay time, cost-effectiveness, and scalability to inform their application in research and drug development.
Performance Comparison: Enzymatic vs. Affinity Biosensors
The table below summarizes a direct comparison of key performance metrics for enzymatic and affinity biosensors, synthesized from current research and commercial applications.
Table 1: Direct comparison of enzymatic and affinity biosensors
| Performance Parameter | Enzymatic Biosensors | Affinity Biosensors |
|---|---|---|
| Typical Assay Time | Seconds to minutes [7] | 1 to 8+ hours; often involves multiple incubation and washing steps [9] [107] |
| Key Cost Factors | Cost of purified enzyme; relative stability influences replacement frequency [108] | High cost of antibodies/aptamers; often requires secondary labels and multiple reagents [9] |
| Scalability & Manufacturing | Highly amenable to mass production via screen-printing; proven in disposable formats (e.g., glucose test strips) [9] | Fabrication is more complex; challenges with consistent antibody orientation and activity preservation [9] [109] |
| Signal Generation | Catalytic; single enzyme molecule generates many product molecules, offering inherent signal amplification [105] [12] | Binding-based; typically 1:1 ratio of target to signal label, often requiring extra steps for signal enhancement [9] |
| Reproducibility Challenges | Enzyme activity can be affected by pH, temperature, and inhibitors [12] | Susceptible to batch-to-batch variation in bioreceptors and surface immobilization [109] |
Analysis of Comparative Data
- Assay Time: The catalytic nature of enzymes allows for rapid, often continuous, signal generation, leading to significantly faster analysis times compared to affinity sensors, which must reach binding equilibrium [7]. For example, the LifeScale affinity-based AST system requires 4.5 hours, whereas enzymatic glucose biosensors provide results in seconds [107] [7].
- Cost-Effectiveness: Enzymatic biosensors generally have a lower cost structure. While enzymes can be expensive, their use in mass-produced, disposable sensors like glucose strips demonstrates cost-effectiveness at scale. Affinity biosensors incur higher costs due to antibodies and more complex assay procedures [9] [108].
- Scalability: Screen-printed electrodes (SPEs) have made both sensor types highly scalable [9]. However, the simpler immobilization of enzymes and their proven track record in global markets give enzymatic biosensors a scalability advantage. Manufacturing reproducible affinity sensors requires stringent quality control to manage the variability inherent in biological receptors like antibodies [109].
Experimental Protocols for Key Performance Assessments
To ensure the data is actionable, this section outlines standard experimental methodologies for evaluating the performance of both biosensor types.
Protocol for Assessing Assay Time and Sensitivity (Amperometric Detection)
This protocol is foundational for characterizing electrochemical biosensors of both types [105] [106].
Biosensor Fabrication:
- Enzymatic Sensor: Immobilize the enzyme (e.g., glucose oxidase) onto the working electrode of a screen-printed carbon electrode (SPE) via a chosen method (e.g., cross-linking with glutaraldehyde or entrapment in a polymer matrix) [105].
- Affinity Sensor: Immobilize the capture bioreceptor (e.g., an antibody or DNA probe) onto the SPE. This often involves functionalizing the surface (e.g., with streptavidin for biotinylated probes) and subsequent incubation with the receptor [106].
Amperometric Measurement:
- Place the fabricated biosensor in an electrochemical cell containing a buffer solution (e.g., phosphate buffered saline) with a redox mediator, such as hydroquinone (HQ).
- Apply a fixed potential optimal for the detection reaction (e.g., -0.20 V vs. Ag/AgCl for the H₂O₂/HQ system).
- After stabilizing the background current, inject a known concentration of the target analyte (glucose or methylated DNA, for instance).
- Record the change in current over time. The time taken for the current to stabilize post-injection is a key measure of the assay time.
Data Analysis:
- The steady-state current is plotted against analyte concentration to generate a calibration curve.
- The sensitivity is determined from the slope of the linear portion of this curve.
- The limit of detection (LOD) is typically calculated as three times the standard deviation of the blank (buffer) signal divided by the sensitivity.
Protocol for Evaluating Reproducibility and Scalability Potential
This methodology assesses the robustness of the fabrication process, which is crucial for scaling [109].
Batch Fabrication: Fabricate multiple biosensors (e.g., n ≥ 5) from the same production batch using a standardized protocol (e.g., same ink, printing parameters, and immobilization conditions).
Standardized Testing: Test all sensors from the batch against an identical, mid-range concentration of the target analyte using the amperometric protocol described above.
Statistical Analysis:
- Calculate the average and standard deviation of the output signal (e.g., current in µA).
- Determine the Relative Standard Deviation (RSD) as (Standard Deviation / Average) × 100%.
- A lower RSD value indicates higher reproducibility and a process that is more amenable to scaling. Advanced strategies may use embedded redox probes like Prussian blue nanoparticles to monitor consistency in real-time during fabrication [109].
Signaling Pathways and Experimental Workflows
The core difference in the operational logic of these two biosensor types is illustrated in the following diagrams.
Enzymatic Biosensor Signaling Pathway
Figure 1: Catalytic signaling pathway in enzymatic biosensors.
Affinity Biosensor Assay Workflow
Figure 2: Multi-step binding and detection workflow in affinity biosensors.
The Scientist's Toolkit: Key Research Reagent Solutions
The table below details essential materials and their functions for developing and working with these biosensing platforms.
Table 2: Essential research reagents and materials for biosensor development
| Item | Function in Biosensors | Example Use Cases |
|---|---|---|
| Screen-Printed Electrodes (SPEs) [9] | Low-cost, disposable, mass-producible platforms that integrate working, counter, and reference electrodes. | Foundational component for most modern electrochemical biosensors. |
| Enzymes (Oxidases/Dehydrogenases) [105] [12] | Act as the biorecognition element that catalyzes a specific reaction with the target analyte. | Glucose oxidase for glucose sensing; Lactate oxidase for lactate sensing. |
| Antibodies & Aptamers [9] [106] | Act as the biorecognition element that binds with high specificity to a target antigen/molecule. | Anti-5-methylcytosine antibody for detecting DNA methylation; Antibodies for protein biomarkers. |
| Cross-linkers (Glutaraldehyde, EDC/NHS) [105] | Chemically immobilize bioreceptors (enzymes, antibodies) onto the sensor surface to enhance stability. | Creating stable enzyme membranes on electrodes; Covalently attaching antibodies to functionalized surfaces. |
| Enzymatic Labels (HRP, ALP) [9] [106] | Conjugated to a detection agent to provide catalytic signal amplification in affinity assays. | HRP-conjugated secondary antibody in a sandwich immunoassay. |
| Redox Mediators (e.g., Hydroquinone) [106] [12] | Shuttle electrons between the biorecognition element and the transducer to improve efficiency. | Used with H₂O₂-producing oxidases to allow detection at a lower, less interfering potential. |
The choice between enzymatic and affinity biosensors involves a direct trade-off between speed/cost and specificity/versatility. Enzymatic biosensors are the unequivocal choice for applications requiring rapid, low-cost, and continuous monitoring of specific metabolites, as proven by the glucose monitoring market. Affinity biosensors are indispensable for detecting targets that are not enzyme substrates, such as specific proteins, DNA sequences, and whole pathogens, despite their longer assay times and higher costs.
Future developments are poised to bridge the gaps between these platforms. The emergence of nanozymes—nanomaterials with enzyme-mimicking properties—offers a path to creating biosensors with the robustness and low cost of synthetic materials while retaining catalytic signal amplification [108]. Furthermore, advanced manufacturing strategies incorporating real-time quality control, such as monitoring embedded Prussian blue nanoparticles during electro-fabrication, promise to significantly improve the reproducibility and scalability of both sensor types, particularly for complex affinity-based systems [109]. These advancements will expand the toolkit available to researchers and clinicians, enabling more precise and accessible diagnostic solutions.
The operational longevity of a biosensor—its ability to maintain sensitivity and accuracy over time and repeated use—is a pivotal factor determining its practical application and commercial viability. For researchers and drug development professionals selecting appropriate biosensing platforms, understanding the fundamental stability and reusability characteristics of different biosensor types is essential for experimental design and technology development. This comparative analysis examines the operational longevity of two principal biosensor categories: enzymatic biosensors (which utilize biocatalytic recognition elements) and affinity biosensors (which employ bioaffinity interactions), each demonstrating distinct performance profiles rooted in their underlying operational mechanisms [110].
Enzymatic biosensors, with glucose monitoring as their paradigmatic success story, typically exhibit robust operational stability owing to the continuous regeneration of their catalytic sites [110]. In contrast, affinity biosensors (including immunosensors and DNA-based sensors), while offering exceptional specificity, often face significant challenges in maintaining performance over multiple uses due to the irreversible or slowly reversible nature of their high-affinity binding events [9] [110]. This evaluation synthesizes current experimental data and technological frameworks to provide a structured comparison of these platforms, offering evidence-based guidance for application-specific selection in research and diagnostic development.
Fundamental Mechanisms Governing Longevity
The divergent longevity profiles of enzymatic versus affinity biosensors originate from their core biochemical principles. Biocatalytic biosensors employ enzymes, typically oxidoreductases or hydrolases, which continuously recognize and convert substrates while regenerating their active sites for subsequent reactions. This catalytic cycle enables continuous or repeated monitoring without the need for sensor regeneration between measurements, forming the basis for their superior reusability potential [110].
Bioaffinity biosensors, including immunosensors (relying on antibody-antigen interactions) and genosensors (based on nucleic acid hybridization), function through binding events that form stable complexes. These interactions are characterized by high affinity and specificity, but the strong binding forces (e.g., multiple non-covalent interactions) that enable excellent sensitivity also complicate the dissociation of the analyte from the bioreceptor. Consequently, most affinity biosensors require harsh regeneration conditions—such as low pH buffers, high ionic strength solutions, or chaotropic agents—to disrupt the binding complex for reuse. These regeneration procedures progressively degrade the immobilized biological recognition elements, ultimately limiting sensor lifetime [9] [110].
Table 1: Fundamental Characteristics Influencing Operational Longevity
| Characteristic | Enzymatic Biosensors | Affinity Biosensors |
|---|---|---|
| Recognition Mechanism | Catalytic turnover | Binding complex formation |
| Analyte Interaction | Transient (enzyme regenerated) | Typically stable/irreversible |
| Signal Generation | Continuous (consumable dependent) | Discrete (end-point or washed) |
| Inherent Reusability | High | Low |
| Regeneration Requirement | None (self-regenerating) | Required (often harsh conditions) |
| Primary Stability Limitation | Enzyme denaturation | Bioreceptor degradation during regeneration |
Experimental Data and Performance Comparison
Quantitative Stability Metrics from Literature
Experimental data from biosensor research reveals consistent patterns in the operational longevity of enzymatic versus affinity-based platforms. Enzymatic biosensors, particularly those utilizing robust oxidoreductases, frequently demonstrate stability spanning hundreds of measurements over periods of weeks to months when properly stored. For instance, continuous glucose monitors (CGMs), which represent the most technologically mature enzymatic biosensors, maintain functionality for up to 14 days of continuous in vivo operation—a testament to the remarkable stability achievable with enzymatic systems [110].
Affinity biosensors exhibit more variable longevity, heavily dependent on the immobilization strategy and regeneration protocol. Surface Plasmon Resonance (SPR) immunosensors, when carefully optimized, can withstand 50-200 regeneration cycles with minimal loss of activity, as demonstrated in a study monitoring human transferrin, which showed maximum stability and consistent performance over multiple regenerative cycles [111]. However, many commercial immunosensors are designed as single-use devices, circumventing reusability challenges entirely but increasing per-test costs [9]. DNA-based biosensors often show superior reusability compared to immunosensors due to the greater stability of nucleic acids under regeneration conditions; some reports indicate stability through 20-50 hybridization-denaturation cycles when appropriate denaturing conditions are applied [111].
Table 2: Experimental Operational Longevity Comparison
| Biosensor Type | Typical Measurement Stability | Reusability (Cycles) | Key Influencing Factors |
|---|---|---|---|
| Enzymatic Glucose Sensors | 7-14 days continuous use [110] | Essentially continuous (until enzyme depletion) | Enzyme immobilization method, membrane permeability, storage conditions |
| General Enzymatic Sensors | 30-90 days with proper storage [112] | 100+ measurements | Enzyme stability, co-factor retention, matrix effects |
| Immunosensors (SPR) | Varies with storage | 50-200 regeneration cycles [111] | Antibody immobilization strategy, regeneration buffer stringency |
| DNA Biosensors | Months with proper storage [111] | 20-50 hybridization cycles [111] | Probe length, immobilization density, denaturation method |
| Affinity Sensors (Disposable) | Single measurement | 1 (single-use design) [9] | Lot-to-lot consistency, shelf life |
Methodologies for Longevity Assessment
Standardized experimental protocols are essential for meaningful comparison of biosensor operational longevity across studies. For enzymatic biosensors, stability is typically quantified by measuring the degradation of analytical performance parameters over time and use. The standard protocol involves: (1) Initial calibration to establish baseline sensitivity and linear range; (2) Repeated measurements of standard concentrations at defined intervals (hourly, daily, or weekly depending on intended use); (3) Storage under specified conditions between measurements; (4) Calculation of signal decay rate and useful lifetime defined as the time until signal response degrades to 80-90% of initial value [110] [112].
For affinity biosensors, reusability assessment follows a different protocol reflecting the need for regeneration between measurements: (1) Initial characterization of binding capacity with target analyte; (2) Application of regeneration buffer (e.g., 10mM glycine-HCl, pH 2.0-3.0 for antibodies) to dissociate bound analyte; (3) Re-equilibration with running buffer; (4) Measurement of retained binding capacity after each cycle; (5) Determination of maximum regeneration cycles before significant signal degradation (>10-20% loss) [9] [111]. The regeneration efficiency is calculated as the percentage of original response maintained after each cycle, with most studies considering the sensor failed when response falls below 80% of initial value.
Technological Advances Enhancing Longevity
Engineering Improved Biorecognition Elements
Protein engineering approaches have yielded significant improvements in biosensor longevity. For enzymatic biosensors, stabilization has been achieved through site-directed mutagenesis to enhance thermal tolerance and resistance to organic solvents, genetic fusion to electron-transfer proteins to facilitate direct electron transfer (third-generation sensors), and enzyme immobilization in protective polymeric matrices [110]. These advances are particularly evident in modern continuous glucose monitoring systems where glucose oxidoreductases maintain functionality in the challenging environment of subcutaneous tissue for up to two weeks [110].
For affinity biosensors, engineering efforts have focused on developing regenerable binding elements. Recombinant antibody fragments (e.g., scFv, Fab) often demonstrate superior stability compared to full-length immunoglobulins under regeneration conditions [111]. Alternative affinity reagents such as aptamers (nucleic acid-based binders) offer advantages in longevity due to their ability to withstand repeated denaturation-renaturation cycles—a characteristic rooted in the inherent stability of nucleic acids [9]. Nucleic acid probes in DNA-based biosensors similarly benefit from this capacity to undergo multiple hybridization and denaturation events without significant degradation [111].
Immobilization and Materials Innovation
The method of immobilizing biological recognition elements profoundly impacts biosensor longevity. Advanced immobilization strategies that precisely control orientation and density can significantly enhance stability for both enzymatic and affinity biosensors [9] [111]. For enzymatic biosensors, confinement in cross-linked polymer matrices or hydrogels protects the enzyme from denaturation while maintaining substrate accessibility [110]. For affinity biosensors, site-specific immobilization through engineered tags (e.g., His-tag, biotin) ensures optimal binding site orientation, maximizing binding capacity and stability over multiple regeneration cycles [111].
Nanomaterial integration has dramatically improved biosensor longevity across both categories. Graphene, carbon nanotubes, and metallic nanoparticles create protective microenvironments for biological elements while facilitating efficient electron transfer in electrochemical biosensors [10]. These nanomaterials often enable more gentle regeneration conditions for affinity biosensors by enhancing binding efficiency, thereby reducing the required stringency of regeneration buffers and extending functional lifespan [9] [10].
The Researcher's Toolkit: Essential Reagents and Materials
The experimental evaluation of biosensor longevity requires specific reagents and materials tailored to each biosensor type. The following table details essential research solutions for conducting stability and reusability assessments.
Table 3: Essential Research Reagents for Longevity Studies
| Reagent/Material | Function in Longevity Assessment | Application Specificity |
|---|---|---|
| Stabilized Enzyme Preparations | Maintain catalytic activity over repeated measurements | Enzymatic biosensors |
| Recombinant Antibody Fragments | Withstand regeneration conditions in reuse cycles | Affinity biosensors (Immunosensors) |
| Nucleic Acid Probes (DNA/RNA) | Enable repeated hybridization-denaturation cycles | DNA-based biosensors |
| Cross-linking Reagents (Glutaraldehyde, EDC-NHS) | Create stable bioreceptor immobilization | Both biosensor types |
| Regeneration Buffers (Glycine-HCl, NaOH, SDS) | Dissociate analyte-bioreceptor complexes | Primarily affinity biosensors |
| Protective Polymers (POEGMA, polyacrylamide) | Form antifouling surfaces and protective matrices | Both biosensor types [111] |
| Nanomaterial Inks (Graphene, CNT, metal nanoparticles) | Enhance electron transfer and create protective environments | Primarily electrochemical biosensors [9] |
| Screen-Printed Electrodes (Gold, carbon, graphene) | Provide reproducible, customizable sensor platforms | Primarily electrochemical biosensors [9] |
This critical evaluation demonstrates that operational longevity presents both distinct challenges and opportunities for enzymatic versus affinity biosensors. Enzymatic biosensors generally offer superior reusability and continuous operation capabilities, making them ideal for monitoring applications requiring repeated or continuous measurement. Affinity biosensors provide exceptional specificity but face fundamental limitations in reusability due to their binding mechanism, making them better suited for single-use applications or situations where rigorous regeneration protocols are feasible.
Future research directions likely to impact biosensor longevity include the development of novel engineered biorecognition elements designed specifically for enhanced stability and regenerability, particularly for affinity reagents [110]. Advanced materials science, including stimuli-responsive polymers and nanostructured interfaces, may enable more gentle and efficient regeneration schemes for affinity biosensors. Integration of artificial intelligence for predictive maintenance and calibration drift correction represents another promising avenue for extending functional biosensor lifespan [92]. As these technologies mature, the convergence of biological engineering, materials science, and data analytics will progressively blur the longevity boundaries between these biosensor classes, ultimately delivering robust, long-lasting sensing platforms for research and clinical applications.
Suitability for Miniaturization and Integration into Portable Devices
The advancement of point-of-care (PoC) diagnostics and personalized health monitoring is intimately linked to the development of compact, portable, and integrated biosensing devices. For researchers and drug development professionals, selecting the appropriate biosensing technology is a critical strategic decision that impacts everything from diagnostic device design to clinical applicability. This guide provides a detailed comparison between two foundational biosensor classes—enzymatic and affinity-based biosensors—focusing on their inherent suitability for miniaturization and integration into portable platforms. We evaluate their performance through the lens of device engineering, analyzing key parameters such as sensing mechanism, structural complexity, and operational stability, supported by experimental data and methodologies from current literature. The objective is to equip scientists with the necessary technical insights to align their research and development goals with the most fitting biosensor technology.
Fundamental Comparison of Biosensor Classes
The core distinction between enzymatic and affinity biosensors lies in their recognition mechanism and signal generation process, which directly influences their integration potential.
Enzymatic biosensors typically rely on a catalytic bioreceptor, such as an enzyme, to convert a target metabolite (e.g., glucose, lactate) into an electrochemically detectable product [113] [114]. This process often produces an amplified, continuous signal, making it suitable for real-time monitoring.
Affinity biosensors, on the other hand, depend on a binding event between a bioreceptor (e.g., antibody, DNA strand, aptamer) and a target analyte (e.g., protein, nucleic acid, virus) [95] [8]. The transduction measures the binding event itself, which is typically a non-catalytic, equilibrium-driven process.
The tables below summarize the fundamental operational principles and a direct comparison of miniaturization suitability.
Table 1: Core Operational Principles of Biosensor Classes
| Feature | Enzymatic Biosensors | Affinity Biosensors |
|---|---|---|
| Bioreceptor | Enzymes (e.g., Glucose Oxidase) | Antibodies, Aptamers, Nucleic Acids, MIPs |
| Recognition Mechanism | Catalytic conversion of substrate | Affinity binding (e.g., antigen-antibody, DNA hybridization) |
| Signal Generation | Proportional to reaction rate (e.g., consumption/production of electroactive species) | Proportional to amount of bound analyte |
| Key Example | Continuous Glucose Monitor (CGM) | COVID-19 Antigen Test, DNA Methylation Sensors |
Table 2: Suitability for Miniaturization and Integration
| Parameter | Enzymatic Biosensors | Affinity Biosensors | Supporting Experimental Evidence |
|---|---|---|---|
| Inherent Simplicity | High. Often a single-step, reagentless measurement. | Lower. Often requires multiple steps (e.g., washing, labeling) for optimal sensitivity [114]. | Affinity detection of large biomarkers "requires multiple steps to produce a detectable signal" [114]. |
| Device Footprint | Excellent for miniaturization, particularly potentiometric sensors [113]. | Good, but fluidic handling for multi-step assays can increase complexity and size [114]. | Potentiometric biosensors offer "greater promise for miniaturization" [113] [115]. |
| Stability & Lifetime | Medium. Dependent on enzyme longevity under operational conditions. | High. Bioreceptors like antibodies and aptamers are generally more stable [95]. | Enzymatic biosensors face challenges with "robust stability" for implants [113]. Aptamers offer "high chemical and physical stability" [95]. |
| Sensitivity | Good for small molecules/metabolites. | Excellent, capable of detecting targets at femtomolar (fM) to attomolar (aM) levels with amplification [114]. | Voltammetric affinity sensors can achieve low limits of detection (LOD), e.g., "~100 fM for DNA" [114]. |
| Multiplexing Potential | Challenging due to cross-reactivity of substrates. | High. Different affinity probes can be immobilized in arrays on a single chip [95]. | Microfluidic systems enable "multiplexed detection" for affinity-based assays [95]. |
Experimental Data and Performance Metrics
Supporting experimental data from the literature highlights the performance characteristics of both biosensor types in integrated systems. The following table compiles key metrics from recent studies.
Table 3: Experimental Performance Data from Integrated Biosensor Systems
| Biosensor Type / Target | Transduction Method | Key Performance Metrics | Device Integration & Experimental Notes |
|---|---|---|---|
| Enzymatic: Glucose [114] | Amperometric | Sensitivity: ~180 μA cm⁻² mmol⁻¹; Stability: ~1 month | Integrated into portable and wearable devices for continuous monitoring. |
| Enzymatic: Metabolites [113] [115] | Potentiometric | Stability: >1 month; Sensitivity: ~60 mV per decade | Emerging for implantable devices; uses non-equilibrium approach for continuous monitoring. |
| Affinity: DNA [8] | Amperometric | LOD: Achieved for gene-specific methylation; Assay Time: ~1 hour | Implemented on magnetic microparticles with screen-printed carbon electrodes (SPCEs). No bisulfite or PCR needed. |
| Affinity: Proteins, DNA [114] | Organic Electrochemical Transistor (OECT) | LOD: 10 pM for DNA; 1 pg mL⁻¹ for proteins | Suitable for portable/wearable integration; enables sensitive, label-free detection. |
| Affinity: MicroRNA [114] | Electrochemiluminescence (ECL) | LOD: ~3 pM | Used for microimaging of single cells; requires ECL collection module. |
Detailed Experimental Protocol: Affinity Biosensor for DNA Methylation
The following protocol, adapted from a study on electrochemical affinity biosensors for detecting gene-specific DNA methylation without bisulfite treatment, exemplifies a typical workflow for a sophisticated, miniaturizable affinity assay [8]. The process is visualized in Figure 1.
1. Sensor Preparation (Probe Immobilization):
- Method A (Immunosensor): Carboxylic acid-modified magnetic beads (HOOC-MBs) are activated and coupled with anti-5-methylcytosine (anti-5-mC) antibody, which serves as a global capture probe for methylated DNA.
- Method B (DNA Sensor): Streptavidin-modified magnetic beads (Strep-MBs) are mixed with a biotinylated DNA capture probe that is specific to the target methylated gene sequence (e.g., from the RASSF1A or MGMT gene promoters).
2. Sample Incubation and Hybridization (Assay Execution):
- The sample containing single-stranded target DNA is introduced to the prepared magnetic beads.
- For Method A: Methylated DNA is captured by the anti-5-mC antibody on the beads.
- For Method B: The target DNA hybridizes with the complementary, gene-specific capture probe on the beads.
3. Signal Generation (Labeling):
- For Method A: A secondary antibody conjugated with horseradish peroxidase (HRP-anti-ssDNA) is added, which binds to the captured ssDNA.
- For Method B: The anti-5-mC primary antibody is added, which binds to the methylated cytosine in the captured DNA. This is followed by an HRP-conjugated secondary antibody (HRP-anti-mouse IgG).
4. Transduction and Readout (Detection):
- The modified magnetic beads are magnetically captured onto the surface of a screen-printed carbon electrode (SPCE).
- An amperometric measurement is performed using the hydrogen peroxide/hydroquinone (H₂O₂/HQ) system. Upon the addition of H₂O₂, the HRP enzyme catalyzes its reduction, with HQ acting as a mediator. The resulting cathodic current is measured, which is proportional to the concentration of methylated DNA in the sample [8].
Figure 1: Experimental workflow for an affinity-based DNA sensor detecting gene-specific methylation.
Signaling Pathways and Operational Workflows
The fundamental operational principles of enzymatic and affinity biosensors are distinct, dictating their integration complexity. Figure 2 below contrasts these two core signaling pathways.
Figure 2: Core signaling pathways for enzymatic (catalytic) and affinity (binding) biosensors.
The Scientist's Toolkit: Key Research Reagent Solutions
The development and implementation of miniaturized biosensors rely on a suite of essential materials and reagents. The following table details key components for constructing experimental systems, as cited in the reviewed literature.
Table 4: Essential Research Reagents and Materials for Biosensor Development
| Item | Function in Biosensor Development | Example Use-Case |
|---|---|---|
| Screen-Printed Electrodes (SPEs) [9] | Low-cost, disposable, mass-producible transducer platform. Enable miniaturization and integration of all electrodes (WE, RE, CE) on a single chip. | Used as the foundational substrate for amperometric detection in portable biosensors [8]. |
| Magnetic Microparticles/Beads [8] | Solid support for immobilizing bioreceptors (antibodies, DNA). Facilitate efficient separation and concentration of the target via magnetic fields, simplifying fluidic handling. | Used to capture methylated DNA and separate it from solution before amperometric readout [8]. |
| Anti-5-Methylcytosine (anti-5-mC) Antibody [8] | High-affinity bioreceptor for specifically recognizing and capturing methylated cytosine in DNA, enabling epigenetic analysis. | Serves as the primary capture (immunosensor) or detection (DNA sensor) element in DNA methylation biosensors [8]. |
| Horseradish Peroxidase (HRP) & H₂O₂/HQ System [8] | Enzymatic label and substrate/mediator system for signal amplification and electrochemical readout in affinity assays. | HRP conjugated to a detector antibody catalyzes the reduction of H₂O₂, with hydroquinone (HQ) shuttling electrons to generate a measurable amperometric current [8]. |
| Quantum Dots (QDs) [95] | Semiconductor nanocrystals used as fluorescent labels or electrochemical tags. Offer high brightness, photostability, and size-tunable properties for multiplexed and highly sensitive detection. | Integrated into microfluidic systems for optical or electrochemical affinity-based detection of viruses like SARS-CoV-2 [95]. |
The choice between enzymatic and affinity biosensors for portable, integrated devices is not a matter of superiority but of strategic alignment with the application's requirements. Enzymatic biosensors, with their simpler, often reagentless operation and continuous output, are the established leaders for monitoring small molecule metabolites (like glucose) in wearable and implantable devices [113] [114]. Their pathway to miniaturization, particularly for potentiometric sensors, is highly promising.
Conversely, affinity biosensors are indispensable for detecting larger, macromolecular targets such as specific proteins, nucleic acids, and whole pathogens. While their assay protocols can be more complex, advancements in microfluidics, surface immobilization strategies [9], and sensitive transducers like OECTs [114] are rapidly enhancing their integrability. Their key strengths are exceptional sensitivity and the potential for highly multiplexed analyses on a single, miniaturized platform [95].
For researchers and drug developers, the decision framework is clear: prioritize enzymatic systems for continuous, simple metabolite sensing, and leverage affinity-based systems for highly specific, sensitive, and multiplexed detection of complex biomarkers. The future of integrated PoC diagnostics will likely see a convergence of these technologies, combined with advanced materials and machine learning [116], to create next-generation intelligent sensing systems.
Biosensors are analytical devices that integrate a biological recognition element with a transducer to produce a measurable signal proportional to the concentration of a target analyte. For researchers, scientists, and drug development professionals, selecting the appropriate biosensing platform is crucial for achieving accurate, reliable, and meaningful results. The choice between enzymatic biosensors and affinity biosensors represents a fundamental decision point in experimental design, impacting everything from detection limits and specificity to operational stability and application suitability [2] [74].
Enzymatic biosensors utilize biocatalysts, typically proteins that speed up biochemical reactions, as their recognition element. These enzymes convert a specific substrate into a product, with the transducer detecting changes related to this catalytic reaction [117] [118]. The first enzymatic biosensor was developed for glucose detection, and such sensors now hold the largest market share of commercial biosensors [119] [104]. In contrast, affinity biosensors rely on selective binding interactions between the biorecognition element and the target analyte, without catalyzing a chemical transformation. This category includes immunosensors (using antibody-antigen interactions), DNA biosensors (using nucleic acid hybridization), aptasensors (using aptamers), and others that exploit specific bioaffinity complexes [2] [74].
This guide provides a structured decision matrix to navigate the selection process between these two platforms, supported by performance comparisons, experimental protocols, and visualization of operational principles.
Core Principles and Signaling Pathways
Understanding the distinct working mechanisms of enzymatic and affinity biosensors is essential for making an informed choice. The following diagrams illustrate the fundamental signaling pathways for each platform.
Enzymatic Biosensor Mechanism
Affinity Biosensor Mechanism
Performance Comparison: Quantitative Data Analysis
The selection between enzymatic and affinity platforms depends heavily on performance requirements for your specific application. The tables below summarize key characteristics and operational parameters for both systems.
Table 1: Characteristic Comparison of Enzymatic vs. Affinity Biosensors
| Parameter | Enzymatic Biosensors | Affinity Biosensors |
|---|---|---|
| Biorecognition Element | Enzymes (e.g., Glucose oxidase, Lactate dehydrogenase) [117] [119] | Antibodies, DNA strands, Aptamers, Whole cells [2] [74] |
| Detection Mechanism | Catalytic conversion of substrate [117] [118] | Binding and complex formation [2] |
| Key Measurable | Reaction rate, Metabolite concentration, Enzyme activity [117] [104] | Presence and concentration of specific molecules (antigens, DNA, etc.) [74] |
| Response Time | Seconds to minutes (depends on enzyme kinetics) [119] | Minutes to hours (depends on binding kinetics) [74] |
| Regeneration/Reusability | Often reusable for multiple assays [119] | Limited reusability due to strong binding; often single-use [74] |
| Typical Applications | Metabolite monitoring (glucose, lactate), Environmental pollutants, Food quality [119] [104] | Disease diagnostics (pathogens, biomarkers), Toxin detection, Genetic analysis [2] [74] |
Table 2: Operational and Market Comparison
| Aspect | Enzymatic Biosensors | Affinity Biosensors |
|---|---|---|
| Commercial Success | High (e.g., glucose sensors dominate the market) [104] | Growing, especially in medical diagnostics [120] [74] |
| Selectivity Challenge | Class selectivity (may detect similar substrates); affected by inhibitors/activators [104] | High specificity for a single or very few analytes [2] [74] |
| Common Transduction Methods | Electrochemical (Amperometry, Potentiometry), Optical [119] [121] | Optical (SPR, Fluorescence), Electrochemical, Piezoelectric [121] [74] |
| Solution to Interferences | Permselective membranes, sentinel sensors, coupled enzyme systems [104] | High inherent specificity; sample pre-treatment may still be needed in complex matrices [74] |
| Stability | Moderate (enzyme can denature) [117] | Generally high (antibodies/DNA are more stable) [74] |
Decision Matrix: Selecting the Right Platform
Use the following structured matrix to guide your platform selection based on the primary objective of your research or application.
Table 3: Biosensor Selection Decision Matrix
| Primary Need | Recommended Platform | Rationale | Application Examples |
|---|---|---|---|
| Detecting a Specific Small Molecule | Enzymatic | Enzymes often have high turnover, enabling amplification via continuous catalysis [117] [104] | Blood glucose monitoring, Lactate sensing in athletes, Alcohol breathalyzers [119] [104] |
| Detecting a Unique Molecular Structure | Affinity | High specificity of antibodies/aptamers for unique epitopes or sequences [2] [74] | Pathogen detection (e.g., SARS-CoV-2), Cardiac biomarker detection (e.g., Troponin) [74] |
| Requiring Continuous, Real-time Monitoring | Enzymatic | Reusable nature and catalytic signal generation suit real-time tracking [119] [104] | Implantable glucose sensors, Fermentation process monitoring [119] |
| One-time/Quantitative Measurement | Affinity | Excellent for single, highly accurate measurements via binding saturation [74] | Home pregnancy tests, Food allergen testing, Forensic analysis [2] |
| Detecting Non-Catalytic Targets | Affinity | Essential for targets that are not enzyme substrates (e.g., proteins, DNA) [2] | Cytokine profiling, Genetic mutation analysis, Virus detection [74] |
| High-Throughput Screening | Either (Context-Dependent) | Both can be adapted; enzymatic for activity, affinity for presence/absence [74] | Drug candidate screening, Library screening for enzyme inhibitors or specific binders [104] [74] |
Experimental Protocols for Key Applications
Protocol for an Enzymatic Biosensor: Glucose Detection
This protocol outlines the development of a first-generation amperometric glucose biosensor based on glucose oxidase (GOx) [119] [104].
Principle: Glucose + O₂ + H₂O →(GOx) Gluconic acid + H₂O₂. The generated H₂O₂ is then detected amperometrically [119].
Materials & Reagents:
- Glucose Oxidase (GOx): The biological recognition element [119].
- Platinum or Carbon Electrode: Serves as the transducer [119].
- Nafion or Cellulose Acetate Membrane: Used to create a permselective layer that rejects interfering anionic species like ascorbate and urate [104].
- Glucose Standard Solutions: For calibration.
- Potentiostat: Instrument to apply potential and measure current.
Procedure:
- Electrode Preparation: Polish the working electrode to a mirror finish and clean it thoroughly.
- Enzyme Immobilization: Deposit a mixture of GOx and a stabilizing protein (like BSA) onto the electrode surface, followed by cross-linking with glutaraldehyde.
- Membrane Application: Coat the enzyme layer with a thin film of Nafion or cellulose acetate to enhance selectivity. Allow to cure.
- Calibration: Immerse the biosensor in a stirred buffer solution. Record the amperometric current (typically at +0.6V to +0.7V vs. Ag/AgCl) upon successive additions of glucose standard solutions.
- Sample Measurement: Introduce the unknown sample and measure the steady-state current. Determine the glucose concentration from the calibration curve.
Troubleshooting Tip: If the signal is unstable or low, check the enzyme activity and the integrity of the permselective membrane. The "sentinel sensor" approach using a BSA-loaded electrode without GOx can be used to subtract background currents from electroactive interferences [104].
Protocol for an Affinity Biosensor: Immunosensor for a Protein Biomarker
This protocol describes a general sandwich-style electrochemical immunosensor for detecting a specific protein biomarker [10] [74].
Principle: A capture antibody immobilized on the sensor surface binds the target antigen. A second, enzyme-labeled detection antibody then binds to form a "sandwich," and the enzyme label generates an electroactive product for detection.
Materials & Reagents:
- Capture Antibody: Specific to the target protein.
- Detection Antibody: Specific to a different epitope of the target protein, conjugated with Horseradish Peroxidase (HRP).
- Gold or Carbon-based Electrode: Often used for protein immobilization.
- Blocking Buffer: (e.g., BSA or casein) to block non-specific binding sites.
- Electrochemical Mediator: e.g., Ferrocene or H₂O₂/HRP substrate to facilitate electron transfer [104].
- Washing Buffers: To remove unbound reagents.
Procedure:
- Surface Functionalization: Modify the electrode surface (e.g., with a self-assembled monolayer on gold) to enable antibody immobilization.
- Antibody Immobilization: Incubate the electrode with the capture antibody solution, allowing physical adsorption or covalent attachment.
- Blocking: Treat the electrode with a blocking buffer to passivate any remaining active surfaces and prevent non-specific binding.
- Antigen Incubation: Expose the sensor to the sample containing the target antigen. Wash thoroughly.
- Detection Incubation: Incubate with the enzyme-conjugated detection antibody. Wash again to remove excess, unbound antibody.
- Signal Measurement: Transfer the sensor to an electrolyte solution containing the mediator/substrate. Measure the amperometric current generated by the reduction/oxidation of the product from the enzymatic reaction (e.g., HRP reducing H₂O₂).
Troubleshooting Tip: High background signals can indicate insufficient washing or non-specific binding. Optimize blocking conditions and washing stringency. The use of nanomaterials like graphene or carbon nanotubes can amplify the signal by increasing the surface area and improving electron transfer [119] [10].
The Scientist's Toolkit: Essential Research Reagents and Materials
Table 4: Key Reagent Solutions for Biosensor Development
| Reagent/Material | Function | Typical Examples |
|---|---|---|
| Enzymes | Biological recognition element in enzymatic biosensors; catalyzes the reaction with the target substrate [117] | Glucose oxidase, Lactate dehydrogenase, Uricase [119] [104] |
| Antibodies & Aptamers | Biological recognition element in affinity biosensors; binds specifically to the target analyte [2] [74] | IgG antibodies, Single-chain variable fragments (scFv), DNA/RNA aptamers [74] |
| Nafion & Cellulose Acetate | Permselective membranes; used to coat the sensor surface to block electrochemical interferents [104] | - |
| Cross-linking Reagents | To immobilize biorecognition elements onto the transducer surface [69] | Glutaraldehyde, EDAC/NHS chemistry [69] |
| Electrochemical Mediators | Shuttle electrons between the enzyme's active site and the electrode; lowers operating potential and reduces interference [104] | Ferrocene derivatives, Ferricyanide, Organic dyes [119] [104] |
| Nanomaterials | Enhance signal, increase surface area for immobilization, and improve electron transfer [119] [10] | Graphene, Carbon nanotubes (CNTs), Metal nanoparticles [119] [10] |
The choice between enzymatic and affinity biosensors is not a matter of one platform being universally superior, but rather of matching the platform's strengths to the application's requirements. Enzymatic biosensors, with their catalytic amplification and suitability for continuous monitoring, are powerful tools for tracking metabolites and small molecules. Affinity biosensors, with their exceptional specificity for unique molecular structures, are indispensable for diagnostic and identification applications.
This decision matrix provides a structured framework for researchers and drug development professionals to navigate this critical choice. By systematically considering the research objective against the performance characteristics and operational requirements outlined herein, scientists can select the optimal biosensing platform to ensure the success and reliability of their experiments and products. Future advancements in nanotechnology [119] [69], synthetic biology, and artificial intelligence are poised to further enhance the capabilities of both platforms, blurring the lines between them and opening new frontiers in analytical science.
Conclusion
Enzymatic and affinity biosensors are complementary technologies, each with distinct strengths that dictate their ideal application domains. Enzymatic biosensors excel in the rapid, cost-effective detection of small molecules and metabolites, underpinning established markets like glucose monitoring. In contrast, affinity biosensors offer superior specificity for larger molecules like proteins and nucleic acids, enabling advanced diagnostics such as gene-specific methylation analysis without amplification. The future of biosensing lies in the convergence of these platforms with innovations in nanomaterials, microfabrication, and artificial intelligence. Emerging trends point toward the development of multi-analyte wearable sensors, continuous monitoring systems, and sophisticated point-of-care devices, all poised to revolutionize personalized medicine, drug discovery, and global health management. The choice between enzymatic and affinity systems is not a matter of superiority, but of strategic alignment with the specific analytical challenge at hand.
References
- 1. Biosensor - Wikipedia [https://en.wikipedia.org/wiki/Biosensor]
- 2. : Applications, Types & Components | StudySmarter Biosensors [https://www.studysmarter.co.uk/explanations/biology/biology-experiments/biosensors/]
- 3. Recent Advances in Biosensors for Nucleic Acid and Exosome Detection - PMC [https://pmc.ncbi.nlm.nih.gov/articles/PMC6536430/]
- 4. , Artificial Intelligence Biosensors , False Results and... Biosensors [https://pmc.ncbi.nlm.nih.gov/articles/PMC12025796/]
- 5. A Review on Biosensors and Recent Development of Nanostructured Materials-Enabled Biosensors - PMC [https://pmc.ncbi.nlm.nih.gov/articles/PMC7915135/]
- 6. for Biomedical Applications: Strategies for... Enzyme Biosensors [https://pubmed.ncbi.nlm.nih.gov/27249001/]
- 7. – Biosensors in Biotechnology Enzymatic Biosensors [https://www.azom.com/article.aspx?ArticleID=15019]
- 8. Electrochemical affinity biosensors for fast detection of gene-specific methylations with no need for bisulfite and amplification treatments | Scientific Reports [https://www.nature.com/articles/s41598-018-24902-1]
- 9. Aspects of Electrochemical Biosensors Using Affinity Assays [https://www.mdpi.com/2079-6374/15/3/166]
- 10. Advances in the design of nanomaterial-based electrochemical affinity ... [https://colab.ws/articles/10.1007%2Fs00604-018-2820-8]
- 11. Enzymatic Biosensors - ScienceDirect [https://www.sciencedirect.com/science/article/abs/pii/B9780128031001000037]
- 12. Enzyme Biosensors for Biomedical Applications: Strategies for Safeguarding Analytical Performances in Biological Fluids - PMC [https://pmc.ncbi.nlm.nih.gov/articles/PMC4934206/]
- 13. Coupled with Biosensors Amplification Technology for the... Signal [https://pmc.ncbi.nlm.nih.gov/articles/PMC8227973/]
- 14. A colorimetric biosensor based on enzyme - catalysis -induced... [https://pubs.rsc.org/en/content/articlelanding/2018/ra/c8ra06347h]
- 15. Application of enzymatic and galvanic processes for... catalysis [https://repositories.lib.utexas.edu/handle/2152/ETD-UT-2011-08-3847]
- 16. Guide to Selecting a Biorecognition Element for Biosensors - PMC [https://pmc.ncbi.nlm.nih.gov/articles/PMC6416154/]
- 17. Frontiers | Recent advances in glucose monitoring utilizing oxidase electrochemical biosensors integrating carbon-based nanomaterials and smart enzyme design [https://www.frontiersin.org/journals/chemistry/articles/10.3389/fchem.2025.1591302/full]
- 18. Research Progress on Nanotechnology-Driven Enzyme Biosensors for Electrochemical Detection of Biological Pollution and Food Contaminants - PMC [https://pmc.ncbi.nlm.nih.gov/articles/PMC11989163/]
- 19. Protonation-induced DNA conformational-change dominated... [https://pubmed.ncbi.nlm.nih.gov/36068049/]
- 20. Recent Advances in Enzymatic Biofuel Cells to Power Up Wearable and Implantable Biosensors - PMC [https://pmc.ncbi.nlm.nih.gov/articles/PMC12024621/]
- 21. as high Nucleic ligands in biotechnology and... acid aptamers affinity [https://pubmed.ncbi.nlm.nih.gov/23666257/]
- 22. (PDF) Nucleic as high acid ligands in biotechnology... aptamers affinity [https://www.academia.edu/96039795/Nucleic_acid_aptamers_as_high_affinity_ligands_in_biotechnology_and_biosensorics]
- 23. [PDF] Affinity and enzyme -based biosensors ... | Semantic Scholar [https://www.semanticscholar.org/paper/Affinity-and-enzyme-based-biosensors%3A-recent-and-in-Liu-Matharu/7723e81249d22485bfaaf25456e72cb6455ba527]
- 24. of Enzyme Action: Simplified for Biology Students Mechanism [https://www.vedantu.com/biology/mechanism-of-enzyme-action]
- 25. for Whole-Cell Bacterial Detection - PMC Biosensors [https://pmc.ncbi.nlm.nih.gov/articles/PMC4135896/]
- 26. A global benchmark study using affinity-based biosensors - PubMed [https://pubmed.ncbi.nlm.nih.gov/19133223/]
- 27. in De Novo Enzyme Design... | Preprints.org Binding versus Catalysis [https://www.preprints.org/manuscript/202401.2193/v1]
- 28. A gold nanoparticle-protein G electrochemical affinity for... biosensor [https://www.nature.com/articles/s41598-022-17219-7?error=cookies_not_supported&code=04dec3a2-84e7-41bc-aa55-803ecc700e9a]
- 29. Recent trends in biosensors - ScienceDirect [https://www.sciencedirect.com/science/article/abs/pii/S1567173904001592]
- 30. Evaluation of Transducer Elements Based on Different Material Configurations for Aptamer-Based Electrochemical Biosensors - PMC [https://pmc.ncbi.nlm.nih.gov/articles/PMC11274616/]
- 31. Biomolecular interaction analysis: affinity biosensor technologies for functional analysis of proteins - ScienceDirect [https://www.sciencedirect.com/science/article/abs/pii/S1367593197800774]
- 32. Immobilized Enzymes in Biosensor Applications - PMC [https://pmc.ncbi.nlm.nih.gov/articles/PMC6337536/]
- 33. Frontiers | Affinity-Based Detection of Biomolecules Using Photo-Electrochemical Readout [https://www.frontiersin.org/journals/chemistry/articles/10.3389/fchem.2019.00617/full]
- 34. Electrochemical Affinity Biosensors in Food Safety [https://www.mdpi.com/2227-9040/5/1/8]
- 35. Critical overview on the application of sensors and biosensors for... [https://pmc.ncbi.nlm.nih.gov/articles/PMC7112812/]
- 36. Aspects of Electrochemical Biosensors Using Affinity Assays - PMC [https://pmc.ncbi.nlm.nih.gov/articles/PMC11939962/]
- 37. Determination of Alanine Aminotransferase with an Electrochemical... [https://pmc.ncbi.nlm.nih.gov/articles/PMC4264364/]
- 38. High ALT Levels Explained: Causes, Symptoms, and Key Biomarkers [https://www.rupahealth.com/post/high-alt-levels-explained-causes-symptoms-and-key-biomarkers]
- 39. Development and Comparative Evaluation of Two Enzyme -Based... [https://www.mdpi.com/2072-666X/16/10/1168]
- 40. Aptasensors Are Conjectured as Promising ALT and AST Diagnostic... [https://pmc.ncbi.nlm.nih.gov/articles/PMC10305476/]
- 41. Affinity Biosensors Technology [https://affinitybio.com/technology/]
- 42. DNA Methylation in Solid Tumors: Functions and Methods of Detection [https://www.mdpi.com/1422-0067/22/8/4247]
- 43. Comprehensive comparison of enzymatic and bisulfite DNA ... [https://clinicalepigeneticsjournal.biomedcentral.com/articles/10.1186/s13148-025-01959-0]
- 44. Magnetic Immunosensor Coupled to Enzymatic Signal for Determination of Genomic DNA Methylation [https://www.mdpi.com/2079-6374/12/3/162]
- 45. methyl sequencing Enzymatic at... detects DNA methylation [https://pubmed.ncbi.nlm.nih.gov/34140313/]
- 46. A bisulfite treatment and PCR-free global DNA methylation detection method using electrochemical enzymatic signal engagement - ScienceDirect [https://www.sciencedirect.com/science/article/abs/pii/S0956566318308297]
- 47. A novel fluorescent biosensor based on dendritic DNA nanostructure... [https://jnanobiotechnology.biomedcentral.com/articles/10.1186/s12951-019-0552-5]
- 48. Affinity Biosensors: Techniques and Protocols | SpringerLink [https://link.springer.com/book/10.1385/0896035395]
- 49. Recent developments in biosensors for healthcare and biomedical applications: A review - ScienceDirect [https://www.sciencedirect.com/science/article/abs/pii/S0263224120308332]
- 50. Sensors | Special Issue : Enzymatic Biosensors [https://www.mdpi.com/journal/sensors/special_issues/enzymatic-biosensors]
- 51. Advances in Detection Technologies for Pesticide Residues and Heavy Metals in Rice: A Comprehensive Review of Spectroscopy, Chromatography, and Biosensors [https://www.mdpi.com/2304-8158/14/6/1070]
- 52. Recent advances on rapid detection and remediation of environmental pollutants utilizing nanomaterials-based (bio)sensors - PubMed [https://pubmed.ncbi.nlm.nih.gov/35421493/]
- 53. Enzyme-Based Biosensors and Their Applications - PMC [https://pmc.ncbi.nlm.nih.gov/articles/PMC10136108/]
- 54. (PDF) Modeling of Enzyme -FET Biosensor Based on Experimental ... [https://www.academia.edu/75247505/Modeling_of_Enzyme_FET_Biosensor_Based_on_Experimental_Glucose_Oxidase_Receptor]
- 55. Principles of affinity-based biosensors - PubMed [https://pubmed.ncbi.nlm.nih.gov/10872504/]
- 56. and Computational Studies of a Laccase Immobilized... Experimental [https://link.springer.com/article/10.1007/s12161-020-01824-1]
- 57. Advances in Enzyme-Based Biosensors for Pesticide Detection - PMC [https://pmc.ncbi.nlm.nih.gov/articles/PMC6022933/]
- 58. A global benchmark study using affinity-based biosensors - PMC [https://pmc.ncbi.nlm.nih.gov/articles/PMC3793259/]
- 59. Wearable biosensors for healthcare monitoring - PMC [https://ncbi.nlm.nih.gov/pmc/articles/PMC8183422]
- 60. Advances in Medical Wearable Biosensors: Design, Fabrication and Materials Strategies in Healthcare Monitoring - PMC [https://pmc.ncbi.nlm.nih.gov/articles/PMC8746599/]
- 61. Advances in the design of nanomaterial-based electrochemical affinity ... [https://link.springer.com/article/10.1007/s00604-018-2820-8]
- 62. Biosensors for Personal Mobile Health: A System Architecture Perspective - PMC [https://pmc.ncbi.nlm.nih.gov/articles/PMC7546526/]
- 63. Rapid AST Test Results | LifeScale from Affinity Biosensors [https://affinitybio.com/]
- 64. Biosensors for Cardiovascular Health Monitoring | SpringerLink [https://link.springer.com/chapter/10.1007/978-981-95-2117-3_7]
- 65. and Stability of Stabilization : The Key to... Enzyme Biosensors [https://pubmed.ncbi.nlm.nih.gov/29580138/]
- 66. and Affinity -based enzyme : recent advances and... biosensors [https://link.springer.com/article/10.1007/s00216-012-6149-6]
- 67. Based Enzyme | Encyclopedia MDPI Biosensors [https://encyclopedia.pub/entry/15346]
- 68. Tyrosinase Immobilization Strategies for the Development of... [https://pmc.ncbi.nlm.nih.gov/articles/PMC9962745/]
- 69. Frontiers in nanoparticles redefining enzyme immobilization: a review addressing challenges, innovations, and unlocking sustainable future potentials | Micro and Nano Systems Letters | Full Text [https://mnsl-journal.springeropen.com/articles/10.1186/s40486-025-00228-2]
- 70. Comparison of biosensor platforms in the evaluation of high affinity antibody-antigen binding kinetics - PubMed [https://pubmed.ncbi.nlm.nih.gov/27365220/]
- 71. | PPTX Immobilization techniques [https://www.slideshare.net/slideshow/immobilization-techniques/179325798]
- 72. Green nanobiocatalysts: enhancing enzyme immobilization for... [https://pmc.ncbi.nlm.nih.gov/articles/PMC11238728/]
- 73. Electrochemical Enzyme-based Biosensors | Encyclopedia MDPI [https://encyclopedia.pub/entry/9421]
- 74. Emerging biosensors in detection of natural products - PMC [https://www.ncbi.nlm.nih.gov/pmc/articles/PMC7484522/]
- 75. Recent Developments in Enzyme, DNA and Immuno-Based Biosensors - PMC [https://pmc.ncbi.nlm.nih.gov/articles/PMC6021829/]
- 76. An Overview on Recent Progress of Metal... [https://pmc.ncbi.nlm.nih.gov/articles/PMC8056378/]
- 77. An Overview of Carbon Nanotubes and Graphene for Biosensing Applications | Nano-Micro Letters [https://link.springer.com/article/10.1007/s40820-017-0128-6]
- 78. Innovations in graphene -based electrochemical biosensors in... [https://pmc.ncbi.nlm.nih.gov/articles/PMC11982133/]
- 79. Carbon nanotube biosensors - PMC [https://pmc.ncbi.nlm.nih.gov/articles/PMC4621484/]
- 80. Metal–Organic-Framework-Based Optical Biosensors: Recent Advances in Pathogen Detection and Environmental Monitoring - PMC [https://pmc.ncbi.nlm.nih.gov/articles/PMC12390483/]
- 81. for Graphene Applications BioSensor [https://www.azonano.com/article.aspx?ArticleID=4673]
- 82. Electrochemical aptasensor based on the engineered core-shell MOF nanostructures for the detection of tumor antigens | Journal of Nanobiotechnology | Full Text [https://jnanobiotechnology.biomedcentral.com/articles/10.1186/s12951-023-01884-5]
- 83. Recent advances in graphene -based biosensor technology with... [https://jnanobiotechnology.biomedcentral.com/articles/10.1186/s12951-018-0400-z]
- 84. Engineering a Proximity Biosensor via Constitutional Dynamic Chemistry - PubMed [https://pubmed.ncbi.nlm.nih.gov/40294133/]
- 85. Focal Molography Allows for Affinity and Concentration Measurements of Proteins in Complex Matrices with High Accuracy [https://www.mdpi.com/2079-6374/15/2/66]
- 86. Current Developments in Biosensor Applications and Smart Strategies | IntechOpen [https://www.intechopen.com/chapters/1210649]
- 87. Design of bioluminescent biosensors for assessing contamination of... [https://pubmed.ncbi.nlm.nih.gov/34215124/]
- 88. A Detailed Model of Electroenzymatic Glutamate Biosensors to Aid in... [https://pmc.ncbi.nlm.nih.gov/articles/PMC5881573/]
- 89. Insights into the performance -determining aspects of electrochemical... [https://pubs.rsc.org/en/content/articlelanding/2025/sd/d5sd00095e]
- 90. Improvement of the optical cavity-based biosensor’s limit of detection using optimal 3-aminopropyltriethoxysilane process | Scientific Reports [https://www.nature.com/articles/s41598-025-92151-0]
- 91. Frontiers | Surface-modified CMOS biosensors [https://www.frontiersin.org/journals/bioengineering-and-biotechnology/articles/10.3389/fbioe.2024.1441430/full]
- 92. Frontiers | Insights in Biosensors and Biomolecular Electronics 2024: Novel Developments, Current Challenges, and Future Perspectives [https://www.frontiersin.org/journals/bioengineering-and-biotechnology/articles/10.3389/fbioe.2025.1668411/abstract]
- 93. Utilization of nanoparticle labels for signal amplification in ultrasensitive electrochemical affinity biosensors: a review - PubMed [https://pubmed.ncbi.nlm.nih.gov/24050664/]
- 94. An immunochromatographic biosensor combined with... [https://pubmed.ncbi.nlm.nih.gov/27203463/]
- 95. Affinity biosensors developed with quantum dots in microfluidic systems - PMC [https://pmc.ncbi.nlm.nih.gov/articles/PMC7944724/]
- 96. Construction of an Immunosensor Based on the Affinity DNA Functional Ligands to the Fc Segment of IgG Antibody [https://www.mdpi.com/2079-6374/15/11/747]
- 97. Advancements in nonenzymatic electrochemical cholesterol detection ... [https://pubs.rsc.org/en/content/articlehtml/2025/sd/d5sd00082c]
- 98. Ultra- sensitive fiber optic LSPR biosensor with enhanced enzyme ... [https://pubmed.ncbi.nlm.nih.gov/39876215/]
- 99. Addressing the Selectivity of Enzyme Biosensors: Solutions and Perspectives [https://www.mdpi.com/1424-8220/21/9/3038]
- 100. Immunosensors | IntechOpen [https://www.intechopen.com/chapters/48359]
- 101. Biosensors | Special Issue : Affinity Sensors [https://www.mdpi.com/journal/biosensors/special_issues/affinity-sensors]
- 102. Electrochemical Biosensors Containing Pure Enzymes ... | IntechOpen [https://www.intechopen.com/chapters/65873]
- 103. Synergistic convergence of materials and enzymes for biosensing and self-sustaining energy devices towards on-body health monitoring | Communications Materials [https://www.nature.com/articles/s43246-024-00557-6]
- 104. Addressing the Selectivity of Enzyme Biosensors: Solutions and Perspectives - PMC [https://pmc.ncbi.nlm.nih.gov/articles/PMC8123588/]
- 105. Recent Advances in Electrochemical Enzyme-Based Biosensors for Food and Beverage Analysis [https://www.mdpi.com/2304-8158/12/18/3355]
- 106. Electrochemical affinity for fast detection of gene-specific... biosensors [https://www.nature.com/articles/s41598-018-24902-1?error=cookies_not_supported]
- 107. Affinity Biosensors Products [https://affinitybio.com/products/]
- 108. Nanozymes in Point-of-Care Diagnosis: An Emerging Futuristic Approach for Biosensing | Nano-Micro Letters [https://link.springer.com/article/10.1007/s40820-021-00717-0]
- 109. A novel strategy for controllable electrofabrication of molecularly imprinted polymer biosensors utilizing embedded Prussian blue nanoparticles | Scientific Reports [https://www.nature.com/articles/s41598-025-93025-1]
- 110. Frontiers | In-vivo continuous monitoring with biosensors based on engineered biological recognition elements: opportunities and challenges [https://www.frontiersin.org/journals/sensors/articles/10.3389/fsens.2025.1579359/full]
- 111. Antibody, DNA, and Enzyme -Based Biosensing Platforms... | IntechOpen [https://www.intechopen.com/chapters/89499]
- 112. Evolution and Expectations of Enzymatic for... | IntechOpen Biosensors [https://www.intechopen.com/chapters/37959]
- 113. Towards continuous potentiometric enzymatic biosensors [https://orbit.dtu.dk/en/publications/towards-continuous-potentiometric-enzymatic-biosensors/]
- 114. of electrochemical Device - PMC integration biosensors [https://pmc.ncbi.nlm.nih.gov/articles/PMC9951169/]
- 115. Towards continuous potentiometric enzymatic biosensors [https://vbn.aau.dk/en/publications/towards-continuous-potentiometric-enzymatic-biosensors]
- 116. Machine-Learning-Aided Advanced Electrochemical Biosensors - PubMed [https://pubmed.ncbi.nlm.nih.gov/40489203/]
- 117. Enzymes: principles and biotechnological applications - PMC [https://pmc.ncbi.nlm.nih.gov/articles/PMC4692135/]
- 118. Enzyme kinetics - Wikipedia [https://en.wikipedia.org/wiki/Enzyme_kinetics]
- 119. Flexible and wearable electrochemical biosensors based on... [https://pmc.ncbi.nlm.nih.gov/articles/PMC7581469/]
- 120. Biosensor development - PubMed [https://pubmed.ncbi.nlm.nih.gov/9818183/]
- 121. Biosensors: The Key to Understanding Enzyme Mechanisms [https://www.numberanalytics.com/blog/biosensors-understanding-enzyme-mechanisms]