From Lab to Reality: A Comprehensive Guide to Validating Biosensors in Complex Biological Samples
This article provides a systematic guide for researchers and drug development professionals on the critical process of validating biosensors for use with real-world biological samples.
From Lab to Reality: A Comprehensive Guide to Validating Biosensors in Complex Biological Samples
Abstract
This article provides a systematic guide for researchers and drug development professionals on the critical process of validating biosensors for use with real-world biological samples. Covering foundational principles to advanced applications, it details the significant challenges posed by sample matrix effects, the necessity of robust optimization strategies like Design of Experiments (DoE), and the implementation of rigorous clinical validation protocols. By synthesizing recent advances and practical methodologies, this resource aims to bridge the gap between promising laboratory biosensor research and their reliable, clinically relevant deployment, ultimately accelerating the translation of these technologies into tools that improve diagnostics and therapeutic monitoring.
The Biosensor Blueprint: Core Principles and The Real-Sample Challenge
Biosensors represent a convergence of biological recognition and physicochemical detection, forming analytical devices indispensable in modern research, clinical diagnostics, and drug development. The international union of pure and applied chemistry (IUPAC) defines a biosensor as a self-contained integrated device that provides specific quantitative or semi-quantitative analytical information using a biological recognition element (bioreceptor) in direct spatial contact with a transducer [1]. The fundamental architecture of any biosensor comprises three core components: a bioreceptor for selective target recognition, a transducer for converting the biological event into a measurable signal, and signal processing electronics for interpreting and displaying the output [2] [3].
The validation of these components within real biological matrices—such as serum, blood, or environmental samples—presents the ultimate test for their analytical robustness. Performance characteristics including sensitivity, selectivity, and stability must be rigorously evaluated against complex backgrounds of interfering substances [4] [5]. This guide deconstructs the biosensor architecture, comparing the performance of various component alternatives and providing experimental methodologies for their validation, framed within the critical context of real-sample analysis.
Core Components of a Biosensor
Bioreceptors: The Molecular Recognition Elements
The bioreceptor is the biological sensing element that confers specificity to the biosensor by interacting selectively with the target analyte. The choice of bioreceptor fundamentally determines the sensor's application potential and limitations in complex samples [1].
Table 1: Comparison of Major Bioreceptor Types
| Bioreceptor Type | Recognition Principle | Key Advantages | Limitations in Real Samples | Exemplary Analytic Targets |
|---|---|---|---|---|
| Enzymes | Catalytic activity converting substrate to product [3] | High catalytic turnover amplifies signal; wide range of substrates [1] | Stability affected by pH, temp., inhibitors in sample [3] | Glucose, Urea, Pesticides, Heavy Metals [1] |
| Antibodies | High-affinity binding to a specific antigen (lock-and-key fit) [3] | Exceptional specificity; robust immunoassay formats [1] | Binding capacity depends on assay conditions (pH, T); can be disrupted [3] | Pathogens, Proteins, Hormones, Toxins [1] |
| Nucleic Acids (DNA/RNA) | Complementary base pairing (hybridization) [3] [1] | High predictability of interactions; aptamers can bind diverse targets [3] | Susceptible to nucleases in biological fluids | DNA/RNA sequences, Aptamer-binding molecules [1] |
| Whole Cells | Metabolic or stress response of living cells [1] [6] | Provides functional/toxicity info; no enzyme purification needed [1] | Longer response time due to transport barrier; less specific [1] | Biological Oxygen Demand (BOD), Toxicity, Heavy Metals [1] [6] |
| Artificial Binding Proteins | Engineered protein scaffolds (e.g., from phage display) [3] | Small size, high stability, can be expressed in bacterial cytoplasm [3] | Relatively new technology; limited commercial availability | Various protein targets [3] |
Transducers: Converting Biological Events into Measurable Signals
The transducer serves as the core signal conversion unit, transforming the biorecognition event into a quantifiable electrical, optical, or mechanical output. The transducer's selection directly impacts the sensor's sensitivity, miniaturization potential, and compatibility with point-of-care formats [7] [4].
Table 2: Performance Comparison of Major Transducer Types
| Transducer Type | Signal Measured | Detection Limit | Response Time | Key Challenges in Real-sample Analysis |
|---|---|---|---|---|
| Electrochemical | ||||
| Amperometric [1] | Current from redox reactions | Very Low (nM-pM) [8] | Seconds to Minutes [8] | Electrode fouling; interference from electroactive species |
| Potentiometric [1] | Potential change at electrode surface | Low (µM-nM) | Seconds to Minutes | Sensitivity to ionic strength; reference electrode stability |
| Conductometric [1] | Change in ionic conductivity | Moderate (µM) | Minutes | Non-specific conductivity changes from sample matrix |
| Optical | ||||
| Fluorescence [1] [9] | Light emission intensity/wavelength | Extremely Low (pM-fM) [9] | Seconds to Minutes | Autofluorescence of sample components; light scattering |
| Surface Plasmon Resonance (SPR) [1] | Change in refractive index | Low (nM) [1] | Real-time (seconds) [1] | Non-specific adsorption to gold surface |
| Piezoelectric [1] [4] | Change in mass (frequency) | High for mass change (~pg) [4] | Minutes | Viscosity and density of sample affect frequency |
| Thermal [4] | Heat absorption/generation (temperature) | Moderate (µM) | Minutes | Requires excellent thermal insulation; background heat |
Experimental Validation in Real Biological Samples
Case Study: Validating a GEM Biosensor for Heavy Metal Detection
A 2023 study on a Genetically Engineered Microbial (GEM) biosensor for detecting Cd²⁺, Zn²⁺, and Pb²⁺ provides a robust template for validation protocols. The sensor was based on a redesigned CadA/CadR operon from Pseudomonas aeruginosa coupled with an enhanced Green Fluorescent Protein (eGFP) reporter in E. coli BL21 [6].
1. Experimental Protocol: Specificity and Cross-Reactivity Assessment
- Objective: To confirm the biosensor's response is specific to Cd²⁺, Zn²⁺, and Pb²⁺ and to rule out interference from other metals.
- Methodology:
- Prepare 100 ppm stock solutions of target metals (Cd²⁺, Pb²⁺, Zn²⁺) and non-specific metals (Ni²⁺, Fe³⁺, AsO₄³⁻) using analytical grade salts dissolved in ddH₂O [6].
- Confirm exact concentrations using Microwave Plasma-Atomic Emission Spectrometry (MP-AES) [6].
- Culture the GEM biosensor cells and expose them to a series of metal solutions (both targets and non-targets) at a range of concentrations (e.g., 0.1 - 5.0 ppm).
- Incubate under optimal physiological conditions (e.g., 37°C, pH 7.0) for a predetermined period.
- Measure the fluorescent output (eGFP intensity) using a fluorometer or microplate reader.
- Validate reporter gene expression via Quantitative PCR (qPCR) [6].
- Data Analysis:
- Plot fluorescence intensity against metal concentration for each metal.
- Calculate the linear regression (R²) for each dose-response curve. High R² values for target metals (e.g., 0.9809 for Cd²⁺) and low R² for non-specific metals (e.g., 0.0373 for Fe³⁺) confirm specificity [6].
- Determine the Limit of Detection (LOD) from the linear calibration graph.
2. Experimental Protocol: Analytical Recovery in Complex Matrices
- Objective: To evaluate the accuracy and precision of the biosensor measurement in a complex, real-world sample.
- Methodology:
- Select a relevant real sample matrix (e.g., water from a potential contamination site, processed food samples, or synthetic biological fluids).
- Spike the sample with known, quantified concentrations of the target analyte (e.g., Cd²⁺ at 1, 2, and 3 ppb).
- Process the sample with the biosensor and measure the resulting signal.
- Use the pre-established calibration curve to calculate the measured concentration of the analyte.
- Compare the measured concentration to the known spiked concentration.
- Data Analysis:
- Calculate the % Recovery for each spike level: (Measured Concentration / Spiked Concentration) × 100.
- Acceptable recovery typically falls between 80-120%, demonstrating that the matrix does not significantly interfere with the assay [6].
- Calculate the coefficient of variation (CV) for replicate measurements (n≥3) to determine precision.
Case Study: Europium Complex-Loaded Nanoparticles for Immunoassay
A 2025 study on immunosensors utilized albumin nanoparticles loaded with luminescent europium complexes for the detection of human IgG, demonstrating key validation steps for an optical biosensor [9].
Experimental Protocol: Assessing Reproducibility and Clinical Concordance
- Objective: To validate the biosensor's performance against a gold-standard clinical method.
- Methodology:
- Functionalize nanoparticle surface with streptavidin for specific binding in a sandwich immunoassay format [9].
- Test the biosensor on a panel of human serum samples with varying IgG levels, diluted up to 1:100,000 [9].
- Employ time-resolved detection to reduce background fluorescence by two orders of magnitude [9].
- Run the same set of samples in parallel using a commercial immunoassay (e.g., ELISA).
- Data Analysis:
- Perform a correlation analysis (e.g., Pearson correlation) between the signals from the new biosensor and the commercial assay.
- Assess intra-assay reproducibility by calculating the CV for replicate measurements of the same sample. The study noted CVs >20% in some sera, highlighting a key area for improvement [9].
- Test cross-reactivity with related analytes (e.g., IgA, IgM), where the reported immunosensor showed minimal cross-reactivity (~2%) [9].
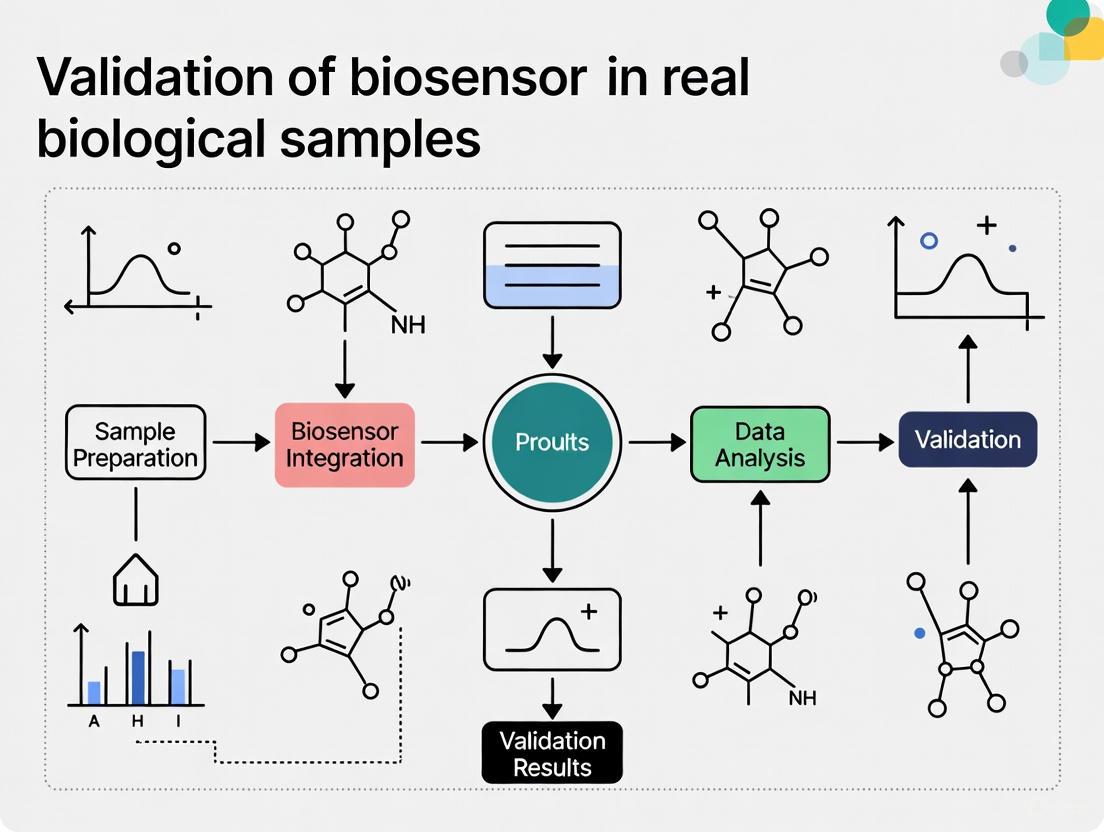
Schematic Representations
Architectural and Validation Workflow
(Biosensor Signal Flow Architecture)
GEM Biosensor Experimental Workflow
(GEM Biosensor Validation Workflow)
The Scientist's Toolkit: Essential Research Reagents and Materials
The development and validation of biosensors require a curated set of high-quality reagents and materials. The following toolkit details essentials for constructing and testing biosensor systems, drawing from the cited experimental studies.
Table 3: Essential Research Reagent Solutions for Biosensor Validation
| Reagent / Material | Function / Application | Exemplary Use Case & Rationale |
|---|---|---|
| pJET1.2 Plasmid | Cloning vector for genetic circuit | Used in GEM biosensor [6] to host the synthetic CadA/CadR-eGFP circuit; provides high copy number and selection. |
| Enhanced Green Fluorescent Protein (eGFP) | Reporter gene for optical detection | Provides a strong, quantifiable fluorescent signal in GEM biosensors upon activation by target analytes [6]. |
| Gold Nanoparticles | Transducer enhancement platform | Used as a substrate for immobilizing bioreceptors (e.g., glucose oxidase) to enhance electron transfer and signal in electrochemical biosensors [2] [8]. |
| Screen-Printed Electrodes (SPEs) | Disposable electrochemical transducers | Provide a ready-to-use, miniaturized three-electrode system (working, reference, counter) for portable amperometric or potentiometric sensing [1]. |
| Streptavidin | Immobilization and binding bridge | Used to functionalize sensor surfaces; binds biotinylated antibodies or DNA, enabling stable and oriented immobilization of bioreceptors [9]. |
| Cadmium Chloride (CdCl₂), Lead Nitrate (Pb(NO₃)₂) | Standard solutions for validation | Prepare stock solutions of target analytes (e.g., heavy metals) for calibration curves and spiking experiments to validate sensor response [6]. |
| Laccase Enzyme | Bioreceptor for organic pollutants | Used in enzymatic biosensors for detecting and degrading phenolic compounds and dyes; catalyzes oxidation reactions [8]. |
| BSA (Bovine Serum Albumin) | Blocking agent | Minimizes non-specific adsorption (fouling) on the transducer surface, a critical step for maintaining specificity in complex samples [9]. |
The systematic deconstruction of biosensor architecture reveals a tightly interconnected relationship between bioreceptor selectivity, transducer sensitivity, and the imperative of robust signal processing. Validation in real biological samples remains the critical gateway for transitioning laboratory biosensor designs into reliable analytical tools for research, clinical diagnostics, and drug development. The experimental frameworks and comparative data presented here provide a roadmap for researchers to rigorously benchmark new biosensor technologies against established alternatives, focusing on the key performance metrics that define analytical utility in real-world conditions. Future advancements will likely hinge on the continued integration of novel nanomaterials [2], engineered biomolecules [3], and sophisticated data analytics to overcome persistent challenges in stability, specificity, and reproducibility.
The transition of biosensors from controlled laboratory settings to real-world clinical applications represents one of the most significant challenges in diagnostic development. While biosensors frequently demonstrate exceptional performance in purified buffer solutions, their accuracy, sensitivity, and reliability can be dramatically compromised when confronted with the complex composition of real biological samples. This phenomenon, known as the matrix effect, arises from the myriad of components in blood, serum, and urine that can interfere with molecular recognition events and signal transduction. The validation of biosensors against these complex matrices is not merely a final checkbox before deployment but constitutes the ultimate test of their true analytical robustness and clinical utility. This guide systematically compares biosensor performance across different biological matrices, provides experimental protocols for evaluating matrix effects, and details strategies to overcome these challenges, framing the discussion within the broader thesis that rigorous validation in real samples is fundamental to advancing biosensor research.
Defining the Problem: The Nature of Matrix Complexity
Biological matrices such as blood, serum, and urine present a complex and variable mixture of components that can interfere with biosensor function through multiple mechanisms:
- Enzymatic Degradation: Nucleases and proteases present in clinical samples can degrade biological recognition elements (e.g., RNA, DNA, protein) essential for biosensor operation [10].
- Optical Interference: The autofluorescence of sample components or their optical absorption can severely impact the signal-to-noise ratio in fluorescence-based and colorimetric detection systems [11].
- Electrochemical Interference: Variations in ionic strength, pH, and the presence of electroactive species can distort signals in electrochemical biosensors [11] [12].
- Fouling and Non-Specific Binding: Proteins, lipids, and other biomolecules can adsorb to sensor surfaces, blocking binding sites and generating false positive signals [13].
The composition of these matrices varies not only between sample types but also between individuals and within the same individual under different physiological conditions, adding another layer of complexity to biosensor validation.
Comparative Analysis of Matrix Effects Across Sample Types
Quantitative Impact on Cell-Free Biosensor Performance
Research has systematically quantified the inhibitory effects of various clinical samples on biosensor performance. In a 2022 study evaluating cell-free transcription-translation (TX-TL) systems, clinical samples added at 10% of the final reaction volume demonstrated substantial inhibition of reporter production [10] [14].
Table 1: Matrix Inhibition on Cell-Free Biosensor Reporter Production
| Sample Type | Inhibition of sfGFP Production | Inhibition of Luciferase Production | Key Interfering Components |
|---|---|---|---|
| Serum | >98% | >98% | Nucleases, proteases, lipids |
| Plasma | >98% | >98% | Nucleases, proteases, anticoagulants |
| Urine | >90% | >90% | Metabolites, salts, variable pH |
| Saliva | 40% | 70% | Bacteria, food debris, enzymes |
Performance Variation Across Sensing Modalities
Different biosensor technologies exhibit varying susceptibility to matrix effects based on their transduction mechanisms. The table below compares the performance of several biosensor platforms when challenged with complex biological samples.
Table 2: Biosensor Technology Comparison in Biological Matrices
| Biosensor Technology | Sample Type | Key Matrix Challenges | Mitigation Strategies | Performance Outcomes |
|---|---|---|---|---|
| Cell-Free TX-TL Systems [10] [14] | Serum, Plasma, Urine, Saliva | RNase degradation, protease activity, glycerol inhibition | Engineered RNase inhibitor strains, buffer optimization | 40-70% signal recovery with RNase inhibition |
| Magnetic Nanosensors [11] | Serum, Urine, Saliva, Lysates | Minimal interference | Magnetic detection (no optical/charge limitations) | Attomolar sensitivity, 93-107% recovery in spiked tap water |
| Electrochemical Biosensors [15] | Tap water, complex media | Fouling, non-specific binding | Mn-doped ZIF-67 MOF coating, antibody functionalization | 1 CFU/mL detection limit, >80% sensitivity over 5 weeks |
| Lab-on-Paper Devices [16] | Urine, Blood | Complex composition, viscosity | Sample filtration, separation membranes | Successful ALB, CRE, and protein detection |
Experimental Protocols for Matrix Effect Evaluation
Standardized Protocol for Assessing Matrix Interference
To systematically evaluate matrix effects, researchers can implement the following standardized protocol adapted from studies on cell-free biosensors and other platforms:
1. Sample Collection and Preparation:
- Collect clinical samples (serum, plasma, urine, saliva) using standardized protocols [10]. For serum and plasma, blood should be collected in appropriate vacuum tubes and centrifuged to obtain the respective fractions.
- Minimize preprocessing to maintain matrix integrity; avoid additional purification unless specifically testing pretreatment methods.
- Aliquot and store samples at -80°C if not used immediately to preserve component stability.
2. Biosensor Reaction Setup:
- Prepare biosensor reactions according to established protocols. For cell-free systems, mix plasmids constitutively expressing reporters (e.g., sfGFP, luciferase) with cell-free extract and optimized buffer containing necessary building blocks, salts, and energy sources [10].
- Add clinical samples to constitute 10% of the final reaction volume, maintaining consistent proportions across experiments.
- Include control reactions without clinical samples to establish baseline signal levels.
- For electrochemical biosensors, functionalize electrodes with recognition elements (e.g., anti-O antibody for E. coli detection) prior to sample exposure [15].
3. Signal Measurement and Analysis:
- Quantify reporter production using appropriate instrumentation (fluorometry for sfGFP, luminometry for luciferase, electrochemistry for electrochemical sensors).
- Calculate percentage inhibition relative to control reactions:
% Inhibition = [(Signal_control - Signal_sample)/Signal_control] × 100 - Evaluate inter-patient variability by testing samples from multiple donors (recommended n≥10) [10].
Mitigation Strategy Testing Protocol
1. Inhibitor Screening:
- Test categories of inhibitors including RNase inhibitors, protease inhibitors (both bacterial and mammalian), and combination approaches.
- Use commercial inhibitors initially, but account for potential buffer-derived interference (e.g., glycerol in RNase inhibitor preparations) [10].
- For electrochemical platforms, evaluate antifouling coatings and blocking agents to reduce non-specific binding.
2. Signal Recovery Quantification:
- Calculate percentage signal recovery for each mitigation strategy:
% Recovery = [(Signal_mitigation - Signal_no mitigation)/(Signal_control - Signal_no mitigation)] × 100 - Compare mitigation effectiveness across different sample types and biosensor platforms.
Diagram 1: Experimental workflow for systematic evaluation of matrix effects in biological samples
The Scientist's Toolkit: Key Reagents and Materials
Table 3: Essential Research Reagents for Matrix Effect Studies
| Reagent/Material | Function | Example Application | Considerations |
|---|---|---|---|
| RNase Inhibitors | Protect RNA components from degradation | Cell-free biosensors in serum/plasma | Commercial preparations may contain glycerol which can inhibit reactions [10] |
| Protease Inhibitors | Prevent protein degradation | Biosensors with protein recognition elements | Test both bacterial and mammalian-specific formulations [10] |
| Engineered E. coli Strains | Produce native RNase inhibitors | Avoid glycerol inhibition in cell-free systems | No additional steps required in extract preparation [10] [14] |
| Magnetic Nanoparticles | Enable matrix-insensitive detection | Magnetic nanosensor platforms | No magnetic background in biological samples reduces interference [11] |
| Zeolitic Imidazolate Frameworks | Enhance sensor surface area and electron transfer | Electrochemical biosensors | Mn-doping improves conductivity and catalytic performance [15] |
| Sample Separation Membranes | Filter complex samples | Lab-on-paper devices | Integrated into microfluidic devices for on-chip separation [16] |
Technological Solutions for Matrix Challenges
Matrix-Insensitive Sensing Platforms
Certain biosensor technologies demonstrate inherent advantages in complex biological matrices:
Magnetic Nanosensors: Giant magnetoresistive (GMR) sensors detect magnetic nanoparticle tags bound to target analytes. Since biological matrices lack a detectable magnetic background, these platforms achieve exceptional sensitivity (down to attomolar concentrations) with minimal matrix interference across diverse media including serum, urine, and saliva [11]. Performance remains stable across varying pH (4-10) and temperature conditions that would compromise other sensing modalities.
Engineered Cell-Free Systems: The development of E. coli strains that produce endogenous RNase inhibitors during extract preparation represents a significant advancement. This approach eliminates the need for commercial inhibitors with detrimental glycerol buffers, improves protein production yields, and reduces inter-patient variability in biosensor response [10] [14].
Metal-Organic Framework (MOF)-Enhanced Electrochemical Sensors: Mn-doped ZIF-67 composites increase sensor surface area and electron transfer efficiency while providing a stable platform for antibody functionalization. These materials enable extremely low detection limits (1 CFU/mL for E. coli) and maintain >80% sensitivity over 5 weeks in complex samples [15].
Diagram 2: Comprehensive strategies for mitigating matrix effects in biosensor applications
Methodological Approaches to Matrix Challenges
Sample Pretreatment Integration: Microfluidic lab-on-paper devices increasingly incorporate on-sample pretreatment steps including separation membranes for plasma isolation from whole blood, extraction pads for target analytes, and filtration zones to remove interfering components [16]. These integrated approaches minimize the need for external sample processing while improving biosensor performance.
Context-Aware Biosensor Design: Implementing Design-Build-Test-Learn (DBTL) cycles that characterize biosensor performance across different environmental conditions (media, supplements, carbon sources) enables the development of context-aware systems with more predictable behavior in variable matrices [17].
The complexity of biological matrices presents a formidable but not insurmountable challenge in biosensor development. Systematic evaluation across sample types reveals consistent patterns of interference, with serum and plasma typically causing the most severe inhibition, followed by urine and saliva. Successful navigation of these challenges requires both technological innovations—such as magnetic detection platforms and engineered biological components—and methodological advances in sample handling and pretreatment. The ultimate validation of any biosensor must occur in the complex, variable, and often unforgiving environment of real clinical samples, as this remains the only meaningful test of its true diagnostic utility. As the field advances, the integration of matrix mitigation strategies directly into biosensor design will be essential for translating promising laboratory technologies into clinically viable diagnostic tools.
The transition of biosensors from research prototypes to reliable clinical tools hinges on rigorous validation against standardized analytical figures of merit. For researchers and drug development professionals, understanding and accurately determining these parameters is crucial for evaluating biosensor performance in complex biological matrices such as blood, serum, and urine [18]. These metrics—sensitivity, specificity, limit of detection (LOD), and limit of quantitation (LOQ)—form an interconnected framework that dictates whether a biosensor can deliver the precision, reliability, and accuracy required for clinical decision-making [19] [20]. In the context of real biological samples, where interferents abound and analyte concentrations can span from abundant to trace levels, these figures of merit provide the objective criteria needed to assess a biosensor's clinical viability [18] [21]. This guide systematically compares these critical parameters, provides experimental protocols for their determination, and contextualizes their significance for biosensor validation in pharmaceutical and clinical research environments.
Defining the Key Figures of Merit
Conceptual Definitions and Clinical Significance
The analytical performance of biosensors is quantified through specific figures of merit, each measuring a distinct aspect of performance. The table below summarizes their core definitions, clinical implications, and determination methods.
Table 1: Core Analytical Figures of Merit for Biosensor Validation
| Figure of Merit | Definition | Clinical Significance | Typical Determination Method |
|---|---|---|---|
| Sensitivity | The change in analytical signal per unit change in analyte concentration [18]. | Dictates the biosensor's ability to detect clinically relevant concentration changes (e.g., small increases in cardiac troponin) [19]. | Slope of the analytical calibration curve [18]. |
| Specificity | The ability to detect a specific analyte in a sample containing other admixtures and contaminants [19]. | Ensures accurate diagnosis by minimizing false positives from interfering substances in biological samples [20]. | Confusion matrix analysis; cross-reactivity testing with structurally similar compounds [20]. |
| Limit of Detection (LOD) | The lowest analyte concentration that can be reliably distinguished from a blank sample [22]. | Determines early disease detection capability (e.g., detecting low ng/ml levels of cancer biomarkers) [19]. | LOD = 3σ/S, where σ is the standard deviation of the blank and S is the sensitivity [20] [23]. |
| Limit of Quantitation (LOQ) | The lowest analyte concentration that can be quantified with acceptable precision and accuracy [22]. | Essential for monitoring disease progression or drug levels where precise concentration values are critical [20]. | LOQ = 10σ/S, where σ is the standard deviation of the blank and S is the sensitivity [20]. |
Interrelationships and Technical Nuances
These figures of merit are not independent; optimizing one can impact another. For instance, enhancing a biosensor's sensitivity often involves using nanomaterials like gold nanoparticles or carbon nanotubes, which provide a larger surface area for bioreceptor immobilization and improve electron transfer rates, thereby amplifying the signal per unit concentration [18]. However, such modifications must be engineered without compromising specificity, which is the bioreceptor's inherent ability to bind only to the target analyte even in complex samples like blood or serum [19]. The high-affinity interaction between an antibody and antigen is a classic example of this specificity [19].
The relationship between LOD and LOQ is fundamentally statistical. The LOD is the point at which a signal can be trusted as real (not noise), while the LOQ is the point at which the measurement becomes quantitatively meaningful [22]. The factor of three standard deviations for LOD provides a 99% confidence level for a true detection, while the ten standard deviations for LOQ ensures a low enough relative standard deviation for accurate quantification [20] [22]. In a clinical setting, the required LOD is directly tied to the physiological or pathological concentration range of the target analyte. For example, a biosensor designed to detect prostate-specific antigen (PSA) must achieve an LOD of at least 4 ng/ml to be clinically relevant for prostate cancer risk assessment [19].
Experimental Protocols for Determination
Protocol for Determining Sensitivity and Calibration Curve
Objective: To construct a calibration curve and determine the analytical sensitivity of a biosensor. Materials: Biosensor platform, purified analyte standard, buffer matrix, data acquisition system. Procedure:
- Standard Preparation: Prepare a series of standard solutions covering the expected clinical range (e.g., 0.1-100 nM) in a matrix that mimics the biological sample (e.g., buffer with 1% serum albumin).
- Measurement: For each standard concentration, measure the biosensor's response (e.g., current in nA, frequency shift in Hz, or optical shift in nm).
- Data Analysis: Plot the measured signal (y-axis) against the analyte concentration (x-axis). Using linear regression, fit a line to the data points. The slope of this calibration curve (e.g., in nA/nM) is the analytical sensitivity [18]. The linearity of this plot across the working range is also a critical performance parameter [19].
Protocol for Determining Limit of Detection (LOD) and Limit of Quantitation (LOQ)
Objective: To calculate the LOD and LOQ of a biosensor. Materials: Biosensor platform, blank sample (analyte-free matrix), low-concentration analyte standards. Procedure:
- Blank Measurement: Analyze the blank sample (e.g., pure buffer) at least 10 times to establish the baseline signal.
- Calculation: Calculate the standard deviation (σ) of the blank measurements. Determine the sensitivity (S) from the calibration curve as described in Section 3.1.
- Determination: Calculate LOD as 3σ/S and LOQ as 10σ/S [20] [23]. For example, a microRNA biosensor with a blank standard deviation of 0.05 nA and a sensitivity of 500 nA/nM would have an LOD of (3 × 0.05) / 500 = 0.0003 nM (or 300 fM) [21].
Protocol for Evaluating Specificity and Selectivity
Objective: To verify the biosensor's specificity towards the target analyte in the presence of potential interferents. Materials: Biosensor platform, target analyte, structurally similar compounds, and common interferents found in the biological sample (e.g., ascorbic acid, uric acid for blood analysis). Procedure:
- Interferent Preparation: Prepare solutions of the target analyte and individual interferents at physiologically relevant concentrations.
- Cross-reactivity Test: Measure the biosensor's response for each interferent solution separately.
- Data Analysis: The response from interferents should be negligible compared to the response from the target analyte at an equivalent concentration. Specificity is often presented via a confusion matrix, showing the rate of true positives and false positives [20]. A biosensor detecting a specific malaria DNA sequence, for instance, should not show a significant signal when exposed to DNA from other pathogens [24].
Comparative Performance Data in Clinical Applications
The practical application of these figures of merit is evident when comparing biosensor performance across different clinical targets. The following table compiles recent data from the literature to illustrate achievable performance benchmarks.
Table 2: Comparative Performance of Biosensors for Various Clinical Targets
| Target Analyte | Biosensor Type | Sensitivity | LOD | LOQ | Specificity/Selectivity Notes | Ref. |
|---|---|---|---|---|---|---|
| miR-21 (Cancer) | Electrochemical (MWCNT) | Not specified | 1.2 × 10⁻¹⁸ M | Not specified | Demonstrated performance in human serum. | [21] |
| SARS-CoV-2 | Metasurface Optical | 400 GHz/RIU | Not specified | Not specified | Machine learning enhanced; label-free. | [25] |
| P. fluorescens | RAA-Test Strip | Not specified | 37 CFU/mL (gyrB gene) | Not specified | No cross-reactivity with 19 other bacteria. | [26] |
| Malaria (Schizont) | SPR | 263.26 °/RIU | Not specified | Not specified | Stage-specific differentiation. | [24] |
| Various Flavonoids | Whole-Cell (TtgR-based) | Not specified | 0.01 mM | Not specified | Engineered TtgR variants for tailored ligand response. | [26] |
| Lidocaine HCl | Dissolvable Microneedles | Not specified | Not specified | Not specified | Significant analgesia in mice within 5 min. | [26] |
CFU: Colony Forming Unit; MWCNT: Multi-Walled Carbon Nanotube; RAA: Recombinase-Aided Amplification; RIU: Refractive Index Unit; SPR: Surface Plasmon Resonance.
Essential Research Reagent Solutions
The following table lists key reagents and materials critical for developing and validating biosensors, along with their primary functions.
Table 3: Key Research Reagent Solutions for Biosensor Development
| Reagent/Material | Function in Biosensor Development | Example Use Cases |
|---|---|---|
| Gold Nanoparticles (AuNPs) | Signal amplification; enhanced electron transfer; large surface area for bioreceptor immobilization. | Used in electrochemical DNA sensors to achieve fM detection limits [18]. |
| Graphene | Transducer component; high electrical conductivity and surface area; enhances plasmonic fields in optical sensors. | Integrated into SPR platforms to improve sensitivity for malaria detection [24] [25]. |
| Carbón Nanotubes (CNTs) | Transduction element; facilitate electron transfer in electrochemical biosensors. | Detection of proteins, neurotransmitters, and cancer biomarkers [18]. |
| Molecularly Imprinted Polymers (MIPs) | Artificial bioreceptors; synthetic recognition sites for selective target binding. | Used as stable, synthetic alternatives to antibodies in sensors for small toxic molecules [27]. |
| Thiol-tethered ssDNA | Bioreceptor; provides stable, oriented binding to sensor surfaces for specific DNA/RNA detection. | Functionalization of graphene surfaces for specific malaria DNA sequence detection [24]. |
| CRISPR/Cas systems | Biorecognition and signal amplification; provides high specificity for nucleic acid targets. | Used in immobilized assays for unamplified miRNA quantification with femtomolar sensitivity [27]. |
Visualizing the Validation Workflow and Relationships
The following diagram illustrates the logical workflow for validating a biosensor, connecting the key experimental procedures with the figures of merit they determine.
Diagram 1: Biosensor Validation Workflow. This chart outlines the key experimental steps (green and red nodes) for determining the core figures of merit (blue nodes).
The conceptual relationship between the blank measurement, LOD, and LOQ is fundamental, as shown in the following probability distribution diagram.
Diagram 2: Statistical Relationship of Blank, LOD, and LOQ. This diagram visualizes the statistical definitions of LOD and LOQ based on the distribution of the blank signal, highlighting the differing levels of confidence for detection versus quantification [22].
The rigorous characterization of sensitivity, specificity, LOD, and LOQ is non-negotiable for the validation of biosensors intended for clinical use. As demonstrated, these parameters are interdependent, and their optimization must be balanced to meet the specific demands of detecting target analytes in complex biological samples. The experimental protocols and performance benchmarks outlined here provide a framework for researchers to systematically evaluate their biosensing platforms. The ongoing integration of advanced materials like nanomaterials and CRISPR-based recognition elements continues to push the boundaries of these figures of merit, enabling detection of clinically significant targets at previously unattainable concentrations. Ultimately, a thorough understanding and precise determination of these key analytical metrics are foundational to developing biosensors that are not only scientifically innovative but also clinically reliable and impactful.
The transition from analytical validation in simple buffer solutions to clinical application in complex biological fluids represents a critical "valley of death" in biosensor development. While academic literature reports countless biosensors with exceptional analytical performance in controlled buffer systems, only a minute fraction successfully translates to commercialized diagnostic products [28] [29]. This translational gap persists despite continuous advancements in sensing modalities, nanomaterials, and biorecognition elements. The core challenge lies in the dramatic performance deterioration that occurs when biosensors encounter the complex, heterogeneous, and variable matrix of biological samples [12] [30]. Even biosensors exhibiting picomolar detection limits for specific biomarkers in buffer may fail to function in blood, saliva, or urine due to a multitude of interference mechanisms that are often overlooked during early-stage development. This review systematically analyzes the common failure points at this critical transition, providing researchers with a framework for anticipating and addressing these challenges through robust experimental design and validation strategies.
Systematic Analysis of Failure Points in Complex Matrices
Matrix Effects and Interfering Substances
Biological fluids contain numerous components that can interfere with biosensor function through various mechanisms. Blood plasma, for instance, contains human serum albumin (35–60 mg mL⁻¹), immunoglobulin G (6–16 mg mL⁻¹), and fibrinogen (2 mg mL⁻¹), which collectively account for significant nonspecific binding that can reduce sensor sensitivity and specificity [30]. Saliva, while less complex than blood, still contains mucins, food debris, and variable ionic strength that can affect sensor performance [30]. The key interfering substances and their mechanisms of action are detailed in the table below.
Table 1: Common Interfering Substances in Biological Fluids and Their Impact on Biosensor Performance
| Biological Fluid | Key Interfering Substances | Interference Mechanism | Impact on Biosensor Performance |
|---|---|---|---|
| Blood/Plasma/Serum | Albumin, Immunoglobulins, Fibrinogen | Nonspecific adsorption, surface fouling | Reduced sensitivity, increased background noise, false positives |
| Red/white blood cells | Physical blockage, release of intracellular components | Sensor fouling, additional redox reactions | |
| Lipids, Bilirubin | Optical interference, viscosity changes | Signal quenching in optical sensors, diffusion limitations | |
| Saliva | Mucins, Glycoproteins | Surface fouling, increased viscosity | Reduced bioreceptor accessibility, slowed diffusion |
| Food debris, Bacteria | Particulate blockage, enzymatic degradation | Physical obstruction, bioreceptor degradation | |
| Variable pH, Ionic strength | Altered bioreceptor conformation/activity | Reduced binding affinity, changed electrochemical properties | |
| Urine | Urea, Creatinine | Chemical interference, high ionic strength | Denaturation of biological recognition elements, high background current |
| Urinary sediments | Physical deposition on sensor surface | Blocked active sites, reduced signal generation |
Biomarker Accessibility and Stability Issues
Beyond matrix effects, the intrinsic properties of target biomarkers themselves present significant challenges in real samples. Circulating tumor DNA (ctDNA), for example, appears in blood as short fragments (<200 bp) with a half-life of less than 2.5 hours, requiring rapid processing and highly sensitive detection methods [31]. The ctDNA-to-circulating free DNA (cfDNA) ratio varies considerably (0.1–5%) depending on disease stage and tumor type, meaning the abundant non-target cfDNA can vastly overwhelm the target signal [31]. For protein biomarkers, stability issues are paramount; many proteins degrade rapidly in collected samples unless specific stabilization protocols are implemented [30]. Furthermore, biomarkers may exist in multiple forms – free, protein-bound, or encapsulated in extracellular vesicles – each with different accessibility to biosensor recognition elements [31].
Electrode Fouling and Surface Passivation
Electrode fouling represents one of the most significant failure points for electrochemical biosensors transitioning to biological samples. The nonspecific adsorption of proteins, lipids, and other biomolecules onto electrode surfaces creates an insulating layer that impedes electron transfer, increases impedance, and reduces sensitivity [28] [30]. This fouling phenomenon occurs rapidly upon exposure to complex biological matrices and is often irreversible without stringent surface regeneration protocols. The problem is particularly acute for continuous monitoring applications where fouling accumulates over time, leading to signal drift and eventual sensor failure. While antifouling coatings such as hydrophilic polymers, zwitterionic materials, and biomimetic membranes have been developed, their integration often involves trade-offs between fouling resistance and sensor sensitivity [28].
Comparative Performance Analysis: Buffer vs. Biological Samples
The performance gap between idealized buffer systems and real biological matrices can be quantified across multiple analytical parameters. The following table compiles experimental data from published studies demonstrating this performance degradation.
Table 2: Quantitative Performance Comparison of Selected Biosensors in Buffer vs. Biological Fluids
| Biosensor Platform | Target Analyte | Limit of Detection (Buffer) | Limit of Detection (Biological Fluid) | Signal Reduction in Biological Matrix | Reference |
|---|---|---|---|---|---|
| Electrochemical immunosensor | Cardiac troponin | 20 pg mL⁻¹ | 100 pg mL⁻¹ | 5-fold | [28] |
| Au-Ag nanostars SERS platform | α-Fetoprotein (AFP) | Not specified | 16.73 ng mL⁻¹ | Not reported | [32] |
| Mn-ZIF-67 electrochemical sensor | E. coli | Not specified | 1 CFU mL⁻¹ (in spiked tap water) | 93.10–107.52% recovery | [15] |
| DNA-based electrochemical sensor | KRAS mutations | Sub-femtomolar (buffer claims) | Only detected in patient serum after wild-type sequence sequestration | Required specialized sample pre-treatment | [31] |
| Aptamer-modified gold test strip | SARS-CoV-2 | Not reported | Demonstrated in clinical samples | Not quantified | [28] |
The data reveal several consistent trends: limits of detection typically degrade by 5-10 fold in biological matrices, assay variability increases substantially, and many platforms require significant sample pre-treatment to function in complex media. Notably, the Mn-ZIF-67 sensor for E. coli demonstrates exceptional performance retention in tap water, though performance in more complex biological fluids like blood or serum remains unverified [15].
Experimental Protocols for Assessing Matrix Effects
Standardized Matrix Challenge Protocol
To systematically evaluate biosensor robustness against matrix effects, researchers should implement a standardized matrix challenge protocol:
Sample Collection and Processing: Collect biological samples (blood, saliva, urine) from at least 5-10 different donors to account for biological variability. Process samples following standardized protocols (e.g., double centrifugation for plasma separation) [31].
Spike-and-Recovery Experiments: Spike known concentrations of the target analyte into both buffer and biological matrix. Calculate percent recovery using the formula: Recovery (%) = (Measured concentration in matrix / Measured concentration in buffer) × 100. Acceptable recovery typically falls between 85-115% [15].
Interference Testing: Test potential interfering substances individually and in combination at physiologically relevant concentrations. Common interferents include ascorbic acid, uric acid, acetaminophen (for electrochemical sensors), albumin, immunoglobulins, and lipids [12].
Cross-Reactivity Assessment: For multiplexed detection or specific identification, test against structurally similar molecules or non-target analytes that may be present in the sample (e.g., different bacterial species for pathogen sensors) [15].
Surface Characterization and Fouling Assessment
Comprehensive surface analysis is essential for understanding and mitigating fouling phenomena:
Pre- and Post-Exposure Surface Analysis: Characterize sensor surfaces before and after exposure to biological fluids using techniques including electrochemical impedance spectroscopy (EIS), scanning electron microscopy (SEM), and X-ray photoelectron spectroscopy (XPS) [15].
Quantitative Fouling Metrics: Calculate fouling parameters using electrochemical methods: Fouling Ratio = (Signal after exposure / Initial signal) × 100. Monitor signal drift over time during continuous exposure.
Antifouling Coating Efficacy: Evaluate antifouling strategies using fluorescence labeling of adsorbed proteins or quartz crystal microbalance with dissipation monitoring (QCM-D) for real-time adsorption quantification.
The Scientist's Toolkit: Essential Research Reagent Solutions
Table 3: Key Research Reagent Solutions for Addressing Translational Challenges
| Reagent/Category | Function | Example Applications |
|---|---|---|
| Biomimetic antifouling coatings | Reduce nonspecific adsorption | Zwitterionic polymers, polyethylene glycol derivatives, hydrophilic surfaces |
| Plasma/serum from diseased populations | Validate clinical relevance | Testing biosensors against real patient samples rather than spiked healthy samples |
| Stabilized collection devices | Preserve biomarker integrity | EDTA tubes with stabilizers for ctDNA, protease inhibitors for protein biomarkers |
| Matrix-matched calibration standards | Account for matrix effects | Calibrants in artificial or pooled natural matrices rather than pure buffer |
| Blocking agents | Minimize nonspecific binding | Bovine serum albumin, casein, synthetic blocking peptides |
| Signal amplification reagents | Enhance sensitivity in complex media | Enzymatic amplification, nanomaterials, redox mediators |
Workflow and Strategic Approaches
The transition from buffer to biological samples requires a systematic workflow that anticipates failure points and implements mitigation strategies at each development stage.
Case Studies: Lessons from Success and Failure
Success Story: Glucose Monitoring Systems
The glucose sensor represents the most successful commercial biosensor platform, with its triumph owing to several key factors: the enzyme glucose oxidase exhibits remarkable stability at physiological pH and temperature, high catalytic turnover provides signal amplification, and sophisticated electrode engineering minimizes interference from ascorbic acid, uric acid, and other electroactive compounds in blood [29]. Modern glucose sensors incorporate multiple membranes – an inner enzyme layer for specificity, an interference rejection layer to exclude electroactive compounds, and a biocompatible outer layer that controls glucose diffusion while limiting protein fouling [29]. This multi-layered approach to addressing matrix effects provides a template for other biosensor platforms.
The Challenge of Protein Biomarker Detection
In contrast to glucose monitoring, biosensors for protein biomarkers like cardiac troponin or PSA have faced significant translational hurdles. For instance, while numerous electrochemical immunosensors demonstrate picomolar detection limits for troponin in buffer, performance typically degrades to 100 pg mL⁻¹ or worse in serum or blood [28]. This degradation stems primarily from nonspecific binding of abundant proteins like albumin and immunoglobulins, which can constitute >99% of total protein content in samples, effectively masking the rare target biomarker [30]. Successful platforms increasingly employ dual-strategy approaches combining surface chemistries that minimize nonspecific binding with signal amplification methods that enhance specific signals above the background noise.
The journey from buffer to biological fluid remains fraught with challenges, but systematic assessment of failure points enables researchers to develop more robust biosensing platforms. Key strategies for success include: (1) early and continuous testing in relevant biological matrices rather than postponing these validation steps; (2) implementation of multi-faceted antifouling strategies that address both nonspecific binding and signal interference; (3) adoption of signal processing approaches that can distinguish specific signals from matrix-derived background; and (4) design of sample handling protocols that preserve biomarker integrity while minimizing complexity. By learning from both successful and failed translation attempts, and by embracing a holistic design philosophy that prioritizes robustness alongside sensitivity, the biosensing community can narrow the translational gap and deliver on the promise of point-of-care diagnostics for precision medicine.
Biosensors in Action: Methodologies and Breakthrough Applications Across Medicine
Electrochemical biosensors have revolutionized metabolic monitoring by converting biological information into quantifiable electrical signals such as current, voltage, or impedance [33] [34]. The driving force behind this field has been the global need for improved diabetes management, with 530 million adults affected worldwide and regular glucose monitoring being crucial for reducing the risks of hypo- and hyperglycemia [35]. These sensors combine a biological recognition element (enzymes, antibodies, DNA, or aptamers) with an electrochemical transducer, offering advantages including high sensitivity, rapid response times, portability, and cost-effectiveness [33] [36].
The evolution has progressed from single-analyte glucose sensors to multi-analyte platforms for continuous metabolic tracking [35]. This expansion is supported by advancements in nanomaterials, manufacturing technologies, and the integration of artificial intelligence, enabling these biosensors to provide comprehensive physiological profiles for personalized healthcare [33] [34]. The validation of these sensors in complex biological matrices—from blood and serum to sweat, saliva, and tears—remains a critical focus, ensuring their transition from laboratory innovation to reliable clinical and point-of-care applications [37] [35].
Performance Comparison of Electrochemical Biosensors
The performance of electrochemical biosensors varies significantly based on their transduction mechanism, biorecognition element, and target analyte. The following tables summarize the key performance metrics for various biosensor types and their applications in detecting different classes of analytes.
Table 1: Performance Comparison of Electrochemical Transduction Techniques
| Transduction Method | Measured Signal | Key Applications | Detection Limit | Advantages | Limitations |
|---|---|---|---|---|---|
| Amperometric | Current from redox reactions | Glucose, lactate, cholesterol, neurotransmitters [34] | Nanomolar to micromolar range [34] | High sensitivity, compatibility with miniaturization [34] | Signal can be affected by electrode fouling [33] |
| Potentiometric | Potential difference at zero current | Electrolytes (K⁺, Na⁺), pH, ion concentration [34] | Micromolar range [34] | Simple, compact, low power, resistant to interference [34] | Slower response time compared to amperometric sensors |
| Voltammetric | Current as a function of applied potential | Cancer biomarkers, cardiac biomarkers, heavy metals [34] | Picomolar to nanomolar (e.g., 27 pM for dopamine) [36] | Low-noise, capable of multi-analyte detection [34] | Can require complex data interpretation |
| Impedimetric (EIS) | Impedance change at electrode interface | Pathogen detection, antibody-antigen binding, cell growth [34] | High sensitivity for label-free detection [34] | Label-free, real-time monitoring [34] | Complex data representation (Nyquist plots) |
Table 2: Performance of Biosensors for Different Analytic Classes
| Analyte Class | Bioreceptor | Target Example | Linear Range | Detection Limit | Real Sample Tested |
|---|---|---|---|---|---|
| Proteins | Immunosensor | Prostate-Specific Antigen (PSA) [36] | 0 to 100 ng/mL [36] | 0.28 ng/mL (8.78 fM) [36] | Not specified |
| Proteins | Immunosensor | Tau-441 (Alzheimer's) [38] | 1 fM – 1 nM [38] | 0.14 fM [38] | Human serum [38] |
| Neurotransmitters | Non-enzymatic | Dopamine [36] | 50 pM – 15 nM [36] | 27 pM [36] | Not specified |
| Toxins | Aptasensor | Endotoxin [36] | 1 fg/mL – 100 ng/mL [36] | 0.55 fg/mL [36] | Not specified |
| Metabolites (Sweat) | Enzyme (Lactate Oxidase) | Lactate [36] | Not specified | 0.083 mmol/L [36] | Human sweat [36] |
Experimental Protocols for Biosensor Validation
Validating biosensor performance in real biological samples requires rigorous and standardized experimental protocols. Key methodologies for different sensor types and validation steps are detailed below.
Fabrication of a Wearable Sweat Lactate Sensor
Objective: To develop a flexible electrochemical biosensor for monitoring lactate in human sweat [36].
- 1. Electrode Modification: Screen-printed carbon electrodes (SPCEs) serve as the base platform. A large-area, ordered poly(3,4-ethylenedioxythiophene) (PEDOT) film is synthesized via interfacial polymerization and deposited onto the SPCE to enhance conductivity and provide a stable substrate.
- 2. Enzyme Immobilization: Lactate oxidase (LOX) is immobilized onto the PEDOT-modified electrode surface. This is achieved through a cross-linking method, typically using glutaraldehyde or a similar cross-linker, which traps the enzyme in a polymer matrix (e.g., polyvinyl alcohol) to ensure stability and reusability.
- 3. Calibration: The sensor is calibrated using standard lactate solutions in a physiologically relevant buffer (e.g., phosphate buffer saline, pH 7.4). Amperometric measurements (current response at a fixed potential) are recorded at varying lactate concentrations to establish a calibration curve.
- 4. Real-Sample Validation: The sensor is integrated into a wearable patch and deployed for on-body testing. Sweat is induced through exercise, and the lactate concentration measured by the sensor is compared against a gold-standard method (e.g., high-performance liquid chromatography) to validate accuracy.
Electrochemical Immunosensor for Protein Biomarkers
Objective: To create a highly sensitive immunosensor for the detection of Tau-441 protein in human serum for Alzheimer's disease diagnosis [38].
- 1. Electrode Functionalization: A commercial 3D graphene foam (GF) electrode is carboxyl-functionalized (COOH-GF) via π–π non-covalent interactions to preserve conductivity while introducing carboxyl groups for biomolecule conjugation.
- 2. Antibody Immobilization: Anti-Tau antibodies are covalently immobilized onto the COOH-GF surface using EDC/NHS (1-Ethyl-3-(3-dimethylaminopropyl)carbodiimide/N-Hydroxysuccinimide) carbodiimide chemistry. This reaction activates the carboxyl groups, forming stable amide bonds with primary amines on the antibodies.
- 3. Immunoassay and Detection: The functionalized electrode is incubated with samples (standard solutions or diluted human serum). After washing, the binding of Tau-441 is quantified using Differential Pulse Voltammetry (DPV) in the presence of a redox probe (e.g., [Fe(CN)₆]³⁻/⁴⁻). The charge transfer resistance increases proportionally with the amount of bound antigen.
- 4. Specificity Testing: The sensor's selectivity is validated by testing against a panel of potential interferents, including other proteins like tau-217, tau-181, amyloid beta, and bovine serum albumin (BSA) [38].
General Procedure for Sensor Calibration and Characterization
Objective: To standardize the assessment of key biosensor performance parameters.
- 1. Selectivity/Interference Study: The sensor's response to the target analyte is compared to its response against structurally similar compounds or common interferents found in the biological matrix (e.g., ascorbic acid, uric acid, acetaminophen in blood).
- 2. Limit of Detection (LOD) and Quantification (LOQ): The LOD is typically calculated as 3.3 × σ/S, and LOQ as 10 × σ/S, where σ is the standard deviation of the blank signal and S is the slope of the calibration curve.
- 3. Reproducibility and Stability: The intra-assay and inter-assay precision (relative standard deviation, RSD) are determined from multiple measurements. Long-term stability is assessed by storing the sensor under defined conditions and periodically testing its response over days or weeks.
Signaling Pathways and Experimental Workflows
The core functionality of electrochemical biosensors relies on specific signaling pathways and logical workflows, from molecular recognition to data output. The following diagrams visualize these critical processes.
Diagram 1: The core pathway of an electrochemical biosensor shows the conversion of a biological event into a quantifiable electrical signal.
Diagram 2: The workflow for developing and validating an electrochemical biosensor for use in real biological samples emphasizes testing in complex matrices.
The Scientist's Toolkit: Essential Research Reagents and Materials
The advancement and fabrication of high-performance electrochemical biosensors rely on a suite of specialized materials and reagents. The table below details key components and their functions in sensor development.
Table 3: Key Reagent Solutions for Electrochemical Biosensor Research
| Material/Reagent | Function | Example Use Case |
|---|---|---|
| Gold Nanoparticles (AuNPs) | Signal amplification; enhance electron transfer; immobilization platform [36]. | Used in a PSA immunosensor to form a conductive gold nanofiber network on SPCE [36]. |
| Graphene & Carbon Nanotubes | High surface area; excellent electrical conductivity; mechanical strength [36]. | Fe/N-doped graphene used for dopamine detection to improve electron transfer and expose active sites [36]. |
| EDC/NHS Chemistry | Cross-linker for covalent immobilization of biomolecules onto carboxylated surfaces [38]. | Used to anchor anti-Tau antibodies onto carboxyl-functionalized 3D graphene electrodes [38]. |
| Ion-Selective Membranes | Provide selectivity for specific ions in potentiometric sensors [34]. | Key component of ion-selective electrodes (ISEs) for measuring electrolytes like Na⁺, K⁺ in blood [34]. |
| Conductive Polymers (e.g., PEDOT) | Flexible, conductive substrates for wearable sensors; biocompatible [36]. | Served as a matrix for immobilizing lactate oxidase in a flexible sweat sensor [36]. |
| Enzymes (e.g., Glucose Oxidase) | Biorecognition element; provides high specificity for catalytic biosensors [37] [35]. | The core of most commercial glucose biosensors, catalyzing the oxidation of glucose [37]. |
| Aptamers | Synthetic bioreceptors with high specificity and stability; alternative to antibodies [36]. | Employed in a sandwich-type electrochemical aptasensor for ultrasensitive endotoxin detection [36]. |
Future Perspectives: AI Integration and Multimodal Sensing
The future of electrochemical biosensors lies in their convergence with advanced data science and materials engineering. Artificial Intelligence (AI) and Machine Learning (ML) are now being deployed to manage the complex, multidimensional data these sensors produce, enhancing sensitivity and specificity by identifying patterns imperceptible to traditional analysis [33] [34]. AI-powered systems facilitate early detection, personalized treatment plans, and real-time health monitoring, as seen in systems that classify pathogens with over 85% accuracy [39] [34].
Simultaneously, the exploration of novel materials like covalent organic frameworks (COFs) and liquid metal composites is paving the way for a new generation of wearables [38] [36]. These materials offer high surface areas, tunable pores, and intrinsic stretchability, which are critical for comfortable, long-term metabolic tracking. The ultimate goal is the development of fully integrated, self-powered, and multimodal sensing systems that can continuously track a panel of metabolic markers (e.g., glucose, lactate, cortisol) from easily accessible biofluids like sweat, providing a holistic view of an individual's metabolic health in real-time [37] [35].
Cancer remains a leading cause of mortality worldwide, with early detection being a critical factor in improving patient survival rates [40]. The detection of protein biomarkers such as Prostate-Specific Antigen (PSA) and α-Fetoprotein (AFP) in biological fluids provides a promising pathway for non-invasive cancer diagnosis and monitoring [41] [42]. Conventional detection methods like enzyme-linked immunosorbent assay (ELISA), polymerase chain reaction (PCR), and computed tomography (CT) scans, while effective, often suffer from limitations including high cost, time-consuming procedures, and the need for sophisticated laboratory infrastructure [40] [43]. These challenges are particularly acute in resource-limited settings, where the majority of cancer deaths occur [40].
In response to these limitations, optical and plasmonic biosensing technologies have emerged as powerful analytical tools capable of rapid, sensitive, and label-free detection of cancer biomarkers [44] [45]. These biosensors translate biomolecular binding events into quantifiable optical signals through various mechanisms, including surface plasmon resonance (SPR), localized surface plasmon resonance (LSPR), fluorescence, and colorimetric detection [41] [45]. The integration of nanomaterials and advanced plasmonic structures has further enhanced biosensor performance, enabling the detection of clinically relevant biomarkers at ultralow concentrations in complex biological samples such as blood, serum, and cerebrospinal fluid [46] [45] [42]. This review provides a comprehensive comparison of emerging optical and plasmonic platforms, detailing their operational principles, experimental validation, and performance in detecting key cancer biomarkers like PSA and AFP within real biological matrices.
Performance Comparison of Optical and Plasmonic Biosensing Platforms
The performance of biosensing platforms is primarily evaluated based on sensitivity, limit of detection (LOD), and linear dynamic range. These parameters determine a sensor's ability to detect clinically relevant concentrations of biomarkers in complex biological samples. The following tables provide a comparative analysis of various optical and plasmonic platforms for detecting PSA and AFP.
Table 1: Performance Comparison of Biosensors for α-Fetoprotein (AFP) Detection
| Sensing Platform | Detection Mechanism | Linear Range | Limit of Detection (LOD) | Real Sample Tested |
|---|---|---|---|---|
| Hybridization Chain Reaction (HCR) Assembly | Colorimetric (TMB oxidation) | 0.1 – 50 ng/mL | 1.95 pg/mL (instrument)5 pg/mL (naked eye) | Not Specified [41] |
| AuNPs/Bi₂Se₃ Nanosheets | Colorimetric (Catalytic switching) | 1 ng/mL – 10 μg/mL | 39 pg/mL | Not Specified [41] |
| Graphene Oxide (GO) co-adsorbed with HRP and anti-IgG | Signal-amplified Immunosensing | Information Missing | Information Missing | Information Missing [41] |
Table 2: Performance Comparison of Biosensors for Prostate-Specific Antigen (PSA) and Other Cancer Biomarkers
| Sensing Platform | Target Analyte | Sensitivity | Limit of Detection (LOD) | Real Sample Tested |
|---|---|---|---|---|
| Dual-channel SPR with fPSA@Au nanoparticles | Free PSA | Linear range: 0.010 – 0.40 ng/mL | Information Missing | Serum [42] |
| LSPR with Au nanoparticles conjugated with anti-PSA | PSA | Calibration Sensitivity: 43.75 nm/(ng/mL) | Information Missing | Serum [42] |
| BK7/BaTiO₃/Ag/Black Phosphorus | Cancer Cells (via RI) | 334 deg/RIU (General)271.25 – 290.714 deg/RIU (Specific Cells) | Information Missing | Six cancer cell lines (Jurkat, HeLa, PC-12, MDA-MB-231, MCF-7, Basal) [40] |
| BK7/ZnO/Ag/Si₃N₄/WS₂ | Blood Cancer Cells (Jurkat) | 342.14 deg/RIU | Information Missing | Blood cancer, cervical cancer, and skin cancer cells [42] |
| Figure-eight-shaped MXene/BP/Graphene Metasurface | Protein Biomarkers | 395 GHz/RIU | Information Missing | Neurological disorder biomarkers [46] |
Table 3: Comparison of Fundamental Biosensing Mechanisms and Their Characteristics
| Biosensing Mechanism | Key Principle | Advantages | Common Transducer Materials |
|---|---|---|---|
| Surface Plasmon Resonance (SPR) | Collective oscillation of electrons at a metal-dielectric interface; resonance angle shifts with refractive index change [40] [45]. | Label-free, real-time monitoring, high sensitivity. | Gold (Au), Silver (Ag), BaTiO₃, 2D materials (Graphene, BP) [40] [42]. |
| Localized Surface Plasmon Resonance (LSPR) | Coherent oscillation of conduction electrons in metal nanostructures; LSPR peak shift with local dielectric environment change [45]. | Enhanced local electromagnetic field, label-free, simpler instrumentation than SPR. | Gold Nanoparticles (AuNPs), Silver Nanoparticles (AgNPs) [45]. |
| Colorimetric | Measurement of visible color change due to aggregation of nanoparticles or catalytic reaction [41] [45]. | Simplicity, low cost, potential for naked-eye detection without complex equipment. | AuNPs, AgNPs, Catalytic Nanocomposites (e.g., AuNPs/Bi₂Se₃) [41]. |
| Fluorescence | Measurement of light emission from excited fluorophores; intensity changes with biomarker binding [47]. | High sensitivity, multiplexing capability. | Quantum Dots, Fluorescent Dyes [47]. |
Experimental Protocols for Biosensor Validation
To ensure the reliability and clinical relevance of biosensing data, rigorous experimental protocols must be followed. These procedures cover the fabrication of the sensor chip, its functionalization for specific biomarker capture, the actual measurement process, and subsequent data analysis.
Sensor Fabrication and Functionalization
The foundation of a high-performance biosensor is a meticulously fabricated and functionalized sensing surface.
- Prism-Coated Multilayer Fabrication (for SPR/LSPR): A common method involves using a BK7 glass prism as a coupling element. Thin films are sequentially deposited on the prism. For instance, a BaTiO₃ layer (e.g., 6 nm) can be deposited first to enhance field confinement, followed by a silver (Ag) layer (e.g., 36 nm) as the primary plasmonic material, and finally a black phosphorus (BP) layer (e.g., 0.7 nm) to enhance biomolecular interaction. Each layer's thickness is optimized using frameworks like the Transfer Matrix Method (TMM) to maximize performance metrics such as sensitivity and quality factor [40].
- Nanomaterial Synthesis for Colorimetric Sensors: For a catalytic colorimetric sensor, materials like Bi₂Se₃ nanosheets may be synthesized and then decorated with gold nanoparticles (AuNPs). This creates a nanocomposite (Au/Bi₂Se₃) with high catalytic activity for reactions like the reduction of 4-nitrophenol, a signal that can be "switched off" upon binding of the target biomarker [41].
- Surface Biofunctionalization: The transducer surface must be modified to capture the target biomarker specifically. This is typically achieved by immobilizing a capture antibody specific to the target antigen (e.g., anti-AFP or anti-PSA) onto the sensor surface. Immobilization can occur through physical adsorption, covalent bonding, or via linker molecules like streptavidin-biotin interactions [41] [42]. This step is critical for ensuring the sensor's specificity.
Measurement and Detection Protocols
The protocol for measuring biomarker concentration varies depending on the detection mechanism.
Angular Interrogation SPR Measurement:
- The functionalized sensor chip is integrated into a microfluidic system to control the flow of samples.
- P-polarized light from a monochromatic source (e.g., a laser) is directed through the prism at a range of incident angles.
- The intensity of reflected light is measured by a photodetector. A sharp dip in reflectivity at a specific SPR angle is observed.
- A baseline reading is established by flowing a buffer solution over the sensor.
- The sample (e.g., serum spiked with the biomarker or a clinical sample) is injected over the sensor surface.
- The binding of biomarkers to the capture probes causes a local increase in the refractive index (RI), leading to a measurable shift in the SPR angle.
- The angular shift (Δθ) is recorded in real-time and is proportional to the biomarker concentration [40] [42].
Colorimetric Detection Protocol:
- The antibody-functionalized nanomaterial (e.g., Au/Bi₂Se₃) is incubated with the sample containing the target biomarker [41].
- Binding of the biomarker to the surface often alters the catalytic activity of the nanomaterial or causes aggregation of metal nanoparticles.
- A substrate solution (e.g., TMB/H₂O₂ for HRP-based systems or 4-NP/NaBH₄ for catalytic sensors) is added.
- The resulting color change or intensity is quantified using a UV-Vis spectrophotometer to measure absorbance at a specific wavelength. The change in absorbance is correlated with the biomarker concentration [41].
Data Processing and Analysis
For advanced sensors, particularly those generating complex datasets, sophisticated data analysis is employed.
- Machine Learning Integration: Sensor responses, such as transmission spectra at different refractive indices or biomarker concentrations, can be used to train machine learning models. For example, Bayesian Ridge Regression has been demonstrated to effectively predict refractive index variations (R² ≈ 86%) and angular dependencies (R² ≈ 96%), enhancing the accuracy and robustness of the quantification [46].
- Real-Time Binding Kinetics: SPR sensors directly generate sensorgrams (response vs. time), which can be analyzed to extract association and dissociation rate constants (kₐ and kḍ), providing insights into the affinity and kinetics of biomolecular interactions [45].
The following diagram illustrates the core workflow and signal transduction principles of an SPR biosensor.
The Scientist's Toolkit: Essential Research Reagents and Materials
The development and validation of high-performance optical biosensors rely on a specific set of advanced materials and reagents. The table below details key components, their functions, and examples of their application in the cited research.
Table 4: Essential Research Toolkit for Optical and Plasmonic Biosensor Development
| Material/Reagent | Function in Biosensor | Application Example |
|---|---|---|
| BK7 Glass Prism | Optical coupler that enables excitation of surface plasmons in the Kretschmann configuration. | Used as the base coupling element in multiple SPR sensors [40] [42]. |
| Silver (Ag) and Gold (Au) | Plasmonic metals that support surface plasmon waves. Ag offers higher sensitivity; Au provides better stability and biocompatibility. | Ag used as the primary plasmonic layer in a BaTiO₃/Ag/BP sensor [40]. |
| 2D Materials (Black Phosphorus, Graphene, TMDCs like WS₂) | Enhance sensitivity and field confinement due to high surface area and strong light-matter interactions. Promote biomolecule adsorption. | BP used to enhance biomolecular interaction [40]. WS₂ identified as the top-performing 2D material in a ZnO/Ag/Si₃N₄/WS₂ sensor [42]. |
| High-Index Dielectrics (BaTiO₃, ZnO, Si₃N₄) | Improve electric field confinement and reduce reflectance curve width, leading to higher sensitivity and detection accuracy. | BaTiO₃ used to enhance optical confinement and sensitivity [40]. ZnO and Si₃N₄ used in a multilayer sensor for cancer cell detection [42]. |
| Capture Antibodies (e.g., anti-AFP, anti-PSA) | Biological recognition element that provides specificity by binding to the target biomarker. | Immobilized on sensor surfaces for specific capture of AFP and PSA [41] [42]. |
| Enzyme Labels (e.g., Horseradish Peroxidase - HRP) | Used in signal amplification strategies. Catalyzes a chromogenic reaction to produce a measurable color change. | Used in a colorimetric AFP biosensor based on HCR assembly and TMB oxidation [41]. |
| Chromogenic Substrates (e.g., TMB, ABTS) | Produce a visible color change when oxidized by an enzyme label like HRP, enabling colorimetric detection. | TMB used for instrumental and visual detection of AFP [41]. |
Optical and plasmonic biosensing platforms represent a significant advancement in the detection of cancer biomarkers, offering performance characteristics that are increasingly competitive with, and in some aspects superior to, conventional methods. The integration of novel materials like 2D semiconductors and high-index dielectrics, coupled with sophisticated structural designs, has pushed the sensitivity of these sensors to new heights, enabling the detection of subtle refractive index changes associated with low biomarker concentrations. The ongoing integration of machine learning for data analysis further enhances their accuracy and potential for real-world application.
Validation in complex biological matrices remains the critical benchmark for clinical translation. The promising results demonstrated by various SPR, LSPR, and colorimetric sensors in detecting PSA, AFP, and entire cancer cells in serum and other samples underscore the viability of this technology. Future research will likely focus on enhancing multiplexing capabilities for parallel detection of biomarker panels, improving sensor stability and reproducibility for point-of-care use, and conducting larger-scale clinical validation studies. As these platforms continue to mature, they hold the strong potential to become indispensable tools in the clinical arsenal for the early diagnosis, prognosis, and monitoring of cancer.
Lab-on-a-Chip (LoC) technology represents a pioneering amalgamation of fluidics, electronics, optics, and biosensors that performs various laboratory functions on a miniaturized scale, typically on a single chip ranging from millimeters to a few square centimeters [48]. These systems process small volumes of fluids, typically from 100 nL to 10 μL, consolidating multiple laboratory processes including sampling, pretreatment, chemical reactions, separation, detection, and data analysis onto a single platform [48]. The concept of miniaturizing laboratory processes began with the development of microelectromechanical systems (MEMS) in the 1960s, with the first actual LoC created in 1979 at Stanford University for gas chromatography [49] [50]. The field gained prominent recognition after the conceptual work on miniaturized total analysis systems (μTAS) by Manz et al. in 1990, with a groundbreaking advancement achieved in 1993 with the pioneering discovery of on-chip capillary electrophoresis [48].
The fundamental principle behind LoC technology is microfluidics—the science of manipulating and controlling fluids at a microscale, typically involving channels with dimensions ranging from tens to hundreds of micrometers [50]. At this scale, fluid behavior differs significantly from macro-scale flows, with laminar flow dominating and parameters like surface forces, shear forces, diffusion, and viscosity becoming crucial while gravitational forces become less significant [48]. This technology has evolved from a novel concept to a powerful tool with broad applications across diagnostics, drug discovery, and environmental monitoring, leveraging the principles of microfluidics and integration of various laboratory functions to offer compact, efficient, and versatile solutions for rapid analysis [50].
Key Materials and Fabrication Techniques
Materials for LoC Devices
The selection of materials for LoC devices significantly influences their intrinsic properties, fabrication methods, and overall functionality. Key considerations include flexibility, air permeability, electrical conductivity, solvent compatibility, optical transparency, and biocompatibility [48].
Table 1: Comparison of Key Materials Used in Lab-on-a-Chip Devices
| Material | Advantages | Limitations | Primary Applications |
|---|---|---|---|
| Silicon | Well-characterized surface chemistry; chemically inert; high design flexibility [48] | High production cost; optically opaque (except IR); electrically conductive [49] [48] | Nucleic acid detection via integrated PCR; organ-on-chip platforms for drug toxicity assessment [48] |
| Glass | Low nonspecific adsorption; high biocompatibility; optically transparent; thermally stable [49] [48] | Requires high bonding temperatures; challenging manufacturing [48] | Point-of-care diagnostics; cell-based assays; nucleic acid analysis; drug delivery studies [48] |
| PDMS | Biocompatible; optically transparent; gas-permeable; flexible; rapid prototyping [48] [51] | Hydrophobic; absorbs hydrophobic analytes; scalability issues; gas permeability can be problematic [52] [48] [51] | Organ-on-chip models; blood flow models; biological applications requiring oxygen/carbon dioxide exchange [48] [51] |
| Thermoplastics (PMMA, PS, COC) | Transparent; good chemical resistance; compatible with various fabrication methods [49] [51] | Variable chemical resistance depending on polymer; requires specialized fabrication [49] | Mass-produced microfluidic devices; point-of-care diagnostics [51] |
| Paper | Low cost; uses capillary action; portable; disposable [49] [48] | Limited precision; simpler fluidic operations only [51] | Low-cost diagnostics for resource-limited settings; urine metabolite detection [49] [48] |
Fabrication Techniques
Various fabrication methods have been developed to create microfluidic devices, each with distinct advantages and limitations:
Soft Lithography for PDMS: This technique involves creating a mold (often via photolithography) and casting PDMS polymer against it. The process includes mixing PDMS with a crosslinker (typically 10:1 ratio), degassing in vacuum, casting over the mold, curing at room temperature for ≈20 hours, peeling off, post-baking at ≈80°C for complete cross-linking, punching inlet/outlet ports, and bonding to glass or other substrates via oxygen plasma activation [51]. While excellent for prototyping, this method faces scalability challenges for mass production [52] [53].
CNC Machining of PMMA: This subtractive method involves converting design files (GDSII) to DXF format, then to 3D STEP files for CNC programming. PMMA slabs (≈3 mm thick) are milled to create microchannels, followed by bonding to flat PMMA (≈1 mm thick) using chemically assisted thermal bonding at ≈55°C with a temperature-controlled pneumatic press [51]. This offers flexibility for rapid prototyping but can be time-consuming and produce material waste [51].
Injection Molding: This method is advantageous for mass production, with high throughput and excellent replication fidelity. However, it comes with high initial mold costs and longer turnaround times for mold fabrication, working best for feature sizes around 100 micrometers or larger [52] [53].
3D Printing: An additive manufacturing technique that allows for high design flexibility and rapid prototyping without cleanroom facilities. Recent advances enable fabrication of devices with bio-compatible materials. However, it typically suffers from resolution limitations, is often time-consuming, and is not currently suitable for low-cost, high-volume manufacturing [52] [53].
Xurography: This cost-effective method uses a commercial cutting plotter to pattern adhesive films to create microchannels. It offers rapid prototyping suitable for educational settings but has limitations in feature size and cannot create complex 3D microstructures [51].
Lab-on-Printed Circuit Board (Lab-on-PCB): This emerging approach leverages established PCB fabrication techniques to seamlessly integrate microfluidics, sensors, and electronic components. It offers excellent potential for scalable manufacturing and has gained significant academic and industrial interest in recent years [53].
Table 2: Comparison of Microfluidic Chip Fabrication Techniques
| Fabrication Method | Resolution | Scalability | Cost | Development Time | Key Applications |
|---|---|---|---|---|---|
| Soft Lithography (PDMS) | High (sub-μm) | Low | Low for prototyping | Rapid prototyping | Biological applications; organ-on-chip [51] |
| CNC Machining (PMMA) | Medium (tens of μm) | Medium | Medium | Medium | Rapid prototyping; custom devices [51] |
| Injection Molding | Medium (≈100 μm) | High | High initial cost | Long for mold creation | Mass production of commercial devices [52] [53] |
| 3D Printing | Low to Medium (50-100 μm) | Low | Low to Medium | Rapid | Custom designs; prototyping [52] [53] |
| Xurography | Low (hundreds of μm) | Medium | Very Low | Very rapid | Educational use; proof-of-concept [51] |
| Lab-on-PCB | High (μm scale) | High | Low in volume | Medium | Integrated sensing applications [53] |
Integration of Sample Preparation and Analysis
Microfluidic Components for Sample Processing
LoC systems incorporate various microfluidic components that enable complete sample-to-answer functionality:
Sample Preparation Modules: These include structures for sample collection, filtration, concentration, and dilution, ensuring the sample is properly prepared for analysis [50]. Examples include filters to remove particulates, dialysis membranes for separation, and magnetic bead-based capture systems for target concentration [51].
Microreactors: Miniaturized reactors on the chip facilitate biochemical reactions such as PCR, enzyme assays, and immunoassays, allowing for rapid amplification and detection of target molecules [50]. The high surface-to-volume ratio in microchannels enhances reaction kinetics and heat transfer [54].
Separation Units: Techniques like electrophoresis, chromatography, and dielectrophoresis are employed within the chip to separate and purify analytes based on their physical and chemical properties [50].
Detection Systems: LoC devices integrate various detection mechanisms including optical (fluorescence, absorbance, chemiluminescence), electrochemical (measuring electrical signals from redox reactions), and magnetic detection (using magnetic particles and sensors) [50].
The following diagram illustrates a generalized workflow for biosensor validation in Lab-on-a-Chip systems:
Generalized Workflow for Biosensor Validation in Lab-on-a-Chip Systems
Experimental Protocols for Biosensor Validation
Validating biosensors in real biological samples requires carefully designed experimental protocols that account for matrix effects, interfering substances, and the complexity of biological fluids. The following section outlines key methodologies cited in recent literature:
CRISPR/Cas-based Detection Integrated with Microfluidics: A CRISPR/Cas13a-based amplification method was integrated into a mobile phone microscopy on a PDMS chip, detecting as low as 100 copies per μL of SARS-CoV-2 RNA in 30 minutes [49]. The experimental protocol involves: (1) Sample loading into the microfluidic device; (2) On-chip nucleic acid extraction and purification; (3) Isothermal amplification of target sequences; (4) CRISPR/Cas13a reaction with specific guide RNAs; (5) Fluorescent signal generation upon target recognition; (6) Detection via mobile phone microscopy [49]. This approach demonstrates the potential for ultra-sensitive, specific detection of infectious diseases with rapid turnaround times.
Electrochemical Biosensing on PCB Platforms: Lab-on-PCB technology has been employed for electrochemical detection of biomarkers. The typical protocol includes: (1) Fabrication of electrodes directly on the PCB substrate using standard lithography; (2) Surface modification with capture probes (antibodies, aptamers, or nucleic acids); (3) Introduction of sample into the microfluidic chamber; (4) Incubation to allow target binding; (5) Electrochemical measurement (amperometric, potentiometric, or impedance-based); (6) Signal processing with integrated electronics [53]. This approach leverages the established PCB manufacturing infrastructure for scalable production while enabling sensitive detection with minimal instrumentation.
Organ-on-a-Chip for Drug Response Validation: Microfluidic systems designed to mimic human organs provide a platform for validating biosensors in physiologically relevant environments. The experimental workflow for a liver-on-a-chip model includes: (1) Fabrication of PDMS devices with appropriate microchannel architecture; (2) Surface modification with extracellular matrix proteins; (3) Seeding of hepatocytes in the main chamber; (4) Establishment of perfusion to mimic blood flow; (5) Introduction of drug compounds through the microfluidic network; (6) Real-time monitoring of metabolic responses using integrated biosensors; (7) Analysis of metabolites in effluent using off-chip methods (e.g., mass spectrometry) for validation [55]. These systems enable the study of drug metabolism and toxicity with better physiological relevance than conventional 2D cultures.
Performance Comparison with Traditional Methods
Analytical Performance Metrics
LoC technologies demonstrate distinct advantages over conventional laboratory methods across multiple performance parameters:
Table 3: Performance Comparison Between Lab-on-a-Chip and Traditional Methods
| Parameter | Lab-on-a-Chip Technology | Traditional Methods |
|---|---|---|
| Analysis Time | Minutes to hours [50] | Hours to days [50] |
| Sample Volume | Microliters to nanoliters [48] | Milliliters typically required [50] |
| Sensitivity | High (e.g., 100 copies/μL for SARS-CoV-2) [49] | Variable, often lower than LoC methods [50] |
| Portability | Compact and portable devices [50] | Laboratory-based equipment requiring specialized facilities [50] |
| Automation | Automated processes with minimal manual intervention [50] [48] | Extensive manual handling of samples [50] |
| Cost per Test | Potentially lower due to reduced reagent consumption [52] | Higher due to reagent volumes and labor [52] |
| Multiplexing Capability | High - multiple analyses on single chip [50] | Limited without multiple instruments |
Thermal Performance in Microfluidic DNA Amplification
The thermal characteristics of different chip materials significantly impact their performance in applications like polymerase chain reaction (PCR). A comparative study of various microfluidic chips revealed substantial differences in heating and cooling rates:
Table 4: Thermal Performance of Different Microfluidic Chip Materials for PCR Applications
| Chip Material | Fabrication Method | Heating Rate (°C/s) | Cooling Rate (°C/s) | Suitable Applications |
|---|---|---|---|---|
| Silicon-Glass | Anodic bonding | 8.7 | 6.0 | High-performance PCR [51] |
| PMMA | CNC milling | 5.4 | 3.6 | Moderate performance PCR [51] |
| PDMS-Glass | Soft lithography | 4.5 | 2.3 | Biological applications not requiring rapid cycling [51] |
| PMMA | Injection molding (thin-walled) | Similar to Si-glass | Similar to Si-glass | Commercial PCR systems (e.g., Cepheid) [51] |
For applications where thermal cycling is challenging, isothermal amplification methods (e.g., LAMP, RPA) provide alternatives that eliminate the need for rapid temperature changes and can achieve high performance even with lower thermal conductivity materials [51].
The Scientist's Toolkit: Essential Research Reagent Solutions
Successful development and validation of biosensors in LoC systems requires carefully selected reagents and materials. The following table outlines key solutions used in the field:
Table 5: Essential Research Reagent Solutions for LoC Biosensor Validation
| Reagent/Material | Function | Application Examples | Key Considerations |
|---|---|---|---|
| PDMS Sylgard 184 | Elastomer for device fabrication | Rapid prototyping; organ-on-chip models [51] | 10:1 base to crosslinker ratio; oxygen plasma treatment for bonding [51] |
| CRISPR/Cas Enzymes | Nucleic acid detection | SARS-CoV-2 RNA detection [49] | Requires specific guide RNAs; isothermal conditions [49] |
| Magnetic Beads | Target concentration and separation | Nucleic acid extraction; protein purification [51] | Surface functionalization; size uniformity; magnetic responsiveness [51] |
| Extracellular Matrix Proteins | Surface modification for cell culture | Organ-on-chip models; cell-based assays [52] [48] | Biocompatibility; concentration; coating uniformity [52] |
| Fluorescent Labels | Signal generation for detection | Real-time PCR; immunoassays [50] | Excitation/emission spectra; photostability; compatibility with detection system [50] |
| Specific Antibodies/Aptamers | Recognition elements | Protein detection; pathogen identification [56] | Affinity; specificity; stability in microfluidic environment [56] |
Advanced Integration and Signaling Pathways
The integration of multiple analytical functions and detection modalities represents the cutting edge of LoC development. The following diagram illustrates the signaling pathways and integration framework for a multi-modal LoC biosensor:
Multi-Modal Detection Pathways in Integrated LoC Systems
Integration with Advanced Technologies
Recent advances in LoC systems have focused on integration with complementary technologies to enhance functionality:
Artificial Intelligence and Machine Learning: AI/ML algorithms enhance diagnostic accuracy and reliability in LoC systems, enabling predictive analytics for disease outbreaks, treatment responses, and complications. These technologies automate workflows from sample handling to data interpretation, reducing human intervention and error [48]. For example, machine learning algorithms can analyze complex electrochemical impedance spectra to distinguish between similar disease states with higher accuracy than traditional analytical methods [54].
Wearable and Implantable LoC Systems: Recent innovations have led to the development of wearable and implantable LoC biosensors for continuous health monitoring. These devices integrate microfluidics, nanomaterials, wireless communication, and artificial intelligence to enable real-time tracking of physiological parameters in non-clinical settings [54]. Examples include skin-mounted patches for sweat biomarker analysis, smart textiles, and implantable devices for continuous glucose monitoring [54].
Internet of Things (IoT) Connectivity: Modern LoC systems increasingly incorporate wireless communication modules like Bluetooth Low Energy (BLE), Near Field Communication (NFC), and Radio Frequency Identification (RFID) to enable real-time data transmission to smartphones or cloud platforms for remote monitoring and analysis [54]. This connectivity supports continuous health monitoring and data-driven decision-making in both clinical and home settings.
Lab-on-a-Chip technology has evolved from a conceptual framework to a powerful platform that integrates sample preparation and analysis on miniaturized devices. Through continued advancements in materials science, fabrication techniques, and system integration, LoC devices now offer capabilities that surpass traditional laboratory methods in speed, sensitivity, and portability. The validation of biosensors in real biological samples remains a critical challenge, addressed through innovative approaches such as organ-on-a-chip models, CRISPR-based detection, and electrochemical sensing on scalable platforms like Lab-on-PCB.
Despite these advancements, challenges remain in standardization, manufacturing scalability, and seamless integration of all necessary components for true sample-to-answer functionality. Future directions point toward increased adoption of AI-driven analytics, wearable and implantable form factors, and multi-modal sensing approaches. As these technologies mature, Lab-on-a-Chip systems are poised to transform diagnostics, drug discovery, and personalized medicine by providing robust, validated biosensing capabilities in compact, accessible formats.
Prostate cancer remains one of the most prevalent malignancies in men globally, with projections indicating that new cases will nearly double from 1.4 million in 2020 to approximately 2.9 million by 2040 [57]. The current diagnostic ecosystem relies heavily on prostate-specific antigen (PSA) testing, which—despite its contribution to earlier detection—suffers from significant limitations including false positives, overdiagnosis, and an reported detection rate of only 10-20% of prostate cancers [57]. Conventional diagnostic methods including immunoradiometric assays (IRMAs), ELISA, and chemiluminescent immunoassays demand complex infrastructure, extended processing times, and costly equipment, hindering rapid clinical decision-making [57] [58].
In response to these challenges, innovative biosensing technologies have emerged, offering potential solutions for point-of-care testing and improved diagnostic accuracy. This case study provides a clinical validation assessment of a novel bioelectric impedance-based biosensor that integrates Molecular Identification through Membrane Engineering (MIME) with real-time cell analysis, comparing its performance against established and emerging diagnostic alternatives [57].
Fundamental Operating Principles
The featured bioelectric impedance biosensor employs a unique approach that combines living cell engineering with impedance sensing technology. The core methodology involves the Bioelectric Recognition Assay (BERA) coupled with Molecular Identification through Membrane Engineering (MIME), a technique designed to enhance cellular recognition specificity through electroinsertion of target-directed biomolecules [57] [59].
The system utilizes Vero cells electroinserted with anti-PSA antibodies, creating living biosensing elements that specifically recognize and bind to PSA antigens. When PSA binding occurs, it triggers alterations in the membrane potential of these engineered cells, which is detected as a measurable change in electrical impedance using the xCELLigence real-time cell analysis platform [57]. Experimental evidence confirms that electroinserted receptors remain functionally intact and properly oriented, preserving their high-affinity binding capability for target analytes [57].
Key Technological Differentiators
This biosensing platform offers several distinct advantages over conventional detection methods. The system provides rapid results within one minute of sample application, significantly faster than standard IRMA protocols [57]. The label-free, continuous monitoring capability enables real-time observation of molecular interactions without requiring secondary detection reagents or washing steps [57]. Furthermore, the living cell component maintains natural biological recognition mechanisms while being specifically engineered for enhanced target specificity through antibody electroinsertion [60].
Table 1: Core Technology Components of the Bioelectric Impedance Biosensor
| Component | Specification | Function |
|---|---|---|
| Cell Line | Vero cells | Living biosensing platform providing natural membrane environment |
| Engineering Method | Molecular Identification through Membrane Engineering (MIME) | Electroinsertion of anti-PSA antibodies into cell membranes |
| Detection Principle | Bioelectric Recognition Assay (BERA) | Measurement of membrane potential changes following molecular binding |
| Instrumentation | xCELLigence RTCA-SP System | Real-time impedance monitoring and data acquisition |
| Optimal Cell Density | 15,000 cells/well | Determined through optimization experiments for ideal impedance response |
Experimental Protocol & Methodology
Biosensor Preparation and Cell Engineering
The biosensor preparation begins with the modification of Vero cells through electroinsertion of anti-PSA antibodies into their membranes. For this process, 2.5 × 10^6 cells in 40 μL PBS are incubated on ice for 20 minutes with 400 μL of antibody solution at a concentration of 0.25 μg/mL [57]. Following incubation, the mixture is transferred to an electric field of 1800 V/cm, and two square electric pulses are applied according to established protocols [57]. Control cells undergo identical electroporation procedures without exposure to anti-PSA antibodies. After electroporation, cells are counted and seeded into specialized E-Plates at the optimized density of 15,000 cells per well for subsequent impedance measurements [57].
Impedance Measurement and PSA Detection
Impedance monitoring for PSA detection is conducted using the xCELLigence Real-Time Cell Analyzer Single Plate system. The protocol involves adding 50 μL of pre-warmed cell culture medium to all E-plate wells for equilibration, followed by the addition of 50 μL of electroporated anti-PSA antibody or control Vero cells [57]. Cells are allowed to settle for 30 minutes at room temperature before E-plates are transferred to the xCELLigence analyzer and incubated overnight in a cell culture chamber at 37°C with 5% CO₂ [57].
For experimental measurements, 50 μL of PSA solution at final in-well concentrations (0-10 ng/mL) is added and gently mixed to assess biosensor response to standard solutions. For clinical sample analysis, 50 μL of human serum samples with predetermined PSA levels are applied. The E-plates are immediately placed into the RTCA-SP system within the cell culture incubator, and biosensor response is continuously monitored for 30 minutes post-application, with Cell Index values recorded every 15 seconds [57].
Performance Comparison with Alternative Technologies
Analytical Performance Metrics
The bioelectric impedance biosensor demonstrates significant performance advantages when compared to conventional PSA detection methods and emerging alternatives. In clinical validation studies, the biosensor exhibited specific, concentration-dependent changes in impedance upon exposure to PSA standard solutions and effectively differentiated between PSA-positive and PSA-negative human serum samples relative to the clinical threshold of 4 ng/mL [57]. The system achieved rapid results within one minute of sample application, while maintaining strong diagnostic agreement with standard immunoradiometric assays [57].
Table 2: Performance Comparison of Prostate Cancer Diagnostic Technologies
| Technology | Detection Principle | Sample Type | Detection Time | Key Performance Metrics |
|---|---|---|---|---|
| Bioelectric Impedance Biosensor | Cell-based impedance | Human serum | <1 minute | Clinical threshold differentiation at 4 ng/mL; Strong diagnostic agreement with IRMA [57] |
| Capacitance Aptasensor | Capacitance (non-Faradaic) | Urinary extracellular vesicles | 10 minutes | PSMA detection limit: 4.83 × 10² EV/μL; CD63 detection limit: 1.47 × 10³ EV/μL [61] |
| Endorectal BIA Test | Bioelectric impedance analysis | Direct tissue measurement | Immediate | 75% accuracy; 63.33% sensitivity; 83.75% specificity for prostate cancer detection [62] |
| Quantum Dot Biosensors | Fluorescence/electrochemical | Serum, urine, tissue | Varies (minutes-hours) | Detection limits: fg/mL to pg/mL range; Multiplexing capability [63] |
| Conventional IRMA/ELISA | Immunoassay | Serum | Hours | Established clinical standard; Limited specificity; Lengthy processing [57] |
Clinical Utility and Practical Considerations
Beyond analytical performance, the practical implementation characteristics of these technologies vary significantly. The bioelectric impedance biosensor offers potential for point-of-care screening workflows due to its rapid results and minimal sample processing requirements [57]. The capacitance-based electrochemical biosensor for urinary extracellular vesicles provides a non-invasive alternative with results in 10 minutes using only 10 μL of sample, demonstrating strong correlation with commercial PSMA ELISA [61]. The endorectal bioelectric impedance analysis test represents a direct tissue measurement approach that improves patient selection for prostate biopsy, achieving 75% accuracy in discerning prostate cancer from benign conditions [62].
Quantum dot-enabled biosensors show promise for multiplexed biomarker detection with exceptional sensitivity, though concerns about cytotoxicity, long-term stability, and regulatory approval remain challenges for clinical translation [63]. Conventional IRMA and ELISA methods, while established clinical standards, require complex infrastructure and extended processing times that hinder rapid clinical decisions [57].
Research Reagent Solutions and Materials
Successful implementation of the bioelectric impedance biosensor requires specific research reagents and materials that ensure experimental reproducibility and reliable performance.
Table 3: Essential Research Reagents and Materials for Bioelectric Biosensing
| Reagent/Material | Specification | Application Purpose | Commercial Source |
|---|---|---|---|
| Cell Line | Vero cells | Living biosensing platform providing cellular membrane structure for antibody engineering | LGC Promochem [57] |
| Culture Medium | Dulbecco's Modified Eagle's Medium High Glucose with L-glutamine | Cell maintenance and experimental culture | Biowest [57] |
| Anti-PSA Antibody | Monoclonal antibody specific to prostate-specific antigen | Electroinsertion into cell membranes for target recognition | Sigma-Aldrich [57] |
| Specialized Plates | E-Plate 96 | Impedance measurement with integrated electrodes for real-time monitoring | Agilent [57] |
| Analysis System | xCELLigence RTCA-SP | Real-time cell analysis platform for continuous impedance monitoring | Agilent [57] |
| Human Serum Samples | Characterized PSA levels (0-26.5 ng/mL) | Clinical validation and biosensor performance assessment | Hospital patient samples [57] |
Signaling Pathways and Detection Mechanism
The fundamental detection mechanism of the bioelectric impedance biosensor relies on specific molecular interactions at the cellular membrane level and subsequent biophysical changes that alter impedance characteristics.
The signaling pathway begins with specific binding of PSA antigens to the electroinserted anti-PSA antibodies on the Vero cell membrane [57]. This molecular recognition event triggers alterations in membrane potential through the Bioelectric Recognition Assay mechanism, which detects changes in the electrical properties of the engineered cells following specific molecular interactions [57]. The membrane potential changes subsequently induce measurable impedance variations that are continuously monitored by the xCELLigence system's microelectrodes [60]. Finally, these impedance measurements are quantified as Cell Index values, providing a quantitative relationship to PSA concentration that enables differentiation between clinically relevant sample classifications [57].
Discussion and Future Perspectives
The clinical validation data presented in this case study positions the bioelectric impedance biosensor as a promising technology for addressing critical limitations in current prostate cancer diagnostics. The system's ability to provide rapid, specific PSA detection in human serum samples, combined with its strong diagnostic agreement with established IRMA methods, supports its potential integration into point-of-care screening workflows [57]. The technology represents one of the fastest PSA detection approaches reported to date, offering a potential solution for reducing overdiagnosis while improving clinical decision-making and patient outcomes [57].
Future development efforts should focus on enhancing the technology's translational potential through automation of cell culture and biosensor preparation processes, expansion of multiplexed detection capabilities for additional prostate cancer biomarkers, implementation of simplified instrumentation compatible with routine clinical settings, and completion of large-scale clinical validation studies across diverse patient populations [57] [63] [58].
When contextualized within the broader thesis of biosensor validation in real biological samples, this case study demonstrates that cell-based bioelectric sensing represents a viable approach for overcoming specific analytical challenges in complex clinical matrices. The integration of biological recognition elements with electronic signal transduction provides a pathway toward clinically viable diagnostic tools that balance analytical performance with practical implementation requirements [57] [58].
The field of drug development is undergoing a profound transformation, driven by the convergence of advanced biosensing technologies and sophisticated microphysiological systems. Traditional preclinical models, primarily reliant on two-dimensional cell cultures and animal testing, have consistently demonstrated limitations in accurately predicting human pharmacological responses, contributing to high failure rates in clinical trials. [64] In response, two innovative technologies have emerged as powerful alternatives: wearable biosensors and organ-on-a-chip (OoC) models. Wearable biosensors enable continuous, real-time monitoring of physiological and biochemical parameters in non-clinical settings, facilitating early disease detection and personalized treatment. [54] Meanwhile, OoC technology utilizes microfluidic devices cultured with human living cells under controlled dynamic conditions to replicate human organ pathophysiology and functionality. [64] When integrated, these platforms offer an unprecedented opportunity to enhance drug safety testing through more physiologically relevant, human-based models that provide continuous, multi-parametric data on compound effects.
This evolution aligns with recent regulatory changes, including the US Food and Drug Administration (FDA) Modernization Act, which now permits the evaluation of experimental drugs using cutting-edge non-animal alternatives. [64] The critical advantage of these technologies lies in their ability to provide dynamic, functional data from human cell systems under conditions that mimic the physiological environment of the human body. Wearable biosensors extend this capability to in vivo contexts, offering non-invasive, continuous monitoring with direct clinical relevance. [65] Together, these platforms represent a fundamental shift from static, endpoint analyses to dynamic, systems-level assessment of drug effects, potentially accelerating the identification of toxicity issues and improving the safety profile of new therapeutic compounds.
Technological Foundations: How These Systems Work
Wearable Biosensors: Architecture and Sensing Modalities
Wearable biosensors are miniaturized analytical platforms that integrate sample handling, signal transduction, and data processing into single devices worn on the body. [54] These systems typically incorporate microfluidic channels for fluid transport, various sensing elements for biochemical detection, and electronics for signal processing and wireless communication. The core functionality depends on advanced transduction mechanisms that convert biological recognition events into quantifiable electrical signals. Electrochemical sensors detect changes in current, voltage, or impedance resulting from biochemical reactions and are widely utilized due to their high sensitivity, low power requirements, and ease of miniaturization. [54] Optical sensors, including fluorescence and absorbance-based systems, offer high specificity and are well-suited for multiplexed assays, though they require more complex integration of optical components. [54]
Recent material innovations have been crucial to the advancement of wearable biosensors. The development of flexible and stretchable substrates enables seamless integration with soft, dynamic biological surfaces, while biocompatible materials minimize adverse reactions during prolonged wear. [54] Nanostructured transducers significantly enhance sensitivity and specificity, supporting multiplexed and multi-modal sensing capabilities. [54] Furthermore, the incorporation of wireless communication modules like Bluetooth Low Energy (BLE) and Near Field Communication (NFC) enables real-time data transmission to smartphones or cloud platforms, facilitating continuous health monitoring and data-driven decision-making. [54]
Organ-on-a-Chip Systems: Engineering Human Physiology
Organ-on-a-chip technology represents a microphysiological approach that mimics critical functions of human organs and tissues using microfluidic devices cultured with human cells. [64] These systems reconstitute the minimal functional unit of an organ in a microfluidic chip, incorporating microchannels with living human tissues and cells under controlled dynamic culture conditions. [64] A key innovation of OoC platforms is their ability to control critical physiological parameters such as shear stress, cell-cell interactions, concentration gradients, and mechanical cues, which are essential for accurately replicating human organ physiology and disease conditions. [64]
The technological foundation of OoC platforms relies heavily on microfluidics principles. Laminar flow, characterized by low Reynolds numbers, provides a consistent flow rate and avoids disturbances in the microenvironment, making it desirable for organ-on-chip technology. [64] Scaling concepts including hydraulic diameter, flow rate, and shear stress are essential for designing and optimizing these devices. [64] Furthermore, these systems can integrate real-time sensors to monitor the condition and activity of the cells continuously, [64] and when multiple organ chips are fluidically connected, they form multi-organ chip systems that can simulate interrelated organ functions, enabling the study of complex physiological interactions and systemic drug effects. [64]
Table 1: Core Technological Components of Wearable Biosensors and Organ-on-a-Chip Systems
| Technology | Key Components | Sensing Mechanisms | Primary Applications in Drug Safety |
|---|---|---|---|
| Wearable Biosensors | Microfluidic channels, flexible substrates, wireless communication modules, nanostructured transducers | Electrochemical (amperometric, potentiometric, impedimetric), optical (fluorescence, absorbance) | Continuous therapeutic drug monitoring, detection of biomarkers indicating organ toxicity, real-time assessment of metabolic responses to drugs |
| Organ-on-a-Chip | Microfluidic channels, porous membranes, human cell cultures (primary or iPSC-derived), integrated sensors, perfusion systems | Transepithelial electrical resistance (TEER), microelectrode arrays (MEA), impedance spectroscopy, optical imaging | Assessment of organ-specific toxicity, prediction of drug absorption/distribution, metabolism/excretion (ADME), modeling of disease states for drug testing |
Comparative Performance Analysis: Quantitative Assessment
Detection Capabilities and Analytical Performance
The utility of both wearable biosensors and OoC models in drug safety testing depends critically on their analytical performance. Wearable biosensors demonstrate exceptional sensitivity in detecting biochemical markers relevant to drug safety assessment. For instance, electrochemical biosensors targeting biomarkers such as cytokines, metabolites, and zonulin enable sensitive detection of inflammation and permeability status, [65] with some systems achieving detection limits in the nanomolar range for specific biomarkers. [9] This high sensitivity allows for early detection of adverse drug reactions before they manifest as clinically significant symptoms.
Organ-on-a-chip platforms integrated with biosensing capabilities similarly offer sophisticated detection methodologies. Electrochemical impedance spectroscopy (EIS) provides multiparametric outputs that distinguish between tight junction disruption and morphological changes in barrier tissues, [65] offering crucial information about drug-induced barrier dysfunction. Microelectrode arrays (MEAs) enable recording of electrophysiological activities in neural and myocardial organoids with high spatiotemporal resolution, [66] allowing for precise assessment of functional cardiotoxicity or neurotoxicity. Field-effect transistor (FET)-based sensing techniques provide label-free detection of biomarkers with high sensitivity, [66] while surface plasmon resonance (SPR) and mass spectrometry imaging enable sophisticated molecular characterization. [66]
Table 2: Analytical Performance Metrics of Featured Sensing Technologies
| Sensing Technology | Detection Limits | Key Measured Parameters | Representative Applications in Drug Safety |
|---|---|---|---|
| Electrochemical Impedance Spectroscopy (EIS) | Capable of distinguishing subtle tight junction disruptions | Multiparametric outputs for barrier integrity assessment, transepithelial electrical resistance (TEER) | Assessment of drug-induced intestinal, blood-brain barrier, or renal barrier damage [65] |
| Microelectrode Arrays (MEA) | High spatiotemporal resolution for electrophysiological signals | Extracellular field potentials, spike rates, burst patterns, network synchronization | Detection of drug-induced cardiotoxicity (hERG channel blockers) or neurotoxicity [66] |
| Whole-Cell Biosensors | 0.1–1 μM for heavy metals | Bioluminescence response to cellular stress | Detection of cellular stress responses to drug candidates or toxic metabolites [8] |
| Laccase-based Biosensors | Nanomolar range for phenolic compounds | Catalytic oxidation of phenolic substrates | Detection and breakdown of drugs with phenolic structures [8] |
Physiological Relevance and Predictive Capacity
The predictive capacity of these technologies for human drug responses represents their most significant advantage over traditional models. Organ-on-a-chip platforms demonstrate remarkable physiological relevance by replicating critical aspects of human organ biology. For instance, vascularized kidney organoids cultured on microfluidic chips developed more mature podocytes and tubular compartments, with glomerular vascular development resembling that of embryonic mammalian kidneys. [66] This enhanced maturation improves cell polarity and adult gene expression, leading to more predictive models for nephrotoxicity assessment.
Similarly, wearable biosensors provide unprecedented access to real-time physiological data in relevant contexts. Electrochemical impedance spectroscopy integrated into wearable formats provides dynamic, quantitative, and real-time insight into epithelial barrier integrity, [65] potentially allowing for continuous monitoring of drug-induced gastrointestinal toxicity. The incorporation of these technologies into ingestible and wearable devices extends monitoring capabilities to in vivo contexts, offering non-invasive, continuous assessment with direct clinical relevance. [65] This capacity for longitudinal monitoring is particularly valuable for detecting delayed adverse effects that might be missed in conventional short-term testing protocols.
Experimental Protocols: Methodologies for Implementation
Organ-on-a-Chip with Integrated Biosensing: A Representative Workflow
The implementation of OoC platforms with integrated biosensing for drug safety assessment follows a systematic experimental workflow. First, microfluidic device fabrication utilizes techniques such as soft lithography, 3D printing, and MEMS to create chips with appropriate channel architectures, often using biocompatible polymers like polydimethylsiloxane (PDMS) or cyclic olefin copolymers (COCs). [54] [66] These materials offer favorable optical properties and long-term stability, which is essential for prolonged culture and observation. The chip design typically includes microchannels with trap sites that can be adjusted according to the size of the organoids, allowing for precise positioning and perfusion. [66]
Next, organoid culture and loading involves seeding tissue-specific organoids derived from primary cells or induced pluripotent stem cells (iPSCs) into the microfluidic device. For example, in a vascularized kidney organoid model, organoids are perfused with controlled wall shear stresses to facilitate attachment to a gel–brain extracellular matrix. [66] This perfusion system promotes the development of a perfusable luminal vascular network and enhances the maturation of functional tissue structures. The establishment of vascular networks is critical for nutrient delivery and waste removal in larger organoids, better mimicking the in vivo environment where drugs would be delivered through the vasculature.
The sensor integration and calibration phase involves implementing appropriate biosensing modalities based on the specific safety endpoints being evaluated. For barrier integrity assessment, electrodes for measuring transepithelial electrical resistance (TEER) are calibrated with standard solutions. [65] For electrophysiological monitoring, microelectrode arrays are positioned to record from contracting cardiac organoids or active neuronal networks. [66] Optical sensors for metabolic monitoring (e.g., oxygen consumption, pH) are calibrated against known standards to ensure accurate quantification.
Finally, compound testing and data acquisition involves perfusing drug candidates through the system at physiologically relevant concentrations while continuously monitoring functional parameters. For example, in a study evaluating drug responses in pancreatic cancer organoids, various agents including targeted inhibitors and conventional chemotherapeutic drugs were administered via the microfluidic system. [66] Real-time data on organoid viability, functional changes, and specific toxicity markers were collected, demonstrating the platform's ability to accurately reflect drug responses observed in clinical settings.
Wearable Biosensor Deployment for Therapeutic Monitoring
Implementing wearable biosensors for drug safety monitoring involves distinct methodological considerations. The process begins with sensor selection and calibration, choosing devices with appropriate sensing modalities (electrochemical, optical, etc.) for the specific drug or biomarker of interest. For example, electrochemical biosensors require calibration against known concentrations of the target analyte to establish a standard curve for quantitative measurements. [65] The selection process must consider the biological matrix (sweat, interstitial fluid, etc.) and the expected concentration range of the target biomarker.
The subject preparation and sensor deployment phase involves proper skin preparation (cleaning, sometimes mild abrasion) to ensure optimal contact and sample access. Devices are then mounted using adhesive patches, bands, or textiles, ensuring secure attachment without compromising comfort or circulation. [54] For ingestible sensors, administration follows protocols similar to conventional medication, with attention to timing relative to drug administration and meals. [65]
Data acquisition and processing occurs continuously throughout the monitoring period. Modern wearable biosensors incorporate microcontrollers for signal conditioning, processing, and storage directly on the device. [54] Wireless communication modules transmit data to external devices (smartphones, cloud platforms) for further analysis. Advanced signal processing algorithms filter noise, correct for baseline drift, and extract relevant features from the continuous data stream, converting raw sensor readings into physiologically meaningful parameters.
Finally, correlation with pharmacokinetic profiles involves comparing the continuous biomarker data with known drug pharmacokinetics, establishing temporal relationships between drug concentrations and physiological effects. This approach enables the identification of individual variations in drug metabolism and toxicity susceptibility, moving toward personalized safety profiling.
The Scientist's Toolkit: Essential Research Reagent Solutions
Successful implementation of wearable biosensors and organ-on-a-chip models for drug safety testing requires specialized materials and reagents. The table below details key components essential for researchers in this field.
Table 3: Essential Research Reagent Solutions for Biosensor and Organ-on-a-Chip Applications
| Research Tool | Composition/Type | Primary Function | Representative Examples |
|---|---|---|---|
| Biocompatible Polymers | Polydimethylsiloxane (PDMS), cyclic olefin copolymers (COCs), PMMA | Microfluidic chip fabrication, flexible sensor substrates | PDMS for organ-on-chip devices due to gas permeability; COCs for long-term stability and optical clarity [54] [66] |
| Stem Cell Sources | Induced pluripotent stem cells (iPSCs), organ progenitor cells | Generation of human organoids for OoC models | Patient-specific iPSCs for personalized disease modeling and drug testing [64] |
| Nanomaterial Enhancers | Gold nanoparticles, graphene, carbon nanotubes, quantum dots | Signal amplification in biosensors, scaffold enhancement | Glucose oxidase immobilized on gold nanoparticles for enhanced sensitivity in pollutant detection [8] |
| Recognition Elements | Enzymes, antibodies, aptamers, nucleic acids, whole cells | Target-specific binding and detection in biosensors | Laccase-based biosensors for phenolic compounds; aptasensors for heavy metal detection [8] |
| Microelectrode Arrays | Metal electrodes (Pt, Au, ITO) on glass/silicon substrates | Electrophysiological recording from organoids | MEA systems for monitoring neural and cardiac organoid activity [66] |
Integration Strategies and Multi-modal Sensing
Convergent Approaches for Enhanced Predictive Power
The integration of wearable biosensors and organ-on-a-chip technologies represents the cutting edge of innovation in drug safety testing. This convergence enables comprehensive assessment strategies that leverage the complementary strengths of both platforms. Multi-organ chip systems, created when more than two organ chips are fluidically connected, can simulate the entire body's pathophysiology and drug absorption, distribution, metabolism, and excretion (ADME) processes. [64] When combined with wearable monitoring technologies, these systems enable correlation between in vitro predictions and in vivo observations, creating powerful feedback loops for model validation and refinement.
A key advancement in this integrated approach is the implementation of multimodal sensing technologies that overcome limitations inherent in singular sensing modalities. [66] For example, the combination of microelectrode arrays for recording electrical signals from cardiac organoids with micropillar arrays for monitoring contractile force provides complementary functional data for comprehensive cardiotoxicity assessment. [66] Similarly, integrating microfluidic perfusion systems with mechanical sensing and advanced intelligent algorithms enables researchers to simultaneously obtain hydrodynamic parameters, mechanical stress responses, and electrophysiological signals from organoids, thereby constructing multidimensional data models for more accurate safety prediction. [66]
Data Integration and Artificial Intelligence
The multi-parametric data generated by integrated wearable biosensors and OoC platforms necessitates advanced analytical approaches. Artificial intelligence and machine learning algorithms are increasingly employed to identify complex patterns in these rich datasets that might elude conventional analysis. [54] These computational approaches can integrate diverse data types—including electrophysiological signals, metabolic profiles, morphological changes, and gene expression patterns—to generate predictive models of compound toxicity with higher accuracy than single-endpoint assessments.
Furthermore, the convergence of these platforms with Internet of Things (IoT) technologies enables real-time data streaming and remote monitoring capabilities. [54] This connectivity supports the creation of extensive databases that aggregate safety information across multiple compounds and model systems, progressively enhancing predictive algorithms through continuous learning. Such integrated, intelligent systems represent the future of preclinical safety assessment, potentially reducing reliance on animal testing while providing more human-relevant safety data.
Wearable biosensors and organ-on-a-chip models represent complementary technological frontiers that are collectively reshaping the landscape of drug safety testing. While OoC platforms offer human-relevant in vitro models that replicate organ-level physiology and enable mechanistic toxicity studies, wearable biosensors provide unprecedented capabilities for continuous, real-time monitoring of drug effects in clinical and ambulatory settings. The integration of these technologies, supported by advanced materials, multimodal sensing, and artificial intelligence, enables a more comprehensive, predictive approach to safety assessment throughout the drug development pipeline.
Despite significant progress, challenges remain in the widespread adoption of these technologies. Standardization of organoid generation, ensuring long-term sensor stability, addressing biofouling issues, and establishing correlation with human outcomes require continued research attention. [54] [66] Furthermore, regulatory acceptance of data from these novel platforms for decision-making necessitates extensive validation and benchmarking against traditional approaches. However, the current trajectory suggests that these integrated technologies will progressively transform drug safety assessment from a static, endpoint-focused process to a dynamic, systems-level analysis that better captures the complexity of human physiology and individual variation. As these technologies mature and converge, they hold the promise of accelerating the development of safer therapeutics while reducing reliance on animal models, ultimately benefiting both patients and the drug development enterprise.
Navigating the Obstacle Course: Systematic Optimization and Problem-Solving
The validation of biosensors in real biological samples represents a critical frontier in diagnostic and pharmaceutical development. A significant barrier to this validation is the matrix effect, a phenomenon where the complex components of a biological sample interfere with the sensor's function, leading to inaccurate readings. These effects primarily manifest as non-specific binding (NSB), where non-target molecules adhere to the sensor surface, and interference, where sample components alter the physicochemical environment or directly inhibit detection chemistry [67] [68]. For researchers and drug development professionals, overcoming these challenges is not merely an analytical refinement but a fundamental requirement for deploying reliable assays in clinical practice. Matrix effects are particularly pronounced in label-free biosensing technologies, which, while offering simplified assay designs and real-time measurement capabilities, lack the signal amplification of labeled methods and are thus more vulnerable to interference from the sample matrix itself [67] [12]. This guide objectively compares the performance of various strategic solutions to this pervasive problem, providing a framework for selecting and validating the most effective approach for a given biosensing application.
Fundamental Mechanisms: How Matrix Effects Compromise Biosensor Performance
The matrix effect is not a single entity but a collection of interference mechanisms. Understanding these is the first step toward developing effective mitigation strategies.
- Non-Specific Binding (NSB): In label-free biosensors, it is virtually impossible to distinguish non-specific interactions without using a reference probe. NSB is driven by electrostatic, hydrogen bonding, and van der Waals interactions between matrix constituents (e.g., serum proteins) and the bioreceptor or sensor substrate. This binding increases background noise and can lead to false positive signals [67].
- Interference from Sample Composition: Complex biological fluids like serum, plasma, and urine contain myriad molecules that can inhibit the core sensing reaction. For example, clinical samples have been shown to strongly inhibit reporter production in cell-free biosensor systems, with serum and plasma causing >98% inhibition in some cases [14]. Similarly, in electrolyte-gated graphene field-effect transistor (EGGFET) biosensors, variations in the electrolyte's ionic strength, composition, and pH can significantly modulate the Fermi level of the graphene channel, leading to signal drift and false results [69].
- The Debye Screening Effect: This is a fundamental challenge for electrical biosensors detecting charged analytes in high-ionic-strength environments, such as physiological fluids. The ions in the solution screen the charge of the target molecule, drastically reducing the sensor's sensitivity and effective detection range [69].
The table below summarizes the core mechanisms and their impact on different biosensor types.
Table 1: Fundamental Mechanisms of Matrix Interference in Biosensors
| Mechanism | Description | Primary Impact on Biosensors | Most Affected Sensor Types |
|---|---|---|---|
| Non-Specific Binding (NSB) | Non-target matrix proteins and molecules adsorb to the sensor surface or bioreceptor. | Increased background noise, reduced specificity, false positives. | Label-free optical (SPR, PhRR) [67] |
| Biochemical Interference | Sample components (e.g., nucleases, proteases) degrade sensing elements or inhibit reactions. | Reduced signal output, loss of sensitivity, assay failure. | Cell-free systems, whole-cell biosensors [14] |
| Physicochemical Interference | Variations in pH, ionic strength, or osmolarity alter the sensor's transduction mechanism. | Signal drift, altered calibration, reduced accuracy. | Electrochemical, FET-based sensors [69] |
| Debye Screening | High ionic strength shields the charge of target analytes from the sensor surface. | Drastic reduction in sensitivity for charged targets. | Field-effect transistor (FET) biosensors [69] |
Comparative Analysis of Strategic Solutions
Multiple strategies have been developed to conquer matrix effects, each with its own advantages, limitations, and optimal application scope. The following sections and tables provide a performance comparison of the leading alternatives.
Strategy 1: Reference Channel Subtraction for NSB Correction
This approach uses a dedicated reference sensor functionalized with a non-interacting control molecule to measure the NSB component, which is then subtracted from the signal of the active sensor.
- Experimental Protocol: On a multiplexed sensor platform (e.g., a photonic microring resonator (PhRR) chip with multiple individual sensors), the active sensors are functionalized with a capture probe (e.g., an anti-IL-17A antibody). The reference sensors are functionalized with a candidate control protein. The sensor is exposed to the sample, and the wavelength shift (or other signal) is recorded for both active and reference sensors. The specific binding signal is calculated as: Signal(active) - Signal(reference) [67].
- Performance Comparison: A systematic study compared various control probes for detecting interleukin-17A (IL-17A) and C-reactive protein (CRP). The results, summarized below, demonstrate that the optimal reference control is analyte-specific and not always the intuitive choice [67].
Table 2: Performance Comparison of Reference Control Probes for NSB Subtraction
| Target Analyte | Reference Control Probe | Key Experimental Finding | Performance Score (Linearity, Accuracy, Selectivity) |
|---|---|---|---|
| IL-17A | Bovine Serum Albumin (BSA) | Best-performing reference for this cytokine. | 83% |
| IL-17A | Mouse IgG1 Isotype Control | Close second, but not the optimal choice. | 75% |
| CRP | Rat IgG1 Isotype Control | Highest-scoring control for this protein. | 95% |
| CRP | Anti-Fluorescein (FITC) | Effective, but less so than the matched isotype. | 89% |
Strategy 2: Sample Pre-Treatment and Matrix Management
This strategy focuses on removing or mitigating interfering substances before the sample contacts the biosensor.
- Experimental Protocol: Common techniques include:
- Dilution: Reducing the concentration of all matrix components, though this also dilutes the analyte.
- Protein Precipitation (PPT): Adding organic solvents or acids to precipitate proteins, which are then removed by centrifugation.
- Solid-Phase Extraction (SPE): Passing the sample through a cartridge that captures either the analyte or the interferents. This can be automated in 96-well formats or online systems coupled to LC-MS/MS [13].
- Desalting/Buffer Exchange: Using dialysis or spin columns to replace the native sample matrix with a compatible buffer, reducing ionic strength and removing small molecules [69].
- Performance Comparison: The choice of method is a trade-off between effectiveness, throughput, and analyte recovery.
Table 3: Comparison of Sample Pre-Treatment Methods for Matrix Management
| Method | Principle | Advantages | Disadvantages / Challenges |
|---|---|---|---|
| Simple Dilution | Reduces concentration of interferents. | Rapid, low-cost, minimal equipment. | Also dilutes analyte; may not remove all interference [13]. |
| Protein Precipitation (PPT) | Denatures and removes proteins. | Simple, high-throughput in 96-well format. | Can co-precipitate analyte; may not remove phospholipids [13]. |
| Solid-Phase Extraction (SPE) | Selective binding of analyte or interferents. | Effective cleanup, can concentrate analyte. | More complex and costly; requires optimization [13]. |
| Online SPE | SPE coupled directly to analysis system. | Full automation, high reproducibility. | Requires sophisticated instrumentation; offline processing of whole blood often still needed [13]. |
Strategy 3: Reagent Additives and Engineered Robustness
This approach involves incorporating specific additives into the sensing chemistry or engineering the biological components to be inherently resistant to matrix interference.
- Experimental Protocol:
- For Cell-Free Biosensors: Add commercial RNase inhibitors to the reaction mix to protect RNA components from degradation by nucleases in clinical samples. A typical protocol involves adding the inhibitor to the cell-free TX-TL extract before adding the sample [14].
- For Graphene FET Biosensors: Dilute the sample in a buffer of defined ionic strength and pH to standardize the electrochemical environment at the sensor interface [69].
- Performance Comparison: A study on cell-free systems found that while RNase inhibitor could partially restore protein production (e.g., ~70% recovery in urine for sfGFP), the glycerol present in the commercial inhibitor buffer itself was inhibitory. This was solved by engineering an E. coli strain to produce its own RNase inhibitor during extract preparation, which improved robustness and reduced interpatient variability in signal output [14].
The Scientist's Toolkit: Essential Reagents and Materials
Successful mitigation of matrix effects requires a suite of key reagents and materials. The following table details a core toolkit derived from the cited experimental approaches.
Table 4: Research Reagent Solutions for Mitigating Matrix Effects
| Reagent / Material | Function in Mitigating Matrix Effects | Example Application |
|---|---|---|
| Isotype Control Antibodies | Serves as a reference probe to measure and subtract NSB in immuno-sensing. | Paired with capture antibody on photonic ring resonator sensors [67]. |
| Bovine Serum Albumin (BSA) | A common blocking agent and potential reference control protein. | Used as a negative control probe in IL-17A assay [67]. |
| RNase Inhibitor | Protects RNA-based sensing systems from degradation by nucleases in samples. | Added to cell-free expression systems to maintain activity in serum/urine [14]. |
| Murine RNase Inhibitor (mRI) Plasmid | Genetic engineering for inherent robustness; eliminates need for additive and its buffer. | Transformed into E. coli for production of resilient cell-free extracts [14]. |
| Solid-Phase Extraction (SPE) Cartridges | Removes proteins and phospholipids from samples prior to analysis. | Online SPE coupled with LC-MS/MS for automated sample prep of plasma/serum [13]. |
| Standardized Buffer Solutions | Controls pH and ionic strength to minimize physicochemical interference. | Used to dilute serum samples for EGGFET immunoassays to regulate gate potential [69]. |
Experimental Workflow and Signaling Pathways
The following diagram illustrates a consolidated experimental workflow for developing and validating a matrix-effect mitigation strategy, integrating elements from the referenced studies.
Experimental Workflow for Matrix Mitigation
The signaling pathway for a genetically engineered microbial (GEM) biosensor, which is designed to be inherently specific and less prone to interference, is shown below.
GEM Biosensor Signaling Pathway
Conquering the matrix effect is a non-negotiable step in the validation of biosensors for real-world applications. As this comparison guide demonstrates, no single strategy is universally superior. The optimal path depends on the specific triad of analyte, biosensor platform, and sample matrix. Reference subtraction with an empirically-optimized control is powerful for label-free optical biosensors, while sample pre-treatment remains a workhorse for electrochemical systems. Emerging strategies, such as genetically engineering robustness directly into the sensing elements, show great promise for creating inherently resilient systems. For researchers and scientists, a systematic, evidence-based approach—using the experimental protocols and performance data outlined here—is essential for selecting and validating the right combination of techniques to ensure their biosensors deliver reliable and accurate performance in the complex environment of real biological samples.
The validation of biosensors for use with real biological samples represents a critical step in translating laboratory research into clinical and pharmaceutical applications. A significant obstacle in this process is the efficient optimization of the biosensor's fabrication and operational parameters. While the one-variable-at-a-time (OFAT) approach is historically common, it is inherently flawed for complex systems. This guide objectively compares OFAT with the systematic Design of Experiments (DoE) methodology, demonstrating through experimental data and case studies how DoE leads to superior biosensor performance by efficiently capturing factor interactions and enabling robust, data-driven optimization.
The development of robust biosensors for clinical diagnostics and drug development requires meticulous optimization of numerous parameters. These can include the concentration of immobilized biorecognition elements, the pH and ionic strength of the detection buffer, incubation times, and the electrical or optical properties of the transducer interface [70]. Achieving a configuration that delivers high sensitivity, a low limit of detection (LOD), and excellent reproducibility in complex matrices like blood or serum is paramount.
Traditionally, many researchers have relied on the one-variable-at-a-time (OFAT) approach. Although straightforward, OFAT involves changing a single factor while holding all others constant, which fails to reveal how factors interact with one another [71]. Consequently, the identified "optimum" may be suboptimal, and the process is often inefficient and incapable of ensuring robust performance in real-world conditions. In contrast, Design of Experiments (DoE) is a powerful chemometric tool that provides a systematic, statistically sound framework for optimization. By varying multiple factors simultaneously according to a predetermined experimental grid, DoE can build a predictive model of the biosensor's behavior, quantifying both individual factor effects and their interactions while significantly reducing the total experimental effort required [70] [71].
Fundamental Principles: OFAT vs. DoE
This section delineates the core methodological differences between OFAT and DoE, highlighting why the latter is fundamentally superior for understanding complex systems.
The One-Variable-at-a-Time (OFAT) Approach
- Methodology: A baseline is established for all factors. The investigator then sequentially changes one factor, testing its different levels while all other factors remain fixed at their baseline levels. After identifying the best level for the first factor, that factor is set to its new "optimal" level, and the process repeats for the next factor [71].
- Key Limitations:
- Failure to Detect Interactions: OFAT cannot detect interactions between factors. An interaction occurs when the effect of one factor depends on the level of another. For instance, the ideal pH for a biosensor's buffer might be different at varying temperatures. OFAT would completely miss this phenomenon [71].
- Suboptimal Results: Because it ignores interactions, OFAT often converges on a local optimum rather than the global optimum, leading to inferior biosensor performance [71].
- Inefficiency: While it may seem simple, OFAT can be highly inefficient, especially as the number of factors increases, as it does not explore the experimental space comprehensively [70].
The Design of Experiments (DoE) Approach
- Methodology: DoE involves deliberately and simultaneously changing the levels of all factors to be studied across a structured set of experimental runs. The collective data from these runs is used to fit a mathematical model (e.g., a linear or quadratic polynomial) that describes the relationship between the input factors and the output response (e.g., signal intensity or LOD) [70] [71].
- Key Advantages:
- Detection of Interactions: DoE is specifically designed to quantify interaction effects, providing a more accurate representation of the biosensor system [70] [71].
- Global Optimization: The generated model allows for prediction of the response across the entire experimental domain, enabling researchers to find the true optimal combination of factor settings [71].
- Efficiency: DoE extracts maximum information from a minimal number of experiments. A study with just two factors showed DoE achieving better optimization in 12 runs than OFAT did in 13 runs, with the efficiency gap widening dramatically as more factors are added [71].
Table 1: A Comparative Overview of OFAT and DoE
| Feature | One-Variable-at-a-Time (OFAT) | Design of Experiments (DoE) |
|---|---|---|
| Basic Principle | Sequential variation of factors | Simultaneous variation of factors |
| Exploration of Space | Limited, along a single axis | Comprehensive, across a multi-dimensional domain |
| Detection of Interactions | Not possible | Explicitly designed to detect and quantify |
| Model Building | Does not support predictive model building | Creates a data-driven predictive model |
| Experimental Efficiency | Low, becomes prohibitively inefficient with many factors | High, structured to maximize information per experiment |
| Final Outcome | Often finds a local, suboptimal maximum | Finds the global optimum settings |
Experimental Comparison: A Head-to-Head Case Study
A straightforward example from chemical processing powerfully illustrates the practical differences between the two methodologies.
- Experimental Objective: Maximize the Yield of a chemical process, with Temperature and pH as the key factors [71].
- OFAT Protocol and Results:
- pH was held constant at 5.5, and Temperature was varied from 15°C to 45°C. A maximum Yield of 85% was observed at 30°C.
- Temperature was then fixed at 30°C, and pH was varied from 5.0 to 8.0. The maximum Yield was 86% at pH 6.0.
- The concluded optimum from OFAT was Temperature=30°C, pH=6.0, Yield=86% [71].
- DoE Protocol and Results:
- A two-factor experimental design was executed, testing combinations of low, middle, and high levels for both Temperature and pH.
- The data was used to fit a quadratic model that revealed a significant interaction between Temperature and pH. The model predicted that the maximum Yield would be 92% at Temperature=45°C, pH=7.0.
- Confirmation runs at these settings validated the model's prediction [71].
This case demonstrates that OFAT not only missed the true optimum but also failed to detect the underlying interaction, resulting in a significantly lower yield. The DoE approach, with a comparable number of experiments, provided a superior, predictive understanding of the system.
DoE in Action: Optimizing Advanced Biosensors
The application of DoE is proving critical in the development of next-generation biosensors, moving beyond traditional OFAT practices.
Case Study 1: Ultrasensitive Electronic Biosensors
In the development of ultrasensitive biosensors capable of sub-femtomolar detection, optimizing the biosensor interface is complex. DoE provides a structured path forward. Common factors include the density of the capture probe, the concentration of a redox marker, and the incubation time. A full factorial design is often a starting point, which for three factors, each at two levels, requires 8 experiments (2^3). This design efficiently screens for main effects and interactions. To capture curvature in the response surface, this can be augmented with center points and axial points in a Central Composite Design, enabling the fitting of a more accurate quadratic model [70].
Case Study 2: Whole-Cell Biosensors for Metabolic Engineering
The performance of whole-cell biosensors is highly dependent on the cellular and environmental context. A recent study on a naringenin-sensitive E. coli biosensor employed a DBTL (Design-Build-Test-Learn) pipeline guided by DoE. Researchers built a library of 17 genetic constructs by combining different promoters and ribosome binding sites (RBS). To efficiently characterize the biosensor's dynamic response under different media and carbon sources, an initial set of 32 experiments was selected via D-optimal design of experiments, a powerful DoE method for constrained situations. This data was used to calibrate a biology-guided machine learning model that could predict optimal genetic and environmental combinations for desired biosensor specifications, an approach impossible with OFAT [17].
Case Study 3: Optical Biosensors for Cancer Detection
In the design of a D-shaped photonic crystal fiber (PCF) Surface Plasmon Resonance (SPR) biosensor for multi-cancer detection, optimization of structural parameters is vital for maximizing sensitivity. Parameters such as the thickness of the gold and titanium dioxide (TiO₂) layers, the pitch of the air holes, and their diameter must be fine-tuned. A systematic DoE approach involving the analysis and optimization of these parameters led to a biosensor with a record wavelength sensitivity of 42,000 nm/RIU and a high figure of merit (FOM) of 1393 RIU⁻¹, demonstrating reliable and accurate detection capabilities for cancer cells like HeLa and MDA-MB-231 [72].
Table 2: Summary of DoE Applications in Biosensor Optimization
| Biosensor Type | Key Factors Optimized | DoE Design Used | Performance Outcome | Reference |
|---|---|---|---|---|
| Ultrasensitive Electronic | Probe density, redox marker concentration, incubation time | Full Factorial, Central Composite | Enhanced signal-to-noise ratio, lower LOD | [70] |
| Whole-Cell (Naringenin) | Promoters, RBS, growth media, carbon sources | D-Optimal Design | Predictive model for dynamic response tuning | [17] |
| Optical SPR (Cancer Detection) | Metal layer thickness, fiber structural parameters | Parameter Sweep & Analysis | Wavelength sensitivity of 42,000 nm/RIU | [72] |
The Scientist's Toolkit: Essential Reagents and Materials
The following reagents and materials are fundamental to conducting rigorous biosensor optimization and validation experiments.
Table 3: Key Research Reagent Solutions for Biosensor Development
| Reagent / Material | Function in Biosensor Development & Validation |
|---|---|
| Biolayer / Capture Probes | (e.g., antibodies, aptamers, enzymes). The primary recognition element that confers specificity to the target analyte. Immobilization strategy and density are critical optimization parameters. [70] |
| Signal Transduction Elements | (e.g., redox markers for electrochemical sensors, fluorophores for optical sensors). Enable the conversion of a binding event into a quantifiable electrical or optical signal. [70] |
| Blocking Agents | (e.g., BSA, casein, synthetic blockers). Used to passivate unused surfaces on the biosensor to minimize non-specific binding, a key factor in achieving a low background signal. |
| Synthetic Biological Parts | (e.g., promoters, RBS, plasmids). Essential for constructing and tuning the performance of whole-cell biosensors, allowing for the engineering of genetic circuits. [17] |
| Validated Biological Samples | (e.g., purified analytes, spiked serum, cancer cell lysates). Used to test biosensor performance in clinically relevant, complex matrices and establish calibration curves, specificity, and LOD. [72] |
Visualizing the DoE Workflow for Biosensor Optimization
The following diagram outlines a generalized DoE workflow for biosensor development, illustrating its iterative, model-based nature.
Diagram 1: The iterative DoE workflow for biosensor optimization, illustrating the "Design-Build-Test-Learn" cycle.
The transition from one-variable-at-a-time experimentation to systematic Design of Experiments is not merely a technical shift but a fundamental strategic improvement in biosensor research and development. As the case studies and data presented here confirm, OFAT is a risky and limited approach that often fails to find the true optimum and cannot account for critical factor interactions. In contrast, DoE provides a rigorous, efficient, and data-driven framework that accelerates development, enhances performance metrics like sensitivity and robustness, and ultimately builds greater confidence in biosensor validation for real-world biological and clinical samples. For researchers and drug development professionals aiming to create reliable point-of-care diagnostics, the adoption of DoE is a critical step toward ensuring success.
The performance and reliability of a biosensor are fundamentally dictated by the efficiency and robustness of its bioreceptor interface. For researchers and drug development professionals, validating a biosensor for use with real biological samples presents a formidable challenge, as complex matrices like serum, GI fluid, and tears can lead to issues with biofouling, non-specific binding, and signal degradation [73] [74] [75]. The biorecognition interface is the primary gatekeeper that determines the analytical sensitivity, specificity, and overall success of the sensing platform in clinically relevant environments. Therefore, the strategic selection of an immobilization method and the engineering of the sensor surface are not mere optimizations but are critical prerequisites for generating reliable and publishable data.
This guide provides a comparative analysis of established and emerging strategies for tethering bioreceptors—such as antibodies, enzymes, and aptamers—to transducer surfaces. By framing this discussion within the context of real-sample validation, we aim to equip scientists with the practical data and protocols needed to make informed decisions that enhance biosensor performance and accelerate the translation of biosensing technology from the laboratory to the point of need.
Comparative Analysis of Immobilization Strategies
The method of immobilization profoundly affects the orientation, stability, and accessibility of bioreceptors. The table below provides a quantitative comparison of four common chemical strategies for antibody immobilization on a gold electrode modified with a graphene-chitosan-Au/Pt nanoparticle nanocomposite, a common high-performance substrate [76].
Table 1: Quantitative Comparison of Antibody Immobilization Strategies on a Nanocomposite-Modified Gold Electrode
| Immobilization Strategy | Key Reagents / Mechanism | Linear Detection Range (ARV) | Limit of Detection (LOD, ARV) | Key Performance Insight |
|---|---|---|---|---|
| Cysteamine Hydrochloride (CH) | CH forms a self-assembled monolayer; antibodies linked via glutaraldehyde cross-linking [76]. | 0 – 105.82 EID50 mL-1 | 100.46 EID50 mL-1 | Broadest linear range (100x wider than Glu/EDC-NHS); excellent selectivity and stability [76]. |
| Direct Incubation | Physical adsorption onto the nanomaterial surface via hydrophobic/electrostatic forces [76]. | 0 – 104.82 EID50 mL-1 | 100.37 EID50 mL-1 | Simplest protocol but can lead to random orientation and receptor denaturation [76] [73]. |
| EDC/NHS Chemistry | EDC/NHS activates carboxyl groups to form stable amide bonds with antibody amines [76]. | 0 – 103.82 EID50 mL-1 | 100.48 EID50 mL-1 | Stable covalent binding; linear range can be constrained [76]. |
| Glutaraldehyde (Glu) | Glu cross-links amine groups on the surface with amine groups on antibodies [76]. | 0 – 103.82 EID50 mL-1 | 100.63 EID50 mL-1 | Can create a dense, but multi-layered and randomly oriented, antibody film [76]. |
Beyond antibodies, enzyme immobilization is crucial for catalytic biosensors. A comparison of strategies for glucose oxidase on carbon-fiber microelectrodes reveals performance trade-offs directly impacting measurements in brain tissue [77].
Table 2: Comparison of Enzyme Immobilization Strategies for Glucose Microbiosensors
| Immobilization Strategy | Mechanism | Performance Profile | Best Suited Application |
|---|---|---|---|
| Hydrogel Entrapment | Enzyme physically trapped within a polymer matrix (e.g., a hydrogel) [77]. | Highest sensitivity and stability; suitable for real-time monitoring of fluctuating analytes [77]. | Simultaneous monitoring of glucose and dopamine in real time in brain tissue [77]. |
| Electrospun Nanofiber Entrapment | Enzyme entrapped within poly(vinyl alcohol) nanofibers [77]. | Effective over a large linear range; high stability [77]. | Targeting high glucose concentrations (e.g., in blood) [77]. |
| Physical Adsorption | Enzyme adsorbed onto the electrode surface via weak physical forces [77]. | Poor sensitivity and unstable performance; simple to implement [77]. | Limited to preliminary or short-term studies due to instability [77]. |
Advanced Interface Engineering for Real-Sample Applications
Nanostructure and Microfluidic Integration
Optimizing the physical structure of the transducer is a powerful interface engineering strategy. Work on porous silicon (PSi) Fabry-Pérot aptasensors for detecting lactoferrin (a GI inflammatory biomarker) demonstrated that performance in complex biofluids can be drastically improved by rational design. By optimizing the PSi nanostructure—specifically, by decreasing layer thickness and increasing pore diameter—researchers reduced mass transfer limitations and achieved a limit of detection (LOD) of 50 nM, an order of magnitude improvement over previous designs [74]. Furthermore, integrating the optimized PSi sensor into 3D-printed microfluidic systems featuring passive staggered herringbone micromixers (SHMs) or active microimpellers enhanced convection, delivering fresh analyte to the sensor surface and lowering the LOD by another order of magnitude [74]. This approach directly addresses validation challenges in complex matrices like GI fluid.
Surface Cleaning and Antifouling Strategies
For electronic biosensors like carbon nanotube field-effect transistors (CNT-FETs), performance is highly susceptible to contamination introduced during fabrication. An interface cleaning strategy using inductively coupled plasma oxygen (ICP-O2) and ozone (O3) treatment was shown to remove contaminants, leading to a ~20% increase in transconductance and a ~19% increase in carrier mobility [75]. Critically, this cleaning protocol created a more uniform surface for biofunctionalization, improving the density of immobilized aptamer probes and resulting in a 6.6-fold increase in sensitivity. This engineered interface enabled the ultrasensitive detection of IL-6 in the complex tear matrix, achieving an LOD of 1.37 aM and demonstrating excellent consistency with ELISA [75]. Incorporating antifouling molecules like methoxypolyethylene glycol (PEG) is also a widely recommended strategy to minimize non-specific binding in real samples [73] [74].
Experimental Protocols for Key Strategies
Protocol 1: Antibody Immobilization via Cysteamine Hydrochloride (CH) Linker
This protocol is adapted from a study creating a highly sensitive "label-free" electrochemical immunosensor [76].
- Step 1: Electrode Modification. Prepare a gold electrode (GE) by polishing and cleaning. Modify the GE surface by drop-coating with a graphene-chitosan-Au/Pt nanoparticle (G-Chi-Au/PtNP) nanocomposite suspension and allow it to dry.
- Step 2: Self-Assembled Monolayer (SAM) Formation. Incubate the modified GE (GE-G-Chi-Au/PtNP) in an aqueous solution of cysteamine hydrochloride (e.g., 50 mM) for a set period (e.g., 1-2 hours) to form an amine-terminated SAM. Rinse thoroughly with water to remove physically adsorbed molecules.
- Step 3: Cross-Linker Attachment. Immerse the electrode in a solution of glutaraldehyde (e.g., 2.5% v/v) for about 1 hour. Glutaraldehyde reacts with the amine groups of cysteamine, presenting aldehyde groups on the surface.
- Step 4: Antibody Immobilization. Incubate the electrode with a solution of the specific monoclonal antibody (e.g., 100 µg/mL) for several hours (e.g., 12 hours at 4°C). The amine groups on the antibody's Fc region will covalently bind to the aldehyde groups.
- Step 5: Surface Blocking. To minimize non-specific binding, incubate the immunosensor with a blocking agent such as bovine serum albumin (BSA, 1% w/v) or methoxypolyethylene glycol amine (PEG) for 1 hour [76] [74]. The sensor is now ready for use or storage.
Protocol 2: Aptamer Immobilization on Oxidized Porous Silicon
This protocol is used for functionalizing optical PSi transducers for label-free detection [74].
- Step 1: Substrate Activation. Begin with a thermally oxidized PSi film. Immerse the film in a solution of (3-aminopropyl)triethoxysilane (APTES) (e.g., 1-2% v/v in anhydrous ethanol) for 1 hour to create an amine-functionalized surface. Rinse with ethanol and water, then cure at 110°C for 15 minutes.
- Step 2: Carboxyl Group Introduction. Incubate the aminated surface with a solution of succinic anhydride (e.g., 50 mM in acetonitrile) for 2 hours. This reaction converts surface amine groups to carboxyl groups.
- Step 3: Carboxyl Activation. Activate the carboxyl groups by immersing the sample in a fresh mixture of N-(3-dimethylaminopropyl)-N′-ethylcarbodiimide hydrochloride (EDC) and N-hydroxysuccinimide (NHS) (e.g., 50 mM and 25 mM in MES buffer, pH 6.0) for 30-45 minutes.
- Step 4: Aptamer Grafting. Incubate the activated surface with a solution of a 3'- or 5'-amino-modified aptamer (e.g., 1-5 µM in selection buffer) for 2-4 hours. The NHS-ester formed in Step 3 will react with the terminal amine group on the aptamer, forming a stable amide bond.
- Step 5: Surface Passivation. To deactivate any remaining activated esters and reduce non-specific adsorption, treat the surface with a 1 M ethanolamine solution (pH 8.5) or a PEG solution for 30 minutes. The PSi aptasensor is now functional [74].
The Scientist's Toolkit: Essential Research Reagent Solutions
Table 3: Key Reagents for Bioreceptor Immobilization and Interface Engineering
| Reagent / Material | Function / Application | Key Consideration |
|---|---|---|
| EDC & NHS | Activates surface carboxyl groups for covalent coupling to amine-containing bioreceptors (antibodies, amine-modified aptamers) [76] [74]. | Standard for carbodiimide chemistry; EDC is unstable in water, so solutions must be prepared fresh. |
| (3-Aminopropyl)triethoxysilane (APTES) | A silane coupling agent used to introduce primary amine groups onto oxide surfaces (e.g., SiO₂, PSi) [74]. | Enables further functionalization with cross-linkers like glutaraldehyde or EDC/NHS. |
| Cysteamine Hydrochloride | A short-chain, thiol-terminated molecule used to form a self-assembled monolayer (SAM) on gold surfaces, presenting amine groups for subsequent chemistry [76]. | Provides a stable and ordered foundation for building biointerfaces on gold transducers. |
| Glutaraldehyde | A homobifunctional cross-linker that reacts with amine groups, used to "bridge" aminated surfaces and amine-containing bioreceptors [76]. | Can lead to multi-point binding and heterogeneous orientation if not carefully controlled. |
| Methoxypolyethylene Glycol Amine (PEG) | Used as a blocking agent or spacer to passivate the sensor surface, dramatically reducing non-specific protein adsorption (biofouling) [74]. | Critical for enhancing sensor performance in complex, protein-rich biological samples. |
| Amino-Modified Aptamers | Single-stranded DNA or RNA molecules with a terminal amine modification for controlled, covalent immobilization on sensor surfaces [73] [74]. | Offers superior stability and shelf-life compared to antibodies; can be chemically synthesized. |
Workflow and Strategic Decision-Making
The following diagram illustrates the logical workflow for selecting and implementing an immobilization strategy, from surface preparation to validation.
Addressing Reproducibility and Stability Hurdles for Point-of-Care Deployment
The translation of biosensors from controlled laboratory settings to robust point-of-care (POC) deployments represents one of the most significant challenges in modern diagnostic development. For researchers and drug development professionals, achieving consistent performance in real biological samples is paramount, as variability in complex matrices like blood, urine, or saliva directly impacts diagnostic accuracy and therapeutic decision-making [78]. The REASSURED criteria (Real-time connectivity, Ease of sample collection, Affordable, Sensitivity, Specificity, User-friendly, Rapid and robust, Equipment-free, and Deliverable to end-users) provide a framework for evaluating POC potential, yet reproducibility and stability remain persistent hurdles that can delay clinical adoption [78].
This guide objectively compares emerging biosensor technologies against conventional alternatives, with a specific focus on experimental data demonstrating stability under realistic conditions and reproducibility across sample types. As the POC biosensor market accelerates toward a projected value of $45 billion by 2033, understanding these performance characteristics becomes crucial for directing research investment and development priorities [79].
Performance Comparison: Quantitative Analysis of Biosensor Technologies
Analytical Performance in Biological Matrices
Table 1: Performance comparison of biosensor technologies for key biomarkers
| Biomarker | Platform | Detection Method | Linear Range | LOD | Stability/Reproducibility Data | Sample Matrix |
|---|---|---|---|---|---|---|
| Glucose | GOx–PABA-GFET [80] | Amperometric (I-V) | 10 μM–1 mM | 4.1 μM | - | Urine |
| Glucose | Gox/N-GQDs/PANI [81] | Amperometric | 0.1-100 μM | 0.1 μM | <5% signal change after 1000 bends | Artificial sweat |
| Protein | BCG-modified SWCNT-FETs [80] | Conductance | 0.07–70 mg/L | 18.6 μg/L | - | Urine |
| Protein | GE/AuNPs/PTH-MB/MIP [80] | DPV | 0.1 ng/L–0.1 mg/L | 30 pg/L | - | Urine |
| Nitrite | 3D-printed G/PLA [80] | Amperometry | 0.5–250 μM | 0.03 μM | - | Urine |
| S. typhimurium | ZnO/Au-immunosensor [82] | Non-Faradaic EIS | 10-10⁷ CFU/mL | 9 CFU/mL | R² = 0.99 with standard methods; CV < 10% | Salad extract |
| PSA | MoS₂ FET [83] | FET | 1 pg/mL-1 μg/mL | 1 pg/mL | Stable across bending conditions | Serum |
| CEA | PEDOT:PSS/nFe₂O₃ [83] | Amperometric | 0.1-2000 ng/mL | 0.1 ng/mL | 95% activity after 30 days | Serum |
Stability Performance Under Operational Stress
Table 2: Stability assessment of biosensor platforms under POC-relevant conditions
| Sensor Platform | Flexibility Assessment | Thermal Stability | Storage Stability | Operational Lifetime | Signal Retention |
|---|---|---|---|---|---|
| PEN-film sweat sensor [81] | 1000 bending cycles | - | - | - | ~100% initial current |
| Gox/N-GQDs/PANI [81] | Continuous bending testing | - | - | - | 21.9% sensitivity increase vs. Gox/Pt |
| Agarose thin-film (CSD) [84] | - | - | 4 weeks | 30 assays | >90% initial response |
| Paper-based PEDOT:PSS [83] | - | - | 30 days | - | 95% activity maintained |
| ZnO/Au pathogen sensor [82] | - | - | - | Single use | CV < 10% (n=3) |
Experimental Protocols: Methodologies for Assessing Reproducibility and Stability
Flexibility and Bending Endurance Testing
Protocol Purpose: To evaluate the mechanical stability of flexible biosensors under repeated deformation similar to wearable use conditions [81].
Key Steps:
- Mount flexible sensor (e.g., PEN-film electrode) on motorized bending apparatus
- Set bending radius to 5-10 mm to simulate skin attachment
- Cycle at 0.5-1 Hz frequency for predetermined cycles (e.g., 1000 cycles)
- After set intervals (100, 500, 1000 cycles), perform electrochemical characterization
- Measure sensitivity, charge-transfer resistance (Rct), and baseline current
- Compare CV curves before and after bending tests
Validation Metrics: Signal retention >90%, overlapping CV curves, maintained sensitivity specification [81].
Non-Faradaic EIS for Live Pathogen Detection
Protocol Purpose: To selectively detect live pathogens in complex food matrices with minimal sample processing while distinguishing viable cells [82].
Key Steps:
- Electrode Functionalization:
- Modify ZnO/Au electrode with DTSSP crosslinker
- Immobilize monoclonal S. typhimurium antibodies (clone AC04)
- Block with SuperBlock buffer to minimize non-specific binding
Sample Preparation:
- Spike salad extract with serial dilutions of S. typhimurium (10-10⁷ CFU/mL)
- Minimal processing: homogenize and filter (0.45 μm)
Measurement:
- Apply 10-50 mV AC voltage at 0.1-1000 Hz frequency
- Monitor capacitance changes at electrode-electrolyte interface
- Measure impedance shifts without redox probes
Data Analysis:
- Plot normalized capacitance change vs. log concentration
- Calculate LOD using 3σ/slope method
- Compare with culture methods for validation [82]
Validation Metrics: LOD of 9 CFU/mL, R² > 0.99 with reference methods, CV < 10% across replicates [82].
Agarose Thin-Film Biosensor Validation
Protocol Purpose: To evaluate the analytical performance and reversibility of agarose-based biosensors for metabolites in biological samples [84].
Key Steps:
- Film Fabrication:
- Prepare 2% agarose in deionized water with heating
- Immobilize enzymes (Urease/GOx) and fluorophores (FITC-dextran/Rubpy)
- Cast into 0.5 mm thick films and dry at room temperature
Device Integration:
- Mount films in custom Color Sensor Device (CSD) with TCS3200 sensor
- Illuminate with white LEDs (450-750 nm)
- Measure RGB channel output frequencies
Performance Assessment:
- Test with spiked plasma and urine samples (n=5)
- Compare with fiber optic spectrometer reference
- Conduct reversibility testing with alternating sample/blank measurements
- Evaluate storage stability at 4°C over 4 weeks
Validation Metrics: Linearity (R² > 0.99), accuracy (>95% vs reference), signal reversibility (>90%), and reproducibility (CV < 5%) [84].
Signaling Pathways and Experimental Workflows
The Scientist's Toolkit: Essential Research Reagent Solutions
Table 3: Key research reagents and materials for POC biosensor development
| Reagent/Material | Function | Application Examples | Performance Considerations |
|---|---|---|---|
| Glucose Oxidase (GOx) | Enzyme recognition element | Glucose biosensors in sweat, urine [81] [84] | Subject to oxygen dependence; thermal denaturation |
| Gold Nanoparticles (AuNPs) | Signal amplification; electrode modification | S. typhimurium detection [82]; CEA detection [83] | Enhance conductivity; large surface area for immobilization |
| Molecularly Imprinted Polymers (MIPs) | Artificial recognition element | Protein detection [80] | Improved stability vs. biological receptors |
| Polydopamine/Melanin-like Coatings | Surface modification; biocompatibility | Environmental monitoring sensors [32] | Simple polymerization; strong adhesion properties |
| Reduced Graphene Oxide (rGO) | Conductive nanomaterial | Flexible electrodes; CEA detection [83] | High conductivity; mechanical flexibility |
| DTSSP Crosslinker | Antibody immobilization | Pathogen sensor functionalization [82] | Stable covalent binding; preserved antibody activity |
| FITC-dextran | Fluorescent pH indicator | Agarose thin-film sensors [84] | Reversible response; photostability concerns |
| N-GQDs/PANI Nanocomposite | Flexible sensing layer | Non-invasive glucose monitoring [81] | Maintains conductivity under bending |
The comparative data presented in this guide reveals a clear trajectory in POC biosensor development: while significant advances in sensitivity have been achieved, stability and reproducibility in real-world conditions remain the critical barriers to clinical adoption. Flexible electrochemical platforms demonstrate particular promise for wearable monitoring, with nanocomposite materials maintaining performance under mechanical stress [83] [81]. Similarly, non-Faradaic EIS approaches enable specific detection in complex matrices without secondary labels, addressing reproducibility challenges in food safety applications [82].
For researchers and drug development professionals, the experimental protocols and material selections outlined provide a framework for systematically addressing these hurdles. The integration of artificial recognition elements, robust nanocomposite materials, and validation methodologies that simulate real-world conditions will be essential for advancing biosensors from research curiosities to reliable POC diagnostics that meet the stringent REASSURED criteria [78]. As the field progresses, standardized stability testing protocols and reproducibility metrics will become increasingly important for meaningful cross-platform comparisons and ultimately, clinical acceptance.
Automated sample processing is a critical frontier in modern biosensing and diagnostic research. The accurate detection of biomarkers in complex biological fluids—a core requirement for validating biosensors in real-world scenarios—is often compromised by manual, multi-step preparation protocols that introduce variability, contamination, and inefficiency [85] [86]. Microfluidic technologies have emerged as a transformative solution, enabling the integration and miniaturization of these laborious procedures onto a single chip. By precisely manipulating fluid volumes at the microscale, these systems automate the entire workflow from raw sample to analyzable product, significantly enhancing throughput, reproducibility, and sensitivity [87] [88]. This guide objectively compares the performance of various automated microfluidic platforms against conventional methods, providing researchers and drug development professionals with the experimental data and protocols necessary to evaluate these integrated solutions for their work in biosensor validation.
Performance Comparison of Microfluidic Platforms vs. Conventional Methods
The transition from manual bench-top protocols to automated microfluidic systems yields measurable improvements in key performance indicators. The following tables summarize experimental data comparing these approaches across various applications, from genomics to protein detection.
Table 1: Performance Comparison for Genomic Sample Preparation
| Platform / Method | Sample Input (Cells) | DNA Input | Library Conversion Efficiency | Mapping Rate | Key Application |
|---|---|---|---|---|---|
| Integrated Microfluidic Device [87] | ~1,000 (E. coli) | 50-100 pg | 5-15% | Reproducible | Low-input WGS, Clinical pathogens |
| Integrated Microfluidic Device [87] | ~10,000 (M. tuberculosis) | N/A | 5-15% | Reproducible | Slow-growing pathogens |
| Standard 'Low Input' Protocol [87] | >1,000,000 | 1 ng | 0.5-2% | Comparable | High-input WGS |
| Bench-top (Manual) Preparation [87] | ~10,000 (Soil micro-colony) | N/A | Significantly lower | Higher contamination | Environmental isolates |
Table 2: Performance Comparison for Protein Detection (Interleukin-10)
| Assay Method | Limit of Detection (LOD) | Limit of Quantification (LOQ) | Dynamic Range | Sample Volume | Analysis Time |
|---|---|---|---|---|---|
| SPRi Biosensor [86] | 0.45 pg/mL | 1.49 pg/mL | 1–1000 pg/mL | Minimal | Rapid, real-time |
| Commercial ELISA Kit 1 [86] | Above sample conc. | Above sample conc. | N/A | Large | Labor-intensive, long |
| Commercial ELISA Kit 2 [86] | Above sample conc. | Above sample conc. | N/A | Large | Labor-intensive, long |
Table 3: Throughput and Reproducibility in Microfluidic Systems
| System Feature | Conventional / Manual Methods | Automated Microfluidic Systems |
|---|---|---|
| Throughput (Samples per Run) | Limited by manual labor [87] | Up to 96 samples per device [87] |
| Droplet Uniformity (Size Variation) | Varies, often high | Below 5% to as low as <2% [88] |
| Inter-assay Coefficient of Variation (CV) | Often inadequately reported [85] | Can be maintained below 20% threshold [85] |
Experimental Protocols for Key Applications
Low-Input Whole-Genome Shotgun (WGS) Sequencing
This protocol details the automated preparation of sequencing libraries from low biomass samples, such as clinical pathogens or environmental micro-colonies, using an integrated PDMS microfluidic device [87].
- Step 1: Device Priming and Sample Loading. The 96-sample microfluidic device is first primed. Individual samples (e.g., ~10,000 M. tuberculosis cells in lysis buffer) are loaded into their dedicated input ports.
- Step 2: On-Chip Cell Lysis and DNA Extraction. Within each nanoliter-scale rotary reactor, cells are lysed through a combination of heat, detergents, and hydrolytic enzymes. The released genomic DNA is purified using Solid Phase Reversible Immobilization (SPRI) with magnetic beads, which are captured and washed using integrated filter valves.
- Step 3: Tagmentation and Library Build. The purified DNA is fragmented and tagged with sequencing adaptors in a single enzymatic step ("tagmentation") within the same reactor. The reaction is then stopped, and the library is cleaned up via a second SPRI bead capture.
- Step 4: Product Elution and Collection. The final sequencing library is eluted from the beads and directed to an output port for collection. The entire process, from cells to sequence-ready library, is completed automatically on the device.
SPRi Biosensor-Based Cytokine Quantification
This protocol describes the steps for sensitive, label-free quantification of bovine Interleukin-10 (IL-10) in serum and follicular fluid using a Surface Plasmon Resonance Imaging (SPRi) biosensor [86].
- Step 1: Biosensor Surface Functionalization. A gold SPRi chip is modified with a cysteamine linker. Subsequently, a polyclonal rabbit anti-bovine IL-10 antibody is immobilized onto this surface at an optimized concentration of 10 µg/mL.
- Step 2: Sample Injection and Real-Time Binding. Minimal volumes of standard solutions or pre-processed biological samples are injected over the functionalized sensor surface. Binding of IL-10 to the captured antibodies causes a local change in the refractive index, which is transduced in real-time as a shift in the resonance angle (SPRi signal).
- Step 3: Regeneration and Re-use. After each measurement, the sensor surface is regenerated using a mild acidic or basic solution to dissociate the bound antigen-antibody complex, allowing the same chip to be used for multiple analyses.
- Step 4: Data Analysis. A calibration curve is constructed by plotting the SPRi signal against the known concentrations of IL-10 standards (1-1000 pg/mL). The concentration of IL-10 in unknown samples is calculated by interpolating their SPRi signals against this curve.
The Scientist's Toolkit: Key Research Reagent Solutions
Successful implementation of automated microfluidic workflows relies on a set of essential reagents and materials. The following table details these key components and their functions.
Table 4: Essential Reagents and Materials for Microfluidic Sample Processing
| Item | Function in the Workflow | Key Characteristics |
|---|---|---|
| Polydimethylsiloxane (PDMS) [87] [85] | Material for fabricating flexible, transparent microfluidic chips. | Biocompatible, gas-permeable, enables rapid prototyping via soft lithography. |
| Solid Phase Reversible Immobilization (SPRI) Beads [87] | Magnetic beads for purifying, concentrating, and size-selecting nucleic acids on-chip. | Enable multiple clean-up steps in a single reactor; >80% recovery at picogram levels. |
| Transposase Enzyme (Tagmentation) [87] | Enzyme that simultaneously fragments DNA and ligates sequencing adaptors. | Streamlines library construction, reducing the number of required processing steps. |
| Immobilization Bioreceptors [85] [86] | Antibodies or other capture molecules fixed to the sensor surface. | High specificity and affinity for the target analyte (e.g., IL-10). |
| Polydopamine Coating [85] | A polymer layer used for robust, non-specific immobilization of bioreceptors on sensor surfaces. | Simplifies functionalization; improves signal and reduces variability compared to flow-based methods. |
| Surfactant Solutions [85] | Additives to aqueous solutions to modify surface tension within microchannels. | Critical for pre-wetting channels and mitigating bubble formation, a major source of variability. |
Workflow and Variability Analysis Diagrams
The following diagrams illustrate the integrated workflow of a microfluidic system and the key factors affecting the reproducibility of biosensing results.
Automated Microfluidic Processing Workflow
Factors Influencing Biosensor Replicability
Integrated microfluidic systems represent a paradigm shift in automated sample processing for biosensor validation and biomedical research. The experimental data and protocols presented in this guide objectively demonstrate their superior performance over conventional methods, particularly in managing precious, low-volume samples and generating highly reproducible, high-quality data. As these platforms continue to evolve with innovations in materials science, fluid dynamics, and intelligent automation, their role in accelerating drug development and enabling robust, point-of-care diagnostics will become increasingly indispensable. For researchers, adopting these integrated solutions is a crucial step toward overcoming the persistent challenges of sample preparation and unlocking the full potential of next-generation biosensors in real biological samples.
Proving Real-World Efficacy: Validation Frameworks and Benchmarking Against Gold Standards
The integration of biosensors into biomedical research and clinical diagnostics represents a paradigm shift in how biological data is collected and utilized. These devices, which combine a biological recognition element with a physicochemical detector, offer unprecedented potential for monitoring physiological function, detecting pathogens, and quantifying biomarkers [89]. However, their translation from laboratory prototypes to reliable tools for research and clinical decision-making hinges on the establishment of robust, standardized validation frameworks. Without such frameworks, data generated by biosensors may be unreliable, leading to misleading research conclusions and potential patient harm [90].
The Verification, Analytical Validation, and Clinical Validation (V3) framework provides a foundational approach for determining whether a biometric monitoring technology (BioMeT) is fit-for-purpose [90]. Originally articulated for digital health technologies, this framework is equally applicable to the broader field of biosensors, creating a common vocabulary and systematic evaluation process that bridges engineering, clinical science, and regulatory science. This guide objectively compares validation approaches across biosensor types, supported by experimental data and detailed protocols, to equip researchers and drug development professionals with the tools necessary to establish rigorous validation protocols for their biosensor applications.
The V3 Framework: Core Principles and Definitions
The V3 framework comprises three distinct but interconnected components that collectively provide comprehensive evidence of a biosensor's reliability and clinical utility [90]. Each component addresses a specific aspect of the biosensor's performance, creating a structured pathway from technical verification to clinical relevance.
Verification is the first component and involves a systematic evaluation of the biosensor's hardware and basic functionality. This process asks: "Was the device built right?" It entails ensuring that the biosensor correctly executes its intended engineering specifications under controlled conditions, typically at the sample-level sensor output stage. Verification occurs computationally in silico and at the bench in vitro, focusing on the device's operational fundamentals without yet considering complex biological contexts [90] [91].
Analytical Validation shifts the evaluation from whether the device was built right to whether it "measures the right thing." This stage occurs at the intersection of engineering and clinical expertise, translating the evaluation procedure from the bench to in vivo conditions. Analytical validation specifically assesses the data processing algorithms that convert sample-level sensor measurements into physiological metrics, determining whether these algorithms accurately generate the intended measures across the biosensor's intended range of use [90] [91]. For biosensors, this typically involves assessing fundamental performance parameters including sensitivity, specificity, limit of detection, and dynamic range.
Clinical Validation addresses the highest-level question: "Is the measurement clinically meaningful?" This stage demonstrates that the biosensor acceptably identifies, measures, or predicts a clinical, biological, physical, functional state, or patient experience in a defined context of use with a specific target population [90] [91]. Unlike analytical validation, which focuses on the accuracy of the measurement itself, clinical validation establishes the relationship between the biosensor's output and clinically relevant endpoints or outcomes.
Table 1: Core Components of the V3 Framework for Biosensors
| Validation Stage | Core Question | Focus of Evaluation | Typical Setting |
|---|---|---|---|
| Verification | "Was the device built right?" | Hardware functionality, sensor outputs, manufacturing quality | In silico and in vitro (bench) |
| Analytical Validation | "Does it measure the right thing accurately?" | Algorithm performance, signal processing, metric generation | Controlled in vivo and lab testing |
| Clinical Validation | "Is the measurement clinically meaningful?" | Correlation with clinical endpoints, predictive value, utility in target population | Clinical trials with patient cohorts |
The relationship between these components is sequential and foundational—each step builds upon the evidence collected in the previous one. A biosensor must successfully pass through all three stages to be considered truly fit-for-purpose for research or clinical applications [90].
Comparative Performance Analysis of Validated Biosensors
Different biosensor technologies have undergone various degrees of validation, with performance characteristics varying significantly based on their design, transduction mechanism, and intended application. The following analysis compares validation data across multiple biosensor types to illustrate how the V3 framework applies in practice.
Infectious Disease Detection Biosensors
The COVID-19 pandemic accelerated the development and validation of numerous biosensor platforms for pathogen detection. A comparative analysis of two carbon-based SARS-CoV-2 immunosensors demonstrates how material choices impact validation outcomes [92].
In a clinical study assessing screen-printed carbon (SPC) sensors, researchers achieved a sensitivity of 93.8% with oropharyngeal swab samples, though specificity was limited to 61.5%. The lower specificity was potentially attributed to positive results from co-habitants and healthy donors, as well as limitations in the reference RT-qPCR method which itself showed only 75.5% sensitivity. When the design was modified to use laser-induced graphene (LIG) electrodes, specificity improved to 86.17%, but sensitivity decreased to 68.93%, a reduction potentially caused by non-covalent LIG-mAb ligands reducing effective antigen-binding sites [92].
Both sensor types demonstrated exceptional analytical validation results with limits of detection for spike protein in phosphate-buffered saline near 1 fg/mL and no cross-reactivity to recombinant structural proteins of Epstein-Barr and Influenza. The time-to-result (5-12 minutes) and low production cost (under $2) represented significant advantages over traditional RT-qPCR, though the trade-offs between sensitivity and specificity highlight the importance of context-of-use in clinical validation [92].
Environmental Monitoring Biosensors
Genetically Engineered Microbial (GEM) biosensors represent a different class of devices, with distinct validation requirements. A novel GEM biosensor specific for Cd²⁺, Zn²⁺, and Pb²⁺ detection demonstrated linear response graphs for heavy metal concentration with R² values of 0.9809, 0.9761, and 0.9758, respectively [6]. The biosensor showed minimal response to non-specific metals including Fe³⁺ (R² = 0.0373), AsO₄³⁻ (R² = 0.3825), and Ni²⁺ (R² = 0.8498), confirming specificity during analytical validation.
This GEM biosensor was calibrated for low concentration detection (1-6 ppb) under normal bacterial physiological conditions (37°C, pH 7.0), with the engineered cells maintaining natural growth characteristics within the target heavy metal concentration range—an important verification of maintaining cellular function post-modification [6].
Broad-Spectrum Pathogen Detection Biosensors
Broad-spectrum biosensors capable of identifying diverse organisms present unique validation challenges as they use nonspecific reagents and standardized information acquisition to detect entire classes of pathogens [5]. Unlike traditional assays that require unique validation for each analyte, these systems can be characterized using representative species from across their breadth of coverage.
These biosensors, which include technologies like 16S ribosomal gene sequencing and PCR followed by electrospray ionization mass spectrometry, face validation paradigms that cannot reasonably require exhaustive testing of every possible reportable species [5]. Instead, a conceptual framework for their validation focuses on general performance characteristics using representative analytes, with the burden of identification and specificity resting heavily on bioinformatic analysis tools and signature-matching algorithms rather than biochemical specificity.
Table 2: Performance Comparison of Validated Biosensor Technologies
| Biosensor Type | Target Analyte | Sensitivity | Specificity | Limit of Detection | Reference |
|---|---|---|---|---|---|
| SPC Immunosensor | SARS-CoV-2 (OS samples) | 93.8% | 61.5% | 1 fg/mL (spike protein in PBS) | [92] |
| LIG Immunosensor | SARS-CoV-2 (NS samples) | 68.93% | 86.17% | 1 fg/mL (spike protein in PBS) | [92] |
| GEM Biosensor | Cd²⁺, Zn²⁺, Pb²⁺ | Linear response R² = 0.9809, 0.9761, 0.9758 | Minimal cross-reactivity to Fe³⁺, AsO₄³⁻, Ni²⁺ | 1-6 ppb range | [6] |
| CRISPR-Based Platform | Multiple miRNAs (Alzheimer's) | Femtomolar sensitivity | Low cross-reactivity (<5%) | 0.1 fM | [27] |
Experimental Protocols for Biosensor Validation
Implementing a robust validation protocol requires methodical experimentation at each V3 stage. The following sections detail essential protocols for verifying biosensor performance, analytically validating their measurements, and establishing clinical relevance.
Verification Protocols: Establishing Technical Foundation
Verification begins with fundamental technical characterization to ensure the biosensor hardware operates as designed.
Sensor Response Verification Protocol: Using standardized solutions with known analyte concentrations, measure sensor outputs across the intended operational range. For electrochemical sensors, this includes cyclic voltammetry and electrochemical impedance spectroscopy to confirm expected electrical behavior [92]. For optical biosensors, validate wavelength accuracy and intensity linearity using certified reference materials.
Environmental Robustness Testing: Subject the biosensor to varying environmental conditions (temperature, humidity, atmospheric pressure) within the expected operational range to verify performance stability. Document any drift or deviation from specifications.
Repeatability and Reproducibility Assessment: Perform repeated measurements of standardized samples across multiple lots of biosensors, different operators, and over time to establish precision metrics including coefficients of variation.
Analytical Validation Protocols: Assessing Measurement Performance
Analytical validation protocols quantitatively assess the relationship between the biosensor's signal and the target analyte.
Limit of Detection (LOD) and Quantification (LOQ) Determination: Prepare serial dilutions of the target analyte in appropriate matrix. LOD is typically determined as the concentration corresponding to the mean blank signal plus three standard deviations, while LOQ is set at the mean blank signal plus ten standard deviations or the lowest concentration meeting predefined precision and accuracy criteria [92] [6].
Cross-Reactivity and Interference Testing: Challenge the biosensor with structurally similar compounds, expected co-existing substances in the sample matrix, and potential interferents. For the SARS-CoV-2 immunosensors, this involved testing against recombinant proteins from related viruses (Epstein-Barr and Influenza) to confirm specificity [92].
Matrix Effect Evaluation: Compare biosensor performance in simple buffers versus complex biological matrices (serum, saliva, whole blood, environmental samples) to identify and quantify matrix effects. For the GEM biosensor, this involved confirming functionality in actual environmental water samples after initial calibration in controlled buffers [6].
Clinical Validation Protocols: Establishing Real-World Utility
Clinical validation connects biosensor measurements to clinically relevant outcomes in the target population.
Reference Method Comparison: For biosensors intended to replace or supplement existing measurements, conduct method comparison studies against the accepted reference method. Use appropriate statistical analyses (Passing-Bablok regression, Bland-Altman plots) to quantify agreement and systematic biases [92].
Diagnostic Accuracy Studies: For diagnostic biosensors, recruit participants representing the full spectrum of the target condition (confirmed cases, healthy controls, patients with confounding conditions). Calculate sensitivity, specificity, positive and negative predictive values, and likelihood ratios with confidence intervals [92].
Longitudinal Monitoring Validation: For biosensors intended for continuous monitoring, establish test-retest reliability, within-subject variability, and responsiveness to change over time through longitudinal studies with repeated measurements.
Experimental Workflow Visualization
The following diagram illustrates the complete V3 validation workflow for biosensors, from initial technical verification through clinical application:
Biosensor V3 Validation Workflow - This diagram illustrates the sequential process of biosensor validation, progressing from technical verification through analytical validation to clinical validation, with each phase building upon the previous one's outputs.
Research Reagent Solutions for Biosensor Validation
Implementing the V3 framework requires specific reagents and materials appropriate for each validation stage. The following table details essential research reagent solutions for biosensor validation protocols:
Table 3: Essential Research Reagents for Biosensor Validation Protocols
| Reagent/Material | Application in Validation | Specific Function | Examples from Literature |
|---|---|---|---|
| Recombinant Antigens/Proteins | Analytical specificity testing | Assessing cross-reactivity and specificity | SARS-CoV-2 spike protein, influenza proteins [92] |
| Certified Reference Materials | Verification and calibration | Establishing measurement traceability | Bovine Serum Albumin for Bradford assay [92] |
| Synthetic Oligonucleotides | Nucleic acid-based biosensor validation | Testing probe specificity and sensitivity | MicroRNA sequences for CRISPR-based detection [27] |
| Genetically Engineered Circuits | Whole-cell biosensor development | Creating biological recognition elements | CadA/CadR-eGFP circuit for heavy metal detection [6] |
| Functionalized Electrodes | Electrochemical biosensor verification | Providing sensing interface | Screen-printed carbon, laser-induced graphene electrodes [92] |
| Clinical Sample Panels | Clinical validation | Establishing real-world performance | Characterized nasopharyngeal, oropharyngeal swabs [92] |
Establishing a robust V3 protocol is not merely a regulatory hurdle but a fundamental scientific requirement for generating trustworthy data from biosensor technologies. The framework provides a systematic approach to bridge disciplinary divides between engineering, data science, and clinical practice, creating a common evidence base for evaluating biosensor performance [90].
As biosensor technologies continue to evolve toward greater complexity—incorporating nanomaterials, synthetic biology, artificial intelligence, and multiplexing capabilities—the principles of V3 become increasingly critical. The framework remains flexible enough to accommodate novel biosensor designs while maintaining rigorous standards for evaluating their performance. Future directions in biosensor validation will likely place greater emphasis on validating algorithm performance as analytical capabilities advance, particularly with machine learning approaches that may adapt and change over time [90] [5].
For researchers and drug development professionals, implementing a comprehensive V3 protocol from the earliest stages of biosensor development provides a strategic advantage. This approach not only generates the evidence necessary for regulatory approval and clinical adoption but also builds confidence in the technology among end-users and the scientific community. By systematically addressing verification, analytical validation, and clinical validation, the biosensor field can realize its potential to transform biomedical research, clinical diagnostics, and therapeutic monitoring.
The integration of biosensors into biomedical research and drug development heralds a new era of rapid, point-of-care diagnostics. However, the adoption of these innovative tools in critical decision-making processes requires rigorous validation against established analytical techniques. This guide provides a systematic comparison of biosensor performance with gold standard methods—High-Performance Liquid Chromatography (HPLC), Mass Spectrometry (MS), and Enzyme-Linked Immunosorbent Assay (ELISA)—focusing on their correlation in analyzing real biological samples. Such benchmarking is essential for establishing reliability and fostering confidence in biosensor technologies among researchers and regulatory bodies [23]. The complexity of biological matrices, including blood, milk, and tissue homogenates, presents significant analytical challenges that necessitate this thorough validation to ensure accurate and reproducible results [93] [94].
Comparative Analysis of Analytical Platforms
Understanding the fundamental principles, strengths, and limitations of each analytical technique is crucial for selecting the appropriate method for specific applications and for designing valid correlation studies.
Table 1: Technical Overview of Analytical Platforms
| Platform | Principle of Detection | Key Strengths | Inherent Limitations |
|---|---|---|---|
| Biosensors | Biorecognition event converted to electrical/optical signal via transducer [23]. | Rapid, portable, suitable for point-of-care use, minimal sample prep [95] [23]. | Susceptible to matrix effects, may have shorter dynamic range, requires cross-validation [23]. |
| ELISA | Antigen-antibody binding detected via enzyme-mediated colorimetric reaction [96]. | High specificity and sensitivity, high-throughput, well-established [97] [96]. | Requires specific antibodies, time-consuming, multiple washing steps, potential for cross-reactivity [96]. |
| HPLC/MS | Physical separation (chromatography) coupled with mass-based detection [97] [98]. | High accuracy, multi-analyte detection, considered a gold standard for quantification [97] [94]. | Expensive instrumentation, complex sample preparation, requires skilled operators [93] [98]. |
Key Performance Metrics and Correlation Data
Empirical data from comparative studies provides the most compelling evidence for the reliability of biosensors. The following section summarizes quantitative findings from recent investigations.
Biosensor and ELISA Correlation with Reference Methods
A study on psychophysiological monitoring demonstrates the utility of biosensors in complex biological contexts. When measuring heart rate (HR) and heart rate variability (HRV), biosensors utilizing photoplethysmography (PPG) showed strong agreement with clinical-grade electrocardiography (ECG), establishing their validity for naturalistic data collection in clinical and research settings [95].
In mycotoxin analysis, a novel nanobody-based indirect competitive ELISA (icELISA) was developed for detecting Aflatoxin M1 (AFM1) in milk, yogurt, and milk powder. This method demonstrated a strong correlation with HPLC, yielding a correlation coefficient (R²) of 0.9722. The icELISA showed excellent recoveries ranging from 95.40% to 111.33% with a low coefficient of variation (2.89-6.78%), confirming its accuracy and precision for food safety monitoring [96].
Direct ELISA and LC-MS/MS Correlation
A 2025 study on desmosine quantification, a biomarker for chronic obstructive pulmonary disease, directly compared a newly established ELISA with isotope-dilution LC-MS/MS. The results between the two methods exhibited an exceptionally high correlation coefficient of 0.9941 [97]. The study noted that while LC-MS/MS measurements initially deviated approximately 2-fold from theoretical values, recalibration using a revised molar extinction coefficient for desmosine brought the LC-MS/MS results to an average of 0.87 times the theoretical values, demonstrating that ELISA can achieve accuracy comparable to MS [97].
HPLC and IC-MS/MS for Multi-Analyte Detection
A comparative study of biogenic amines in fish products found a strong correlation between HPLC and Ion Chromatography-Mass Spectrometry (IC-MS/MS) for several amines. The highest correlation was observed for tyramine (R² = 0.9785), followed by cadaverine and putrescine [94]. This highlights that for specific analytes, well-optimized HPLC methods can perform on par with advanced mass spectrometric techniques, though the correlation for other amines was less consistent, underscoring the effect of the analyte and sample matrix on method performance [94].
Table 2: Summary of Correlation Data from Comparative Studies
| Analyte | Sample Matrix | Test Method | Reference Method | Correlation (R²) | Key Performance Metric |
|---|---|---|---|---|---|
| Aflatoxin M1 | Dairy Products | Nanobody icELISA [96] | HPLC [96] | 0.9722 [96] | Recovery: 95.4-111.3% [96] |
| Desmosine | Synthetic Solutions | ELISA [97] | LC-MS/MS [97] | 0.9941 [97] | High accuracy post-calibration [97] |
| Histamine | Fish Products | HistaSure ELISA [94] | IC-MS/MS [94] | 0.9903 [94] | Validated for food safety [94] |
| Tyramine | Fish Products | HPLC [94] | IC-MS/MS [94] | 0.9785 [94] | Best correlation among biogenic amines [94] |
Experimental Protocols for Method Correlation
To ensure the validity of biosensor data, a structured experimental approach for benchmarking is essential. The following protocols outline key steps for correlating biosensor data with established methods.
Protocol for Correlative Analysis of Small Molecules in Food Matrices
This protocol is adapted from the development and validation of an icELISA for Aflatoxin M1 [96].
- Sample Preparation: Spike the target analyte (e.g., AFM1) into the biological matrix (e.g., milk, yogurt). For complex matrices like yogurt, a 2-fold dilution may be necessary to mitigate matrix effects [96].
- Extraction and Cleanup: Use appropriate solvents (e.g., methanol) to extract the analyte. For HPLC validation, further purification with an immunoaffinity column is often required [96].
- Parallel Analysis:
- Biosensor/ELISA: Analyze samples using the biosensor or ELISA according to optimized conditions (e.g., specific antibody/nanobody concentration, incubation time, temperature).
- Chromatography (HPLC): Analyze the same sample extract using HPLC with fluorescence detection. Conditions may involve a C18 column, isocratic or gradient elution with a water-methanol/acetonitrile mobile phase, and fluorescence detection at specific wavelengths [96].
- Data Correlation: Plot the concentrations obtained by the test method (biosensor/ELISA) against those from the reference method (HPLC) and perform linear regression analysis to determine the correlation coefficient (R²) [96] [94].
Protocol for Biomarker Correlation Studies in Clinical Samples
This protocol is based on studies comparing ELISA and LC-MS/MS for biomarker quantification [97].
- Calibration Standard Preparation: Prepare a dilution series of the pure biomarker (e.g., desmosine) in a relevant buffer to create a calibration curve for both methods [97].
- Analysis of Validation Samples: Analyze a variety of samples (synthetic solutions, spiked biological fluids) in parallel using both ELISA and LC-MS/MS.
- Cross-Method Calibration Verification: Precisely measure the molar extinction coefficient of the analyte if using UV-Vis detection (e.g., in ELISA) to ensure accurate concentration calculations. Discrepancies with historical values can lead to systematic errors, as seen in the desmosine study [97].
- Statistical Comparison: Calculate the correlation coefficient and perform Bland-Altman analysis to assess the agreement between the two methods and identify any systematic biases [97].
Figure 1: Workflow for correlating biosensor data with gold standard methods, illustrating the critical steps from sample preparation to data analysis.
The Scientist's Toolkit: Essential Research Reagents and Materials
The successful development and validation of analytical methods rely on a suite of specialized reagents and materials.
Table 3: Essential Research Reagents and Materials
| Reagent/Material | Function | Application Examples |
|---|---|---|
| Nanobodies (VHH) | Single-domain antibodies used as highly stable and specific biorecognition elements [96]. | Detection of small molecules (e.g., Aflatoxin M1) in icELISA, offering superior stability over traditional antibodies [96]. |
| Monoclonal Antibodies (mAbs) | Highly specific antibodies that bind to a single epitope of the target analyte [96]. | Used as capture/detection antibodies in sandwich ELISA and various immunoassays [96]. |
| Enzyme Conjugates (e.g., HRP) | Enzymes linked to detection antibodies to catalyze a colorimetric, chemiluminescent, or electrochemical reaction for signal generation [96] [23]. | HRP is commonly used in ELISA and immunosensors for signal amplification and detection [96]. |
| Molecularly Imprinted Polymers (MIPs) | Synthetic polymers with tailor-made recognition sites for specific molecules, serving as artificial receptors [23]. | Used in electrochemical biosensors as stable, low-cost alternatives to biological recognition elements [23]. |
| Nanomaterials (AuNPs, Graphene) | Materials used to modify electrode surfaces, enhancing surface area, conductivity, and sensitivity [23]. | Gold nanoparticles (AuNPs) and graphene are used in electrochemical biosensors to improve signal transduction [23]. |
| Immunoaffinity Columns | Columns packed with antibody-bound beads for selective extraction and cleanup of target analytes from complex samples [96]. | Sample preparation for HPLC/LC-MS analysis of contaminants (e.g., mycotoxins) to remove interfering matrix components [96]. |
Figure 2: Functional relationships of key reagents in biosensor development and validation, showing the flow from analyte recognition to final data analysis.
The validation of biosensors in real biological samples research is a cornerstone of modern diagnostic development. For researchers, scientists, and drug development professionals, establishing the agreement between a novel biosensor and a reference standard method is paramount. This process relies fundamentally on a suite of statistical tools, primarily sensitivity, specificity, and Receiver Operating Characteristic (ROC) curves, to objectively quantify diagnostic performance. These metrics move beyond qualitative claims, providing a rigorous, data-driven framework to evaluate how well a biosensor can distinguish between diseased and non-diseased states in complex biological matrices.
The ROC curve, initially developed during World War II for detecting enemy objects on radar, was later introduced to psychology and medicine for perceptual detection and diagnostic decision-making [99] [100]. In clinical practice and biosensor research, test results are often continuous values. Converting these into a binary outcome (disease present or absent) requires defining an optimal cut-off value. The ROC curve is the primary analytical method used for this process, as it visually and statistically summarizes the trade-off between sensitivity and specificity across all possible threshold values [99]. A thorough understanding of these concepts is a prerequisite for the proper interpretation of biosensor performance and its translation from the laboratory to clinical application.
Core Concepts: Sensitivity, Specificity, and the ROC Curve
Sensitivity and Specificity
Sensitivity and specificity are the foundational parameters used to evaluate the performance of a diagnostic test against a gold standard.
- Sensitivity, or the true positive rate, is defined as the proportion of people who actually have the target disease that test positive. It is calculated as True Positives / (True Positives + False Negatives). A highly sensitive test is excellent for ruling out a disease; if a test has high sensitivity and returns a negative result, it is unlikely the disease is present (often summarized as "SnNout") [99] [101].
- Specificity, or the true negative rate, is the proportion of people without the disease who test negative. It is calculated as True Negatives / (True Negatives + False Positives). A highly specific test is valuable for ruling in a disease; a positive result from such a test strongly indicates the presence of the disease ("SpPin") [99] [101].
In an ideal scenario, a test would have 100% sensitivity and specificity. However, in practice, an inherent trade-off exists between these two metrics; as sensitivity increases, specificity tends to decrease, and vice-versa [99].
The Receiver Operating Characteristic (ROC) Curve
The ROC curve is a graphical plot that illustrates the diagnostic ability of a binary classifier system as its discrimination threshold is varied. It is created by plotting the True Positive Rate (Sensitivity) on the y-axis against the False Positive Rate (1 - Specificity) on the x-axis for all possible cut-off values [99] [100].
The key elements of an ROC curve are:
- The Point of Perfect Discrimination: This is the coordinate (0, 1) in the upper left corner, representing 100% sensitivity and 100% specificity.
- The Line of No-Discrimination: This is the diagonal line from (0,0) to (1,1). A test whose ROC curve lies on this line performs no better than random chance.
- Curve Proximity to Upper Left Corner: The closer the ROC curve is to the point (0, 1), the better the overall performance of the diagnostic test [101] [100].
Area Under the Curve (AUC)
The Area Under the ROC Curve (AUC), also known as the c-statistic, is a single scalar value that quantifies the overall ability of the test to discriminate between two outcomes. The AUC can be interpreted as follows [99] [101]:
- AUC = 1.0: Perfect test.
- AUC = 0.9 - 1.0: Excellent discrimination.
- AUC = 0.8 - 0.9: Good discrimination.
- AUC = 0.7 - 0.8: Fair discrimination.
- AUC = 0.5 - 0.7: Poor discrimination.
- AUC = 0.5: No discrimination, equivalent to random guessing.
Experimental Protocols for Diagnostic Agreement Studies
Standardized Methodology for Biosensor Evaluation
To ensure the validity and comparability of performance data, studies evaluating diagnostic agreement must adhere to rigorous experimental protocols. A typical workflow involves the following key stages, which are critical for the validation of biosensors in real biological samples:
1. Sample Collection and Cohort Definition: A well-defined cohort with known disease status is essential. For instance, a study evaluating SARS-CoV-2 antigen tests used 356 nasopharyngeal samples, comprising 170 PCR-positive and 186 PCR-negative samples from unique patients. Clinical variables, such as the time from the onset of symptoms, should be recorded from medical records [102].
2. Reference Standard Testing: The test under investigation must be compared to an accepted gold standard. In virology, this is often quantitative reverse transcription PCR (RT-qPCR). The reliability of the PCR platforms should be validated beforehand, showing high agreement and comparable Cycle threshold (Ct) values for common targets [102]. Samples are typically considered positive when amplification is detected for multiple viral genes.
3. Index Test Execution: The biosensor or rapid test is performed according to the manufacturer's instructions. For example, the Panbio COVID-19 Ag Rapid Test Device (Abbott) uses optical reading, while the SD-Biosensor STANDARD F COVID-19 Ag FIA uses a fluorescence immunoassay analyzer [102]. It is critical that personnel are blinded to the reference standard results to avoid bias.
4. Data Analysis and Statistical Calculation: Sensitivity and specificity with 95% confidence intervals (95% CI) are calculated using the reference standard as the truth. Sensitivity is often stratified according to viral load (using PCR Ct values) and days post symptom onset. Agreement between techniques is evaluated using the Cohen's kappa score, and differences in performance can be assessed with the McNemar's test [102].
Advanced Biosensor Technologies and Their Evaluation
Beyond traditional lateral flow assays, novel biosensor platforms are being rigorously validated. The performance characteristics of these technologies are also assessed using sensitivity, specificity, and ROC analysis.
- Cell-Based Biosensors: The Bioelectric Recognition Assay (BERA) uses live cells as recognition elements. In one development, monkey kidney (Vero) cells were engineered with electro-inserted monoclonal antibodies against the SARS-CoV-2 spike protein. Upon exposure to the virus, these cells produce a measurable change in their electrical properties. One study evaluated this biosensor using 110 positive and 136 negative RT-PCR samples, reporting a sensitivity of 92.7% and specificity of 97.8% [103].
- Aptamer-Based Biosensors: These use synthetic nucleic acid or peptide molecules as recognition elements. A meta-analysis of 14 studies on aptamer-based biosensors for SARS-CoV-2 found that a Surface Enhanced Raman Scattering (SERS) platform demonstrated a summary sensitivity of 97% and specificity of 98%, with an Area Under the SROC curve of 0.98, indicating excellent diagnostic accuracy [104].
- Optofluidic Biosensors: These devices integrate optics and microfluidics to detect single particles, such as pathogens, labeled with fluorescent markers. Their design parameters (e.g., illumination format, flow configuration) are optimized to maximize the signal-to-noise ratio, which directly impacts the sensitivity and the resulting ROC analysis [105].
Comparative Performance Data of Diagnostic Platforms
The following tables synthesize experimental data from various studies to compare the performance of different diagnostic platforms, highlighting how sensitivity is profoundly influenced by viral load.
Table 1: Comparative sensitivity of two WHO-approved rapid antigen tests stratified by PCR Ct value, indicative of viral load [102].
| Ct Value Range | Viral Load Category | Panbio Sensitivity (%) | SD-Biosensor Sensitivity (%) |
|---|---|---|---|
| ≤ 20 | High | 100.0 | 100.0 |
| 20 – 25 | High | 93.0 | 95.3 |
| 25 – 30 | Low | 41.3 | 52.2 |
| > 30 | Very Low | 5.0 | 17.5 |
Table 2: Overall performance characteristics of various biosensor platforms for SARS-CoV-2 detection.
| Biosensor Platform / Test | Overall Sensitivity (%) | Overall Specificity (%) | Reference |
|---|---|---|---|
| SD-Biosensor Ag Test | 36.5 - 60.0 | 97.3 - 100.0 | [102] [106] |
| Abbott (Panbio) Ag Test | 50.8 - 66.5 | 99.4 - 100.0 | [102] [106] |
| BERA Cell-Based Biosensor | 92.7 | 97.8 | [103] |
| Aptamer-Based SERS Platform | 97.0 | 98.0 | [104] |
The data in Table 1 underscores a critical concept in diagnostic agreement: sensitivity is not a fixed value but is highly dependent on the analyte's concentration. Both Ag-RDTs show excellent performance (sensitivity >93%) in samples with high viral loads (Ct ≤ 25) but perform poorly in samples with low viral loads (Ct > 25). This reinforces the principle that diagnostic tests are most reliable when the target analyte is present in sufficient quantities, a key consideration when validating biosensors against a gold standard.
The Scientist's Toolkit: Essential Research Reagent Solutions
The following table details key reagents and materials essential for conducting robust diagnostic agreement studies in biosensor research.
Table 3: Key research reagents and materials for diagnostic agreement experiments.
| Reagent / Material | Function in Experiment | Example from Literature |
|---|---|---|
| Reference Standard Kits | Provides the gold-standard result against which the biosensor is validated. | Allplex SARS-CoV-2 Assay (Seegene), TaqPath COVID-19 RT-qPCR Kit (Thermo Fisher) [102] [106]. |
| Biological Recognition Elements | The core of the biosensor that specifically binds the target analyte. | Anti-SARS-CoV-2 Spike Protein Monoclonal Antibodies [103], DNA/RNA aptamers [104]. |
| Cell Lines | Used as biorecognition elements or for biosensor fabrication in cell-based systems. | Monkey African Green Kidney (Vero) cells (ATCC CCL-81) [103]. |
| Universal Transport Media (UTM) | Preserves specimen integrity during transport and storage before testing. | Used for nasopharyngeal swabs in viral detection studies [102]. |
| Fluorescent Dyes/Labels | Tags for optical detection in fluorescence-based biosensors (e.g., optofluidic systems). | Fluorophore-conjugated antibodies or aptamers for pathogen detection [105]. |
| Screen-Printed Electrodes | The transducer in electrochemical biosensors, converting biological interaction to electrical signal. | Carbon-screen printed electrodes with Ag/AgCl reference used in the BERA biosensor [103]. |
The rigorous statistical analysis of diagnostic agreement, anchored by sensitivity, specificity, and ROC curves, is non-negotiable for the validation of biosensors in real-world research. As demonstrated by comparative studies, no single diagnostic platform is universally superior; each has a performance profile that must be understood in the context of its intended use. Factors such as viral load, time since symptom onset, and the specific technology platform significantly influence outcomes. For researchers and drug developers, a deep understanding of these metrics and the experimental protocols that generate them is essential for critically evaluating new technologies, optimizing their application, and ultimately translating innovative biosensors from the laboratory bench to the patient bedside, thereby advancing the fields of medical diagnostics and therapeutic development.
The translation of biosensors from laboratory prototypes to clinically viable point-of-care (POC) diagnostics requires rigorous assessment of their clinical utility and seamless workflow integration [30]. Clinical utility, defined as the likelihood that a test will prompt an intervention leading to improved health outcomes, serves as the critical endpoint for diagnostic validation [107]. For POC biosensors, this encompasses not only analytical performance but also practical implementation within clinical workflows, economic efficiency, and ultimate impact on patient care [108] [109]. This review examines the framework for evaluating POC biosensors through structured pilot studies and workflow integration analyses, providing researchers and drug development professionals with evidence-based methodologies for translating biosensor technologies into clinical practice.
The pathway from biosensor development to clinical implementation faces significant challenges. Despite extensive research output in biosensing technologies, relatively few platforms achieve successful commercial translation [110] [30]. This translational gap often results from insufficient attention to key aspects beyond analytical performance, including clinical utility, regulatory approval, manufacturing scale-up, and seamless integration into existing clinical workflows [30]. A holistic approach that addresses these factors through systematic pilot studies is therefore essential for successful POC biosensor implementation.
Defining Clinical Utility for POC Biosensors
Conceptual Framework and Hierarchical Models
Clinical utility extends beyond analytical and clinical validity to encompass the test's actual impact on patient management and health outcomes [107]. The Fryback and Thornbury hierarchical model positions clinical utility within a broader efficacy framework, emphasizing its role in connecting diagnostic results to improved patient outcomes [107]. Similarly, the ACCE model (Analytical validity, Clinical validity, Clinical utility, and Ethical, legal, and social implications) provides a structured approach for evaluating genetic tests, adaptable to POC biosensor assessment [107].
For POC biosensors, clinical utility can be demonstrated through multiple endpoints:
- Diagnostic Impact: Ability to accurately diagnose or rule out disease
- Therapeutic Impact: Guidance in selecting appropriate treatments or medications
- Management Impact: Influence on patient monitoring, follow-up scheduling, or additional testing
- Economic Impact: Cost-effectiveness through reduced hospital stays, fewer clinic visits, or optimized resource utilization [109] [111]
- Patient-Centered Outcomes: Reduced anxiety, improved satisfaction, or enhanced quality of life [107]
Relationship Between Analytical Performance and Clinical Utility
A biosensor's clinical utility is fundamentally dependent on its analytical and clinical validity [107]. Tests with suboptimal analytical performance inevitably demonstrate poor clinical utility due to false positive or negative results leading to incorrect diagnoses and inappropriate treatments [107]. The relationship between analytical performance and clinical utility must be established through rigorous validation in real-world clinical settings with appropriate patient populations [108].
Table 1: Key Components of Clinical Utility Assessment for POC Biosensors
| Component | Description | Assessment Methods |
|---|---|---|
| Diagnostic Accuracy | Ability to correctly identify target condition | Sensitivity, specificity, PPV, NPV compared to reference standard [108] |
| Clinical Impact | Influence on clinical decision-making | Changes in treatment plans, medication adjustments [107] |
| Workflow Integration | Compatibility with existing clinical processes | Time-motion studies, user satisfaction surveys [111] |
| Economic Value | Cost-benefit analysis of implementation | Cost-effectiveness analysis, resource utilization studies [109] |
| Patient Outcomes | Effect on health status and quality of life | Morbidity, mortality, quality of life measures [107] |
Methodologies for Pilot Studies
Study Design Considerations
Pilot studies for POC biosensors should employ designs that generate robust evidence of clinical utility. Randomized controlled trials (RCTs) represent the gold standard but may not always be feasible or ethical for diagnostic tests [108]. Alternative designs include:
- Matched-pair studies: Comparing outcomes between biosensor-guided decisions and standard diagnostic pathways
- Pre-post implementation studies: Assessing changes in outcomes before and after biosensor integration
- Decision curve analysis: Evaluating the net benefit of using the biosensor across different threshold probabilities [108]
When designing pilot studies, researchers must clearly define the intended use population, clinical setting, and comparator (current standard of care) [108]. Sample size calculations should account for both analytical performance metrics and clinical outcome measures, with particular attention to confidence intervals for sensitivity and specificity estimates.
Analytical Validation Protocols
Comprehensive analytical validation forms the foundation for assessing clinical utility. The following protocol outlines key experiments for POC biosensor validation:
Table 2: Essential Analytical Validation Experiments for POC Biosensors
| Experiment | Protocol | Acceptance Criteria |
|---|---|---|
| Precision | Repeatability: 20 replicates of 3 concentrations (low, medium, high) within one run [112]Reproducibility: 2 replicates of 3 concentrations across 5 days, multiple operators | CV ≤15% for precision studies [112] |
| Accuracy | Method comparison: 40-100 patient samples analyzed by both biosensor and reference method [112] | Slope = 1.00 ± 0.05, intercept ≈ 0, r² ≥0.95 |
| Linearity | Analyze 5-8 samples with concentrations spanning claimed measuring range [112] | % deviation from linearity ≤5% at each level |
| Limit of Detection (LoD) | Measure blank sample 20 times, calculate mean + 2SD; verify with low-concentration samples [112] | Signal-to-noise ratio ≥3:1 |
| Interference | Spike samples with potential interferents (hemoglobin, bilirubin, lipids, common medications) [112] | Recovery within ±10% of baseline |
Clinical Validation in Real Biological Samples
Validation in real biological matrices is crucial for demonstrating clinical utility. The complex composition of bodily fluids presents challenges including:
- Matrix effects: Nonspecific binding or signal interference from sample components
- Biomarker stability: Degradation or modification of target analytes during storage or processing
- Heterogeneity: Natural variation in sample composition across patient populations [30]
For blood-based biosensors, the high concentration of proteins like human serum albumin (35-60 mg mL⁻¹) and immunoglobulin G (6-16 mg mL⁻¹) can cause nonspecific adsorption, reducing sensitivity and specificity [30]. Similarly, saliva contains numerous compounds that can interfere with detection systems despite being less complex than blood [30]. Pilot studies should include method comparison using prospectively collected clinical samples representing the intended use population, with careful attention to pre-analytical factors such as sample collection, processing, and storage conditions [112] [30].
Figure 1: Pilot Study Workflow for POC Biosensor Clinical Validation. This workflow outlines the key stages in assessing biosensor performance and clinical impact, from sample collection through evidence synthesis. LOA: Limits of Agreement; PPV: Positive Predictive Value; NPV: Negative Predictive Value.
Workflow Integration Analysis
Assessing Operational Compatibility
Successful POC biosensor integration requires compatibility with existing clinical workflows without creating disruptions or excessive burden on healthcare staff [109] [111]. Workflow integration analysis should evaluate:
- Sample collection and processing: Minimal specimen requirements with no complex preparation steps
- Testing time: Rapid turnaround time compatible with clinical decision timelines
- User interface: Intuitive operation with minimal training requirements
- Result reporting: Seamless transfer to electronic health records or clear interpretation guidelines
- Maintenance requirements: Minimal downtime with clear protocols for quality control [109]
Time-motion studies conducted during pilot implementations can quantify the impact on staff workload and identify potential bottlenecks. These studies should document the total hands-on time, turnaround time from sample collection to result availability, and any workflow modifications required for biosensor implementation [111].
Usability and Training Considerations
POC biosensors are often operated by non-laboratory personnel, making usability a critical factor in clinical utility [111]. The ideal POC biosensor should feature:
- Simple operation: Minimal steps between sample collection and result interpretation
- Robust design: Resistance to common handling errors or environmental variations
- Clear indicators: Unambiguous result presentation with built-in quality flags
- Automated functions: Self-calibration, quality control monitoring, and error detection [109]
Training programs should be developed following the manufacturer's instructions for use but adapted to the specific clinical environment [111]. Competency assessment should be performed initially and at regular intervals, particularly for waived tests that may lack ongoing regulatory oversight [111].
Case Study: NSE Biosensor for Stroke Risk Assessment
A recent development of an electrochemical biosensor for neuron-specific enolase (NSE) quantification demonstrates a comprehensive approach to assessing clinical utility [113]. This case study illustrates key principles of pilot study design and workflow integration for POC biosensors.
Experimental Protocol and Performance Metrics
The NSE biosensor was evaluated using the following experimental protocol:
- Biosensor fabrication: Electrode modification with NSE-specific capture elements
- Sample preparation: Whole blood samples from mouse stroke models and human patients
- Measurement procedure: 20μL unprocessed whole blood applied to sensor surface
- Detection method: Electrochemical signal measurement with 5-minute assay time
- Comparison method: Parallel testing with hospital-standard electrochemiluminescence immunoassay (ECLIA)
Table 3: Performance Comparison of NSE Biosensor vs. Reference Method
| Parameter | NSE Biosensor | ECLIA Reference | Acceptance Criteria |
|---|---|---|---|
| LoD | 1.15 ng/mL | Not specified | ≤2.0 ng/mL |
| Sample Volume | 20 μL | >100 μL | ≤50 μL |
| Assay Time | 5 minutes | >60 minutes | ≤15 minutes |
| Sample Processing | None required | Centrifugation required | Minimal processing |
| Correlation (R²) | 0.972 (vs. ECLIA) | N/A | ≥0.95 |
| Clinical Correlation | Elevated NSE with stroke severity | Confirmed | Statistically significant |
The biosensor demonstrated strong correlation with the reference method (r=0.972) while offering significant advantages in speed, sample requirements, and operational simplicity [113]. Most importantly, it accurately quantified elevated blood NSE associated with more severe stroke, establishing its potential clinical utility in pre-hospital settings for stroke risk stratification [113].
Workflow Integration Advantages
The NSE biosensor offers several workflow integration benefits:
- Pre-hospital application: Potential for use by emergency personnel to identify stroke risk during transport
- Minimal sample processing: Elimination of centrifugation steps enables direct whole blood testing
- Rapid results: 5-minute turnaround enables therapeutic decisions within critical windows
- Portability: Compact design suitable for field use in ambulances or emergency departments [113]
When combined with existing stroke assessment methods, this biosensor could optimize patient triage and increase the likelihood of receiving time-sensitive interventions [113].
The Scientist's Toolkit: Essential Research Reagents and Materials
Successful pilot studies for POC biosensor validation require carefully selected reagents and materials that ensure reliable performance in complex biological matrices.
Table 4: Essential Research Reagents for POC Biosensor Validation
| Reagent/Material | Function | Considerations for Clinical Utility Assessment |
|---|---|---|
| Validated Antibodies | Target capture and detection | Specificity, affinity, cross-reactivity profiling in biological matrices [30] |
| Stable Reference Materials | Calibration and quality control | Matrix-matched to clinical samples (serum, whole blood, saliva) [112] |
| Blocking Agents | Minimize nonspecific binding | Effective in complex matrices without affecting target binding [30] |
| Signal Amplification Systems | Enhanced detection sensitivity | Compatibility with complex samples; minimal background interference [30] |
| Stabilizing Additives | Preserve biomarker integrity | Maintain analyte stability during sample storage and testing [112] |
| Interference Panels | Specificity assessment | Common interferents: hemoglobin, bilirubin, lipids, medications [112] |
Regulatory and Economic Considerations
Regulatory Pathway Integration
Pilot studies should be designed with regulatory requirements in mind, particularly for biosensors intended for clinical use. The FDA's Biomarkers, EndpointS, and other Tools (BEST) Resource provides guidelines for biomarker qualification [30]. Additionally, the Clinical Laboratory Improvement Amendments (CLIA) establish quality standards for laboratory testing, with complexity categorization (waived, moderate, high) impacting implementation feasibility [111].
For POC biosensors, the CLIA waiver category is particularly relevant, requiring demonstration of "simple laboratory examinations and procedures that have an insignificant risk of an erroneous result" [111]. Pilot studies should generate evidence supporting such categorization through ease-of-use testing with non-laboratory operators and robustness studies under varied conditions.
Health Economic Assessment
Economic evaluation forms an essential component of clinical utility assessment [109] [107]. Cost-effectiveness analysis should compare the biosensor not only against current diagnostic approaches but also against the standard of care without testing [108]. Elements to consider include:
- Direct costs: Test reagents, instrumentation, personnel time
- Downstream savings: Reduced hospital stays, fewer complications, optimized treatment
- Operational impacts: Time savings, workflow efficiency, resource allocation [109]
The Medical Device Innovation Consortium (MDIC) framework provides guidance on establishing both clinical and economic utility for in vitro diagnostics, recommending a self-assessment approach for developers to determine market viability [107].
Assessing clinical utility through structured pilot studies and workflow integration analysis is fundamental to translating POC biosensors from research tools to clinical assets. The framework presented emphasizes the multifaceted nature of this assessment, encompassing analytical performance, clinical impact, operational compatibility, and economic value. As the field advances, researchers should adopt these comprehensive evaluation methodologies to ensure that promising biosensor technologies fulfill their potential to improve patient care through accurate, accessible, and actionable diagnostic information at the point of care.
Successful translation requires interdisciplinary collaboration among scientists, clinicians, regulatory experts, and healthcare administrators. By addressing both technical and implementation challenges throughout the development process, the next generation of POC biosensors can overcome the translational gap and make meaningful contributions to personalized medicine and improved health outcomes.
Regulatory and Commercial Considerations for Biosensor Approval and Adoption
Biosensors are analytical devices that convert a biological response into an electrical signal, typically consisting of a biorecognition element (such as an enzyme, antibody, or DNA) and a physicochemical transducer (optical, electrochemical, piezoelectric, or thermal) [114] [115]. These devices drive a rapidly expanding global market with notable contributions to blood glucose monitoring and substantial potential in personalized medicine [114] [116]. Despite their potential, the transition of biosensors from research laboratories to widespread clinical and commercial applications involves navigating complex regulatory pathways and overcoming significant adoption barriers [114] [12]. This guide objectively compares the performance of various biosensor technologies and provides a detailed analysis of the regulatory and commercial landscape, framed within the broader context of validating biosensors in real biological samples.
Regulatory Pathways for Biosensor Approval
Navigating regulatory requirements is a critical step in the commercialization of biosensor technologies. Regulatory frameworks ensure safety, efficacy, and reliability but vary significantly across regions and present distinct challenges for developers.
United States Food and Drug Administration (FDA) Framework
The FDA has implemented several pathways to facilitate the approval of innovative medical devices, including biosensors.
- Traditional and Expedited Pathways: The FDA's standard premarket requirements include a focused review of a device's overall safety and effectiveness [117]. For areas of unmet need where traditional trials are infeasible, the FDA has outlined a "plausible mechanism pathway" [118]. This pathway allows for marketing authorization based on a plausible mechanism of action and early clinical data, particularly for products targeting specific, well-understood genetic abnormalities. It prioritizes rare, fatal, or severely disabling childhood diseases but is also available for common conditions with no proven alternatives [118].
- Digital Health Technologies: The FDA's Digital Health Center of Excellence maintains a list of authorized sensor-based Digital Health Technology (sDHT) medical devices [117]. These are typically non- or minimally invasive, wearable devices (e.g., smartwatches, rings, patches) designed for continuous or spot-check monitoring in non-clinical settings [117]. As of 2025, authorized devices include continuous glucose monitors (e.g., Dexcom G7), ECG features (e.g., on WHOOP and Samsung watches), and remote EEG monitoring systems (e.g., REMI) [117].
- Post-Market Surveillance: Under novel pathways like the "plausible mechanism pathway," sponsors are often required to collect robust real-world evidence (RWE) post-approval to confirm sustained efficacy and monitor for long-term safety signals [118].
Global Regulatory Landscape
A comparative analysis of regulatory frameworks across major markets reveals key differences and common challenges.
Table 1: Comparative Analysis of Biosensor Regulatory Frameworks Across Key Markets
| Region | Regulatory Authority | Key Focus Areas | Classification Approach | Unique Challenges |
|---|---|---|---|---|
| United States | Food and Drug Administration (FDA) | Safety & Effectiveness, Post-Market Surveillance [117] [118] | Risk-based | Stringent premarket requirements, Evolving pathways (e.g., plausible mechanism) [119] |
| European Union | European Medicines Agency (EMA) | Safety, Performance, CE Marking [120] | Risk-based (Class I-IV) | Navigating Medical Device Regulation (MDR) updates |
| India | Central Drugs Standard Control Organization (CDSCO) | Safety, Performance, Manufacturing Quality [120] | Risk-based | Harmonizing with international standards, Regulatory capacity [120] |
Globally, regulatory agencies emphasize Good Manufacturing Practices (GMP), risk-based device classification, validation, and post-market surveillance [120]. The stringent regulatory scenario is consistently identified as a key challenge, potentially delaying time-to-market for new products [116] [119].
Commercial Landscape and Market Considerations
The biosensors market is experiencing significant growth, driven by technological advancements and increasing application in healthcare.
Market Size, Segmentation, and Growth Drivers
The global biosensors market is a multi-billion dollar industry with a promising growth trajectory.
Table 2: Global Biosensors Market Size, Segmentation, and Forecasts
| Segment | 2024 Market Value (USD Billion) | Projected 2034 Market Value (USD Billion) | Compound Annual Growth Rate (CAGR) | Primary Drivers |
|---|---|---|---|---|
| Overall Market | 32.3 [119] | 68.5 [119] | 7.9% [119] | Chronic disease prevalence, Point-of-care demand, Tech advancements [116] [119] |
| U.S. Market | 10.2 [119] | - | - | High healthcare spending, Innovation hub, Strong regulatory framework [119] |
| By Product | ||||
| Non-wearable | 20.7 [119] | - | - | Point-of-care testing integration, Clinical accuracy [119] |
| Wearable | - | - | - | Personalized health monitoring, Consumer demand [115] [116] |
| By Technology | ||||
| Electrochemical | 13.4 [119] | - | - | Dominance in glucose monitoring, Chronic disease management [119] [115] |
| Optical | - | - | - | Versatility in analyte detection [114] |
Key market drivers include the rising prevalence of chronic diseases like diabetes and cardiovascular conditions, which creates demand for continuous monitoring devices [119]. There is also a growing need for point-of-care testing that provides rapid, cost-effective diagnostics outside centralized labs [116]. Furthermore, technological advancements in miniaturization, nanotechnology, and the integration of biosensors with the Internet of Things (IoT) and artificial intelligence (AI) are creating new capabilities and applications [116].
Key Commercial Challenges
Despite a positive outlook, the industry faces several hurdles:
- High Development Costs: The initial investment in biosensor technology, infrastructure, and navigating the regulatory process can be prohibitive, especially for smaller companies [116].
- System Integration and Standardization: Integrating novel biosensors with existing clinical laboratory systems or digital health platforms can be technically challenging. The lack of universal technological standards further complicates widespread adoption [114] [116].
- Data Security: As biosensors become more connected (e.g., via IoT), ensuring the security and privacy of patient data is a paramount concern [116].
Technical Performance and Validation in Real-World Samples
For researchers and developers, validating biosensor performance against traditional methods using complex biological samples is a critical step toward clinical acceptance.
Experimental Protocol for Biosensor Validation
A robust validation protocol should assess key analytical performance metrics and benchmark against established standards. The following workflow outlines a standard approach for electrochemical biosensor validation, commonly used for its sensitivity and ease of use [115].
(Biosensor Validation Workflow: A standard protocol for validating biosensor performance from fabrication to clinical utility assessment.)
Key Reagents and Materials for Biosensor Research
The development and validation of biosensors require a specific set of reagents and materials to ensure functionality and reliability.
Table 3: Essential Research Reagent Solutions for Biosensor Development
| Reagent/Material | Function | Example in Context |
|---|---|---|
| Biorecognition Elements | Provides selective binding to the target analyte [115]. | Enzymes (e.g., Glucose Oxidase), Antibodies, DNA probes, Whole cells [115] [121]. |
| Transducer Materials | Converts the biological recognition event into a measurable signal [115]. | Electrochemical electrodes, Optical fibers, Piezoelectric crystals [114] [115]. |
| Nanomaterials | Enhances signal amplification, sensitivity, and electrode surface area [115]. | Metallic nanoparticles, Carbon nanotubes, Graphene, Nanocomposites [115]. |
| Anti-fouling Coatings | Minimizes non-specific adsorption (NSA) from complex biological matrices, crucial for accuracy in real samples [114]. | Polyethylene glycol (PEG), Hydrogels, Self-assembled monolayers [114]. |
| Electron Mediators | Shuttles electrons in electrochemical biosensors, improving efficiency [122]. | Osmium complexes (e.g., Os(II)/Os(III)), Ferrocene derivatives [122]. |
Addressing Key Technical Challenges
Validation in real biological samples (e.g., serum, saliva, urine, blood) presents specific challenges that must be overcome for clinical adoption.
- Matrix Effects and Specificity: A major hurdle is minimizing non-specific adsorption (NSA), or fouling, from complex sample matrices, which can cause false positives or reduced sensitivity [114] [12]. This requires tandem development of the biosensor's probe and its anti-fouling surface chemistry [114]. Furthermore, demonstrating high specificity for the target analyte amidst interferents with similar structures is critical [121].
- Quantitative Performance vs. Traditional Methods: While traditional methods like ELISA, HPLC, and mass spectrometry are reliable, they are often time-consuming, require costly equipment, and must be conducted in centralized labs [12] [121]. Biosensors offer a compelling alternative with advantages in speed, cost, and portability. For example, a study on an enzyme-based glucose biosensor demonstrated that alternative data-processing approaches (e.g., a pseudo-equilibrium option) could extend the linear range and maintain high sensitivity for substrate concentrations well above the Michaelis constant, outperforming traditional steady-state measurements [122].
- Throughput and Integration: For adoption in clinical biochemistry laboratories, biosensors must demonstrate they can handle the high sample throughput typically processed by automated or robotic systems [114]. A significant financial investment would be required to integrate new sensor signaling technology into existing automated workflows [114]. A pragmatic approach may be to initially introduce biosensors for detecting less common or rare diseases where high-throughput automation is unnecessary and current diagnostic tools are limited [114].
The approval and adoption of biosensors are governed by a complex interplay of stringent regulatory pathways, a dynamic commercial landscape, and rigorous technical validation requirements. Regulatory bodies like the FDA are creating innovative pathways to accelerate the approval of promising technologies, particularly for unmet medical needs. Commercially, the market is poised for substantial growth, fueled by the rise in chronic diseases and technological convergence with AI and IoT. However, for biosensors to transition from research tools to mainstream clinical applications, developers must prioritize overcoming key technical challenges related to specificity, matrix effects, and integration into healthcare systems. Robust validation against gold-standard methods using real biological samples remains the cornerstone of demonstrating clinical utility and achieving regulatory and market success.
Conclusion
The successful validation of biosensors in complex biological samples is the critical gateway to their clinical and commercial impact. This journey requires a multidisciplinary approach that integrates fundamental biosensor design with a deep understanding of sample matrix challenges, employs systematic optimization frameworks like DoE, and adheres to rigorous, multi-tiered validation protocols. Future progress hinges on developing more robust and antifouling sensing interfaces, creating fully integrated 'sample-in-answer-out' systems, and generating extensive clinical data across diverse populations. By mastering these elements, researchers can transcend laboratory benchmarks and deliver transformative biosensing technologies that enhance diagnostic accuracy, enable personalized medicine, and ultimately improve patient outcomes in real-world healthcare settings.
References
- 1. : An Introduction – Environmental Microbiology... Biosensors [https://ebooks.inflibnet.ac.in/esp15/chapter/biosensors-an-introduction/]
- 2. A Review on Biosensors and Recent Development of Nanostructured Materials-Enabled Biosensors - PMC [https://pmc.ncbi.nlm.nih.gov/articles/PMC7915135/]
- 3. Biosensor - Wikipedia [https://en.wikipedia.org/wiki/Biosensor]
- 4. and Biosensors - Biomedical Engineering... | Fiveable Transducers [https://fiveable.me/biomedical-engineering-i/unit-5/biosensors-transducers/study-guide/fGrpzz9Y3xwZxmEh]
- 5. The value and validation of broad spectrum biosensors for ... [https://pmc.ncbi.nlm.nih.gov/articles/PMC3925709/]
- 6. Validation and calibration of a novel GEM biosensor for ... [https://bmcbiotechnol.biomedcentral.com/articles/10.1186/s12896-023-00820-7]
- 7. Transducer Technologies for Biosensors and Their Wearable Applications - PMC [https://pmc.ncbi.nlm.nih.gov/articles/PMC9221076/]
- 8. Advances in Smart Biosensors for Real-Time Pollutant ... [https://www.sciencedirect.com/science/article/abs/pii/S0165993625003516]
- 9. Biosensors, Volume 15, Issue 11 (November 2025) [https://www.mdpi.com/2079-6374/15/11]
- 10. Evaluating and mitigating clinical samples matrix effects on ... [https://pmc.ncbi.nlm.nih.gov/articles/PMC9374283/]
- 11. Matrix-insensitive protein assays push the limits of ... [https://pmc.ncbi.nlm.nih.gov/articles/PMC4165514/]
- 12. Advances and challenges in biosensor-based diagnosis of ... [https://pmc.ncbi.nlm.nih.gov/articles/PMC4104499/]
- 13. Matrix Effects—A Challenge toward Automation of ... [https://www.sciencedirect.com/science/article/pii/S1535553510000158]
- 14. Evaluating and mitigating clinical samples matrix effects on ... [https://www.nature.com/articles/s41598-022-17583-4]
- 15. High-performance electrochemical biosensor comprising ... [https://www.nature.com/articles/s42004-025-01703-y]
- 16. Lab-on-Paper Devices for Diagnosis of Human Diseases ... [https://www.mdpi.com/2079-6374/11/8/260]
- 17. Context-Aware Biosensor Design Through Biology-Guided ... [https://pmc.ncbi.nlm.nih.gov/articles/PMC12186671/]
- 18. Critical overview on the application of sensors and biosensors ... [https://pmc.ncbi.nlm.nih.gov/articles/PMC7112812/]
- 19. Introduction to biosensors - PMC [https://pmc.ncbi.nlm.nih.gov/articles/PMC4986445/]
- 20. Biosensors Metrics Glossary of Definitions - Zimmer & Peacock [https://www.zimmerpeacocktech.com/knowledge-base/faq/biosensors-glossary/]
- 21. Applications and development trend of biosensors in the ... [https://pmc.ncbi.nlm.nih.gov/articles/PMC12131493/]
- 22. Detection limit [https://en.wikipedia.org/wiki/Detection_limit]
- 23. Point-of-care biosensors for infectious disease diagnosis [https://pubs.rsc.org/en/content/articlehtml/2025/ra/d5ra03897a?page=search]
- 24. Design and simulation of a graphene-integrated SPR ... [https://pmc.ncbi.nlm.nih.gov/articles/PMC12264435/]
- 25. Next-generation COVID-19 detection using a metasurface ... [https://www.nature.com/articles/s41598-025-18753-w]
- 26. Biosensors, Volume 15, Issue 8 (August 2025) – 85 articles [https://www.mdpi.com/2079-6374/15/8]
- 27. Biosensors, Volume 15, Issue 6 (June 2025) – 62 articles [https://www.mdpi.com/2079-6374/15/6]
- 28. Maximising the translation potential of electrochemical ... [https://pmc.ncbi.nlm.nih.gov/articles/PMC12355650/]
- 29. The Example of Blood Glucose Meters [https://www.mdpi.com/2227-9040/13/8/300]
- 30. A holistic pathway to biosensor translation - RSC Publishing [https://pubs.rsc.org/en/content/articlehtml/2024/sd/d4sd00088a]
- 31. The Translational Potential of Electrochemical DNA-Based ... [https://www.frontiersin.org/journals/chemistry/articles/10.3389/fchem.2020.00143/full]
- 32. Biosensors, Volume 15, Issue 9 (September 2025) [https://www.mdpi.com/2079-6374/15/9]
- 33. Recent Advances in Electrochemical Biosensors [https://pmc.ncbi.nlm.nih.gov/articles/PMC8472208/]
- 34. Application of artificial intelligence in electrochemical ... [https://link.springer.com/article/10.1007/s44373-025-00042-w]
- 35. Advances in electrochemical sensors for real-time glucose ... [https://pubs.rsc.org/en/content/articlehtml/2024/sd/d4sd00086b]
- 36. Research Progress of Electrochemical Biosensors for ... [https://pmc.ncbi.nlm.nih.gov/articles/PMC12024860/]
- 37. Advances in Biosensors for Continuous Glucose ... [https://pmc.ncbi.nlm.nih.gov/articles/PMC8416677/]
- 38. Biosensors, Volume 15, Issue 7 (July 2025) – 74 articles [https://www.mdpi.com/2079-6374/15/7]
- 39. Biosensors [https://research.njit.edu/smart/biosensors]
- 40. A high-performance BaTiO3/Ag/BP-based plasmonic ... [https://www.sciencedirect.com/science/article/abs/pii/S0924424725009276]
- 41. Recent advances in optical biosensors for the detection of ... [https://www.sciencedirect.com/science/article/abs/pii/S0165993620301497]
- 42. On the sensing performance improvement in SPR ... [https://pmc.ncbi.nlm.nih.gov/articles/PMC12322250/]
- 43. Breaking barriers in cancer diagnosis - RSC Publishing [https://pubs.rsc.org/en/content/articlehtml/2025/ra/d4ra08212e]
- 44. Optical biosensors: a decade in review [https://www.sciencedirect.com/science/article/pii/S1110016822008249]
- 45. Nanoplasmonic Biosensors: A Comprehensive Overview ... [https://pmc.ncbi.nlm.nih.gov/articles/PMC12067471/]
- 46. Plasmonic SPR biosensor with bayesian regression for ... [https://www.nature.com/articles/s41598-025-22949-5]
- 47. A comparison of optical, electrochemical, magnetic, and ... [https://pmc.ncbi.nlm.nih.gov/articles/PMC6736529/]
- 48. Lab on chip for medical and clinical applications [https://pubs.rsc.org/en/content/articlehtml/2025/sd/d5sd00096c]
- 49. Introduction to lab-on-a-chip 2024: review, history and future [https://elveflow.com/microfluidic-reviews/introduction-to-lab-on-a-chip-review-history-and-future/]
- 50. Advancing healthcare through laboratory on a chip technology [https://pmc.ncbi.nlm.nih.gov/articles/PMC11577522/]
- 51. Microfluidics chips fabrication techniques comparison [https://www.nature.com/articles/s41598-024-80332-2]
- 52. fulfilling the promise of lab-on-a-chip technologies - PMC [https://pmc.ncbi.nlm.nih.gov/articles/PMC10964744/]
- 53. Recent advances in bio-microsystem integration and Lab- ... [https://www.nature.com/articles/s41378-025-00940-4]
- 54. Biochips on the Move: Emerging Trends in Wearable and ... [https://www.mdpi.com/2079-9292/14/16/3224]
- 55. Revisiting lab-on-a-chip technology for drug discovery - PMC [https://pmc.ncbi.nlm.nih.gov/articles/PMC6493334/]
- 56. Recent advancements in microfluidic-based biosensors for ... [https://www.sciencedirect.com/science/article/pii/S2590137024000530]
- 57. A Proof-of-Concept Study on Bioelectric-Based Biosensing ... [https://pmc.ncbi.nlm.nih.gov/articles/PMC12384445/]
- 58. Biosensors Designed for Clinical Applications - PMC [https://pmc.ncbi.nlm.nih.gov/articles/PMC8301448/]
- 59. A Proof-of-Concept Study on Bioelectric-Based Biosensing ... [https://pubmed.ncbi.nlm.nih.gov/40862963/]
- 60. A Proof-of-Concept Study on Bioelectric-Based Biosensing ... [https://www.mdpi.com/2079-6374/15/8/503]
- 61. A capacitance biosensor for prostate cancer detection via ... [https://www.sciencedirect.com/science/article/pii/S0956566325006670]
- 62. Bioelectric Impedance Analysis Test Improves the ... [https://pmc.ncbi.nlm.nih.gov/articles/PMC8430220/]
- 63. Quantum Dot-Enabled Biosensing for Prostate Cancer ... [https://pmc.ncbi.nlm.nih.gov/articles/PMC12348777/]
- 64. Revolutionizing drug development: harnessing the potential of ... [https://pmc.ncbi.nlm.nih.gov/articles/PMC10166826/]
- 65. Applications of EIS, Organ-on-a-Chip, and Ingestible ... [https://www.sciencedirect.com/science/article/pii/S1452398125002536]
- 66. Sophisticated Interfaces Between Biosensors and Organoids [https://pmc.ncbi.nlm.nih.gov/articles/PMC12467644/]
- 67. Everything's under Control: Maximizing Biosensor ... [https://pmc.ncbi.nlm.nih.gov/articles/PMC11840803/]
- 68. Transformative biomedical devices to overcome biomatrix ... [https://www.sciencedirect.com/science/article/abs/pii/S0956566325002477]
- 69. Matrix Effect Study and Immunoassay Detection Using ... [https://pmc.ncbi.nlm.nih.gov/articles/PMC6187333/]
- 70. Perspectives on systematic optimization of ultrasensitive ... [https://pubs.rsc.org/en/content/articlehtml/2024/tc/d4tc02131b]
- 71. Design of Experiments | Statistics Knowledge Portal [https://www.jmp.com/en/statistics-knowledge-portal/design-of-experiments]
- 72. Advanced SPR biosensor with optimized gold-TiO2 D ... [https://www.nature.com/articles/s41598-025-24697-y]
- 73. Biochemistry strategies for label-free optical sensor ... [https://link.springer.com/article/10.1007/s00216-021-03751-4]
- 74. Enhancing the performance of porous silicon biosensors [https://www.nature.com/articles/s41378-024-00738-w]
- 75. Interface Cleaning Strategy of Carbon Nanotube Field ... [https://pubmed.ncbi.nlm.nih.gov/40390229/]
- 76. Explore how immobilization strategies affected ... [https://www.nature.com/articles/s41598-022-26768-w]
- 77. Quantitative Comparison of Enzyme Immobilization ... [https://pubmed.ncbi.nlm.nih.gov/29316144/]
- 78. Point-of-care biosensors for infectious disease diagnosis [https://pmc.ncbi.nlm.nih.gov/articles/PMC12377050/]
- 79. Point-of-Care Biosensors 2025-2033 Analysis [https://www.archivemarketresearch.com/reports/point-of-care-biosensors-837457]
- 80. Recent Advances in Biosensor Technologies for Point-of-Care ... [https://pmc.ncbi.nlm.nih.gov/articles/PMC9688579/]
- 81. A new generation of sensors for non-invasive blood ... [https://pmc.ncbi.nlm.nih.gov/articles/PMC10331674/]
- 82. Label-Free Electrochemical Biosensor for Real-Time ... [https://www.sciencedirect.com/science/article/abs/pii/S0956566325008371]
- 83. Flexible biochemical sensors for point-of-care management of ... [https://pmc.ncbi.nlm.nih.gov/articles/PMC9465157/]
- 84. Point-of-care devices for thin-film-based biosensors for the ... [https://www.sciencedirect.com/science/article/abs/pii/S0009898125004395]
- 85. factors shaping assay yield and variability in microfluidics ... [https://pubs.rsc.org/en/content/articlehtml/2025/lc/d5lc00575b]
- 86. A Novel Surface Plasmon Resonance Imaging (SPRi ... [https://www.mdpi.com/1422-0067/26/21/10395]
- 87. High-throughput automated microfluidic sample ... [https://www.nature.com/articles/ncomms13919]
- 88. Innovative Advances in Droplet Microfluidics - PMC [https://pmc.ncbi.nlm.nih.gov/articles/PMC12384975/]
- 89. Advancing protein biosensors: redefining detection through ... [https://pubs.rsc.org/en/content/articlehtml/2025/ra/d4ra06791f]
- 90. Verification, analytical validation, and clinical validation (V3) [https://www.nature.com/articles/s41746-020-0260-4]
- 91. Verification, analytical validation and clinical validation (V3) of ... [https://pmc.ncbi.nlm.nih.gov/articles/PMC9806438/]
- 92. Performance assessment of disposable carbon-based ... [https://www.nature.com/articles/s41598-025-92104-7]
- 93. Biopharmaceutical analysis — current analytical ... [https://link.springer.com/article/10.1007/s00216-025-06036-2]
- 94. Analysis of Biogenic Amines Using Immunoassays, HPLC ... [https://www.mdpi.com/1420-3049/26/20/6156]
- 95. Leveraging biosensors in clinical and research settings [https://www.nature.com/articles/s44277-025-00037-w]
- 96. Nanobody-based indirect competitive ELISA for the ... [https://www.nature.com/articles/s41598-024-83869-4]
- 97. Correlation between LC-MS/MS and ELISA methods for ... [https://pubmed.ncbi.nlm.nih.gov/40947852/]
- 98. Comparison of ELISA and HPLC-MS methods for the ... [https://pmc.ncbi.nlm.nih.gov/articles/PMC6598173/]
- 99. Receiver operating characteristic curve: overview and ... [https://pmc.ncbi.nlm.nih.gov/articles/PMC8831439/]
- 100. Receiver operating characteristic [https://en.wikipedia.org/wiki/Receiver_operating_characteristic]
- 101. ROC-ing along: Evaluation and interpretation of receiver ... [https://www.sciencedirect.com/science/article/abs/pii/S0039606016000660]
- 102. Comparative evaluation of Panbio and SD Biosensor ... [https://pmc.ncbi.nlm.nih.gov/articles/PMC8242635/]
- 103. Development and performance characteristics evaluation of a ... [https://pmc.ncbi.nlm.nih.gov/articles/PMC8051012/]
- 104. Diagnostic accuracy of aptamer-based biosensors for the ... [https://www.sciencedirect.com/science/article/pii/S2405844025017463]
- 105. Performance Comparison of Flow-Through Optofluidic ... [https://www.mdpi.com/2079-6374/11/7/226]
- 106. Sensitivity and specificity of two WHO approved SARS-CoV2 ... [https://bmcinfectdis.biomedcentral.com/articles/10.1186/s12879-022-07240-6]
- 107. The Concept of Clinical Utility for Diagnostic Tests [https://myadlm.org/cln/cln-industry-insights/2023/the-concept-of-clinical-utility-for-diagnostic-tests]
- 108. Methods for determining clinical utility [https://www.sciencedirect.com/science/article/abs/pii/S0009912023002023]
- 109. Point-of-care testing: a critical analysis of the market and ... [https://www.frontiersin.org/journals/lab-on-a-chip-technologies/articles/10.3389/frlct.2024.1394752/full]
- 110. A push towards disruptive biosensing technologies [https://www.nature.com/articles/s41565-025-02050-8]
- 111. Point of Care Testing [https://ascls.org/point-of-care/]
- 112. Point-of-Care Testing - StatPearls - NCBI Bookshelf [https://www.ncbi.nlm.nih.gov/books/NBK592387/]
- 113. Biosensors, Volume 15, Issue 4 (April 2025) – 66 articles [https://www.mdpi.com/2079-6374/15/4]
- 114. Challenges in the application of biosensor technology ... [https://www.frontiersin.org/journals/sensors/articles/10.3389/fsens.2025.1641221/full]
- 115. Wearable Biosensors: An Alternative and Practical ... [https://pmc.ncbi.nlm.nih.gov/articles/PMC7867046/]
- 116. Biosensors Market: Comprehensive Analysis and Forecast ... [https://www.pharmiweb.com/press-release/2025-02-13/biosensors-market-comprehensive-analysis-and-forecast-2025-2035]
- 117. Medical Devices that Incorporate Sensor-based Digital ... [https://www.fda.gov/medical-devices/digital-health-center-excellence/medical-devices-incorporate-sensor-based-digital-health-technology]
- 118. FDA announces “plausible mechanism” approval pathway ... [https://www.hoganlovells.com/en/publications/fda-announces-plausible-mechanism-approval-pathway-for-certain-personalized-therapies-with-few-detai]
- 119. Biosensors Industry Forecast Report 2025-2034 - The U.S. [https://www.globenewswire.com/news-release/2025/06/17/3100408/28124/en/Biosensors-Industry-Forecast-Report-2025-2034-The-U-S-Biosensors-Market-Thrives-Amid-Regulatory-Challenges-with-Innovation-and-Partnerships-Fuelling-Expansion.html]
- 120. Biosensors in wearable medical devices: Regulatory ... [https://pubmed.ncbi.nlm.nih.gov/40020872/]
- 121. Sensors and Biosensors as Viable Alternatives in the ... [https://www.mdpi.com/2227-9040/13/8/299]
- 122. Evaluation of alternative measurement and data ... [https://www.sciencedirect.com/science/article/abs/pii/S0003267099000781]