Label-Based vs. Label-Free Biosensors: A Comparative Analysis for Biomedical Research and Clinical Diagnostics
This article provides a comprehensive comparative analysis of label-based and label-free biosensing technologies, tailored for researchers, scientists, and drug development professionals.
Label-Based vs. Label-Free Biosensors: A Comparative Analysis for Biomedical Research and Clinical Diagnostics
Abstract
This article provides a comprehensive comparative analysis of label-based and label-free biosensing technologies, tailored for researchers, scientists, and drug development professionals. It explores the fundamental principles, inherent advantages, and limitations of each approach, from foundational concepts to cutting-edge applications. The scope includes a detailed examination of diverse methodological platforms such as electrochemical, optical, and plasmonic biosensors, alongside practical guidance for troubleshooting, assay optimization, and rigorous validation. By synthesizing insights from current literature, this review aims to equip practitioners with the knowledge to select the appropriate biosensing strategy for their specific needs in basic research, point-of-care testing, and clinical diagnostics, while also outlining future trajectories for the field.
Core Principles and Strategic Advantages of Biosensing Platforms
Defining Label-Based and Label-Free Biosensing Strategies
Biosensors are analytical devices that integrate a biological sensing element with a physicochemical transducer to detect specific analytes. They are indispensable tools in modern research, clinical diagnostics, and drug development, enabling the detection of disease biomarkers, monitoring of therapeutic agents, and study of biomolecular interactions. The core components of any biosensor include a biorecognition element (such as enzymes, antibodies, or nucleic acids) that provides specificity, a transducer that converts the biological response into a measurable signal, and an electronic system that processes and displays the results [1]. Biosensing technologies can be broadly classified into two fundamental strategies based on their detection mechanism: label-based and label-free methods, each with distinct advantages and applications in biomedical research.
The fundamental distinction between these strategies lies in their approach to signal generation. Label-based detection relies on molecular labels—such as enzymes, fluorescent tags, or nanoparticles—to generate a detectable signal upon analyte binding. In contrast, label-free detection measures intrinsic molecular properties or changes in the physical environment resulting from biomolecular interactions without requiring secondary reporting molecules [1] [2]. This comparative guide examines both strategies in detail, providing researchers with the experimental data and methodological insights needed to select the appropriate biosensing approach for their specific applications.
Fundamental Principles and Comparative Analysis
Label-Based Biosensing
Label-based biosensing employs molecular tags that generate a detectable signal to indicate analyte binding. This approach typically involves conjugating reporter molecules to either the analyte itself or a secondary binding agent. Common labels include enzymes that produce colorimetric, chemiluminescent, or electrochemical signals; fluorescent dyes; radioactive isotopes; and nanoparticles that enhance detection sensitivity [1].
The experimental workflow for label-based detection requires multiple preparation and washing steps to introduce labels, remove unbound reagents, and ultimately generate the measurable signal. For example, in a typical enzyme-linked immunosorbent assay (ELISA), the target protein is captured by an immobilized antibody, detected by an enzyme-conjugated secondary antibody, and then quantified by measuring the enzymatic conversion of a substrate into a colored product [1]. While these additional steps increase assay complexity and time, they often enable exceptional sensitivity and facilitate multiplexed detection of multiple analytes simultaneously.
Label-Free Biosensing
Label-free biosensing techniques detect biomolecular interactions by measuring intrinsic physicochemical changes that occur when analytes bind to the sensor surface, eliminating the need for fluorescent, enzymatic, or other reporter tags. These methods monitor changes in refractive index, mass, * electrical impedance, or *optical thickness that naturally accompany molecular binding events [3] [4] [2].
The fundamental advantage of label-free approaches lies in their ability to monitor interactions in real-time without modifying the native structure or function of the molecules being studied. This provides more physiologically relevant data on binding kinetics and affinity. As one review notes, label-free biosensing "allows one to investigate the underlying physical and chemical characteristics, and interactions, of target species by relying solely on their intrinsic physicochemical properties" [5]. This benefit comes with reduced sample preparation time, lower analysis cost, and minimal perturbation of the native biological system [5].
Table 1: Comparison of Fundamental Characteristics Between Label-Based and Label-Free Biosensing
| Characteristic | Label-Based Biosensing | Label-Free Biosensing |
|---|---|---|
| Signal Generation | Indirect, via labels (enzymes, fluoresence, etc.) | Direct, measures intrinsic properties (mass, RI) |
| Sample Preparation | Extensive (labeling, washing steps) | Minimal |
| Assay Time | Longer due to multiple steps | Shorter, real-time monitoring |
| Molecular Perturbation | Possible due to labeling | Minimal, maintains native state |
| Cost | Higher (reagents, labels) | Lower after initial investment |
| Information Obtained | Typically endpoint | Real-time kinetics and affinity |
| Multiplexing Potential | High with different labels | Possible but more complex |
Performance Metrics and Experimental Data
Sensitivity and Detection Limits
Both label-based and label-free biosensing platforms have demonstrated exceptional sensitivity in detecting biomolecules at clinically relevant concentrations. Label-based approaches, particularly those employing enzymatic or nanomaterial amplification, can achieve detection limits extending to the picomolar (pM) or even femtomolar (fM) range for protein biomarkers [1]. For example, electrochemical immunosensors utilizing redox-tagged, single-walled carbon nanohorns have successfully detected carcinoembryonic antigen (CEA), an important tumor marker, at clinically relevant concentrations [2].
Label-free platforms have made remarkable progress in sensitivity, with some advanced configurations surpassing conventional detection limits. Recent research published in Light: Science & Applications demonstrates a plasmonic biosensor based on phase singularity that achieved unprecedented sensitivity for cytokine detection. This platform detected cancer biomarkers TNF-α and IL-6 at concentrations as low as 1×10⁻¹⁶ M (0.1 fM), which represents approximately 0.2 zeptomole per mm² in a 200-μL flow chamber [6]. Such extraordinary sensitivity enables researchers to detect trace amounts of biomarkers that were previously undetectable with conventional methods.
Comparative Performance Across Techniques
The performance of different biosensing platforms varies significantly based on their underlying detection principles and optimal working ranges. Recent comparative studies provide valuable insights for researchers selecting appropriate methodologies for specific applications.
Table 2: Performance Comparison of Various Label-Free Biosensing Techniques with Thick Protein Layers
| Technique | Maximum Linear Measurement Range (nm) | Number of Protein Layers | Key Advantages |
|---|---|---|---|
| MP-SPR | 300-400 | >50 | Best for thick samples, predictable binding signal |
| BLI | 228-304 | 38 | Good linear range |
| QCM | 108-144 | 16-22 | Mass-sensitive |
| MSMA/FBAR | 72-96 | 9-12 | Compact platform |
A systematic study evaluating how label-free biosensors perform with varying layer thickness revealed that multi-parametric surface plasmon resonance (MP-SPR) outperformed other techniques for analyzing thick samples, showing predictable and sensitive binding signals for over 50 albumin-avidin layers, corresponding to 300-400 nm thick protein films [7]. This research highlights that the optimal biosensor selection depends significantly on the experimental aims and sample characteristics, as "the feasibility of the biosensor technique is dependent on the aim of the assay" [7].
Experimental Protocols and Methodologies
Label-Free Electrochemical Immunosensor for Pathogen Detection
The development of a label-free capacitive immunosensor for Escherichia coli O157:H7 detection demonstrates a representative protocol for label-free biosensing. This approach utilized a strontium titanate perovskite layer (SrTiO₃) synthesized on a platinum electrode, capitalizing on the material's interesting ferroelectric and dielectric properties [5].
The experimental methodology followed these key steps:
- Sensor Fabrication: SrTiO₃ perovskite layer synthesis on platinum electrode via appropriate deposition method
- Surface Functionalization: Immobilization of anti-E. coli O157:H7 antibodies on the SrTiO₃-modified electrode
- Blocking: Application of blocking agents (e.g., BSA) to minimize non-specific binding
- Sample Incubation: Exposure to E. coli O157:H7 at various concentrations
- Detection: Electrochemical impedance spectroscopy measurements focusing on capacitance changes
- Characterization: Atomic force microscopy (AFM) to verify surface modification and cell presence
This capacitive immunosensor demonstrated a linear detection range from 1 to 7 log cfu/mL with a detection limit of 1 log cfu/mL, showcasing the potential of perovskite materials in label-free biosensing applications [5].
Phase-Enhanced Plasmonic Biosensor for Ultrasensitive Detection
A groundbreaking label-free approach recently published demonstrates how phase singularity can enhance biosensing capabilities. The experimental protocol for this plasmonic biosensor based on Goos-Hänchen (GH) shift included [6]:
Substrate Fabrication: DC magnetron sputtering to create sensing layers on sapphire slides with specific structure:
- Amorphous Ge₂Sb₂Te₅ (GST, 1 nm) as phase-response-enhancing layer
- Silver (40 nm) as main plasmonic material
- Titanium (7 nm) as adhesion layer
Optical Configuration: Sensor coupling with SF11 prism in Kretschmann configuration
Measurement Principle: Differential GH shift measurement between p- and s-polarized light
- (\Delta {GH}=-\frac{{\lambda }{1}}{2\pi {n}{1}}\,\left(\frac{\partial {{\rm{\phi }}}{p}-\partial {{\rm{\phi }}}{s}}{\partial \theta }\right))
- Where ({\lambda }{1}) and ({n}{1}) refer to incident light wavelength and prism refractive index
- (\theta) and ({\rm{\phi }}) represent incident angle and reflection phase shift
Biomolecular Detection: Functionalization with specific antibodies for target cytokines (TNF-α and IL-6)
This innovative approach achieved a record-breaking position shift of 439.3 μm with an ultra-high sensitivity of 1.72 × 10⁸ nm RIU⁻¹ and a detection limit of 6.97 × 10⁻⁷ RIU [6].
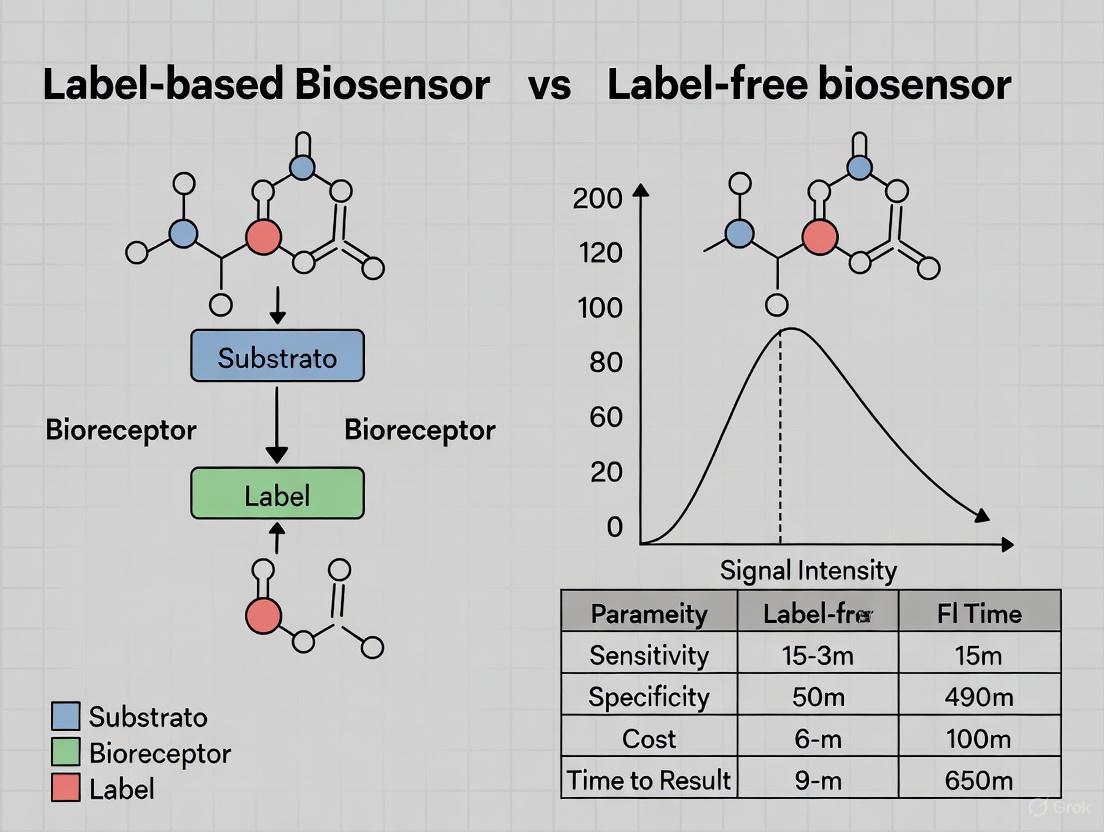
Diagram: Experimental Workflow Comparison Between Label-Based and Label-Free Biosensing Strategies
Essential Research Reagents and Materials
Successful implementation of biosensing strategies requires specific reagents and materials tailored to each detection approach. The selection of appropriate components significantly impacts assay performance, reproducibility, and reliability.
Table 3: Essential Research Reagent Solutions for Biosensing Applications
| Reagent/Material | Function in Biosensing | Applications |
|---|---|---|
| Biorecognition Elements (antibodies, aptamers, enzymes) | Target capture and specificity | Both label-based and label-free |
| Electroactive Indicators (ferricyanide, ruthenium complexes) | Signal generation in electrochemical detection | Primarily label-based |
| Functionalized Nanoparticles (Au, Ag, carbon nanotubes) | Signal amplification and transduction | Both approaches |
| Sensor Chips (SPR, QCM, electrochemical) | Transducer platform for biomolecular interaction | Primarily label-free |
| Phase-Enhancing Materials (GST on Ag nanofilms) | Enhance phase shift in advanced plasmonics | Label-free (GH shift sensors) |
| Blocking Agents (BSA, casein, synthetic blockers) | Minimize non-specific binding | Both approaches |
| Immobilization Chemistry (carboxylated SAMs, NHS/EDC) | Covalent attachment of biorecognition elements | Both approaches |
Advanced materials play a particularly crucial role in enhancing label-free biosensing performance. For instance, the integration of atomically thin layers of Ge₂Sb₂Te₅ (GST) on silver nanofilms has been demonstrated to singularize phase change while simultaneously protecting the active silver layer, enabling unprecedented sensitivity in plasmonic biosensing [6]. Similarly, perovskite-structured materials like strontium titanate (SrTiO₃) have shown promising ferroelectric and dielectric properties for capacitive biosensors [5].
The comparative analysis of label-based and label-free biosensing strategies reveals a complementary relationship rather than a competitive one between these approaches. Label-based methods continue to offer exceptional sensitivity and multiplexing capabilities for endpoint analyses, while label-free technologies provide unprecedented insights into biomolecular interactions in real-time without molecular perturbation.
Future developments in biosensing will likely focus on overcoming existing limitations through technological innovation. Standardization of reporting practices through initiatives like STROBE (Standards for Reporting Optical Biosensor Experiments) aims to address the challenge of irreproducible biosensor data in the literature [8]. Additionally, systematic optimization approaches utilizing design of experiments (DoE) methodologies are emerging as powerful tools for enhancing biosensor performance, particularly for ultrasensitive platforms with sub-femtomolar detection limits [9].
The ongoing integration of novel nanomaterials, advanced optical techniques, and microfluidic systems continues to expand the capabilities of both label-based and label-free biosensing platforms. As these technologies evolve, they will further empower researchers and clinicians in their efforts to understand disease mechanisms, develop targeted therapies, and implement precise diagnostic strategies for improved patient outcomes.
The evolution of biosensing technologies has positioned label-free biosensors as powerful tools for analyzing molecular interactions in their native state. Unlike label-based methods that rely on fluorescent, radioactive, or enzymatic tags for detection, label-free techniques directly measure intrinsic molecular properties such as mass, refractive index, or electrical impedance during biological binding events [2]. This capability is fundamentally transforming how researchers study biomolecular interactions, particularly in drug discovery and clinical diagnostics.
The core advantage of this approach lies in its avoidance of artificial labels, which can sterically hinder molecular interactions or alter biological activity, thereby providing more physiologically relevant data [10]. Furthermore, label-free platforms enable researchers to monitor binding events in real-time, capturing not just the presence of interaction but the complete kinetics and dynamics of the process [11]. This comparative guide examines the performance advantages of label-free biosensors against traditional label-based methods, supported by experimental data and detailed methodologies.
Key Advantages of Label-Free Biosensors
Avoiding Label-Induced Artifacts
Label-free biosensors circumvent the potential artifacts introduced by molecular tags, providing more physiologically relevant data.
- Preservation of Native Molecular Properties: Labels such as fluorescent dyes or nanoparticles can be comparable in size to small molecule therapeutics, potentially altering binding affinities, interfering with native conformational dynamics, and blocking active sites [10]. Label-free detection eliminates these concerns by relying on intrinsic molecular properties.
- Elimination of Tag-Dependent Optimization: Label-based approaches require extensive optimization of tag placement and chemistry to minimize functional disruption, a time-consuming process unnecessary with label-free methods [1].
- Unbiased Detection: Label-free methods can detect unlabeled biomolecules that might be overlooked in tag-dependent systems, potentially revealing novel interactions or subtypes [10].
Table 1: Comparative Analysis of Artifact Potential in Biosensing Platforms
| Biosensor Type | Molecular Tag Required | Risk of Steric Hindrance | Potential for Altered Kinetics | System Suitability for Small Molecules |
|---|---|---|---|---|
| Label-Free | No | Low | Low | Excellent |
| Fluorescence | Yes (Dyes, Proteins) | Moderate-High | Moderate-High | Poor-Fair |
| Enzymatic | Yes (Enzymes) | High | High | Poor |
| Radioactive | Yes (Radioisotopes) | Low-Moderate | Low | Fair-Good |
Enabling Real-Time Monitoring
Label-free biosensors provide continuous monitoring of biomolecular interactions as they occur, capturing kinetic details lost in endpoint measurements.
- Comprehensive Kinetic Profiling: Researchers can measure association rates (kon), dissociation rates (koff), and affinity constants (KD) in a single experiment without secondary detection steps [11]. This provides a more complete understanding of interaction dynamics.
- Observation of Transient Intermediates: Real-time monitoring can reveal transient binding states and complex formation dynamics that might be missed in endpoint assays [10].
- Continuous Quality Control: The ability to monitor the entire binding process allows researchers to identify experimental artifacts or quality issues as they occur, improving data reliability [11].
Table 2: Real-Time Kinetic Parameters Measurable by Label-Free Biosensors
| Kinetic Parameter | Symbol | Measurement Phase | Biological Significance | Typical Range |
|---|---|---|---|---|
| Association Rate | kon | Binding Phase | How quickly complexes form | 10³-10⁹ M⁻¹s⁻¹ |
| Dissociation Rate | koff | Dissociation Phase | How quickly complexes break down | 10⁻⁵-1 s⁻¹ |
| Equilibrium Constant | KD | Calculated from kon/koff | Binding affinity | μM to pM |
Experimental Evidence and Performance Data
Ultra-Sensitive Detection of Membrane Protein Interactions
A landmark 2024 study demonstrated the exceptional sensitivity of label-free biosensors using frequency-locked optical whispering evanescent resonator (FLOWER) technology to monitor G-protein coupled receptor (GPCR) interactions [12].
Experimental Protocol:
- Surface Functionalization: Supported biomimetic membranes were self-assembled on silica microtoroid resonators by rupturing lipid vesicles
- Receptor Incorporation: κ-opioid receptors (κOR) were incorporated via micelle dilution into the membrane
- Ligand Binding: Native agonist dynorphin A 1-13 was introduced at varying concentrations
- Detection Principle: Binding events changed the local refractive index, shifting the resonance frequency of the microtoroid
- Validation: Results were confirmed using radioligand competitive binding assays
Performance Results:
- Limit of Detection: 180 zeptomolar (zM) for dynorphin A 1-13 [12]
- Measured Affinity: KD of 3.1 nM, correlating with radioligand assays (1.1 nM)
- Sample Consumption: Minimal (30 μL) with rapid results (minutes)
- Key Advantage: Elimination of radioactive labels while maintaining sensitivity
Viability-Specific Pathogen Detection in Food Safety
A 2025 electrochemical biosensor demonstrated the practical application of label-free detection for foodborne pathogens, addressing a critical limitation of traditional methods [13].
Experimental Protocol:
- Sensor Fabrication: ZnO/Au-modified electrode functionalized with DTSSP crosslinker
- Antibody Immobilization: Monoclonal Salmonella typhimurium antibodies conjugated to the surface
- Sample Application: Salad samples spiked with bacteria introduced without preprocessing
- Detection Method: Non-Faradaic electrochemical impedance spectroscopy (EIS)
- Measurement: Capacitance shifts at the electrode-electrolyte interface indicated pathogen binding
Performance Results:
- Detection Limit: 9 CFU/mL within 5 minutes [13]
- Viability Specificity: Selective detection of live pathogens, reducing false positives
- Reproducibility: Inter- and intra-study coefficient of variation below 20%
- Predictive Value: Positive and negative predictive values exceeding 85%
Comparative Technical Performance
Thick Sample Analysis Capability
A 2024 systematic comparison evaluated how different label-free technologies perform with increasingly thick protein layers, revealing important practical considerations for assay development [7].
Table 3: Performance Comparison Across Label-Free Biosensor Platforms with Thick Samples
| Biosensor Technique | Linear Measurement Range (Protein Layers) | Estimated Thickness Range (nm) | Key Strengths | Technical Limitations |
|---|---|---|---|---|
| MP-SPR | >50 layers | 300-400 nm | Predictable binding signal for thick layers | - |
| Biolayer Interferometry (BLI) | 38 layers | 228-304 nm | Good thickness range | Limited linear measurement range |
| Quartz Crystal Microbalance (QCM) | 18-24 layers | 108-144 nm | Mass sensitivity | Signal deviation with thickness |
| Mass-Sensitive Micro Array (MSMA/FBAR) | 12-16 layers | 72-96 nm | Miniaturization potential | Limited to thinner layers |
The Scientist's Toolkit: Essential Research Reagents and Materials
Successful implementation of label-free biosensing requires specific reagents and materials optimized for each platform.
Table 4: Key Research Reagent Solutions for Label-Free Biosensing
| Reagent/Material | Function | Example Application | Considerations |
|---|---|---|---|
| Sensor Chips (Gold-coated) | Platform for biomolecule immobilization | SPR studies of protein interactions | Require specific derivatization for different ligands |
| Lipid Vesicles | Formation of supported lipid bilayers | Studying membrane protein interactions [12] | Size and composition affect bilayer quality |
| DTSSP Crosslinker | Covalent attachment of antibodies to surfaces | Immunosensor development [13] | Spacer length affects antigen accessibility |
| Carboxymethyl Dextran Matrix | Hydrogel for ligand immobilization | SPR-based kinetic studies | Minimizes non-specific binding |
| ZnO/Au Electrodes | Signal transduction platform | Electrochemical impedance sensing [13] | Nanostructure enhances sensitivity |
| Regeneration Buffers | Removal of bound analyte between cycles | Sensor surface reusability | Must be strong enough to remove analyte but preserve ligand activity |
Technological Workflows and Operational Principles
Understanding the fundamental operating principles of major label-free platforms reveals how they achieve their performance advantages.
Label-free biosensors represent a significant advancement in biomolecular analysis, offering distinct advantages through the elimination of label-induced artifacts and enabling real-time monitoring of interactions. The experimental evidence demonstrates that these platforms achieve exceptional sensitivity—down to zeptomolar concentrations and single-molecule detection—while providing comprehensive kinetic information unavailable from endpoint assays.
For researchers and drug development professionals, the selection of appropriate label-free technology must consider specific application requirements: SPR and optical resonators for high-sensitivity kinetic studies; electrochemical platforms for rapid, portable detection; and FET-based sensors for charge-sensitive applications. As these technologies continue to evolve with enhancements in multiplexing, miniaturization, and data analysis, their implementation in basic research, diagnostic development, and therapeutic discovery is poised to expand significantly, providing increasingly powerful tools for understanding biological systems in their native state.
Inherent Signals and Probe Interactions in Label-Free Detection
The core distinction in modern biosensing lies between label-based and label-free strategies. Label-based detection relies on the covalent attachment of signal-generating probes (e.g., fluorophores, enzymes, or electrochemiluminescent tags) to either the analyte or the recognition element [4] [14]. While this can provide high sensitivity, the labeling process itself can be laborious, time-consuming, and may potentially alter the native structure and biological activity of the molecules under investigation [10] [14]. In contrast, label-free biosensing detects molecules in their native state by measuring inherent physicochemical properties or changes induced by probe-analyte interactions, without the need for artificial tags [5]. This approach offers significant advantages, including reduced sample preparation time, the ability to monitor binding events in real-time, the avoidance of potential side-effects caused by labels, and often, lower cost [14] [11]. The fundamental requirement for a true label-free biosensor, as defined by Shaw (2014), is that it must "detect a whole biologically active molecule in real time," emphasizing the importance of specificity, sensitivity, and the preservation of biological activity [15].
This guide provides a comparative analysis of the primary mechanisms underpinning label-free detection, detailing the inherent signals exploited and the nature of probe interactions. It is structured to serve researchers and professionals in drug development by presenting clearly organized experimental data, detailed protocols, and essential resource information to inform experimental design.
Core Principles of Label-Free Detection
Label-free biosensors function by transducing a biological recognition event (e.g., an antibody-antigen binding) into a measurable signal through a physicochemical transducer [16]. The signal originates from the intrinsic properties of the molecules or the changes they induce upon interaction.
Inherent Molecular Properties and Transduction Mechanisms
The following diagram illustrates the primary signaling pathways and logical relationships in label-free detection, categorizing them by the fundamental property they measure.
The primary mechanisms can be categorized as follows:
- Refractometric Sensing: This is the most widespread principle, where the binding of an analyte to a surface-immobilized probe (e.g., an antibody) increases the local refractive index (RI). Optical transducers like Surface Plasmon Resonance (SPR) and Whispering Gallery Mode (WGM) resonators detect this change as a shift in a resonance wavelength or angle [10] [11] [17]. The signal is directly proportional to the bound mass per unit area.
- Mechanical Transduction: Techniques like Quartz Crystal Microbalance (QCM) measure a change in oscillating frequency due to mass loading on the sensor surface. This provides a direct measure of the total mass bound, including hydrodynamically coupled solvent [14].
- Electronic Transduction: Field-Effect Transistor (FET) based biosensors detect changes in surface charge or potential when a charged analyte (e.g., a protein or DNA) binds to the gate surface, modulating the current flow through the transistor [4] [3].
- Interferometric and Scattering Sensing: Methods like Interference Scattering (iSCAT) microscopy detect biomolecules by interfering the weak light they scatter with a reference laser beam. The contrast is proportional to the molecular volume and refractive index, allowing it to function as an "optical mass spectrometer" [10].
The Role of Probes and Immobilization
Despite being "label-free," these biosensors critically depend on biological probes to confer specificity. These probes are immobilized on the transducer surface to capture the target analyte. The choice of probe and immobilization chemistry is paramount for sensor performance.
- Probe Types: Common probes include antibodies, aptamers (single-stranded DNA or RNA oligonucleotides selected for high-affinity binding) [4] [14], enzymes, and peptide nucleic acids (PNAs). Aptamers are increasingly popular due to their stability, versatility, and ease of chemical synthesis [4].
- Immobilization Strategies: The probe must be securely attached to the sensor surface without compromising its activity. Standard methods include:
- Covalent Coupling: Using amine, thiol, or carboxyl chemistry to link the probe to a functionalized surface (e.g., a gold film for SPR or a silica surface for optical resonators) [11] [17].
- Affinity Coupling: Utilizing systems like biotin-streptavidin, which offers a robust and oriented immobilization [11].
- Self-Assembled Monolayers (SAMs): Organosilane or alkanethiol films that create a well-defined, functional interface on the sensor surface [4] [17].
A key advancement is the development of multifunctional surface coatings that are simultaneously protein-resistant and bioconjugable. For example, coating a silica WGM microtoroid with an organosilane like THPMP (3-(Trihydroxysilyl) propyl methylphosphonate) significantly reduces non-specific adsorption from complex media like blood serum, while still allowing for the covalent functionalization of specific antibodies [17]. This solves a major conundrum in label-free biosensing, enabling highly specific detection in clinically relevant samples.
Comparative Analysis of Key Technologies
The following table summarizes the operational principles, key performance metrics, and typical applications of the major label-free biosensing platforms.
Table 1: Comparison of Major Label-Free Biosensing Technologies
| Technology | Transduction Principle | Measured Signal | Key Performance Metrics | Example Application |
|---|---|---|---|---|
| Surface Plasmon Resonance (SPR) [10] [11] | Refractometric | Shift in resonance angle/wavelength | Sensitivity: High (routinely sub-nM)Throughput: Medium (multiplexing possible with imaging)Sample Volume: ~100s µL | Real-time kinetic analysis of antibody-antigen interactions; determination of affinity (KD) and rate constants (kon, koff). |
| Whispering Gallery Mode (WGM) Resonators [15] [17] | Refractometric | Shift in resonance wavelength | Sensitivity: Very High (single protein detection)Q-factor: >10⁶Sample Volume: Can be nL-µL in droplets [15] | Detection of cancer biomarkers in diluted serum [17]; rapid detection in small volume droplets [15]. |
| Field-Effect Transistor (FET) [4] [3] | Electronic | Change in source-drain current or threshold voltage | Sensitivity: Varies (fM-pM with nanomaterials)Response Time: Seconds to minutesMiniaturization: Excellent | Detection of ions, nucleic acids, and proteins; often integrated with CNTs or SiNWs for enhanced sensitivity [3]. |
| Interference Scattering (iSCAT) [10] | Interferometric | Interference contrast in scattered light | Sensitivity: Single protein (≥40 kDa)Information: Mass, size, dynamicsTemporal Resolution: Millisecond | Mass profiling and real-time tracking of molecular transport and interactions [10]. |
| Quartz Crystal Microbalance (QCM) [14] | Mechanical | Shift in resonant frequency | Sensitivity: ~ng/cm²Information: Hydrated massRobustness: High | Study of protein adsorption and cell adhesion [14]. |
Experimental Protocols for Key Platforms
To illustrate the practical application of these technologies, here are detailed methodologies for two prominent and sensitive label-free biosensors.
Protocol: Label-Free Biosensing using a Whispering Gallery Mode (WGM) Microtoroid
This protocol is adapted from the work detailed in Scientific Reports for the specific detection of a protein biomarker in complex media [17].
Objective: To functionalize a silica microtoroid resonator for the specific, label-free detection of a target protein (e.g., Human Interleukin-2, IL-2) in a buffered solution and complex media like fetal bovine serum (FBS).
Materials & Reagents:
- Fabricated silica microtoroids on a silicon chip.
- Tapered optical fiber for evanescent coupling.
- Tuneable laser (1550 nm), photodetector, and data acquisition system.
- Piranha solution (Caution: Highly corrosive).
- 3-(Trihydroxysilyl) propyl methylphosphonate (THPMP).
- Anhydrous toluene.
- N-(3-Dimethylaminopropyl)-N′-ethylcarbodiimide (EDC) and N-Hydroxysuccinimide (NHS).
- Anti-IL-2 antibody (α-IL-2).
- Phosphate Buffered Saline (PBS), pH 7.4.
- Fetal Bovine Serum (FBS).
- Purified IL-2 antigen.
Step-by-Step Workflow:
- Sensor Fabrication & Cleaning: Microtoroids are fabricated via photolithography and CO₂ laser reflow. Before functionalization, they are cleaned in Piranha solution to create a pristine, hydroxylated silica surface.
- Anti-Fouling Coating: The cleaned microtoroids are immersed in a 1% (v/v) solution of THPMP in anhydrous toluene for 1 hour at room temperature. This forms a covalently bound monolayer that is protein-resistant.
- Probe Immobilization: The THPMP-coated surface is activated with a fresh mixture of EDC and NHS in water to convert surface phosphonate groups to NHS esters. The sensor is then incubated with a solution of α-IL-2 antibody, allowing the antibodies to covalently attach to the surface via primary amines.
- Optical Coupling & Measurement Setup: A functionalized microtoroid is placed in a fluidic cell. A tapered optical fiber is navigated to couple light evanescently into the microtoroid. The transmission spectrum is monitored, showing sharp Lorentzian dips corresponding to the WGM resonances.
- Biosensing Experiment: PBS buffer is flowed over the sensor to establish a stable baseline resonance wavelength. The analyte solution (IL-2 in PBS or diluted FBS) is then introduced. The specific binding of IL-2 to the immobilized antibody causes a shift in the resonance wavelength (∆λ) due to the local increase in refractive index.
- Data Analysis: The ∆λ is tracked in real-time to generate a sensorgram, from which binding kinetics and affinity can be extracted. The sensor surface can be regenerated for reuse by flowing a mild acidic or basic solution to dissociate the antigen-antibody complex.
Protocol: Real-Time Kinetic Analysis using Surface Plasmon Resonance (SPR)
This protocol outlines a standard procedure for characterizing a molecular interaction, a cornerstone of drug development [11].
Objective: To determine the affinity and kinetic rate constants for the interaction between a drug candidate (analyte) and its immobilized protein target (ligand).
Materials & Reagents:
- SPR instrument (e.g., Biacore, SensiQ).
- Carboxymethylated dextran gold sensor chip.
- EDC and NHS.
- Ethanolamine hydrochloride.
- Ligand (e.g., purified receptor protein).
- Analyte (e.g., small molecule drug candidate).
- Running buffer (e.g., HBS-EP: 10 mM HEPES, 150 mM NaCl, 3 mM EDTA, 0.005% v/v Surfactant P20, pH 7.4).
- Regeneration solution (e.g., 10 mM Glycine-HCl, pH 2.0).
Step-by-Step Workflow:
- Surface Activation: The carboxymethylated dextran matrix on the sensor chip is activated by injecting a mixture of EDC and NHS, creating reactive NHS esters.
- Ligand Immobilization: The ligand protein, diluted in a low-salt acetate buffer (pH 4.0-5.0) to promote electrostatic preconcentration, is injected over the activated surface, resulting in covalent coupling via primary amines. Remaining active esters are deactivated by injecting ethanolamine.
- Kinetic Titration: A series of analyte solutions at five or more different concentrations (prepared in running buffer via serial dilution) are injected sequentially over the ligand surface and a reference surface. Each injection cycle consists of:
- Association Phase: Analyte injection (60-300 s) to monitor binding.
- Dissociation Phase: Switch to running buffer (120-600 s) to monitor complex dissociation.
- Regeneration: A short pulse of regeneration solution to remove bound analyte without damaging the ligand.
- Data Processing and Analysis: The reference flow cell signal (accounting for bulk RI change and non-specific binding) is subtracted from the ligand flow cell signal. The resulting sensorgrams for all concentrations are globally fitted to a suitable interaction model (e.g., 1:1 Langmuir binding) using the instrument's software to calculate the association rate (kₒₙ), dissociation rate (kₒff), and the equilibrium dissociation constant (K_D = kₒff / kₒₙ).
The Scientist's Toolkit: Essential Research Reagents and Materials
Successful implementation of label-free biosensing requires a suite of specialized materials and reagents. The following table details key items and their functions.
Table 2: Essential Reagents and Materials for Label-Free Biosensing
| Item Category | Specific Examples | Function in Label-Free Biosensing |
|---|---|---|
| Sensor Substrates | Gold sensor chips (SPR); Silica microspheres/toroids (WGM); Carbon or Graphene-based electrodes (FET) | Serves as the physical platform and transducer for the biological recognition event. |
| Probe Molecules | Antibodies; DNA/RNA Aptamers; Enzymes; Peptide Nucleic Acids (PNAs) | The biological recognition element that provides high specificity and selectivity for the target analyte. |
| Immobilization Chemistry | EDC/NHS; THPMP; MPA (3-Mercaptopropionic acid); Biotin-Streptavidin | Creates a stable link between the probe molecule and the sensor substrate, often while minimizing non-specific adsorption. |
| Nanomaterials for Signal Enhancement | Gold Nanoparticles (AuNPs); Carbon Nanotubes (CNTs); Silicon Nanowires (SiNWs); Graphene Oxide | Used to modify transducer surfaces to increase active surface area, enhance sensitivity, and improve detection limits. |
| Buffers & Solutions | HBS-EP Buffer; PBS; Acetate Buffers (for immobilization); Glycine-HCl (for regeneration) | Provide a stable chemical environment for interactions and are used for surface preparation and regeneration. |
Label-free biosensing technologies represent a powerful and versatile toolkit for the life sciences, enabling the real-time, quantitative analysis of biomolecular interactions in a native format. The choice of the optimal platform—be it SPR for robust kinetic analysis, WGM for exceptional sensitivity in small volumes, or FET for miniaturization and electronic readout—depends heavily on the specific application, required sensitivity, and available sample matrix. As innovations in nanomaterials, surface chemistry, and optical engineering continue to mature, label-free biosensors are poised to become even more sensitive, robust, and integrated into point-of-care diagnostic devices and high-throughput drug discovery pipelines. The ongoing refinement of antifouling coatings, in particular, is critical for unlocking the full potential of these sensors in real-world clinical and environmental samples.
Biosensors, analytical devices that integrate a biological sensing element with a physicochemical transducer, have become cornerstone tools in biotechnology, medical diagnostics, and drug development [1]. Within this field, detection strategies are broadly categorized into two paradigms: label-based and label-free methods. Label-based biosensors rely on molecular tags—such as fluorescent dyes, enzymes, or nanoparticles—to generate a detectable signal upon a biological recognition event [1]. This approach has powered a "fluorescence revolution," enabling researchers to visualize and quantify biomolecular interactions with exceptional sensitivity and versatility. In contrast, label-free methods detect binding events directly by measuring inherent changes in mass, refractive index, or electrical properties at the sensor surface, avoiding the need for secondary reporters [1] [14].
This guide provides a comparative analysis of these two foundational approaches. While label-free strategies offer the significant advantage of observing biomolecules in their native state, avoiding potential artifacts from labels [14] [10], the well-established sensitivity, operational simplicity, and robust toolbox of label-based methods, particularly fluorescence, have secured their central role in modern biosensing [18] [19]. We will objectively compare their performance, delve into the experimental protocols that underpin key data, and situate their utility within the workflow of researchers and drug development professionals.
Performance Comparison: Label-Based vs. Label-Free Biosensors
The choice between label-based and label-free biosensors is multifaceted, hinging on the specific requirements of the assay, including the desired sensitivity, the need for real-time kinetic data, and the acceptable level of structural perturbation. The following table summarizes the core characteristics of each approach.
Table 1: Comparative Analysis of Label-Based and Label-Free Biosensors
| Feature | Label-Based Biosensors | Label-Free Biosensors |
|---|---|---|
| Core Principle | Detection relies on a signal from a molecular label (e.g., fluorophore, enzyme) attached to the analyte or reporter element [1]. | Detection relies on measuring inherent changes from the analyte binding (e.g., mass, refractive index, charge) [1] [14]. |
| Key Strengths | Ultra-high sensitivity and low limit of detection (LOD); capability for multiplexing; vast commercial reagent availability; suitable for single-molecule and live-cell imaging [18] [19]. | No label modification required, preserving native function; real-time, kinetic binding data (e.g., ka, kd, KD); avoids costly and time-consuming labeling steps [14] [20]. |
| Major Limitations | Potential for label-induced steric hindrance or altered biomolecule function; multi-step washing and separation often required; not always suitable for small molecules [14] [20]. | Generally higher limits of detection for small molecules; can be more susceptible to non-specific binding signals; requires sophisticated instrumentation for high sensitivity (e.g., SPR) [20] [10]. |
| Typical LOD (Protein Biomarkers) | Can achieve fM to aM levels with signal amplification [18]. | Generally pM to nM levels with standard platforms [1]. |
| Throughput | High (can be adapted to microplate readers, high-content screeners). | Varies; newer imaging systems enable high-throughput [21]. |
| Assay Time | Can be lengthy due to incubation and washing steps. | Rapid for direct binding measurements; real-time monitoring [14]. |
A critical performance differentiator is the achievable sensitivity. Label-based biosensors, when coupled with cyclic signal amplification (CSA) technologies, can reach astonishing limits of detection. For instance, rolling circle amplification (RCA) has been used to detect microRNA at attomolar (aM, 10⁻¹⁸ M) concentrations [18], while enzyme-assisted amplification (EAA) and strand displacement reactions (SDR) can push detection to the femtomolar (fM, 10⁻¹⁵ M) range [18]. These amplification strategies are less commonly applied in label-free systems, which often rely on the intrinsic signal from the binding event itself, leading to typically lower sensitivity, especially for low-molecular-weight analytes [20].
Table 2: Quantitative Performance of Selected Label-Based and Label-Free Biosensors
| Analyte | Biosensor Type | Detection Mechanism | Reported LOD | Linear Range | Citation |
|---|---|---|---|---|---|
| microRNA (Let-7a) | Label-Based | RCA with G-quadruplex/ThT | 4 aM | Not Specified | [18] |
| microRNA | Label-Based | RCA with DNAzyme | 1.51 fM | Not Specified | [18] |
| HIV-1 DNA | Label-Based | SDR with G-quadruplex/NMM | 1.9 pM | Not Specified | [18] |
| SARS-CoV-2 Spike | Label-Based | Binding-activated nanobody | ~nM (affinity) | N/A | [19] |
| Thrombin | Label-Free | Aptamer-based SPRi / iRIf | ~nM (affinity measured) | N/A | [21] |
| Small Molecules | Label-Free | SPR / LSPR | Varies (highly size-dependent) | N/A | [20] |
Experimental Deep Dive: Methodologies in Action
Protocol: microRNA Detection via Rolling Circle Amplification (RCA)
This protocol exemplifies the extreme sensitivity achievable with amplified label-based fluorescence [18].
- Probe Design and Assembly: A hairpin-shaped DNA probe is designed containing a region complementary to the target miRNA. Upon hybridization, the hairpin opens, making its ends available for ligation.
- Circularization: The opened hairpin is treated with T4 DNA ligase in the presence of the target miRNA to form a circular DNA template. Exonucleases (Exo I and III) are added to degrade any remaining linear DNA, reducing background.
- RCA Reaction: The circularized template is mixed with a primer, dNTPs, and the Klenow fragment of DNA polymerase. The polymerase extends the primer continuously around the circular template, generating a long single-stranded DNA product containing hundreds of tandem repeats complementary to the circle.
- Fluorescent Signal Generation: The RCA product, which contains multiple repeated sequences of a DNAzyme, is incubated with a hairpin substrate (HS) probe. The HS probe is labeled with a fluorophore and a quencher. In the presence of Mg²⁺, the DNAzyme cleaves the HS, separating the fluorophore from the quencher and causing a fluorescence increase. Each DNAzyme repeat can cleave multiple HS probes, providing a second stage of signal amplification.
Protocol: Real-Time Binding Kinetics using Label-Free SPR
This protocol highlights the direct, kinetic measurements possible with label-free systems [21].
- Surface Functionalization: A gold sensor chip (for SPR) is modified with a self-assembled monolayer (SAM) to create a reactive surface. One interaction partner (the "ligand," e.g., an antibody or aptamer) is immobilized onto this surface via amine or thiol coupling.
- Baseline Establishment: A continuous flow of running buffer is passed over the sensor surface to establish a stable refractive index baseline.
- Association Phase: The analyte (the "analyte") is injected over the ligand-functionalized surface at a defined concentration and flow rate. Binding causes an increase in mass on the surface, leading to a proportional shift in the SPR angle, recorded in real-time as a resonance unit (RU) signal. This part of the sensorgram is used to calculate the association rate constant (kₐ).
- Dissociation Phase: The analyte injection is stopped, and pure running buffer is flowed over the surface again. The decrease in RU signal as the analyte dissociates is monitored to calculate the dissociation rate constant (kd).
- Regeneration: A mild acidic or basic solution is injected to break the ligand-analyte complexes without denaturing the immobilized ligand, returning the surface to its original state for the next cycle.
The Scientist's Toolkit: Essential Reagents and Materials
Successful implementation of biosensing strategies requires a suite of specialized reagents and materials.
Table 3: Key Research Reagent Solutions for Biosensor Development
| Reagent / Material | Function | Example Use Cases |
|---|---|---|
| Fluorogenic Amino Acids (FgAAs) | Genetically encodable synthetic amino acids that become fluorescent only when a specific molecular environment is created, such as upon target binding. | Construction of binding-activated fluorescent nanosensors for proteins (e.g., SARS-CoV-2 Spike) and small molecules (e.g., cortisol) [19]. |
| Nucleic Acid Amplification Enzymes | Enzymes like the Klenow fragment (DNA polymerase) and T4 DNA ligase are crucial for executing isothermal amplification strategies. | Rolling circle amplification (RCA) for ultra-sensitive detection of nucleic acid targets like miRNA and DNA [18]. |
| Structured Nucleic Acids (Aptamers) | Short, single-stranded DNA or RNA oligonucleotides that fold into 3D structures to bind specific targets with high affinity; serve as synthetic recognition elements. | Used as ligands in both label-free (SPR, interferometry) and label-based (fluorescently tagged) biosensors for proteins, small molecules, and ions [21] [20]. |
| Functionalized Sensor Surfaces | Biosensor chips (e.g., gold for SPR, silica for interferometry) pre-coated with chemical groups (e.g., carboxymethyl dextran, SAMs) for biomolecule immobilization. | Covalent immobilization of ligands (antibodies, aptamers, receptors) in label-free biosensing systems like SPR and iRIf [21]. |
| Signal Amplification Probes | Probes such as hairpin substrates or labeled nucleotides that generate a strong, measurable signal upon activation by an amplification product. | Detecting the long DNA product from RCA, often using fluorescent or colorimetric readouts [18]. |
The "fluorescence revolution" of label-based biosensors has provided the scientific community with an exceptionally powerful and sensitive toolkit. The ability to perform single-molecule imaging, conduct high-throughput cellular screening, and detect trace analytes via sophisticated amplification schemes makes this approach indispensable [10] [19]. However, this power comes with caveats, including the risk of label-induced perturbation and often more complex assay workflows.
The strategic choice between label-based and label-free methods is not a matter of superiority but of context. Label-based fluorescent biosensors are the unequivocal choice for ultimate sensitivity, multiplexing, and imaging deep within cells or tissues. Conversely, label-free biosensors are preferred for determining true binding affinities and kinetics without the potential bias of a label, making them ideal for characterization and screening in drug discovery [14] [21].
The future lies not in the displacement of one paradigm by the other, but in their convergent evolution and complementary use. Emerging technologies, such as binding-activated biosensors that minimize background fluorescence [19] and advanced label-free methods reaching single-molecule sensitivity [10], are continually pushing the boundaries. Researchers and drug developers are best served by understanding the core strengths and limitations of each approach, allowing them to strategically deploy the right tool for their specific scientific question.
Platform Technologies and Real-World Applications Across Biomedicine
Label-free biosensing has emerged as a cornerstone technology in analytical science, enabling the direct detection of biomolecular interactions without the need for fluorescent, enzymatic, or other secondary labels. This approach provides significant advantages over label-based techniques, including reduced assay time and cost, avoidance of molecular modifications that might alter binding properties, and the ability to monitor binding events in real-time [1] [22]. The fundamental principle of label-free biosensing relies on transducing the physical or chemical changes that occur when a target analyte binds to a biological recognition element immobilized on a sensor surface [1]. These changes can be detected through various physicochemical mechanisms, forming the basis for the different categories of label-free biosensors that will be explored in this comparative guide.
The technological evolution of label-free biosensors has been remarkable, progressing from laboratory curiosities to sophisticated analytical tools capable of sensitive and specific detection across diverse application domains including biomedical diagnostics, environmental monitoring, food safety, and drug discovery [4] [23]. For researchers, scientists, and drug development professionals, understanding the capabilities, limitations, and appropriate application contexts of these various biosensor platforms is crucial for selecting the optimal technology for specific research needs. This guide provides a comprehensive comparison of ten major categories of in vitro label-free biosensors, with particular emphasis on their operational principles, performance characteristics, and experimental implementation requirements.
Classification and Operational Principles
Label-free biosensors can be broadly classified based on their transduction mechanism. The table below summarizes the fundamental operating principles and key characteristics of the ten major biosensor categories discussed in this guide.
Table 1: Classification of Major Label-Free Biosensor Types
| Biosensor Category | Transduction Principle | Measured Parameters | Key Advantages |
|---|---|---|---|
| Electrochemical Impedance Spectroscopy (EIS) | Measures electrical impedance changes at electrode-solution interface upon target binding [1] | Impedance (Z), Resistance (Rs), Charge transfer resistance (Rct), Capacitance (Cdl) [1] | Low cost, simple construction, portability, label-free operation [1] [22] |
| Field-Effect Transistor (FET) | Detects charge-induced field effect when target binds to gate surface [4] | Current, conductance, or threshold voltage shifts [22] | Potential for miniaturization, high sensitivity, real-time detection [4] |
| Surface Plasmon Resonance (SPR) | Measures refractive index changes near metal surface upon biomolecular binding [10] [23] | Resonance angle or wavelength shifts [23] | Real-time kinetics, well-established technology, high sensitivity [23] |
| Localized SPR (LSPR) | Utilizes noble metal nanoparticles for localized refractive index sensitivity [4] [23] | Resonance wavelength shifts [23] | Size selectivity, spectral tunability, additional SERS capability [23] |
| Interferometry | Detects interference patterns between light scattered from biomolecules and a reference wave [10] | Phase and intensity variations [10] | Single-molecule sensitivity, mass-sensitive quantification [10] |
| Waveguide-Based | Monitors evanescent field changes when guided light interacts with surface-bound molecules | Phase, intensity, or wavelength shifts | High sensitivity, compatibility with integrated optics |
| Whispering Gallery Mode | Traps light in circular resonators; binding events shift resonant frequencies [23] | Resonance frequency or wavelength shifts [23] | Ultra-high quality factors, exceptional sensitivity |
| Mechanical (Cantilever) | Detects surface stress-induced bending or resonant frequency shifts from mass binding | Deflection or frequency changes | Extremely sensitive to mass changes, array compatibility |
| Thermal | Measures heat changes from biochemical reactions | Temperature variations | Simple readout, label-free [24] |
| Paper-Based | Utilizes paper substrates with functionalized detection zones [4] | Optical, colorimetric, or electrical changes [4] | Extremely low cost, disposability, point-of-care suitability [4] |
The following diagram illustrates the general functional principle shared by most label-free biosensors, where a biological recognition event is converted into a measurable signal through various transduction mechanisms.
General Biosensor Operating Principle
Comparative Performance Analysis
Sensitivity and Detection Limits
Sensitivity represents a critical performance parameter that varies significantly across different biosensor platforms. The following table provides a comparative analysis of the detection capabilities of major label-free biosensor types.
Table 2: Sensitivity and Detection Limit Comparison Across Biosensor Platforms
| Biosensor Type | Typical Detection Limit | Key Factors Influencing Sensitivity | Representative Applications |
|---|---|---|---|
| SPR | ~1 pg/mm² [23] | Metal film quality, excitation wavelength, flow conditions [23] | Biomolecular interaction analysis, affinity constant determination [10] [23] |
| LSPR | Varies with nanoparticle properties | Nanoparticle composition, size, shape, and local environment [23] | Protein detection, disease diagnostics [4] [23] |
| Interferometry (iSCAT) | Single proteins (tens of kDa) [10] | Phase stability, reference wave intensity, molecular proximity to substrate [10] | Single-molecule imaging, mass profiling, molecular transport tracking [10] |
| EIS | Varies with target and electrode functionalization | Electrode material, surface chemistry, frequency range, redox mediators [1] [22] | Disease biomarker detection, pathogen identification [1] [25] |
| FET | Dependent on semiconductor material and Debye length | Nanowire/nanotube dimensions, ionic strength, gate insulation [4] [22] | Protein biomarker detection, virus sensing [4] |
| Plasmonic Phase Sensing | <1 fg/mm² (single molecule level) [23] | Phase jump sharpness, darkness condition precision [23] | Ultrasensitive pathogen detection, low-abundance biomarker discovery [23] |
Experimental Considerations and System Selection
Choosing the appropriate biosensor platform requires careful consideration of multiple experimental factors beyond raw sensitivity. The following workflow diagram outlines key decision points in selecting an appropriate label-free biosensing platform for specific research applications.
Biosensor Selection Workflow
Detailed Methodologies for Key Biosensor Platforms
Electrochemical Impedance Spectroscopy (EIS) Protocol
Experimental Workflow:
- Electrode Preparation: Clean working electrode (typically gold, carbon, or indium tin oxide) through electrochemical cycling or plasma treatment [1].
- Surface Functionalization: Immobilize capture probes (antibodies, aptamers, DNA) via self-assembled monolayers (SAMs), avidin-biotin chemistry, or direct adsorption [1] [22].
- Blocking: Apply inert proteins (BSA, casein) or SAMs to minimize nonspecific binding [22].
- Impedance Measurement: Acquire spectra over frequency range (typically 0.1 Hz to 100 kHz) using small AC amplitude (5-10 mV) at appropriate DC bias [1] [22].
- Data Analysis: Fit impedance data to equivalent circuit models (e.g., Randles circuit) to extract parameters (Rct, Cdl) [22].
Critical Considerations:
- The charge transfer resistance (Rct) often increases upon target binding due to hindered electron transfer of redox probes ([Fe(CN)6]3-/4-) to the electrode surface [1] [22].
- Optimal measurement frequency varies with system; lower frequencies often more sensitive to binding-induced changes [22].
- Ionic strength significantly affects impedance response; lower ionic strengths can enhance sensitivity but may reduce biological activity [22].
Surface Plasmon Resonance (SPR) Implementation
Experimental Workflow:
- Sensor Chip Preparation: Clean gold film (typically 50 nm) on glass substrate with piranha solution or oxygen plasma [23].
- Surface Functionalization: Create carboxylated or amine-reactive surface using SAMs (e.g., 11-mercaptoundecanoic acid) or polymer coatings [23].
- Ligand Immobilization: Covalently attach capture molecules via EDC/NHS chemistry, thiol coupling, or amine coupling [23] [21].
- Binding Measurements: Inject analyte solutions in continuous flow while monitoring resonance angle in real-time [23].
- Regeneration: Remove bound analyte using mild acid or base to regenerate surface for multiple cycles [21].
Critical Considerations:
- Nonspecific binding to gold surface must be minimized through appropriate blocking strategies [23] [21].
- Mass transport limitations can affect binding kinetics at high ligand densities [23].
- Reference channel with immobilized non-specific molecule essential for compensating bulk refractive index changes [21].
Field-Effect Transistor (FET) Biosensor Fabrication
Experimental Workflow:
- Transistor Fabrication: Create FET structures using silicon nanowires, carbon nanotubes, or 2D materials (graphene, MoS2) via photolithography or electron-beam lithography [4].
- Gate Dielectric Functionalization: Modify gate surface (SiO2, Al2O3, HfO2) with appropriate silane or phosphate chemistry [4] [22].
- Probe Immobilization: Attach recognition elements (antibodies, aptamers, enzymes) to functionalized gate surface [4].
- Electrical Characterization: Measure transfer characteristics (Ids-Vgs) before and after analyte exposure [4] [22].
- Signal Recording: Monitor source-drain current or threshold voltage shifts in real-time upon analyte binding [4].
Critical Considerations:
- Debye screening in physiological buffers limits sensitivity; strategies include using high-frequency operation or reduced ionic strength solutions [22].
- Proper encapsulation of source and drain contacts essential for stable operation in liquid environments [4].
- Solution-gated configurations often preferred for biological measurements to avoid reference electrode instability [22].
The Scientist's Toolkit: Essential Research Reagents and Materials
Successful implementation of label-free biosensing requires careful selection of materials and reagents. The following table outlines key components essential for biosensor development and operation.
Table 3: Essential Research Reagents and Materials for Label-Free Biosensing
| Category | Specific Examples | Function/Purpose | Considerations |
|---|---|---|---|
| Substrate Materials | Gold films (SPR), Carbon electrodes (EIS), Silicon wafers (FET), Paper substrates [4] | Sensor platform and transducer | Surface roughness, conductivity, optical properties, functionalization compatibility |
| Recognition Elements | Antibodies, aptamers, enzymes, nucleic acid probes, peptides, molecularly imprinted polymers [4] [1] [21] | Molecular recognition and target capture | Specificity, affinity, stability, orientation after immobilization |
| Surface Chemistry Reagents | Thiols (for gold), silanes (for oxides), EDC/NHS, biotin-streptavidin [4] [22] [21] | Immobilization of recognition elements | Reaction efficiency, monolayer order, nonspecific binding minimization |
| Blocking Agents | BSA, casein, polyethylene glycol (PEG), SAMs with oligo(ethylene glycol) termini [22] [21] | Reduction of nonspecific binding | Compatibility with recognition elements, stability during assay |
| Redox Probes | [Fe(CN)6]3-/4-, [Ru(NH3)6]3+/2+ [1] | Electron transfer mediators in EIS | Chemical stability, appropriate redox potential, minimal interference |
| Buffer Components | PBS, HEPES, Tris with varying ionic strength and pH modifiers [21] | Maintain biological activity and control experimental conditions | Ionic strength effects, compatibility with transduction mechanism |
Comparative Insights: Label-Free vs. Label-Based Approaches
The fundamental distinction between label-free and label-based detection methods represents a critical consideration in experimental design. Label-free techniques detect the intrinsic physical properties of biomolecules or the direct consequences of binding events, while label-based methods rely on reporter molecules (fluorophores, enzymes, radioisotopes) attached to the target or a secondary binding element [1]. Each approach offers distinct advantages and limitations that must be weighed for specific applications.
Advantages of Label-Free Biosensors:
- Simplified Workflow: Elimination of labeling steps reduces preparation time, cost, and experimental complexity [1] [22].
- Minimal Molecular Perturbation: Avoids potential alterations to binding affinity or biological activity caused by labels, especially critical for small molecules and certain proteins [10] [22].
- Real-Time Monitoring: Enables continuous observation of binding events, providing direct access to kinetic parameters (association/dissociation rates) [22] [23].
- Native State Analysis: Studies biomolecular interactions without modifications, potentially revealing mechanisms obscured by labeling [10].
Limitations and Considerations:
- Sensitivity Challenges: For some applications, label-free methods may not achieve the detection limits of highly amplified label-based systems [23].
- Nonspecific Binding: Direct transduction makes systems vulnerable to signal interference from nonspecific adsorption [22] [21].
- Complex Data Interpretation: Signal transduction may involve multiple simultaneous physical changes, complicating quantitative analysis [22] [21].
A comprehensive comparison study using thrombin aptamers demonstrated that while different label-free platforms consistently identified strong versus weak binders, the absolute binding constants (KD) varied significantly between systems [21]. This highlights the importance of considering the specific biosensor platform, surface chemistry, and assay conditions when interpreting quantitative results from label-free measurements.
Emerging Trends and Future Perspectives
The field of label-free biosensing continues to evolve rapidly, with several emerging technologies pushing the boundaries of sensitivity and application. Plasmonic metamaterials and hetero-metastructures show exceptional promise for overcoming current sensitivity limitations by employing novel optical phenomena including topological darkness, bound states in continuum, and exceptional points [23]. Phase-sensitive detection methods represent another frontier, leveraging the singular behavior of optical phase at points of light darkness to achieve detection limits at the single molecule level [23].
Nanomaterial-enhanced biosensors continue to advance, with developments in quantum dots, magnetic nanoparticles, and various nanostructures contributing to improved sensitivity and novel functionalities [4] [24]. The integration of artificial intelligence with biosensing data analysis is poised to address challenges in signal interpretation and enhance detection specificity in complex samples [24]. For intravascular and implantable applications, innovations in biodegradable materials and bioresorbable electronics are opening new possibilities for temporary monitoring applications without requiring device extraction [24].
As these technologies mature, the gap between research tools and clinically applicable devices continues to narrow, promising transformative impacts on personalized medicine, point-of-care diagnostics, and fundamental biological research. The ongoing challenge for researchers remains selecting the appropriate biosensing strategy based on their specific analytical needs, balancing factors of sensitivity, throughput, cost, and technical feasibility.
Electrochemical biosensors have emerged as powerful analytical tools that combine the specificity of biological recognition elements with the sensitivity of electrochemical transducers. These devices are revolutionizing diagnostic fields, from ensuring food safety to enabling early disease detection [1] [26]. A fundamental distinction in biosensor technology lies in the detection methodology: label-based approaches that utilize molecular tags (e.g., enzymes, nanoparticles, fluorescent tags) for signal generation, versus label-free systems that directly measure electrochemical changes arising from biomarker binding events [1]. This review provides a comparative analysis of these competing methodologies through detailed case studies examining their application in food authenticity verification and cancer biomarker detection, highlighting performance characteristics, experimental protocols, and optimal implementation scenarios.
Fundamental Principles and Comparative Mechanisms
Operational Principles of Label-Based and Label-Free Biosensors
Electrochemical biosensors function by converting a biological recognition event into a quantifiable electrical signal. The core components include a biorecognition element (antibodies, aptamers, nucleic acids, enzymes) that specifically interacts with the target analyte, and a transducer that converts this interaction into a measurable electrochemical signal [1] [27]. Label-free detection mechanisms elicit response signals directly upon analyte molecule binding to the sensor surface, while labelled detection employs molecular labels such as enzymes, nanoparticles, and fluorescent tags to generate or amplify signals [1].
Label-free electrochemical biosensors monitor changes in inherent electrical properties (current, potential, impedance, or conductance) that occur when target molecules bind to the recognition element immobilized on the electrode surface [1] [28]. These platforms have gained prominence for their simplicity, reduced analysis time, and elimination of complex labeling procedures that can potentially modify biomolecular interactions [28].
Label-based approaches introduce additional molecular tags that facilitate signal generation or amplification. These systems often provide enhanced sensitivity through catalytic amplification (e.g., enzyme labels) or unique electrochemical signatures (e.g., metal nanoparticles) [1] [29]. Common labels include horseradish peroxidase, alkaline phosphatase, gold nanoparticles, and methylene blue, which participate in redox reactions that produce measurable currents [29].
Electrochemical Detection Techniques
Both label-based and label-free biosensors utilize similar electrochemical detection techniques but leverage them differently:
- Voltammetric Methods (DPV, SWV, CV): Apply potential scans and measure resulting current. Differential Pulse Voltammetry (DPV) is particularly valued for its low background current and high sensitivity in detecting redox-active species [1] [28].
- Amperometry: Measures current at a fixed potential over time, ideal for monitoring catalytic reactions [29] [28].
- Electrochemical Impedance Spectroscopy (EIS): Monitors impedance changes at the electrode interface, exceptionally well-suited for label-free detection of binding events [1] [28].
- Potentiometry: Measures potential difference at zero current flow, useful for ionic species detection [1].
Table 1: Comparison of Electrochemical Detection Techniques
| Technique | Principle | Advantages | Limitations | Best Applications |
|---|---|---|---|---|
| Cyclic Voltammetry (CV) | Potential linear sweep with reversal | Reveals redox mechanisms, semi-quantitative | Moderate sensitivity | Electrode characterization, mechanism studies |
| Differential Pulse Voltammetry (DPV) | Pulse potential with current sampling | Low background, high sensitivity | Slower scan rates | Quantitative detection of low analyte concentrations |
| Square Wave Voltammetry (SWV) | Square wave potential with current difference | Fast, extremely sensitive | Complex waveform optimization | High-throughput screening, sensitive detection |
| Electrochemical Impedance Spectroscopy (EIS) | AC frequency response measurement | Label-free, surface-sensitive | Complex data interpretation | Binding kinetics, surface modification monitoring |
| Amperometry | Fixed potential current measurement | Simple, real-time monitoring | Specific to electroactive species | Enzyme activity, continuous monitoring |
Case Study 1: Food Authenticity and Species Identification
Application Context and Challenges
Food authenticity represents a critical challenge in global food supply chains, with economic and safety implications from species substitution and mislabeling. Conventional techniques like PCR and chromatography, while accurate, are time-consuming, require specialized equipment, and are unsuitable for rapid field testing [30] [27]. Electrochemical biosensors offer promising alternatives by providing rapid, on-site testing capabilities with minimal sample preparation.
DNA-Based Biosensors for Species Identification
DNA biosensors have emerged as powerful tools for food authenticity assessment, particularly for species identification in meat and derived products [30]. These platforms utilize nucleic acids as both analytes and biorecognition elements, leveraging the high specificity of DNA hybridization.
Table 2: Performance Comparison of Food Authenticity Biosensors
| Analyte | Biosensor Type | Recognition Element | Detection Method | Linear Range | LOD | Reference |
|---|---|---|---|---|---|---|
| Species-specific DNA sequences | Label-free | DNA probes | EIS | N/A | N/A | [30] |
| Pathogens (E. coli) | Label-based | T4 phage | DPV | N/A | N/A | [29] |
| Heavy metals (Hg²⁺) | Label-based | Aptamer | SWV | N/A | N/A | [29] |
| Mycotoxins | Label-based | Antibodies | Amperometry | N/A | N/A | [26] |
Experimental Protocol: DNA-Based Species Identification
Workflow Description: The experimental process begins with DNA extraction from food samples, followed by amplification of species-specific gene sequences. The biosensor platform is prepared by immobilizing complementary DNA probes on the electrode surface, typically gold or screen-printed carbon electrodes. For label-free detection, hybridization is monitored directly via EIS or changes in redox probe behavior. Label-based approaches incorporate enzyme conjugates or nanoparticle tags that generate electrochemical signals upon hybridization.
Key Steps:
- Sample Preparation: DNA extraction from food matrix using commercial kits
- Target Amplification: PCR amplification of species-specific sequences (e.g., mitochondrial DNA)
- Probe Immobilization: Thiolated DNA probes self-assembled on gold electrodes
- Hybridization: Introduction of sample DNA to sensor platform (15-30 min)
- Signal Detection:
- Label-free: EIS measurement in [Fe(CN)₆]³⁻/⁴⁻ solution
- Label-based: DPV measurement after enzyme substrate addition
- Data Analysis: Charge transfer resistance (Rct) calculation for EIS or peak current measurement for DPV
Comparative Analysis: Label vs. Label-Free in Food Authentication
The selection between label-based and label-free detection for food authenticity involves critical trade-offs. Label-free EIS-based platforms offer simplicity and real-time monitoring of DNA hybridization without additional reagents, making them cost-effective for routine screening [30]. However, they may exhibit lower sensitivity in complex food matrices and require sophisticated data interpretation.
Label-based systems, particularly those employing enzyme amplification or nanoparticle tags, provide enhanced sensitivity and specificity, capable of detecting low-abundance targets in processed foods where DNA may be fragmented [29] [30]. The limitations include additional procedural steps, higher cost, and potential for non-specific signal generation.
Case Study 2: Cancer Biomarker Detection
Clinical Significance and Detection Challenges
Early cancer detection dramatically improves patient survival rates, with biomarker analysis offering a promising diagnostic pathway [31] [32]. Protein biomarkers such as HER2, CEA, PSA, and CA19-9 provide valuable diagnostic information when detected at clinically relevant levels [1] [33] [31]. Conventional detection methods like ELISA, PCR, and mass spectrometry, while sensitive, are often laboratory-bound, time-consuming, and require skilled personnel [33] [28]. Electrochemical biosensors present viable alternatives by offering rapid, sensitive, and potentially point-of-care diagnostic capabilities.
HER2 Breast Cancer Biomarker Detection
The human epidermal growth factor receptor 2 (HER2) is a 185 kDa protein overexpressed in 20-30% of breast cancers and serves as a critical prognostic and predictive biomarker [33]. A recent innovative biosensor demonstrated ultrasensitive HER2 detection using a label-free electrochemical platform.
Table 3: Performance Comparison of Cancer Biomarker Biosensors
| Biomarker | Cancer Type | Biosensor Design | Detection Method | Linear Range | LOD | Reference |
|---|---|---|---|---|---|---|
| HER2 | Breast | rGO/Fe₃O₄/Nafion/PANI/GCE | EIS/SWV | 10²-10⁶ cells mL⁻¹ | 5 cells mL⁻¹ | [33] |
| HER2 | Breast | MXene-based cytosensor | Label-free EIS | 10²-10⁶ cells mL⁻¹ | 47 cells mL⁻¹ | [33] |
| SKBR3 cells | Breast | CoFe₂O₄@Ag/HB5 | Label-based DPV | 10²-10⁶ cells mL⁻¹ | 47 cells mL⁻¹ | [33] |
| Various cancers | Multiple | Graphene/CaF₂ multilayer | Optical SPR | N/A | RI change: 0.001 | [34] |
Experimental Protocol: Label-Free HER2 Detection
Workflow Description: This protocol details the fabrication and operation of a nanocomposite-based label-free immunosensor for ultrasensitive detection of HER2-positive SKBR3 breast cancer cells. The platform employs a glassy carbon electrode modified with a green-synthesized reduced graphene oxide/Fe₃O₄/Nafion/polyaniline nanocomposite to enhance surface area and electron transfer efficiency.
Key Steps:
- Nanocomposite Synthesis:
- Green reduction of GO using ascorbic acid to produce rGO
- Co-precipitation synthesis of Fe₃O₄ nanoparticles
- In situ polymerization of aniline to form PANI
- Formulation of rGO/Fe₃O₄/Nafion/PANI nanocomposite
Electrode Modification:
- GCE polishing with alumina slurry
- Drop-casting of nanocomposite suspension
- Drying under infrared lamp
Antibody Immobilization:
- EDC/NHS activation of carboxyl groups
- Herceptin antibody immobilization (2h, room temperature)
- BSA blocking (1h) to prevent non-specific binding
Cell Detection and Analysis:
- Incubation with SKBR3 cell suspensions (varying concentrations)
- EIS measurements in 5mM [Fe(CN)₆]³⁻/⁴⁻ solution
- SWV measurements in PBS (pH 7.4)
- Data analysis using charge transfer resistance (Rct) vs. cell concentration
Optimization Parameters:
- Nafion concentration and incubation time optimized via Response Surface Methodology
- Central Composite Design for experimental optimization
- Optimal conditions: 0.5% Nafion, 30min incubation
Comparative Analysis: Label vs. Label-Free in Cancer Diagnosis
The HER2 detection case study illustrates significant performance differences between methodological approaches. The label-free rGO/Fe₃O₄/Nafion/PANI immunosensor achieved an exceptionally low detection limit of 5 cells mL⁻¹ with a broad linear range of 10²-10⁶ cells mL⁻¹, outperforming many label-based systems [33]. This demonstrates how advanced nanomaterials can enhance label-free sensitivity to clinically relevant levels.
Label-based approaches for cancer biomarker detection, while potentially more complex, offer alternative advantages. Enzyme-linked immunosorbent assays (ELISA) provide well-established protocols and high sensitivity but require multiple washing and incubation steps [28]. Nanoparticle-based labeling strategies using gold, silver, or quantum dots can provide significant signal amplification through catalytic activity or unique electrochemical signatures [29] [31].
Label-free platforms excel in simplicity, reduced analysis time, and preservation of biomolecular native state, making them ideal for rapid diagnostic screening [28]. Their limitations include potential matrix effects in complex biological fluids and generally more sophisticated data interpretation requirements. The choice between methodologies depends on the specific clinical context, required sensitivity, and available infrastructure.
The Scientist's Toolkit: Essential Research Reagents and Materials
Table 4: Key Research Reagent Solutions for Electrochemical Biosensing
| Reagent/Material | Function | Example Applications | Considerations |
|---|---|---|---|
| Reduced Graphene Oxide (rGO) | Enhanced conductivity, large surface area | HER2 detection, signal amplification | Green synthesis options available using ascorbic acid [33] |
| Magnetic Nanoparticles (Fe₃O₄) | Improved electron transfer, magnetic separation | HER2 biosensor, sample preparation | Biocompatible, easy surface functionalization [33] |
| Gold Nanoparticles (AuNPs) | Signal amplification, electron transfer enhancement | Pathogen detection, DNA sensors | High conductivity, biocompatible, easy functionalization [29] [26] |
| Nafion | Cation exchange polymer, stability enhancement | Sensor modification, interference reduction | Optimize concentration (typically 0.5-1%) [33] |
| Polyaniline (PANI) | Conductive polymer, signal transduction | Nanocomposite biosensors | Environmental stability, interesting redox properties [33] |
| EDC/NHS Chemistry | Carboxyl group activation for immobilization | Antibody, aptamer immobilization | Standard bioconjugation approach [33] |
| Screen-Printed Electrodes | Disposable, reproducible sensor platforms | Point-of-care testing, field deployment | Cost-effective, mass production [27] |
| Methylene Blue | Redox indicator in label-based systems | DNA hybridization detection | Intercalation or covalent attachment [29] |
| Horseradish Peroxidase | Enzyme label for signal amplification | ELISA alternatives, enhanced sensitivity | Requires substrate (H₂O₂) for detection [29] |
The comparative analysis of label-based and label-free electrochemical biosensors reveals a nuanced technological landscape where methodological selection depends heavily on application requirements. Label-free platforms demonstrate clear advantages in food authenticity applications through simplified DNA hybridization detection and real-time monitoring capabilities [30]. For cancer biomarker detection, sophisticated nanomaterial-enhanced label-free sensors can achieve exceptional sensitivity competitive with label-based approaches while offering procedural simplicity [33].
Future developments will likely focus on multiplexed detection capabilities, improved nanomaterials for signal enhancement, integration with microfluidic systems for automated sample processing [32], and artificial intelligence integration for advanced data interpretation. The convergence of these technologies will further establish electrochemical biosensors as indispensable tools across food safety and clinical diagnostics, potentially enabling truly personalized medicine through rapid, sensitive biomarker profiling.
The selection between label-free and labelled detection methods ultimately depends on various factors, including the biomolecular compound used, analyte type and biological binding site, biosensor design, sample volume, operational costs, analysis time, and desired detection limit [1]. Both approaches will continue to evolve synergistically, addressing the critical demands for rapid, sensitive, and specific detection across diverse application domains.
The evolution of biosensing technologies has progressively shifted toward methods that provide high sensitivity and specificity while minimizing external perturbations to the native biological system. Within this landscape, advanced optical techniques—namely interferometric, plasmonic, and single-molecule detection methods—have emerged as powerful tools. These techniques are predominantly characterized by their label-free operation, which eliminates the need for fluorescent dyes or other covalent labels that can alter biomolecular function [14] [10]. This capability is crucial for obtaining accurate kinetic data, observing transient interactions, and facilitating real-time monitoring in biomedical research and drug development. This guide provides a comparative analysis of these three optical techniques, focusing on their operational principles, performance metrics based on experimental data, and appropriate applications within life sciences research.
The table below summarizes the core characteristics, performance data, and primary applications of interferometric, plasmonic, and single-molecule detection methods, providing a baseline for their comparison.
Table 1: Performance Comparison of Advanced Label-Free Optical Biosensors
| Feature | Interferometric Biosensors | Plasmonic Biosensors | Single-Molecule Detection (Label-Free) |
|---|---|---|---|
| Fundamental Principle | Measures phase shift or interference pattern changes due to refractive index (RI) variation [35] | Measures RI change-induced shift in plasmon resonance condition (angle/wavelength) [6] [36] | Detects intrinsic scattering or absorption of single molecules [10] |
| Typical Measured Signal | Phase shift, lateral beam position shift [6] [35] | Resonance angle or wavelength shift [6] | Scattered light intensity, polarizability [10] |
| Demonstrated Sensitivity (LoD) | Procalcitonin: 1 pg mL⁻¹ (∼0.07 pM) [35]; Cytokines (TNF-α, IL-6): 1×10⁻¹⁶ M [6] | Picomolar (pM) level for conventional SPR; can reach femtomolar (fM) with signal enhancement [6] [36] | Single proteins in the tens of kilodalton range [10] |
| Bulk Refractive Index Sensitivity | 1.72×10⁸ nm/RIU (for lateral shift configuration) [6] | Varies; e.g., ∼10³–10⁴ nm/RIU for conventional SPR; higher for specialized structures [37] | Not typically measured in RIU; sensitivity is to molecular mass/volume [10] |
| Key Advantage | High sensitivity and intrinsic stability from common-path design [35] | Real-time, kinetic profiling of biomolecular interactions; well-established [10] [36] | Observes heterogeneity, transient states, and native biomolecular dynamics without ensemble averaging [10] |
| Primary Limitation | Dynamic range can be limited by sharp resonance features [35] | Probing volume limits single-molecule resolution for conventional SPR [10] | Extremely weak signals require sophisticated noise suppression and detection schemes [10] |
Detailed Technical Analysis
Interferometric Biosensors
Interferometric biosensors function by transducing a biological binding event into a measurable change in the properties of an interference pattern. A prominent principle within this category is the Goos-Hänchen (GH) shift, which refers to a lateral displacement of a light beam upon total internal reflection. This shift is highly sensitive to phase changes at the sensor surface, which are altered by biomolecular binding [6]. For instance, one study employed an atomically thin layer of Ge₂Sb₂Te₅ (GST) on a silver nanofilm to create a phase singularity, resulting in a massive GH shift of 439.3 μm and enabling the detection of cytokines like TNF-α and IL-6 at concentrations as low as 0.1 fM [6].
An alternative approach uses guided-mode resonances (GMRs) in dielectric nanostructures. In a common-path interferometric setup, two orthogonally polarized modes (TE and TM) are excited simultaneously. The TM mode, with its sharper phase response, acts as the sensing signal, while the broader TE mode serves as an internal reference. The relative phase difference between them is measured via an interferogram, providing inherent stability against environmental noise. This method has successfully detected the small protein procalcitonin (13 kDa) at a clinically relevant concentration of 1 pg mL⁻¹ [35].
Table 2: Key Experimental Reagents for Advanced Biosensing
| Reagent / Material | Function in Experiment | Example Technique |
|---|---|---|
| Ge₂Sb₂Te₅ (GST) Layer | Atomically thin capping layer to enhance phase singularity and protect silver film [6] | Plasmonic Biosensor with GH Shift |
| Silicon Nitride (Si₃N₄) | Dielectric material for constructing guided-mode resonance gratings [35] | Interferometric Biosensor |
| Gold / Silver Nano-films | Active plasmonic materials that support surface plasmon polaritons [6] [37] | SPR, LSPR, and Interferometric Sensors |
| Wollaston Prism | Optical element to create a small angle between orthogonally polarized beams for interferogram formation [35] | Common-Path Interferometry |
| Biotin & Streptavidin | High-affinity binding pair for creating well-defined, thick protein layers in validation studies [7] | Model System for Biosensor Calibration |
Plasmonic Biosensors
Plasmonic biosensors are a cornerstone of label-free detection, primarily based on surface plasmon resonance (SPR) and localized surface plasmon resonance (LSPR). SPR relies on the excitation of charge density waves at the interface between a metal (e.g., gold) and a dielectric. When biomolecules bind to the functionalized metal surface, the local refractive index changes, leading to a shift in the resonance angle or wavelength that can be monitored in real-time [14] [36]. While SPR is the gold standard for measuring binding kinetics and affinity, its propagating nature limits the spatial resolution, making it primarily an ensemble-averaging technique [10].
LSPR utilizes metallic nanoparticles rather than continuous films. The confinement of plasmons to the nanoparticle surface creates a much smaller probing volume, which enhances the sensitivity to individual binding events and makes LSPR more amenable to miniaturization and single-molecule detection [10] [36]. Performance varies significantly with the sensor's physical properties. A comparative study evaluating thick protein layers found that multi-parametric SPR (MP-SPR) provided a predictable signal for layers up to 300-400 nm thick, outperforming quartz crystal microbalance (QCM) and biolayer interferometry (BLI) in this regime [7].
The integration of plasmonics with optical fibers has created a versatile class of sensors. Configurations such as tilted fiber Bragg gratings (TFBGs) excite cladding modes that interact with the surrounding medium, offering high sensitivity and the potential for in-situ monitoring [37].
Single-Molecule Detection
Label-free single-molecule detection represents the sensitivity frontier, aiming to observe biomolecules without labels or immobilization. These techniques exploit intrinsic molecular properties, such as elastic Rayleigh scattering, where the scattering cross-section is proportional to the square of the molecular polarizability and thus its volume [10]. The primary challenge is the extremely weak signal, which demands sophisticated enhancement strategies.
The leading method is interference scattering microscopy (iSCAT). It detects a molecule by interfering its scattered light with a reference wave reflected from a substrate. The resulting interference pattern provides a contrast that scales linearly with the protein mass, enabling the detection of single proteins and functioning as an "optical mass spectrometer" [10]. Other techniques, like nanofluidic scattering microscopy (NSM), confine molecules within nanochannels to stabilize their signal, allowing for mass and diffusivity measurements of freely diffusing species [10].
While single-molecule fluorescence detection is highly sensitive, it requires fluorescent labeling. As noted, labels can perturb the system under study through effects such as altered binding affinities or native conformational dynamics, and they are susceptible to photobleaching [38] [10]. Label-free optical approaches circumvent these limitations, allowing prolonged observation of biomolecules in their native state.
Experimental Protocols & Workflows
Protocol for Common-Path Interferometric Sensing
This protocol is adapted from the detection of procalcitonin using a guided-mode resonance biosensor [35].
- Sensor Chip Fabrication: Design and fabricate a dielectric nanostructure (e.g., from Si₃N₄) on a substrate to support guided-mode resonances. The grating parameters are optimized independently for TE and TM modes.
- Optical Setup Configuration:
- Illuminate the sensor chip with a polarized, coherent light source (e.g., a laser).
- Incorporate a Wollaston prism in the output arm to introduce a small angle (∼1°) between the reflected TE and TM beams.
- Use an analyzer and a camera to project the beams onto the same polarization state, generating an interferogram in the overlap region.
- Surface Functionalization: Immobilize specific bioreceptors (e.g., antibodies against the target analyte) onto the sensor surface via standard chemical silanization or other bio-conjugation techniques.
- Sample Introduction & Data Acquisition:
- Flow the sample containing the analyte (e.g., serum spiked with procalcitonin) over the functionalized surface in a microfluidic chamber.
- Record a time-lapse sequence of interferograms as molecules bind to the surface.
- Data Analysis: Process the interferograms via Fourier analysis to extract the relative phase difference between the TE and TM modes. Plot the phase shift over time to obtain a sensorgram and quantify the analyte concentration.
Protocol for Plasmonic GH Shift Sensing
This protocol is adapted from the ultra-sensitive detection of cytokines using a phase-singularity-enhanced plasmonic biosensor [6].
- Substrate Preparation: Deposit a nanofilm stack onto a sapphire slide using DC magnetron sputtering. The stack consists of a Titanium adhesion layer (7 nm), a Silver layer (40 nm), and an atomically thin amorphous GST capping layer (1 nm).
- Sensor Calibration: Couple the substrate to an SF11 prism in a Kretschmann configuration. Flow glycerin solutions of known concentrations (and thus known refractive indices) over the sensor and measure the resulting GH shift to establish a calibration curve of shift distance versus refractive index change.
- Bioreceptor Immobilization: Functionalize the GST surface with antibodies specific to the target biomarkers (e.g., anti-TNF-α and anti-IL-6).
- Target Analyte Detection:
- Direct the p-polarized incident light from a 785 nm laser to the resonance angle.
- Flow the sample (e.g., buffer spiked with cytokines) over the sensor surface.
- Use a quadrant sensor or CCD to precisely measure the lateral position shift of the reflected p-polarized beam relative to the s-polarized reference beam.
- Kinetic Analysis: Relate the measured GH shift to the surface mass density of bound analyte. The shift can be monitored in real-time to derive association and dissociation rate constants for the binding interaction.
The choice between interferometric, plasmonic, and single-molecule detection techniques is dictated by the specific requirements of the biological question. For routine, high-throughput kinetic analysis of biomolecular interactions, SPR remains the established workhorse. However, for applications demanding the ultimate sensitivity, such as detecting low-abundance biomarkers for early disease diagnosis, interferometric methods like phase-enhanced GH shift sensing currently hold the edge, demonstrating detection limits down to the atto- and femtomolar range [6] [35].
When the goal is to probe molecular heterogeneity, observe transient states, or analyze samples without any form of labeling, label-free single-molecule detection (e.g., iSCAT) is the unrivaled technique, albeit with more complex instrumentation [10]. The ongoing integration of machine learning with these sensor technologies is poised to further enhance their performance by improving data analysis and pattern recognition for complex biological samples [36].
In conclusion, interferometric, plasmonic, and single-molecule optical techniques provide a powerful, label-free toolkit for modern biosensing. Their continued development and application will undoubtedly deepen our understanding of biological mechanisms and accelerate diagnostic and drug discovery workflows.
In vivo label-free imaging represents a transformative approach in biomedical research, enabling the direct observation of metabolic processes and cellular environments without the need for synthetic dyes or fluorescent tags. These technologies exploit intrinsic molecular properties—such as mass, refractive index, or autofluorescence—to provide quantitative analytical information about biological systems in their native state [2]. The fundamental principle underlying label-free biosensing involves integrating a biological recognition element with a transducer that converts molecular interactions directly into measurable signals [39]. This approach stands in stark contrast to label-based techniques, which rely on molecular labels such as enzymes, nanoparticles, or fluorescent tags to generate detectable signals [1].
The significance of label-free imaging is particularly evident in metabolic studies, where it enables researchers to monitor functional changes in living systems without artificial perturbations. For example, autofluorescence imaging of endogenous metabolic coenzymes including reduced nicotinamide adenine dinucleotide (NADH) and oxidized flavin adenine dinucleotide (FAD) provides direct metrics for detecting metabolic variations in their native physiological context [40]. This capability is revolutionizing our understanding of cellular metabolism in fields ranging from cancer biology to immunology, as it preserves the authentic biochemical environment while enabling dynamic monitoring of metabolic pathway usage [40]. As these technologies continue to advance, they are increasingly being integrated with complementary approaches such as machine learning algorithms to enhance their analytical power and specificity [40].
Comparative Analysis: Label-Free vs. Label-Based Biosensing
Fundamental Principles and Mechanisms
Label-free and label-based biosensing technologies employ fundamentally different detection mechanisms, each with distinct advantages and limitations. Label-free detection mechanisms elicit response signals directly when analyte molecules bind to the sensor surface, measuring intrinsic molecular properties including mass, refractive index, or electrical characteristics [1] [2]. This approach includes techniques such as surface plasmon resonance (SPR), electrochemical impedance spectroscopy, and autofluorescence lifetime imaging [1] [39]. The absence of labels preserves the native state of biological molecules and enables real-time monitoring of molecular interactions without additional processing steps [2].
In contrast, label-based detection employs molecular labels including enzymes, nanoparticles, and fluorescent tags to generate detectable signals [1]. These approaches include methods such as enzyme-linked immunosorbent assay (ELISA), fluorescence microscopy, and lateral flow immunoassay (LFIA) [39]. While labeling can enhance sensitivity and facilitate multiplexed detection, it introduces potential limitations including steric hindrance, altered biological activity, and complex preparation workflows [1] [39]. The selection between label-free and labeled detection methods depends on various factors, including the biomolecular compound used, analyte type, biological binding site, biosensor design, sample volume, operational costs, analysis time, and desired detection limit [1].
Table 1: Comparison of Fundamental Characteristics Between Label-Free and Label-Based Biosensing
| Characteristic | Label-Free Biosensing | Label-Based Biosensing |
|---|---|---|
| Detection Principle | Measures intrinsic molecular properties | Relies on synthetic labels for signal generation |
| Sample Preparation | Minimal processing required | Often complex labeling procedures |
| Molecular Perturbation | Minimal, preserves native state | Potential steric hindrance and altered function |
| Real-Time Monitoring | Excellent capability | Often limited by labeling process |
| Multiplexing Potential | Developing, through advanced sensors | Well-established with different labels |
| Cost Considerations | Lower per test, potentially higher initial investment | Recurring costs for labels and reagents |
Performance Metrics and Applications
The analytical performance of label-free and label-based biosensors varies significantly across different application domains, with each approach offering distinct advantages for specific use cases. Label-free electrochemical biosensors have demonstrated exceptional capability for achieving low detection limits, either with or without sample preparation, making them particularly valuable for point-of-care diagnostics [1]. For metabolic imaging, autofluorescence lifetime imaging of NADH and FAD has enabled the classification of cellular metabolic phenotypes with 90-95% accuracy, providing powerful insights into metabolic heterogeneity without exogenous probes [40].
Label-based approaches, particularly those using enzymatic labels or fluorescent tags, often provide enhanced signal amplification, which can be advantageous for detecting low-abundance analytes [1]. Lateral flow immunoassay (LFIA) technologies, for instance, have been successfully used for rapid diagnostics of infectious diseases, though they face limitations in quantitative accuracy and often require confirmation by more specific methods [39]. Recent advances in both approaches have focused on improving sensitivity, specificity, and multiplexing capabilities, with label-free methods increasingly leveraging nanomaterial enhancements and machine learning algorithms to overcome historical limitations [4] [40].
Table 2: Performance Comparison for Key Application Areas
| Application Area | Label-Free Approach | Label-Based Approach | Relative Advantages |
|---|---|---|---|
| Metabolic Imaging | Autofluorescence lifetime imaging of NADH/FAD [40] | Fluorescent glucose analogs (2-NBDG) | Label-free preserves native metabolism; enables long-term tracking |
| Protein Biomarker Detection | Electrochemical impedance spectroscopy [1] | Enzyme-linked immunosorbent assay (ELISA) | Label-free offers real-time kinetics; label-based provides amplification |
| Infectious Disease Diagnosis | Surface plasmon resonance (SPR) biosensors [39] | Lateral flow immunoassay (LFIA) [39] | Label-free offers quantitative precision; LFIA provides rapid screening |
| Drug Discovery | SPR monitoring of molecular interactions [2] | Fluorescence polarization assays | Label-free reveals binding kinetics without artifacts |
| Single-Cell Analysis | Raman spectroscopy & FLIM [40] | Fluorescence-activated cell sorting (FACS) | Label-free maintains viability; enables longitudinal studies |
Experimental Approaches in Label-Free Metabolic Imaging
Fluorescence Lifetime Imaging (FLIM) of Metabolic Coenzymes
Autofluorescence lifetime imaging microscopy (FLIM) of endogenous metabolic coenzymes represents one of the most powerful approaches for label-free metabolic monitoring in living systems. This methodology exploits the natural fluorescence properties of two key metabolic coenzymes: reduced nicotinamide adenine dinucleotide (NADH) and oxidized flavin adenine dinucleotide (FAD) [40]. The fluorescence lifetime—defined as the time a fluorophore remains in the excited state before releasing a fluorescent photon—provides sensitive information about molecular conformations and local microenvironments [40]. Both NADH and FAD exist in two distinct conformations within cells: protein-bound and free, with each state exhibiting characteristically different fluorescence lifetimes [40].
The experimental protocol for metabolic FLIM involves several critical steps. First, cells or tissues are maintained under physiologically relevant conditions without any fixation or labeling procedures. Multi-photon excitation is typically employed to minimize photodamage and enhance penetration depth in living samples [40]. NADH fluorescence is commonly excited at approximately 740 nm with emission collected in the 450-500 nm range, while FAD is excited at around 900 nm with emission collected in the 500-550 nm range [40]. The resulting fluorescence decay curves are then fitted to multi-exponential models to extract lifetime components (τ1, τ2) and their relative amplitudes (α1, α2), which reflect the relative proportions of free and protein-bound coenzyme states [40]. These parameters serve as sensitive indicators of metabolic activity, as they shift characteristically during transitions between different metabolic pathways including glycolysis, oxidative phosphorylation, and glutaminolysis [40].
Machine Learning Integration for Metabolic Phenotyping
A groundbreaking advancement in label-free metabolic imaging involves the integration of fluorescence lifetime data with machine learning algorithms to classify metabolic phenotypes with high accuracy. In this approach, autofluorescence lifetime images of NADH and FAD are first acquired from cells under controlled metabolic conditions—for example, cells manipulated to depend primarily on glycolysis versus oxidative phosphorylation through specific substrate availability and metabolic inhibitors [40]. The resulting fluorescence lifetime features are then used to train conventional machine learning models including support vector machines or random forest classifiers, which can achieve 90-92% accuracy in distinguishing glycolytic from oxidative phenotypes [40].
More sophisticated convolutional neural networks (CNNs) adapted to process the spatial information in fluorescence lifetime images directly have demonstrated even higher performance, reaching approximately 95% classification accuracy [40]. Notably, models trained on cancer cell data can be successfully transferred to predict metabolic states in non-cancerous cells, with one study demonstrating that a model trained on cancer cells could correctly classify 80% of activated T cells as glycolytic and 97% of quiescent T cells as oxidative [40]. This transferability highlights the robustness of the autofluorescence lifetime features across different cell types and suggests that conserved metabolic principles can be captured through this label-free approach.
Signaling Pathways in Metabolic Imaging
NADH and FAD in Cellular Energy Metabolism
The exceptional utility of NADH and FAD as endogenous biomarkers for label-free metabolic imaging stems from their central roles in cellular energy transduction pathways. NADH serves as a critical electron carrier in both glycolysis and oxidative phosphorylation, while FAD functions as an essential redox cofactor primarily in the mitochondrial electron transport chain [40]. In glycolysis, glucose is broken down to pyruvate with concomitant reduction of NAD+ to NADH in the cytosol. This NADH can then transfer reducing equivalents to the mitochondria through shuttle systems, ultimately contributing to the proton gradient driving ATP synthesis [40]. The fluorescence properties of these coenzymes are exquisitely sensitive to their binding status to metabolic enzymes, with protein-bound states typically exhibiting longer fluorescence lifetimes than free states [40].
The optical redox ratio—defined as the fluorescence intensity ratio of NADH to FAD—provides a quantitative measure of the cellular redox state and has been widely employed as a metabolic indicator [40]. However, fluorescence lifetime measurements offer additional dimensionality by resolving not just concentration but also conformational states of these coenzymes. For instance, the free-to-bound ratio of NADH decreases when cells shift toward oxidative phosphorylation, as more NADH becomes bound to mitochondrial enzymes [40]. Similarly, FAD lifetime parameters shift characteristically during metabolic perturbations, providing complementary information about mitochondrial function. This rich multidimensional data enables more specific interpretation of metabolic states than intensity-based measurements alone.
Metabolic Heterogeneity in Disease States
Label-free metabolic imaging has revealed profound metabolic heterogeneity within seemingly uniform cell populations, with significant implications for understanding disease mechanisms and therapeutic responses. In cancer biology, autofluorescence lifetime imaging has demonstrated that metabolic heterogeneity correlates with metastatic potential and treatment resistance [40]. Similarly, in immunology, distinct metabolic phenotypes have been identified between quiescent and activated T cells, with activated pro-inflammatory T cells exhibiting predominantly glycolytic metabolism while quiescent cells rely more on oxidative phosphorylation [40]. This metabolic stratification provides insights into functional states that complement transcriptional and proteomic analyses.
The ability to monitor metabolic dynamics at single-cell resolution while maintaining spatial context represents a particular strength of label-free imaging approaches. For example, FLIM has been used to track metabolic changes in individual cells within tumor microenvironments, revealing how spatial positioning influences metabolic phenotype [40]. This capability is vital for understanding metabolic interactions between different cell types in complex tissues, such as the metabolic coupling between cancer cells and cancer-associated fibroblasts. By preserving spatial relationships and enabling longitudinal monitoring, label-free metabolic imaging provides a window into dynamic metabolic processes that is difficult to achieve with destructive endpoint assays.
The Scientist's Toolkit: Essential Research Reagents and Materials
Successful implementation of in vivo label-free imaging requires specific research tools and materials optimized for preserving native metabolic states and maximizing detection sensitivity. The following table details essential components of the experimental workflow for autofluorescence-based metabolic imaging, along with their critical functions and application notes.
Table 3: Essential Research Reagents and Materials for Label-Free Metabolic Imaging
| Category | Specific Reagents/Materials | Function in Experiment | Application Notes |
|---|---|---|---|
| Cell Culture | Phenol-red free culture media | Minimizes background autofluorescence | Essential for reducing interference with NADH/FAD detection |
| Specific metabolic substrates (glucose, glutamine, fatty acids) | Controls metabolic pathway utilization | Enables experimental manipulation of metabolic states | |
| Metabolic inhibitors (oligomycin, 2-DG, BPTES) | Modulates specific metabolic pathways | Validates metabolic dependencies and phenotypes | |
| Imaging Setup | Multi-photon excitation source | Enables deep tissue penetration with minimal photodamage | Preferred over single-photon for live samples |
| Time-correlated single photon counting (TCSPC) system | Measures fluorescence decay with high precision | Essential for fluorescence lifetime imaging | |
| Bandpass filters (450/50 nm for NADH, 550/50 nm for FAD) | Isolates specific emission signals | Critical for spectral separation of autofluorescence | |
| Data Analysis | Fluorescence lifetime fitting software | Extracts lifetime components from decay data | Typically uses multi-exponential models |
| Machine learning platforms (Python, MATLAB) | Classifies metabolic phenotypes from lifetime features | Enables automated high-throughput analysis | |
| Validation | Extracellular flux analyzers (Seahorse) | Measures OCR and ECAR as gold standard | Provides orthogonal validation of metabolic states |
| Biochemical assays (ATP, lactate measurements) | Quantifies metabolic endpoints | Correlates with optical measurements |
Future Perspectives and Concluding Remarks
Label-free imaging technologies are poised to revolutionize our understanding of cellular metabolism in living systems, offering unprecedented capabilities for dynamic monitoring without artificial perturbations. The integration of these approaches with advanced computational methods, particularly machine learning algorithms, is enhancing both the classification accuracy and interpretability of metabolic data [40]. Future developments will likely focus on improving spatial resolution, penetration depth, and multiplexing capabilities while reducing computational complexity for broader accessibility.
The application range of label-free biosensors is highly likely to expand, providing more powerful economical tools for clinical diagnosis, environmental monitoring, and industrial quality control [2]. Emerging trends include the integration of optical biosensors with artificial intelligence to enable enhanced analytical performance and real-time decision-making [41]. Additionally, the development of novel single-molecule, label-free sensing schemes that are cost-effective and easy to use will further broaden accessibility and application scope [2]. As these technologies mature, they hold tremendous promise for transforming both basic research and clinical practice by enabling non-invasive, functional assessment of metabolic states in their native physiological contexts.
Enhancing Performance, Sensitivity, and Robustness
The choice of assay configuration is a critical decision in biosensor research and drug development, directly impacting the quality, efficiency, and relevance of the data generated. This choice is often framed between traditional, well-established microplate systems and emerging, sophisticated microfluidic platforms. Furthermore, the strategic decision between using label-based detection methods, which rely on fluorescent or colorimetric tags, and label-free strategies, which measure inherent biomolecular properties, adds another layer of complexity. This guide provides an objective comparison of microfluidic and microplate configurations, situating the analysis within the broader context of label-based versus label-free biosensor research. By presenting experimental data, detailed protocols, and key technical considerations, we aim to equip researchers and scientists with the information needed to optimize their assay formats for specific applications.
Platform Comparison: Microfluidic vs. Microplate Systems
Microplate and microfluidic systems operate on fundamentally different principles, leading to distinct performance characteristics. The table below summarizes a direct, objective comparison of these two platforms.
Table 1: Direct comparison of microplate and microfluidic assay configurations.
| Feature | Microplate Configuration | Microfluidic Configuration |
|---|---|---|
| Sample & Reagent Consumption | High (typically 50-200 µL per well) [42] | Low (nano- to micro-liter volumes) [43] [32] |
| Analysis Scale | Bulk-cell analysis (population average, ~10,000 cells/well) [42] | Single-cell monitoring and analysis [42] [32] |
| Throughput | High-throughput, parallel processing of 96, 384, or 1536 samples [42] | Variable; can be high-throughput via parallelization, but often focused on rapid, serial analysis [44] |
| Analysis Time | Minutes to hours; slower due to diffusion-limited kinetics [45] | Seconds to minutes; rapid analysis due to short diffusion distances and controlled flow [45] |
| Data Output | Population-average, end-point or kinetic data [42] | Real-time, dynamic data from individual cells or molecules [42] [32] |
| Key Advantage | Comprehensive bulk measurements, high-throughput, standardized [42] | Insights into cellular heterogeneity, low reagent cost, rapid analysis [42] |
| Primary Limitation | Masks cell-to-cell variation, higher reagent consumption [42] | Can be limited by the number of single cells analyzed, potentially more complex operation [42] |
Label-Based vs. Label-Free Biosensing in Assay Configuration
The distinction between label-based and label-free methodologies cuts across both microplate and microfluidic platforms, representing a core strategic choice in assay design.
Label-Based Biosensors: These rely on a fluorescent, colorimetric, or other tag being attached to the analyte or a reporter molecule. A prime example is the use of calcium-sensitive dyes like Fluo-4 to monitor intracellular calcium concentration ([Ca²⁺]i) in response to a stimulus [42]. While label-based methods can be highly sensitive, the labeling process can be laborious, may disrupt the native function of the biomolecule, and introduces the possibility of background noise from unbound labels [14].
Label-Free Biosensors: These techniques detect analytes based on their inherent properties, such as refractive index, electrical impedance, surface charge, or mass, without the need for covalent labeling [14]. Technologies enabling label-free detection include surface plasmon resonance (SPR), electrochemical impedance spectroscopy (EIS), and field-effect transistors (FET) [14] [16]. The primary advantages are the ability to monitor biomolecular interactions in real-time without modification and to avoid potential side-effects caused by labels [14].
The choice of platform influences the implementation of these methods. Label-free detection in microplates, for instance, can be hindered by slow diffusion times, whereas the flow-based nature of microfluidics can significantly accelerate the establishment of a stable equilibrium for label-free measurements [45].
Supporting Experimental Data: A Direct Comparative Study
A direct comparative study investigating intracellular calcium ([Ca²⁺]i) dynamics in A549 lung cancer cells provides quantitative data to underscore the differences between these platforms. The study used an identical biological system—histamine-induced calcium response in wild-type and ACE2-enriched A549 cells—to compare a microfluidic single-cell method with a microplate bulk-cell method [42].
Table 2: Experimental results from a direct comparison of microfluidic single-cell and microplate bulk-cell assays for measuring histamine-induced calcium response in A549 cells.
| Assay Configuration | Cell Type Analyzed | Stimulant | Key Finding | Assay Characteristic |
|---|---|---|---|---|
| Microfluidic Single-Cell | Wild-type & ACE2-enriched A549 | Histamine | Wild-type A549 cells exhibited a stronger histamine-induced calcium response than ACE2-enriched cells. | Provides temporal resolution on single-cell dynamics. |
| Microplate Bulk-Cell | Wild-type & ACE2-enriched A549 | Histamine | Wild-type A549 cells exhibited a stronger histamine-induced calcium response than ACE2-enriched cells. | Provides a population-level average measurement. |
This study confirmed that both methods can yield consistent patterns in calcium signaling, validating their biological relevance. The critical difference lies in the nature of the information: the microplate reader provided a robust population average, while the microfluidic chip revealed real-time dynamics and heterogeneity at the single-cell level [42]. The two methods are therefore complementary; single-cell assays provide temporal and low-reagent analysis, while bulk assays provide high-throughput, population-level averages [42].
Detailed Experimental Protocols
To illustrate how these assays are implemented in practice, here are the detailed methodologies for the key experiments cited from the comparative study [42].
Protocol 1: Single-Cell Intracellular Calcium Measurement via Microfluidic Chip
This protocol details the process for monitoring calcium flux in individual cells in real-time.
- Chip Preparation: A glass microfluidic chip with three reservoirs, three channels, and a chamber featuring a V-shaped cell retention structure is used. The chip is first washed and prepared for cell loading.
- Cell Loading:
- A small aliquot (5 µL) of cell suspension is added to Reservoir 1.
- A slight pressure difference is created by removing a small amount of medium from Reservoir 3, causing cells to flow from left to right.
- As a cell approaches the retention structure, medium is added to Reservoir 3 to stabilize the pressure and trap the cell.
- Fluorescence Imaging: The chip is placed on an inverted fluorescence microscope (e.g., Nikon TE300) equipped with a CCD camera. The fluorescence emitted from the calcium-Fluo-4 chelate is monitored over time.
- Drug Delivery and Data Acquisition: A histamine working solution (e.g., 5-10 µM in HBSS) is introduced via Reservoir 2. The fluorescence intensity of the single cell is recorded in real-time throughout the experiment.
- Data Calculation: The change in intracellular calcium concentration ([Ca²⁺]i) is calculated using the formula:
[Ca²⁺]i = Kd * (F - Fmin) / (Fmax - F)whereKdis the dissociation constant,Fis the measured fluorescence,Fminis the fluorescence in a calcium-free solution, andFmaxis the fluorescence after cell lysis.
Protocol 2: Bulk-Cell Intracellular Calcium Measurement via Microplate Reader
This protocol outlines the steps for a high-throughput, population-average calcium assay.
- Cell Seeding: A549 cells are seeded into a black, clear-bottom, 96-well microplate at a density of 10,000 cells per well. Cells are cultured for 24 hours to ensure adherence.
- Dye Loading: After 24 hours, the growth medium is replaced with a freshly prepared 5 µM Fluo-4 AM working solution in HBSS. The plate is incubated for 45 minutes at 37°C.
- Washing: The extracellular dye solution is removed, and each well is washed gently with HBSS before being topped up with a final volume of 200 µL of HBSS.
- Baseline Measurement: Using a microplate reader (e.g., Tecan M200), the fluorescence of all wells is measured in bottom-reading mode to establish a baseline (
F). A cell-free well with buffer is also measured to establishFmin. - Stimulation and Reading: The histamine working solution is automatically dispensed into the wells, and fluorescence measurements are taken continuously to monitor the kinetic response.
- Data Analysis: The fluorescence data from all wells is processed, and the calcium response is calculated similarly to the microfluidic method, yielding an average response for the cell population in each well.
Visualizing the Experimental Workflows
The diagrams below illustrate the logical flow and key components of the two primary experimental setups described in the protocols.
Microplate Bulk-Cell Assay Workflow
Microfluidic Single-Cell Assay Workflow
The Scientist's Toolkit: Key Research Reagent Solutions
The successful execution of biosensor assays, whether label-based or label-free, relies on a suite of essential materials and reagents. The following table details key components used in the featured experiments and the broader field.
Table 3: Essential materials and reagents for biosensor research, with a focus on calcium signaling assays and general biosensor construction.
| Item | Function & Application | Example from Research |
|---|---|---|
| Fluorescent Dyes (e.g., Fluo-4 AM) | Label-based detection: Cell-permeable dye that becomes fluorescent upon binding to intracellular calcium ([Ca²⁺]i), enabling visualization of signaling dynamics [42]. | Used to compare histamine-induced calcium responses in microfluidic vs. microplate formats [42]. |
| Biorecognition Elements | The core of biosensor specificity: Antibodies, enzymes, aptamers, or whole cells that bind the target analyte with high specificity [46] [16]. | Immobilized TNF-alpha capture antibody used in a model label-free biosensor system [45]. |
| Cell Lines (e.g., A549) | Cellular models: Well-characterized cells used to study biological processes and drug effects. A549 is a human alveolar epithelial cell line. | Used as a model to study histamine receptor activation and calcium signaling [42]. |
| Microfluidic Chips | Miniaturized platform: Devices with micro-scale channels and chambers for manipulating fluids and cells, enabling single-cell analysis and low reagent use [42] [44]. | Glass chip with a V-shaped cell retention structure for trapping and monitoring single cells [42]. |
| Nanomaterials (e.g., AuNPs, Graphene) | Signal enhancement: Used in label-free biosensors to enhance sensitivity and selectivity by providing high surface area and unique electrical/optical properties [14] [32]. | Gold nanoparticles (AuNPs) and graphene enhance electrochemical and optical signals in microfluidic biosensors [32]. |
The decision between microfluidic and microplate configurations is not a matter of declaring one universally superior to the other. Instead, it is a strategic choice that should be guided by the specific research question. Microplates are the undisputed choice for high-throughput screening that requires population-average data and leverages standardized, automated protocols. In contrast, microfluidics excels in applications demanding single-cell resolution, minimal reagent consumption, and real-time kinetic analysis of biological processes. This platform comparison is further nuanced by the choice between label-based and label-free detection methods, each with its own trade-offs in sensitivity, simplicity, and proximity to native biological conditions. As the field advances, the integration of nanomaterials and artificial intelligence with microfluidic biosensors is poised to further enhance their capabilities, solidifying their role in the future of personalized medicine and advanced diagnostic workflows [32]. Researchers are best served by understanding the complementary strengths of these powerful technologies.
Leveraging Nanomaterials and Signal Amplification for Enhanced Sensitivity
The evolution of biosensor technology has been significantly influenced by the dichotomy between label-based and label-free detection strategies, a central theme in comparative biosensor research. Label-free strategies, which have undergone tremendous advances in recent years, are defined by their ability to detect target molecules without requiring the covalent label or modification of analytes or recognition elements with signal probes like fluorophores or electrochemical indicators [14]. In contrast, label-based methods rely on these extrinsic labels to generate a detectable signal. The distinct features of label-free biosensors include the avoidance of potential side-effects caused by label modifications, no need for laborious and time-consuming labeling processes, cost effectiveness, simple detection, and the capacity for real-time, non-invasive monitoring [14]. These advantages make label-free platforms particularly appealing for applications where preserving the native state of biomolecules is crucial, such as in biomolecular interaction analysis, clinical diagnostics, and real-time monitoring in living systems.
The integration of nanotechnology has revolutionized both label-based and label-free biosensing approaches, but its impact on label-free systems has been particularly transformative. Novel nanomaterials—including quantum dots (QDs), gold nanoparticles (AuNPs), metal-organic frameworks (MOFs), covalent organic frameworks (COFs), carbon nanotubes, and nanowires—have been extensively employed to enhance sensor performance [14] [47]. These materials contribute high surface-to-volume ratios, quantum size effects, high adsorption capacity, and reactive surfaces that significantly boost sensitivity. When combined with signal amplification techniques such as hybridization chain reaction (HCR), recombinase polymerase amplification (RPA), and rolling circle amplification (RCA), these nanomaterial-enhanced biosensors achieve remarkable detection limits while maintaining the inherent advantages of label-free detection [14].
This review provides a comprehensive comparison of label-free versus label-based biosensing platforms, with a specific focus on how nanomaterials and signal amplification strategies enhance sensitivity. We present systematically organized experimental data and methodologies to guide researchers and drug development professionals in selecting appropriate biosensing strategies for their specific applications.
Comparative Performance Analysis: Label-Free vs. Label-Based Biosensors
Fundamental Characteristics and Applications
Table 1: Fundamental Characteristics of Label-Free vs. Label-Based Biosensors
| Characteristic | Label-Free Biosensors | Label-Based Biosensors |
|---|---|---|
| Signal Generation | Relies on inherent properties of analytes (refractive index, electrical impedance, mass) or supramolecular interactions [14] | Dependent on covalent label/modification with signal probes (fluorophores, isotopes, electrochemical indicators) [14] |
| Sample Preparation | Simplified preparation; no labeling steps required [14] | Often requires complex, time-consuming labeling procedures [14] |
| Risk of Artifacts | Minimal risk of altering biomolecule function or binding affinity [10] | Labels may perturb system, altering binding affinities or conformational dynamics [10] |
| Real-Time Monitoring | Excellent capability for real-time, continuous monitoring [14] | Limited for continuous monitoring due to photobleaching, label instability [10] |
| Cost Considerations | Generally lower cost per test; no expensive labels required [14] | Higher cost due to label reagents and additional processing steps [14] |
| In Vivo Applicability | Suitable for in vivo imaging and monitoring [14] | Limited by potential toxicity and size of labels [10] |
| Multiplexing Capacity | Developing; challenges in distinguishing multiple analytes [14] | Well-established with different fluorescent labels [14] |
Analytical Performance Metrics Across Detection Modalities
Table 2: Performance Comparison of Label-Free Biosensing Techniques Enhanced by Nanomaterials
| Technique | Typical Analytes | Detection Limit | Linear Range | Key Nanomaterials | Signal Amplification Methods |
|---|---|---|---|---|---|
| Colorimetric | Metal ions (Pb²⁺), proteins, small molecules [48] | ~2.4 pmol/L (for Pb²⁺) [48] | 0.01 nmol/L - 100 μmol/L [48] | MnO₂ nanoflowers, AuNPs [48] [14] | DNAzyme cleavage, enzyme mimics [48] |
| Electrochemical | Glucose, proteins, nucleic acids [47] [24] | Varies with design; often sub-nM [47] | Broad, application-dependent [47] | CNTs, graphene, metal nanoparticles [47] [49] | HCR, RPA, EXPAR [14] |
| Fluorescence | RNA, DNA, proteins, enzymes [14] | Single-molecule detection achievable [10] | Application-dependent [14] | QDs, MOFs, COFs [14] | HCR, DSNSA, transcriptional amplification [14] |
| SPR | Proteins, biomarkers, viruses [14] [10] | ~pg/mm² mass concentration [10] | Not specified | Gold films, nanoparticles [10] [14] | Localized surface plasmon resonance [10] |
| FET | Proteins, ions, nucleic acids [14] | Often fM range [14] | Not specified | Graphene, semiconductor nanowires [14] | Nanomaterial-enhanced charge transfer [14] |
| SERS | Metabolites, proteins, pathogens [14] | Single-molecule detection [10] | Not specified | Roughened metal surfaces, nanoparticles [14] | Plasmonic enhancement [14] |
Technical Considerations for Implementation
Table 3: Technical Considerations for Biosensor Implementation
| Parameter | Label-Free Biosensors | Label-Based Biosensors |
|---|---|---|
| Nonspecific Binding Management | Requires reference channels with control probes (e.g., BSA, isotype antibodies) [50] | Less affected by NSB due to specific label detection |
| Stability & Shelf-Life | Generally high stability; limited mainly by bioreceptor degradation [47] | Limited by label stability; photobleaching concerns [10] |
| Instrument Complexity | Varies from simple (colorimetric) to complex (SPR, single-molecule detection) [14] [48] | Often requires excitation sources, filters (optical methods) [10] |
| Multiplexing Capability | Emerging approaches using multi-parameter detection [14] | Well-established with multiple reporter labels [14] |
| Regulatory Approval Status | Increasingly accepted; well-established for SPR [10] | Extensive history with approved clinical assays |
Experimental Protocols: Methodologies for Enhanced Sensitivity
Label-Free Colorimetric Detection of Lead Ions Using MnO₂ Nanoflowers
The following protocol demonstrates a representative label-free biosensor that utilizes MnO₂ nanoflowers as nanozymes with oxidase-like activity for sensitive detection of Pb²⁺ ions [48].
Principle: The biosensor employs an aptazyme strand (DNAzyme) that undergoes cleavage in the presence of Pb²⁺ ions. The cleavage reaction releases substrate fragments that enhance the catalytic activity of MnO₂ nanoflowers, leading to increased oxidation of chromogenic substrates and detectable color changes [48].
Materials:
- MnO₂ Nanoflowers: Synthesized from KMnO₄ and PVP, providing high surface area and catalytic activity [48]
- Aptazyme and Substrate Strands: Custom DNA sequences; aptazyme strand hybridizes with substrate strand [48]
- Chromogenic Substrate: TMB (3,3',5,5'-tetramethylbenzidine) for visual detection [48]
- Buffer Components: Tris-HCl (10 mmol/L, pH 7.4) for maintaining optimal reaction conditions [48]
- Pb²⁺ Standards: For calibration curve generation
Procedure:
- MnO₂ Nanoflower Synthesis: Mix KMnO₄ and PVP in specific ratios with hydrochloric acid, followed by centrifugation and washing to obtain MnO₂ nanoflowers [48].
- Aptazyme-Substrate Hybrid Preparation: Hybridize aptazyme and substrate strands in appropriate buffer by heating to 90°C and gradual cooling to room temperature [48].
- Detection Reaction:
- Incubate Pb²⁺ samples with the aptazyme-substrate hybrid to activate DNAzyme cleavage.
- Add MnO₂ nanoflowers and TMB substrate to the reaction mixture.
- Monitor color development visually or spectrophotometrically at 652 nm.
- Data Analysis: Generate calibration curve from Pb²⁺ standards; calculate unknown concentrations from linear regression analysis [48].
Optimization Notes:
- The 3D structure of MnO₂ nanoflowers provides superior catalytic activity compared to other MnO₂ nanostructures [48].
- The cleavage reaction is highly specific to Pb²⁺ when using the appropriate DNAzyme sequence [48].
- Color intensity correlates directly with Pb²⁺ concentration across a broad linear range [48].
Reference Control Selection for Nonspecific Binding Management
A critical methodological consideration for label-free biosensors is managing nonspecific binding (NSB), particularly when working with complex matrices like serum. The FDA-inspired framework for optimal control probe selection involves [50]:
Procedure:
- Control Probe Panel Preparation: Select a panel of potential control probes including:
- Matched isotype control antibodies
- Non-matched isotype controls
- Bovine serum albumin (BSA)
- Anti-FITC antibodies
- Cytochrome c (charged non-antibody control) [50]
- Sensor Functionalization: Immobilize both specific capture probe and control probes on separate sensor regions using standardized surface chemistry [50].
- Sample Exposure: Test sensors with both target analyte and complex matrix samples (e.g., serum).
- Response Assessment: Evaluate control probes based on:
- Linearity: How well the control tracks NSB across concentrations
- Accuracy: Ability to correct for NSB without over- or under-subtraction
- Selectivity: Specificity in distinguishing target binding from NSB [50]
- Optimal Control Selection: Select the highest-scoring control for each specific assay; note that optimal controls may differ between analytes [50].
Nanomaterial-Enhanced Electrochemical Aptasensing
Materials:
- Electrode Modifiers: Gold nanoparticles, carbon nanomaterials, metal oxides [49]
- Aptamer Recognition Elements: Thiol-modified for gold surface immobilization [49]
- Signal Amplification Elements: Metal-organic frameworks, quantum dots, graphene composites [49]
Procedure:
- Electrode Modification: Nanomaterials are utilized as (i) electrode modifiers, (ii) nanocarriers, (iii) nanocatalysts, or (iv) luminophores to enhance signals [49].
- Aptamer Immobilization: Thiol-modified aptamers are immobilized on gold surfaces via gold-thiol interactions [49].
- Target Capture: Introduction of sample enables specific aptamer-analyte binding.
- Signal Transduction: Binding events transduced via electrochemical methods (EIS, DPV, CV) with nanomaterial-enhanced sensitivity [49].
Signaling Pathways and Experimental Workflows
The Scientist's Toolkit: Essential Research Reagents and Materials
Table 4: Essential Research Reagent Solutions for Nanomaterial-Enhanced Biosensing
| Category | Specific Examples | Function in Biosensing | Key Applications |
|---|---|---|---|
| Plasmonic Nanomaterials | Gold nanoparticles (AuNPs), silver nanoparticles [14] [49] | Enhanced optical signals, plasmonic enhancement | Colorimetric, SPR, SERS biosensors [14] |
| Carbon Nanomaterials | Carbon nanotubes (CNTs), graphene [47] [49] | High conductivity, large surface area, electron transfer | Electrochemical biosensors, electrode modifiers [49] |
| Metal Oxide Nanozymes | MnO₂ nanoflowers, ZnO nanostructures [48] [16] | Enzyme-like catalytic activity, signal amplification | Colorimetric sensors, catalytic amplification [48] |
| Framework Materials | Metal-organic frameworks (MOFs), covalent organic frameworks (COFs) [14] | High surface area, tunable porosity, loading capacity | Fluorescence, electrochemical sensors [14] |
| Signal Amplification Probes | DNAzymes, aptazymes, HCR templates [14] [48] | Biochemical signal amplification, catalytic nucleic acids | All detection modalities, especially colorimetric [48] |
| Immobilization Materials | Thiol-modified aptamers, silane layers, SAMs [16] [51] | Surface functionalization, bioreceptor attachment | All solid-phase biosensors [51] |
| Reference Control Probes | Isotype control antibodies, BSA, anti-FITC [50] | Nonspecific binding correction, signal normalization | Label-free biosensors in complex matrices [50] |
| Chromogenic Substrates | TMB (3,3',5,5'-tetramethylbenzidine) [48] | Visual signal generation, oxidase substrate | Colorimetric assays, nanozyme-based detection [48] |
The strategic integration of nanomaterials and signal amplification techniques has substantially narrowed the sensitivity gap between label-free and label-based biosensing platforms, while preserving the inherent advantages of label-free approaches. As evidenced by the experimental data and methodologies presented, label-free biosensors enhanced with nanozymes, plasmonic nanoparticles, and carbon nanomaterials now achieve detection limits comparable to—and in some cases surpassing—traditional label-based methods. The continued advancement of these technologies, particularly through innovative nanomaterial designs and sophisticated signal amplification strategies, promises to further expand the applications of label-free biosensing in clinical diagnostics, environmental monitoring, and drug development. For researchers and drug development professionals, selection between label-free and label-based approaches should be guided by specific application requirements including the need for real-time monitoring, sample complexity, multiplexing needs, and infrastructure constraints, with the understanding that label-free platforms now offer competitive sensitivity for an expanding range of analytes.
The evolution of biosensing technologies has increasingly focused on label-free detection methods that analyze biomolecules based on their intrinsic properties, eliminating the need for fluorescent or radioactive labels that can complicate assays and introduce artifacts [14]. Among the most promising advancements in this field are innovations in nanowell geometries and waveguide engineering, which significantly enhance biosensor performance through physical and optical optimization. These approaches improve sensitivity, specificity, and fabrication efficiency while maintaining the core advantages of label-free detection: real-time monitoring, simplified procedures, and minimal sample modification [14] [1]. This guide provides a comparative analysis of these cutting-edge fabrication strategies, offering researchers experimental data and methodologies for informed technology selection.
Nanowell Geometry Optimizations for Enhanced Biosensing
Nanowell-based biosensors utilize precisely engineered micro-scale containers on sensor surfaces to enhance detection capabilities. Recent research has demonstrated that geometry optimization dramatically influences performance by controlling surface area, confinement effects, and binding efficiency.
Comparative Performance of Nanowell Geometries
A 2024 systematic investigation compared four different nanowell geometries for detecting interleukin-6 (IL-6), a clinically significant cancer biomarker and inflammatory cytokine. The study fabricated sensors with identical circumferences but varying shapes to isolate the effect of geometry on performance [52].
Table 1: Performance Metrics of Different Nanowell Geometries for IL-6 Protein Detection
| Nanowell Geometry | Bottom Electrode Surface Area (μm²) | Effective Volume (μm³) | Perimeter-to-Area Ratio (μm⁻¹) | Impedance Change (%) |
|---|---|---|---|---|
| Tube | 250 | 46.25 | 0.94 | 9.55 |
| Spiral | 565 | 104.53 | 0.25 | 0.91 |
| Quatrefoil | 520 | 96.20 | 0.55 | 0.95 |
| Circle | 79 | 14.62 | 2.00 | 1.62 |
Data sourced from impedance measurements of IL-6 antibodies and antigens at 100 nM concentration using a lock-in amplifier [52].
The tube-shaped nanowell demonstrated superior sensitivity, with an impedance change nearly 6 times greater than traditional circular designs. This enhanced performance is attributed to its optimized perimeter-to-area ratio, which balances sufficient surface area for binding with efficient mass transport and confinement effects [52].
Experimental Protocol: Nanowell Fabrication and Testing
Methodology Overview: The fabrication process utilizes optical lithography and thin-film deposition techniques to create precisely defined nanowells on electrode surfaces [52].
Step-by-Step Fabrication:
- Substrate Preparation: Begin with a 500μm thick glass wafer (76.2mm diameter) as the foundation
- First Electrode Patterning: Apply AZ5214 photoresist via optical lithography (SUSS MicroTec ReMan GmbH)
- Metal Deposition: Deposit 5nm Cr adhesion layer followed by 100nm Au layer using E-beam evaporation with liquid N₂
- Lift-off Process: Remove unwanted metals with acetone, leaving only the patterned first electrode
- Insulation Layer: Deposit 40nm Al₂O₃ using atomic layer deposition
- Second Electrode Fabrication: Repeat steps 2-4 to create the second electrode with 45×45μm² overlapping area
- Second Insulation Layer: Apply another 40nm Al₂O₃ layer
- Well Patterning: Pattern wells within the electrode overlapping area using photolithography
- Etching: Use wet-etching with buffered oxide etch (BOE), Au, and Cr etchants to create nanowells
- Final Processing: Remove residual photoresist with acetone and bond PDMS channels using oxygen plasma cleaner
Impedance Measurement Protocol:
- Utilize a lock-in amplifier (Zurich Instruments HF2IS) for measurements
- Conduct measurements at 10-minute intervals
- Use 100nM concentrations of IL-6 antibodies and antigens in buffer solution
- Apply equivalent electrical circuit modeling to interpret electrode-electrolyte interface behavior
Figure 1: Nanowell biosensor fabrication workflow showing key steps from substrate preparation to functional device.
Waveguide Engineering for Advanced Optical Biosensing
Waveguide-based biosensors represent a sophisticated approach to optical detection, leveraging light confinement principles to achieve exceptional sensitivity. Recent innovations in inverse design methodologies have revolutionized this field by enabling computational optimization of waveguide structures for specific detection scenarios.
Inverse-Designed Waveguide Biosensors
Traditional waveguide biosensors face inherent limitations in balancing sensitivity, signal-to-noise ratio, and fabrication complexity. The emerging approach of inverse design applies computational optimization to create waveguide structures specifically engineered for enhanced biosensing performance [53].
Table 2: Comparison of Waveguide Biosensor Technologies
| Waveguide Type | Design Approach | Readout Mechanism | Key Performance Metrics | Implementation Complexity |
|---|---|---|---|---|
| Ring Resonator | Conventional | Resonance frequency shift | High Q-factor, vulnerable to noise | Moderate (requires tunable laser/broadband detector) |
| Interferometric | Conventional | Transmission intensity | Low sensitivity, simple readout | Low (single-frequency source) |
| Inverse-Designed | Computational optimization | Transmission intensity contrast | 20.06-fold transmission increase, noise-resistant | High (computational design), Moderate (fabrication) |
The inverse-designed waveguide biosensor demonstrates remarkable performance, showing 98.3% transmission for the positive state (target detected) and only 4.9% transmission for the negative state (no target) at 1550nm wavelength. This creates a dramatic 20.06-fold transmission increase upon target detection, far exceeding the less than 1% wavelength shift observed in conventional ring-resonator biosensors [53].
Integration with Biological Amplification Techniques
Advanced waveguide biosensors increasingly incorporate biological amplification methods such as the High-Contrast Cleavage Detection (HCCD) technique. This approach combines CRISPR-based specific target recognition with optical detection, using gold nanoparticles (25nm³) as high-contrast probes attached to the sensor surface via DNA or RNA tethers [53].
Experimental Workflow for HCCD-Enhanced Waveguide Biosensing:
- Surface Functionalization: Modify silicon waveguide surface with appropriate chemistry
- Probe Attachment: Attach gold nanoparticle probes via target-specific DNA/RNA tethers
- Sample Introduction: Introduce sample containing target molecules and CRISPR-cas complexes
- Cleavage Activation: Target-activated CRISPR complexes cleave specific DNA/RNA tethers
- Signal Detection: Measure transmission intensity changes at single wavelength (1550nm)
- Result Interpretation: Significant transmission increase indicates target presence
Figure 2: HCCD-enhanced waveguide biosensing workflow combining biological recognition with optical detection.
Comparative Analysis with Alternative Label-Free Platforms
When evaluating nanowell and waveguide technologies against established label-free platforms, distinct performance characteristics emerge across different measurement scenarios.
Table 3: Comprehensive Comparison of Label-Free Biosensing Platforms
| Biosensor Technology | Optimal Application Context | Detection Limit | Throughput Capacity | Key Advantages | Measurable Layer Thickness |
|---|---|---|---|---|---|
| Nanowell (Tube Geometry) | Protein biomarker detection | Not specified | Moderate | 9.55% impedance change, prevents nonspecific binding | N/A |
| Inverse-Designed Waveguide | DNA/RNA targets with HCCD | Single-molecule potential | High | 20.06-fold transmission contrast, single-wavelength operation | N/A |
| MP-SPR | Thick protein layers | Not specified | Moderate | Predictable binding signal for 300-400nm thick layers | 300-400nm |
| QCM | General biomolecular interactions | Not specified | Low | Mass-sensitive, established methodology | 108-144nm |
| BLI | Kinetic binding studies | Not specified | Moderate | Fiber-optic based, suitable for crude samples | 228-304nm |
| MSMA/FBAR | Thin protein layers | Not specified | High | Miniaturized, array capability | 72-96nm |
Data compiled from multiple studies comparing label-free biosensing platforms [52] [7] [53].
This comparative analysis reveals that each platform offers distinct advantages for specific application scenarios. MP-SPR outperforms other technologies for analyzing thick protein layers, while nanowell configurations excel at preventing nonspecific binding. Inverse-designed waveguides offer exceptional signal contrast for nucleic acid detection when combined with cleavage-based amplification methods [7] [53].
The Scientist's Toolkit: Essential Research Reagents and Materials
Successful implementation of optimized biosensor designs requires specific materials and reagents carefully selected for their functional properties.
Table 4: Essential Research Reagents for Biosensor Fabrication and Testing
| Category | Specific Materials | Function/Purpose | Example Applications |
|---|---|---|---|
| Substrate Materials | Glass wafers (500μm thick), PDMS (SYLGRAD 184) | Sensor foundation, microfluidic channels | Nanowell substrate [52] |
| Photolithography Materials | AZ5214 photoresist, AZ 917MIF developer | Pattern definition in fabrication | Electrode and well patterning [52] |
| Metallization Materials | Chromium (5nm), Gold (100nm) | Electrode formation, conductivity | Sensing electrodes [52] |
| Insulation Materials | Al₂O₃ (40nm via atomic layer deposition) | Electrical insulation between layers | Inter-electrode insulation [52] |
| Etching Reagents | Buffered oxide etch (BOE), Au etchant, Cr etchant | Selective material removal | Nanowell formation [52] |
| Biological Reagents | IL-6 antibodies/antigens (100nM), thrombin aptamers | Target analytes for detection | Performance validation [52] [21] |
| Nanoparticles | Gold nanoclusters (25nm³), europium complexes | Signal enhancement, labeling | Optical detection enhancement [54] [53] |
| Immobilization Chemistries | NH₂ with C6 spacer, biotin modifications | Surface attachment of probes | Aptamer immobilization [21] |
The strategic optimization of nanowell geometries and waveguide designs represents a sophisticated approach to enhancing biosensor performance through physical and optical engineering. Tube-shaped nanowells demonstrate clear advantages over traditional circular designs, with significantly enhanced sensitivity for protein detection. Similarly, inverse-designed waveguides overcome limitations of conventional optical biosensors through computational optimization, enabling dramatic signal contrast with simplified readout requirements. When selecting between these technologies, researchers must consider their specific application requirements, with nanowell configurations offering advantages for electrochemical protein detection and engineered waveguides providing superior performance for nucleic acid targets with appropriate biological amplification. As these technologies continue to evolve, their integration with emerging nanomaterials and amplification strategies will further expand the capabilities of label-free biosensing platforms.
Label-free biosensors have emerged as powerful tools in biomedical research and drug development, enabling the direct, real-time monitoring of biomolecular interactions without the need for fluorescent or radioactive tags. These platforms transduce biological binding events—such as antibody-antigen recognition, nucleic acid hybridization, or cellular secretion—into quantifiable physical signals based on inherent molecular properties like refractive index, impedance, or dielectric permittivity [14] [10]. This stands in contrast to label-based methods, which rely on engineered reporter molecules that can potentially alter binding kinetics or mask native conformational dynamics [10]. The fundamental advantage of label-free detection lies in its ability to preserve the intrinsic activity of biomolecules, thereby providing a more physiologically relevant readout of biological processes [14] [4].
However, the adoption of label-free technologies is accompanied by significant challenges. The intricate physical transduction mechanisms often generate multivariate data streams that require sophisticated interpretation, while the fabrication of highly sensitive, reproducible sensor interfaces demands precision engineering at the micro- and nanoscale [14] [55]. This guide provides a comparative analysis of how contemporary research is addressing these dual challenges of data interpretation and fabrication, offering scientists a framework for selecting and optimizing label-free platforms for specific applications in diagnostics and therapeutic development.
Comparative Performance: Quantitative Data Across Biosensor Platforms
The performance of label-free biosensors varies significantly across different transduction principles. The table below summarizes key performance metrics for several established and emerging platforms, based on recent experimental data.
Table 1: Comparative Performance of Label-Free Biosensor Platforms
| Biosensor Platform | Target Analyte | Limit of Detection (LOD) | Linear Range | Assay Time / Real-Time Monitoring | Key Challenges |
|---|---|---|---|---|---|
| Photonic Crystal (PC-TIR) Biosensor [56] | Monoclonal Antibodies (IgG) | Not specified | Standard curve R² > 0.99 | Real-time (monitors secretion rates) | Sensitive to environmental conditions; requires precise alignment |
| Microwave Biosensor [57] | E. coli bacteria | 100 CFU/mL | Sensitivity: 2.41° per order of CFU/mL | Not specified | Complex fabrication to achieve high sensitive-to-total area ratio |
| Wireless Impedance Sensor [58] | IL-6 cytokine | Demonstrated detection from 500 pM to 5 μM | R² = 0.986 (regression model) | ~10 min measurement (post-antibody immobilization) | Signal drift from evaporation; sensitive to coil misalignment |
| Electrochemical Impedance Spectroscopy (EIS) [55] | Pathogens (bacterial, viral) | Varies with pathogen and bioreceptor | Dependent on interface design | Rapid; suitable for real-time/POC | Low ΔRct/decade sensitivity; non-specific binding in complex matrices |
| Interference Scattering Microscopy (iSCAT) [10] | Single proteins (e.g., albumin) | Single-molecule sensitivity (tens of kilodalton range) | Mass-sensitive (optical mass spectrometry) | Real-time tracking of molecular transport | Rapid phase fluctuations limit detection to surface-bound molecules |
Experimental Protocols: Detailed Methodologies for Key Platforms
This protocol details the integration of a photonic crystal biosensor with a microtranswell system for quantifying antibody secretion from hybridoma cells.
- Sensor Fabrication: The biosensor utilizes a photonic crystal structure in a total-internal-reflection (PC-TIR) geometry. An open optical microcavity generates an enhanced evanescent field above the sensor surface. The microtranswell chip is a 3D-printed device comprising an upper layer with micro-wells, a middle porous PET membrane (3 μm pore diameter), and a lower layer with microchannels that align with the sensor.
- Biofunctionalization: The sensor surface is blocked with Bovine Serum Albumin (BSA) to minimize non-specific binding. The capture antibody (e.g., anti-IgG) is immobilized on the sensor surface within the microchannels.
- Cell Seeding and Measurement: Hybridoma cells (e.g., W6/32) are seeded into the upper microtranswell chamber. The entire assembly is placed in a cell culture incubator. Secreted monoclonal antibodies diffuse through the porous membrane and bind to the capture antibodies in the evanescent field of the biosensor.
- Data Acquisition and Analysis: A probe laser is directed at the sensor surface. The binding of antibodies alters the local refractive index, causing a measurable shift in the sensor's resonance condition. This shift is recorded in real-time, and the rate of change is directly correlated with the antibody secretion rate. Cell density and culture conditions (e.g., FBS concentration) can be manipulated to study their impact on productivity.
This protocol describes a novel approach for tracking inflammatory biomarkers like IL-6 in live animals using a wirelessly powered impedance sensor.
- Sensor Fabrication and Functionalization: A nanowell array electrode is fabricated using nanofabrication techniques to create a sensing region between two overlapping electrodes. The sensor is functionalized with anti-IL-6 antibodies. The receiver circuit, which includes the functionalized sensor, is integrated into a 3D-printed housing designed for application on wound sites.
- Wireless Power and Readout: The system operates via resonant inductive coupling. A transmitter coil powers the implanted sensor circuit wirelessly. The binding of IL-6 to the antibodies within the nanowells alters the impedance, which modulates the signal received by the transmitter coil. This signal is demodulated by a lock-in amplifier, eliminating the need for direct electrical connections.
- In Vivo Measurement: The 3D-printed housing containing the sensor is placed on a wound site on a live animal (e.g., a mouse model). The transmitter coil is aligned externally. Impedance changes are monitored in real-time as IL-6 in the wound fluid binds to the sensor.
- Validation: Wound fluid is collected and analyzed using a standard ELISA to validate the sensor's measurements, with studies showing a strong correlation (R² > 0.9) between the two methods.
This protocol outlines the use of Giant Magnetoresistive (GMR) biosensors for the highly sensitive and specific detection of DNA oligonucleotides, highlighting probe design challenges.
- Sensor Preparation: A GMR biosensor chip is washed and prepared. Amine-modified oligonucleotide probes are diluted in 2X SSC buffer and contact-printed onto the sensor surface for immobilization.
- Hybridization and Signal Generation: The target oligonucleotide, biotinylated at one end, is introduced and hybridizes with the surface-tethered probes. After washing, streptavidin-coated magnetic nanoparticles (MNPs) are added, which bind to the biotin on the captured targets.
- Detection: The GMR sensor detects the stray magnetic fields from the bound MNPs. The signal is proportional to the number of hybridized targets.
- Probe Design and Specificity: A critical step is the design of oligonucleotide probes to minimize cross-hybridization with off-target sequences. Guidelines include calculating solution-phase Gibbs free energy (≥ -7.5 kcal mol⁻¹) and melting temperature (≤10 °C below the hybridization temperature) to ensure high sensitivity and specificity, acknowledging the thermodynamic penalties of solid-phase hybridization.
Signaling Pathways and Workflows: A Visual Guide
The following diagrams illustrate the core operating principles and experimental workflows of the label-free biosensors discussed.
PC-TIR Biosensor Working Principle
This diagram shows how a probe laser undergoes total internal reflection within a photonic crystal, generating an evanescent field. Biomolecules binding in this field alter the resonance condition, producing a measurable optical signal.
Wireless Impedance Sensing Workflow
This diagram illustrates the wireless power transfer via resonant inductive coupling and how biomarker binding at the nanoelectrode surface causes an impedance change, which modulates the signal read remotely without direct electrical connections.
The Scientist's Toolkit: Key Research Reagent Solutions
Successful implementation of label-free biosensors relies on a suite of specialized materials and reagents. The following table details essential components and their functions in typical experimental setups.
Table 2: Essential Research Reagents and Materials for Label-Free Biosensing
| Item Name | Function / Role in Experiment | Example Application |
|---|---|---|
| Biorecognition Elements (Antibodies, Aptamers, DNA probes) [56] [55] [59] | Provides high specificity by binding to the target analyte. Immobilized on the sensor surface. | Anti-IL-6 antibodies for cytokine detection; specific oligonucleotide probes for DNA sensing. |
| Streptavidin-Coated Magnetic Nanoparticles (MNPs) [59] | Used as labels in some "label-free" sensors for signal amplification. Generate a detectable magnetic field. | Detecting biotinylated DNA targets in GMR biosensors. |
| Bovine Serum Albumin (BSA) [56] [59] | Used as a blocking agent to passivate the sensor surface and reduce non-specific binding of non-target molecules. | Coating a PC-TIR sensor surface after probe immobilization. |
| Saline-Sodium Citrate (SSC) Buffer [59] | A standard hybridization buffer that maintains optimal salt concentration and pH for biomolecular interactions, particularly nucleic acid hybridization. | Diluting oligonucleotide probes and targets in GMR biosensor experiments. |
| Self-Assembled Monolayer (SAM) Chemicals [4] | Used to create a well-defined, functionalized surface on electrodes (e.g., gold) for controlled immobilization of biorecognition elements. | Attaching DNA or antibodies to the surface of a FET or EIS biosensor. |
| Nanowell/Nanoarray Substrates [58] [60] | Nanofabricated structures that confine the sensing volume, enhancing sensitivity by reducing mass transfer limitations and increasing the surface-to-volume ratio. | The core sensing element in the wireless impedance sensor for IL-6 detection. |
| Photonic Crystal Substrates [56] | Engineered dielectric materials that manipulate light to create a strong evanescent field, highly sensitive to changes in the local refractive index. | The transducer in the PC-TIR biosensor for monitoring antibody secretion. |
Rigorous Validation and Data-Driven Comparative Analysis
The Critical Need for Extrinsic Label Validation of Label-Free Methods
Label-free biosensing and imaging technologies have established themselves as powerful tools in biological research and drug discovery, enabling the direct observation of biomolecules and cellular processes in their native state [10]. These methods exploit intrinsic molecular properties—such as refractive index, mass, and autofluorescence—to generate contrast without the need for artificial tags [61] [10]. Despite their significant advantages, including minimal perturbation of biological systems and the ability to monitor dynamics in real-time, the interpretation of data from label-free methods requires rigorous validation [61] [62]. This guide examines the critical role of extrinsic labels in validating label-free techniques, providing a comparative analysis of their performance and detailed experimental protocols for researchers seeking to implement these approaches in their work.
The fundamental challenge lies in the complex nature of intrinsic signals. For instance, autofluorescence from metabolic co-factors like NAD(P)H provides valuable information about cellular metabolism but cannot distinguish between NADH and NADPH, which have different metabolic roles [61]. Similarly, techniques like interference scattering microscopy (iSCAT) can detect single proteins but require confirmation that the observed signals genuinely represent the biomolecules or processes of interest [10]. Extrinsic labels, including genetically encoded fluorescent proteins and synthetic probes, serve as essential references for establishing this biological "ground truth" [61].
Comparative Analysis of Label-Free and Label-Based Biosensing Technologies
Fundamental Principles and Contrast Mechanisms
Label-free technologies detect biomolecules based on their inherent physical and chemical properties. Key methods include:
- Autofluorescence imaging: Leverages intrinsic fluorescence from metabolic co-factors (NAD(P)H, FAD), aromatic amino acids, and structural proteins (elastin) to study metabolism and tissue architecture [61].
- Interference-based microscopy (e.g., iSCAT, COBRI): Detects molecules via interference between scattered light and a reference wave, enabling single-protein detection and mass quantification [10].
- Non-linear optical techniques: Including Second Harmonic Generation (SHG) for collagen imaging and Third Harmonic Generation (THG) for lipid visualization [61].
- Plasmonic sensors: Track binding events through refractive index changes near metal surfaces or nanoparticles [10] [63].
- Vibrational spectroscopies: Such as Raman and infrared spectroscopy, which probe molecular vibrational fingerprints [61].
Label-based approaches instead rely on engineered reporter molecules:
- Fluorescent proteins (e.g., GFP): Enable genetic encoding of fluorescence for tracking protein localization and expression [61].
- Small-molecule dyes: Organic fluorophores that can be conjugated to antibodies, drugs, or other biomolecules.
- Biosensors: Designed to report specific biochemical activities, such as the SoNar sensor for NADH/NAD+ ratios [61].
Performance Comparison of Detection Modalities
Table 1: Technical comparison of major biosensing and imaging modalities
| Technology | Detection Principle | Sensitivity | Temporal Resolution | Key Applications | Limitations |
|---|---|---|---|---|---|
| NAD(P)H Autofluorescence | Metabolic co-factor fluorescence | High (single cell) | Seconds to minutes | Metabolic imaging, cancer biology, stem cell differentiation | Cannot distinguish NADH from NADPH; complex signal interpretation [61] |
| iSCAT | Interference scattering | Single protein (~50 kDa) [10] | Milliseconds | Single-molecule tracking, mass photometry | Restricted to surface-bound molecules; phase sensitivity [10] |
| Surface Plasmon Resonance (SPR) | Refractive index change | ~5 pg/mm² [63] | Seconds | Biomolecular interaction analysis, kinetics | Low throughput in conventional formats; difficult single-molecule resolution [10] [63] |
| Electrochemical Biosensors | Redox activity/charge transfer | pM-nM range [64] | Seconds | Point-of-care diagnostics, biomarker detection | Requires electrode functionalization; potential interference in complex samples [65] [64] |
| Fluorescent Biosensors | Specific binding/activity reporting | Varies (nM-pM) | Milliseconds to seconds | Live-cell imaging, metabolic monitoring | Potential perturbation of native systems; photobleaching [61] [10] |
Quantitative Performance Metrics in Validation Studies
Table 2: Experimental validation data for label-free biosensors
| Label-Free Method | Validation Approach | Key Performance Metrics | Experimental System | Reference |
|---|---|---|---|---|
| Electrochemical HbA1c/Insulin Sensor | Antibody-based capture (anti-HbA1c, anti-insulin) | Sensitivity (R² > 0.96), Selectivity (>95%), Stability (>95% over 120 days) [64] | Pretreated whole blood samples | [64] |
| NAD(P)H Autofluorescence | SoNar biosensor (NADH/NAD+), Apollo-NADP+ sensor | Correlation of optical redox ratio with biochemical assays | Breast cancer models, microglia studies | [61] |
| iSCAT | Fluorescence correlation | Mass measurement accuracy, single-molecule tracking | Surface-immobilized proteins, viral particles | [10] |
| Plasmonic Nanoparticles | Surface immobilization chemistry | Real-time binding monitoring, single-particle sensitivity | Protein-binding studies, alkanethiol detection | [10] |
Experimental Protocols for Validation Studies
Protocol 1: Validating Metabolic Autofluorescence with Genetically Encoded Biosensors
Purpose: To confirm that NAD(P)H autofluorescence signals accurately report cellular metabolic states.
Materials:
- Cell culture system (e.g., cancer cells, primary macrophages)
- Two-photon or multiphoton fluorescence microscope
- Genetically encoded biosensors (e.g., SoNar for NADH/NAD+, Apollo-NADP+)
- Appropriate culture media and metabolic modulators
Procedure:
- Cell Preparation: Culture cells in appropriate conditions. For metabolic studies, maintain consistent nutrient availability and cell density.
- Sensor Expression: Introduce biosensor constructs via transfection or viral transduction. Include untransfected controls for autofluorescence measurements.
- Dual-Modality Imaging:
- Acquire NAD(P)H autofluorescence signals using two-photon excitation at ~740 nm and detection at 450-470 nm [61].
- Simultaneously image biosensor signals using appropriate excitation/emission settings.
- Apply metabolic perturbations (e.g., glucose addition, mitochondrial inhibitors) during time-lapse imaging.
- Data Analysis:
Troubleshooting: Account for potential spectral overlap between biosensors and autofluorescence using spectral unmixing or lifetime separation techniques [61].
Protocol 2: Single-Molecule Validation Using Interference Microscopy with Fluorescence Correlation
Purpose: To verify that single-molecule detection via iSCAT corresponds to specific target biomolecules.
Materials:
- Purified target protein (50 kDa - 1 MDa)
- Functionalized glass coverslips
- iSCAT microscope system
- Fluorescent labels compatible with target (e.g., ATTO dyes)
- Microfluidic chamber for sample delivery
Procedure:
- Sample Preparation:
- Label a portion of target proteins with fluorescent dyes at appropriate stoichiometry.
- Functionalize coverslips with suitable capture chemistry (e.g., NHS-ester for amines, Ni-NTA for His-tagged proteins).
- Dual-Modality Imaging:
- Introduce diluted protein solution into microfluidic chamber.
- Acquire iSCAT videos at high frame rate (500-1000 fps) to detect binding events [10].
- Simultaneously image fluorescence using TIRF illumination.
- Correlate iSCAT landing events with fluorescence signals.
- Data Analysis:
- Extract mass information from iSCAT contrast using calibration standards [10].
- Calculate binding kinetics from arrival and departure times.
- Verify specificity by comparing fluorescence-positive and fluorescence-negative landing events.
Troubleshooting: For freely diffusing molecules, consider Nanofluidic Scattering Microscopy (NSM) to minimize axial displacement and stabilize signals [10].
Visualizing Validation Workflows and Technology Relationships
Workflow for Validating Label-Free Imaging Methods
Technology Comparison and Application Space
Essential Research Reagent Solutions for Validation Experiments
Table 3: Key reagents and materials for label-free method validation
| Reagent/Material | Function in Validation | Example Applications | Key Considerations |
|---|---|---|---|
| SoNar Biosensor | Reports NADH/NAD+ ratios | Validating NAD(P)H autofluorescence measurements in metabolism studies [61] | Sensitive to pH and temperature; spectral overlap with NAD(P)H [61] |
| Apollo-NADP+ Sensor | Detects NADP+ levels via anisotropy | Differentiating NADPH contribution to autofluorescence signals [61] | Requires polarization measurements; specific to NADP+ [61] |
| Palladium Nanostructures | Electrode functionalization | Creating label-free electrochemical sensors for HbA1c and insulin [64] | High stability (>120 days); enables covalent antibody immobilization [64] |
| SRU BIND Biosensor Plates | Guided mode resonance detection | High-throughput label-free binding assays in microplate format [63] | 384-well format; compatible with automation; <$100 per plate [63] |
| Functionalized Nanochannels | Confinement for free diffusion studies | Enabling stable signal detection in Nanofluidic Scattering Microscopy [10] | Minimizes axial displacement; prevents full-phase oscillations [10] |
The validation of label-free biosensing and imaging methods with extrinsic labels represents a critical step in realizing their full potential for biological discovery and diagnostic applications [61] [62]. As demonstrated through the comparative data and experimental protocols presented here, each validation approach offers specific strengths for confirming the biological relevance of intrinsic signals. The expanding toolkit of genetic biosensors, advanced nanomaterials, and innovative optical techniques continues to enhance our ability to establish reliable ground truth measurements.
Future directions in this field point toward increased integration of artificial intelligence for signal interpretation [41], the development of multifunctional sensors that provide complementary information, and the creation of standardized validation frameworks that can be applied across laboratory settings. For researchers implementing these techniques, the systematic validation approach outlined in this guide provides a pathway to generating more reproducible, interpretable, and biologically meaningful data from label-free methods. Through continued refinement of these validation paradigms, label-free technologies are poised to expand their impact across basic research, drug discovery, and clinical diagnostics.
The accurate detection of protein biomarkers is fundamental to disease diagnosis, drug development, and biomedical research. Within the broader context of biosensor technology, which encompasses both label-based and label-free detection schemes, two primary platforms have emerged as leaders in protein detection: immunosensors, which employ antibodies as biorecognition elements, and aptasensors, which utilize engineered nucleic acid aptamers [66] [67]. For decades, immunosensors have been the established "gold standard," prized for their high specificity and affinity stemming from natural biological evolution [66]. However, the advent of aptamers, selected in vitro through the Systematic Evolution of Ligands by Exponential Enrichment (SELEX) process, has presented a powerful alternative with a distinct set of advantages and limitations [66] [68] [67].
This guide provides an objective, data-driven comparison of these two platforms, focusing on their operational principles, analytical performance, and practical applicability. We synthesize theoretical frameworks with direct experimental evidence to assist researchers, scientists, and drug development professionals in selecting the optimal technology for their specific protein detection needs.
Fundamental Comparison of Biorecognition Elements
The core of any biosensor is its biorecognition element. The inherent properties of antibodies and aptamers fundamentally influence sensor design, performance, and application.
Antibodies are large (~150 kDa for IgG) Y-shaped proteins produced by the immune system. Their binding sites, located at the variable regions of heavy and light chains, recognize specific epitopes on antigens with high affinity [66] [69]. Immunosensor performance is heavily influenced by the choice of antibody format. Whole monoclonal antibodies (mAbs) are commonly used, but smaller fragments like Fab' (antigen-binding fragment), scFv (single-chain variable fragment), and scAb (single-chain antibody) offer advantages for biosensing. These fragments, typically ranging from ~30 to 50 kDa, allow for higher density immobilization on sensor surfaces and can be engineered for oriented coupling, which often leads to improved sensitivity and lower limits of detection (LOD) [66].
Aptamers are short (15-100 nucleotides), single-stranded DNA or RNA oligonucleotides that fold into specific three-dimensional structures, enabling them to bind targets such as proteins, small molecules, and cells with affinity and specificity comparable to antibodies [66] [68] [67]. Their smaller size, synthetic production, and ease of chemical modification make them highly versatile biorecognition elements.
Table 1: Fundamental Properties of Antibodies and Aptamers
| Property | Antibodies (for Immunosensors) | Aptamers (for Aptasensors) |
|---|---|---|
| Biochemical Nature | Proteins (IgG, ~150 kDa) | Single-stranded DNA or RNA (~8-25 kDa) |
| Production Method | In vivo (animal hosts) or recombinant | In vitro (SELEX) chemical synthesis |
| Development Time | Months | Weeks |
| Production Cost | High (cell culture, purification) | Low (chemical synthesis) |
| Stability | Moderate (sensitive to temperature, pH) | High (DNA aptamers are thermally stable and renumerable) |
| Modification | Complex (genetic engineering for fragments) | Simple (terminal functional groups e.g., thiol, amino, biotin) |
| Target Range | Primarily immunogenic molecules | Virtually any target (including toxins, non-immunogenic targets) |
| Binding Affinity (K_D) | Very high (pM-nM range) [69] | High (nM-pM range) [67] |
A critical advantage of aptamers is their programmability. The SELEX process can be conducted under non-physiological conditions (e.g., specific pH, temperature, or buffer composition), ensuring the selected aptamer functions optimally in the intended application environment [67]. Furthermore, aptamers often undergo significant and reversible conformational changes upon target binding, a property that can be harnessed in label-free sensing designs [67].
Analytical Performance and Experimental Data
Theoretical advantages must be validated through experimental performance. A direct head-to-head comparison study provides the most insightful data.
Case Study: Direct Comparative Experiment for PSA Detection
A seminal study directly compared a PSA (Prostate-Specific Antigen) aptasensor and immunosensor on an identical sensor platform—graphene quantum dots-gold nanorods (GQDs-AuNRs) modified screen-printed electrodes [68]. The experimental protocols and results are summarized below.
Experimental Protocol:
- Sensor Fabrication: Screen-printed electrodes were modified with a nanocomposite of GQDs-AuNRs and chitosan to enhance electron transfer and provide a robust immobilization matrix.
- Bioreceptor Immobilization:
- For the Immunosensor: Monoclonal anti-PSA antibodies were immobilized onto the modified electrode surface.
- For the Aptasensor: DNA aptamers specific to PSA were immobilized on the identical platform.
- Detection and Measurement: The analytical performance of both sensors was evaluated using three simultaneous electrochemical techniques:
- Cyclic Voltammetry (CV)
- Differential Pulse Voltammetry (DPV)
- Electrochemical Impedance Spectroscopy (EIS) Measurements were taken upon introduction of PSA antigen, relying on the label-free detection of binding-induced changes in electrochemical signals.
Table 2: Performance Comparison of PSA Aptasensor vs. Immunosensor [68]
| Parameter | PSA Immunosensor | PSA Aptasensor |
|---|---|---|
| Limit of Detection (LOD) | 0.14 ng mL⁻¹ | 0.14 ng mL⁻¹ |
| Linear Range | Not specified in detail, but covered clinically relevant PSA concentrations. | Not specified in detail, but covered clinically relevant PSA concentrations. |
| Analytical Techniques | CV, DPV, EIS | CV, DPV, EIS |
| Stability | Good | Better (due to DNA's higher chemical stability) |
| Regeneration | Limited (antibodies can denature) | Excellent (DNA can be denatured and renatured multiple times) |
| Cost | Higher (antibody production) | Lower (aptamer synthesis) |
| Remarks | Performance comparable to the aptasensor in this specific setup. | Demonstrated comparable sensitivity with advantages in operational stability and cost. |
This direct comparison reveals that both sensors can achieve comparable sensitivity (identical LOD) for detecting PSA when optimized on the same nanomaterial-enhanced platform [68]. The study concluded that the aptasensor offered distinct practical benefits, including superior stability, simpler preparation, and lower cost.
Broader Performance Trends
Beyond a single case study, a review of electrochemical biosensors for small molecules highlights a general performance trend: immunosensors often achieve limits of detection that are two to three orders of magnitude lower than those of aptasensors for the same target, primarily attributable to the exceptionally high affinities of antibodies [69]. However, the same review notes that significant progress in improving aptamer affinities has been limited, with the most substantial gains in aptasensor sensitivity coming from advances in transduction schemes and signal amplification strategies rather than from the aptamers themselves [69].
Detection Mechanisms and Experimental Workflows
Both immunosensors and aptasensors can be deployed in various assay formats, primarily categorized as label-free or label-based. The choice of format and bioreceptor immobilization strategy is crucial for sensor performance.
Immobilization and Surface Chemistry
- Immunosensors: Antibody orientation on the sensor surface is critical. Random immobilization (e.g., via adsorption or amine-coupling) can block antigen-binding sites. Oriented immobilization is preferred and can be achieved using Protein A/G (which binds the Fc region of antibodies), coupling via oxidized glycan moieties in the Fc region, or by using engineered fragments like Fab' with exposed thiol groups for specific coupling to gold or maleimide surfaces [66].
- Aptasensors: Immobilization is typically more straightforward. Aptamers can be synthesized with terminal functional groups (e.g., thiol, amino, or biotin) for controlled, oriented attachment to corresponding surfaces (gold, carboxylated, or streptavidin-coated surfaces) [66] [67]. This often results in highly ordered and reproducible receptor layers.
Common Transduction Mechanisms
The biological binding event is converted into a measurable signal via a transducer. Electrochemical methods are widely used due to their sensitivity, cost-effectiveness, and portability [1] [70].
- Label-Free Electrochemical Detection: This method directly monitors changes in electrical properties upon target binding.
- Electrochemical Impedance Spectroscopy (EIS): Binding of the target protein (e.g., PSA, thrombin) hinders electron transfer to a redox probe (e.g., ferro/ferricyanide) in solution, leading to an increase in electron transfer resistance (Rct), which is measured [68] [67].
- Other Voltammetric Techniques: Binding can cause a measurable decrease in current in techniques like Differential Pulse Voltammetry (DPV), as seen in a sensor for the Monkeypox A29 protein [71].
- Label-Based Electrochemical Detection: These assays use a labeled molecule to generate or amplify the signal.
- Sandwich Assay: A capture antibody/aptamer is immobilized. The target protein is bound, and then a second, labeled detection antibody/aptamer is introduced. The label (e.g., enzyme like Horseradish Peroxidase (HRP) or a nanoparticle) catalyzes a reaction, producing an electrochemical signal [70] [69].
- Competitive Assay: Used for small molecules with limited epitopes. Labeled and unlabeled antigens compete for a limited number of binding sites. The signal is inversely proportional to the target concentration [70] [69].
The Scientist's Toolkit: Essential Research Reagents and Materials
Successful development of either platform requires a suite of specialized reagents and materials. The table below details key components for constructing electrochemical biosensors, as featured in the cited research.
Table 3: Key Research Reagent Solutions for Biosensor Development
| Reagent/Material | Function | Example Use Case |
|---|---|---|
| Screen-Printed Electrodes (SPEs) | Disposable, miniaturized electrochemical cells for portable, low-cost sensing. | Platform for PSA aptasensor/immunosensor comparison [68]. |
| Gold Electrodes / Nanoparticles | Excellent conductors; gold surfaces enable easy functionalization via thiol-gold chemistry. | Working electrode for MPXV A29 protein immunosensor [71]; nanoparticles for signal amplification [70]. |
| Graphene Quantum Dots (GQDs) | Carbon nanomaterial with high surface area and excellent electrocatalytic properties, enhancing electron transfer. | Used in nanocomposite with AuNRs for PSA sensor [68]. |
| Chitosan (CH) | A biopolymer used as a compatibilizing matrix; provides strong film-forming ability and prevents nanomaterial restacking. | Component of the film for immobilizing GQDs-AuNRs composite [68]. |
| 11-Mercaptoundecanoic acid (MUA) | A thiolated molecule that forms a self-assembled monolayer (SAM) on gold, presenting carboxyl groups for further covalent coupling. | Used for oriented antibody immobilization on gold electrodes via EDC/NHS chemistry [71]. |
| EDC / NHS Crosslinkers | (1-Ethyl-3-(3-dimethylaminopropyl)carbodiimide / N-Hydroxysuccinimide) Activate carboxyl groups for covalent coupling to primary amines on antibodies or aptamers. | Standard chemistry for covalent immobilization of bioreceptors on carboxylated surfaces [71]. |
| Ferri/Ferrocyanide Redox Probe | A common electrochemical mediator; its redox reaction is sensitive to surface modifications, making it ideal for label-free EIS and DPV detection. | Used to monitor antigen-antibody binding in the MPXV A29 protein sensor [71] and PSA sensors [68]. |
The choice between aptasensors and immunosensors is not a matter of declaring one universally superior, but rather of selecting the right tool for the specific application.
- Choose an Immunosensor when: Your priority is the highest possible sensitivity and lowest LOD, particularly for established clinical biomarkers like cardiac troponins or viral antigens. This is the preferred platform when the target is immunogenic and well-characterized, and when operational constraints like cost and stability are secondary to ultimate performance. Their long history of use and validation in clinical settings also provides a level of trust and familiarity [66] [69].
- Choose an Aptasensor when: The application demands enhanced stability, lower cost, and greater operational flexibility. Aptasensors are ideal for detecting non-immunogenic targets, toxins, or small molecules [67]. They are perfectly suited for development in resource-limited settings, for applications requiring sensor regeneration and multiple uses, or when the assay conditions deviate from standard physiological buffers [68] [67]. Their synthetic nature ensures high batch-to-batch reproducibility.
The future of protein biosensing lies not only in the continued refinement of each platform but also in their integration. Hybrid biosensing schemes that combine the strengths of both antibodies and aptamers are emerging as a powerful approach, potentially offering superior performance and versatility than either could achieve alone [66]. As nanomaterials and transduction methods continue to advance, the performance gap between these two platforms will likely narrow, further solidifying their joint role as indispensable tools in modern bioanalysis and precision medicine.
In the study of cellular metabolism, the dynamics of nicotinamide adenine dinucleotide (NAD(H)) and its phosphorylated counterpart (NADP(H)) are of central importance. These coenzymes are essential indicators of cellular redox state, energy metabolism, and biosynthetic capacity [72]. For decades, researchers relied on the inherent autofluorescence of reduced NADH and NADPH, a label-free method, to gain insights into metabolic states. The advent of genetically encoded biosensors, a form of label-based detection, has revolutionized this field by offering unprecedented specificity and subcellular resolution [72] [73]. This case study provides a comparative analysis of these two fundamental approaches, evaluating their performance in validating NAD(P)H dynamics across various biological models. We focus on experimental data and methodologies to illustrate how these tools are applied and how they complement each other in modern metabolic research.
Fundamental Principles and Technical Comparison
NAD(P)H Autofluorescence: A Label-Free Method
The reduced forms of the coenzymes, NADH and NADPH, exhibit innate blue-green fluorescence when excited with ultraviolet light (excitation ~340 nm, emission ~460 nm). This autofluorescence allows for non-invasive monitoring without the need for exogenous labels, making it a classic label-free biosensing strategy [72] [74]. Its primary advantage is the minimal perturbation to the native cellular environment. However, this method has significant limitations:
- Inability to Distinguish NADH from NADPH: The fluorescence spectra of NADH and NADPH are nearly identical, making it impossible to differentiate between these two distinct metabolic pools [72].
- Low Specificity and Sensitivity: The signal is weak and represents the total pool of reduced pyridine nucleotides, including molecules bound to proteins, which can alter their fluorescent properties [74].
- Potential for Cell Damage: The required UV excitation light can be phototoxic to living cells over extended imaging periods [72].
Genetically Encoded Biosensors: A Label-Based Approach
Genetically encoded biosensors are engineered proteins that consist of a sensing domain and a fluorescent reporter domain. The sensing domain, often derived from bacterial transcription factors like Rex, binds specifically to the target metabolite (e.g., NADH or NADPH). This binding induces a conformational change that alters the fluorescence of the reporter protein, enabling quantitative tracking of the metabolite in real-time [75] [73]. These sensors represent a label-based strategy because a genetic construct is introduced to produce the reporter protein in situ.
Key advantages include:
- High Specificity: Sensors can be engineered to discriminate between NADH and NADPH, and even between reduced and oxidized forms [75].
- Subcellular Targeting: They can be directed to specific organelles (e.g., cytosol, mitochondria) to probe compartmentalized metabolic events [73].
- Ratiometric Quantification: Many sensors, like the Peredox and NAPstar families, incorporate a reference fluorescent protein (e.g., mCherry) that allows for ratio-metric measurement, minimizing artifacts from variations in sensor concentration or excitation light [75].
Table 1: Core Characteristics of NAD(P)H Monitoring Techniques
| Feature | NAD(P)H Autofluorescence | Genetically Encoded Biosensors |
|---|---|---|
| Detection Principle | Label-free; intrinsic fluorescence | Label-based; engineered fluorescent protein |
| Specificity | Low; cannot distinguish NADH from NADPH | High; can be specific for NADH, NADH/NAD+ ratio, NADPH, or NADPH/NADP+ ratio |
| Spatial Resolution | Cellular; limited subcellular specificity | Excellent; can be targeted to specific organelles |
| Quantification | Semi-quantitative; influenced by protein binding | Quantitative; often ratiometric for precise measurement |
| Cellular Perturbation | Minimal | Requires genetic manipulation |
| Key Limitation | Low signal-to-noise, phototoxicity | Potential for buffering metabolite pools |
Experimental Validation: Direct Comparative Data
Quantitative Performance and Sensitivity
The development and validation of new biosensors involve direct comparison with autofluorescence measurements. The NAPstar family of biosensors, recently introduced for monitoring the NADPH/NADP+ redox state, demonstrates the advanced capabilities of the label-based approach. In vitro characterization shows these sensors have a broad dynamic range, covering NADPH/NADP+ ratios from 0.001 to 5, with high specificity for NADP over NAD [75]. This specificity is a key advantage over autofluorescence.
Experimental data from live cells reveals stark differences in sensitivity. For instance, in mammalian cells, the inherent autofluorescence of NADPH is very weak. In contrast, using a metagenome-derived blue fluorescent protein (mBFP) that binds to NADPH, researchers observed an approximately 10-fold enhancement of the NADPH-specific fluorescence signal compared to background autofluorescence. This dramatic increase in signal-to-noise ratio enables real-time tracking of NADPH flux at the single-cell level with high temporal resolution [74].
Table 2: Experimental Performance Metrics from Key Studies
| Method / Sensor | Target | Dynamic Range / Sensitivity | Key Experimental Finding |
|---|---|---|---|
| NAD(P)H Autofluorescence | Combined NADH & NADPH | Low sensitivity; semi-quantitative | Reveals general metabolic shifts; used to identify "Warburg effect" in cancer cells [72] |
| mBFP-NADPH Complex | NADPH | ~10x fluorescence enhancement over autofluorescence [74] | Real-time monitoring of NADPH depletion upon diamide treatment in HeLa cells [74] |
| NAPstar Biosensors | NADPH/NADP+ Ratio | Kratio(NADPH/NADP+) from ~0.9 to 11.6 μM [75] | Revealed conserved robustness of cytosolic NADP redox homeostasis across yeast, plants, and mammals [75] |
| Peredox | NADH/NAD+ Ratio | --- | Used to image cytosolic NADH/NAD+ redox state in single cells [73] |
Methodologies for Key Experiments
The following protocols exemplify the experimental workflows used to generate comparative data.
Protocol 1: Validating Biosensor Specificity Against Autofluorescence This experiment aims to confirm that a biosensor's signal is specific to its intended target (e.g., NADPH) and not merely reporting changes in general autofluorescence.
- Cell Preparation & Transfection: Culture mammalian cells (e.g., HeLa cells) and transfect one group with the plasmid encoding the NADPH biosensor (e.g., mBFP or NAPstar). Maintain a separate group of untransfected cells as a control.
- Metabolic Perturbation: Treat both groups with a metabolic modulator. For NADPH, this could be:
- Dual-Channel Imaging: Image cells over time using a fluorescence microscope or two-photon microscopy (to reduce photodamage).
- Channel 1 (Autofluorescence): Use UV excitation (~340-360 nm) and collect emission at ~450-460 nm. This channel captures the total NAD(P)H autofluorescence in both transfected and untransfected cells.
- Channel 2 (Biosensor): Use the appropriate excitation/emission for the biosensor (e.g., ~400 nm ex / ~515 nm em for NAPstar's T-Sapphire).
- Data Analysis: In untransfected cells, the autofluorescence channel will show a slow, minor decrease upon treatment. In biosensor-expressing cells, the biosensor channel should show a rapid and significant decrease in signal (e.g., ratio change for NAPstar) that is decoupled from the minor autofluorescence change, confirming target-specific reporting [74].
Protocol 2: Mapping Subcellular Compartment-Specific Redox States This protocol leverages the targetability of biosensors to uncover metabolic heterogeneity within a cell.
- Sensor Targeting: Express biosensors (e.g., NAPstars) fused with localization sequences to target them to specific compartments, such as the cytosol or mitochondria.
- Live-Cell Imaging: Use time-lapse fluorescence microscopy (or FLIM for compatible sensors) to image the biosensor signal in the different compartments simultaneously.
- Stimulus Application: Apply a physiological stimulus relevant to the model system. For example:
- In plant leaves: Change the illumination conditions (light-dark transitions) [75].
- In yeast or mammalian cells: Induce an oxidative challenge (e.g., with H2O2) or alter nutrient availability.
- Ratiometric Analysis: Calculate the ratiometric signal (e.g., T-Sapphire/mCherry for NAPstars) for each compartment over time. This reveals how the NADPH redox state changes independently in different parts of the cell, a feat impossible with bulk autofluorescence [75].
The Scientist's Toolkit: Essential Research Reagents
Table 3: Key Reagent Solutions for NAD(P)H Biosensing Research
| Reagent / Tool | Function in Research | Example Use Case |
|---|---|---|
| NAPstar Biosensors | Genetically encoded sensors for monitoring NADPH/NADP+ redox state with subcellular resolution. | Revealing cell cycle-linked NADP redox oscillations in yeast [75]. |
| Peredox & SoNar | Genetically encoded sensors for monitoring NADH/NAD+ redox state. | Imaging cytosolic NADH/NAD+ ratio in single cells to study metabolic state [72] [73]. |
| mBFP (metagenomic Blue Fluorescent Protein) | A bacterial protein that binds NADPH and enhances its intrinsic fluorescence. | Real-time, single-cell monitoring of NADPH flux in mammalian cells without complex engineering [74]. |
| Diamide | A thiol-oxidizing agent that depletes glutathione and consequently consumes NADPH. | Experimentally inducing oxidative stress to challenge the NADPH pool and test sensor responsiveness [74]. |
| Dehydroepiandrosterone (DHEA) | A specific inhibitor of Glucose-6-Phosphate Dehydrogenase (G6PD). | Inhibiting the pentose phosphate pathway to study its contribution to NADPH generation [74]. |
Signaling Pathways and Experimental Workflows
The diagram below illustrates the core signaling pathways involving NAD(P)H and the conceptual difference between autofluorescence and biosensor-based detection.
The comparative data clearly establishes that genetically encoded biosensors and NAD(P)H autofluorescence are not mutually exclusive tools but exist on a continuum of technological sophistication. Autofluorescence remains a valuable, label-free method for detecting gross metabolic shifts, particularly in systems where genetic manipulation is difficult. However, its lack of specificity is a major constraint [72] [74].
The label-based biosensor approach has fundamentally expanded our ability to dissect metabolism with high precision. The validation experiments using tools like NAPstars and mBFP demonstrate their superior specificity, sensitivity, and spatial resolution. They have enabled discoveries such as the conservation of cytosolic NADP redox homeostasis across eukaryotes and the identification of the glutathione system as the primary mediator of antioxidative electron flux—findings that were elusive with autofluorescence alone [75].
In conclusion, while autofluorescence provides a coarse, label-free snapshot of metabolic state, genetically encoded biosensors offer a powerful, targetable, and quantitative lens. The choice between them is dictated by the specific biological question. For initial, non-invasive screening, autofluorescence may suffice. For mechanistic studies requiring precise, compartment-specific quantification of metabolic fluxes, genetically encoded biosensors are the indispensable tool in the modern metabolic researcher's arsenal.
Biosensors are powerful analytical devices that combine a biological recognition element with a physicochemical detector to measure the presence or concentration of analytes. Within this field, a fundamental distinction exists between label-based and label-free biosensing technologies. Label-based methods rely on fluorescent dyes, enzymes, or other detectable tags to generate a signal, while label-free techniques detect biomolecular interactions directly by measuring inherent properties such as mass, refractive index, or impedance change. This guide provides a comparative analysis of these two approaches, focusing on the critical metrics of sensitivity, specificity, cost, and operational workflow to inform researchers and drug development professionals in their experimental design.
Fundamental Principles and Comparative Mechanisms
The core difference between label-based and label-free biosensors lies in their signal transduction mechanisms. The diagram below illustrates the fundamental operational principles of each approach.
- Label-Based Biosensors: These rely on a secondary molecule, such as a fluorescent tag or enzyme, which must bind to the primary analyte to generate a detectable signal. The process involves multiple preparation and washing steps to introduce the label and remove unbound molecules [10].
- Label-Free Biosensors: These techniques detect the analyte directly by monitoring changes in the physical properties of the sensor surface upon binding. This allows for the observation of biomolecules in their native state without artificial modifications, minimizing potential perturbations to their natural function [10].
Comparative Performance Metrics
The choice between label-based and label-free biosensors involves trade-offs across several key performance metrics, as summarized in the table below.
Table 1: Comparative analysis of label-based and label-free biosensors
| Metric | Label-Based Biosensors | Label-Free Biosensors |
|---|---|---|
| Sensitivity | Extremely high (zeptomole to attomole levels); signal amplification possible. | High (femtomole to picomole levels). Examples: Single-protein detection via iSCAT [10]; 1.5 pM for SARS-CoV-2 spike protein via nanowell impedance sensor [76]. |
| Specificity | High, but can be compromised by non-specific binding of labels. | High; relies on intrinsic biorecognition. Can differentiate between closely related targets (e.g., SARS-CoV-2 vs. MERS-CoV spike proteins) [76]. |
| Cost & Operational Workflow | Higher reagent costs (labels, substrates). Multi-step, lengthy protocols requiring skilled operators. | Lower reagent costs, simpler sample prep. Faster, real-time results. Amenable to miniaturization and point-of-care use [77] [76] [64]. |
| Throughput | High (e.g., microplate readers). | Traditionally lower, but increasing with array-based platforms. |
| Information Content | Primarily endpoint concentration data. | Rich, real-time kinetic data on binding affinity, rates, and concentration [10]. |
Detailed Experimental Protocols
Protocol for a Label-Free Nanowell Impedance Biosensor
This protocol details the fabrication and use of a label-free electronic biosensor for detecting SARS-CoV-2 spike proteins, achieving a detection limit of 1.5 pM [76].
Sensor Fabrication:
- Begin with a 500 μm-thick fused silica substrate.
- Deposit a 100 nm gold layer (with a 5 nm chromium adhesion layer) via physical vapor evaporation. Pattern the first electrode using photolithography and lift-off processing.
- Deposit a 40 nm layer of aluminum oxide via atomic Layer Deposition (ALD).
- Deposit a second 100 nm gold layer (with a 5 nm chromium adhesion layer) and pattern it to create a 5x5 array of nanowells over a 20 μm × 20 μm area where the electrodes overlap.
- Perform wet etching (using buffered oxide etch, gold etchant, and chromium etchant) to pattern the well-shaped array and expose the bottom gold layer.
- Finally, a polydimethylsiloxane (PDMS) fluidic cell is glued above the nanowell array to contain liquid samples.
Sensor Functionalization:
- Inject a phosphate-buffered saline (PBS) buffer into the wells to create a liquid environment.
- Introduce polyclonal or monoclonal SARS-CoV-2 antibodies into the wells and allow them to adsorb onto the gold surface.
- Monitor impedance changes in real-time using a lock-in amplifier (e.g., Zurich Instruments HF2IS) to confirm successful antibody adsorption.
Sample Measurement:
- Introduce the test sample (e.g., in artificial saliva buffer) into the wells.
- Continuously monitor the impedance at an operational frequency of 1 MHz.
- A measurable increase in impedance indicates the specific binding of the target antigen (SARS-CoV-2 spike protein) to the immobilized antibodies.
- Diagnostic results are typically obtained within ten minutes using a sample volume of less than 5 μL.
Protocol for a Label-Free Electrochemical Biosensor
This protocol outlines the development of a disposable point-of-care device for the simultaneous measurement of HbA1c and insulin from a single drop of blood [64].
Electrode Preparation:
- Use a dual screen-printed carbon electrode system.
- Functionalize the working electrodes (WE1 and WE2) with palladium nanostructures (PdNS) to create a high-surface-area platform.
Biorecognition Immobilization:
- Covalently immobilize anti-HbA1c antibodies on WE1 and anti-insulin antibodies on WE2.
Sample Pretreatment:
- For HbA1c measurement, a glycated hemoglobin extraction step from a whole blood sample is performed prior to analysis.
Amperometric Measurement:
- Incubate the pretreated blood sample on the sensor.
- Introduce a hydrogen peroxide (H₂O₂) measuring solution.
- Measure the amperometric signals simultaneously at both working electrodes:
- At WE1, the current is generated from the oxidation of the heme group in HbA1c.
- At WE2, the current is suppressed due to insulin binding interfering with the H₂O₂ reaction.
- Quantify analyte concentrations based on the respective current responses. The biosensor demonstrated high sensitivity (R² > 0.96) and selectivity (>95%) in whole blood analysis.
The Scientist's Toolkit: Key Research Reagent Solutions
Table 2: Essential materials and reagents for biosensor development
| Item | Function in Biosensing | Example Applications in Cited Research |
|---|---|---|
| Gold & Palladium Nanostructures | Enhance electrode surface area and electron transfer efficiency; provide sites for biomolecule immobilization. | Palladium nanostructures on carbon electrodes for HbA1c/insulin sensing [64]. Gold electrodes in nanowell impedance sensors [76]. |
| Specific Antibodies | Act as biorecognition elements that provide high specificity for the target analyte. | Anti-SARS-CoV-2 antibodies for virus detection [76]. Anti-HbA1c and anti-insulin antibodies for diabetes management [64]. |
| Allosteric Transcription Factors (aTFs) | Used in cell-free biosensors; undergo conformational change upon analyte binding, triggering a signal. | Detection of Hg²⁺ and Pb²⁺ in water with pM sensitivity [78]. |
| Thiol-Based Linkers | Form self-assembled monolayers (SAMs) on gold surfaces for controlled immobilization of biorecognition elements. | Used for functionalizing gold-coated surfaces in optical biosensors [79]. |
| Lock-in Amplifier | Precisely measures small electrical signals (e.g., impedance) by rejecting noise, crucial for label-free detection. | Used to monitor impedance changes in nanowell sensors at 1 MHz [76]. |
| Cell-Free Protein Synthesis (CFPS) Systems | Provide the transcriptional/translational machinery for biosensing outside of living cells, enabling field deployment. | Used in paper-based biosensors for environmental toxins and pathogens [78]. |
Technological Advancements and Future Outlook
The field of biosensing is being transformed by several key technological integrations. Artificial Intelligence and Machine Learning are now being deployed to significantly enhance the performance of both biosensor types. For electrochemical biosensors, machine learning models—including stacked ensemble learning, Gaussian Process Regression, and artificial neural networks—can predict and optimize sensor responses, denoise signals, and identify critical performance-driving parameters like enzyme amount and pH, thereby reducing development time and cost [80]. Furthermore, AI algorithms improve the sensitivity and specificity of optical biosensors during intelligent signal processing and automated decision-making [41].
The drive toward point-of-care (POC) diagnostics is accelerating, particularly for label-free platforms. The core requirements for POC devices are summarized by the REASSURED criteria (Real-time connectivity, Ease of sample collection, Affordable, Sensitive, Specific, User-friendly, Rapid and robust, Equipment-free, and Deliverable to end-users) [79]. Label-free electrochemical and impedance-based sensors are at the forefront of this trend, as demonstrated by the rapid, low-cost, and miniaturized devices for detecting pathogens like SARS-CoV-2 [76] and chronic disease biomarkers like HbA1c [64].
Finally, synthetic biology is pushing the boundaries of what biosensors can detect. The development of cell-free biosensors that harness the selectivity of cellular machinery without the constraints of living cells is a major innovation [78]. These systems leverage synthetic biology components such as riboswitches, allosteric transcription factors, and engineered metabolic pathways to detect a wide range of analytes, from heavy metals and organic pollutants to specific pathogens, with high sensitivity and specificity. Their suitability for lyophilization and paper-based formats makes them ideal for environmental monitoring and diagnostics in resource-limited settings [78].
Conclusion
The comparative analysis reveals that label-based and label-free biosensors are not mutually exclusive but are complementary technologies, each with distinct strengths for specific applications. Label-free biosensors offer significant advantages for real-time, in vivo monitoring and simplified workflows, while label-based methods provide unparalleled specificity and a well-established validation framework. The future of biosensing lies in the intelligent integration of these platforms, guided by rigorous validation using innovative probes and enhanced by artificial intelligence for data analysis. Emerging trends point toward sophisticated multiplexed assays, robust point-of-care devices, and a deeper quantitative understanding of biological systems, ultimately accelerating drug discovery and improving clinical diagnostics.
References
- 1. Label-free and label-based electrochemical detection of ... [https://pmc.ncbi.nlm.nih.gov/articles/PMC11289512/]
- 2. Label-Free Biosensor - PMC [https://pmc.ncbi.nlm.nih.gov/articles/PMC10216458/]
- 3. Progress of new label-free techniques for biosensors: a review - PubMed [https://pubmed.ncbi.nlm.nih.gov/25608959/]
- 4. A review on label free biosensors [https://www.sciencedirect.com/science/article/pii/S2590137022001091]
- 5. Biosensors | Special Issue : Label-free Biosensing [https://www.mdpi.com/journal/biosensors/special_issues/Label_free_biosensing]
- 6. Label-free biosensing with singular-phase-enhanced ... [https://www.nature.com/articles/s41377-023-01345-6]
- 7. Performance of label-free biosensors as a function of layer ... [https://www.sciencedirect.com/science/article/pii/S2590137024001201]
- 8. Improving standards in the reporting of optical biosensor ... [https://www.sciencedirect.com/science/article/pii/S2472555224000546]
- 9. Perspectives on systematic optimization of ultrasensitive ... [https://pubs.rsc.org/en/content/articlehtml/2024/tc/d4tc02131b]
- 10. Label-free single-molecule optical detection | npj Biosensing [https://www.nature.com/articles/s44328-025-00048-9]
- 11. Real-time and Label-free Bio-sensing of Molecular ... [https://pmc.ncbi.nlm.nih.gov/articles/PMC3529553/]
- 12. Label-free, real-time monitoring of membrane binding ... [https://www.nature.com/articles/s41467-024-51320-x]
- 13. Label-Free Electrochemical Biosensor for Real-Time ... [https://www.sciencedirect.com/science/article/abs/pii/S0956566325008371]
- 14. Recent advances in label-free detection in vitro and ... [https://www.sciencedirect.com/science/article/abs/pii/S0010854525008975]
- 15. Biosensors | Special Issue : Label-Free Biosensors: Exploring the Field [https://www.mdpi.com/journal/biosensors/special_issues/label-free-biosensors]
- 16. Point-of-care biosensors for infectious disease diagnosis [https://pubs.rsc.org/en/content/articlehtml/2025/ra/d5ra03897a?page=search]
- 17. Label-Free Biosensing with High Selectivity in Complex ... [https://www.nature.com/articles/srep13173]
- 18. Recent advances of fluorescent biosensors based on cyclic ... [https://jnanobiotechnology.biomedcentral.com/articles/10.1186/s12951-021-01149-z]
- 19. Starting a fluorescent biosensor revolution - Wyss Institute [https://wyss.harvard.edu/news/starting-a-fluorescent-biosensor-revolution/]
- 20. Optical Biosensors for Label-Free Detection of Small ... [https://pmc.ncbi.nlm.nih.gov/articles/PMC6308632/]
- 21. Comparison of different label-free imaging high-throughput ... [https://www.sciencedirect.com/science/article/abs/pii/S0003269719302106]
- 22. Label-Free Impedance Biosensors: Opportunities and ... [https://pmc.ncbi.nlm.nih.gov/articles/PMC2174792/]
- 23. Label-free optical biosensing: going beyond the limits [https://pubs.rsc.org/en/content/articlehtml/2023/cs/d3cs00155e]
- 24. Recent Advances in Micro- and Nano-Enhanced Intravascular ... [https://pmc.ncbi.nlm.nih.gov/articles/PMC12349352/]
- 25. Review of Label-Free Monitoring of Bacteria [https://pmc.ncbi.nlm.nih.gov/articles/PMC9026780/]
- 26. Biosensor in smart food traceability system for food safety ... [https://pmc.ncbi.nlm.nih.gov/articles/PMC10841032/]
- 27. Food Safety Analysis Using Electrochemical Biosensors [https://pmc.ncbi.nlm.nih.gov/articles/PMC6164425/]
- 28. Label-Free Electrochemical Biosensor Platforms for ... [https://www.mdpi.com/2079-6374/13/3/333]
- 29. Electrochemical Biosensors Driving Model Transformation ... [https://www.mdpi.com/2304-8158/14/15/2669]
- 30. The role of DNA-based biosensors in species identification ... [https://www.sciencedirect.com/science/article/pii/S0924224424000268]
- 31. Electrochemical detection techniques and usage of ... [https://link.springer.com/article/10.1007/s44373-025-00066-2]
- 32. Microfluidic biosensors for biomarker detection in body fluids [https://biomarkerres.biomedcentral.com/articles/10.1186/s40364-024-00697-4]
- 33. Label-free electrochemical biosensor based on green ... [https://www.nature.com/articles/s41598-024-62231-8]
- 34. Highly sensitive label-free biosensor: graphene/CaF 2 ... [https://www.nature.com/articles/s41598-023-43480-5]
- 35. Common-path interferometric label-free protein sensing ... [https://www.nature.com/articles/s41377-020-0336-6]
- 36. Label-free plasmonic biosensors for neurodegenerative ... [https://www.sciencedirect.com/science/article/abs/pii/S0165993625003565]
- 37. All-fiber label-free optical fiber biosensors: from modern ... [https://pmc.ncbi.nlm.nih.gov/articles/PMC10942689/]
- 38. Recent Advance in Single-Molecule Fluorescent ... [https://pmc.ncbi.nlm.nih.gov/articles/PMC11591580/]
- 39. Label-Free Biosensors for Laboratory-Based Diagnostics of ... [https://pmc.ncbi.nlm.nih.gov/articles/PMC7169461/]
- 40. Label-free spatially maintained measurements of metabolic ... [https://www.frontiersin.org/journals/bioengineering-and-biotechnology/articles/10.3389/fbioe.2023.1293268/full]
- 41. Emerging trends in AI-integrated optical biosensors for point ... [https://pubs.rsc.org/en/content/articlehtml/2025/cc/d5cc04899k]
- 42. Single-Cell Monitoring Microfluidic ... | Preprints.org Versus Microplate [https://www.preprints.org/manuscript/202511.1437]
- 43. Application of Microfluidics in Drug Development from ... [https://www.mdpi.com/2079-6374/12/10/870]
- 44. Microfluidic Bio-Sensors and Their Applications - PMC [https://pmc.ncbi.nlm.nih.gov/articles/PMC10526507/]
- 45. of label-free biosensing in Comparison , microplate , and... microfluidic [https://pubmed.ncbi.nlm.nih.gov/20553867/]
- 46. Blueprints for Biosensors: Design, Limitations, and ... [https://pmc.ncbi.nlm.nih.gov/articles/PMC6115959/]
- 47. Nanotechnology-Enabled Biosensors: A Review of ... [https://pmc.ncbi.nlm.nih.gov/articles/PMC9856107/]
- 48. Label-free colorimetric biosensor for sensitive detection of ... [https://www.sciencedirect.com/science/article/abs/pii/S095656632500627X]
- 49. Nanomaterials as signal amplification elements in aptamer ... [https://www.sciencedirect.com/science/article/abs/pii/S1567539422001219]
- 50. Everything's under Control: Maximizing Biosensor ... [https://pmc.ncbi.nlm.nih.gov/articles/PMC11840803/]
- 51. A Closer Look at Biosensors: A Practical Tutorial for ... [https://www.spectroscopyonline.com/view/a-closer-look-at-biosensors-a-practical-tutorial-for-spectroscopists]
- 52. Optimization of Nanowell-Based Label-Free Impedance ... [https://pmc.ncbi.nlm.nih.gov/articles/PMC11430111/]
- 53. Inverse-designed waveguide-based biosensor for high ... [https://pmc.ncbi.nlm.nih.gov/articles/PMC11501463/]
- 54. Biosensors, Volume 15, Issue 11 (November 2025) [https://www.mdpi.com/2079-6374/15/11]
- 55. Electrochemical Impedance Spectroscopy-Based ... [https://www.mdpi.com/2079-6374/15/7/443]
- 56. Real-Time and Label-Free Monitoring of Monoclonal ... [https://www.sciencedirect.com/science/article/abs/pii/S0956566325008553]
- 57. Highly sensitive space-filling planar microwave biosensors ... [https://www.sciencedirect.com/science/article/pii/S0263224125023875]
- 58. Wireless Power-Up and Readout of Label-Free ... [https://pmc.ncbi.nlm.nih.gov/articles/PMC12461922/]
- 59. Design and Validation of Specific Oligonucleotide Probes ... [https://pmc.ncbi.nlm.nih.gov/articles/PMC12588398/]
- 60. Wireless power-up and readout from a label-free biosensor [https://link.springer.com/article/10.1007/s10544-024-00728-9]
- 61. To label or not: the need for validation in label-free imaging [https://pmc.ncbi.nlm.nih.gov/articles/PMC11660684/]
- 62. To label or not: the need for validation in label-free imaging [https://pubmed.ncbi.nlm.nih.gov/39711795/]
- 63. Label-Free Detection - New biosensors facilitate broader ... [https://www.ddw-online.com/label-free-detection-new-biosensors-facilitate-broader-range-of-drug-discovery-applications-1475-200412/]
- 64. Palladium nanostructure-based label-free electrochemical ... [https://www.sciencedirect.com/science/article/pii/S2666053925000785]
- 65. Recent Advances in Biosensor Technology for Potential ... [https://pmc.ncbi.nlm.nih.gov/articles/PMC4754454/]
- 66. Aptasensors versus immunosensors—Which will prevail? [https://pmc.ncbi.nlm.nih.gov/articles/PMC8961048/]
- 67. Protein Detection with Aptamer Biosensors [https://www.mdpi.com/1424-8220/8/7/4296]
- 68. A comparative Study of Aptasensor Vs Immunosensor for ... [https://www.nature.com/articles/s41598-018-19733-z]
- 69. Comparison of Electrochemical Immunosensors and ... [https://pmc.ncbi.nlm.nih.gov/articles/PMC4810399/]
- 70. Electrochemical protein biosensors for disease marker ... [https://www.nature.com/articles/s41378-024-00700-w]
- 71. A label-free point-of-care electrochemical biosensor for ... [https://www.sciencedirect.com/science/article/abs/pii/S0956566325002118]
- 72. Monitoring NAD(H) and NADP(H) dynamics during ... [https://pmc.ncbi.nlm.nih.gov/articles/PMC8807777/]
- 73. Profiling metabolic states with genetically encoded ... [https://www.sciencedirect.com/science/article/abs/pii/S0958166914001499]
- 74. Real-time monitoring of NADPH levels in living mammalian ... [https://www.sciencedirect.com/science/article/abs/pii/S0956566319308322]
- 75. A family of NADPH/NADP+ biosensors reveals in vivo ... [https://www.nature.com/articles/s41467-024-55302-x]
- 76. A label-free nanowell-based impedance sensor for ten- ... [https://pmc.ncbi.nlm.nih.gov/articles/PMC12056702/]
- 77. Electrochemical Nanobiosensors for Low-Cost Clinical ... [https://www.sciencedirect.com/science/article/pii/S1452398125002810]
- 78. Recent Advances in Developing Cell-Free Protein ... [https://pmc.ncbi.nlm.nih.gov/articles/PMC12385134/]
- 79. Point-of-care biosensors for infectious disease diagnosis [https://pmc.ncbi.nlm.nih.gov/articles/PMC12377050/]
- 80. Machine learning-based prediction and interpretation of ... [https://www.sciencedirect.com/science/article/abs/pii/S0026265X25030048]