Multiplex Biosensors for Pesticide Residues: Advanced Nanomaterial-Driven Detection Strategies
This article provides a comprehensive analysis of multiplex biosensors for the simultaneous detection of multiple pesticide residues, a critical need for modern food safety and environmental monitoring.
Multiplex Biosensors for Pesticide Residues: Advanced Nanomaterial-Driven Detection Strategies
Abstract
This article provides a comprehensive analysis of multiplex biosensors for the simultaneous detection of multiple pesticide residues, a critical need for modern food safety and environmental monitoring. It explores the foundational principles of optical and electrochemical sensing platforms driven by advanced nanomaterials, including noble metal nanoparticles, carbon-based materials, and metal-organic frameworks. The review details methodological innovations in fluorescence, surface-enhanced Raman scattering (SERS), colorimetry, and electrochemical sensing, alongside their practical applications in complex matrices. It further addresses key challenges in real-sample analysis, sensitivity, and selectivity, offering troubleshooting and optimization strategies. Finally, the article presents a comparative validation of these emerging technologies against traditional chromatographic methods, highlighting their potential for rapid, on-site screening and paving the way for next-generation diagnostic tools in biomedical and clinical research.
The Rise of Multiplex Biosensing: Addressing the Urgent Need for Multi-Residue Pesticide Analysis
Pesticide contamination represents a critical global environmental challenge, with significant implications for ecosystem stability and public health. The extensive reliance on synthetic chemicals for agricultural and public health purposes has led to the pervasive presence of pesticide residues in aquatic ecosystems, where they adversely affect non-target organisms and contribute to biodiversity loss [1]. Current monitoring approaches primarily depend on conventional analytical techniques such as gas chromatography-mass spectrometry (GC-MS) and liquid chromatography-tandem mass spectrometry (LC-MS/MS), which, while highly sensitive and reliable, present limitations for rapid environmental screening due to their time-consuming processes, requirement for sophisticated laboratory infrastructure, and extensive sample pretreatment [1] [2]. These challenges highlight the pressing need for innovative monitoring solutions that can provide rapid, on-site, and cost-effective detection of multiple pesticide residues across diverse environmental matrices.
The development and implementation of multiplex biosensors offer a transformative approach to pesticide monitoring by enabling simultaneous detection of multiple analytes with high specificity and sensitivity. This application note details the operational principles, experimental protocols, and implementation frameworks for advanced biosensing platforms designed to address the global challenge of pesticide contamination, with particular emphasis on their application within environmental water quality assessment and agricultural product safety.
Biosensor Platforms for Pesticide Detection
Biosensors integrate biological recognition elements with physicochemical transducers to produce measurable signals proportional to target analyte concentration. The diversity of biosensor platforms enables tailored approaches for specific monitoring applications and detection requirements. The table below summarizes the principal biosensor types employed in pesticide residue detection, along with their respective characteristics and common applications.
Table 1: Classification and Characteristics of Biosensors for Pesticide Detection
| Biosensor Type | Recognition Element | Transducer Principle | Key Advantages | Representative Pesticides Detected |
|---|---|---|---|---|
| Enzymatic Biosensors | Enzymes (e.g., acetylcholinesterase, organophosphorus hydrolase) | Electrochemical, Optical | High catalytic activity, substrate specificity | Organophosphates, carbamates, methyl parathion [1] [3] |
| Immunosensors | Antibodies | Optical (SPR, TIRF), Electrochemical | High specificity and affinity, versatile format | Herbicides (atrazine), insecticides (chlorpyrifos) [1] [4] |
| Aptasensors | Nucleic acid aptamers | Electrochemical, Fluorescent | Thermal stability, chemical synthesis, small size | Various insecticides and herbicides [1] |
| Whole-Cell Biosensors | Microorganisms or plant cells | Electrochemical, Bioluminescent | Functional toxicity assessment, viability | Broad-spectrum detection [1] |
| Wearable Biosensors | Enzymes or antibodies | Electrochemical | In-situ, real-time, non-destructive analysis | Organophosphorus pesticides on crops [3] |
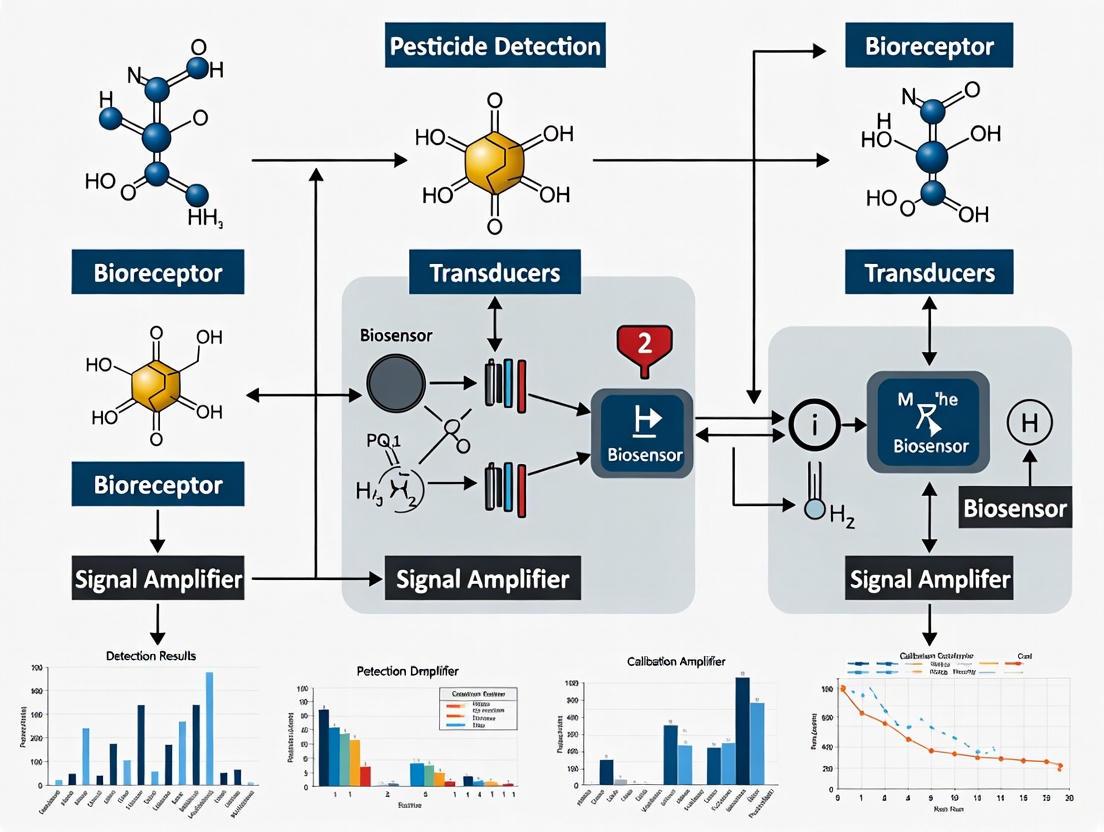
The operational principle of multiplex biosensor detection relies on the parallel integration of multiple biological recognition elements onto a single platform, each specifically targeting a different pesticide compound. This configuration allows for the simultaneous quantification of several analytes in a single sample, significantly enhancing screening efficiency. Transducer elements convert the specific binding events into quantifiable signals, typically electrochemical, optical, or acoustic, which are subsequently processed and correlated to analyte concentration [1] [4].
Figure 1: Fundamental principle of multiplex biosensor operation for parallel pesticide detection.
Research Reagent Solutions
The development and implementation of effective biosensing platforms require specific research-grade reagents and materials to ensure analytical reliability and performance. The following table details essential reagents and their functional roles in biosensor fabrication and operation.
Table 2: Essential Research Reagents for Biosensor Development and Application
| Reagent/Material | Functional Role | Application Context |
|---|---|---|
| Organophosphorus Hydrolase (OPH) | Enzyme recognition element; catalyzes hydrolysis of organophosphorus pesticides. | Selective capture and recognition of methyl parathion and related OPs in wearable and enzymatic biosensors [3]. |
| Nucleic Acid Aptamers | Synthetic oligonucleotide recognition elements; high-affinity binding to specific pesticide targets. | Aptasensor development; stable alternatives to antibodies for various insecticides and herbicides [1]. |
| Gold Nanoparticles (AuNPs) | Signal amplification; enhance electron transfer in electrochemical sensors and optical properties. | Modification of electrode surfaces (e.g., LIG) to improve sensitivity in wearable and other biosensors [2] [3]. |
| Laser-Induced Graphene (LIG) | Porous, high-surface-area electrode material; provides conductive substrate for sensor fabrication. | Flexible, stretchable three-electrode systems for plant-wearable and other electrochemical biosensors [3]. |
| Polydimethylsiloxane (PDMS) | Flexible, biocompatible polymer substrate; allows sensor conformability to irregular surfaces. | Transfer and encapsulation of LIG electrodes for plant-wearable applications [3]. |
| Specific Monoclonal Antibodies | Immunological recognition elements; high specificity for target pesticide antigens. | Immunosensors (e.g., SPR, array biosensors) for herbicides like atrazine and insecticides [1] [4]. |
Detailed Experimental Protocols
Protocol 1: Fabrication of a Plant-Wearable Serpentine Electrode Biosensor
This protocol describes the fabrication and application of a flexible, plant-wearable biosensor for in-situ detection of organophosphorus pesticides on crop surfaces [3].
Materials Required:
- Commercial polyimide (PI) film (25 μm thickness)
- CO₂ laser induction system
- Polydimethylsiloxane (PDMS)
- Ag/AgCl ink
- Organophosphorus hydrolase (OPH)
- Gold(III) chloride trihydrate (HAuCl₄·3H₂O)
- Phosphate buffer (0.1 M, pH 7.4)
- Semisolid electrolyte (e.g., gelatin-based)
- Hand-held potentiostat with Bluetooth capability
Procedure:
- Laser-Induced Graphene (LIG) Patterning:
- Mount the PI film securely on the laser processing stage.
- Utilize computer-controlled laser writing to pattern a serpentine three-electrode system (working, counter, and reference electrodes) directly onto the PI surface.
- Optimize laser power (e.g., 3.6 W) and scan speed to achieve a 3D porous graphene structure with high conductivity and mechanical integrity [3].
Electrode Transfer and Functionalization:
- Apply a PDMS layer to transfer and encapsulate the LIG electrode, conferring flexibility and stretchability.
- Modify the working electrode surface by electrodepositing gold nanoparticles (AuNPs) from a HAuCl₄ solution to enhance electrochemical performance and surface area.
- Immobilize the OPH enzyme onto the AuNP-modified working electrode using a cross-linking agent or physical adsorption, followed by rinsing with phosphate buffer to remove unbound enzyme.
Sensor Integration and Calibration:
- Apply a biocompatible semisolid electrolyte layer over the three-electrode system.
- Connect the flexible sensor to a hand-held potentiostat.
- Calibrate the biosensor by measuring the amperometric response (e.g., chronoamperometry) to standard solutions of methyl parathion in phosphate buffer across a concentration range (e.g., 0.1-100 μM).
- Establish a calibration curve correlating pesticide concentration to electrochemical signal.
In-Situ Application on Crops:
- Gently attach the functionalized biosensor directly to the surface of a leaf or fruit.
- Initiate measurement via the potentiostat; the OPH enzyme catalyzes the hydrolysis of methyl parathion, generating an electroactive product detected amperometrically.
- Wirelessly transmit the resulting data in real-time to a smartphone device for analysis and interpretation.
Figure 2: Workflow for plant-wearable biosensor fabrication and deployment.
Protocol 2: Multiplex Array Biosensor for Water Monitoring
This protocol outlines the procedure for utilizing a planar array biosensor based on the NRL (Naval Research Laboratory) platform for simultaneous detection of multiple pesticides in water samples [4].
Materials Required:
- Planar waveguide chip (e.g., glass slide)
- Avidin coating solution
- Biotinylated capture antibodies (specific to target pesticides, e.g., atrazine, chlorpyrifos)
- Polydimethylsiloxane (PDMS) flow channel block
- Fluorescently labeled tracer antibodies (e.g., Cy5 or AlexaFluor 647 conjugates)
- Diode laser (635 nm) and CCD detection system
- Water samples (filtered if containing particulate matter)
- Regeneration buffer (e.g., low pH glycine buffer)
Procedure:
- Waveguide Functionalization:
- Coat a clean planar waveguide with an avidin layer.
- Immobilize biotinylated capture antibodies in distinct columns on the waveguide surface using a PDMS flow channel block to create a patterned array.
Sample Preparation and Assay:
- Pre-mix the environmental water sample with a solution containing fluorescently labeled tracer antibodies.
- Perpendicularly orient the PDMS flow channel block to the immobilized antibody columns and introduce the sample mixture.
- Allow the sample to flow through the channels, enabling pesticides in the sample to compete with immobilized haptens or directly bind to capture antibodies in a sandwich format.
Signal Detection and Analysis:
- Launch 635 nm light from a diode laser into the waveguide edge, creating an evanescent wave that excites surface-bound fluorophores.
- Capture the fluorescent pattern emitted from the array using a CCD camera.
- Quantify the fluorescence intensity at each capture spot, which is inversely proportional to the pesticide concentration in competitive assays or directly proportional in sandwich assays.
Regeneration and Reuse:
- Regenerate the biosensor surface by flowing a regeneration buffer to dissociate bound analytes and antibodies.
- Recalibrate with standard solutions before subsequent sample analyses to ensure quantitative accuracy.
Data Analysis and Interpretation
Biosensor data analysis requires conversion of raw signal outputs (electrical current, fluorescence intensity, spectral shift) into quantitative analyte concentrations based on established calibration models. For multiplex detection, data deconvolution is essential to accurately attribute signals to specific targets within a mixture.
Table 3: Typical Performance Metrics of Advanced Biosensor Platforms
| Biosensor Platform | Target Analytic | Sample Matrix | Detection Limit | Detection Time | Multiplexing Capacity |
|---|---|---|---|---|---|
| Plant-Wearable (Electrochemical) | Methyl parathion | Crop surface (in-situ) | Low μM range [3] | Minutes [3] | Single analyte |
| NRL Array Biosensor (Optical) | Toxins, small molecules | Water, food crude extracts | ng/L to μg/L range [4] | 5 - 15 minutes [4] | Multiple (e.g., 4-6 analytes) |
| SPR-based Immunosensor | Herbicides, antibiotics | Water, milk | ng/L level [4] | Real-time (< 5 min) [4] | Moderate (4-16 spots) |
| CL-based Microarray | Antibiotics | Milk | ng/L level [4] | ~5 minutes [4] | High (dozens of spots) |
| Fluorescent Aptasensor | Various pesticides | Processed tea extracts | pM to nM range [2] | 5 - 30 minutes [2] | Moderate |
Statistical analysis, including replicate measurements (n ≥ 3) and appropriate controls (negative, positive), is crucial for ensuring data reliability. The limit of detection (LOD) is typically calculated as the mean signal of the blank plus three times its standard deviation. Cross-reactivity assessments are particularly important for multiplex assays to verify minimal interference between parallel detection channels.
Troubleshooting and Optimization
Successful implementation of biosensor protocols often requires optimization and problem-solving. Common challenges and recommended solutions include:
- Low Signal-to-Noise Ratio: Optimize recognition element density on the sensor surface. For electrochemical sensors, ensure proper electrode cleaning and surface renewal. For optical sensors, check laser alignment and fluorescence background.
- Poor Selectivity/Cross-Reactivity: Re-evaluate the specificity of biological recognition elements (antibodies, aptamers). Implement additional blocking steps during surface preparation (e.g., with BSA or casein) to minimize non-specific binding.
- Signal Drift or Instability: Verify the stability of the reference electrode in electrochemical systems. Ensure constant temperature and pH during measurements, as these factors significantly affect biorecognition kinetics and stability.
- Reproducibility Issues: Standardize the immobilization chemistry for biological elements across different sensor batches. Implement rigorous quality control using standard reference materials for each experimental run.
- Matrix Interference: For complex samples like tea, incorporate sample clean-up steps such as dilution, filtration, or solid-phase extraction to remove interfering compounds like polyphenols and alkaloids [2]. Utilize standard addition methods for quantification to compensate for matrix effects.
Biosensor technology represents a paradigm shift in environmental monitoring, offering rapid, sensitive, and potentially on-site detection capabilities that complement traditional analytical methods. The protocols outlined herein for wearable and multiplex biosensors provide researchers with practical frameworks for detecting pesticide residues in various environmental and agricultural contexts. Future developments in this field are anticipated to focus on enhanced multiplexing capabilities for a broader spectrum of pesticides, integration with microfluidic systems for automated sample handling, incorporation of artificial intelligence for data analysis and pattern recognition, and the development of increasingly robust and stable biorecognition elements for prolonged field deployment [1] [2]. The ongoing convergence of nanotechnology, materials science, and biotechnology will continue to propel the evolution of biosensors, ultimately contributing to more effective global management of pesticide contamination and the mitigation of associated health risks.
The accurate monitoring of pesticide residues in food products is a critical component of ensuring global food safety and protecting public health. Traditional analytical techniques, particularly High-Performance Liquid Chromatography (HPLC), Gas Chromatography-Mass Spectrometry (GC-MS), and Enzyme-Linked Immunosorbent Assay (ELISA), have long served as the cornerstone of residue analysis in regulatory and quality control settings [5]. These methods are renowned for their accuracy, sensitivity, and reliability in quantifying specific analytes at trace levels.
However, in the context of modern agricultural practices, which involve the use of hundreds of different pesticide compounds, these traditional methods face significant challenges. The demand for analyzing multiple pesticide residues simultaneously—driven by the need for comprehensive food safety assessments—has exposed inherent limitations in these conventional platforms [5]. This application note details the specific constraints of HPLC, GC-MS, and ELISA, framing their shortcomings within the pressing need for advanced, multiplexed detection solutions such as biosensors. By examining performance metrics, operational complexities, and practical bottlenecks, this analysis provides a scientific rationale for the transition towards next-generation analytical technologies.
Performance Limitations and Comparative Analysis
The limitations of traditional methods become evident when their key operational characteristics are systematically compared. The following table summarizes the principal constraints of each technique, highlighting the factors that hinder their efficiency in modern multi-residue analysis.
Table 1: Comparative Limitations of Traditional Detection Methods
| Method | Key Limitations | Typical Sample Throughput | Multiplexing Capability | Approximate Cost Factor |
|---|---|---|---|---|
| HPLC | Complex sample prep, high solvent consumption, requires skilled technicians, limited to lab use [2] [5] | Low to Moderate | Low (Single or few analytes per run) | High (Equipment & Consumables) |
| GC-MS | Extensive sample cleanup needed, derivatization for non-volatile compounds, matrix effects, sophisticated instrumentation [6] [5] [7] | Low to Moderate | Moderate (with advanced MS) | Very High (Equipment & Maintenance) |
| ELISA | Susceptible to matrix/solvent interference, single-analyte focus, limited dynamic range, antibody cross-reactivity [8] [9] | High (per analyte) | Very Low (Typically single-analyte) | Low to Moderate (per test) |
Quantitative data further underscores these limitations. For instance, a study validating an HPLC-MS/MS method for 121 pesticides in rice reported a sample preparation and analysis workflow that is inherently time-consuming and complex, despite achieving excellent recoveries of 70-119% [10]. Similarly, a GC-MS method for 12 pesticides in cucumbers, while achieving a satisfactory recovery range of 80.6-112.3%, required meticulous calibration and cleanup procedures that are not amenable to rapid, on-site analysis [6]. ELISA kits, though simpler, show their own constraints in sensitivity and specificity, as seen in an ELISA for dinotefuran, where the working range was 1.0–30 ng/mL and cross-reactivity with clothianidin was a notable 184% [8].
Detailed Experimental Protocols Highlighting Operational Complexity
Protocol: Multi-Residue Analysis by GC-MS Using QuEChERS
This protocol, adapted from a method for determining 208 pesticides in plant-derived foods, exemplifies the intricate and multi-step nature of traditional chromatographic analysis [7].
1. Reagent Preparation:
- Extraction Solvent: Acetonitrile with 1% acetic acid.
- Standard Solutions: Prepare a series of matrix-matched calibration standards (e.g., 10–500 µg/L) from pesticide stock solutions in ethyl acetate. An internal standard (e.g., Heptachloride B) is added for quantification.
2. Sample Preparation (QuEChERS):
- Extraction: Weigh 10 g of homogenized sample (e.g., apple) into a 50 mL centrifuge tube. Add 10 mL of extraction solvent and a commercial QuEChERS salt packet (containing MgSO₄, NaCl, trisodium citrate, disodium hydrogen citrate). Shake vigorously for 1 minute and centrifuge.
- Cleanup: Transfer 6 mL of the supernatant to a dSPE tube containing cleanup sorbents (e.g., PSA, C18, and MgSO₄). Vortex and centrifuge. Transfer a portion of the cleaned extract, evaporate to near dryness under a nitrogen stream, and reconstitute in a solvent compatible with GC injection [7].
3. GC-MS Analysis:
- Injection: Inject 1–2 µL of the final extract in splitless mode.
- GC Conditions: Use a temperature-programmed run (e.g., initial 75°C, ramping to 300°C) on a non-polar or mid-polar capillary column (e.g., HP-5ms).
- Detection: Operate the mass spectrometer in multiple reaction monitoring (MRM) mode for high selectivity and sensitivity. Identify and quantify pesticides by comparing retention times and ion ratios to those of the matrix-matched calibration standards.
This workflow, while robust, involves numerous manual steps, requires significant solvent use, and depends on expensive, laboratory-bound instrumentation.
Protocol: Residue Analysis by ELISA
This protocol for the fungicide azoxystrobin demonstrates the comparative simplicity of ELISA but also its targeted, single-analyte nature [9].
1. Sample Extraction:
- Homogenize the agricultural sample.
- Extract the analyte with a water-miscible solvent like methanol or acetonitrile. For some matrices (e.g., rice), methanol extracts can be directly analyzed after dilution, as they show no significant matrix interference [8].
2. Assay Procedure:
- Add the standard or sample extract to the wells of a microplate pre-coated with capture antibody (direct competitive ELISA) or antigen (indirect ELISA).
- Add the enzyme-conjugated tracer (hapten or antibody) and incubate to allow competitive binding.
- Wash the plate to remove unbound materials.
- Add a colorimetric enzyme substrate and incubate for a defined period.
- Stop the reaction and measure the absorbance of each well with a plate reader.
3. Data Analysis:
- Construct a standard curve by plotting absorbance against the logarithm of the standard concentration.
- Interpolate the concentration of the analyte in the sample extracts from the standard curve. Recovery rates for a well-optimized ELISA, such as the one for azoxystrobin, can range from 96-109% [9].
The limitation is fundamental: each well or test is designed for one specific analyte, making the comprehensive screening of a sample for multiple pesticides prohibitively time-consuming and resource-intensive.
The Scientist's Toolkit: Key Research Reagent Solutions
The execution of traditional methods relies on a suite of specialized reagents and materials. The following table details essential items and their functions in the analytical workflow.
Table 2: Essential Research Reagents and Materials for Traditional Methods
| Reagent/Material | Function | Application Example |
|---|---|---|
| QuEChERS Extraction Kits | Standardized salts and tubes for pesticide extraction and partitioning from food matrices [7]. | GC-MS, LC-MS sample prep |
| dSPE Cleanup Tubes | Dispersive Solid-Phase Extraction tubes containing sorbents (PSA, C18, GCB) to remove matrix interferences like fatty acids and pigments [6] [7]. | GC-MS, LC-MS sample prep |
| Chromatography Columns | GC (e.g., HP-5) and HPLC (e.g., C18) columns for the physical separation of analyte mixtures. | GC-MS, HPLC |
| MS-Grade Solvents | Ultra-pure solvents (acetonitrile, methanol, ethyl acetate) with minimal impurities to avoid background noise in detection. | HPLC, GC-MS, ELISA |
| Antibodies (Monoclonal/Polyclonal) | Biological recognition elements that provide high specificity and sensitivity for a target analyte in immunoassays [8] [9]. | ELISA |
| Stable Isotope-Labeled Internal Standards | Standards used in MS for precise quantification, correcting for matrix effects and recovery losses. | GC-MS, LC-MS |
Workflow Visualization of Traditional Methods
The following diagram illustrates the complex, multi-stage processes involved in chromatographic methods (HPLC/GC-MS) and the simpler, yet single-plex, process of ELISA, highlighting their operational bottlenecks.
The limitations of traditional detection methods—operational complexity, low throughput for multi-analyte screening, high cost, and lack of portability—are inherent to their fundamental design principles [2] [5]. While HPLC, GC-MS, and ELISA remain gold standards for confirmatory, single-analyte quantification, their shortcomings create a significant technological gap in the face of the growing need for comprehensive pesticide residue profiling.
This analysis underscores the necessity for a paradigm shift in food safety monitoring. Multiplex biosensor technology emerges as a promising solution, potentially integrating the specificity of biological recognition with transducers capable of generating simultaneous, multi-analyte signals. By overcoming the key limitations outlined in this document, such advanced systems are poised to enable rapid, on-site, and high-throughput screening of multiple pesticide residues, thereby enhancing the efficacy of food safety control systems and better protecting public health.
Biosensors are analytical devices that integrate a biological recognition element with a physicochemical transducer to convert a biological event into a measurable signal [11]. These devices have become indispensable tools across various fields, including medical diagnostics, environmental monitoring, and food safety control, particularly for detecting pesticide residues in agricultural products [12] [11]. The core principle of biosensor operation involves three essential components: a biorecognition element that specifically interacts with the target analyte, a transducer that converts the biological interaction into a quantifiable signal, and a signal processing system that interprets and displays the results [13] [11]. This application note examines the fundamental principles of recognition elements and transduction mechanisms, framed within the context of multiplex biosensor detection for multiple pesticide residues research.
Fundamental Components and Principles
Core Biosensor Architecture
All biosensors share a common architectural framework consisting of three fundamental components that work in sequence to detect and quantify target analytes [13] [11]. The arrangement and integration of these elements determine the biosensor's performance characteristics, including sensitivity, specificity, and operational stability.
Recognition Elements
Recognition elements form the molecular interface that provides biosensors with their exceptional specificity. These biological or biomimetic components are selected for their ability to bind particular target molecules with high affinity while minimizing interactions with non-target substances in complex sample matrices [12] [13]. The choice of recognition element significantly influences the sensor's selectivity, stability, and application potential.
Table 1: Common Recognition Elements in Biosensors for Pesticide Detection
| Recognition Element | Composition | Detection Principle | Advantages | Limitations |
|---|---|---|---|---|
| Enzymes (e.g., AChE, BChE) | Proteins | Enzyme inhibition or catalytic activity | High catalytic activity, signal amplification | Sensitivity to environment, limited stability [12] |
| Antibodies | Immunoglobulin proteins | Antigen-antibody binding | High specificity, commercial availability | Animal-derived, batch variability [14] |
| Aptamers | Single-stranded DNA/RNA oligonucleotides | Folding into target-specific 3D structures | Chemical stability, thermal stability, modifiable [15] | |
| Molecularly Imprinted Polymers (MIPs) | Synthetic polymers with template-shaped cavities | Molecular recognition via shape complementarity | Robustness, stability in harsh conditions [12] |
Transduction Mechanisms
Transduction mechanisms form the critical interface between biological recognition events and measurable physical signals. These systems convert molecular interactions into quantifiable outputs that can be processed, analyzed, and interpreted [13] [11]. The transduction principle employed determines key performance parameters including sensitivity, detection limit, and compatibility with different measurement environments.
Table 2: Transduction Mechanisms in Biosensors
| Transduction Type | Measurable Signal | Detection Method | Sensitivity Range | Applications in Pesticide Detection |
|---|---|---|---|---|
| Electrochemical | Current, potential, or impedance changes | Amperometric, potentiometric, impedimetric | nM to fM | Organophosphorus, carbamate detection [11] [15] |
| Optical | Light absorption, emission, or scattering | Fluorescence, luminescence, colorimetry, SPR | pM to fM | Multiplex pesticide detection [12] [16] |
| Piezoelectric | Mass change | Frequency shift | ng-level mass detection | Gas phase pesticide detection [11] |
| Thermal | Heat change | Temperature measurement | - | Enzyme-based pesticide sensors [11] |
Experimental Protocols for Pesticide Detection
Protocol 1: Acetylcholinesterase-Based Electrochemical Biosensor for Organophosphorus Pesticides
Principle: This protocol utilizes the inhibition of acetylcholinesterase (AChE) enzyme activity by organophosphorus pesticides (OPs). The decrease in enzymatic conversion of acetylthiocholine to thiocholine is measured amperometrically, with the signal reduction correlating to pesticide concentration [12].
Materials:
- Acetylcholinesterase (AChE) from electrophorus electricus
- Acetylthiocholine chloride (ATCh) substrate
- Phosphate buffer saline (PBS, 0.1 M, pH 7.4)
- Screen-printed carbon electrodes (SPCEs)
- Potentiostat for electrochemical measurements
- Chitosan for enzyme immobilization
- Glutaraldehyde for cross-linking
Procedure:
- Electrode Modification: Clean SPCEs by cycling in 0.5 M H₂SO₄ between -1.0 V and +1.0 V until stable voltammogram is obtained.
- Enzyme Immobilization: Prepare AChE solution (0.5 U/μL) in chitosan matrix (0.5% w/v). Deposit 5 μL of enzyme solution on electrode surface. Cross-link with 2% glutaraldehyde vapor for 30 minutes.
- Baseline Measurement: Incubate modified electrode in PBS containing 1 mM ATCh. Record amperometric current at +0.7 V for 2 minutes. This current (I₀) represents uninhibited enzyme activity.
- Inhibition Phase: Incubate biosensor in sample containing suspected OPs for 15 minutes. Rinse gently with PBS to remove unbound pesticides.
- Post-Inhibition Measurement: Measure amperometric current (Iᵢ) again under identical conditions as step 3.
- Calculation: Calculate inhibition percentage as: % Inhibition = [(I₀ - Iᵢ)/I₀] × 100
- Quantification: Compare inhibition percentage to calibration curve prepared with standard OP solutions.
Performance Parameters:
- Detection limit: 0.38 pM for specific OPs [12]
- Linear range: 0.1-100 nM
- Total analysis time: 25 minutes
- Recovery in spiked apple samples: 95-105%
Protocol 2: Aptamer-Based Optical Biosensor for Neonicotinoid Pesticides
Principle: This protocol employs fluorescently-labeled DNA aptamers that undergo conformational changes upon binding to neonicotinoid pesticides, resulting in measurable fluorescence alterations [15].
Materials:
- Fluorescently-labeled aptamer specific to imidacloprid
- Tris buffer (10 mM, pH 7.4 with 5 mM MgCl₂)
- Quencher-labeled complementary DNA (for quenching-based detection)
- Fluorometer or fluorescence microplate reader
- Solid support for aptamer immobilization (e.g., magnetic beads)
- Washing buffer (Tris with 0.05% Tween-20)
Procedure:
- Aptamer Preparation: Denature aptamer solution at 95°C for 5 minutes, then slowly cool to room temperature for proper folding.
- Immobilization: Immobilize thiol-modified aptamers on gold surfaces or magnetic beads via gold-thiol chemistry. Block nonspecific sites with 1% BSA for 1 hour.
- Sample Incubation: Incubate immobilized aptamers with sample solutions for 20 minutes with gentle shaking.
- Washing: Remove unbound analytes by washing three times with washing buffer.
- Signal Measurement: Measure fluorescence intensity at excitation/emission wavelengths specific to the fluorophore used.
- Quantification: Generate calibration curve by plotting fluorescence intensity against pesticide concentration.
Performance Parameters:
- Detection limit: 0.1 nM for imidacloprid
- Specificity: Minimal cross-reactivity with other pesticides
- Analysis time: 30 minutes
- Applicable to fruit and vegetable samples
Research Reagent Solutions for Multiplex Pesticide Detection
Table 3: Essential Research Reagents for Biosensor Development
| Reagent Category | Specific Examples | Function in Biosensor | Key Characteristics |
|---|---|---|---|
| Recognition Elements | Acetylcholinesterase, Anti-parathion antibodies, DNA aptamers | Molecular recognition of specific pesticide classes | Determines specificity, shelf life, operating conditions [12] [15] |
| Signal Transducers | Screen-printed electrodes, Gold SPR chips, Quantum dots, Carbon nanotubes | Convert binding events to measurable signals | Determine sensitivity, detection limit, signal-to-noise ratio [12] [11] |
| Immobilization Matrices | Chitosan, Nafion, Sol-gels, Self-assembled monolayers | Stabilize recognition elements on transducer surface | Affect bioreceptor activity, sensor stability, response time [11] |
| Signal Amplifiers | Enzymes (HRP, AP), Metal nanoparticles, Polymer beads | Enhance detection signals for lower detection limits | Improve sensitivity, enable visual detection, reduce instrument requirements [12] [16] |
| Sample Preparation Kits | QuEChERS kits, Solid-phase extraction cartridges | Extract and clean up pesticides from complex matrices | Improve accuracy, reduce matrix effects, concentrate analytes [17] |
Advanced Signaling Pathways in Biosensor Detection
The fundamental principles of biosensors revolve around the sophisticated integration of biological recognition elements with appropriate transduction mechanisms. For multiplex pesticide detection, the strategic selection and combination of these components determines the analytical performance, including sensitivity, specificity, and multiplexing capability. Current research trends indicate a movement toward miniaturized, portable devices incorporating artificial intelligence for data interpretation, wearable formats for continuous monitoring, and Internet of Things (IoT) integration for real-time environmental surveillance [14] [15]. The convergence of nanotechnology, materials science, and biotechnology continues to push the boundaries of what's possible in biosensing, promising increasingly sophisticated solutions for the complex challenge of multiple pesticide residue detection in food and environmental samples. As these technologies mature, standardization of fabrication protocols and validation under real-world conditions will be essential for translating laboratory developments into practical analytical tools that can effectively safeguard public health and environmental quality.
The monitoring of multiple pesticide residues in food and environmental samples is a critical challenge for ensuring public health and safety. Multiplexing technologies, which enable the simultaneous detection and quantification of numerous analytes in a single assay, have emerged as powerful tools to address this need. These strategies offer significant advantages over traditional single-analyte methods, including reduced analysis time, lower sample volume requirements, decreased cost per analyte, and higher throughput capabilities [18]. This article explores the fundamental strategies and practical protocols for implementing multiplex detection systems, with particular focus on applications within pesticide residue analysis for research and development professionals.
Core Multiplexing Strategies
Multiplex biosensing platforms primarily employ two distinct strategic approaches: recognition element-based methods and inherent characteristic-based methods [18]. Each strategy offers unique advantages for specific application requirements in multi-analyte detection.
Recognition Element-Based Strategies
This approach relies on biological or biomimetic recognition elements with broad specificity toward multiple target compounds. The three primary categories include:
Broadly Specific Antibodies: These can be generated through four main methods: (1) generic antibodies prepared using "general-structure" immunogens that preserve common features of an entire analyte class; (2) broad-spectrum antibodies generated with multi-hapten immunogens; (3) bispecific antibodies composed of two different heavy/light chains; and (4) combinations of multiple analyte-specific antibodies [18]. Computer-assisted molecular modeling and quantitative structure-activity relationship (QSAR) studies have significantly improved the design of haptens for generating antibodies with desired broad specificity profiles [18].
Aptamers: These single-stranded DNA or RNA molecules offer advantages of thermal stability, simple production, and ease of modification compared to antibodies.
Molecular Imprinted Polymers (MIPs): These synthetic polymers contain tailor-made recognition sites that mimic natural antibodies, offering excellent stability and customizability.
Inherent Characteristic-Based Strategies
This alternative approach leverages the innate physical or chemical properties of target analytes without requiring specific recognition elements. Key methodologies include:
- Enzymatic inhibition-based sensors
- Near-infrared (NIR) spectroscopy
- Surface-Enhanced Raman Scattering (SERS) spectroscopy [18]
Experimental Protocols
Multiplex Immunochip Assay for Pesticide Detection
This protocol describes a membrane-based colorimetric immunochip assay for simultaneous detection of seven pesticides from six different chemical groups [19].
Materials and Reagents
- Nitrocellulose (NC) membrane
- Goat anti-mouse IgG and rabbit anti-goat IgG
- Pesticide standards (triazophos, methyl-parathion, fenpropathrin, carbofuran, thiacloprid, chlorothalonil, carbendazim)
- 2-(N-morpholino) ethanesulfonic acid (MES) buffer
- Bovine serum albumin (BSA)
- Chloroauric acid
- Nanogold enhancement solution
- Primary secondary amine (PSA) and C18 sorbents
Procedure
Chip Fabrication:
- Spot seven pesticide antigens as capture probes on designated positions of the NC membrane
- Include rabbit anti-goat IgG as a positive control position
- Allow spots to dry completely at room temperature for 1 hour
- Block the membrane with 1% BSA in PBS for 1 hour at 37°C to prevent nonspecific binding
Immunoassay Procedure:
- Apply 10 μL of standard or sample extract to each antigen spot
- Immediately add 10 μL of primary antibody mixture (containing specific antibodies for all seven pesticides)
- Incubate at 37°C for 30 minutes in a humidified chamber
- Wash the membrane three times with PBS containing 0.05% Tween-20 (PBST)
Signal Development:
- Add nanogold-labeled secondary antibody solution (gold-conjugated anti-species IgG)
- Incubate at 37°C for 20 minutes
- Wash with PBST followed by deionized water
- Apply nanogold enhancement solution for signal amplification
- Terminate the reaction by rinsing with deionized water after optimal color development (typically 4-8 minutes)
Signal Detection:
- Capture chip images using a flatbed scanner or digital camera
- Analyze spot intensity using image analysis software (e.g., ImageJ)
- Generate calibration curves for each pesticide by plotting normalized intensity (B/B₀) against logarithm of concentration
- Calculate sample concentrations using the established calibration curves
Performance Characteristics: The immunochip assay demonstrates detection limits of 0.02–6.45 ng mL⁻¹ for the seven pesticides, with visual detection limits ranging from 1 to 100 ng mL⁻¹ [19]. Recovery tests in spiked vegetable and fruit samples validate the method's accuracy and precision for multi-residue screening applications.
Quantitative Performance Data
Table 1: Analytical Performance of Multiplex Detection Platforms for Pesticide Residues
| Detection Platform | Number of Analytes | Detection Limit Range | Analysis Time | Key Applications |
|---|---|---|---|---|
| Immunochip Assay [19] | 7 pesticides | 0.02–6.45 ng mL⁻¹ | < 60 minutes | Vegetables, fruits |
| Fluorescent LFIA [18] | 7 β-agonists | Not specified | Rapid screening | Food safety |
| icELISA [18] | 5 antibacterial synergists | 0.067–0.139 μg/L | Standard ELISA time | Food analysis |
| dcELISA [18] | 5 antibacterial synergists | 0.208–9.24 μg/L | Shorter than icELISA | Food analysis |
| Chemiluminescence ELISA [18] | 21 FQs | 0.10–33.83 ng/mL | Standard ELISA time | Milk samples |
Table 2: Research Reagent Solutions for Multiplex Biosensor Development
| Reagent Category | Specific Examples | Function in Assay |
|---|---|---|
| Recognition Elements | Generic antibodies, Aptamers, MIPs [18] | Target capture and specificity |
| Signal Transducers | Colloidal gold nanorods, Fluorochromes [20] [21] | Signal generation and amplification |
| Solid Supports | Nitrocellulose membrane, Modified glass slides [19] | Platform for probe immobilization |
| Blocking Agents | BSA, Casein, Skim milk [19] | Minimize nonspecific binding |
| Enhancement Reagents | Nanogold enhancers, Silver stains [19] | Signal amplification |
| Biological Buffers | MES, PBS, Carbonate-bicarbonate [19] | Maintain optimal assay conditions |
Visual Workflows
Multiplex Strategy Selection Workflow - This diagram illustrates the decision pathway for selecting appropriate multiplex detection strategies based on sample characteristics and analytical requirements.
Immunochip Experimental Protocol - This workflow details the step-by-step procedure for performing multiplex pesticide detection using the membrane-based immunochip platform with nanogold signal enhancement.
Multiplex biosensors represent a transformative advancement in analytical technology, enabling the simultaneous detection and quantification of multiple analytes in a single assay. Within the critical field of pesticide residue research, these systems address fundamental limitations of traditional methods by integrating high-throughput capabilities with portable design. The core advantages of multiplex biosensors—exceptional speed, significant cost-reduction, and true on-site operational capability—are revolutionizing monitoring approaches across the "tea garden-to-cup" supply chain and other agricultural sectors [2]. This Application Note delineates the quantitative benefits of these technologies and provides detailed protocols for their implementation in pesticide residue detection, framed within a broader thesis on advanced detection methodologies.
Core Advantages: A Quantitative Comparison
The transition from conventional, single-analyte techniques to multiplexed platforms offers demonstrable and significant improvements in key performance metrics. The following table summarizes the comparative advantages of multiplex biosensors over traditional detection methods.
Table 1: Comparative Analysis of Pesticide Residue Detection Technologies
| Technology Feature | Traditional Methods (GC-MS/LC-MS) | Multiplexed Biosensors | Practical Implication for Research |
|---|---|---|---|
| Analysis Time | 30 minutes to several hours per sample [2] | 5–30 minutes per multi-analyte profile [2] | High-throughput screening; rapid iteration for kinetic studies |
| Detection Limit | ~0.002–0.5 mg/kg (GC-MS) [22] | < 0.0012 μM (for pesticides) [23] | Ultra-sensitive detection for trace-level residue analysis |
| Multiplexing Capacity | Typically single-analyte or targeted MRM | Simultaneous detection of 7+ pesticides [23] | Identification of mixed contamination profiles with a single test |
| Portability | Laboratory-bound, benchtop systems | Portable, handheld devices enabled | True on-site analysis in fields and processing facilities |
| Cost per Data Point | High (equipment > $1M, skilled operator) [2] | Significantly lower, minimal reagent use [24] | Enables large-scale spatial and temporal monitoring studies |
Detailed Experimental Protocols
Protocol 1: Nanozyme-Based Colorimetric Sensor Array for Multi-Pesticide Detection
This protocol details the creation of a colorimetric sensor array using self-assembled copper-amino acid (Cu-AC) nanozymes, capable of discriminating seven different pesticides with limits of detection below 0.0012 μM [23].
Research Reagent Solutions:
- Cu-AC Nanozymes: Sensing units with tunable laccase-mimic activity, self-assembled from Cu²⁺ ions and amino acids (L-leucine, L-isoleucine, L-phenylalanine) [23].
- Chromogenic Substrate: A solution containing 2,4-dichlorophenol (2,4-DP) and 4-aminoantipyrine (4-AP) [23].
- Pesticide Standards: Analytical-grade target pesticides in a suitable solvent (e.g., methanol).
- Buffer Solution: Acetate buffer (0.1 M, pH 4.5) for optimal nanozyme activity.
Procedure:
- Sensor Array Fabrication:
- Prepare three distinct Cu-AC nanozyme suspensions (Cu-Leu, Cu-Ile, Cu-Phe) in acetate buffer.
- Dispense 50 μL of each nanozyme suspension into separate wells of a 96-well microplate to form the three-element sensor array.
- Assay Execution:
- Add 50 μL of the chromogenic substrate solution (2,4-DP + 4-AP) to each well.
- Introduce 100 μL of the sample (or pesticide standard) into each well.
- Incubate the microplate at 25°C for 15 minutes to allow the colorimetric reaction to proceed.
- Signal Acquisition:
- Capture an image of the entire microplate using a standard flatbed scanner or a smartphone under controlled lighting conditions.
- Extract the Red-Green-Blue (RGB) values from each well using image processing software (e.g., ImageJ).
- Data Analysis:
- Compile the RGB values from the three sensing units for each sample to create a unique fingerprint.
- Input the fingerprint data into a pre-trained Linear Discriminant Analysis model for pesticide classification.
- For automated, high-confidence identification, use a YOLOv8 deep learning algorithm trained on LDA plot images, achieving a mean average precision of up to 0.99 [23].
- Sensor Array Fabrication:
Protocol 2: Multiplexed Electrochemical Biosensor for High-Specificity Detection
This protocol outlines a multiplexed sensing platform using metal nanoparticles and Y-shaped DNA structures, exemplifying a strategy that can be adapted for the specific detection of pesticide residues [25].
Research Reagent Solutions:
- Metal Nanoparticles (MNPs): AgNPs, PtFeNPs, and AuNPs, functionalized with specific molecular recognition elements (e.g., antibodies or aptamers) [25].
- Y-shaped DNA Probes: Synthetic DNA structures designed for simultaneous target capture and signal amplification [25].
- Electrode Chip: A multi-working electrode system (e.g., screen-printed carbon or gold electrodes).
- Buffer Solutions: PBS (10 mM, pH 7.4) for immobilization and assay steps.
Procedure:
- Probe Immobilization:
- Immobilize the Y-shaped DNA structures onto the predefined working electrodes of the chip.
- Conjugate the different metal nanoparticles (AgNPs, PtFeNPs, AuNPs) with their respective detection probes (e.g., antibodies against specific pesticides).
- Assay Execution:
- Apply the sample to the electrode chip and incubate for 20 minutes to allow the target pesticides to bind to the Y-DNA and form sandwich complexes with the MNP-labeled probes.
- Wash the chip thoroughly with PBS buffer to remove unbound reagents.
- Signal Transduction and Readout:
- Place the chip in an electrochemical reader containing an appropriate electrolyte solution.
- Perform square wave voltammetry (SWV) or differential pulse voltammetry (DPV).
- Measure the distinct redox currents from each metal nanoparticle (e.g., Ag⁺, Pt²⁺, Au³⁺) at their characteristic oxidation potentials.
- Data Analysis:
- The magnitude of each specific current peak is directly proportional to the concentration of the corresponding pesticide target, enabling simultaneous quantification [25].
- Probe Immobilization:
Technology Workflow and Data Integration
The operational pipeline of a multiplex biosensor, from sample to result, integrates material science, biorecognition, and advanced data analytics. The following diagram visualizes this integrated workflow.
Diagram 1: Integrated Workflow of a Multiplex Biosensor Platform. This diagram illustrates the seamless integration of sample introduction, biorecognition, signal transduction, and intelligent data processing that characterizes modern multiplex biosensor systems.
The Scientist's Toolkit: Essential Research Reagents
Successful implementation of multiplex biosensors relies on a suite of specialized materials and reagents. The following table catalogues the core components central to the experimental protocols and the broader field.
Table 2: Essential Reagents for Multiplex Biosensor Research and Development
| Research Reagent | Core Function | Exemplar Use Case |
|---|---|---|
| Nanozymes (e.g., Cu-AC) | Mimics natural enzyme activity; serves as a highly tunable and stable sensing unit for colorimetric reactions. | Core element in colorimetric sensor arrays for discriminating multiple pesticides via unique activity profiles [23]. |
| Functionalized Metal Nanoparticles (Au, Ag, PtFe) | Acts as an electrochemical label; provides distinct, resolvable redox signals for multiplexed detection. | Used as labels in electrochemical biosensors for simultaneous discrimination of multiple targets [25]. |
| Biological Recognition Elements (Antibodies, Aptamers) | Provides high specificity and affinity for binding to target analytes (e.g., a specific pesticide). | Immobilized on sensor surfaces or nanoparticles to capture specific targets from a complex sample matrix [26] [24]. |
| Y-shaped DNA Nanostructures | Provides a programmable scaffold for simultaneous target capture and signal probe attachment, enhancing assay efficiency. | Used in electrochemical biosensors to create a structured platform for forming detection complexes [25]. |
| Cell-Free Protein Expression Systems | Enables on-chip synthesis of functional protein arrays directly from DNA, bypassing costly protein purification. | Facilitates high-throughput, label-free kinetic screening of thousands of protein interactions on platforms like SPOC [27]. |
Nanomaterial-Enhanced Sensing Platforms: From Fluorescence to Electrochemical Detection
The detection of multiple pesticide residues represents a significant challenge in ensuring food safety and environmental health. Optical biosensing technologies have emerged as powerful tools to address this challenge, offering rapid, sensitive, and specific detection capabilities that are essential for monitoring the complex mixtures of pesticides found in agricultural products [2] [28]. These sensing strategies leverage the interactions between light and matter to transduce molecular recognition events into measurable signals, enabling the quantification of trace-level contaminants [29]. The integration of these technologies with advanced nanomaterials has dramatically enhanced their performance, pushing detection limits to parts-per-billion or even parts-per-trillion levels while enabling multiplexed analysis of several pesticides simultaneously [28] [12]. This application note provides a detailed overview of four principal optical biosensing strategies—fluorescence (including FRET and MEF), Surface-Enhanced Raman Spectroscopy (SERS), colorimetry, and Surface Plasmon Resonance (SPR)—within the context of multiplex detection platforms for pesticide residue analysis. We present standardized protocols, analytical performance comparisons, and implementation guidelines to facilitate the adoption of these methodologies in research and development settings focused on agricultural safety monitoring.
Fundamental Principles and Signaling Mechanisms
Core Sensing Modalities
Fluorescence-based sensing operates on the principle that certain molecules (fluorophores) absorb light at specific wavelengths and subsequently emit light at longer wavelengths. This process can be modulated through mechanisms such as FRET (Förster Resonance Energy Transfer), where energy non-radiatively transfers from a donor fluorophore to an acceptor molecule through dipole-dipole coupling, and MEF (Metal-Enhanced Fluorescence), where fluorophores interacting with plasmonic metallic nanostructures exhibit significantly enhanced emission intensities [29] [30]. These mechanisms are particularly valuable for pesticide detection as they can signal binding events or enzymatic activity inhibition with high sensitivity.
Surface-Enhanced Raman Spectroscopy (SERS) leverages the enormous enhancement of Raman scattering signals (typically 10⁶-10⁸ fold) observed when target molecules are adsorbed onto or in close proximity to nanostructured noble metal surfaces (primarily Au and Ag) [28]. This enhancement arises from electromagnetic mechanisms (localized surface plasmon resonances) and chemical mechanisms (charge transfer), enabling the acquisition of distinct molecular "fingerprint" spectra even at trace concentrations, which is ideal for identifying specific pesticide compounds in complex mixtures [28].
Colorimetric sensing relies on visually detectable color changes induced by the interaction between target pesticides and recognition elements, often mediated by functional nanomaterials such as gold and silver nanoparticles [31]. These color changes can result from various mechanisms including nanoparticle aggregation, redox reactions, or enzyme-mediated chromogenic reactions, providing a simple yet effective detection method suitable for point-of-care testing [31] [28].
Surface Plasmon Resonance (SPR) detects changes in the refractive index occurring at the surface of a thin metal film (typically gold) when target molecules bind to immobilized recognition elements [29] [28]. This interaction alters the angle or wavelength at which surface plasmons are excited, enabling real-time, label-free monitoring of binding kinetics and affinity, which is valuable for characterizing pesticide-receptor interactions [29].
Visualizing Biosensing Mechanisms
The following diagrams illustrate the fundamental working principles and signaling pathways of the four optical biosensing strategies discussed.
Research Reagent Solutions and Essential Materials
Table 1: Essential Research Reagents for Optical Biosensing of Pesticides
| Category | Specific Materials | Function/Application | Key Characteristics |
|---|---|---|---|
| Nanomaterials | Gold nanoparticles (AuNPs), Silver nanoparticles (AgNPs), Quantum Dots (QDs) [31] [12] | Signal generation/enhancement; Colorimetric, fluorescence, and SERS probes | Tunable LSPR properties; High extinction coefficients; Size/shape-dependent optical properties |
| Recognition Elements | Acetylcholinesterase (AChE) enzyme, Antibodies, Aptamers, Molecularly Imprinted Polymers (MIPs) [12] | Target-specific binding; Enzyme inhibition assays | High specificity and affinity; Stability under varying conditions; Reusability for MIPs |
| Signal Amplification Reagents | Nanozymes (e.g., CuO NPs), Single-Atom Nanozymes (SAzymes), Catalytic nanoparticles (Au/Pt) [12] [30] | Signal amplification; Enhanced detection sensitivity | Peroxidase-like activity; Higher stability than natural enzymes; Tunable catalytic properties |
| Substrate Materials | SPR gold chips, SERS-active substrates (Au/Ag nanostructures), Microfluidic chips, Filter paper [31] [28] | Sensor platform; Sample containment and flow | Low autofluorescence; Controlled surface chemistry; Reproducible nanostructuring |
| Detection Reagents | Chromogenic substrates (TMB, OPD), Fluorogenic substrates, Enzyme substrates (acetylthiocholine) [12] [30] | Signal generation in presence of target | High turnover rates; Distinct color/fluorescence changes; Low background interference |
Comparative Performance Analysis of Optical Biosensing Techniques
Table 2: Quantitative Performance Comparison of Optical Biosensing Techniques for Pesticide Detection
| Technique | Detection Limit | Analysis Time | Multiplexing Capability | Key Advantages | Primary Limitations |
|---|---|---|---|---|---|
| Fluorescence (FRET/MEF) | pM-fM range [30] | 10-60 minutes [12] | Moderate to High | Ultra-high sensitivity; Real-time monitoring; Ratiometric capabilities | Photobleaching potential; Background autofluorescence interference |
| SERS | Single-molecule to nM range [28] | 5-30 minutes [2] | High | Molecular fingerprinting; Multiplex detection; Minimal sample preparation | Substrate reproducibility; Signal uniformity challenges |
| Colorimetry | nM-µM range [31] [12] | 5-30 minutes [2] [31] | Low to Moderate | Visual detection; Instrument-free potential; Cost-effectiveness | Lower sensitivity compared to other methods; Matrix interference in complex samples |
| SPR | pM-nM range [29] [28] | Real-time (minutes) | Moderate | Label-free detection; Kinetic parameter measurement; High specificity | Bulk refractive index sensitivity; Nonspecific binding interference |
Experimental Protocols and Methodologies
Fluorescence-Based Detection Protocol for Organophosphorus Pesticides
Principle: This protocol utilizes enzyme inhibition-based fluorescence detection, where organophosphorus pesticides inhibit acetylcholinesterase (AChE) activity, reducing the production of fluorescent products [12].
Materials and Reagents:
- Acetylcholinesterase (AChE) enzyme solution (0.5 U/mL)
- Acetylthiocholine (ATCh) substrate solution (5 mM)
- Quantum dots (CdTe) or fluorogenic substrate
- Phosphate buffer (0.1 M, pH 7.4)
- Standard pesticide solutions for calibration
- Microfluidic device or 96-well microplate [12]
Procedure:
- Sample Preparation: Homogenize agricultural samples (fruits, vegetables) and extract pesticides using appropriate solvent systems (e.g., acetonitrile). Filter through 0.22 µm membrane.
- Enzyme Inhibition: Mix 50 µL of sample extract with 50 µL of AChE solution in buffer. Incubate at 37°C for 20 minutes.
- Substrate Addition: Add 50 µL of ATCh substrate solution and incubate for additional 10 minutes at 37°C.
- Signal Development: Introduce 50 µL of quantum dot solution or fluorogenic substrate. For QD-based detection, thiocholine produced from ATCh hydrolysis quenches QD fluorescence, while pesticides inhibit AChE, preventing fluorescence quenching [12].
- Measurement: Record fluorescence intensity using microplate reader or microfluidic detector (Ex/Em: 360/450 nm for common fluorogenic substrates).
- Quantification: Generate calibration curve with pesticide standards (0.1-1000 ppb). Calculate unknown concentrations from the standard curve.
Notes: This method achieved LOD of 0.38 pM for organophosphorus pesticides in apple samples [12]. For enhanced sensitivity, metal-enhanced fluorescence (MEF) substrates can be incorporated to boost signal intensity [30].
SERS-Based Multiplex Detection Protocol for Pesticide Residues
Principle: This protocol employs SERS-active substrates to enhance Raman signals of pesticide molecules, enabling simultaneous detection of multiple residues through their unique spectral fingerprints [28].
Materials and Reagents:
- SERS-active substrate (Au or Ag nanostructures on silicon/silica)
- Portable Raman spectrometer with 785 nm or 633 nm laser
- Standard solutions of target pesticides
- Extraction solvents (methanol, acetonitrile)
- Centrifugal filtration devices (3 kDa MWCO)
Procedure:
- Substrate Preparation: Fabricate SERS substrates using electron beam lithography, nanoimprinting, or chemical synthesis of Au/Ag nanoparticles on solid supports.
- Sample Extraction: Extract pesticides from agricultural products using QuEChERS method or solid-phase extraction. Concentrate extracts using nitrogen evaporation.
- Sample Application: Apply 2-5 µL of concentrated extract to SERS substrate. Allow to dry at room temperature.
- SERS Measurement: Focus laser spot on sample area. Acquire spectra with integration time of 10-30 seconds. Collect multiple spectra from different spots for statistical analysis.
- Spectral Processing: Preprocess spectra by subtracting background, smoothing, and vector normalization.
- Multiplex Analysis: Employ chemometric methods (PCA, PLS-DA) to deconvolute overlapping peaks from multiple pesticides. Develop multivariate calibration models using reference standards.
Notes: Key to this method is substrate reproducibility and signal uniformity. Core-shell nanoparticles (Au@Ag) can provide enhanced stability and SERS activity. Integration with microfluidics enables automated sample delivery and washing steps [28].
Colorimetric Nanozyme-Based Detection Protocol
Principle: This protocol utilizes nanozymes (nanomaterial-based enzyme mimics) that catalyze color-changing reactions, with pesticides modulating this catalytic activity [31] [12].
Materials and Reagents:
- Copper oxide nanoparticles (CuO NPs) or other nanozymes
- Colorimetric substrate (TMB, ABTS)
- Hydrogen peroxide (H₂O₂) solution
- Acetate buffer (0.1 M, pH 4.0)
- Paper-based analytical devices
- Smartphone with color analysis app
Procedure:
- Nanozyme Synthesis: Prepare CuO NPs through chemical precipitation: mix copper chloride with NaOH, collect precipitate by centrifugation, wash, and resuspend in water [12].
- Device Fabrication: Create paper-based microfluidic devices by wax printing or cutting. Spot nanozyme solution onto detection zones.
- Sample Preparation: Extract pesticides from tea leaves or other crops using simplified extraction procedure.
- Assay Assembly: Mix 10 µL sample extract with 10 µL H₂O₂ solution and 10 µL TMB substrate solution. Apply to sample pad of paper device.
- Color Development: Allow reaction to proceed for 10 minutes at room temperature. Pesticides inhibit nanozyme activity, reducing color intensity proportionally to concentration.
- Signal Detection: Capture device image using smartphone camera. Analyze RGB values using ImageJ or custom app. Calculate pesticide concentration from standard curve.
Notes: This system achieved LOD of 0.08 mg/L for malathion with ~10 minute analysis time [12]. For quantitative precision, include color reference standards on each device to correct for lighting variations.
SPR-Based Binding Assay for Pesticide Detection
Principle: This protocol employs SPR to monitor direct binding between pesticides and immobilized recognition elements (antibodies, aptamers) in real-time without labeling [29] [28].
Materials and Reagents:
- SPR instrument with gold sensor chips
- Carboxymethyl dextran-coated sensor chips
- EDC/NHS crosslinking reagents
- Recognition elements (antibodies, aptamers)
- Running buffer (HEPES with surfactant)
- Regeneration solution (glycine-HCl, pH 2.5)
Procedure:
- Surface Functionalization: Activate carboxymethyl dextran sensor chip surface with EDC/NHS mixture for 7 minutes.
- Ligand Immobilization: Dilute recognition element (antibody/aptamer) in sodium acetate buffer (pH 5.0). Inject over activated surface for 15-30 minutes to achieve desired immobilization level.
- Blocking: Deactivate remaining active esters with ethanolamine-HCl injection.
- Equilibration: Condition surface with multiple injections of regeneration solution until stable baseline achieved.
- Sample Analysis: Dilute pesticide samples in running buffer. Inject samples over functionalized surface at flow rate of 30 µL/min for 3-5 minutes association phase.
- Dissociation Monitoring: Continue buffer flow for 5-10 minutes to monitor dissociation.
- Surface Regeneration: Inject regeneration solution for 30 seconds to remove bound analytes.
- Data Analysis: Determine binding response in resonance units (RU). Calculate kinetic parameters (kₐ, kḍ, Kᴅ) using appropriate binding models.
Notes: SPR enables real-time monitoring of pesticide-antibody interactions with pM-nM sensitivity [29]. Reference flow cell should be similarly prepared without recognition element to correct for bulk refractive index changes and nonspecific binding.
Implementation Workflow for Multiplexed Detection
The following diagram illustrates a comprehensive experimental workflow integrating multiple optical biosensing strategies for multiplexed pesticide detection, from sample preparation to data analysis.
Optical biosensing strategies offer powerful approaches for multiplex detection of pesticide residues, each with distinct advantages and optimal application scenarios. Fluorescence techniques provide ultra-sensitive detection, SERS enables specific molecular identification, colorimetry offers simplicity and field-deployment potential, and SPR permits label-free binding characterization. The integration of these complementary techniques within a unified analytical framework, supported by advanced nanomaterials and AI-enhanced data processing, represents the future of pesticide monitoring technology [28] [32]. Emerging trends include the development of smartphone-integrated portable detection systems, self-validating dual-mode sensors, and AI-optimized nanomaterial designs that collectively promise to transform pesticide residue analysis from laboratory settings to point-of-need applications across the food supply chain [28]. As these technologies continue to mature, their implementation in standardized monitoring protocols will significantly enhance our capability to ensure food safety and protect public health through comprehensive pesticide residue surveillance.
Electrochemical biosensors represent a powerful class of analytical devices that combine the specificity of biological recognition elements with the sensitivity of electrochemical transducers. These systems are particularly valuable for detecting pesticide residues in complex matrices due to their robustness, potential for miniaturization, excellent detection limits, and ability to function in turbid biofluids [33]. Within this domain, potentiostatic and impedimetric detection methods have emerged as prominent techniques for quantifying biochemical interactions. Potentiostatic methods, such as amperometry and cyclic voltammetry, operate by applying a constant potential to an electrochemical cell and measuring the resulting current generated from redox reactions. In contrast, impedimetric techniques monitor changes in the electrical impedance at the electrode-solution interface, providing a label-free approach to detecting binding events [34]. The integration of these detection principles with advanced nanomaterials and biorecognition elements has significantly enhanced the performance of biosensing platforms, enabling the sensitive, selective, and multiplexed detection required for comprehensive pesticide residue analysis in environmental and food safety monitoring [35] [22].
Theoretical Foundations and Detection Mechanisms
Potentiostatic Detection Principles
Potentiostatic detection methods encompass a range of techniques where the potential between the working and reference electrodes is maintained at a constant value while the current is measured. The most common potentiostatic methods include amperometry, chronoamperometry, and cyclic voltammetry (CV). In amperometric biosensors, the current resulting from the electrochemical oxidation or reduction of an electroactive species is monitored at a constant applied potential. This current is directly proportional to the concentration of the analyte. A prime example is the glucose biosensor, where the enzymatic reaction produces hydrogen peroxide, which is then oxidized at the electrode surface, generating a measurable current [33]. Cyclic voltammetry involves scanning the potential linearly with time while measuring the current, providing information about redox potentials and reaction kinetics of electrochemical processes. These techniques are widely employed in biosensing due to their high sensitivity, relatively simple instrumentation, and well-established theoretical foundations [33].
Impedimetric Detection Principles
Impedimetric biosensors function by monitoring changes in the electrical impedance of the electrode-solution interface, which comprises both resistive and capacitive components. Electrical impedance spectroscopy (EIS) serves as the primary technique for these measurements, applying a small amplitude AC potential across a range of frequencies and analyzing the system's response [34]. Impedimetric biosensors are broadly categorized into faradaic and non-faradaic systems. Faradaic impedimetric biosensors utilize a redox probe in the solution, such as ferro/ferricyanide, and measure changes in charge transfer resistance (Rct) upon target binding. Non-faradaic systems operate without redox reactions, instead relying on changes in the electrical double-layer capacitance (Cdl) caused by binding events [34]. This label-free approach is particularly advantageous for detecting biomolecular interactions in their native state, preserving sample integrity while enabling real-time monitoring of binding events. The exceptional versatility of impedimetric biosensors supports various recognition elements, including antibodies, aptamers, enzymes, and molecularly imprinted polymers (MIPs), making them highly adaptable for pesticide residue detection [34].
Comparative Analysis of Detection Techniques
Table 1: Comparison of Electrochemical Detection Techniques for Biosensing Applications
| Parameter | Amperometric/Potentiostatic | Impedimetric |
|---|---|---|
| Detection Principle | Measures current from redox reactions at constant potential | Measures changes in electrical impedance (resistance and capacitance) |
| Sensitivity | High (nM-pM range) | Very High (pM-fM range demonstrated) |
| Label Requirement | Often requires enzyme labels or redox mediators | Label-free detection possible |
| Measurement Complexity | Moderate | Requires frequency analysis in EIS |
| Real-time Monitoring | Limited for some configurations | Excellent for real-time, label-free monitoring |
| Impact on Sample | May require sample modification with redox probes | Minimal sample preparation; measures native state |
| Primary Applications | Enzyme-based sensors, metabolic markers | Affinity-based detection (immunosensors, DNA sensors), kinetic studies |
Experimental Protocols for Pesticide Detection
Protocol 1: Impedimetric Aptasensor for Organophosphorus Pesticides
This protocol details the development of a faradaic impedimetric biosensor for the detection of chlorpyrifos and other organophosphorus pesticides using a gold electrode platform with aptamer recognition elements [22] [34].
Materials and Reagents:
- Gold working electrode (2 mm diameter)
- Phosphate Buffered Saline (PBS, 0.1 M, pH 7.4)
- [Fe(CN)₆]³⁻/⁴⁻ redox probe (5 mM in PBS)
- Thiol-modified aptamer specific to target pesticide (100 μM stock in TE buffer)
- 6-Mercapto-1-hexanol (MCH, 1 mM in PBS)
- Pesticide standards for calibration
- Ethanol (absolute) for cleaning
- Deionized water (18.2 MΩ·cm)
Experimental Procedure:
Electrode Pretreatment:
- Polish the gold electrode with 0.3 μm and 0.05 μm alumina slurry sequentially on a microcloth pad.
- Rinse thoroughly with deionized water between polishing steps.
- Electrochemically clean in 0.5 M H₂SO₄ by cycling the potential between 0 V and 1.5 V (vs. Ag/AgCl) until a stable cyclic voltammogram is obtained.
- Rinse with deionized water and dry under nitrogen stream.
Aptamer Immobilization:
- Incubate the cleaned gold electrode with 100 μL of 1 μM thiol-modified aptamer solution in PBS at 4°C for 16 hours.
- Rinse with PBS to remove loosely bound aptamers.
- Backfill with 1 mM MCH for 1 hour to block uncovered gold surfaces.
- Wash thoroughly with PBS to remove excess MCH.
Impedance Measurements:
- Record EIS spectra in 5 mM [Fe(CN)₆]³⁻/⁴⁻ solution with frequency range from 0.1 Hz to 100 kHz at open circuit potential.
- Use amplitude of 10 mV for AC perturbation.
- Measure charge transfer resistance (Rct) from Nyquist plot fittings.
- Establish calibration curve by measuring Rct changes with varying pesticide concentrations (0.1 pg/mL to 100 ng/mL).
Data Analysis:
- Fit EIS data using appropriate equivalent circuit model.
- Plot ΔRct (Rct after binding - Rct before binding) versus logarithm of pesticide concentration.
- Calculate limit of detection (LOD) using 3σ/slope method.
Protocol 2: Multiplexed Potentiostatic Sensor for Azole Fungicides
This protocol describes the development of a multiplexed potentiostatic biosensor for simultaneous detection of multiple azole-containing fungicides using enzyme inhibition principles, suitable for integration into microfluidic platforms for field testing [35] [33].
Materials and Reagents:
- Screen-printed carbon electrode (SPCE) arrays
- Acetylcholinesterase (AChE) enzyme solution (5 U/mL in PBS)
- Chitosan solution (1% w/v in 1% acetic acid)
- Gold nanoparticles (20 nm diameter)
- Substrate solution: Acetylthiocholine iodide (ATCH, 5 mM in PBS)
- Detection solution: 5,5'-Dithiobis(2-nitrobenzoic acid) (DTNB, 0.1 mM in PBS)
- Azole fungicide standards (triadimefon, propiconazole, etc.)
- Bovine serum albumin (BSA, 1% w/v in PBS)
Experimental Procedure:
Electrode Modification:
- Deposit 5 μL of chitosan-gold nanoparticle composite onto each SPCE working electrode.
- Dry at room temperature for 2 hours.
- Immobilize AChE by depositing 3 μL of enzyme solution onto modified electrodes.
- Cross-link with 2 μL of 2.5% glutaraldehyde solution for 30 minutes.
- Block non-specific sites with 5 μL of 1% BSA for 1 hour.
Inhibition Assay:
- Incubate modified electrodes with 50 μL of pesticide standards of varying concentrations for 15 minutes at 25°C.
- Rinse gently with PBS to remove unbound pesticides.
- Add 50 μL of substrate detection mixture (ATCH + DTNB) to each electrode.
- Incubate for 10 minutes for enzymatic reaction.
Amperometric Measurement:
- Apply constant potential of +0.5 V (vs. Ag/AgCl reference) to working electrodes.
- Measure steady-state current generated from thiocholine oxidation.
- Record current values after stabilization (typically 60 seconds).
- Calculate inhibition percentage: % Inhibition = [(I₀ - I)/I₀] × 100, where I₀ is current without inhibitor and I is current with inhibitor.
Multiplexed Detection:
- Functionalize different electrodes in array with varying enzyme isoforms for differential detection.
- Employ statistical pattern recognition for identifying specific azole compounds.
- Generate heat maps of inhibition profiles for pesticide mixture analysis.
The Scientist's Toolkit: Essential Research Reagents and Materials
Table 2: Key Research Reagent Solutions for Electrochemical Biosensor Development
| Reagent/Material | Function/Application | Example Specifications |
|---|---|---|
| Gold Electrodes | Working electrode substrate; enables thiol-based bioconjugation | 2 mm diameter, polished to 0.05 μm finish |
| Screen-Printed Electrodes (SPCEs) | Disposable, cost-effective sensor platforms; ideal for field testing | Carbon working, silver reference, carbon counter electrodes |
| Thiol-modified Aptamers | Biorecognition elements for specific pesticide binding | 25-40 nucleotides, 5'- or 3'-thiol modification, HPLC purified |
| Acetylcholinesterase (AChE) | Enzyme for inhibition-based pesticide detection | 500-1000 U/mg protein, electric eel source |
| [Fe(CN)₆]³⁻/⁴⁻ Redox Probe | Electron mediator for faradaic impedance measurements | 5 mM in PBS, equimolar mixture |
| Chitosan | Biopolymer for enzyme immobilization and nanocomposite formation | Medium molecular weight, >75% deacetylation |
| Gold Nanoparticles (AuNPs) | Nanomaterial for signal amplification and electrode surface enhancement | 20 nm diameter, OD₁ ≈ 1 in aqueous solution |
| 6-Mercapto-1-hexanol (MCH) | Backfilling agent to form well-ordered self-assembled monolayers | 97% purity, prepared in ethanol or PBS |
Application in Multiplex Pesticide Residue Detection
The integration of potentiostatic and impedimetric detection methods into multiplexed platforms offers significant advantages for comprehensive pesticide residue analysis. Recent advances have demonstrated that electrochemical biosensors can achieve detection limits at parts-per-billion (ppb) levels for various azole-containing pesticides, with recovery rates of 90-100% in spiked food samples [35]. The strategic combination of these electrochemical techniques with complementary detection principles and signal amplification strategies represents a powerful approach for multi-residue screening [35] [22].
For multiplexed detection, electrode arrays functionalized with different biorecognition elements (enzymes, antibodies, or aptamers) enable simultaneous quantification of multiple pesticide residues. Research indicates that electroanalytical and colorimetric techniques demonstrate superior performance for pesticide detection with low percentage relative standard deviation (%RSD) and high recovery rates [35]. Furthermore, the incorporation of metallic nanoparticles as signal amplifiers can significantly boost detection sensitivity, pushing detection limits to femtogram levels for specific compounds [35] [22]. These advancements align with the growing need for field-deployable tools that meet regulatory standards for food safety while providing reliable sensitivity for both parent compounds and their metabolites [35].
The future development of electrochemical biosensing platforms for pesticide detection will likely focus on several key areas: (1) creating integrated microfluidic "sample-to-result" systems that minimize required operator expertise, (2) developing biomimetic recognition materials such as molecularly imprinted polymers for enhanced specificity and stability, and (3) implementing artificial intelligence-driven data analysis for improved pattern recognition in complex mixture analysis [22] [34]. These innovations will strengthen the role of electrochemical biosensors in comprehensive pesticide monitoring frameworks, providing crucial technological support for food safety, regulatory compliance, and environmental protection.
The detection of multiple pesticide residues presents a significant challenge in ensuring food safety and environmental health. Traditional methods like chromatography-mass spectrometry, while accurate, are often ill-suited for rapid, on-site screening due to their cost, operational complexity, and inability to perform simultaneous multi-analyte detection [36] [37]. Biosensors incorporating advanced nanomaterials have emerged as a powerful alternative, offering the potential for high sensitivity, specificity, and multiplexed analysis [38] [36].
The performance of these biosensors is profoundly enhanced by the integration of nanomaterials such as noble metals (gold and silver), carbon dots, and molybdenum disulfide (MoS₂). These materials provide exceptional electrical conductivity, catalytic activity, and optical properties, which significantly improve the transduction of biological recognition events into measurable signals [39] [40] [41]. Furthermore, their high surface-to-volume ratio allows for dense immobilization of biorecognition elements like enzymes, antibodies, and aptamers, enhancing both the stability and the detection capability of the biosensing platform [38] [40]. This document details the specific roles, experimental protocols, and application notes for these nanomaterials within the context of a research thesis focused on multiplex detection of pesticide residues, providing a practical toolkit for researchers and scientists in the field.
Nanomaterial Properties and Application Tables
Table 1: Functional Roles of Nanomaterials in Multiplex Pesticide Biosensors
| Nanomaterial | Key Properties | Role in Biosensor | Example Pesticides Detected |
|---|---|---|---|
| Noble Metals (Au, Ag) | High electrical conductivity, localized surface plasmon resonance (LSPR), biocompatibility, strong SERS enhancement [38] [40] [41]. | Signal amplification, immobilization platform for bioreceptors (e.g., via Au-thiol chemistry), colorimetric signal generation [40] [42] [36]. | Chlorpyrifos, Malathion, Acetamiprid [36] [37]. |
| Molybdenum Disulfide (MoS₂) | Two-dimensional structure, high surface area, tunable bandgap, excellent electrocatalytic activity [39] [43]. | Immobilization platform (e.g., for thiolated aptamers), enhances electrochemical sensitivity, can quench fluorescence for "signal-on" assays [39] [43]. | Broad-spectrum organophosphorus and carbamate pesticides [39]. |
| Carbon Dots | Water solubility, high charge transfer efficiency, low toxicity, can act as enzyme mimics or ECL coreactants [43]. | Fluorescent probes, electrochemiluminescence (ECL) coreactants, catalytic signal amplification [43]. | Used in systems for herbicides and organophosphates; often combined with other nanomaterials [43]. |
Table 2: Performance Comparison of Nanomaterial-Based Biosensors for Pesticide Detection
| Detection Method | Nanomaterial Used | Biorecognition Element | Target Pesticide | Limit of Detection (LOD) | Linear Range | Ref |
|---|---|---|---|---|---|---|
| Electrochemical | Gold Nanoparticles (AuNPs) | Acetylcholinesterase (AChE) | Carbamate | 1.0 nM | Not specified | [36] |
| Electrochemical | AuNPs | Aptamer | Chlorpyrifos | 36 ng L⁻¹ | Not specified | [36] |
| Fluorescence | Silver-based Nanoclusters | Aptamer | Organophosphorus (e.g., Chlorpyrifos) | 15.03 pg/mL | 20 pg/mL–1000 ng/mL | [37] |
| Colorimetric | AuNPs | Aptamer | Carbendazim (CBZ) | 2.2 nmol L⁻¹ | 2.2–500 nmol L⁻¹ | [42] |
| Electrochemilumine-scence | MoS₂ & Carbon Dots | Aptamer | (Model biomarker HER2) | 1.84 fg/mL | Wide linear range | [43] |
| Electrochemical | AChE (Enzyme) | AChE | OP pesticides (Malathion) | 2.6 pg/mL | 0.01–1 ng/mL | [37] |
Detailed Experimental Protocols
Protocol 1: Aptamer-Functionalized Gold Nanoparticle (AuNP) Sensor for Colorimetric Multiplex Detection
Principle: This protocol utilizes the aggregation of AuNPs, which induces a color change from red to blue, for the visual detection of pesticides. Aptamers, which specifically bind to target pesticides, protect the AuNPs from salt-induced aggregation. In the presence of the pesticide, the aptamer preferentially binds to its target, deprotecting the AuNPs and leading to aggregation and a color shift [42].
Materials:
- Gold Nanoparticle Solution: ~13 nm diameter, synthesized via the citrate reduction method.
- Thiolated or Amino-Modified Aptamers: Specific for target pesticides (e.g., chlorpyrifos, carbendazim).
- Salting Agent: Phosphate buffer with varying concentrations of NaCl.
- Cationic Polymer: Poly-diallyldimethylammonium chloride (PDDA) for aggregation induction [42].
- Pesticide Standards: Analytical grade for calibration.
Procedure:
- Functionalization: Incubate the AuNP solution with a specific concentration of aptamer (e.g., 5 nM) for 24 hours at 4°C to allow for self-assembly on the AuNP surface via thiol-gold chemistry.
- Stabilization: Add a stabilizing agent like bovine serum albumin (BSA) to block any remaining active surfaces on the AuNPs.
- Sample Incubation: Mix the aptamer-AuNP conjugate with the sample solution (or pesticide standard) and allow it to react for 15-30 minutes at room temperature.
- Aggregation Induction: Add a controlled volume of PDDA polymer or salt solution to the mixture.
- Signal Measurement:
- Visual Qualitative Analysis: Observe the immediate color change. A red color indicates a negative result (no pesticide), while blue indicates a positive result.
- Quantitative Analysis: Use a UV-Vis spectrophotometer to measure the absorbance ratio at A520/A620 nm. The absorbance at 520 nm (characteristic of dispersed AuNPs) decreases with aggregation, while absorbance at 620-650 nm increases.
- Multiplexing: For multiplex detection, functionalize different batches of AuNPs with aptamers specific to different pesticides. The colorimetric response can be deconvoluted using a spectrometer and a pre-established calibration model.
Data Analysis: Plot the absorbance ratio (A520/A620) against the logarithm of pesticide concentration. The limit of detection (LOD) can be calculated as three times the standard deviation of the blank signal divided by the slope of the calibration curve.
Protocol 2: MoS₂-Based Electrochemical Aptasensor for Ultrasensitive Detection
Principle: This protocol leverages the high surface area and excellent electrocatalytic properties of 2D MoS₂ nanosheets. Thiolated aptamers are immobilized on the MoS₂ surface, which is coated on an electrode. Binding of the target pesticide induces a conformational change in the aptamer, altering the electrochemical properties at the electrode interface, which is measured via electrochemical impedance spectroscopy (EIS) [39] [43].
Materials:
- Electrode: Glassy carbon electrode (GCE).
- MoS₂ Nanosheets: Synthesized via lithium intercalation and exfoliation from bulk MoS₂.
- Aptamer Solution: Thiolated aptamer specific to the target pesticide.
- Electrochemical Probe: 5mM [Fe(CN)₆]³⁻/⁴⁻ in 0.1 M KCl.
- Buffer Solutions: Phosphate buffer saline (PBS, 0.1 M, pH 7.4) for immobilization and washing.
Procedure:
- Electrode Pretreatment: Polish the GCE with 0.3 and 0.05 μm alumina slurry, followed by sequential sonication in ethanol and deionized water. Dry under nitrogen.
- Nanomaterial Modification: Disperse MoS₂ nanosheets in DMF (1 mg/mL) and drop-cast 8 μL onto the clean GCE surface. Allow to dry at room temperature.
- Aptamer Immobilization: Incubate the MoS₂/GCE with a solution of the thiolated aptamer (e.g., 1 μM) for 12-16 hours at 4°C. Thoroughly rinse with PBS to remove unbound aptamers.
- Blocking: Treat the electrode with 1% BSA for 1 hour to block non-specific binding sites.
- Target Capture: Incubate the modified electrode with the sample or standard solution containing the pesticide for 40 minutes at 37°C.
- Electrochemical Measurement: Perform EIS measurements in the presence of the [Fe(CN)₆]³⁻/⁴⁻ redox probe. Parameters: DC potential of 0.22 V, frequency range from 0.1 Hz to 100 kHz, amplitude of 5 mV.
- Multiplexing: Fabricate an array of working electrodes, each modified with MoS₂ and a unique aptamer. Use a multi-channel potentiostat to record EIS signals from each electrode simultaneously.
Data Analysis: The charge transfer resistance (Rct), derived from the diameter of the semicircle in the Nyquist plot, is the key analytical signal. The change in Rct (ΔRct) is proportional to the pesticide concentration. A calibration curve of ΔRct vs. log(concentration) is used for quantification.
Workflow and Signaling Pathway Visualizations
Multiplex Biosensor Workflow
Nanomaterial Signal Transduction Pathways
The Scientist's Toolkit: Research Reagent Solutions
Table 3: Essential Research Reagents for Nanomaterial-Based Pesticide Biosensors
| Reagent/Material | Function/Description | Example Application Note |
|---|---|---|
| Thiolated DNA Aptamers | Synthetic single-stranded DNA selected for high affinity to specific pesticides; thiol group allows for covalent binding to Au and MoS₂ surfaces [42] [43]. | Critical for creating the biorecognition layer. Must be reduced prior to use to break disulfide bonds. Optimal surface density is key for sensor performance. |
| Acetylcholinesterase (AChE) Enzyme | A biocatalytic recognition element; pesticide inhibition of its activity is the basis for detection of organophosphates and carbamates [42] [36] [37]. | Used in electrochemical and optical biosensors. Enzyme purity and activity must be rigorously controlled for reproducible results. |
| Gold Nanoparticle Colloid | Spherical nanoparticles (~13-20 nm) for colorimetric sensing, signal labeling, and enhancing electrochemical conductivity [40] [42] [36]. | Citrate-capped AuNPs are common. Functionalization with aptamers requires careful control of pH and ionic strength to prevent aggregation. |
| Molybdenum Disulfide (MoS₂) Nanosheets | 2D nanomaterial providing a high-surface-area platform for immobilizing bioreceptors and enhancing electron transfer [39] [43]. | Exfoliation quality (to single/few layers) is crucial. Can be functionalized with thiolated probes via van der Waals and covalent interactions. |
| Carbon Dots (CDs) | Fluorescent or ECL-active nanomaterials that can serve as coreactants (e.g., with [Ru(bpy)₃]²⁺) or direct signal reporters [43]. | Offer advantages of low toxicity and good water solubility. Can be synthesized from various natural carbon sources. |
| [Fe(CN)₆]³⁻/⁴⁻ Redox Probe | A standard electrochemical probe used to monitor changes in electron transfer efficiency at the electrode surface via EIS or CV [44]. | The change in charge transfer resistance (Rct) after target binding is a primary signal in impedimetric aptasensors. |
Probe Immobilization and Surface Functionalization Techniques
The performance of multiplex biosensors for pesticide residue detection is fundamentally governed by the techniques used to immobilize molecular probes onto sensor surfaces. Effective surface functionalization creates a stable, reproducible, and high-density layer of recognition elements that directly determines analytical sensitivity, specificity, and multiplexing capability. Within pesticide biosensing, this enables the simultaneous quantification of multiple pesticide classes from complex food and environmental matrices. The precision of immobilization techniques affects both the orientation and biological activity of probes, making surface chemistry a critical determinant in developing robust biosensing platforms for food safety monitoring [45] [46].
This document provides detailed application notes and experimental protocols for key probe immobilization strategies, with specific application to multiplex biosensor development for pesticide residue analysis. It is structured to equip researchers with practical methodologies for implementing these techniques in their biosensor fabrication workflows.
Core Principles and Significance
Uniform probe immobilization is an essential technology that profoundly influences the performance of any biosensing platform [46]. In the context of multiplex biosensors for pesticide residues, the primary goal of surface functionalization is to create discrete sensing zones with high density of correctly oriented recognition molecules (e.g., antibodies, aptamers, or enzymes). This enables specific capture of multiple target analytes simultaneously from a sample. The spatial control of probe attachment ensures minimal cross-talk between adjacent sensing regions, a prerequisite for reliable multiplex detection.
Advanced surface treatments allow for dense and uniform immobilization of probes, which significantly enhances detection precision compared to traditional methods where applying a fixing agent unevenly onto a substrate led to non-uniform probe densities [46]. For pesticide detection, this translates to lower limits of detection, improved reproducibility, and enhanced capability to discriminate between structurally similar pesticide compounds and their metabolites in complex food samples.
Surface Functionalization Methodologies
Substrate Activation and Modification
Protocol: Silane-Based Substrate Functionalization for Covalent Immobilization
- Objective: To create a reactive aldehyde-terminated surface on glass or silicon substrates for covalent antibody/aptamer immobilization.
Materials:
- Glass or silicon dioxide substrates
- (3-Aminopropyl)triethoxysilane (APTES)
- Anhydrous toluene
- Glutaraldehyde solution (2.5% in PBS)
- Ethanol, Acetone
- Nitrogen gas stream
- Oxygen plasma cleaner (optional)
Procedure:
- Substrate Cleaning: Clean substrates sequentially in acetone and ethanol via sonication for 15 minutes each. Dry under a stream of nitrogen. For optimal results, treat substrates with oxygen plasma for 2-5 minutes to generate maximally hydroxylated surfaces.
- Silane Solution Preparation: Under an inert atmosphere, prepare a 2% (v/v) solution of APTES in anhydrous toluene. Ensure the solution is moisture-free to prevent premature silane polymerization.
- Aminosilane Modification: Immerse the clean substrates in the APTES-toluene solution for 2 hours at room temperature with gentle agitation.
- Washing: Remove substrates and rinse thoroughly with fresh toluene to remove physisorbed silane.
- Curing: Heat the substrates at 110°C for 30 minutes to complete the covalent silane bonding.
- Aldehyde Activation: Incubate the aminated substrates in a 2.5% glutaraldehyde solution in phosphate-buffered saline (PBS, 0.01 M, pH 7.4) for 1 hour at room temperature.
- Final Rinse: Rinse the activated substrates extensively with PBS and deionized water. Dry under nitrogen and use immediately for probe immobilization.
Application Note: The resulting aldehyde-functionalized surface readily reacts with primary amine groups in antibodies or amine-modified aptamers, forming stable Schiff base linkages. This method is particularly suitable for creating high-density antibody microarrays for multiplex pesticide detection, as used in microarray technology [45]. Surface treatment technology that improves the substrate surface enables more uniform immobilization compared to conventional methods where applying a fixing agent unevenly leads to non-uniform probe densities [46].
Probe Immobilization Techniques
Protocol: Covalent Immobilization of Antibodies on Functionalized Surfaces
Objective: To covalently attach pesticide-specific antibodies onto aldehyde-functionalized surfaces in a defined orientation.
Materials:
- Aldehyde-functionalized substrates (from Protocol 3.1)
- Capture antibodies (specific to target pesticides, e.g., anti-organophosphate, anti-carbamate)
- Borate buffer (0.1 M, pH 8.5)
- Sodium cyanoborohydride (NaCNBH₃)
- Bovine Serum Albumin (BSA)
- PBS-Tween (0.1% Tween-20)
- Blocking buffer (1% BSA in PBS)
Procedure:
- Probe Preparation: Dilute the specific antibodies to a concentration of 50-100 µg/mL in borate buffer (0.1 M, pH 8.5).
- Immobilization Reaction: Spot 0.1-1 µL of antibody solution onto each predefined region of the aldehyde surface using a non-contact microarray spotter. For manual spotting, use a precision pipette.
- Incubation: Place the spotted substrate in a humidified chamber to prevent evaporation and incubate for 1 hour at room temperature.
- Stabilization: Prepare a fresh solution of sodium cyanoborohydride (5 mg/mL) in borate buffer. Gently flood the substrate surface with this solution and incubate for 30 minutes to reduce the Schiff base to a stable secondary amine linkage.
- Quenching: To block remaining aldehyde groups, incubate the surface with a 1% BSA solution in PBS for 30 minutes.
- Washing: Rinse the substrate three times with PBS-Tween and twice with deionized water to remove non-specifically bound antibodies.
- Storage: The functionalized biosensor can be stored dry at 4°C for several weeks until use.
Application Note: This covalent immobilization strategy ensures stable attachment of antibodies, which is crucial for the reproducibility and longevity of biosensors used in the analysis of complex food matrices. The orientation achieved through amine coupling can help preserve the antigen-binding paratope, enhancing detection sensitivity for pesticide residues [45].
The Scientist's Toolkit: Essential Research Reagents
Table 1: Key Reagent Solutions for Probe Immobilization and Biosensor Fabrication
| Reagent/Material | Function/Application | Example Use in Pesticide Biosensors |
|---|---|---|
| (3-Aminopropyl)triethoxysilane (APTES) | Creates an amine-terminated self-assembled monolayer on glass/silicon surfaces for further functionalization. | Primary surface amination for subsequent glutaraldehyde crosslinking in immunosensor development [45]. |
| Glutaraldehyde | Homobifunctional crosslinker that reacts with primary amine groups to form Schiff bases. | Couples aminated surfaces to amine-containing biomolecules (antibodies, enzymes) for covalent immobilization. |
| N-Hydroxysuccinimide (NHS) / EDC | Carbodiimide crosslinking chemistry activates carboxyl groups for coupling with primary amines. | Functionalizes carboxylated surfaces (e.g., on certain SERS platforms) for antibody attachment in pesticide detection [47]. |
| Bovine Serum Albumin (BSA) | Non-specific blocking agent to passivate unreacted surface sites and minimize background signal. | Reduces non-specific binding of sample matrix components in food extracts on the biosensor surface. |
| Gold Nanoparticles & Nanostars | Plasmonic nanomaterials serving as SERS-active substrates or signal amplification tags. | Au-Ag nanostars provide intense plasmonic enhancement for SERS-based immunoassays detecting pesticides [47] [48]. |
| Mercaptopropionic Acid (MPA) | Forms a self-assembled monolayer on gold surfaces, presenting terminal carboxyl groups for biomolecule conjugation. | Used to functionalize gold surfaces in electrochemical and SERS biosensors for subsequent probe immobilization [47]. |
Integration with Detection Platforms for Pesticide Residues
The choice of immobilization strategy is often dictated by the detection transducer. For optical biosensors like those using Surface-Enhanced Raman Spectroscopy (SERS), the functionalization must occur directly on plasmonic nanostructures. A reported SERS immunoassay for α-fetoprotein demonstrates this principle: Au-Ag nanostars were functionalized with mercaptopropionic acid (MPA), followed by EDC/NHS chemistry to covalently attach monoclonal antibodies [47]. This protocol is directly transferable to the development of SERS biosensors for pesticide residues, where the specific antibody is swapped for one targeting a pesticide class (e.g., organophosphates). SERS biosensors combine the high specificity of bio-affinity elements with the single-molecule sensitivity and fingerprinting capability of SERS, making them a promising alternative to traditional chromatography for rapid, on-site pesticide detection [48].
Similarly, for electrochemical biosensors, surface functionalization must ensure both probe immobilization and efficient electron transfer. Melanin-like polydopamine coatings have been successfully used for this purpose due to their strong adhesion and biocompatibility. These coatings can be easily modified to immobilize recognition elements for targets like toxic metal ions, drugs, and pesticides [47].
Workflow and Data Analysis
The following diagram illustrates the complete experimental workflow for fabricating a multiplex biosensor for pesticide residues, from surface functionalization to final detection.
Diagram 1: Biosensor Fabrication and Detection Workflow
Performance Metrics and Data Analysis
After signal detection, data analysis is critical for quantifying pesticide residues. For multiplex assays, calibration curves must be generated for each pesticide on the platform. Key performance parameters to evaluate are summarized below.
Table 2: Key Quantitative Performance Metrics for Pesticide Biosensors Based on Recent Advances
| Performance Metric | Target Value / Typical Range | Detection Technique & Context |
|---|---|---|
| Limit of Detection (LOD) | Low ppm to ppb levels | SERS-based immunoassays can achieve LODs as low as 16.73 ng/mL for specific biomarkers, indicating sensitivity potential for pesticides [47]. |
| Recovery Rate | 90 - 100% | Reported for advanced detection methods (e.g., electroanalytical, colorimetric) for azole-containing pesticides in food [35]. |
| Precision (% RSD) | Low percentage (High Precision) | Electroanalytical and colorimetric methods demonstrate superior performance with low %RSD [35]. |
| Analysis Time | Minutes to a few hours | Rapid, field-deployable SERS biosensors aim for significantly faster analysis than traditional chromatography [48]. |
| Multiplexing Capacity | Simultaneous detection of multiple pesticide classes | The core advantage of microarray and multiplex biosensor technology, enabled by spatially defined probe immobilization [45]. |
Mastering probe immobilization and surface functionalization is a cornerstone of developing reliable multiplex biosensors for pesticide residue analysis. The protocols and application notes detailed herein provide a framework for creating robust sensing interfaces. As the field advances, future efforts will focus on refining these techniques to further improve biosensor sensitivity, specificity, and suitability for on-site deployment. This will involve exploring new nanomaterial substrates, developing more efficient and oriented immobilization chemistries, and validating these platforms against complex, real-world food samples to ensure they meet regulatory and food safety standards.
The detection of pesticide residues in complex matrices like fruits, vegetables, and environmental samples (e.g., soil, water) presents significant analytical challenges due to matrix effects that can interfere with assay sensitivity and specificity. Sophisticated biosensing technologies have been developed to address these challenges, offering rapid, sensitive, and multi-residue detection capabilities essential for modern food safety and environmental monitoring [49] [22]. Framed within the broader context of multiplex biosensor detection for multiple pesticide residues, this document details practical application notes and standardized protocols. It focuses on the deployment of advanced biosensors in real-world samples, leveraging nanomaterials and multi-mode signaling to overcome matrix-related interferences and provide reliable, accurate results for researchers and scientists.
Key Biosensing Platforms and Performance
The selection of an appropriate biosensing platform is critical and depends on the specific analytical requirements, including the target pesticides, the complexity of the sample matrix, desired sensitivity, and need for multiplexing. The following table summarizes the core characteristics of prominent biosensor technologies applied to complex matrices.
Table 1: Comparison of Biosensing Platforms for Pesticide Detection in Complex Matrices
| Biosensor Type | Core Principle | Example Targets | Limit of Detection (LOD) | Key Advantages for Complex Matrices |
|---|---|---|---|---|
| Electrochemical Aptasensor [49] | Measures electrical current/potential change from redox reactions at a functionalized electrode. | Carbendazim | 1.0 nM [49] | High sensitivity, cost-effectiveness, potential for miniaturization and on-site use. |
| Aptamer-Mediated Nanozyme Sensor [49] | Uses nanoparticle-labeled aptamers; detection via catalytic signal amplification (e.g., colorimetry). | Phorate, Profenofos, Isocarbophos, Omethoate | 0.03 - 1.6 ng/mL [49] | Visual detection, high specificity from aptamers, signal amplification from nanomaterials. |
| Triple-Mode Biosensor [50] | Integrates three independent detection mechanisms (e.g., colorimetric, fluorescence, photothermal) in a single platform. | Glyphosate [50] | Varies by mode and target | Built-in self-validation, cross-checking reduces false results, wide dynamic range, high reliability. |
| Chromatography-MS (Reference) [22] | Physical separation followed by mass spectral identification and quantification. | Multi-residue analysis (e.g., 68 compounds in soil) [22] | µg/kg to ng/kg levels [22] | Gold standard for lab confirmation, high sensitivity and precision. |
Detailed Experimental Protocols
Protocol: Aptamer-Mediated Nanozyme Sensor for Organophosphorus Pesticides in Vegetables
This protocol describes a method for the visual and quantitative detection of multiple organophosphorus pesticides (Ops) in vegetable samples using a competitive assay format with bimetallic metal-organic framework (MOF) nanoparticles [49].
I. Materials and Reagents
- Fe-Co MNPs: Bimetallic magnetic nanoparticles serving as the capture probe.
- Fe-N-C Nanozyme: Signal probe with catalytic activity.
- Broad-spectrum Ops Aptamer: Immobilized on Fe-Co MNPs.
- Complementary DNA (cDNA): Labeled with Fe-N-C nanozyme and complementary to the aptamer.
- Sample Extraction Buffer: Acetonitrile-acetic acid (99:1 v/v) or similar.
- Purification Column: e.g., Carb/NH2 for clean-up.
- Detection Substrate: TMB (3,3',5,5'-Tetramethylbenzidine) or ABTS for colorimetric readout.
II. Procedure
Sample Preparation (QuEChERS-based): a. Homogenize 10 g of vegetable sample. b. Extract pesticides with 10 mL of acetonitrile-acetic acid (99:1) buffer, vortex vigorously for 1 minute. c. Add salts for partitioning (e.g., MgSO4, NaCl), shake, and centrifuge. d. Pass an aliquot of the supernatant through a Carb/NH2 purification column [22].
Competitive Assay Incubation: a. In a microcentrifuge tube, mix the purified sample extract (containing target Ops, if present) with the Fe-Co MNPs/aptamer complex and the Fe-N-C nanozyme/cDNA complex. b. Incubate at 25°C for 15 minutes with gentle shaking. The target Ops in the sample will compete with the cDNA for binding to the aptamer on the MNPs.
Separation and Signal Development: a. Apply a magnetic field to separate the Fe-Co MNPs and their bound complexes from the solution. b. Transfer the supernatant, which now contains the free Fe-N-C nanozyme/cDNA displaced by the target pesticides, to a new tube. c. Add the colorimetric substrate (e.g., TMB) to the supernatant and incubate for 5-10 minutes. d. Observe the color development. The intensity of the color is proportional to the concentration of Ops in the sample.
Detection and Quantification: a. Colorimetric: Measure the absorbance of the solution with a spectrophotometer or smartphone-based reader. b. Data Analysis: Quantify Ops concentration by comparing the signal to a standard curve generated with known pesticide concentrations.
The following workflow diagram illustrates the key steps and principle of this assay:
Protocol: Validation Using UHPLC-MS/MS
For confirmatory analysis and method validation, Ultra-High-Performance Liquid Chromatography-Tandem Mass Spectrometry (UHPLC-MS/MS) is the gold standard [22]. The protocol below can be used to validate the results obtained from biosensors.
I. Materials and Reagents
- UHPLC System: With C18 or equivalent analytical column.
- Tandem Mass Spectrometer: Equipped with electrospray ionization (ESI).
- Mobile Phases: e.g., (A) Water with 0.1% formic acid and (B) Methanol with 0.1% formic acid.
- Analytical Standards: Pure pesticide standards for calibration.
- Isotope-labeled Internal Standards: e.g., for correcting matrix effects.
II. Procedure
- Sample Preparation: Follow a validated QuEChERS procedure appropriate for the sample matrix [22].
- Instrument Setup: a. Chromatography: Optimize the UHPLC gradient to achieve baseline separation of target pesticides. A typical run time is 10-14 minutes [22]. b. Mass Spectrometry: Operate in Multiple Reaction Monitoring (MRM) mode. For each pesticide, optimize two specific precursor-to-product ion transitions for quantification and confirmation.
- Data Acquisition and Analysis: a. Inject the purified sample extracts. b. Identify pesticides by matching the retention time and ion ratio of the two MRM transitions with those of the standard. c. Quantify concentrations using a calibration curve, corrected with the internal standard.
The Scientist's Toolkit: Essential Research Reagents and Materials
Successful implementation of biosensors for pesticide detection relies on a suite of specialized reagents and materials. The following table outlines key components and their functions.
Table 2: Essential Research Reagents and Materials for Pesticide Biosensor Development
| Category / Item | Specific Examples | Function in the Biosensing System |
|---|---|---|
| Nanomaterials | Gold Nanoparticles (AuNPs) [49], Silver Nanoparticles [49], Magnetic Nanoparticles (Fe₃O₄) [49], Metal-Organic Frameworks (MOFs) [49] | Signal amplification, electrode modification, immobilization platform for biomolecules, simplified separation (magnetic). |
| Recognition Elements | Aptamers (DNA/RNA) [49], Enzymes (e.g., AChE) [49], Antibodies | Provide high specificity and affinity for binding to target pesticide molecules. |
| Transduction Elements | Screen-printed Electrodes (SPE) [49], Fluorophores, Chromogenic Substrates (TMB/ABTS) | Convert the biological binding event into a measurable signal (electrical, optical, colorimetric). |
| Sample Prep Materials | QuEChERS Kits [22], Carb/NH2 Purification Columns [22], Zeba Spin Desalting Columns [51] | Extract, clean-up, and purify analytes from complex matrices to reduce interference. |
Signaling Pathways and Multi-Mode Detection Logic
The superior performance of triple-mode biosensors stems from the integration of complementary detection principles, which provides built-in cross-validation and compensates for the limitations of any single mode. The logical relationship between these pathways enhances reliability in complex samples [50].
Overcoming Practical Hurdles: Matrix Effects, Sensitivity, and Real-World Deployment
Mitigating Matrix Interference in Food and Agricultural Samples
Matrix effects (MEs) represent a significant challenge in the quantitative analysis of pesticide residues using advanced detection techniques like multiplex biosensors and liquid chromatography–mass spectrometry (LC-MS). These effects are phenomena where the mass spectral signal of a target analyte at a given concentration differs significantly when introduced from a sample extract compared to a pure solvent standard [52] [53]. In the context of multiplex biosensor detection for multiple pesticide residues, MEs can severely compromise data quality by causing signal suppression or enhancement, ultimately affecting the accuracy, precision, and reliability of results [53].
The fundamental mechanism behind MEs involves interactions between target analytes and co-extracted matrix components from the food or agricultural sample. These interactions can occur via van der Waals forces, dipolar-dipolar interactions, or electrostatic forces, altering the ionization efficiency of the target pesticides in the electrospray ionization (ESI) source [53]. Matrix effects are particularly problematic in multi-residue analysis where dozens to hundreds of pesticide analytes are measured in a single run, with each analyte exhibiting widely variable matrix effects [52]. The complexity of these effects is further amplified when dealing with diverse agricultural commodities, as different matrix species induce systematic variations that must be distinguished from mass spectrometry-induced variations [52].
Quantitative Assessment of Matrix Effects
Measurement and Impact on Analytical Performance
Matrix effects can be quantitatively assessed using several approaches. The calibration-graph method and concentration-based method are commonly employed, with the latter demonstrating superior precision as it evaluates ME at each concentration level individually [54]. Studies have shown that lower concentration levels are more significantly affected by MEs than higher levels, highlighting the importance of level-specific assessment [54].
The impact of MEs on analytical parameters is substantial and can affect:
- Limit of Detection (LOD) and Limit of Quantification (LOQ): MEs can alter the signal-to-noise ratio, potentially raising both LOD and LOQ values.
- Linearity: Matrix components can cause non-linear responses at different concentration levels.
- Accuracy and Precision: Signal suppression or enhancement directly impacts quantitative accuracy, while matrix interference affects method precision [52].
Comparative Matrix Effect Profiles Across Commodities
Recent studies evaluating 74 pesticides in golden gooseberry (GG), purple passion fruit (PPF), and Hass avocado (HA) revealed distinct ME profiles. Statistical analysis using Spearman correlation tests demonstrated a stronger positive correlation between GG-PPF (0.79) than between GG-HA (0.71) and PPF-HA (0.70), respectively [54]. This finding challenges the SANTE guideline recommendation to validate at least a single matrix per commodity group, as compounds like methomyl, fenhexamid, and carbendazim exhibited contrasting behavior even in similar matrices [54].
Table 1: Matrix Effect Correlation Between Different Fruit Matrices
| Matrix Pair | Spearman Correlation Coefficient | Interpretation |
|---|---|---|
| GG-PPF | 0.79 | Strong positive correlation |
| GG-HA | 0.71 | Moderate positive correlation |
| PPF-HA | 0.70 | Moderate positive correlation |
Experimental Protocols for Matrix Effect Mitigation
Sample Preparation: Modified QuEChERS Approach
The quick, easy, cheap, effective, rugged, and safe (QuEChERS) method remains the cornerstone of sample preparation for multi-residue pesticide analysis. The protocol must be tailored to different matrix types according to established standards [52]:
- For light-colored fruits, vegetables, and mushrooms (e.g., Chinese yam, lemon, maize, cabbage, oyster mushroom, shiitake mushroom): Use the standard QuEChERS procedure for light-colored produce [52].
- For dark-colored fruits and vegetables (e.g., wheatgrass, amaranth, garlic sprout, red chili, ginger, blueberry): Apply the QuEChERS procedure optimized for pigmented matrices [52].
- For condiments and tea (e.g., cilantro, basil, mint, bay leaf, Sichuan pepper, green tea): Implement the specific QuEChERS protocol for complex aromatic matrices [52].
- For oil seeds (e.g., soybean): Utilize the QuEChERS procedure developed for high-lipid content matrices [52].
Analytical Conditions for LC-MS/MS Analysis
Chromatographic separation should be performed using UHPLC systems fitted with appropriate reverse-phase columns (e.g., AQUITY UPLC BEH C18 column, 100 × 2.1 mm, 1.7 μm) maintained at 40°C. The mobile phase typically consists of water with 0.1% formic acid (mobile phase A) and acetonitrile (mobile phase B) with a gradient elution program starting at 5% B, linearly increasing to 30% B at 1 minute, then to 98% B over 10 minutes, holding for 3 minutes before re-equilibration [52]. The flow rate should be maintained at 0.3 mL/min with an injection volume of 2 μL [52].
Mass spectrometric detection can be performed using either:
- Multiple Reaction Monitoring (MRM) on tandem mass spectrometry (MS/MS) for targeted quantification [52]
- Information-Dependent Acquisition (IDA) on quadrupole time-of-flight mass spectrometry (QTOF-MS) for wide-scope screening and quantification [52]
Recent studies indicate that the TOF-MS scan under IDA mode of high-resolution mass spectrometry (HR-MS) simultaneously weakened MEs on 24 pesticides in 32 different matrices compared to MRM scanning by MS/MS [52].
Metabolomics-Informed ME Assessment Strategy
Drawing on analytical approaches from metabolomics, a novel ME analysis strategy can be implemented to distinguish matrix species-induced and mass spectrometry-induced systematic ME variations [52]. This approach involves:
- Principal Components Analysis (PCA) to organize and characterize ME types based on MEs of pesticide targets [52]
- Orthogonal Partial Least Squares Discriminant Analysis (OPLS-DA) to scan and validate differential pesticides contributing to ME variations [52]
- OmicSense quantitative prediction method that uses a mixture of Gaussian distributions as the probability distribution, yielding the most likely objective variable predicted for each biomarker [55]
Table 2: Comparison of Mass Spectrometry Approaches for Mitigating Matrix Effects
| Parameter | MRM Scan (MS/MS) | IDA Mode (QTOF-MS) |
|---|---|---|
| Analysis Type | Targeted quantification | Wide-scope screening and quantification |
| ME Impact | Enhanced signal suppression for 105 differential MRM transitions for 42 pesticides | Simultaneous weakening of MEs on 24 pesticides in 32 matrices |
| Data Complexity | Manages predetermined transitions | Handles multi-dimensional ME data |
| Compatible Matrices | All, but with varying ME | Shows improved performance across diverse matrices |
Advanced Mitigation Strategies and Biosensor Integration
Computational Approaches and Signal Processing
The OmicSense method represents a significant advancement in handling multidimensional omics data with considerable noise, including missing and erroneous values arising from stochasticity and technical shortcomings in measurements [55]. This approach constructs a library of simple regression models between the target and each predictor variable, generating a conditional probability distribution of the target from the corresponding predictor variable using new input data [55]. The algorithm can be represented as:
For biosensor applications, recent developments in FRET-based biosensors demonstrate promising approaches for reducing matrix interference. Engineered interfaces between fluorescent proteins and fluorescently labeled HaloTag enable the development of FRET biosensors with unprecedented dynamic ranges [56]. The chemogenetic FRET pairs (ChemoG designs) establish a new concept for developing highly sensitive and tunable biosensors that can be adapted for pesticide detection in complex matrices [56].
Integrated Workflow for Matrix Effect Management
A comprehensive strategy for mitigating matrix interference in multiplex biosensor detection involves multiple complementary approaches:
The Scientist's Toolkit: Essential Research Reagents and Materials
Table 3: Key Research Reagent Solutions for Matrix Effect Mitigation
| Reagent/Material | Function | Application Notes |
|---|---|---|
| Bond Elut QuEChERS Kits | Sample cleanup and extraction | Select according to National Food Safety Standards; different formulations for light-colored produce, dark-colored produce, condiments/tea, and oil seeds [52] |
| AQUITY UPLC BEH C18 Column | Chromatographic separation | 100 × 2.1 mm, 1.7 μm particle size; provides optimal separation of pesticide residues from matrix components [52] |
| Formic Acid (≥98%) | Mobile phase additive | Used at 0.1% in water to enhance ionization and chromatographic performance [52] |
| Acetonitrile (MS grade) | Extraction solvent and mobile phase | Preferred for pesticide residue analysis due to its extraction efficiency and compatibility with MS detection [52] |
| HaloTag Fusion Systems | Biosensor development | Enables tuning of spectral properties of FRET acceptors on demand using different fluorophore substrates [56] |
| Chemogenetic FRET Pairs (ChemoG designs) | Biosensor signal generation | Engineered interfaces between fluorescent proteins and fluorescently labeled HaloTag with near-quantitative FRET efficiencies (≥94%) [56] |
| OmicSense R Package | Computational ME correction | Implements quantitative prediction method using mixture of Gaussian distributions; available on CRAN and GitHub [55] |
Effective mitigation of matrix interference in food and agricultural samples requires an integrated approach combining appropriate sample preparation, advanced instrumental analysis, and sophisticated computational correction methods. The modified QuEChERS protocol tailored to specific matrix types forms the foundation for reducing matrix effects, while high-resolution mass spectrometry techniques, particularly QTOF-MS in IDA mode, demonstrate superior performance in minimizing MEs compared to traditional MRM-based approaches.
The integration of metabolomics-informed assessment strategies and emerging biosensor technologies, particularly tunable FRET-based systems, offers promising avenues for enhancing the accuracy and reliability of multiplex pesticide residue detection. Furthermore, computational approaches like OmicSense provide robust frameworks for handling the multidimensional data generated in these analyses, enabling more accurate quantification despite the challenges posed by complex sample matrices.
As the field advances, the development of standardized protocols for matrix effect assessment and mitigation across diverse agricultural commodities will be essential for ensuring food safety and regulatory compliance while advancing our understanding of plant metabolic responses to pesticide exposure.
Strategies for Enhancing Sensitivity and Achieving Femtogram-Level Detection
The pursuit of femtogram-level detection sensitivity represents a frontier in analytical science, particularly for applications requiring the identification of ultra-trace analytes such as specific pesticide residues, disease biomarkers, or viral particles. Achieving detection limits at the femtogram (10-15 gram) scale enables unprecedented capabilities in early disease diagnosis, environmental monitoring, and food safety assurance [57] [58] [59]. This application note details established and emerging strategies for enhancing biosensor sensitivity, framed within the context of multiplex biosensor detection for multiple pesticide residues research. We present practical protocols, reagent solutions, and analytical frameworks that research scientists can implement to push detection capabilities to these extreme sensitivities.
The significance of femtogram-level detection is underscored by clinical and environmental requirements. For instance, detecting cancer antigens like AGR2 at femtogram levels in plasma can significantly improve early cancer diagnosis [57]. Similarly, detecting SARS-CoV-2 spike protein at 257 fg/mL provides a powerful tool for managing viral spread [58]. In pesticide analysis, such sensitivity allows for identifying minute residue concentrations that may still pose health risks through chronic exposure [35].
Amplification Strategies and Performance Comparison
Multiple signal amplification strategies have been developed to achieve femtogram-level detection limits. These approaches typically involve nanotechnology, enzymatic amplification, or advanced transducer configurations that significantly enhance the analytical signal relative to the target concentration.
Table 1: Comparison of Signal Amplification Strategies for Femtogram-Level Detection
| Amplification Strategy | Detection Technique | Target Analyte | Achieved LOD | Key Characteristics |
|---|---|---|---|---|
| Antibody-functionalized gold electrodes with SAM | Electrochemical Impedance Spectroscopy (EIS) | Cancer antigen AGR2 | 0.01-10 fg/mL | One-step capture and quantitation; uses 4-ATP monolayer and glutaraldehyde crosslinking [57] |
| scFv-conjugated magnetic nanoparticles with SERS nanotags | Surface-Enhanced Raman Spectroscopy (SERS) | SARS-CoV-2 spike protein | 257 fg/mL | 30-minute assay; uses recombinant antibody fragments; point-of-care compatible [58] |
| Enzyme-labeled immunosensors with redox amplification | Electrochemical (Amperometry/DPSV) | Multiple cancer biomarkers | Units of fg/mL | Uses enzyme labels (HRP) with electrochemical mediators; compatible with multiplexing [59] |
| Nanostructured electrodes with metal enhancement | Electrochemical (LSASV) | CEA, AFP | 0.093 pg/mL (CEA), 0.061 pg/mL (AFP) | Silver deposition on gold nanoparticles or carbon nanotubes; extremely high signal amplification [59] |
The selection of an appropriate amplification strategy depends on the specific application requirements, including the need for multiplexing, sample matrix complexity, and available instrumentation. Nanomaterial-based amplifications generally offer the highest sensitivity gains but may require more complex fabrication procedures [60] [59].
Experimental Protocols for Femtogram-Level Detection
Protocol: scFv-SERS Assay for Femtogram Level Detection
This protocol adapts the SERS immunoassay approach demonstrated for SARS-CoV-2 detection [58] for pesticide residue analysis.
Materials:
- Single-chain Fv (scFv) antibody fragments specific to target pesticides
- Magnetic nanoparticles (streptavidin-coated)
- SERS nanotags (gold or silver nanoparticles with Raman reporters)
- Portable Raman spectrometer with 785 nm or 633 nm laser excitation
- Phosphate-buffered saline (PBS) with 0.05% Tween-20
- Blocking buffer (1% BSA in PBS)
Procedure:
- scFv Bioconjugation: Conjugate scFv antibodies to magnetic nanoparticles (capture probe) and SERS nanotags (detection probe) via EDC-NHS chemistry. Purify conjugated particles using magnetic separation and resuspend in storage buffer.
- Immunocomplex Formation: Incubate 100 µL sample with 50 µL scFv-magnetic nanoparticles for 15 minutes with gentle mixing. Apply magnetic field and wash twice with PBS-Tween.
- Signal Tag Binding: Add 50 µL scFv-SERS nanotags to the captured complexes. Incubate for 10 minutes. Wash three times with PBS-Tween to remove unbound nanotags.
- SERS Measurement: Resuspend immunocomplexes in 50 µL PBS. Spot 10 µL onto aluminum-coated slides and air dry. Acquire SERS spectra using portable spectrometer with 10-second integration time.
- Quantification: Measure intensity of characteristic Raman peak and compare against calibration curve prepared with standard concentrations.
Critical Considerations:
- Optimize scFv:nanoparticle ratio during conjugation to maximize binding capacity
- Validate specificity against related pesticide compounds to minimize cross-reactivity
- Include appropriate controls (blank, negative control) to account for matrix effects
Protocol: Electrochemical Immunosensor with Nanomaterial Amplification
This protocol describes construction of a nanomaterial-enhanced electrochemical immunosensor based on the principles demonstrated for cancer biomarker detection [57] [59].
Materials:
- Screen-printed gold electrodes (SPAuEs)
- 4-aminothiophenol (4-ATP) in ethanol
- 2.5% glutaraldehyde in PBS
- Monoclonal antibodies specific to target pesticides
- Gold nanoparticles (10 nm diameter)
- Bovine serum albumin (BSA)
- Electrochemical cell with potentiostat
Procedure:
- Electrode Functionalization: Clean SPAuEs with 0.5 M H2SO4 for 15 minutes. Rinse with ethanol and dry under nitrogen. Immerse in 0.1 M 4-ATP in ethanol for 12 hours to form self-assembled monolayer (SAM). Rinse with ethanol to remove unbound thiols.
- Antibody Immobilization: Treat SAM-modified electrodes with 2.5% glutaraldehyde for 15 minutes in dark. Rinse with water and dry under nitrogen. Apply 10 µg/µL anti-pesticide antibody and incubate at 37°C for 1 hour. Rinse with PBS to remove excess antibodies.
- Blocking: Treat antibody-modified electrodes with 0.1% BSA for 30 minutes to block non-specific sites. Rinse with PBS and water, then dry under nitrogen.
- Signal Amplification (Optional): For additional sensitivity, incubate with gold nanoparticles conjugated with secondary antibodies for 30 minutes, followed by silver enhancement for 5-10 minutes.
- Measurement: Incubate functionalized electrode with sample for 5 minutes. Perform electrochemical impedance spectroscopy (EIS) in 1 mM K3[Fe(CN)6]/K4[Fe(CN)6]/0.1 M PBS. Record Nyquist plots over frequency range 100 kHz to 0.1 Hz with 10 mV AC amplitude.
- Data Analysis: Fit impedance data to equivalent circuit model. Use charge transfer resistance (Rct) values for quantification against calibration curve.
Critical Considerations:
- Maintain consistent SAM formation time and conditions for reproducibility
- Optimize antibody concentration to maximize binding sites while minimizing steric hindrance
- For multiplex detection, pattern different antibodies on electrode arrays using microfluidic dispensing
Biosensor Architectures and Signal Amplification Pathways
The following diagrams illustrate key biosensor architectures and signal amplification pathways employed in femtogram-level detection systems.
Biosensor Signal Amplification Pathway
Surface Functionalization for Ultrasensitive Detection
Research Reagent Solutions for Ultrasensitive Detection
The following table details essential materials and their functions in developing biosensors capable of femtogram-level detection.
Table 2: Essential Research Reagents for Femtogram-Level Detection Systems
| Reagent/Material | Function | Application Examples | Considerations |
|---|---|---|---|
| Single-chain Fv (scFv) fragments | Recombinant antibody fragments for target recognition | SARS-CoV-2 detection [58] | Rapid isolation (3-4 weeks); bacterial expression; smaller size improves density |
| Gold nanoparticles (Various sizes) | Signal amplification; electrode modification; SERS substrate | Electrochemical immunosensors [57] [59] | Tunable optical properties; high surface area; compatible with bioconjugation |
| Screen-printed gold electrodes (SPAuEs) | Disposable electrode platforms | AGR2 detection [57] | Low-cost; reproducible; customizable designs |
| 4-Aminothiophenol (4-ATP) | Self-assembled monolayer formation | Electrode functionalization [57] | Creates ordered interface for antibody immobilization |
| Glutaraldehyde | Crosslinking agent | Antibody immobilization [57] | Links amine groups on SAM to antibodies |
| Magnetic nanoparticles | Capture and separation | SERS immunoassays [58] | Enables efficient washing and concentration |
| SERS nanotags | Raman signal generation | Multiplex detection [58] | Distinct spectral signatures enable multiplexing |
| Horseradish peroxidase (HRP) | Enzymatic signal amplification | Electrochemical immunosensors [59] | High turnover number; compatible with various substrates |
Implementation Considerations for Multiplex Pesticide Detection
Adapting femtogram-level detection strategies for multiplex pesticide residue analysis presents specific challenges that require strategic solutions. The following aspects require particular attention:
Sample Preparation: Complex food matrices necessitate efficient extraction and clean-up procedures to minimize interference while maintaining target analyte integrity. Immunoaffinity extraction using pesticide-specific antibodies can provide the required selectivity [35].
Multiplexing Architecture: For simultaneous detection of multiple pesticide residues, both spatial patterning of recognition elements on electrode arrays and spectral multiplexing with SERS nanotags offer viable approaches. The barcode configuration using distinct electroactive labels enables multiplexing with single electrode platforms, while multi-electrode arrays provide simpler signal interpretation [59].
Validation: Method validation must include assessment of cross-reactivity with related pesticide compounds and metabolites. Recovery studies at multiple concentration levels across relevant food matrices are essential to establish method reliability [35].
Signal Interference: Complex sample matrices can cause nonspecific binding and signal interference. Optimal blocking conditions and inclusion of control sensors functionalized with non-specific antibodies are critical for minimizing false positives [57] [60].
The strategies outlined in this application note provide a pathway to achieving the exceptional sensitivity required for next-generation pesticide residue monitoring. By leveraging nanotechnology, advanced biorecognition elements, and sophisticated signal amplification methods, researchers can develop analytical systems capable of detecting pesticide residues at biologically relevant concentrations, even in complex sample matrices.
Improving Selectivity and Reducing Cross-Reactivity in Multi-Analyte Assays
The drive for high-throughput analysis in food safety, particularly for the detection of multiple pesticide residues, has propelled the development of multiplex biosensors. A significant challenge in this endeavor is managing assay selectivity and minimizing undesired cross-reactivity. Cross-reactivity occurs when a recognition element (e.g., an antibody) binds to non-target analytes that are structurally similar to the primary target, potentially leading to false positives and overestimation of analyte concentrations [61]. Traditionally, cross-reactivity is calculated for competitive immunoassays using the formula: Cross-reactivity (CR) = IC50(target analyte)/IC50(tested cross-reactant) × 100% [62].
While often viewed as a liability, a paradigm shift is underway, exploring how the cross-reactive properties of antibodies can be strategically harnessed to create selective arrays capable of discriminating complex mixtures, similar to the principles of chemical olfaction systems [63]. This application note details practical strategies, underpinned by theoretical models and experimental data, to refine the selectivity of multi-analyte assays for pesticide detection.
Theoretical Foundations: Cross-Reactivity as a Tunable Parameter
Emerging research demonstrates that cross-reactivity is not an immutable property of an antibody but an assay-dependent characteristic that can be deliberately modulated.
Key Modulating Factors
- Reagent Concentration: Assays utilizing sensitive detection methods and implemented at low concentrations of antibodies and competing antigens demonstrate higher specificity and lower cross-reactivity. Conversely, formats requiring high reagent concentrations tend to exhibit broader cross-reactivity. Mathematical modeling and experimental comparisons between enzyme immunoassays and fluorescence polarization immunoassays (FPIA) for sulfonamides and fluoroquinolones confirm that shifting to lower reagent concentrations can reduce cross-reactivities by up to five-fold [62].
- Kinetic and Thermodynamic Control: The selectivity of an assay can be influenced by moving the assay regime from equilibrium conditions toward kinetic control. Shorter incubation times favor the binding of high-affinity interactions (typically the target analyte) over lower-affinity, cross-reactive binding events [61].
- Assay Format and Heterology: The "heterologous" immunoassay approach, which uses different antigen derivatives during immunization and the competitive assay step, can narrow the selectivity spectrum. This method ensures that not all elicited antibodies participate in the analytical interaction, selectively excluding subpopulations with undesired cross-reactivity [62].
Experimental Strategies and Optimization Protocols
The following section provides actionable methodologies for enhancing selectivity during assay development and implementation.
Protocol: Reagent Concentration Titration for Specificity Enhancement
This protocol is designed to identify reagent concentrations that minimize cross-reactivity while maintaining robust assay signals [62] [61].
- Preparation: Serially dilute the capture antibody (or other recognition element) and the labeled competitor antigen (e.g., enzyme-hapten conjugate) in a suitable buffer (e.g., PBS).
- Matrix Setup: For each combination of antibody and antigen concentrations, set up a calibration curve with the target analyte and a separate dose-response curve with the primary cross-reactant.
- Assay Execution: Perform the competitive assay in a 96-well plate or microfluidic device. Incubate according to standard protocols for the chosen format (e.g., 1 hour at room temperature for ELISA).
- Data Analysis: Measure the signal and calculate the IC50 values for both the target and cross-reactant at each reagent concentration combination.
- Optimization: Calculate the cross-reactivity (CR) for each condition. The optimal reagent concentrations are those that yield the lowest CR value while preserving an acceptable signal-to-noise ratio (typically >10:1) for the target analyte.
Protocol: Kinetic Control to Favor High-Affinity Binding
Leveraging short contact times can preferentially favor the desired high-affinity antigen-antibody interaction [61].
- Platform Selection: Utilize an automated flow-through system (e.g., a microfluidic immunoassay platform) that allows for precise control of interaction times.
- Time-Course Experiment: Fix the concentrations of the target analyte and a key cross-reactant at their respective IC50 levels. Vary the contact time between the sample and the immobilized antibody from seconds to minutes.
- Signal Measurement: Record the analytical signal at each time point.
- Analysis: Plot the signal versus contact time. The point where the difference in signal between the target and cross-reactant is maximized indicates the optimal contact time for selectivity. This occurs when the high-affinity binding of the target is favored, while the lower-affinity cross-reactive binding is minimized.
Protocol: exploiting Cross-Reactivity for Pattern-Based Discrimination
This protocol outlines the use of cross-reactive antibodies in an array format to discriminate between complex samples, turning a perceived weakness into a strength [63].
- Sensor Array Fabrication: Immobilize a panel of different, deliberately cross-reactive antibodies or aptamers in discrete locations on a solid support (e.g., a functionalized glass slide or electrode array).
- Sample Exposure: Apply the sample containing the target pesticide or mixture of pesticides to the array.
- Binding Profiling: Incubate to allow binding, then wash. Detect the binding event using a label-free method (e.g., Surface Plasmon Resonance - SPR) or a generic label (e.g., a fluorescent anti-species antibody).
- Data Processing and Pattern Recognition: The binding profile across the array generates a unique fingerprint for each analyte or complex mixture. Analyze this multivariate data using chemometric tools (e.g., Principal Component Analysis - PCA or Linear Discriminant Analysis - LDA) to identify and classify the sample components.
Figure 1: Pattern-Based Discrimination Workflow. A sample is exposed to a cross-reactive sensor array, generating a unique binding fingerprint that is analyzed to identify and classify components [63].
Data Presentation and Analysis
Impact of Assay Parameters on Cross-Reactivity
Table 1: Summary of strategies for modulating selectivity in multi-analyte immunoassays, based on experimental findings from the literature.
| Strategy | Experimental Parameter Adjusted | Effect on Cross-Reactivity | Reported Efficacy | Key Considerations |
|---|---|---|---|---|
| Reagent Concentration Titration [62] | Concentration of antibodies and labeled antigens | Reduction | Up to 5-fold decrease | Must balance with assay sensitivity and signal intensity. |
| Kinetic Control [61] | Incubation/contact time | Reduction | Favors high-affinity binding, reducing low-affinity cross-reactions. | Requires platforms capable of precise flow control (e.g., microfluidics). |
| Assay Heterology [62] | Structure of the competing antigen used in the assay | Modulation (can be increased or decreased) | Unpredictable; requires synthesis of multiple antigen derivatives. | A powerful but resource-intensive approach. |
| Chemical Denaturants [62] | pH, ionic strength, urea concentration | Variable Modulation | Highly compound-specific and poorly predictable. | Can impact antibody stability and assay robustness. |
The Scientist's Toolkit: Key Research Reagent Solutions
Table 2: Essential reagents and materials for developing selective multi-analyte assays for pesticide detection.
| Reagent / Material | Function in Assay Development | Application Note |
|---|---|---|
| Monoclonal Antibodies (mAbs) [61] | High-specificity capture agents; recognize a single epitope. | Ideal as primary capture antibodies to establish assay specificity against target pesticides. |
| Polyclonal Antibodies (pAbs) [61] | High-sensitivity detection agents; bind multiple epitopes. | Suitable as detection antibodies; their broader specificity can be managed via dilution and careful pairing with mAbs. |
| Broad-Spectrum Antibodies [64] | Recognize a common core structure of a pesticide class. | Useful for developing assays for the simultaneous screening of multiple pesticides within a chemical class. |
| Aptamers [12] [48] | Synthetic nucleic acid-based recognition elements. | Offer high stability and tunable selectivity; can be selected against specific targets or for broad cross-reactivity. |
| Molecularly Imprinted Polymers (MIPs) [12] | Biomimetic synthetic receptors with tailored cavities. | Provide a robust, stable, and cost-effective alternative to biological recognition elements. |
| Nanomaterial-Modified Electrodes [64] | Signal amplification platforms (e.g., using metal nanoparticles, carbon nanotubes). | Enhance sensitivity, allowing for the use of lower reagent concentrations, which can indirectly improve selectivity [62]. |
Achieving high selectivity in multi-analyte assays for pesticide residues is a multifaceted challenge that extends beyond the simple selection of high-specificity antibodies. As detailed in these application notes, cross-reactivity can be actively managed through strategic optimization of reagent concentrations, interaction kinetics, and assay design. The emerging approach of using cross-reactive elements in array formats, analyzed with chemometric tools, presents a powerful alternative for discriminating complex mixtures. By implementing the protocols and strategies outlined herein, researchers can systematically enhance the reliability and accuracy of their multiplex biosensing platforms, thereby strengthening food safety monitoring systems.
Optimizing Nanomaterial Synthesis and Sensor Fabrication for Reproducibility
The detection of multiple pesticide residues (PRs) represents a significant analytical challenge for food safety and environmental monitoring. Multiplex biosensors, which can simultaneously screen for numerous contaminants, have emerged as a powerful solution. The performance of these biosensors is intrinsically linked to the quality and reproducibility of their constituent nanomaterials. Inconsistent nanomaterial synthesis directly translates to variable sensor properties such as sensitivity, selectivity, and limit of detection, ultimately undermining the reliability of the analytical data. This Application Note provides detailed protocols and insights aimed at overcoming these reproducibility challenges, with a specific focus on synthesizing nanomaterials and fabricating sensors for multiplex PR detection. The principles outlined are designed to integrate seamlessly into a broader research framework dedicated to developing robust multiplex biosensing platforms.
Optimizing Nanomaterial Synthesis for Reproducible Performance
Key Synthetic Parameters and Their Control
The synthesis of nanoparticles, a common recognition element in biosensors, is sensitive to a multitude of variables. Achieving reproducibility requires strict control over these parameters. Microfluidic synthesis offers superior control compared to traditional batch methods, leading to higher quality and more uniform particles [65]. The following table summarizes the critical parameters that must be optimized and controlled for reproducible nanomaterial synthesis.
Table 1: Key Parameters for Reproducible Nanomaterial Synthesis
| Parameter Category | Specific Variables | Impact on Material Properties | Optimization Goal |
|---|---|---|---|
| Chemical Composition | Reagent concentration & stoichiometry [65] | Determines crystallinity, phase, and surface chemistry | Identify precise molar ratios for target structure |
| Type and concentration of modulators (e.g., surfactants, polymers) [65] | Controls particle size, morphology, and dispersion | Prevent aggregation and define particle shape | |
| Physical Conditions | Mixing efficiency (e.g., Dean number in coiled reactors) [65] | Directly influences particle size and size distribution | Achieve uniform and rapid mixing of precursors |
| Aging / reaction time [65] | Affects crystal growth and final particle size | Define exact time for consistent crystallinity | |
| Temperature and pH | Influences reaction kinetics and nucleation | Maintain constant, precise environmental control |
Advanced Synthesis Protocol: Microfluidic Synthesis of Zeolitic Imidazolate Frameworks (ZIFs)
This protocol details the microfluidic synthesis of ZIF nanoparticles, which are excellent candidates for biosensor platforms due to their high surface area and tunable porosity [65]. The use of a coiled tube microreactor is emphasized to leverage Dean flow for enhanced mixing.
Experimental Protocol
- Materials: Metal precursor (e.g., Zinc nitrate hexahydrate), Organic linker (e.g., 2-Methylimidazole), Solvent (e.g., Methanol), Coiled tube microreactor (e.g., 1.5 m length, 750 µm diameter, coiled around a 4.8 mm mandrel), Syringe pumps, Collection vessel.
- Procedure:
- Solution Preparation: Prepare separate solutions of the metal precursor and the organic linker in methanol. The concentrations (e.g., 25 mM) and stoichiometry (e.g., metal:linker = 1:8) should be determined from initial optimization screens [65].
- Reactor Setup: Load the two precursor solutions into separate syringes and mount them on syringe pumps. Connect the syringes to the inlet of the coiled tube microreactor.
- Flow Rate Calibration: Set the flow rates on the syringe pumps to achieve the desired Dean Number (De). The Dean Number is calculated using the equation:
De = (ρQ / μ(1/4)πd) * √(d/2Rc)
where
ρis fluid density,Qis flow rate,μis dynamic viscosity,dis tube diameter, andRcis the radius of the coil curvature [65]. For initial optimization, test values of De = 20, 60, and 100. - Synthesis Execution: Start the syringe pumps simultaneously to introduce the precursor streams into the microreactor. The reagents mix within the coil due to Dean vortices, initiating nanoparticle formation.
- Collection and Aging: Collect the effluent in a vial. Divide the product into aliquots and age for defined periods (e.g., 30 minutes and 24 hours) to study the effect of aging time on particle size and crystallinity [65].
- Washing and Storage: Centrifuge the aged samples to pellet the nanoparticles. Wash twice with methanol and re-disperse in a suitable buffer for storage or immediate use.
Workflow Diagram: Microfluidic Synthesis of Nanoparticles
The following diagram illustrates the logical flow and critical control points in the microfluidic synthesis process.
Sensor Fabrication and Functionalization Protocols
Fabrication of Planar Array Biosensors
Planar array technologies offer high multiplexing capabilities, which are essential for simultaneous detection of multiple pesticide residues [4]. The following protocol describes the functionalization of a planar waveguide for a fluorescence-based array biosensor.
Experimental Protocol
- Materials: Planar waveguide (e.g., patterned glass slide), Avidin or protein A, PDMS flow channel block, Capture antibodies (biotinylated or purified), Sample and analyte solutions, Fluorescently-tagged detection antibodies, CCD camera or scanner.
- Procedure:
- Surface Activation: Clean the waveguide surface thoroughly. For a glass slide, an avidin coating is often applied to allow for biotin-avidin immobilization [4].
- Immobilization of Capture Elements: Using a PDMS block with multiple microchannels, create a "bar-code" pattern by flowing different biotinylated capture antibodies through separate channels, immobilizing them in columns on the avidin-coated surface [4].
- Sample Introduction: Re-orient the PDMS block perpendicularly to the immobilized antibody columns. Introduce the sample solutions containing the target pesticide residues through these channels. Analytes will bind to their specific capture antibodies.
- Signal Generation and Detection: Introduce a solution containing a mixture of fluorescently-labeled detection antibodies. After washing, the fluorescence from the specific immuno-complexes formed at the intersections of the sample and antibody columns is measured using a CCD camera [4]. The signal pattern provides multiplexed detection data.
Biomolecular Immobilization for Biosensing
The quality of the immobilized biological layer is critical for sensor performance. This protocol details a reliable amine-coupling method for attaching ligands to a sensor surface, as used in reflectometric interference spectroscopy (RIfS) and similar label-free techniques [66].
Experimental Protocol
- Materials: Sensor transducer (e.g., SiO₂/Ta₂O₅ coated glass), 3-glycidyloxypropyl-trimethoxysilane (GOPTS), Poly(ethylene glycol) diamine (PEG-DA) and ɑ-methoxy-ω-amino PEG (PEG-MA), Glutaric acid (GA), N,N′-diisopropyl-carbodiimide (DIC) and N-hydroxysuccinimide (NHS), Ligand (e.g., hapten or antibody).
- Procedure:
- Transducer Cleaning and Activation: Clean the transducer first with KOH solution, followed by a piranha solution (3:2 conc. H₂SO₄:H₂O₂ (30%)) to activate the surface. Caution: Piranha solution is highly corrosive and must be handled with extreme care. [66]
- Silane Functionalization: Vapor-deposit or incubate the transducer with GOPTS to introduce epoxy groups to the surface [66].
- PEG Layer Application: Covalently bind a mixture of PEG-DA and PEG-MA (e.g., 1:1000 ratio) onto the GOPTS layer. This PEG layer reduces non-specific binding. The amino groups on PEG-DA serve as subsequent attachment points [66].
- Carboxyl Group Introduction: Convert the amino functions of PEG-DA into carboxyl functions by reacting with glutaric acid (GA) using DIC and NHS as coupling reagents [66].
- Ligand Immobilization: Activate the carboxylated surface with a fresh solution of NHS and DIC. Finally, incubate the transducer with the ligand (e.g., a pesticide hapten) for covalent immobilization via its primary amine groups [66].
Workflow Diagram: Biosensor Fabrication and Assay
This diagram outlines the key steps in fabricating a biosensor and running a multiplexed assay for pesticide residues.
The Scientist's Toolkit: Essential Research Reagent Solutions
The following table catalogs key materials and reagents essential for the experiments described in this note.
Table 2: Essential Research Reagents for Nanomaterial and Biosensor Development
| Reagent / Material | Function / Application | Specific Example / Note |
|---|---|---|
| Microfluidic Coiled Reactor | Provides enhanced mixing via Dean flow for reproducible nanoparticle synthesis [65] | 1.5 m tube, 750 µm diameter, coiled on a 4.8 mm mandrel |
| Zeolitic Imidazolate Framework (ZIF) Precursors | Synthesis of porous nanoparticles for sensor platforms [65] | e.g., Zinc nitrate & 2-Methylimidazole for ZIF-8 |
| Chemical Modulators | Control size and morphology during nanomaterial synthesis [65] | pH-altering agents, surfactants (e.g., CTAB), polar polymers (e.g., PVP) |
| Planar Waveguide | Solid support for immobilizing capture elements in array biosensors [4] | Patterned glass slide with avidin coating |
| PEG-Based Polymer Mix | Creates a low-fouling surface on biosensors to minimize non-specific binding [66] | Mixture of PEG-DA and PEG-MA (e.g., 1:1000 ratio) |
| Amine-Coupling Reagents | Covalently immobilize ligands on sensor surfaces [66] | GOPTS (silane), DIC/NHS (activators) |
| Fluorescent Labels | Tag detection antibodies for signal generation in optical biosensors [4] | e.g., Cy5, AlexaFluor 647 (excited at long wavelengths) |
| Regeneration Solution | Remove bound analyte from the sensor surface for re-use [66] | e.g., Guanidine hydrochloride (6 M, pH 1.5) |
Characterization and Data Analysis for Validation
Quantitative Biomolecular Interaction Analysis (BIA)
After sensor fabrication, quantifying the kinetics of the binding interaction is crucial for understanding sensor performance and reproducibility. This involves evaluating association and dissociation rate constants.
Experimental Protocol for Kinetic Analysis
- Materials: Functionalized biosensor, Analyte solutions at various concentrations, Buffer, Data evaluation software (e.g., commercial packages or open-source like Anabel/EvilFit) [66].
- Procedure:
- Data Collection: Flush the sensor surface with buffer to establish a baseline. Inject a series of analyte concentrations over the immobilized ligand surface, allowing the association to be monitored. Then, switch back to buffer flow to monitor the dissociation phase [66].
- Data Evaluation: Fit the resulting binding curves to an appropriate model (e.g., 1:1 Langmuir binding) to determine the association (
k_a) and dissociation (k_d) rate constants, and the equilibrium dissociation constant (K_D). - Validation: Use multiple mathematical approaches (e.g., linear transformation, integrated rate equation, numerical integration) to cross-validate the results and avoid reliance on a single "black box" software output [66]. Ensure mass transport limitations are minimized by using fast flow rates and low ligand density.
Key Characterization Techniques
Table 3: Advanced Characterization Techniques for Nanomaterials and Biosensors
| Characterization Technique | Information Provided | Role in Ensuring Reproducibility |
|---|---|---|
| Electron Microscopy [67] | Particle size, morphology, and distribution. | Provides direct visual confirmation of batch-to-batch consistency in nanomaterial synthesis. |
| Spectroscopic Techniques [67] | Chemical composition, surface functional groups, and bonding. | Verifies correct chemical structure and successful functionalization of sensor surfaces. |
| Reflectometric Interference Spectroscopy (RIfS) [66] | Label-free, time-resolved monitoring of biomolecular binding events. | Enables quantitative determination of binding kinetics, a key metric for biosensor performance. |
| Surface Plasmon Resonance (SPR) [4] | Label-free, real-time analysis of biomolecular interactions. | Used for high-throughput characterization of ligand-analyte binding affinity and specificity. |
The reproducibility of multiplex biosensors for pesticide residue detection is fundamentally dependent on the rigorous optimization and control of nanomaterial synthesis and sensor fabrication processes. By adopting the detailed protocols and methodologies outlined in this document—including microfluidic synthesis with controlled Dean flow, standardized surface functionalization, and validated characterization techniques—researchers can significantly enhance the reliability and performance of their biosensing platforms. This structured approach to development and validation is essential for generating high-quality, reproducible data that meets the stringent demands of modern analytical science.
The detection of multiple pesticide residues is a critical challenge in ensuring food safety and environmental health. Traditional laboratory methods, while accurate, are often ill-suited for rapid, on-site screening. The integration of multiplex biosensors with portable platforms represents a paradigm shift, enabling simultaneous, specific, and quantitative analysis of several analytes directly in the field [68] [69]. This convergence of microfluidics, lateral flow assays, and smartphone-based readouts creates powerful, user-friendly diagnostic tools. These systems leverage the miniaturization and automation of microfluidic devices, the simplicity and rapidity of lateral flow principles, and the ubiquitous processing power, connectivity, and imaging capabilities of smartphones [70] [71]. This document provides detailed application notes and experimental protocols for developing and utilizing these integrated platforms within a research context focused on multiplexed pesticide residue detection.
Application Notes
The successful deployment of portable biosensing platforms hinges on the synergistic integration of their core components. The design choices at each stage directly impact the sensor's performance, including its sensitivity, multiplexing capacity, and ease of use.
Core Components and Design Considerations
Microfluidic Device Fabrication
Microfluidic chips form the physical foundation of the sensor, handling fluid manipulation and housing the sensing elements.
Material Selection: The choice of material is critical and depends on the intended application, detection method, and fabrication resources.
- Polydimethylsiloxane (PDMS): Widely used for its excellent optical transparency, flexibility, and ease of fabrication via soft lithography. It is suitable for optical detection (colorimetric, fluorescence) but can suffer from nonspecific adsorption of molecules and is not ideal for organic solvents [72] [71].
- Polymethylmethacrylate (PMMA): A thermoplastic polymer offering good optical clarity and chemical resistance. It is often fabricated via injection molding or laser cutting, making it suitable for cost-effective mass production [72] [71].
- Paper: Paper-based microfluidic devices (µPADs) are extremely low-cost and leverage capillary action for fluid transport, eliminating the need for external pumps. They are ideal for simple colorimetric lateral flow assays and are highly disposable [72] [73].
- Glass and Silicon: Offer superior chemical stability and optical properties but are more expensive and require complex fabrication processes, such as photolithography and etching, often in cleanroom environments [72] [71].
Design and Fabrication: Channel geometry is designed using software like AutoCAD or COMSOL to control fluid flow, mixing, and reaction kinetics. For multiplexing, designs incorporate multiple parallel channels or distinct reaction chambers to allow for the simultaneous detection of different pesticides [71]. Fabrication involves creating a master mold (for PDMS) or direct machining (for PMMA), followed by bonding to a substrate to enclose the channels.
Smartphone Integration and Readout Modalities
The smartphone acts as the system's brain, providing power, illumination, detection, and data processing.
Imaging Modalities: Smartphone cameras are primarily used for optical detection.
- Bright-field Imaging: Used for colorimetric assays, where the concentration of the target analyte induces a color change that the camera captures [70].
- Fluorescence Imaging: Offers higher sensitivity than colorimetric detection. This requires additional attachments like LED excitation sources and emission filters to integrate with the smartphone [70] [74].
Data Acquisition and Communication: Smartphones can connect to sensing modules via wired (USB, audio jack) or wireless peripherals (Bluetooth, Wi-Fi, NFC) [68]. This allows for power delivery, data transfer, and communication with cloud servers for advanced data analysis and storage. Custom smartphone applications (Apps) are developed to control the hardware, capture images or spectra, process data, and display quantitative results [68] [70] [74].
Recognition Elements and Transduction Mechanisms
The biological or chemical recognition element provides specificity, while the transducer converts the binding event into a measurable signal.
Recognition Elements:
- Aptamers: Single-stranded DNA or RNA molecules that bind to specific targets with high affinity. They are stable, synthetically produced, and easily modified, making them excellent for pesticide detection [69] [2].
- Enzymes: Used in assays where the pesticide inhibits enzyme activity (e.g., organophosphates inhibiting acetylcholinesterase), leading to a measurable signal change [69] [22].
- Antibodies: Provide high specificity and are commonly used in immunoassay formats, including lateral flow assays [73].
Transduction Mechanisms:
- Optical Detection: Includes colorimetric, fluorescence, and Surface-Enhanced Raman Scattering (SERS). SERS utilizes nanostructured metal surfaces to greatly amplify Raman signals, providing a unique molecular "fingerprint" and very high sensitivity for pesticide identification [69] [22].
- Electrochemical Detection: Measures electrical signals (current, potential, impedance) resulting from biochemical reactions. Electrochemical sensors are highly sensitive, can be miniaturized effectively, and are well-suited for integration with microfluidics [69] [75].
Table 1: Comparison of Detection Modalities for Portable Pesticide Biosensors.
| Detection Modality | Principle | Advantages | Limitations | Example Limits of Detection (Pesticides) |
|---|---|---|---|---|
| Colorimetric | Measurement of color intensity change | Simple, low-cost, intuitive visual readout | Lower sensitivity, susceptible to sample matrix interference | Varies; typically in µM range [69] |
| Fluorescence | Measurement of light emission upon excitation | High sensitivity, quantitative | Can require complex probe design, background fluorescence | Varies; can achieve nM to pM levels [2] |
| Electrochemical | Measurement of electrical signal change | High sensitivity, portability, low cost | Sensor fouling, requires stable reference electrode | Picomolar levels achievable [69] |
| SERS | Enhancement of Raman signals on nanostructures | Provides molecular fingerprint, ultra-sensitive | Signal uniformity, complex substrate fabrication | e.g., Chlorpyrifos: 220.35 pg/mL [22] |
| LSPR | Shift in resonance peak of nanostructures | Label-free, highly sensitive, real-time monitoring | Requires precise nanofabrication, spectrometer needed | Demonstrated for biomarkers [74] |
Multiplexing Strategies and Fluid Handling
- Spatial Multiplexing: This is the most common approach, where different recognition elements (e.g., aptamers for different pesticides) are immobilized in distinct spatial locations on the chip or strip (e.g., different channels, wells, or spots on a vertical flow array) [68] [70]. The smartphone camera captures the signal from each location simultaneously, allowing for parallel analysis.
- Fluid Handling: For lab-on-a-chip microfluidics, fluid control can be achieved using capillary forces, integrated finger pumps, or passive vacuum pumps, eliminating the need for bulky external equipment [70] [71]. In lateral flow and paper-based devices, the wicking property of the material itself drives the fluid.
Experimental Protocols
Protocol: Fabrication of a Multiplexed Paper-based Microfluidic Device for Colorimetric Pesticide Detection
Objective: To create a disposable, multiplexed µPAD for the semi-quantitative colorimetric detection of two different pesticide classes using enzyme inhibition assays.
Research Reagent Solutions & Essential Materials:
Table 2: Key Research Reagent Solutions and Materials.
| Item | Function/Description |
|---|---|
| Whatman Chromatography Paper #1 | Porous cellulose matrix for creating microfluidic channels. |
| Wax Printer or Hydrophobic Barrier Pen | To define hydrophobic boundaries and create hydrophilic channels. |
| Acetylcholinesterase (AChE) Enzyme | Biological recognition element; inhibited by organophosphates/carbamates. |
| Acetylthiocholine Iodide (ATCh) | Enzyme substrate. |
| 5,5'-Dithio-bis-(2-nitrobenzoic acid) (DTNB) | Chromogenic agent; produces yellow color upon reaction with thiocholine. |
| Alkaline Phosphatase (ALP) Enzyme | Biological recognition element for other pesticide classes (protocol adaptable). |
| p-Nitrophenyl Phosphate (pNPP) | ALP substrate; produces yellow color when dephosphorylated. |
| Positive Control Pesticide Standards | e.g., Chlorpyrifos (for AChE inhibition). |
| Smartphone with Custom App | For image capture and color intensity analysis. |
| 3D-Pprinted Imaging Box | To provide consistent, uniform lighting conditions. |
Procedure:
Chip Design and Fabrication:
- Design a chip with two independent detection zones using design software (e.g., AutoCAD).
- Print the design onto the chromatography paper using a wax printer. Alternatively, draw the hydrophobic barriers manually using a hydrophobic barrier pen.
- Heat the paper on a hotplate at ~100°C for 1-2 minutes to allow the wax to melt and penetrate through the paper, forming a complete hydrophobic barrier.
Biochemical Functionalization:
- Zone 1 (AChE Inhibition Assay): Spot 1 µL of AChE enzyme solution onto the first detection zone. Allow it to dry at room temperature.
- Zone 2 (ALP Inhibition Assay - Example): Spot 1 µL of ALP enzyme solution onto the second detection zone. Allow it to dry.
- Store the functionalized chips in a desiccator at 4°C until use.
Sample Preparation and Assay Execution:
- Prepare standard solutions of the target pesticides in a suitable buffer or a known negative sample (as a control).
- Pre-mix the sample/extract with a solution containing the substrates (ATCh + DTNB for Zone 1; pNPP for Zone 2).
- Apply 50-100 µL of the mixture to the sample inlet of the µPAD.
- Allow the fluid to migrate via capillary action through the paper to the detection zones (5-10 minutes).
Signal Acquisition and Data Analysis:
- Place the µPAD inside a 3D-printed imaging box with consistent LED illumination to minimize ambient light variations.
- Use a smartphone mounted on a stand to capture an image of the µPAD.
- A custom smartphone app (e.g., developed using OpenCV) converts the image from RGB to a suitable color space (e.g., grayscale, HSV). The app then defines Regions of Interest (ROIs) over each detection zone and calculates the mean color intensity.
- The intensity values are inversely correlated with pesticide concentration (higher pesticide concentration leads to more enzyme inhibition, less product formation, and lower color intensity). Quantification is achieved by comparing the signal to a pre-loaded standard curve.
Protocol: Development of a Smartphone-based LSPR Biosensor with Microfluidics
Objective: To construct a label-free, quantitative biosensor for a specific pesticide using an LSPR chip integrated with a microfluidic channel and a smartphone spectrometer.
Procedure:
LSPR Chip Fabrication (Gold Nanoparticles - AuNPs):
- Clean a glass or quartz substrate with piranha solution (Caution: Highly corrosive) and dry with nitrogen.
- Use a metal mask to define a sensor array on the substrate.
- Deposit a thin film of gold (e.g., 8 nm) using an electron beam evaporator.
- Anneal the substrate at a high temperature (e.g., 560°C for 5 hours) to dewet the gold film and form AuNPs [74].
- Characterize the size and distribution of AuNPs using Scanning Electron Microscopy (SEM).
Surface Functionalization with Aptamer:
- Immerse the LSPR chip in a solution of thiolated DNA aptamer specific to the target pesticide (e.g., 1 µM in PBS) for 12-24 hours. This forms a self-assembled monolayer (SAM) on the AuNP surface via gold-thiol chemistry.
- Rinse the chip with buffer to remove unbound aptamers.
- Passivate the remaining gold surface with a mercaptoalkane (e.g., 6-mercapto-1-hexanol) to minimize nonspecific binding.
Microfluidic Integration and Smartphone Spectrometer Assembly:
- Bond a PDMS slab with a microfluidic channel (fabricated via soft lithography) onto the LSPR chip, ensuring the channel aligns with the sensor array.
- Assemble the optical attachment for the smartphone. This typically includes a white LED light source, a collimating lens, a polarization filter, a diffraction grating, and a slit, all housed in a 3D-printed case that attaches firmly to the smartphone [74].
- The LSPR chip is placed in a holder such that the transmission spectrum through the chip is diffracted by the grating and projected onto the smartphone camera.
Detection and Data Analysis:
- Connect the chip to a syringe pump via tubing for controlled sample injection.
- Flow buffer (baseline) through the microfluidic channel and use the smartphone app to capture the reference transmission spectrum. The LSPR peak wavelength (λ_max) is recorded.
- Inject the sample containing the target pesticide. The binding of the pesticide to the immobilized aptamer causes a change in the local refractive index, leading to a measurable shift in the LSPR peak (Δλ).
- The smartphone app tracks the peak shift in real-time. The magnitude of Δλ is proportional to the concentration of the bound pesticide, allowing for quantification against a calibration curve.
Visualization of Workflows
Multiplexed Biosensor Assay Workflow
This diagram illustrates the general workflow for a multiplexed detection assay, from sample introduction to result analysis.
Smartphone-Based LSPR Biosensing Platform
This diagram details the components and signal flow in a smartphone-based LSPR biosensing system.
Benchmarking Performance: Validation Against Gold Standards and Future Prospects
The accurate detection of multiple pesticide residues is a critical challenge in environmental monitoring and food safety. Within the broader context of developing multiplex biosensors for pesticide screening, techniques like Liquid Chromatography-Tandem Mass Spectrometry (LC-MS/MS) and Gas Chromatography-Mass Spectrometry (GC-MS) provide the gold-standard validation and foundational performance metrics against which new biosensor technologies are benchmarked [76] [77]. This application note provides a detailed comparative analysis of LC-MS/MS and GC-MS, focusing on the core parameters of sensitivity, specificity, and throughput, which are essential for researchers and scientists developing and validating novel detection platforms.
Core Principle Comparison
The fundamental difference between these techniques lies at the chromatography stage. LC-MS/MS uses a liquid mobile phase to separate compounds based on their affinity for a stationary phase, making it ideal for polar, thermally labile, and high-molecular-weight molecules [78] [79]. In contrast, GC-MS relies on a gaseous mobile phase to separate compounds based on their volatility and thermal stability, making it superior for volatile and semi-volatile organic compounds [80] [79].
The ionization techniques further define their applications. LC-MS/MS typically uses "soft" ionization like Electrospray Ionization (ESI), which produces abundant molecular ions with little fragmentation, which is ideal for precise quantification [76]. GC-MS traditionally uses "hard" ionization like Electron Impact (EI), which generates extensive, reproducible fragment patterns that are excellent for library-based identification [80].
Diagram 1: Technique Selection Workflow for Pesticide Analysis.
Performance Metrics: Sensitivity, Specificity, and Throughput
Quantitative Performance Comparison
The following table summarizes the key performance characteristics of LC-MS/MS and GC-MS for pesticide analysis, particularly in the context of water and environmental samples [77].
Table 1: Performance Comparison for Pesticide Analysis
| Parameter | LC-MS/MS | GC-MS | Notes & Context |
|---|---|---|---|
| Typical Sensitivity (LOD) | Sub-ng/L to low ng/L range achievable [77] | Sub-ng/L to low ng/L range achievable [77] | Performance is compound and matrix-dependent. |
| Specificity | High (via SRM/MRM) | High (via SIM) | LC-MS/MS uses Selective Reaction Monitoring; GC-MS uses Selective Ion Monitoring [77]. |
| Analytical Scope | Broad: polar pesticides, estrogens, conjugates [77] | Narrower: volatile/semi-volatile compounds [77] | LC-MS/MS can analyze highly water-soluble EDCs without derivatization [77]. |
| Sample Preparation | Minimal: Often "dilute-and-shoot" [81] [82] | More Complex: Often requires extraction & derivatization [81] [80] | Simpler prep for LC-MS/MS increases throughput and reduces cost [82]. |
| Analysis Time | Shorter run times (e.g., 2-5 min with UHPLC) [76] | Longer run times common | Faster LC cycles enhance throughput in high-volume labs [82]. |
| Derivatization | Not required | Often required for non-volatile pesticides | Derivatization adds complexity, time, and cost to GC-MS [80]. |
Advantages and Pitfalls in Environmental Analysis
A direct comparison for analyzing endocrine-disrupting chemicals (EDCs) in surface waters found that both techniques can perform comparably for many target analytes [77]. However, key distinctions exist:
- GC-MS/MS Advantage: Demonstrates superior performance for legacy organochlorine pesticides (e.g., DDT and its metabolites) [77].
- LC-MS/MS Advantage: Excels at simultaneously analyzing highly water-soluble EDCs (e.g., estrogens and their conjugates) alongside modern pesticides, all without derivatization [77]. It also showed higher sensitivity for certain benzodiazepines in urine, a relevant model for complex sample matrices [81].
Experimental Protocols
Protocol 1: Multi-Residue Pesticide Analysis via LC-MS/MS
This protocol is adapted for the analysis of polar pesticides and hormones in water samples, optimized for high throughput [77] [83].
Workflow Diagram: LC-MS/MS Analysis
Diagram 2: LC-MS/MS Workflow for Pesticide Analysis.
Sample Preparation:
- Collect water samples and filter through a 0.45 µm glass fiber filter.
- Adjust the sample pH to 7.0 ± 0.5.
- Perform Solid-Phase Extraction (SPE) using a suitable mixed-mode polymer sorbent cartridge (e.g., Oasis HLB). Condition cartridges with methanol and water. Load the sample, wash with a water-methanol mixture, and elute with a solvent like ethyl acetate [77].
- Evaporate the eluent to dryness and reconstitute in a methanol-water mixture for LC-MS/MS analysis [77].
Instrumental Analysis - LC Conditions:
Instrumental Analysis - MS/MS Conditions:
- Ionization: Electrospray Ionization (ESI), with positive/negative polarity switching in a single run [77].
- Acquisition Mode: Scheduled Selected Reaction Monitoring (SRM) or Multiple Reaction Monitoring (MRM).
- Source Temperature: 300°C.
- Gas Flow: Optimize nitrogen or compressed air for nebulizing, drying, and collision gases.
Protocol 2: Multi-Residue Pesticide Analysis via GC-MS
This protocol is suited for volatile and semi-volatile pesticides, including organochlorines, in environmental samples [77].
Workflow Diagram: GC-MS Analysis
Diagram 3: GC-MS Workflow for Pesticide Analysis.
Sample Preparation:
- Extract water samples with a suitable organic solvent (e.g., ethyl acetate) via liquid-liquid extraction [77].
- For compounds that are not sufficiently volatile or are thermally labile, a derivatization step is required. A common reagent is N-tert-butyldimethylsilyl-N-methyltrifluoroacetamide (MTBSTFA) with 1% tert-butyldimethylchlorosilane [82].
- The derivatization procedure involves adding the reagent to the dried extract, vortexing, and incubating at 65°C for 20 minutes [82].
Instrumental Analysis - GC Conditions:
- Column: HP-ULTRA 1 or equivalent (15-30 m, 0.20-0.25 mm ID, 0.33 µm film thickness).
- Carrier Gas: Helium, constant flow of 0.9-1.0 mL/min.
- Injection: Pulsed splitless mode, 250°C.
- Oven Program: Start at 60-80°C, ramp at 20-30°C/min to 300°C.
- Run Time: 15-30 minutes.
Instrumental Analysis - MS Conditions:
- Ionization: Electron Impact (EI) at 70 eV.
- Ion Source Temperature: 230-250°C.
- Acquisition Mode: Selected Ion Monitoring (SIM) for highest sensitivity in targeted analysis, or Full Scan (e.g., 50-550 m/z) for library searching.
The Scientist's Toolkit: Key Research Reagent Solutions
Table 2: Essential Materials for Pesticide Residue Analysis by MS
| Item | Function | Example Use Case |
|---|---|---|
| Mixed-Mode SPE Cartridges | Extracts a wide range of analytes with varying polarity from aqueous samples. | Pre-concentrating polar pesticides and hormones from water for LC-MS/MS analysis [77]. |
| C18 UHPLC Columns | Provides fast, high-efficiency separation of complex mixtures. | Separating multiple pesticide residues and their metabolites in a short run time (e.g., <5 min) [83]. |
| Derivatization Reagents | Increases volatility and thermal stability of non-volatile analytes. | Enabling the analysis of polar pesticide degradants by GC-MS (e.g., using MTBSTFA) [82]. |
| Deuterated Internal Standards | Corrects for matrix effects and losses during sample preparation. | Quantifying pesticides in complex matrices like soil or food extracts via both LC- and GC-MS [81] [82]. |
| pH-Modified Mobile Phases | Controls ionization efficiency and retention in LC-MS. | Enabling single-run analysis of acidic and basic pesticides using wrong-way-round ionization at high pH [77]. |
LC-MS/MS and GC-MS are powerful, complementary techniques for pesticide residue analysis. The choice between them is primarily dictated by the physicochemical properties of the target analytes. LC-MS/MS offers a broader analytical scope for polar and thermally labile pesticides, with significant advantages in sample preparation simplicity and throughput, making it suitable for high-volume screening [81] [77]. GC-MS remains the gold standard for volatile and semi-volatile compounds, particularly legacy pesticides like DDT, offering robust and reproducible results [77]. For comprehensive multiplex pesticide detection projects, a hybrid approach utilizing both techniques often provides the most complete analytical picture and serves as a robust validation tool for novel biosensor technologies.
Validation Protocols and Regulatory Considerations for Biosensor Approval
The increasing global demand for food safety has accelerated the need for reliable multiplex biosensor technologies capable of detecting multiple pesticide residues simultaneously. Unlike single-analyte detection methods, multiplex biosensors present unique validation challenges due to their complex recognition elements, signal transduction mechanisms, and potential cross-reactivity issues. Regulatory approval of these sophisticated analytical devices requires rigorous demonstration of accuracy, precision, specificity, and reliability under real-world conditions. This application note provides comprehensive validation protocols and regulatory frameworks specifically tailored for multiplex biosensors targeting pesticide residues, addressing a critical gap in current scientific literature between technological innovation and regulatory acceptance. The guidance presented herein is designed to ensure that novel biosensor platforms meet stringent regulatory standards while maintaining the practical utility required for field deployment in agricultural and food safety applications.
Validation Framework for Multiplex Biosensors
Analytical Performance Parameters
Establishing comprehensive analytical performance parameters forms the foundation of any biosensor validation protocol. For multiplex systems detecting multiple pesticide residues, each analyte must be individually characterized while also evaluating system performance in complex mixture scenarios. The validation workflow should progress from basic sensitivity and specificity assessments to more complex interference and cross-reactivity studies, culminating in real-sample analysis. This hierarchical approach ensures that potential failure points are identified early in the development process, saving considerable time and resources during regulatory submission.
Key analytical parameters must be established for each target pesticide in the multiplex panel, with particular attention to cross-reactivity profiles between structurally similar compounds. For organophosphates, pyrethroids, carbamates, and other common pesticide classes, matrix effects can significantly impact biosensor performance, necessitating validation in relevant food matrices such as fruits, vegetables, and grains. The shelf-life stability of recognition elements (aptamers, antibodies, enzymes) and the entire biosensor system must be documented through accelerated stability studies under various environmental conditions [84] [48].
Table 1: Required Analytical Performance Parameters for Multiplex Pesticide Biosensors
| Parameter | Target Specification | Testing Methodology | Acceptance Criteria |
|---|---|---|---|
| Limit of Detection (LOD) | Sub-ppb for regulated pesticides | Serial dilution in matrix | ≤ MRL/10 for each pesticide |
| Linear Range | Covering 0.1x to 10x MRL | Calibration curve in matrix | R² ≥ 0.99 for each analyte |
| Accuracy | Minimal bias vs. reference method | Spiked recovery in 5+ matrices | 80-120% recovery for each pesticide |
| Precision | Consistent performance | Inter-day, intra-day, inter-operator | CV ≤ 15% for each analyte |
| Cross-reactivity | Minimal interference | Challenge with structural analogs | ≤ 5% signal change for non-targets |
| Sample-to-result Time | Field-deployable | Timing from sample application | ≤ 30 minutes for full panel |
Technical and Clinical Validation
The validation pathway for multiplex pesticide biosensors follows a staged approach mirroring the "evidence ladder" concept recognized by regulatory bodies [85]. Initial technical validation focuses on basic sensor functionality under controlled laboratory conditions, progressing to clinical validation in intended-use environments with authentic samples. This systematic de-risking strategy builds compelling evidence for both regulatory approval and stakeholder adoption.
Technical validation begins with biosensor construction verification, including characterization of recognition elements (aptamer affinity constants, antibody specificity), transducer performance (signal-to-noise ratio, detection limits), and system integration (fluidics, electronics, software). For aptamer-based biosensors, this includes determining dissociation constants (Kd) through fluorescence-based affinity assays, with reported values typically ranging from 0.173 to 1.577 μM for high-affinity binders [84]. Molecular docking simulations and base mutation analyses further validate aptamer-target interactions and identify critical binding interfaces [84].
Clinical validation demonstrates biosensor performance in realistic scenarios, comparing results against gold-standard reference methods like LC-MS/MS across diverse sample matrices. A recent multiplex biosensor for phthalate detection demonstrated 94.18%-110.43% concordance with LC-MS results, establishing a benchmark for validation against regulatory methods [84]. This stage should include inclusivity/exclusivity testing with samples of varying compositions and from different geographical sources to ensure robust performance across the intended use population [85] [48].
Experimental Protocols
Multiplex Aptamer Biosensor Protocol for Pesticide Detection
This protocol details the development and validation of a gold nanoparticle (AuNP)/aptamer-based visual detection platform for simultaneous detection of multiple pesticides, adapted from recent advances in phthalate detection [84]. The platform leverages the specific binding properties of DNA aptamers with the optical properties of AuNPs for colorimetric detection without requiring sophisticated instrumentation.
Materials and Equipment
- Screen-printed carbon electrodes or lateral flow strips
- Gold nanoparticles (20-40 nm diameter)
- Custom-synthesized aptamers for target pesticides (HPLC purified)
- Nitrocellulose membrane (for lateral flow platforms)
- Sample application pads and absorbent pads
- Phosphate buffered saline (PBS, 0.1 M, pH 7.4) with 0.1% Tween 20
- Magnetic separation rack (for paramagnetic bead-based separation)
- Portable strip reader or smartphone-based detection setup
Procedure
- Aptamer Functionalization: Incubate AuNPs with thiol-modified aptamers (1:200 molar ratio) in PBS buffer for 16 hours at 4°C. Stabilize with 0.1% SDS and centrifuge at 14,000 rpm for 30 minutes. Resuspend in storage buffer (PBS with 0.1% BSA and 0.05% sodium azide).
Biosensor Assembly: For lateral flow platforms, deposit aptamer-functionalized AuNPs on conjugate pads. Spray capture probes (complementary DNA sequences or competitor molecules) onto nitrocellulose membrane in discrete test lines. Assemble with sample pad and absorbent pad in cassette.
Sample Preparation: Homogenize food samples (1 g) with extraction buffer (5 mL acetonitrile:water, 8:2). For liquid samples, dilute 1:1 with running buffer. Filter through 0.45 μm membrane prior to analysis.
Detection Protocol: Apply 100 μL processed sample to sample well. Allow capillary flow for 15 minutes. For quantitative results, capture strip image with smartphone camera and analyze intensity of test lines using colorimetric analysis software.
Data Analysis: Generate calibration curves for each pesticide by plotting test line intensity against concentration. Calculate cross-reactivity by testing each aptamer against non-target pesticides in the panel.
Validation Parameters
- Determine LOD for each pesticide through serial dilution approaching the maximum residue limit (MRL)
- Assess precision through intra-assay (n=8) and inter-assay (n=3 days) CV measurements
- Verify accuracy through spike-recovery studies at 0.5x, 1x, and 2x MRL concentrations
- Evaluate robustness by testing under different environmental conditions (temperature 18-30°C, humidity 30-70%)
SERS-Based Multiplex Biosensor Protocol
Surface-enhanced Raman spectroscopy (SERS) biosensors combine molecular specificity of recognition elements with the exceptional sensitivity of plasmonic nanostructures, enabling multiplex detection with single-molecule sensitivity [48]. This protocol describes a SERS biosensor incorporating antibodies or aptamers for pesticide recognition.
Materials and Equipment
- SERS-active substrate (Au or Ag nanostructures on silicon or glass)
- Raman spectrometer with 785 nm or 633 nm laser excitation
- Recognition elements (antibodies, aptamers) for target pesticides
- Raman reporter molecules (e.g., 4-mercaptobenzoic acid, malachite green)
- Microfluidic flow cell (optional)
- Washing buffer (PBS with 0.05% Tween 20)
Procedure
- SERS Substrate Preparation: Fabricate Au/Ag nanostructured substrates through electron beam lithography or chemical synthesis. Characterize enhancement factor using benzenethiol as probe molecule.
Biosensor Functionalization: Immobilize capture probes (aptamers or antibodies) on SERS substrate through thiol-gold chemistry or EDC/NHS coupling. Block non-specific sites with 1% BSA for 1 hour.
Assay Format: For competitive format, pre-incubate samples with Raman reporter-labeled pesticides. For sandwich format (larger molecules), use reporter-labeled detection antibodies.
SERS Measurement: Place functionalized substrate in flow cell or measurement chamber. Acquire spectra with 5-10 second integration time. For multiplex detection, use distinct Raman reporters for different pesticides.
Data Processing: Preprocess spectra (background subtraction, smoothing). Employ multivariate analysis (PCA, PLS) for quantification of multiple pesticides simultaneously.
Validation Approach
- Establish calibration models for each pesticide using partial least squares regression
- Validate model performance with independent test set not used in calibration
- Assess specificity by testing against common interferents in food matrices
- Determine LOD for each pesticide by progressively decreasing concentration
Figure 1: Biosensor validation pathway progressing through analytical, technical, and clinical stages before regulatory submission.
Regulatory Considerations
Global Regulatory Landscape
Navigating the global regulatory landscape requires understanding region-specific requirements for biosensor approval. While fundamental performance standards are consistent across jurisdictions, implementation details vary significantly. The FDA's Digital Health Innovation Action Plan and the EMA's initiatives on real-world evidence collection have created frameworks supporting biosensor integration into regulatory submissions [86]. For pesticide detection biosensors, additional considerations include alignment with agricultural and food safety regulations governing maximum residue limits (MRLs) and monitoring methodologies.
In the United States, biosensors intended for pesticide detection may fall under FDA jurisdiction if related to food safety, or Environmental Protection Agency (EPA) oversight if deployed for environmental monitoring. The FDA's approach follows a risk-based classification system, with most biosensors classified as Class II moderate-risk devices [86]. The recently issued "Artificial Intelligence-Enabled Device Software Functions" guidance (2025) introduces a Total Product Life Cycle (TPLC) approach particularly relevant to biosensors incorporating machine learning algorithms [87].
The European Union's In Vitro Diagnostic Regulation (IVDR) establishes stringent requirements for clinical evidence, performance evaluation, and post-market surveillance. Under IVDR, pesticide detection biosensors would typically fall under Class A or B depending on their intended use and associated risks [86]. Asia-Pacific regulations vary significantly, with Japan's PMDA offering expedited pathways for innovative technologies through the SAKIGAKE system, while China's NMPA maintains stringent localization requirements for clinical data [86].
Table 2: Regulatory Requirements Across Major Jurisdictions
| Region | Primary Authority | Key Regulations | Device Classification | Clinical Evidence Requirements |
|---|---|---|---|---|
| United States | FDA | FD&C Act, Digital Health Software Precertification | Class I/II based on intended use | Analytical and clinical validation per intended use |
| European Union | EMA | IVDR, MDR, GDPR | Class A-C based on risk level | Performance evaluation with intended user population |
| China | NMPA | Medical Device Regulation, Digital Health Guidelines | Class I-III with localization requirements | Local clinical trials for Class II/III devices |
| Japan | PMDA | Pharmaceutical and Medical Device Act, SAKIGAKE | Category 1-4 based on risk | Clinical data acceptable from foreign studies |
| International | IMDRF | Risk categorization guidelines | Based on intended use and risk | Analytical validation and clinical utility |
Quality Management and Standards Compliance
Implementing a robust Quality Management System (QMS) is fundamental to regulatory success. ISO 13485 provides the framework for medical device QMS, while specific technical standards govern biosensor design and validation. For multiplex pesticide biosensors, key standards include ISO 17025 for testing laboratory competence, ISO 10993 for biocompatibility of patient-contact components, and IEC 62304 for medical device software [85].
Documentation requirements extend throughout the device lifecycle, from design controls to post-market surveillance. Design history files must demonstrate rigorous verification and validation activities, while the device master record comprehensively defines manufacturing specifications. For biosensors incorporating artificial intelligence components, the FDA's Predetermined Change Control Plan (PCCP) framework provides a structured approach to managing algorithm updates while maintaining regulatory compliance [87].
Post-market surveillance requirements under the EU's IVDR and FDA's Quality System Regulation mandate systematic monitoring of device performance in the field. This includes establishing procedures for complaint handling, adverse event reporting, and corrective/preventive actions. For multiplex pesticide biosensors, this may involve tracking false positive/negative rates across different food matrices and geographic regions [85] [86].
The Scientist's Toolkit
Research Reagent Solutions
Table 3: Essential Research Reagents for Multiplex Pesticide Biosensor Development
| Reagent Category | Specific Examples | Function in Biosensor Development | Key Considerations |
|---|---|---|---|
| Recognition Elements | DNA aptamers, monoclonal antibodies, molecularly imprinted polymers | Target capture and specificity | Cross-reactivity profile, stability, binding affinity (Kd) |
| Signal Transducers | Gold nanoparticles, quantum dots, fluorophores, enzymes (HRP, AP) | Signal generation and amplification | Brightness, stability, conjugation efficiency, background |
| Platform Materials | Screen-printed electrodes, nitrocellulose membranes, microfluidic chips | Biosensor assembly and sample processing | Reproducibility, lot-to-lot variation, flow characteristics |
| Reference Materials | Certified pesticide standards, characterized food samples | Method validation and calibration | Purity, stability, matrix-matched calibration |
| Buffer Components | Blocking agents (BSA, casein), surfactants (Tween 20), preservatives | Assay optimization and stabilization | Non-specific binding reduction, sample compatibility |
Technology Selection Framework
Figure 2: Biosensor technology selection framework based on application requirements and deployment context.
The development of multiplexed biosensors for detecting multiple pesticide residues represents a transformative advancement in food and environmental safety monitoring. Traditional analytical techniques such as high-performance liquid chromatography (HPLC) and gas chromatography-mass spectrometry (GC-MS/MS), while highly sensitive and reproducible, present significant economic challenges for laboratories requiring high-throughput screening [88] [28]. These methods typically involve complex operational procedures, extended processing times, and require specialized technical expertise, thereby increasing operational costs and limiting applicability for rapid on-site screening [28]. In contrast, multiplexed nanobiosensors—which leverage the unique properties of quantum dots (QDs), gold nanoparticles, and other nanomaterials—enable simultaneous detection of hundreds of pesticide compounds in a single analysis, dramatically improving operational efficiency [89] [88].
Performing a systematic cost-benefit analysis (CBA) is essential for research laboratories and commercial facilities seeking to implement these emerging detection platforms. A well-structured CBA evaluates the financial implications of equipment acquisition, operational workflows, and per-test costs against the anticipated benefits of improved throughput, faster results, and reduced reagent consumption [90]. This analysis follows a defined methodology involving the enumeration of all relevant costs and benefits, assignment of appropriate monetary values, and calculation of key financial metrics such as the cost-benefit ratio and net present value (NPV) [91]. For multiplex biosensing technologies, the significant advantages include the capability to detect multiple biomarkers qualitatively or quantitatively in a single sample, resulting in more data points from single samples, reduced cost per data point, fewer errors due to fewer samples, and increased throughput [89]. This application note provides a detailed framework for conducting a comprehensive cost-benefit analysis specific to multiplex biosensor platforms for pesticide residue detection, enabling researchers and laboratory managers to make financially informed decisions about technology adoption.
Quantitative Cost-Benefit Analysis
Cost and Benefit Components for Multiplex Biosensors
A thorough cost-benefit analysis for multiplex biosensor implementation requires careful consideration of all relevant cost components and potential benefits. Table 1 provides a detailed breakdown of these elements, categorized for systematic evaluation.
Table 1: Cost and Benefit Components for Multiplex Biosensor Implementation
| Category | Component | Description | Considerations for Multiplex Biosensors |
|---|---|---|---|
| Costs | Equipment Acquisition | Initial capital investment in instrumentation [88] | Spectrofluorimeters, microplate readers, or custom optical sensing systems; typically lower cost than chromatographic systems [28]. |
| Consumables & Reagents | Ongoing expenses for test execution [90] | Nanomaterials (QDs, AuNPs), antibodies, chemical modifiers; may be higher initially due to specialized nanomaterials [89]. | |
| Personnel & Labor | Staff time for assay development and execution [88] | Requires expertise in nanomaterial functionalization and assay optimization; training requirements differ from traditional methods [89]. | |
| Facility & Overhead | Laboratory space, utilities, maintenance [90] | Standard laboratory facilities typically suffice; minimal special requirements compared to dedicated chromatography labs. | |
| Validation & Compliance | Ensuring regulatory acceptance [88] | Method validation against established techniques (e.g., GC-MS/MS) for multiple pesticides simultaneously [88]. | |
| Benefits | Throughput Efficiency | Samples processed per unit time [89] | Simultaneous detection of multiple analytes significantly increases throughput versus single-analyte methods [89]. |
| Operational Cost Savings | Reduced cost per data point [89] | Single test replaces multiple individual assays, saving reagents and labor [89] [88]. | |
| Speed to Result | Faster analytical turnaround [88] | Rapid response characteristics of optical sensors reduce result times from days to hours [28]. | |
| Sample Volume Efficiency | Minimal sample requirement [89] | Small quantities of clinical/environmental samples suffice for multiple analyses, crucial when volume is limited [89]. | |
| Enhanced Detection Capability | Improved sensitivity and scope [88] | Modern multi-residue methods can detect 400–700 pesticide compounds simultaneously; detection limits as low as 0.01 ppm [88]. |
Comparative Cost Analysis: Multiplex Biosensors vs. Traditional Techniques
To objectively evaluate the financial viability of multiplex biosensors, a direct comparison with established traditional techniques is essential. Table 2 presents a quantitative comparison based on key economic and performance metrics, highlighting the specific advantages of nanomaterial-based sensing platforms.
Table 2: Cost and Performance Comparison: Multiplex Biosensors vs. Traditional Techniques
| Parameter | Multiplex Biosensors (e.g., QLISA, Nano-optical) | Traditional Techniques (e.g., GC-MS/MS, LC-MS/MS) | Financial & Operational Impact |
|---|---|---|---|
| Initial Equipment Cost | Moderate ($50,000 - $150,000) [28] | High ($150,000 - $500,000+) [88] | Lower capital investment reduces barrier to entry [28]. |
| Cost per Test (Multi-analyte) | $50 - $200 [88] | $200 - $500+ (for equivalent analyte panel) [88] | Significant savings when analyzing multiple residues [89]. |
| Analytes per Test | 400-700 compounds [88] | Typically targeted; multi-residue methods cover similar range [88] | Single multiplex test replaces multiple single-analyte tests [89]. |
| Throughput (Samples/day) | High (potentially 100+ with automation) [28] | Moderate (10-40 depending on method complexity) [88] | Higher throughput reduces labor costs per sample [89]. |
| Turnaround Time | Hours to < 24 hours [88] [28] | 1-7 days [88] | Faster decisions improve supply chain efficiency [88]. |
| Detection Limit | ppt to ppb range (e.g., 0.01 ppm) [88] | ppt to ppb range [88] | Comparable sensitivity for most regulatory applications [28]. |
| Personnel Skill Requirements | Specialized in nanobiosensors | Specialized in chromatography | Different training investments; similar specialization level. |
Calculating Financial Metrics
The final step in the cost-benefit analysis involves calculating key financial metrics to determine overall project viability. The cost-benefit ratio (CBR) is calculated by comparing the present value of benefits to the present value of costs [90]:
Cost-Benefit Ratio Formula:
Cost-Benefit Ratio = Sum of Present Value Benefits / Sum of Present Value Costs
A ratio greater than 1.0 indicates a financially viable project, with higher values indicating stronger returns [90]. For example, a CBR of 4.43 indicates that $4.43 of benefits are generated for every $1 spent [90].
The Net Present Value (NPV) is another critical metric that evaluates the financial potential of a project by discounting future benefits back to their present values using a discount rate [91]. A positive NPV indicates that the expected benefits outweigh the costs, suggesting the project is worth the investment [91].
These calculations must incorporate the projected lifespan of the equipment (typically 5-7 years) and account for the time value of money using an appropriate discount rate that reflects the organization's cost of capital and project risk profile [90].
Experimental Protocols for Cost and Performance Validation
Protocol: Per-Test Cost Calculation for Multiplex Biosensor Assay
Objective: To accurately determine the direct per-test cost of a multiplex biosensor assay for pesticide residue detection, enabling comparison with traditional methods.
Materials:
- Cost data for all consumables (nanomaterials, antibodies, buffers, substrates)
- Equipment depreciation schedule
- Laboratory labor cost rates
- Overhead allocation rates
Procedure:
- Catalog Consumables: List all reagents required for a single test, including:
- Capture antibodies immobilized on sensor surface
- Detection antibodies conjugated with nanomaterials (e.g., QDs, AuNPs)
- Blocking buffers, washing buffers, chemical substrates
Calculate Reagent Cost: For each consumable:
- Determine cost per unit (e.g., $/mg, $/mL)
- Calculate volume/mass used per test
- Multiply to obtain cost per test
- Example: QD-antibody conjugate: $250/mg, 0.002 mg/test = $0.50/test
Account for Equipment Depreciation:
- Record instrument purchase price (e.g., $100,000)
- Determine useful lifespan (e.g., 5 years = 1,250 working days)
- Estimate tests per day (e.g., 40 tests)
- Calculate cost per test: $100,000 / (1,250 days × 40 tests/day) = $2.00/test
Calculate Labor Expenses:
- Determine hands-on technician time per test (e.g., 0.5 hours)
- Multiply by hourly burdened labor rate (e.g., $60/hour) = $30/test
Include Allocated Overhead:
- Apply facility overhead rate (e.g., 30% of direct costs)
Summarize Total Cost:
- Sum all components: Consumables + Equipment + Labor + Overhead
- Example: $15.20 + $2.00 + $30.00 + $14.16 = $61.36 per test
Data Interpretation: Compare calculated per-test cost against traditional methods (typically $200-$500 for equivalent multi-analyte panels). Factor in throughput advantages—while per-test cost might be similar, the ability to detect multiple residues simultaneously often makes multiplex biosensors more cost-effective overall [89].
Protocol: Throughput and Efficiency Analysis
Objective: To quantify the analytical throughput of multiplex biosensor platforms and compare operational efficiency with traditional single-analyte methods.
Materials:
- Multiplex biosensor platform
- Sample preparation workstation
- Timer
- Data recording system
Procedure:
- Define Test Scenario: Design an experiment requiring detection of 10 different pesticide residues in food samples.
Establish Traditional Method Workflow:
- Plan the sequential analysis using single-analyte methods (e.g., ELISA)
- Document time requirements: sample preparation, incubation, detection, data analysis
- Calculate total time: 10 analytes × 2.5 hours/analyte = 25 hours
Establish Multiplex Method Workflow:
- Plan parallel analysis using multiplex biosensor
- Document time requirements: single sample preparation, incubation, simultaneous detection of all 10 analytes
- Calculate total time: approximately 3 hours
Quantify Efficiency Metrics:
- Calculate time savings: (25 - 3) / 25 × 100% = 88% reduction
- Determine labor efficiency: estimate hands-on time reduction
- Compute throughput: tests per day (e.g., 8 batches/day × 10 analytes = 80 analyte determinations/day)
Calculate Economic Impact:
- Multiply time savings by labor rate
- Factor in opportunity cost of faster results (e.g., quicker release of products)
Data Interpretation: The significantly reduced time to results (from 25 hours to 3 hours) demonstrates one of the most substantial benefits of multiplex biosensors. This efficiency translates directly to labor savings and enables more rapid decision-making in food safety testing scenarios [88].
Visualizing the Cost-Benefit Analysis Workflow
CBA Process Flow
The Scientist's Toolkit: Essential Research Reagents and Materials
Successful implementation of multiplex biosensors for pesticide detection requires specific materials and reagents with carefully defined functions. Table 3 catalogues these essential components and their roles in assay development and execution.
Table 3: Essential Research Reagents for Multiplex Biosensor Development
| Material/Reagent | Function | Application Notes |
|---|---|---|
| Quantum Dots (QDs) | Fluorescent labels with narrow emission bands [89] | Enable multiplexing; different sizes emit different colors with single wavelength excitation [89]. |
| Gold Nanoparticles (AuNPs) | Signal amplification via surface plasmon resonance [28] | Provide colorimetric signals; enhance Raman scattering in SERS-based detection [28]. |
| Capture Antibodies | Immobilized recognition elements for specific pesticides [89] | Must show minimal cross-reactivity for accurate multiplex detection [89]. |
| Detection Antibodies | Signal-generating recognition elements [89] | Conjugated to nanomaterials (QDs, AuNPs); must retain specificity after conjugation [89]. |
| Surface Chemistry Reagents | Enable biomolecule immobilization on sensor surfaces [89] | Includes cross-linkers, spacers, and blocking agents to reduce non-specific binding [89]. |
| Microplate Reader/Spectrometer | Optical signal detection and quantification [89] | Requires appropriate filters/excitation sources for nanomaterial labels [89]. |
| Sample Preparation Kits | Extract and purify pesticides from complex matrices [88] | Critical for removing interferents from food samples; impact assay sensitivity and accuracy [88]. |
The Role of Artificial Intelligence and Machine Learning in Data Analysis
Application Note: Enhancing Multiplex Biosensor Data Analysis with AI
Multiplexed biosensors represent a transformative approach for detecting multiple pesticide residues simultaneously, offering significant advantages over single-analyte detection methods. These sensors enable comprehensive analysis of complex chemical profiles by detecting a panel of discriminative biomarkers in a single diagnostic test, thereby enhancing detection accuracy and enabling early diagnostics [68]. However, the complex, high-dimensional data generated by these platforms presents substantial analytical challenges that traditional methods struggle to process efficiently.
Artificial Intelligence (AI) and Machine Learning (ML) have emerged as critical technologies for extracting meaningful information from multiplexed biosensor data. ML, a subset of AI focused on algorithms that learn patterns from training data, enables accurate inferences about new data without explicit, hard-coded instructions [92]. The integration of these technologies is particularly valuable for analyzing the subtle, interconnected patterns indicative of multiple pesticide residues in agricultural products.
Key AI/ML Applications in Pesticide Residue Analysis
Pattern Recognition for Complex Mixtures: Machine learning algorithms excel at identifying characteristic patterns in spectral and imaging data that correspond to specific pesticide residues. For instance, convolutional neural networks (CNNs) can automatically extract complex features from hyperspectral images to identify pesticide residues with high accuracy [93].
Data Fusion from Multiple Sensing Modalities: Multiplexed sensing often combines optical, electrochemical, and spectroscopic techniques. Generative AI and other ML approaches can integrate these diverse data streams, creating comprehensive models that improve detection reliability beyond what any single method can achieve [94] [93].
Predictive Model Development: Supervised learning algorithms, including support vector machines (SVM) and partial least squares regression (PLSR), establish quantitative correlations between sensor signals and pesticide concentration levels. These models enable rapid, non-destructive screening of fruits and vegetables [93].
Automated Quality Control and Validation: AI-assisted data extraction efficiently evaluates scientific literature and analytical reporting, ensuring method validation standards are maintained across pesticide residue studies. This approach was demonstrated in an analysis of 391 studies published in the Journal of Agricultural and Food Chemistry [95].
Protocol: AI-Driven Analysis of Spectral Data for Pesticide Detection
Workflow for Spectroscopy Combined with Machine Learning
The following diagram illustrates the typical workflow for detecting pesticide residues using spectroscopy technology combined with machine learning, adapted from current research in the field [93].
Detailed Experimental Methodology
Sample Preparation and Spectral Acquisition
Materials: Fresh fruit/vegetable samples (e.g., strawberries, spinach, tomatoes), pesticide standard solutions, sample containers, spectrometer (NIRS, HSI, or Raman), and sample presentation accessories.
Procedure:
- Prepare pesticide solutions at varying concentrations relevant to regulatory limits (e.g., 0.03–26.94 mg/kg for boscalid in strawberries).
- Apply pesticides uniformly to fruit/vegetable surfaces using calibrated sprayers or immersion methods.
- Allow treated samples to dry under controlled conditions (temperature: 25°C, humidity: 50%).
- Acquire spectral data using appropriate instrumentation:
- For NIRS: Collect diffuse reflectance spectra in the 348–1800 nm or 4000–11000 cm⁻¹ range.
- For HSI: Capture both spatial and spectral information across visible and near-infrared ranges.
- Ensure consistent measurement geometry and environmental conditions throughout acquisition.
Data Preprocessing and Feature Engineering
Objective: Enhance signal quality and reduce dimensionality while preserving chemically relevant information.
Protocol:
- Apply spectral preprocessing techniques:
- Savitzky-Golay smoothing for noise reduction
- Standard Normal Variate (SNV) or Multiplicative Scatter Correction (MSC) for scatter effects
- First or second derivatives to enhance spectral features and remove baseline variations
- Implement feature selection methods:
- Particle Swarm Optimization (PSO) for identifying informative wavelengths
- Principal Component Analysis (PCA) for dimensionality reduction
- Genetic Algorithms (GA) for optimal wavelength selection
- Partition data into training (70%), validation (15%), and test (15%) sets using stratified sampling to maintain concentration distribution.
- Apply spectral preprocessing techniques:
Model Development and Training
Algorithm Selection: Choose appropriate ML algorithms based on data characteristics and analysis goals:
Implementation Steps:
- Partial Least Squares Regression (PLSR):
- Standard method for establishing quantitative relationships between spectral features and pesticide concentrations
- Optimize the number of latent variables using cross-validation to avoid overfitting
- Support Vector Machines (SVM):
- Effective for classification tasks (e.g., presence/absence of pesticides)
- Optimize kernel parameters (linear, radial basis function) and regularization parameters
- Convolutional Neural Networks (CNN):
- Implement 1D-CNN architectures with multi-scale convolutional kernels (3/5/7) for spectral data
- Include feature fusion structures to enhance pattern recognition
- Train using appropriate optimization algorithms (Adam, SGD) with early stopping
- Partial Least Squares Regression (PLSR):
Model Validation and Performance Assessment
Validation Protocol:
- Employ k-fold cross-validation (typically k=10) during model development
- Evaluate final model performance on independent test set not used during training
- Calculate multiple performance metrics to comprehensively assess model capability:
Performance Metrics Table:
| Metric | Formula | Purpose | Optimal Value |
|---|---|---|---|
| R²P (Prediction Correlation Coefficient) | R²P = 1 - (SSres/SStot) | Measures prediction accuracy on test dataset | Closer to 1.0 |
| RMSEP (Root Mean Square Error of Prediction) | RMSEP = √(Σ(ŷi - yi)²/n) | Quantifies prediction error in concentration units | Closer to 0 |
| Accuracy | (TP+TN)/(TP+TN+FP+FN) | Overall classification correctness | > 0.85 |
| Precision | TP/(TP+FP) | Reliability of positive predictions | > 0.80 |
| Sensitivity/Recall | TP/(TP+FN) | Ability to identify contaminated samples | > 0.85 |
| F1-Score | 2×(Precision×Recall)/(Precision+Recall) | Harmonic mean of precision and recall | > 0.85 |
| RPD (Ratio of Performance to Deviation) | SD/RMSEP | Standardized measure of predictive capability | > 2.0 |
Case Study: NIRS with 1D-CNN for Pesticide Detection on Hami Melon
Experimental Context: Implementation of a modified 1D-CNN algorithm for non-destructive detection of pesticide residues on Hami melon surfaces [93].
Implementation Details:
- Spectral Range: 348.45–1141.34 nm using NIR diffuse reflectance spectroscopy
- Target Analytes: Water (control) and three pesticides (chlorothalonil, imidacloprid, pyraclostrobin) at 1:1000 dilution
- CNN Architecture:
- Input layer: Preprocessed spectral data
- Multi-scale convolutional layers with kernel sizes 3, 5, and 7
- Feature fusion structure to combine multi-scale features
- Fully connected layers with appropriate activation functions
- Output layer with softmax activation for classification
- Performance Outcomes:
- Four-class classification accuracy: 95.83% (outperforming PLS-DA at 88.33% and SVM at 85.83%)
- Binary classification (pesticide presence/absence): 99.17% accuracy with 100% true negative rate
Advanced Protocol: Multi-Modal Data Fusion for Enhanced Detection
Workflow for Integrating Spectral and Image Data
The integration of multiple data sources through AI represents a cutting-edge approach for improving pesticide detection accuracy. The following diagram illustrates this multi-modal fusion process.
Implementation Protocol for Multi-Modal Fusion
Spectral Data Collection:
- Utilize hyperspectral imaging (HSI) to capture both spatial and spectral information
- Acquire data across appropriate wavelength ranges (e.g., 400–1000 nm for VIS-NIR HSI)
- Ensure consistent illumination and calibration using standard reference materials
Image Data Collection:
- Capture high-resolution visible light images under standardized lighting conditions
- Extract texture, color, and morphological features using computer vision algorithms
- Implement segmentation techniques to isolate regions of interest
Additional Data Sources:
- Collect environmental parameters (temperature, humidity, time since application)
- Include sample metadata (fruit/vegetable type, origin, harvest date)
Data Fusion and Model Development
Fusion Strategies:
- Feature-level Fusion: Concatenate extracted features from all data sources before model input
- Decision-level Fusion: Train separate models on each data type and combine predictions
- Hybrid Approaches: Implement intermediate fusion with cross-modal attention mechanisms
Advanced Algorithm Implementation:
- Generative Adversarial Networks (GANs):
- Utilize Wasserstein GANs with residual networks (WGANs-ResNet) for data augmentation
- Generate synthetic spectral data to address class imbalance in training sets
- Achieve accuracy rates up to 91.4% as reported in terahertz spectroscopy studies [93]
- Multi-Stream Neural Networks:
- Design architecture with dedicated branches for each data modality
- Implement shared layers for cross-modal feature learning
- Include attention mechanisms to weight informative features dynamically
- Generative Adversarial Networks (GANs):
Performance Optimization and Validation
Hyperparameter Tuning:
- Employ Bayesian optimization or grid search for parameter selection
- Optimize learning rates, network architecture, and regularization parameters
- Utilize computational resources efficiently through distributed training
Validation Against Reference Methods:
- Compare AI/ML results with traditional analytical methods (e.g., LC-MS/MS, GC-MS)
- Establish correlation coefficients and method agreement statistics
- Verify detection capabilities at regulatory relevant concentrations
The Scientist's Toolkit: Essential Research Reagent Solutions
Table: Key Research Materials and Technologies for AI-Enhanced Pesticide Detection
| Item | Function/Benefit | Example Applications |
|---|---|---|
| Hyperspectral Imaging (HSI) Systems | Captures both spatial and spectral information simultaneously; enables chemical mapping of samples | Detection of multiple pesticide residues on fruit surfaces [93] |
| Portable NIRS Spectrometers | Field-deployable rapid screening; non-destructive analysis without sample preparation | On-site detection of boscalid and pyraclostrobin in strawberries [93] |
| Surface-Enhanced Raman Scattering (SERS) Substrates | Enhances Raman signals by several orders of magnitude; enables trace-level detection | Sensitive detection of low-concentration pesticide residues |
| Smartphone-Based Sensing Platforms | Portable, cost-effective detection using built-in cameras and processors; enables democratized testing | Colorimetric detection assays with AI-powered image analysis [68] |
| Microfluidic Chips for Multiplexing | Enables simultaneous detection of multiple analytes with minimal sample volume | Integrated biosensing platforms for pesticide panels [68] |
| Reference Analytical Standards | Provides ground truth data for model training and validation; ensures analytical accuracy | LC-MS/MS confirmation of pesticide identity and concentration [93] |
| AI Model Development Frameworks | Pre-built libraries for efficient algorithm implementation (TensorFlow, PyTorch, scikit-learn) | Custom CNN development for spectral classification [92] |
Performance Comparison of AI/ML Approaches
Table: Comparative Analysis of Machine Learning Techniques for Pesticide Residue Detection
| Method | Data Type | Best For | Performance Metrics | Limitations |
|---|---|---|---|---|
| PLSR | Spectral | Quantitative analysis of pesticide concentration | R²P: 0.83-0.93, RPD: >2.0 [93] | Linear assumptions may not capture complex relationships |
| SVM | Spectral/Image | Classification tasks (presence/absence) | Accuracy: ~85.83% [93] | Performance decreases with highly overlapping classes |
| 1D-CNN | Spectral | Automatic feature extraction from raw spectra | Accuracy: 95.83% (4-class) [93] | Requires larger datasets for training |
| GANs (WGANs-ResNet) | Spectral/Image | Data augmentation and classification with limited data | Accuracy: 91.4% [93] | Complex training process requiring expertise |
| Multi-Modal Fusion | Spectral + Image | Comprehensive analysis leveraging complementary data | Enhanced accuracy over single-mode approaches [93] | Increased computational complexity and data requirements |
This document provides application notes and detailed experimental protocols for developing advanced biosensing platforms. These notes are framed within a broader thesis research focused on the multiplex detection of multiple pesticide residues. The convergence of biomimetic materials, inspired by natural designs, with the high specificity of CRISPR-based detection creates a pathway for constructing next-generation sensors that are both highly sensitive and environmentally sustainable [96] [97]. These integrated approaches are poised to overcome the limitations of current methods, enabling rapid, on-site, and simultaneous screening of numerous agrochemicals.
The development of multiplex biosensors for pesticide residues leverages distinct technological paradigms, from nature-inspired designs to advanced molecular tools. The table below summarizes the core principles, advantages, and key challenges of these approaches.
Table 1: Comparative Analysis of Core Technologies for Multiplex Pesticide Sensing
| Technology | Core Principle | Key Advantages | Major Challenges |
|---|---|---|---|
| Biomimetic Sensing | Imitating biological structures (e.g., nasal cavity) or processes to enhance sensor performance [98]. | Improved fluidics and odorant binding; bio-inspired data processing; inherent sustainability [96] [99]. | Complexity in replicating biological systems; ensuring robustness in field conditions. |
| CRISPR-Based Detection | Utilizing CRISPR-Cas proteins' programmable precision to recognize and report on specific molecular targets [97]. | High specificity and programmability; compatibility with various signal outputs (electrochemical, colorimetric) [100]. | Efficient delivery of components; potential off-target effects; signal amplification in complex matrices. |
| Electrochemical Biosensors | Transducing the binding of a pesticide into a measurable electrical signal (current, impedance) via functionalized electrodes [101]. | High sensitivity; portability; low cost and potential for miniaturization [101] [18]. | Sensor fouling in complex samples; stability of biological recognition elements. |
| Nanomaterial Integration | Employing engineered nanomaterials (e.g., graphene, MoS₂) to enhance electrode surface area and electron transfer [101]. | Increased sensitivity and lower limits of detection; improved catalyst support [97] [101]. | Batch-to-batch variability in nanomaterial synthesis; complex functionalization protocols. |
Detailed Experimental Protocols
Protocol: Fabrication of a Biomimetic Electronic Nasal Cavity for Vapor Sampling
This protocol details the creation of a miniaturized bionic electronic nose system, inspired by the sturgeon nasal cavity, to improve the uniformity of gas flow and enhance sensor response to volatile pesticide signatures [98].
I. Materials and Reagents
- 3D Modeling Software: CAD software (e.g., SolidWorks, Fusion 360).
- CFD Simulation Software: ANSYS Fluent or OpenFOAM.
- 3D Printer: FormLabs or similar high-resolution printer.
- Printing Resin: High-resolution, chemically resistant resin.
- Sensor Array: Commercial metal oxide semiconductor (MOX) gas sensors or electrochemical sensor chips.
II. Procedure
- Bionic Structure Design:
- Extract and analyze the key structural features of the sturgeon nasal cavity from biological studies.
- Create a 3D model of the bionic nasal cavity, focusing on channels and chambers that promote laminar flow and eddy formation near the sensor placement areas [98].
- Computational Fluid Dynamics (CFD) Validation:
- Import the 3D model into CFD software.
- Set boundary conditions for gas inflow and outflow, simulating the target pesticide vapors.
- Run simulations to analyze gas flow distribution, velocity near the sensor sites, and eddy current intensity. Optimize the chamber geometry to ensure the gas flow distribution is more uniform and the eddy current intensity near the sensor is higher than in a conventional chamber [98].
- Fabrication and Assembly:
- 3D print the optimized bionic chamber using the high-resolution printer.
- Post-process the printed part according to the resin manufacturer's instructions (e.g., washing, curing).
- Integrate the sensor array into the designated locations within the printed bionic chamber, ensuring a secure electrical and physical connection.
III. Validation and Data Analysis
- Expose the bionic electronic nose and a conventional (control) electronic nose to known concentrations of pesticide vapors.
- Record the sensor response (e.g., resistance change) over time.
- Use machine learning algorithms (K-NN, Random Forest, SVM) to compare the recognition performance and accuracy of the bionic system versus the conventional system for identifying and quantifying pesticide residues [98].
Protocol: CRISPR-Cas13a-based Electrochemical Detection of Pesticide-specific Nucleic Acid Signatures
This protocol describes a method for converting the presence of a specific nucleic acid sequence, which can be derived from a pesticide-specific aptamer binding event, into an amplified electrochemical signal using the CRISPR-Cas13a system.
I. Materials and Reagents
- CRISPR Components: Recombinant LwaCas13a protein, target-specific crRNA.
- Nucleic Acid Targets: Synthetic DNA or RNA sequences representing the pesticide marker.
- Electrochemical Cell: Potentiostat and screen-printed gold or carbon electrodes.
- Redox Reporter: Ferrocene (Fc)- or Methylene Blue (MB)-labeled RNA probes.
- Reaction Buffer: NEBuffer 2.1 or similar.
II. Procedure
- Electrode Preparation:
- Clean the working electrode of the screen-printed chip according to manufacturer protocols.
- (Optional) Modify the electrode surface with nanomaterials like graphene or MoS₂ to enhance sensitivity [101].
- CRISPR Activation and Detection:
- Prepare a reaction mixture containing:
- 50 nM LwaCas13a
- 75 nM target-specific crRNA
- 1 µM of the redox-labeled RNA reporter probe
- The sample containing the target nucleic acid (e.g., from an aptamer-pesticide complex)
- 1X Reaction Buffer
- Incubate the reaction mixture at 37°C for 30-60 minutes.
- During this incubation, if the target is present, Cas13a becomes activated and cleaves the reporter probe, releasing the redox molecule [97] [100].
- Prepare a reaction mixture containing:
- Electrochemical Measurement:
- Transfer the entire reaction mixture to the electrochemical cell.
- Perform Square Wave Voltammetry (SWV) or Differential Pulse Voltammetry (DPV).
- Measure the change in the redox current. A decrease in signal indicates that cleavage has occurred, confirming the presence of the target [100].
IV. Data Analysis
- Plot the change in peak current (∆I) against the logarithm of the target concentration.
- Generate a standard curve to quantify unknown samples. The high specificity is provided by the crRNA, while the signal is amplified by the trans-cleavage activity of Cas13a.
Protocol: Development of a Multiplexed Nanoporous Gold Leaf Electrode (NPGL) Sensor
This protocol outlines the steps for creating a low-cost, multiplexed electrochemical sensor for the simultaneous detection of herbicides like atrazine, glyphosate, and dicamba [101].
I. Materials and Reagents
- Electrode Substrate: Nanoporous Gold Leaf (NPGL) electrodes.
- Enzymes/Recognition Elements: Glycine oxidase, tyrosinase, acetylcholinesterase, and specific antibodies.
- Cross-linking Agents: Glutaraldehyde, EDC/NHS.
- Measurement Instrument: Potentiostat for amperometry and electrochemical impedance spectroscopy (EIS).
- Microfluidic Cartridge: 3D-printed chamber (e.g., using FormLabs resin) designed using fluid dynamics software [101].
II. Procedure
- Sensor Functionalization:
- Individual Sensor Prep: Spot individual enzymes or antibodies onto discrete working electrodes on the NPGL platform.
- Cross-linking: Use optimized concentrations of cross-linkers (e.g., 0.5% glutaraldehyde or a 1:1 ratio of EDC:NHS) to immobilize the recognition elements. Adjust enzyme concentrations between 2-2000 unit/mL to achieve sensitivity for environmental concentrations [101].
- Validation: Test each sensor for sensitivity, limit of detection (LOD), and interference from other pesticides (targeting <10% interference) [101].
- Multiplexing and Microfluidics:
- Integrate the individually functionalized sensors into a single multiplex platform.
- Design and 3D print a microfluidic cartridge that directs the sample over each sensor sequentially or simultaneously. Validate the fluid flow using camera monitoring [101].
- Sample Measurement:
- Inject river water or soil slurry samples into the microfluidic cartridge.
- Perform amperometric or EIS measurements for each sensor.
- Compare the results against individual calibration curves to ensure at least 95% accuracy in the multiplex format [101].
III. Data Processing with Machine Learning
- Collect at least 50 data sets to formulate a machine learning algorithm.
- Validate the sensor's in-field data (≥95% accuracy) by comparing it with gold-standard methods (e.g., LC-MS/MS) performed by a partner lab [101].
The Scientist's Toolkit: Essential Research Reagents and Materials
The successful implementation of the protocols above relies on a set of key reagents and materials. The following table lists these essential components and their functions.
Table 2: Key Research Reagent Solutions for Advanced Biosensor Development
| Item Name | Function/Application | Key Characteristics |
|---|---|---|
| LwaCas13a Protein | CRISPR-based recognition and trans-cleavage of reporter RNA for signal amplification [97] [100]. | Programmable, RNA-targeting, high specificity and collateral activity. |
| Target-specific crRNA | Guides the Cas13a protein to the complementary nucleic acid target sequence [97]. | Synthetic, customizable sequence (~28 nt), defines assay specificity. |
| Nanoporous Gold Leaf (NPGL) | Electrode substrate for electrochemical biosensors [101]. | High surface area, excellent conductivity, low-cost, suitable for functionalization. |
| Glycine Oxidase | Biological recognition element for glyphosate detection [101]. | Enzyme that catalyzes a reaction with the target, producing a measurable signal. |
| Bionic Chamber Structure | 3D-printed structure to mimic biological nasal cavity for improved vapor sampling [98]. | Optimized geometry for uniform flow and enhanced sensor-analyte contact. |
| Molybdenum Disulfide (MoS₂) Nanosheets | Nanomaterial for functionalizing laser-induced graphene electrodes [101]. | Enhances electrocatalytic properties and sensor sensitivity. |
| Screen-Printed Electrode (SPE) | Low-cost, disposable platform for electrochemical measurements [18]. | Portable, integrable with microfluidics, mass-producible. |
Workflow and Signaling Pathway Visualizations
CRISPR-Cas13a Electrochemical Sensing Workflow
The following diagram illustrates the step-by-step process for detecting a target molecule using a CRISPR-Cas13a based electrochemical biosensor.
Biomimetic e-Nose for Pesticide Vapor Detection
This diagram outlines the functional workflow of a biomimetic electronic nose system, from sample intake to data analysis and pesticide identification.
Implementation Considerations for Sustainable Design
Integrating these advanced technologies into a viable biosensor requires careful consideration of manufacturing and environmental impact.
- Material Selection for Sustainability: Prioritize the use of biodegradable polymers or composites inspired by nature (e.g., mycelium-based, engineered wood) for sensor housings and non-critical components [99]. The use of biomimetic principles in manufacturing can help foster resilience and reduce the environmental footprint of production [96].
- Manufacturing and Scale-Up: Techniques like 3D printing are highly suitable for producing complex biomimetic structures (e.g., the bionic nasal cavity) and microfluidic cartridges in a scalable and material-efficient manner [101] [98].
- End-of-Life Management: A core tenet of sustainable design is planning for disassembly and recycling. Sensor designs should facilitate the separation of electronic components from plastic and biological parts, aligning with principles of a circular economy [96].
Conclusion
Multiplex biosensors represent a paradigm shift in pesticide residue detection, moving beyond the limitations of traditional, single-analyte methods. The integration of sophisticated nanomaterials has been pivotal in unlocking unprecedented levels of sensitivity and specificity for simultaneous multi-analyte screening. While significant progress has been made in optical and electrochemical platforms, the path to widespread commercialization requires overcoming challenges related to real-sample matrix complexity, long-term sensor stability, and standardized validation protocols. Future research must focus on the development of robust, cost-effective, and user-friendly platforms that integrate seamlessly with point-of-need testing. The convergence of biosensing with AI-driven analytics, biomimetic recognition elements, and advanced microfluidics promises to usher in a new era of intelligent, connected diagnostic systems. These advancements will not only revolutionize food safety monitoring but also create powerful new tools for environmental surveillance and clinical diagnostics, ultimately contributing to the protection of public health on a global scale.
References
- 1. Harnessing the power of biosensors for environmental ... [https://pmc.ncbi.nlm.nih.gov/articles/PMC11991957/]
- 2. Research Progress of Biosensors in the Detection ... [https://www.mdpi.com/2079-6374/15/12/778]
- 3. Smart plant-wearable biosensor for in-situ pesticide analysis [https://www.sciencedirect.com/science/article/abs/pii/S0956566320306266]
- 4. Multiplex bioanalytical methods for food and environmental ... [https://pmc.ncbi.nlm.nih.gov/articles/PMC7125819/]
- 5. Innovative Analytical Approaches for Food Pesticide Residue ... [https://pmc.ncbi.nlm.nih.gov/articles/PMC12452724/]
- 6. A Multi Residue GC-MS Method for Determination of 12 ... [https://pmc.ncbi.nlm.nih.gov/articles/PMC5316259/]
- 7. Analysis of Pesticide Residues in food by QuEChERS and ... [https://www.sigmaaldrich.com/US/en/technical-documents/technical-article/food-and-beverage-testing-and-manufacturing/chemical-analysis-for-food-and-beverage/analysis-of-pesticide-residues-in-food-by-quechers-and-gcms?srsltid=AfmBOooIImOJhLxUTC7dsZjep-wLfoN4OEt40mrV4WuUn41kLWc09hro]
- 8. Analytical evaluation of enzyme-linked immunosorbent ... [https://www.sciencedirect.com/science/article/abs/pii/S0039914011002244]
- 9. Development of an enzyme-linked immunosorbent assay ... [https://pubmed.ncbi.nlm.nih.gov/22224459/]
- 10. Validation of an HPLC-MS/MS method for the quantification ... [https://www.sciencedirect.com/science/article/pii/S2590157524008265]
- 11. A Closer Look at Biosensors: A Practical Tutorial for ... [https://www.spectroscopyonline.com/view/a-closer-look-at-biosensors-a-practical-tutorial-for-spectroscopists]
- 12. Research Advances in Nanosensor for Pesticide Detection in ... [https://pmc.ncbi.nlm.nih.gov/articles/PMC12298915/]
- 13. Structural design of biosensor: A review [https://jmpcr.samipubco.com/article_177586.html]
- 14. Recent advances in biosensors: structure, principles ... [https://www.sciencedirect.com/science/article/abs/pii/S1046202325001665]
- 15. Aptamer-based electrochemical biosensors: Signal ... [https://www.sciencedirect.com/science/article/pii/S2666053925000840]
- 16. Emerging biosensing and transducing techniques for potential ... [https://pmc.ncbi.nlm.nih.gov/articles/PMC8905799/]
- 17. Pesticide residue detection techniques for increasing ... [https://www.frontiersin.org/journals/plant-science/articles/10.3389/fpls.2025.1694779/full]
- 18. Rapid Multi-Residue Detection Methods for Pesticides and ... [https://pmc.ncbi.nlm.nih.gov/articles/PMC7464912/]
- 19. Multi-residue detection of pesticides using a sensitive ... [https://www.sciencedirect.com/science/article/abs/pii/S0003267016308807]
- 20. Quantitative Evaluation of Sensitivity and Selectivity ... [https://pmc.ncbi.nlm.nih.gov/articles/PMC2072052/]
- 21. What is Multicolor Flow Cytometry | Cell Sorting Techniques [https://www.bdbiosciences.com/en-us/learn/applications/multicolor-flow-cytometry]
- 22. Multimodal Fusion-Driven Pesticide Residue Detection [https://pmc.ncbi.nlm.nih.gov/articles/PMC12430378/]
- 23. Artificial intelligence-assisted colorimetric sensor array ... [https://www.sciencedirect.com/science/article/abs/pii/S0925400525012699]
- 24. Multiplexed immunosensors for point-of-care diagnostic ... [https://www.sciencedirect.com/science/article/pii/S0956566322000902]
- 25. A multiplexed electrochemical biosensor for simultaneous ... [https://pubs.rsc.org/en/content/articlehtml/2025/cc/d5cc04129e?page=search]
- 26. Research Progress on Multiplexed Pathogen Detection ... [https://pmc.ncbi.nlm.nih.gov/articles/PMC12191064/]
- 27. Multiplexed proteomic biosensor platform for label-free real ... [https://www.nature.com/articles/s42003-025-07844-z]
- 28. Multiplexed Optical Sensors Driven by Nanomaterials for ... [https://www.sciencedirect.com/science/article/abs/pii/S0165993625002961]
- 29. Comprehensive Analysis of Advancement in Optical Biosensing Techniques for Early Detection of Cancerous Cells [https://www.mdpi.com/2079-6374/15/5/292]
- 30. Sensitivity-Enhancing Strategies in Optical Biosensing - PMC [https://pmc.ncbi.nlm.nih.gov/articles/PMC7884068/]
- 31. Colorimetric Biosensors: Advancements in Nanomaterials and Cutting-Edge Detection Strategies - PMC [https://pmc.ncbi.nlm.nih.gov/articles/PMC12190540/]
- 32. Optical Biosensors enabled by integrated optics and AI [https://www.lightcounting.com/research-note/may-2025-optical-biosensors-enabled-by-integrated-optics-and-ai-400]
- 33. Electrochemical Biosensors - Sensor Principles and ... [https://pmc.ncbi.nlm.nih.gov/articles/PMC3663003/]
- 34. Advances in Impedimetric Biosensors: Current Applications ... [https://www.mdpi.com/2072-666X/16/11/1244]
- 35. Exploring alternative detection methods for azole ... [https://www.sciencedirect.com/science/article/pii/S0924224425002006]
- 36. Recent Advances in Nanomaterial-Based Biosensors for ... [https://pmc.ncbi.nlm.nih.gov/articles/PMC9405907/]
- 37. Pesticide Biosensors for Multiple Target Detection [https://www.jstage.jst.go.jp/article/ras/12/0/12_128/_html/-char/en]
- 38. Multiplexed Optical Nanobiosensing Technologies for ... [https://pmc.ncbi.nlm.nih.gov/articles/PMC12562344/]
- 39. Based biosensing platforms for detecting contaminants in ... [https://www.sciencedirect.com/science/article/pii/S0165993625001074]
- 40. Noble metal nanoparticles in biosensors: recent studies ... [https://pmc.ncbi.nlm.nih.gov/articles/PMC5766271/]
- 41. Noble Metal Nanomaterial-Based Biosensors for ... [https://www.frontiersin.org/journals/chemistry/articles/10.3389/fchem.2021.672739/full]
- 42. Multiple Recognition-Based Sensor for Pesticide Residues [https://pmc.ncbi.nlm.nih.gov/articles/PMC8979164/]
- 43. MoS2-Carbon Nanodots as a New ... [https://pmc.ncbi.nlm.nih.gov/articles/PMC10046281/]
- 44. Electrochemical (Bio)Sensors for Toxins, Foodborne ... [https://www.mdpi.com/2079-6374/15/7/468]
- 45. Surface Functionalization for Immobilization of Probes on ... [https://pubmed.ncbi.nlm.nih.gov/26614065/]
- 46. Special surface modification for probe immobilization [https://www.3d-gene.com/en/about/merit/mer_003.html]
- 47. Biosensors, Volume 15, Issue 9 (September 2025) [https://www.mdpi.com/2079-6374/15/9]
- 48. Surface-enhanced Raman spectroscopy biosensor ... [https://link.springer.com/article/10.1007/s44462-025-00031-7]
- 49. Progress of rapid detection of pesticides in fruits and ... [https://www.frontiersin.org/journals/food-science-and-technology/articles/10.3389/frfst.2023.1253227/full]
- 50. Triple-mode biosensing strategies: A critical review of ... [https://www.sciencedirect.com/science/article/abs/pii/S0026265X25023550]
- 51. Reliable Strategy for Analysis of Complex Biosensor Data [https://pmc.ncbi.nlm.nih.gov/articles/PMC6150654/]
- 52. Impact of Matrix Species and Mass Spectrometry on ... [https://pmc.ncbi.nlm.nih.gov/articles/PMC10048110/]
- 53. Matrix Effects in Multi-Residue Pesticide Analysis When ... [https://www.restek.com/articles/matrix-effects-in-multi-residue-pesticide-analysis-when-using-liquid-chromatography-tandem-mass-spectrometry?srsltid=AfmBOoodgEZzM3UsaoEOwLSJWSF1VJDLBXA1XJ2LAw7oRilcMgc2pd6m]
- 54. Evaluation of the matrix effect in the analysis of 74 ... [https://www.sciencedirect.com/science/article/pii/S2949824425002861]
- 55. A quantitative prediction method utilizing whole omics data ... [https://www.nature.com/articles/s41598-024-84323-1]
- 56. A general method for the development of multicolor ... [https://pmc.ncbi.nlm.nih.gov/articles/PMC10449634/]
- 57. An Ultrasensitive Biosensor for Detection of Femtogram Levels of the Cancer Antigen AGR2 Using Monoclonal Antibody Modified Screen-Printed Gold Electrodes [https://www.mdpi.com/2079-6374/11/6/184]
- 58. Rapid, Point-of-Care scFv-SERS Assay for Femtogram Level Detection of SARS-CoV-2 - PMC [https://www.ncbi.nlm.nih.gov/pmc/articles/PMC8961876/]
- 59. Multiplexed Electrochemical Immunosensors for Clinical Biomarkers - PMC [https://www.ncbi.nlm.nih.gov/pmc/articles/PMC5464191/]
- 60. Biosensing systems for the detection of biomarkers ... [https://www.sciencedirect.com/science/article/abs/pii/S0039914024016266]
- 61. Solutions to immunoassay interference, cross reactivity and ... [https://www.gyrosproteintechnologies.com/spinblog/immunoassay-interference-crossreactivity-challenges]
- 62. Changing Cross-Reactivity for Different Immunoassays ... [https://www.mdpi.com/2076-3417/11/14/6581]
- 63. Redefining antibody cross-reactivity as an advantage for ... [https://www.sciencedirect.com/science/article/abs/pii/S0167779925001829]
- 64. Enhancing Sensitivity and Selectivity: Current Trends in ... [https://pmc.ncbi.nlm.nih.gov/articles/PMC11505628/]
- 65. Identifying synthetic variables influencing the reproducible ... [https://www.nature.com/articles/s43246-024-00644-8]
- 66. Comparison of methods for quantitative biomolecular ... [https://pmc.ncbi.nlm.nih.gov/articles/PMC8748344/]
- 67. Progress in nanomaterials: Synthesis, characterization, ... [https://www.sciencedirect.com/science/article/pii/S2949829525001329]
- 68. Smartphone-Based Multiplexed Biosensing Tools for Health ... [https://pmc.ncbi.nlm.nih.gov/articles/PMC9406027/]
- 69. A review of innovative approaches toward pesticide ... [https://www.sciencedirect.com/science/article/abs/pii/S0026265X25010471]
- 70. Smartphone-based platforms implementing microfluidic ... [https://www.nature.com/articles/s41467-023-36017-x]
- 71. Microfluidic Sensors Integrated with Smartphones for ... [https://pmc.ncbi.nlm.nih.gov/articles/PMC12298308/]
- 72. Emerging biosensors integrated with microfluidic devices... [https://www.nature.com/articles/s41538-025-00444-5?error=cookies_not_supported&code=9bd8929c-d72c-4e75-ad0e-c1af7ea4d572]
- 73. Frontiers | Microfluidic for rapid biosensors of foodborne... detection [https://www.frontiersin.org/journals/chemistry/articles/10.3389/fchem.2025.1536928/full]
- 74. Smartphone Biosensor System with Multi-Testing Unit ... [https://www.mdpi.com/1424-8220/20/2/446]
- 75. A multiplexed sensing system with multimodal readout ... [https://www.sciencedirect.com/science/article/abs/pii/S0013468624010387]
- 76. Recent Advances in Liquid Chromatography–Mass ... [https://pmc.ncbi.nlm.nih.gov/articles/PMC12204688/]
- 77. Comparison of GC-MS/MS and LC-MS/MS for the analysis ... [https://pubs.rsc.org/en/content/articlelanding/2019/ay/c8ay02774a]
- 78. GC-MS vs LC-MS [https://resolvemass.ca/gc-ms-vs-lc-ms/]
- 79. LCMS vs. GCMS: When to Choose Each for Optimal ... [https://emerypharma.com/blog/lcms-vs-gcms-when-to-choose-each-for-optimal-results-in-your-analytical-chemistry/]
- 80. LC-MS vs. GC-MS: Understanding the Key Differences and Uses [https://www.hplcvials.com/faq/lc-ms-vs-gc-ms-understanding-the-key-differences-and-uses.html]
- 81. Comparison of LC-MS-MS and GC-MS Analysis ... [https://pubmed.ncbi.nlm.nih.gov/26755538/]
- 82. Comparison of LC–MS-MS and GC–MS Analysis ... [https://pmc.ncbi.nlm.nih.gov/articles/PMC4885916/]
- 83. A high-throughput LC-MS/MS method for simultaneous ... [https://www.sciencedirect.com/science/article/pii/S1570023225002958]
- 84. Construction of a Multiplex Biosensor for the On-site Rapid ... [https://www.sciencedirect.com/science/article/abs/pii/S0304389425030833]
- 85. Clinical Validation of Biosensors: Protocols That Investors ... [https://medstartups.org/clinical-validation-biosensors-protocols-investors-expect]
- 86. Regulatory Standards for Wearable Biosensors in ... [https://eureka.patsnap.com/report-regulatory-standards-for-wearable-biosensors-in-pharmaceuticals]
- 87. AI Medical Devices: FDA Draft Guidance, TPLC & PCCP ... [https://www.complizen.ai/post/fda-ai-medical-device-regulation-2025]
- 88. Residue Testing Market Size, Share and Growth Report ... [https://www.precisionbusinessinsights.com/market-reports/global-residue-testing-market]
- 89. Multiplexed Nanobiosensors: Current Trends in Early ... [https://pmc.ncbi.nlm.nih.gov/articles/PMC7729484/]
- 90. Cost-Benefit Analysis: A Quick Guide with Examples and ... [https://www.projectmanager.com/blog/cost-benefit-analysis-for-projects-a-step-by-step-guide]
- 91. Cost Benefit Analysis For Successful Project Evaluation [https://xmind.com/blog/cost-benefit-analysis-for-project-evaluation]
- 92. The 2025 Guide to Machine Learning [https://www.ibm.com/think/machine-learning]
- 93. Spectroscopic and Imaging Technologies Combined with Machine... [https://www.mdpi.com/2304-8158/14/15/2679]
- 94. Machine learning and generative AI: What are they good ... [https://mitsloan.mit.edu/ideas-made-to-matter/machine-learning-and-generative-ai-what-are-they-good-for]
- 95. Insights Powered by Artificial Intelligence: Analyzing the Extent of... [https://pubmed.ncbi.nlm.nih.gov/40476316/]
- 96. Biomimetics in sustainable manufacturing: Towards a new ... [https://www.sciencedirect.com/science/article/pii/S305047592500421X]
- 97. Intracellular biosensors by functional nanomaterial- ... [https://pubs.rsc.org/en/content/articlelanding/2025/cc/d5cc05016b]
- 98. Biomimetics, Volume 10, Issue 8 (August 2025) – 77 articles [https://www.mdpi.com/2313-7673/10/8]
- 99. Emerging trends in advanced biomimetic composite ... [https://www.aimspress.com/article/doi/10.3934/matersci.2025034?viewType=HTML]
- 100. Advances in CRISPR/Cas13a-based biosensors for non- ... [https://pubmed.ncbi.nlm.nih.gov/40300474]
- 101. Portable, In-field Biosensor for Multiplex Sensing of Common ... [https://training-portal.nifa.usda.gov/web/crisprojectpages/1026406-portable-in-field-biosensor-for-multiplex-sensing-of-common-midwestern-herbicides.html]