Optimizing Biosensor Performance: A Design of Experiments Framework for Enhanced Signal Amplification
This article provides a comprehensive guide for researchers and drug development professionals on applying Design of Experiments (DoE) to optimize signal amplification in biosensors.
Optimizing Biosensor Performance: A Design of Experiments Framework for Enhanced Signal Amplification
Abstract
This article provides a comprehensive guide for researchers and drug development professionals on applying Design of Experiments (DoE) to optimize signal amplification in biosensors. It covers the foundational principles of biosensor operation and the necessity of signal amplification for detecting low-concentration analytes. The piece details methodological approaches, including the integration of nanomaterials and catalytic amplification, and presents a structured DoE framework for troubleshooting and optimizing key performance parameters. Finally, it explores validation strategies against gold-standard methods and discusses the significant implications of these optimized biosensors for biomedical research and clinical diagnostics, enabling highly sensitive and reliable detection of biomarkers.
Biosensor Fundamentals and the Critical Need for Signal Amplification
Frequently Asked Questions (FAQs) and Troubleshooting Guides
This technical support center is designed for researchers working on signal amplification in biosensors, providing solutions to common experimental challenges within a Design of Experiments (DoE) framework.
FAQ Category 1: Bioreceptor Performance and Selectivity
Q1: My biosensor shows poor selectivity and significant interference from the sample matrix. How can I improve bioreceptor specificity? This is often related to the choice and immobilization of the bioreceptor.
- Root Cause: The bioreceptor (e.g., antibody, enzyme, aptamer) may have low affinity for the target analyte, or the immobilization method may have altered its conformation, reducing binding specificity. Non-specific adsorption of other molecules in the sample can also cause interference [1].
- Troubleshooting Steps:
- Verify Bioreceptor Affinity: Characterize the binding kinetics (e.g., using Surface Plasmon Resonance) of your bioreceptor in solution before immobilization to confirm its intrinsic specificity [2].
- Optimize Immobilization: Experiment with different immobilization strategies (e.g., covalent binding, entrapment, cross-linking) using a DoE approach to find the method that best preserves bioreceptor activity and orientation [1].
- Implement Anti-Biofouling Layers: Modify the transducer surface with anti-fouling reagents such as self-assembled monolayers, polymeric coatings, or peptides to prevent non-specific adsorption [2].
Q2: The bioreceptor in my biosensor degrades quickly, leading to a short shelf life and unstable signals. How can I enhance its stability?
- Root Cause: Bioreceptors like enzymes and antibodies can denature over time due to temperature, pH, or chemical degradation. Leaching from the sensor surface can also occur [1].
- Troubleshooting Steps:
- Improve Immobilization: Use cross-linking methods to create a stable, three-dimensional network of bioreceptors, which can enhance stability compared to simple physical adsorption [1].
- Utilize Nanomaterials: Explore the use of nanozymes (nanomaterials with enzyme-like properties) which often exhibit higher stability than their natural counterparts [2].
- Optimize Storage Conditions: Systematically test different storage buffers and temperatures using a DoE protocol to identify conditions that maximize bioreceptor longevity [3].
FAQ Category 2: Transducer Function and Signal Generation
Q3: My biosensor has a high limit of detection (LOD). What signal amplification strategies can I employ? This is a core challenge in biosensor research, particularly for detecting low-abundance analytes.
- Root Cause: The transducer may have a low signal-to-noise ratio, or the bio-recognition event may not generate a sufficiently strong signal [1].
- Troubleshooting Steps:
- Integrate Nanomaterials: Modify the electrode surface with materials like graphene, carbon nanotubes, or MXenes. These materials have high surface area and excellent conductivity, which can enhance electron transfer in electrochemical biosensors and lower the LOD [2].
- Adopt Exponential Amplification Methods: For DNA biosensors, employ enzymatic amplification methods. For example, a cascade of self-perpetuating restriction endonuclease reactions can enable exponential signal amplification, allowing for detection at the attomolar level [2].
- Explore Photoelectrochemical Sensing: Combine redox enzymes with light-harvesting semiconductor materials (e.g., quantum dots, TiO₂ nanoparticles). This hybrid approach can significantly enhance device sensitivity [2].
Q4: The signal from my electrochemical biosensor drifts over time during continuous monitoring. What could be causing this?
- Root Cause: Signal drift can be caused by biofouling, temperature fluctuations, or degradation of the bioreceptor or transducer components [3] [1].
- Troubleshooting Steps:
- Control Temperature: Ensure the experimental setup includes temperature control, as transducer and electronic responses are often temperature-sensitive [3].
- Use a Reference Sensor: Integrate a reference electrode or a sensor without the bioreceptor to account for background drift and non-specific signals [1].
- Re-calibrate Frequently: Establish a regular re-calibration schedule, especially for long-term monitoring applications, to compensate for any signal decay [1].
FAQ Category 3: System Integration and Data Readouts
Q5: I am developing a wearable biosensor and am experiencing issues with signal loss and connectivity. How can I improve reliability?
- Root Cause: This often relates to physical movement, poor adhesion of the sensor, or limitations in the wireless data transmission system (e.g., Bluetooth) [4].
- Troubleshooting Steps:
- Check Adhesion and Placement: Ensure the biosensor is properly adhered to the skin and placed in a location less prone to direct pressure or movement, which can cause signal loss [4] [5].
- Verify Operating Distance: Keep the display device (e.g., smartphone) within the maximum operating range of the biosensor's wireless technology [6].
- Integrate Microfluidics: For wearable devices, consider integrating microfluidic systems for continuous and minimally invasive sample collection, which can improve the consistency of analyte delivery to the transducer [2].
Q6: The readout from my biosensor does not match the gold standard laboratory method. How should I validate its accuracy?
- Root Cause: Differences can arise from calibration errors, sample matrix effects, or the inherent technological differences between the biosensor and the reference method [5].
- Troubleshooting Steps:
- Cross-Validate with Standards: Test the biosensor with known standard concentrations of the analyte to establish a calibration curve and assess accuracy across the dynamic range [1].
- Perform a Clinical Validation: Test the biosensor with a set of real patient samples and compare the results statistically (e.g., using regression analysis) against an established diagnostic tool like ELISA [1].
- Understand Physiological Lag: If measuring glucose, note that interstitial fluid measurements (from continuous sensors) will lag behind blood glucose meter readings during periods of rapidly changing glucose levels [5].
Experimental Protocols for Key Biosensor Experiments
Protocol 1: Immobilization of a Bioreceptor on an Electrode Surface
Objective: To covalently immobilize an enzyme on a gold electrode surface for electrochemical biosensing, optimizing for maximum activity retention.
Materials:
- Gold disk electrode
- Bioreceptor (e.g., Glucose Oxidase)
- Cross-linker (e.g., Glutaraldehyde)
- Self-Assembled Monolayer (SAM) precursor (e.g., 3-Mercaptopropionic acid)
- Coupling agents: N-(3-Dimethylaminopropyl)-N′-ethylcarbodiimide (EDC) and N-Hydroxysuccinimide (NHS)
- Washing buffers (e.g., Phosphate Buffered Saline)
Methodology:
- Electrode Pretreatment: Clean and polish the gold electrode to ensure a pristine surface.
- SAM Formation: Immerse the electrode in a solution of 3-Mercaptopropionic acid to form a SAM presenting carboxyl groups.
- Activation: Activate the carboxyl groups on the SAM by treating with a fresh mixture of EDC and NHS, forming amine-reactive esters.
- Immobilization: Expose the activated surface to a solution of the enzyme. The primary amines on the enzyme will covalently bind to the esters.
- Quenching and Washing: Quench any remaining active groups with ethanolamine. Rinse the modified electrode thoroughly with buffer to remove unbound enzyme.
- Validation: Confirm immobilization and activity via Cyclic Voltammetry in the presence of the analyte.
Protocol 2: Evaluating Biosensor Performance Using a DoE Approach
Objective: To systematically investigate the effect of multiple factors (pH, temperature, immobilization density) on biosensor sensitivity (LOD) and dynamic range.
Materials:
- Functionalized biosensor from Protocol 1
- Analytic standards of known concentrations
- Buffer solutions of different pH
- Temperature-controlled electrochemical cell
Methodology:
- Define Factors and Levels: Using a DoE software or matrix, select factors to test (e.g., pH: 6.5, 7.0, 7.5; Temperature: 25°C, 30°C, 37°C).
- Run Experiments: Follow the experimental order prescribed by the DoE matrix. For each run, record the biosensor's amperometric response to a series of analyte concentrations.
- Data Analysis: For each experiment, calculate the calibration slope (sensitivity) and LOD. Input these results into the DoE software.
- Model and Optimize: The software will generate a statistical model showing the main and interactive effects of each factor. Use this model to predict the optimal conditions for maximum sensitivity.
- Verify: Perform a confirmation experiment at the predicted optimal conditions to validate the model's accuracy.
Biosensor Performance Metrics and Data
Table 1: Key Performance Characteristics of an Ideal Biosensor [3] [1]
| Characteristic | Definition | Ideal Value / Target | Impact on Signal Amplification Research |
|---|---|---|---|
| Sensitivity / LOD | The minimum detectable concentration of analyte. | ng/ml to fg/ml, depending on application [3]. | The primary metric for evaluating new amplification strategies. |
| Selectivity | The ability to distinguish analyte from interferents. | High specificity from high-affinity bioreceptors [3]. | Ensures amplified signal originates from the target, not noise. |
| Linearity & Dynamic Range | The concentration range over which response is linear. | Wide linear range with high resolution [3]. | Determines the usable scope of the biosensor after amplification. |
| Reproducibility | Precision and accuracy of repeated measurements. | High reliability and robustness [3]. | Critical for validating that an amplification method is controllable. |
| Response Time | Time to generate a stable signal after analyte exposure. | Fast, for real-time monitoring [1]. | Amplification should not disproportionately slow the sensor response. |
| Stability | Performance consistency over time and conditions. | Long-term functionality with minimal drift [3]. | Determines the practical lifespan of an amplified biosensor. |
Table 2: Research Reagent Solutions for Biosensor Development [1] [7] [2]
| Item / Reagent | Function in Biosensor Development | Example Use Case |
|---|---|---|
| Enzymes (e.g., Glucose Oxidase) | Biocatalytic bioreceptor that generates a electroactive product upon reaction with its substrate [1]. | Core sensing element in amperometric glucose biosensors. |
| Antibodies | Bio-affinity bioreceptor for highly specific antigen binding [1]. | Used in immunosensors (e.g., lateral flow pregnancy tests). |
| Aptamers | Single-stranded DNA/RNA molecules that bind targets with high specificity; more stable than antibodies [2]. | Used in aptasensors for detection of small molecules, proteins, or cells. |
| Carbon Nanotubes / Graphene | Nanomaterials used to modify electrode surfaces, enhancing conductivity and surface area for better electron transfer [2]. | Signal amplification in electrochemical transducers. |
| EDC/NHS Chemistry | Coupling agents for covalently immobilizing biomolecules (with carboxyl or amine groups) on surfaces [1]. | Standard method for attaching bioreceptors to transducer surfaces. |
| Lock-in Amplifier | Electronic instrument that extracts signals with a known carrier wave from extremely noisy environments [7]. | Improving signal-to-noise ratio in optical or electrical measurements. |
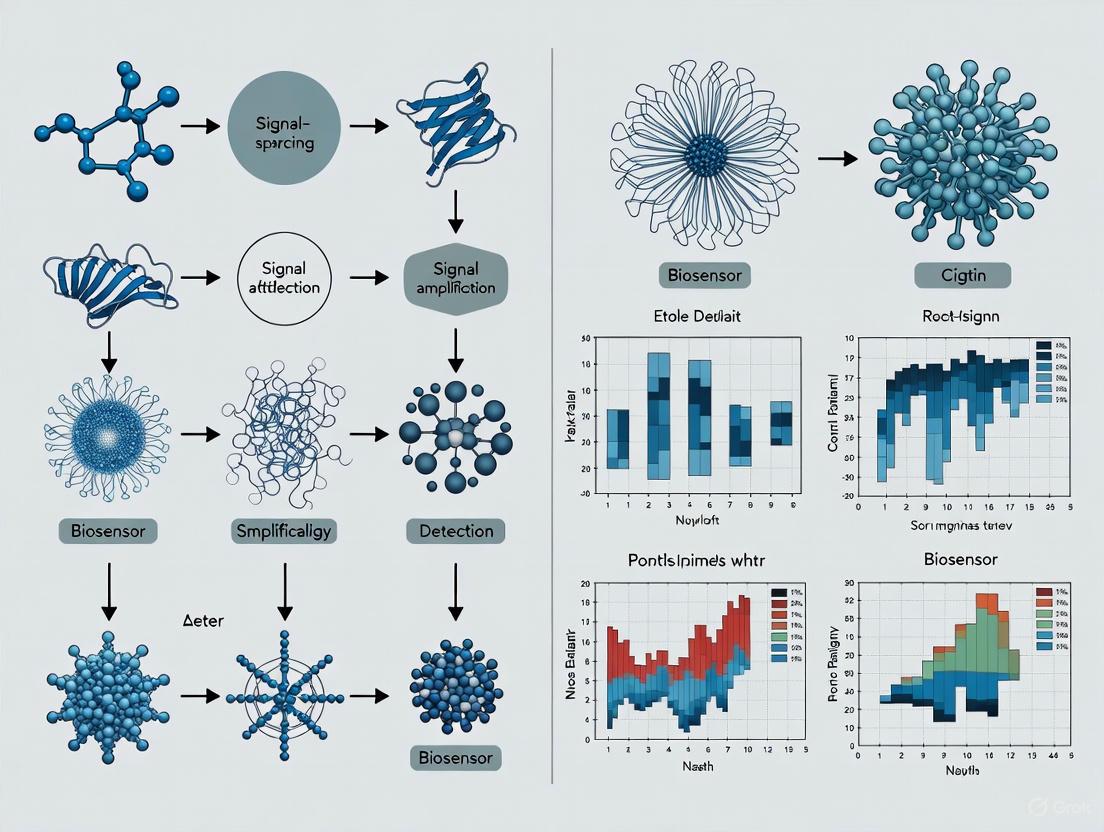
Biosensor Workflow and Signaling Diagrams
Biosensor Component Architecture
DoE Optimization Pathway
Frequently Asked Questions (FAQs) on Signal Amplification
FAQ 1: What are the most effective strategies to amplify a weak signal from a low-concentration analyte? Multiple strategies exist, often used in combination. You can optimize the physical sensor design using algorithmic methods, employ biochemical signal amplification techniques, or utilize novel transducer materials. For instance, multi-objective optimization algorithms can simultaneously enhance sensitivity and signal clarity [8]. Alternatively, integrating enzymatic biofuel cells with organic electrochemical transistors (OECTs) has been shown to amplify electrical signals by three orders of magnitude, drastically improving the signal-to-noise ratio [9].
FAQ 2: How can Design of Experiments (DoE) improve my biosensor development process? DoE provides a structured framework to efficiently understand the influence of multiple factors and identify their optimal settings. This is crucial for avoiding common pitfalls. A key preparatory step is ensuring process stability and repeatability before running a DoE. If the process itself is unstable due to random causes (e.g., machine breakdowns, unstable settings), your results will be affected by noise, making it difficult to distinguish the true effects of the factors you are studying [10]. DoE helps in systematically exploring complex parameter interactions that single-variable testing might miss [8].
FAQ 3: My sensor signal is unstable. What could be causing this? Signal instability often stems from issues prior to the actual measurement. Common culprits include:
- Unstable Input Conditions: Inconsistent raw materials (e.g., different reagent batches) or varying environmental conditions (temperature, humidity) can mask or distort factor effects [10].
- Inadequate Measurement System: An uncalibrated instrument or a measurement system with poor repeatability and reproducibility will generate unreliable data [10].
- Material Instability: Some sensitive 2D materials, like certain molybdenum disulfides or graphene, can suffer from inadequate stability, leading to alterations in structure and performance over time [8].
FAQ 4: Are there alternatives to traditional PCR for nucleic acid amplification in biosensing? Yes, several powerful isothermal amplification techniques are available. Rolling Circle Amplification (RCA) is a simple, efficient process conducted at a constant temperature, generating long single-stranded DNA [11]. Loop-Mediated Isothermal Amplification (LAMP) is another isothermal method that amplifies DNA with high specificity and efficiency using a set of primers [11]. These methods are well-suited for point-of-care diagnostic platforms.
Troubleshooting Guide: Common Experimental Issues
| Issue | Possible Cause | Solution |
|---|---|---|
| Low Sensitivity | Suboptimal sensor design parameters (e.g., incident angle, metal layer thickness). | Apply algorithmic optimization (e.g., Particle Swarm Optimization) to holistically tune multiple parameters for sensitivity, FOM, and depth [8]. |
| Poor Signal-to-Noise Ratio | Non-specific binding; high background interference; inefficient signal transduction. | Use antifouling coatings; employ OECTs to amplify the primary signal while reducing background noise [9]. Implement proper blocking agents during immobilization [12]. |
| Irreproducible Results | Unstable process conditions; inconsistent reagent batches; unverified measurement system. | Ensure process stability using SPC before experiments. Standardize materials from a single batch. Perform Measurement System Analysis (MSA/Gage R&R) [10]. |
| Signal Drift Over Time | Degradation of the biological recognition element (e.g., enzyme denaturation). | Implement regular recalibration and use reference standards. Explore more robust bioreceptors like certain aptamers or chemically stable plasmonic materials like gold [13] [12]. |
Featured Experimental Protocols
Protocol 1: Multi-Objective Optimization of an SPR Biosensor using Particle Swarm Optimization (PSO)
This protocol details a methodology for holistically enhancing Surface Plasmon Resonance (SPR) biosensor performance [8].
1. Objective Definition:
- Define the key performance metrics to optimize simultaneously. The study optimized for:
- Sensitivity (S): Change in resonant output per unit change in refractive index.
- Figure of Merit (FOM): A comprehensive metric balancing sensitivity and resonance width.
- Depth of Resonant Dip (DRD): Influences signal intensity.
2. Sensor Modeling:
- Model the SPR sensor as a multi-layer medium (e.g., prism, adhesive chromium layer, gold layer).
- Use the transfer matrix method to compute optical characteristics and theoretical reflectivity.
3. Algorithm Configuration:
- Implement a multi-objective PSO algorithm.
- Set the three key performance metrics (S, FOM, DRD) as the fitness functions.
- Define the search space for design parameters: incident angle, chromium film thickness, and gold film thickness.
4. Iteration and Validation:
- Run the PSO algorithm (e.g., for 150 iterations) to find the parameter set that maximizes the fitness functions.
- Fabricate the sensor with the optimized parameters.
- Experimentally validate performance through bulk refractive index sensitivity tests and specific immunoassays (e.g., for mouse IgG).
Protocol 2: Signal Amplification using Organic Electrochemical Transistors (OECTs)
This protocol describes a method to dramatically amplify signals from enzymatic or microbial fuel cells [9].
1. System Components:
- Biofuel Cell: Prepare either an enzymatic fuel cell (e.g., using glucose dehydrogenase) or a microbial fuel cell (using electroactive bacteria).
- Organic Electrochemical Transistor (OECT): Fabricate thin-film transistors using a specific polymer as the channel material.
2. System Integration:
- Couple the OECT with the fuel cell electronically. Two primary configurations can be tested:
- Cathode-Gate Configuration: The fuel cell's cathode is connected to the OECT's gate electrode.
- Anode-Gate Configuration: The fuel cell's anode is connected to the OECT's gate electrode.
- Keep the OECT and fuel cell in separate chemical environments to ensure optimal conditions for both.
3. Signal Measurement:
- Introduce the target analyte (e.g., glucose, arsenite) to the biofuel cell.
- Measure the resulting electrical signal (e.g., current) at the OECT's output.
- The OECT will act as an amplifier, translating small electrochemical changes from the fuel cell into large, easily detectable electrical signals.
4. Performance Optimization:
- Identify the operational mode: power-mismatched mode for higher sensitivity or power-matched mode for more stable readings.
- Fine-tune the interactions between the fuel cell and OECT for the specific application.
Performance Benchmarks: State-of-the-Art Biosensors
The table below summarizes reported performance metrics for various advanced biosensors, providing reference points for your own development.
Table 1: Performance Comparison of Advanced Biosensors for Low-Concentration Detection
| Sensor Type / Technology | Target / Application | Key Performance Metrics | Reference |
|---|---|---|---|
| Algorithm-Optimized SPR | Mouse IgG | Detection Limit: 54 ag/mL (0.36 aM); 230% sensitivity increase | [8] |
| PCF-SPR with ML & XAI | Refractive Index (general) | Max Wavelength Sensitivity: 125,000 nm/RIU; FOM: 2112.15 | [14] |
| Gold-TiO₂ D-shaped PCF-SPR | Multi-Cancer Cells | Max Wavelength Sensitivity: 42,000 nm/RIU; FOM: 1393 RIU⁻¹ | [13] |
| OECT-Amplified Biofuel Cell | Arsenite in Water | Detection Limit: 0.1 µmol/L; Signal Amplification: 1000-7000x | [9] |
| SERS Immunoassay (Au-Ag Nanostars) | α-Fetoprotein (AFP) | Limit of Detection (LOD): 16.73 ng/mL | [15] |
| RCA-based Electrochemical Sensor | microRNA (miR-7a) | LOD: 0.59 fM; Dynamic Range: 1 fM - 100 fM | [11] |
Workflow and Signaling Pathways
Sensor Optimization and Experimental Workflow
DNA-Based Signal Amplification Pathways
The Scientist's Toolkit: Research Reagent Solutions
Table 2: Essential Materials for High-Sensitivity Biosensor Development
| Reagent / Material | Function / Role | Application Examples |
|---|---|---|
| Gold & Silver Films | Plasmonic layer to generate Surface Plasmon Resonance (SPR). | SPR, LSPR, and PCF-SPR biosensors. Gold preferred for chemical stability [8] [13]. |
| 2D Materials (Graphene, MoS₂) | Enhance sensitivity due to large surface area and strong analyte binding. | Coating on SPR sensors to improve performance [8]. |
| Titanium Dioxide (TiO₂) | Coating on gold to enhance sensitivity and performance. | D-shaped PCF-SPR sensors for cancer detection [13]. |
| Aptamers | Synthetic biological recognition elements (chemical antibodies) with high affinity. | Target-specific probes for proteins, small molecules, and cells [11]. |
| Polymerase Enzymes | Enzymatic replication of target nucleic acid sequences. | PCR, RCA, and LAMP for target-based signal amplification [11]. |
| Organic Electrochemical Transistors (OECTs) | Amplify weak electrical signals by several orders of magnitude. | Coupling with enzymatic/microbial fuel cells for signal enhancement [9]. |
| Au-Ag Nanostars | Plasmonic nanostructures for intense signal enhancement. | SERS-based immunoassays for biomarker detection [15]. |
Signal amplification is a cornerstone of modern biosensing, crucial for detecting low-abundance biomarkers for early disease diagnosis, environmental monitoring, and therapeutic applications [11] [16]. Amplification strategies are primarily employed to overcome the fundamental limitation of biosensor sensitivity when target analyte concentrations are exceptionally low, such as in the case of early-stage cancer biomarkers or trace pathogens [17] [18]. These strategies can be broadly categorized into target amplification (multiplying the number of target molecules) and signal amplification (enhancing the output per target molecule) [11]. The selection of an appropriate amplification strategy directly influences key biosensor performance parameters, including sensitivity, specificity, limit of detection (LOD), dynamic range, and reproducibility [16] [19].
The increasing demand for ultrasensitive detection in fields like clinical diagnostics has driven the development of sophisticated amplification methodologies [11]. This technical resource center provides troubleshooting guides, experimental protocols, and optimization frameworks centered on three primary amplification categories: enzymatic, nanomaterial-based, and nucleic acid-based strategies. Furthermore, this content is framed within the context of Design of Experiments (DoE), a systematic approach that significantly enhances the efficiency and effectiveness of biosensor development and optimization [17].
Core Amplification Strategies and Mechanisms
The following table summarizes the three primary signal amplification strategies, their core principles, and key applications in biosensing.
Table 1: Core Signal Amplification Strategies in Biosensing
| Strategy | Fundamental Principle | Key Examples | Typical Applications |
|---|---|---|---|
| Enzymatic | Utilizes enzymes to catalyze the production of many detectable reporter molecules from a single binding event [16]. | Horseradish Peroxidase (HRP), Alkaline Phosphatase (ALP), Glucose Oxidase (GOD) [16]. | Electrochemical detection of RNA tumor markers; colorimetric immunoassays [16]. |
| Nanomaterial-Based | Employs nanomaterials as catalysts, redox reporters, or carriers for numerous reporter molecules to amplify the signal [19]. | Gold Nanoparticles (AuNPs), Quantum Dots, Carbon Nanotubes [19]. | Electrochemical nucleic acid biosensors; rapid diagnostic tests (e.g., pregnancy tests) [19]. |
| Nucleic Acid-Based | Leverages the programmable hybridization of DNA/RNA to create complex structures or initiate cascades that amplify the signal [11]. | Hybridization Chain Reaction (HCR), Catalytic Hairpin Assembly (CHA), DNA nanostructures [11]. | Detection of specific DNA/RNA sequences; microRNA profiling; in-situ imaging [11]. |
The diagram below illustrates the fundamental workflow of a biosensor integrating these amplification strategies, from biorecognition to amplified signal output.
Figure 1: General workflow of a biosensor incorporating a signal amplification step.
Troubleshooting Guides and FAQs
This section addresses common experimental challenges encountered when working with different signal amplification strategies.
Enzymatic Amplification Troubleshooting
Table 2: Troubleshooting Guide for Enzymatic Amplification
| Problem | Possible Causes | Solutions & Checks |
|---|---|---|
| High Background Noise | 1. Non-specific binding of enzyme conjugate.2. Substrate contamination or degradation.3. Incomplete washing steps. | 1. Optimize blocking agent concentration and type (e.g., BSA, casein).2. Prepare fresh substrate buffer; check expiration dates.3. Standardize wash buffer volume, incubation time, and number of washes [17]. |
| Low or No Signal | 1. Enzyme inactivation.2. Sub-optimal substrate concentration.3. Incorrect buffer pH or missing cofactor. | 1. Check enzyme storage conditions; aliquot to avoid freeze-thaw cycles.2. Perform a substrate titration curve to determine ( K_m ) and optimal concentration [20].3. Verify buffer recipe; ensure necessary cofactors (e.g., ( Mg^{2+} ) for ALP) are present. |
| Poor Reproducibility | 1. Inconsistent enzyme immobilization.2. Fluctuations in reaction temperature.3. Uncontrolled manual pipetting. | 1. Use DoE to optimize immobilization parameters (concentration, time, coupling chemistry) [20].2. Use a thermostated chamber for reactions.3. Switch to automated liquid handling systems. |
FAQ: How can I improve the stability of my enzyme-based biosensor? Regular calibration is crucial. Store the sensor in the recommended buffer at 4°C, ensure the enzyme is not exposed to extreme temperatures during modification, and consider using more robust enzyme mutants or alternative catalysts if stability is a recurring issue [21].
Nanomaterial-Based Amplification Troubleshooting
Table 3: Troubleshooting Guide for Nanomaterial-Based Amplification
| Problem | Possible Causes | Solutions & Checks |
|---|---|---|
| Nanomaterial Aggregation | 1. Salt concentration too high during modification.2. Unsuitable surface chemistry.3. Protein fouling in complex samples. | 1. Introduce salt gradually during functionalization; use surfactants.2. Optimize the density and length of linker molecules (e.g., thiolated DNA) [19].3. Implement a sample pre-treatment step or improve the blocking strategy. |
| Inconsistent Signal Between Batches | 1. Poor reproducibility in nanomaterial synthesis.2. Variable functionalization efficiency. | 1. Characterize each batch (size, zeta potential, UV-Vis spectrum).2. Use standardized kits and protocols for functionalization. Establish rigorous quality control metrics [19]. |
| Non-specific Adsorption | 1. Inadequate passivation of nanomaterial surface.2. Electrostatic interactions with non-target molecules. | 1. Passivate with inert proteins (e.g., BSA) or polymers (e.g., PEG).2. Modify the surface charge of the nanomaterial to be more repulsive to interferents. |
FAQ: Why is my nanoparticle-based colorimetric assay not showing a color change? This could be due to nanoparticle instability leading to precipitation, improper conjugation of the biorecognition element, or the target concentration being below the visual detection threshold. Check the stability of the nanoparticles by DLS and UV-Vis, verify the conjugation chemistry, and run a positive control with a known high concentration of target [19].
Nucleic Acid-Based Amplification Troubleshooting
Table 4: Troubleshooting Guide for Nucleic Acid-Based Amplification
| Problem | Possible Causes | Solutions & Checks |
|---|---|---|
| Non-Specific Amplification or Leakage | 1. Off-target hybridization.2. Sub-optimal reaction temperature or buffer.3. Contaminated reagents or nuclease degradation. | 1. Re-design probes/primers with improved specificity; use LNA or PNA analogs [22].2. Use a thermal gradient to determine the optimal hybridization temperature.3. Use nuclease-free water and reagents; include nuclease inhibitors if needed. |
| Low Yield of Amplified Product | 1. Inefficient primer/probe binding.2. Secondary structure in the target or probe.3. Limitations in enzyme-free systems (e.g., HCR, CHA). | 1. Check primer melting temperature (( T_m )) and avoid self-complementarity.2. Use software to predict secondary structure; add denaturing agents like DMSO if necessary.3. Ensure all hairpin components are properly purified and folded [11]. |
| False Positives in Isothermal Amplification | 1. Primer-dimer formation.2. Amplification from contaminating DNA/RNA. | 1. Design primers with strict parameters; use hot-start enzymes.2. Physically separate pre- and post-amplification areas; use uracil-DNA glycosylase (UDG) containment. |
FAQ: What can I do if my DNA-based sensor lacks the required sensitivity for low-abundance targets? Consider integrating a target pre-amplification step such as Loop-Mediated Isothermal Amplification (LAMP) or Rolling Circle Amplification (RCA) before detection [11]. Alternatively, enhance the signal output by combining nucleic acid amplification with enzymatic or nanomaterial strategies, such as using DNAzyme-linked systems or nanoparticle-quenched probes [16] [19].
Detailed Experimental Protocols
Protocol: Developing an Electrochemical miRNA Biosensor using Enzymatic Amplification
This protocol outlines the steps for creating a biosensor to detect microRNA (miRNA) with femtomolar sensitivity using an enzyme-based signal amplification strategy, as inspired by recent research [16].
Research Reagent Solutions:
- Capture Probe: Thiolated single-stranded DNA (ssDNA) complementary to the target miRNA.
- Enzyme Conjugate: Streptavidin-Horseradish Peroxidase (SA-HRP).
- Substrate Solution: Tetramethylbenzidine (TMB) with ( H2O2 ).
- Buffer Solutions: Phosphate Buffered Saline (PBS), Saline-Sodium Citrate (SSC) buffer.
Step-by-Step Methodology:
- Electrode Pretreatment: Clean the gold electrode surface via electrochemical cycling in sulfuric acid solution and characterize using Cyclic Voltammetry (CV) in a standard redox probe like ( K3Fe(CN)6 ) [20].
- Self-Assembled Monolayer (SAM) Formation: Incubate the clean gold electrode with the thiolated capture probe (e.g., 1 µM) in PBS for 1-2 hours to form a SAM. Backfill with 6-mercapto-1-hexanol (MCH) for 1 hour to passivate unbound gold surfaces and orient the probes.
- Target Hybridization: Incubate the modified electrode with the sample containing the target miRNA for 60 minutes at a controlled temperature (e.g., 37°C). Wash thoroughly with SSC buffer to remove non-specifically bound sequences.
- Signal Amplification and Detection: a. Incubate the electrode with a biotinylated detector probe that binds to a different region of the captured miRNA. b. Introduce the SA-HRP conjugate, which binds to the biotin. c. Transfer the electrode to an electrochemical cell containing the TMB substrate. d. Apply a constant potential and measure the amperometric current generated by the HRP-catalyzed reduction of ( H2O2 ). The current is directly proportional to the target miRNA concentration [16].
The workflow for this protocol is visualized below.
Figure 2: Workflow for developing an electrochemical miRNA biosensor with enzymatic amplification.
Protocol: Optimizing a DNA Hydrogel Biosensor via RCA using DoE
This protocol uses a Design of Experiments (DoE) approach to optimize a biosensor that uses Rolling Circle Amplification (RCA) to create a DNA hydrogel for ultrasensitive detection of bacterial DNA [11].
Research Reagent Solutions:
- Circular Template: A single-stranded DNA circle complementary to a segment of the target bacterial gene (e.g., mecA of MRSA).
- Phi29 DNA Polymerase: An enzyme with high processivity for RCA.
- dNTPs: Deoxyribonucleotide triphosphates.
- Primer: A short DNA strand complementary to the circular template.
Step-by-Step Methodology:
- Define Objective and Response: The objective is to maximize the sensitivity (e.g., lower the LOD for the mecA gene). The primary response (Y) is the measured electrochemical signal (e.g., peak current in µA).
- Identify Critical Factors (X): Select factors likely to influence RCA efficiency and signal generation. For initial screening, a 2³ full factorial design is suitable [17]. Key factors include:
- X1: RCA reaction time (e.g., 60 - 120 minutes)
- X2: Phi29 polymerase concentration (e.g., 0.5 - 1.5 U/µL)
- X3: Hybridization temperature for the capture probe (e.g., 30 - 40°C)
- Execute the DoE: Perform the 8 experiments (2³) specified by the design matrix in a randomized order to minimize bias. Include center points to estimate experimental error.
- Analyze Data and Build Model: Use statistical software to fit a first-order model with interactions (e.g., ( Y = β0 + β1X1 + β2X2 + β3X3 + β{12}X1X2 + ε )). Identify which factors and interactions are statistically significant (p < 0.05).
- Optimize and Validate: Based on the model, predict the optimal factor settings to maximize the signal. Conduct a confirmation experiment at these predicted optimal conditions to verify the model's accuracy [17] [20].
The DoE Framework for Biosensor Optimization
The "one-variable-at-a-time" (OVAT) approach to optimization is inefficient and often fails to identify interactions between factors. Design of Experiments (DoE) is a powerful chemometric tool that provides a systematic, statistically sound framework for developing and optimizing biosensors by varying multiple factors simultaneously [17]. This approach not only reduces the total number of experiments required but also yields a global understanding of the system, revealing how factors interact to affect the response [20]. For ultrasensitive biosensors, where maximizing the signal-to-noise ratio is paramount, DoE is particularly valuable [17].
Implementing a Factorial Design
A 2^k factorial design is an excellent starting point for screening which factors from a large set have significant effects on your biosensor's performance. The experimental matrix for a 2² design, investigating reaction time (X1) and enzyme concentration (X2), is shown below. The model fitted to the data from these four experiments would be: ( Y = β0 + β1X1 + β2X2 + β{12}X1X2 ) [17].
Table 5: Experimental Matrix for a 2² Factorial Design
| Test Number | X1: Reaction Time | X2: Enzyme Concentration | Measured Response (Y) |
|---|---|---|---|
| 1 | -1 (Low) | -1 (Low) | Y1 |
| 2 | +1 (High) | -1 (Low) | Y2 |
| 3 | -1 (Low) | +1 (High) | Y3 |
| 4 | +1 (High) | +1 (High) | Y4 |
Advanced DoE: Response Surface Methodology (RSM)
After identifying critical factors, Response Surface Methodology (RSM) is used to find the optimal factor levels. A Central Composite Design (CCD) is commonly used for this purpose, as it efficiently fits a second-order model, allowing for the prediction of a curvature in the response [20]. An example is the optimization of an amperometric biosensor for heavy metals, where factors like enzyme concentration, number of electrosynthesis cycles, and flow rate were modeled using RSM to maximize sensitivity toward target ions [20]. The iterative nature of the DoE process for optimization is summarized in the diagram below.
Figure 3: The iterative workflow for optimizing biosensors using Design of Experiments (DoE).
Troubleshooting FAQs for DoE in Biosensor Development
Why did my DoE model show a significant factor interaction that I did not anticipate?
Unexpected factor interactions are common when moving beyond one-factor-at-a-time (OFAT) approaches. In biosensor development, factors like primer concentration, incubation temperature, and buffer pH can interact synergistically or antagonistically.
- Solution: Conduct a follow-up screening design, such as a Plackett-Burman design, to efficiently identify the most influential factors and their key interactions before proceeding to a more comprehensive optimization model. Always include center points in your design to detect curvature, which might be masking interactions.
My amplification signal is inconsistent across experimental replicates. What could be wrong?
High variability often stems from uncontrolled noise factors or imprecise protocol execution.
- Solution:
- Identify Noise Factors: List potential sources of variation (e.g., reagent lot differences, analyst technique, ambient temperature fluctuations).
- Implement Blocking: If a factor is known but uncontrollable (e.g., different PCR machines), use it as a "blocking" factor in your experimental design to eliminate its effect on the analysis.
- Randomize Run Order: Always randomize the order of your experimental runs to protect against the influence of lurking variables.
- Review Protocols: Ensure all liquid handling steps are performed using calibrated equipment and that incubation times are strictly adhered to.
The optimal conditions predicted by my model do not yield the expected signal improvement in validation. What happened?
This can occur due to overfitting or an incorrect assumption about the model's underlying structure.
- Solution:
- Check Model Lack-of-Fit: Ensure your model does not have a significant lack-of-fit p-value. A significant value indicates the model is not adequately describing the relationship between factors and responses.
- Confirm Factor Ranges: Verify that your experimental region (the range of factor values you tested) includes the true optimum. If the optimum lies outside your tested range, the model's prediction will be unreliable.
- Conduct Confirmation Runs: Always perform at least three confirmation runs at the predicted optimal settings to validate the model's performance and estimate pure error.
Experimental Protocol: DoE for Optimizing a Rolling Circle Amplification (RCA) Biosensor
This protocol outlines a systematic approach to optimize key factors in an RCA-based biosensor for detecting a specific microRNA (miRNA) target.
Define Objective and Response Variables
- Primary Objective: Maximize the fluorescence intensity signal from the RCA product.
- Secondary Objectives: Minimize non-specific amplification and reduce total assay time.
Select Factors and Ranges
Based on preliminary OFAT experiments, select the following factors and their levels for a Response Surface Methodology (RSM) design:
| Factor | Name | Low Level (-1) | High Level (+1) |
|---|---|---|---|
| A | Phi29 Polymerase Concentration (U/μL) | 5 | 15 |
| B | Incubation Time (minutes) | 60 | 120 |
| C | dNTP Concentration (mM) | 0.2 | 0.6 |
| D | Mg²⁺ Concentration (mM) | 10 | 20 |
Choose Experimental Design
A Central Composite Design (CCD) is recommended for this optimization. It efficiently estimates linear, interaction, and quadratic effects with a manageable number of runs. A full factorial for 4 factors would be augmented with axial (star) points and center points, totaling approximately 30 experimental runs.
Execute Experiments
- Randomization: Use statistical software to generate a randomized run order to minimize bias.
- Preparation: Prepare a master mix for common reagents to reduce pipetting error. Aliquot the master mix and then add factors according to the design table.
- Signal Measurement: Initiate the RCA reaction and measure the fluorescence intensity at the endpoint using a plate reader. Record all data in a structured table.
Analyze Data and Model Optimization
- Use software to perform multiple regression analysis on the fluorescence intensity data.
- Identify significant terms (main effects, interactions, quadratic effects) and remove non-significant ones to create a reduced model.
- The software will generate a set of optimal factor settings that maximize the predicted fluorescence signal.
Validate the Model
Perform three independent confirmation experiments at the predicted optimal conditions. The average result should align closely with the model's prediction and show a significant improvement over the baseline signal.
The table below compares common signal amplification techniques used in biosensor research, highlighting their performance characteristics to aid in method selection and experimental design [11].
| Method | Target | Biosensing Method | Dynamic Range | Limit of Detection (LOD) | Ref. |
|---|---|---|---|---|---|
| PCR | Nucleocapsid gene (SARS-CoV-2) | Electrochemical | 10 pg/μL - 200 pg/μL | 10² - 2×10³ copies/μL | [11] |
| PCR | Lambda DNA | Colorimetric | 0.5 ng/μL - 3 fg/μL | 63.7 aM | [11] |
| RCA | miR-7a (microRNA) | Electrochemical | 1 fM - 100 fM | 0.59 fM | [11] |
| RCA | S. aureus nuc gene | Electrochemiluminescent | 10 aM - 1 pM | 3.8 aM | [11] |
| LAMP | Mycoplasma pneumoniae | Electrochemical | 10³ - 10⁷ copies/mL | 10³ copies/mL | [11] |
| LAMP | Atlantic salmon DNA | Fluorescent | 0.1 fg - 100 ng | 1 fg of DNA | [11] |
DoE Workflow for Biosensor Optimization
The following diagram outlines the logical workflow for applying Design of Experiments to enhance biosensor signal amplification.
Research Reagent Solutions for DoE in Biosensing
This table details key reagents and materials essential for designing and executing experiments in DNA-based biosensor signal amplification [11].
| Item | Function in Experiment |
|---|---|
| DNA Polymerase (e.g., Phi29, Taq) | Enzymatic engine for amplification methods like PCR, RCA, and LAMP; synthesizes new DNA strands [11]. |
| Primers & Probes | Single-stranded DNA oligonucleotides designed for sequence-specific hybridization to initiate amplification or for signal generation [11]. |
| Aptamers | Single-stranded DNA or RNA oligonucleotides that function as "chemical antibodies" to bind non-nucleic acid targets (e.g., proteins, small molecules) with high affinity and specificity [11]. |
| dNTPs | The fundamental building blocks (deoxyribonucleotide triphosphates) required for enzyme-mediated DNA synthesis [11]. |
| Fluorescent Dyes (e.g., SYBR Green) | Intercalating dyes or labeled probes that emit fluorescence upon binding to double-stranded DNA, allowing for real-time or endpoint signal detection [11]. |
| Buffer Components (Mg²⁺) | Divalent cations like magnesium are critical cofactors for polymerase activity; their concentration is a common factor to optimize in a DoE [11]. |
| DNA Nanostructures | Programmatically assembled DNA structures (e.g., origami) that act as scaffolds to organize sensing elements and enhance signal transduction efficiency [11]. |
For researchers and scientists in drug development, optimizing a biosensor is a familiar hurdle. The process involves balancing multiple, often interacting, variables—from the density of biorecognition elements on the sensor surface to the conditions of the detection assay. Traditional "one-variable-at-a-time" (OVAT) approaches are not only time-consuming and resource-intensive but also risk missing the true optimal point because they fail to account for interactions between factors [23].
Design of Experiments (DoE) is a powerful chemometric tool that addresses these limitations. It provides a systematic, statistically grounded framework for guiding biosensor development and optimization. By running a pre-determined set of experiments, researchers can build a data-driven model that maps the relationship between input variables and sensor performance, efficiently revealing optimal conditions and critical interactions that OVAT methods overlook [24] [23]. This FAQ guide explains how to apply DoE to overcome specific challenges in biosensor signal amplification research.
Frequently Asked Questions (FAQs)
Q1: What fundamental problem in biosensor development does DoE solve?
A: The primary problem is the interaction between variables. In biosensor fabrication, factors like probe concentration, immobilization time, and buffer pH rarely act independently. Changing one can alter the effect of another. Traditional OVAT methods cannot detect these interactions, often leading to suboptimal performance and poor reproducibility. DoE is uniquely suited for this complexity because it is specifically designed to quantify how multiple factors and their interactions influence a desired outcome, such as the signal-to-noise ratio or limit of detection [23].
Q2: How does DoE directly enhance signal-to-noise ratio and dynamic range?
A: DoE enhances these critical parameters by enabling the precise optimization of the biosensor's interface and transduction chemistry. For instance, a Full Factorial Design can systematically vary the concentration of an immobilized enzyme and the pH of the assay buffer to find the combination that maximizes catalytic current (signal) while minimizing non-specific binding (noise) [23]. Similarly, a Central Composite Design can model curvature in the response, helping to push the dynamic range to its theoretical limits by fine-tuning interacting variables that a OVAT approach would miss [24] [23].
Q3: We are developing a novel bioelectronic sensor. Which specific DoE designs should we start with?
A: The choice of design depends on your goal. Below is a comparison of common DoE designs for biosensor optimization:
| DoE Design | Primary Use Case | Key Advantage | Example Experiment |
|---|---|---|---|
| Full Factorial | Screening for significant main effects and interactions with a small number of variables (e.g., 2-4) [23]. | Efficiently identifies which factors (and their interactions) have the largest impact on sensor response [23]. | Optimizing probe density and incubation time for an electrochemical aptasensor [23]. |
| Central Composite | Optimizing and modeling processes with curvature; building a precise response surface [24] [23]. | Fits a quadratic model, allowing you to find a true maximum or minimum (i.e., the "sweet spot") for performance [23]. | Finding the optimal pH and ionic strength for maximum signal amplification in an OECT-based sensor [9] [23]. |
| Mixture Design | Optimizing the composition of a multi-component blend where the total must sum to 100% [23]. | Handles the constraint of interdependent components, which is common in reagent formulation. | Optimizing the ratio of polymer, cross-linker, and mediator in a biosensor's hydrogel layer [23]. |
Q4: Can you provide a real-world example where DoE was crucial for success?
A: Yes. A recent breakthrough in enhancing bioelectronic sensors used organic electrochemical transistors (OECTs) to amplify signals from enzymatic and microbial fuel cells by over 1,000 times [9]. Optimizing such a system involves navigating complex power dynamics between the fuel cell and the OECT.
A researcher could employ a Central Composite Design to model the relationship between variables like bacterial cell density, substrate concentration, and transistor gate voltage. The resulting model would pinpoint the conditions that push the system into a "power-matched" mode, yielding a stable, highly amplified signal for detecting targets like arsenite in water or lactate in sweat [9]. This complex, multi-variable optimization is a quintessential task for DoE.
Troubleshooting Guide: From DoE Model to Robust Biosensor
| Observed Problem | Potential DoE Insight | Recommended Experimental Action |
|---|---|---|
| High Signal Noise | The DoE model may reveal an interaction between buffer ionic strength and incubation temperature that affects non-specific binding. | Use the response surface from a Central Composite Design to find the low-noise operating window [24] [23]. |
| Poor Reproducibility | A Full Factorial design might show that the effect of probe immobilization time on signal variance depends on the surface functionalization method. | The model pinpoints a critical interaction. Control this factor-interaction pair tightly during manufacturing [23]. |
| Insufficient Dynamic Range | The DoE model could indicate that the concentration of a signal amplification reagent has a non-linear (curved) effect on the maximum signal. | A follow-up Mixture Design can optimize the reagent cocktail composition to push the upper detection limit [23]. |
Experimental Protocol: Implementing a 2-Factor Full Factorial DoE
This protocol provides a step-by-step guide to screen for main effects and interactions in a biosensor assay.
1. Define Factors and Levels:
- Select two critical variables (e.g., Assay pH (Factor A) and Detection Antibody Concentration (Factor B)).
- Choose a "Low" (-1) and "High" (+1) level for each based on preliminary data (e.g., pH 7.0 and 8.5; Antibody 1 µg/mL and 5 µg/mL) [23].
2. Execute the Experimental Matrix:
- Run all four possible combinations of these levels in a randomized order to minimize bias. The experimental layout is as follows [23]:
| Experiment Run | Assay pH (A) | Detection Antibody Conc. (B) | Measured Response (e.g., Signal/Noise) |
|---|---|---|---|
| 1 | -1 (7.0) | -1 (1 µg/mL) | Result 1 |
| 2 | +1 (8.5) | -1 (1 µg/mL) | Result 2 |
| 3 | -1 (7.0) | +1 (5 µg/mL) | Result 3 |
| 4 | +1 (8.5) | +1 (5 µg/mL) | Result 4 |
3. Analyze Results and Calculate Effects:
- Main Effect of A: Average signal when A is high - Average signal when A is low =
[(Result 2 + Result 4) - (Result 1 + Result 3)] / 2 - Main Effect of B: Average signal when B is high - Average signal when B is low =
[(Result 3 + Result 4) - (Result 1 + Result 2)] / 2 - Interaction Effect AB: Assess whether the effect of pH depends on the antibody concentration. If the lines in the interaction diagram are not parallel, it indicates an interaction [23].
The Scientist's Toolkit: Research Reagent Solutions
| Reagent / Material | Critical Function in Biosensor Optimization |
|---|---|
| Organic Electrochemical Transistors (OECTs) | Used to amplify weak electrical signals from enzymatic or microbial fuel cells by up to 7,000x, crucial for detecting low-abundance analytes [9]. |
| CRISPR/Cas12a System | Provides highly specific signal amplification; upon target recognition, its collateral cleavage activity can be used to cut reporter molecules, generating a strong electrochemical signal [25]. |
| Transcription Factors (TFs) | Protein-based bioreceptors that regulate gene expression upon ligand binding; can be linked to reporters for high-throughput screening of metabolite-producing strains [26]. |
| Riboswitches / Toehold Switches | RNA-based sensors that undergo conformational changes for label-free, real-time regulation of metabolic fluxes or logic-gated detection of intracellular RNA [26]. |
Integrating Design of Experiments is not just a statistical upgrade; it is a strategic shift toward more efficient, robust, and insightful biosensor development. By moving beyond one-variable-at-a-time, researchers can deconvolute the complex synergies that define high-performance biosensing systems. This approach directly accelerates the development of reliable point-of-care diagnostics and sensitive monitoring tools for both clinical and environmental applications [24] [23]. Embrace DoE to navigate the complexity of biosensor optimization and unlock the full potential of your signal amplification research.
A Practical DoE Workflow for Biosensor Amplification
Frequently Asked Questions (FAQs)
Q1: What is the most critical goal when optimizing an ultrasensitive biosensor? The primary goal is often to lower the Limit of Detection (LOD) to the femtomolar level or below, enabling the early diagnosis of progressive diseases. This requires maximizing the Signal-to-Noise Ratio (SNR) to confidently distinguish the target signal from background interference [17] [23].
Q2: Are "sensitivity" and "limit of detection" the same thing? No, this is a common misconception. Sensitivity is a conversion factor relating a measured signal (e.g., a frequency shift) to a change in the target (e.g., mass). The Limit of Detection (LOD), however, is the smallest quantity that can be confidently detected and is determined by the Signal-to-Noise Ratio (SNR). A high sensitivity is only beneficial if it does not come with a proportional increase in noise [27].
Q3: Why is a systematic approach like Design of Experiments (DoE) better for optimization? Traditional "one-variable-at-a-time" approaches can miss critical interactions between factors and may not find the true optimum. DoE is a systematic, model-based method that explores the entire experimental domain efficiently, accounting for these interactions and building a predictive model with less experimental effort [17] [23].
Q4: Which key responses should I track during biosensor optimization? The essential responses depend on your application but typically include:
- Limit of Detection (LOD): The lowest analyte concentration that can be reliably detected.
- Signal-to-Noise Ratio (SNR): Critical for determining the LOD and ensuring result confidence.
- Dynamic Range: The range over which the biosensor provides a quantifiable signal.
- Selectivity/Specificity: The ability to distinguish the target analyte from interferents.
- Reproducibility: The precision of the biosensor output across multiple tests [17] [28] [29].
Troubleshooting Guides
Issue: High Background Noise or Low Signal-to-Noise Ratio
Potential Causes and Solutions:
- Cause 1: Non-specific binding of reagents or sample components.
- Solution: Optimize the concentration and type of blocking agent (e.g., BSA, casein) in the assay buffer. Systematically test different agents using a DoE approach to find the optimal condition [30].
- Cause 2: Suboptimal formulation of the biorecognition layer.
- Cause 3: Unstable or poorly characterized biorecognition element conjugates.
- Solution: Ensure thorough characterization of synthesized nanoparticles and bioconjugates (e.g., assessing size, shape, surface charge, and stability) before use in biosensor fabrication [30].
Issue: Inconsistent or Non-Reproducible Results Between Tests
Potential Causes and Solutions:
- Cause 1: Uncontrolled variation in fabrication or assay conditions.
- Cause 2: Inconsistent membrane properties in lateral flow or paper-based biosensors.
- Solution: Carefully select and characterize the membrane. Properties like porosity, thickness, and flow rate are critical. A DoE can be used to understand how different membrane lots or types interact with other assay components [30].
Key Response Parameters and Quantitative Targets
The following table summarizes the key responses to define and monitor during the optimization process.
| Response Parameter | Definition | Optimization Goal | Example from Literature |
|---|---|---|---|
| Limit of Detection (LOD) | The lowest analyte concentration that can be distinguished from blank with confidence. | Achieve sub-femtomolar (fM) or picogram-per-milliliter (pg/mL) levels for early disease diagnosis [17] [28]. | An electrochemical aptasensor for Paclitaxel achieved an LOD of 0.02 pg/mL [28]. |
| Signal-to-Noise Ratio (SNR) | The ratio of the magnitude of the target signal to the background noise. | A ratio of 2 or 3 is typically acceptable for confident detection of a signal [27]. | A QCM instrument's detection limit is defined as the signal that gives an SNR of 2 or 3 [27]. |
| Dynamic Range | The range of analyte concentrations over which the sensor response changes. | Widen the range for both low-level detection and high-concentration quantification. | Optimization of an RNA biosensor via DoE led to a 4.1-fold increase in dynamic range [29]. |
| Selectivity | The sensor's ability to respond only to the target analyte in the presence of interferents. | High specificity against closely related compounds or common biological matrix components. | An aptasensor for Leucovorin showed good selectivity against other chemotherapeutic drugs [28]. |
Experimental Protocol: Implementing a Definitive Screening Design (DSD) for Initial Optimization
This protocol is adapted from a study that successfully enhanced an RNA biosensor's performance [29].
1. Objective: Identify key factors significantly impacting the biosensor's dynamic range and signal-to-noise ratio.
2. Define Factors and Ranges: Select critical assay components and conditions (factors) and define a high (+1) and low (-1) level for each. Example factors include: * Concentration of the reporter protein * Concentration of the capture oligonucleotide (e.g., poly-dT) * Concentration of additives (e.g., DTT, MgCl₂) * Buffer pH and ionic strength * Incubation time and temperature
3. Generate and Execute the DSD: Use statistical software (e.g., Design-Expert, Stat-Ease 360) to generate a DSD experimental matrix [31] [32]. This design will create a list of experimental runs, each with a specific combination of factor levels. Execute these runs in a randomized order.
4. Model and Analyze Responses: For each experimental run, record your key responses (e.g., dynamic range, SNR). Input the data into the software to fit a statistical model. Use feature selection (e.g., stepwise regression with Bayesian Information Criterion) to identify factors with significant main effects and two-factor interactions.
5. Validation and Iteration: Conduct validation experiments at the predicted optimal conditions from the DSD model. Based on the results, you may proceed to a further optimization round (e.g., using a Response Surface Methodology design) to refine the optimum [29].
Experimental Workflow Diagram
The diagram below illustrates the iterative, systematic workflow for optimizing a biosensor using Design of Experiments.
Research Reagent Solutions
This table lists essential materials and their functions for a typical biosensor development and optimization project.
| Reagent / Material | Function in Biosensor Development | Key Consideration |
|---|---|---|
| Biorecognition Elements (Aptamers, Antibodies) | Provides specificity by binding the target analyte. | Affinity, stability, and optimal orientation upon immobilization are critical for performance [30] [28]. |
| Labels (Gold nanoparticles, Enzymes, Fluorescent dyes) | Generates a detectable signal (colorimetric, electrochemical, fluorescent). | Choice depends on the transducer; nanomaterials offer high surface area and unique properties [30]. |
| Blocking Agents (BSA, Casein, Synthetic polymers) | Reduces non-specific binding to the sensor surface, lowering background noise. | Type and concentration are key optimization parameters in assay buffer formulation [30]. |
| Membranes (Nitrocellulose, Paper) | Serves as a solid support and enables fluid transport in lateral flow assays. | Porosity, capillary flow rate, and protein binding capacity must be consistent and suitable [30]. |
| Chemical Additives (DTT, Detergents, Stabilizers) | Maintains a reducing environment, improves solubility, and stabilizes reagents. | Concentration can significantly impact signal output and assay robustness [30] [29]. |
Frequently Asked Questions (FAQs)
1. What are the most critical nanomaterial properties to consider for signal amplification? The most critical properties are the nanomaterial's size, shape, surface chemistry, and composition. These properties directly influence key signal enhancement mechanisms. For instance, noble metal nanoparticles (e.g., gold) exhibit strong surface plasmon resonance, while quantum dots offer size-tunable fluorescence. A high specific surface area allows for greater immobilization of biorecognition elements (e.g., antibodies, DNA probes), which is crucial for sensitivity [33] [34]. The surface chemistry also determines how effectively you can create stable bioconjugates with your probe molecules [30].
2. Why should I use a Design of Experiments (DoE) approach instead of optimizing one variable at a time? The traditional "one-variable-at-a-time" (OVAT) approach is inefficient and can miss important interactions between factors. For example, optimizing a biosensor with six variables via OVAT could require 486 experiments. A DoE approach, such as a D-optimal design, can find the true optimal conditions with far fewer experiments (e.g., only 30), leading to a more sensitive and robust biosensor. It has been shown to achieve a 5-fold improvement in the limit of detection (LOD) for miRNA sensors [35].
3. Which factors related to assay chemistry are most often overlooked? The choice of blocking agents, detergents, and the ionic strength/pH of the running buffer are frequently underestimated. These components are foundational to assay performance. They minimize non-specific binding, optimize the flow in lateral flow assays, and ensure proper kinetics for the interaction between your biorecognition element and the target analyte. Empirical screening and optimization of these reagents are essential [30].
4. My biosensor signal is weak. What are the first parameters I should investigate? First, verify the stability and quality of your nanomaterial-biomolecule conjugates. Then, systematically check the following using a structured approach:
- Immobilization density: Ensure an optimal amount of probe (antibody/DNA) is attached to the nanomaterial or sensor surface [36].
- Hybridization/Binding conditions: Optimize ionic strength, pH, and incubation time [35].
- Non-specific binding: Review your blocking strategy and buffer composition [30].
Troubleshooting Guides
Table 1: Troubleshooting Weak or No Signal
| Symptom | Possible Cause | Recommended Action |
|---|---|---|
| Weak or no detectable signal | Insufficient probe immobilization | Characterize bioconjugate; optimize probe concentration and conjugation chemistry [30] [36]. |
| Sub-optimal binding/hybridization kinetics | Use DoE to systematically optimize ionic strength, pH, and incubation time [35]. | |
| Inefficient signal transduction nanomaterial | Select nanomaterials known for high signal enhancement (e.g., AuNPs for colorimetric, QDs for fluorescent assays) [33] [34]. | |
| High background noise | Inadequate blocking | Test different blocking agents (e.g., BSA, casein, proprietary blends) and concentrations [30]. |
| Non-specific binding of nanomaterials | Include detergents (e.g., Tween 20) in running and washing buffers [30]. | |
| Over-enhancement in metallic deposition steps | For methods like silver staining, optimize precursor concentration and reaction time to reduce background nucleation [37]. | |
| Irreproducible results between batches | Inconsistent nanomaterial synthesis | Strictly control synthesis parameters (temperature, precursor concentration, reaction time). |
| Variable conjugation efficiency | Standardize and characterize the conjugation process (e.g., pH, ratio of probe to nanomaterial) [30]. | |
| Fluctuations in instrument parameters | Use DoE to identify critical instrument settings (e.g., voltage, temperature) and maintain strict control [35]. |
Table 2: Troubleshooting Specific to Signal Enhancement Protocols
| Enhancement Strategy | Common Challenge | Solution |
|---|---|---|
| Metallic Deposition (e.g., Gold/Silver Enhancement) [37] | High background; spontaneous nucleation | Optimize concentration of metal ion precursor (e.g., HAuCl₄) and reducing agents (e.g., MES, H₂O₂). Adjust pH and buffer composition to favor deposition on existing nanoparticles over new nucleation [37]. |
| Enzyme-Based Amplification | Enzyme inactivation or instability | Ensure proper storage of enzyme conjugates; optimize buffer conditions (pH, ionic strength) for maximum enzyme activity. |
| Nanomaterial Labels (QDs, CNTs) [34] | Signal quenching | Ensure proper passivation of nanomaterials; check for energy transfer between closely packed labels. |
Quantitative Data for Experimental Design
Table 3: Key Nanomaterial Properties and Their Impact on Biosensor Performance
| Nanomaterial | Key Property | Impact on Signal Amplification | Example Performance |
|---|---|---|---|
| Gold Nanoparticles (AuNPs) | Surface Plasmon Resonance | Enables colorimetric detection and signal enhancement via metal deposition [37]. | Visual detection of <10 nanoparticles after enhancement [37]. |
| Quantum Dots (QDs) | Size-Tunable Fluorescence; Broad Excitation | Allows multiplexed detection; high photostability for sensitive FRET-based assays [34]. | Enables detection at single molecule/particle level [34]. |
| Carbon Nanotubes (CNTs) | High Electrical Conductivity | Enhances electron transfer in electrochemical biosensors, improving sensitivity [33] [34]. | Used in composites for improved electrochemical response [34]. |
| Metal Oxides (ZnO, SnO₂) | Fluorescence Enhancement; High Surface Area | Can increase quantum yield of fluorophores; more probe immobilization [34]. | SnO₂ nanomaterial achieved detection limit of 1.0 × 10⁻¹⁴ M for DNA [34]. |
| Magnetic Nanoparticles | Superparamagnetism | Enables efficient separation and concentration of analyte, reducing background [30]. | Used in functionalization of beads for assay steps [30]. |
Table 4: DoE versus OVAT: A Quantitative Comparison
| Optimization Aspect | One-Variable-at-a-Time (OVAT) | Design of Experiments (DoE) |
|---|---|---|
| Number of Experiments for 6 Variables | Hypothetical: 486 experiments [35] | Actual: 30 experiments (using D-optimal design) [35] |
| Detection of Factor Interactions | No, risks missing true optimum [35] | Yes, identifies synergistic/hidden effects [35] |
| Optimization Efficiency | Low, time-consuming [35] | High, strategic and comprehensive [35] |
| Resulting Performance (Example) | Higher limits of detection [35] | 5-fold improved LOD for miRNA [35] |
Detailed Experimental Protocols
This protocol outlines the use of a D-optimal design to optimize a paper-based electrochemical DNA biosensor.
1. Define Variables and Ranges: Identify the critical factors to optimize. The example below is for a DNA-miRNA hybridization sensor:
- Manufacturing Variables:
AuNP concentration: Concentration of gold nanoparticles used on the electrode.Probe concentration: Concentration of the immobilized DNA probe.
- Assay Chemistry & Working Condition Variables:
Ionic strength: Of the hybridization buffer.Hybridization time: Time allowed for probe-target binding.Incubation temperature: Temperature for the hybridization step.Electrochemical parameters: e.g., applied voltage.
2. Implement the D-Optimal Design:
- Use statistical software to generate an experimental matrix with 30 runs, each representing a unique combination of the six variables at different levels [35].
- Prepare and test the biosensor according to each of the 30 experimental conditions.
- Record the analytical response (e.g., peak current) for each run.
3. Analyze Data and Model the System:
- Input the response data into the software to build a mathematical model.
- The model will identify which factors have a significant effect and reveal any interaction effects between them.
- The software will predict the optimal combination of factor levels that yields the highest signal (e.g., peak current).
4. Verify the Model:
- Run a confirmation experiment using the predicted optimal conditions.
- Compare the experimental result with the model's prediction to validate the optimization.
This protocol describes a method to enhance the signal of various nanoprobes (Au, Ag, silica, iron oxide) by depositing a gold metal layer.
1. Prepare Enhancement Solution:
- Final Concentrations:
- 5 mM Chloroauric acid (HAuCl₄·3H₂O)
- 50 mM MES buffer, pH 5.0 - 6.0
- 1.027 M Hydrogen Peroxide (H₂O₂)
- Procedure: Dissolve the components in deionized water. The solution should be prepared fresh before use.
2. Perform Enhancement Reaction:
- After the initial detection step with the nanoprobes is complete and the substrate has been washed, apply the enhancement solution to cover the detection zone.
- Incubate at room temperature for 2 to 5 minutes. Monitor the signal development visually or with a scanner.
- Critical Note: The MES buffer and H₂O₂ act as reducing agents, converting Au(III) to Au(0), which deposits onto the existing nanoprobes, enlarging them and drastically amplifying the signal.
3. Stop the Reaction and Read:
- Rinse the substrate thoroughly with deionized water to stop the enhancement process.
- Dry the substrate and acquire the final signal (visually, by UV-Vis, or scanner).
Experimental Workflow and Signaling Pathways
Diagram 1: DoE Optimization Workflow
Diagram 2: Nanomaterial Signal Enhancement
The Scientist's Toolkit: Research Reagent Solutions
Table 5: Essential Materials for Biosensor Development and Signal Enhancement
| Item | Function / Role in Signal Amplification |
|---|---|
| Gold Nanoparticles (AuNPs) | Versatile label for colorimetric detection; excellent seed for metal deposition enhancement due to strong Surface Plasmon Resonance [33] [37]. |
| Quantum Dots (QDs) | Fluorescent nanolabel; size-tunable emission enables multiplexing; used as donors in FRET-based assays for high sensitivity [34]. |
| MES Buffer | A buffering agent that also acts as a reducing agent in metallic enhancement solutions, facilitating the deposition of gold onto nanoprobes [37]. |
| Chloroauric Acid (HAuCl₄) | The source of Au(III) ions in gold enhancement protocols; reduced to Au(0) to form a metal layer on seed nanoparticles [37]. |
| Hydrogen Peroxide (H₂O₂) | A co-reducing agent in enhancement solutions; helps control the kinetics of metal deposition, improving the signal-to-noise ratio [37]. |
| Blocking Agents (BSA, Casein) | Proteins used to passivate unused binding sites on the sensor surface, critical for reducing non-specific binding and background noise [30]. |
| Detergents (e.g., Tween 20) | Surfactants added to running and wash buffers to minimize hydrophobic interactions and further reduce non-specific binding [30]. |
| Nitrocellulose Membranes | The critical porous substrate in lateral flow and many paper-based biosensors; its properties (pore size, flow rate) must be optimized for each assay [30]. |
FAQ: DoE and PCR Fundamentals
Q1: What is Design of Experiments (DoE) and how does it apply to PCR optimization?
Design of Experiments (DoE) is a statistical approach used to optimize a method by minimizing costs and time through strategically designed experiments that maximize information gain [38]. In the context of real-time PCR probe optimization, a DoE approach allows researchers to systematically investigate the effect of multiple input factors—such as probe sequence design and binding stability—on assay performance characteristics (target values) simultaneously [39] [38]. This contrasts with the traditional "one-factor-at-a-time" approach, which is less efficient. For probe optimization, using DoE required only 180 individual reactions compared to 320 needed for a one-factor-at-a-time approach [39] [38].
Q2: What are the key advantages of using DoE for PCR probe optimization?
The primary advantages include:
- Reduced Experimental Burden: DoE can significantly reduce the number of experiments required. One study reported a reduction from 320 to 180 individual reactions [39] [38].
- Identification of Critical Factors: DoE helps identify which input factors have the greatest influence on assay performance. In mediator probe PCR, dimer stability between the mediator and universal reporter was identified as the most influential factor [38].
- Optimized Performance: Implementing an optimal design configuration identified through DoE improved RT-MP PCR efficiency by up to 10% and achieved excellent detection limits of 3-14 target copies per reaction for influenza B virus [39] [38].
Q3: What are common "target values" when optimizing PCR assays using DoE?
Target values are performance characteristics that represent the effectiveness of the PCR method. Key values often include [38]:
- Selectivity/Specificity: The ability to solely assess the intended target.
- Accuracy: Closeness of agreement between test results and accepted reference values.
- Precision: Degree of agreement between independent test results.
- Limit of Detection (LOD): The lowest amount of analyte that can be detected.
- Linear Dynamic Range: The quantity range over which the measurand can be determined linearly.
- Real-time PCR Efficiency: A measure of the power of product formation in a particular PCR cycle.
Troubleshooting Common PCR Issues
| Observation | Possible Cause | Recommended Solution |
|---|---|---|
| No Product | Suboptimal annealing temperature | Recalculate primer Tm; test a temperature gradient starting 5°C below the lower Tm of the primer pair [40] [41]. |
| Poor primer design or specificity | Verify primers are specific to the target and non-complementary to each other; use online design tools [40]. | |
| Insufficient template quality/quantity | Analyze DNA integrity via gel electrophoresis; increase template amount if necessary [40] [41]. | |
| Multiple or Non-Specific Products | Primer annealing temperature too low | Increase annealing temperature; use a hot-start polymerase to prevent mispriming [40] [41]. |
| Excess Mg2+ concentration | Optimize Mg2+ concentration, typically in 0.2-1 mM increments [40] [41]. | |
| Poor primer design | Avoid GC-rich 3' ends and repetitive sequences; increase primer length for enhanced specificity [40]. | |
| Low Efficiency/Poor Yield | Problematic probe design | For probe-based assays, optimize factors like probe-target dimer stability and primer-probe distance using DoE [39] [38]. |
| Suboptimal reaction components | Use DNA polymerases with high processivity for complex targets; optimize Mg2+ and dNTP concentrations [40]. | |
| Inhibitors in reaction | Purify template DNA to remove contaminants like phenol, EDTA, or salts; use polymerases tolerant to inhibitors [40]. |
Experimental Protocol: DoE-Based Probe Optimization
This protocol outlines the methodology for implementing a DoE approach to optimize mediator probe (MP) designs for real-time PCR, based on the study by [38].
Definition of Optimization Goal
- Clearly define the performance requirements for your assay. For clinical detection of viral targets, a typical goal might be reliable detection of 10-100 RNA copies per reaction [38].
Selection of Performance Characteristics and Target Value
- Select key performance characteristics that influence your goal, such as PCR efficiency, quantitative correlation (R²), signal-to-background ratio, and Cq value at a specific concentration.
- Combine these into a single abstracted target value using a weighted formula. For example [38]:
Target value = (a × R²) + (b × PCR efficiency) + (c × signal increase) + (d × Cq value at 10^4 copies/reaction) - Coefficients a-d are determined based on the mean values of the performance characteristics from initial screening experiments to balance their influence.
Selection of Input Factors and Factor Levels
- Identify critical input factors from probe interaction pathways. For MP PCR, the most effective factors were [38]:
- Dimer stability (ΔG) between the mediator probe (MP) and the universal reporter (UR).
- Dimer stability (ΔG) between the MP and the target sequence.
- Distance between the primer and the MP cleavage site.
- Define at least two levels (e.g., high and low) for each factor to test.
Experimental Setup and Execution
- Design: Use a screening design (e.g., a fractional factorial design) to select a representative set of MP sequences that cover the different combinations of your chosen factor levels. The referenced study used nine different MP designs [38].
- Preparation: Prepare an RNA dilution series for calibration.
- Running the Assay: Perform RT-MP PCR with all MP designs and RNA concentrations in a defined number of replicates. The study used nine replicates per concentration for limit of detection analysis [38].
- Data Collection: Record Cq values, fluorescence signals, and calculate the performance characteristics for each MP design.
Data Analysis and Validation
- Calculate the target value for each MP design.
- Analyze the data to determine which input factors and factor levels yield the highest target value.
- Confirm the optimal configuration by testing the detection limit with a different universal reporter design and/or a second target sequence to validate robustness [38].
Quantitative Data from DoE Case Study
Table: DoE Experimental Design and Performance Outcomes for MP PCR [38]
| Input Factor | Factor Description | Influence on Assay Performance | Optimal Configuration Outcome |
|---|---|---|---|
| MP-UR Dimer Stability (ΔG) | Gibbs free energy of mediator probe binding to universal reporter | Greatest influence; 10% increase in PCR efficiency with optimal ΔG | Strongest correlation with improved efficiency and lower Cq values |
| MP-Target Dimer Stability (ΔG) | Gibbs free energy of mediator probe binding to target sequence | Moderate influence on overall assay performance | Required balanced stability for specific binding and probe release |
| Primer-Probe Distance | Nucleotide distance between primer and probe cleavage site | Lesser, but still significant, influence on efficiency | Specific distance optimized for polymerase cleavage efficiency |
| Overall DoE Benefit | -- | Reduced experiments from 320 (one-factor) to 180 | Achieved detection limit of 3-14 copies/μL for InfB and 7-11 copies/μL for hMPV |
The Scientist's Toolkit: Research Reagent Solutions
Table: Essential Reagents for DoE-based PCR Probe Optimization
| Reagent / Material | Function in Optimization | Application Note |
|---|---|---|
| Universal Reporter (UR) | Fluorogenic oligonucleotide that hybridizes with released mediator to generate signal; allows use of same reporter for different targets [38]. | Design is critical for fluorescence signal generation; dimer stability with MP is a key optimization factor. |
| Sequence-Specific Mediator Probe (MP) | Unlabeled hydrolysis probe cleaved during amplification; released segment binds to UR [38]. | Its sequence is the subject of DoE optimization (interaction with target and UR). |
| High-Fidelity DNA Polymerase | Enzyme for DNA synthesis; hot-start versions increase specificity by reducing non-specific amplification at low temperatures [40] [41]. | Essential for robust amplification, especially for complex targets (GC-rich, long amplicons). |
| Statistical Software for DoE | Enables experimental design creation, data analysis, and identification of significant factors and interactions [38]. | Crucial for efficiently implementing the DoE approach and interpreting complex results. |
| Magnesium Salts (MgCl₂/MgSO₄) | Cofactor for DNA polymerase; concentration significantly impacts specificity, yield, and fidelity [40] [41]. | Requires optimization (often 0.2-1 mM increments); preference for MgSO₄ or MgCl₂ depends on polymerase. |
| Nucleotide Mix (dNTPs) | Building blocks (dATP, dCTP, dGTP, dTTP) for new DNA strand synthesis [40]. | Use balanced, equimolar concentrations to prevent increased error rates; fresh aliquots recommended. |
Experimental Protocols & Key Data
Core Experimental Methodology
This protocol is adapted from the foundational study that demonstrated 400% LSPR signal enhancement using gold nanoparticle-labeled antibodies [42].
Nanoparticle Fabrication:
- Method: Nanosphere Lithography (NSL)
- Substrate: Glass coverslips (Fisher no. 2, 18 mm)
- Cleaning: Piranha solution (1:3 30% H₂O₂/H₂SO₄) at 80°C for 30 minutes
- Nanomask: Polystyrene nanospheres (390 nm diameter) in hexagonal formation
- Metal Deposition: 20 nm Ag evaporated onto samples
- Result: Silver nanoprism arrays on glass substrate [42]
Surface Functionalization:
- Self-Assembled Monolayer (SAM): Incubate nanoprism substrates in 1 mM 3:1 ethanolic solution of octanethiol/11-mercaptoundecanoic acid for 12-24 hours
- Biotin Attachment: Incubate with 1 mM amine-conjugated biotin (EZ-Link Amine-PEO3-Biotin) in 10 mM PBS with 100 mM EDC linker for 1 hour
- Rinsing: Remove excess EDC and biotin with 10mM PBS [42]
Gold Nanoparticle-Antibody Conjugation:
- Nanoparticles: 20 nm Au colloids (British Biocell International)
- Antibody: Antibotin monoclonal antibodies (Sigma)
- Conjugation Method: Electrostatic adsorption at pH 9
- Incubation: 1 mL colloids with 9.0 μg antibiotin for 1 hour
- Purification: Centrifuge at 8000g for 1 hour at 4°C
- Storage: Resuspend in milli-Q H₂O, use immediately or store at 4°C [42]
Quantitative Enhancement Results
Table 1: LSPR Signal Enhancement Metrics from Hall et al. Study [42]
| Parameter | Standard Antibody | NP-Antibody Conjugate | Improvement |
|---|---|---|---|
| Wavelength Shift | Baseline | Up to 400% amplification | 4x enhancement |
| Binding Constant | Reference | 2 orders of magnitude stronger | 100x improvement |
| Limit of Detection | Reference | Nearly 3 orders of magnitude lower | ~1000x more sensitive |
| Detection Level | Not specified | Picomolar range achieved | Clinically relevant |
Troubleshooting Guide: Frequently Asked Questions
Conjugation Efficiency Issues
Q: How can I verify successful antibody-nanoparticle conjugation? A: Monitor the LSPR peak shift using UV-visible spectroscopy. In the reference study, bare gold colloids exhibited an extinction peak at 521.1 nm. Following antibody conjugation, the peak red-shifted by 13.1 nm to 534.2 nm, confirming antibody attachment. Based on the refractive index sensitivity of 80 nm/RIU for 20 nm gold colloids, this shift indicates a refractive index change of approximately 0.16 RIU, consistent with monolayer protein coverage [42].
Q: What factors affect conjugation stability? A: Key factors include:
- pH optimization: The ideal labeling pH should be optimized for the isoelectric point of each specific antibody [43]
- Salt concentration: High salt can induce nanoparticle aggregation; the protective antibody layer prevents this [43]
- Storage conditions: Conjugates should be stored at 4°C and used promptly after preparation [42]
Signal Optimization Challenges
Q: Why am I not achieving the expected 400% signal enhancement? A: Consider these factors:
- Nanoparticle size and shape: The reference study used precisely fabricated 20 nm gold nanoparticles and silver nanoprisms. Variations in nanoparticle morphology significantly impact LSPR properties [44]
- Antibody orientation: Random antibody attachment can block binding sites. Consider site-specific conjugation methods
- Distance from surface: Sensitivity losses occur when detecting molecules place themselves far from the surface and outside the optimal sensing volume [42]
Q: What alternative signal amplification strategies exist? A: Recent advances include:
- DNA origami adapters: Provide tunable amplification factors (55-fold with gold nanoparticles, up to 125-fold with fluorescent dyes) with molecular precision [45]
- Peptide self-assembly engineering: Achieves 18-fold sensitivity enhancement for cancer biomarkers [46]
- Click chemistry-mediated nanosensors: Enable effective signal transformation and amplification with high selectivity [47]
Specificity and Background Issues
Q: How can I reduce non-specific binding in LSPR assays? A:
- Implement proper surface passivation with mixed SAMs (as in the reference study using 3:1 octanethiol/11-mercaptoundecanoic acid) [42]
- Optimize running buffer composition and include appropriate blocking agents
- Use orthogonal verification methods like gel electrophoresis to confirm binding specificity [45]
The Scientist's Toolkit: Essential Research Reagents
Table 2: Key Reagents for Nanoparticle-Antibody Conjugate Experiments
| Reagent/Category | Function/Application | Specific Examples |
|---|---|---|
| Nanoparticles | LSPR signal generation and amplification | 20 nm Au colloids (British Biocell International) [42] |
| Antibodies | Target recognition and binding | Antibotin monoclonal antibodies (Sigma) [42] |
| Surface Chemistry | Substrate functionalization and stabilization | Octanethiol, 11-mercaptoundecanoic acid, amine-conjugated biotin [42] |
| Coupling Agents | Facilitating biomolecular conjugation | EDC (1-ethyl-3-(3-dimethylaminopropyl) carbodiimide HCl) [42] |
| Alternative Amplification Scaffolds | Enhanced signal amplification | DNA origami structures [45], peptide self-assemblies [46] |
| Characterization Tools | Verification and quantification | UV-visible spectroscopy, TEM analysis, gel electrophoresis [42] [45] |
Experimental Workflow Visualization
LSPR Enhancement Experimental Workflow
Signal Enhancement Mechanism
LSPR Signal Amplification Mechanism
Implementing Full Factorial and Screening Designs to Map the Factor Space
Troubleshooting Guides and FAQs
Frequently Asked Questions (FAQs)
Q1: When should I use a Full Factorial Design instead of a Screening Design?
- A: A Full Factorial Design is most appropriate when you have a limited number of factors (typically 2-5) and your goal is to understand not only the main effects of each factor but also all the possible interactions between them [48]. It provides a complete map of the factor space but becomes impractical with many factors due to the exponential increase in required experimental runs [49]. Use a Screening Design, such as a fractional factorial or Plackett-Burman design, when you need to efficiently identify the most influential factors from a large pool of potential variables (e.g., 5 or more), saving time and resources for subsequent, more detailed optimization studies [49] [50].
Q2: My Screening Design identified several important factors. What is the recommended next step?
- A: After a screening experiment, the recommended path is to perform an optimization experiment on the few critical factors you have identified [50]. This often involves using a Response Surface Methodology (RSM) design, such as a Central Composite or Box-Behnken design, to understand the curvature in the response and pinpoint the optimal factor settings [48]. If your initial screening design had low resolution and you suspect important interactions are confounded, you can also "fold" the design to de-alias those effects before proceeding [50].
Q3: Why is the optimal setting suggested by my main effects plot different from the actual best run in my full factorial experiment?
- A: This is a classic indication of significant interaction effects [48]. Main effects plots only show the average effect of changing a factor across all levels of other factors. If a strong interaction exists, the effect of one factor depends on the level of another. The optimal combination can therefore be a specific setting that main effects alone cannot reveal. You must analyze the interaction plots to understand these dependencies [48].
Q4: How do I handle continuous factors like temperature or concentration in a 2-level design?
- A: Continuous factors are handled by selecting a "Low" and "High" level that represent a practical and interesting range for your process [48]. The experimental runs are performed at these two extremes. To simplify analysis and make the effects of different factors comparable, it is standard practice to code these levels as -1 (Low) and +1 (High) [48].
Troubleshooting Common Experimental Issues
Problem: High background noise is obscuring the signal in my biosensor response.
- Potential Cause & Solution: The signal-to-noise ratio may be too low. Recent research demonstrates that coupling enzymatic or microbial fuel cells with Organic Electrochemical Transistors (OECTs) can amplify electrical signals by 1,000 to 7,000 times while also improving the signal-to-noise ratio [51]. Ensure your transducer and amplification system are optimized for your specific bio-recognition element.
Problem: The results from my fractional factorial screening design are confusing, and some effect estimates seem unreliable.
- Potential Cause & Solution: This is likely due to the confounding (aliasing) of main effects with two-factor interactions in low-resolution designs [49]. If interactions are present, they corrupt the estimates of the main effects.
- Solution 1: If possible, "fold" your design. This involves adding a second set of runs that reverses the signs of one or more factors, which can help de-alias these confounded effects [50].
- Solution 2: Consider using a Definitive Screening Design (DSD) for future experiments. DSDs require more runs than Plackett-Burman designs but can estimate main effects, quadratic effects, and two-way interactions without confounding [49] [50].
Problem: My biosensor's response is inconsistent between experimental replicates.
- Potential Cause & Solution: This lack of reproducibility can stem from several sources related to core biosensor characteristics [52].
- Check Stability: Fluctuations in temperature or pH can degrade the biological receptor (e.g., enzyme, antibody) or affect the transducer's performance [52]. Tightly control environmental conditions.
- Check Selectivity: Other molecules in the sample matrix may be interfering with the target analyte, causing false positives or signal suppression [52]. Review the specificity of your bio-recognition element.
- Review Experimental Procedure: Ensure that sample preparation, sensor immobilization, and measurement protocols are standardized and followed precisely every time.
The following tables summarize key characteristics of different Design of Experiments (DoE) approaches and the performance metrics of a relevant biosensor study.
Table 1: Comparison of Common Experimental Designs for Factor Screening
| Design Type | Maximum Factors (Typical) | Key Strength | Key Limitation | Best Suited For |
|---|---|---|---|---|
| Full Factorial | ~4-5 (2-level) [48] | Estimates all main effects and all interactions [48] | Number of runs grows exponentially with factors (e.g., 5 factors = 32 runs) [48] | Characterizing a small, well-defined factor space completely [48] |
| Fractional Factorial | 15 [50] | Highly efficient for screening; fewer runs [49] | Confounds (aliases) interactions with main effects [49] | Screening many factors when higher-order interactions are negligible [49] |
| Plackett-Burman | 47 [50] | Very high efficiency for a large number of factors [49] | Assumes all interactions are negligible [49] | Screening a very large number of factors to find the vital few [49] |
| Definitive Screening | 48 [50] | Estimates main effects, interactions, and quadratic effects [50] | More runs than Plackett-Burman [50] | Screening when curvature or interactions are suspected [49] |
Table 2: Signal Amplification Performance of OECT-Enhanced Biofuel Cells
This data is derived from a recent study on enhancing bioelectronic sensors, demonstrating the quantitative impact of a well-designed amplification system [51].
| Biofuel Cell Type | OECT Configuration | Signal Amplification Factor | Key Application Demonstrated | Detection Limit |
|---|---|---|---|---|
| Enzymatic (Glucose Dehydrogenase) | Cathode-Gate | 1,000 - 7,000x [51] | Lactate sensing in sweat [51] | Not Specified |
| Microbial (Engineed E. coli) | Cathode-Gate | Up to 7,000x [51] | Arsenite detection in water [51] | 0.1 µmol/L [51] |
Experimental Protocols
Protocol 1: Setting Up a 2-Level Full Factorial Design
This protocol outlines the steps to create and execute a basic full factorial design, using a 4-factor example from the search results [48].
Objective: To systematically investigate the effect of four factors (Temperature, Pressure, Concentration of Formaldehyde, Agitation Speed) on Filtration Rate.
Step-by-Step Methodology:
Define Factors and Levels: Select practical "Low" and "High" levels for each factor based on prior knowledge and equipment limits [48].
- Factor A (T): Temperature (20°C / 40°C)
- Factor B (P): Pressure (1 bar / 3 bar)
- Factor C (CoF): Concentration of Formaldehyde (2% / 6%)
- Factor D (RPM): Agitation Speed (100 / 300)
Create the Design Matrix: Generate a table with 16 rows (2⁴ = 16 runs). Each row is a unique combination of factor levels, coded as -1 (Low) and +1 (High). Crucially, randomize the run order before going to the lab to minimize the effect of uncontrolled variables [48].
Execute Experiments: Conduct the experiments strictly according to the randomized run order. Measure and record the response (Filtration Rate) for each run.
Analyze Main Effects:
- For each factor, calculate the average response at its high level and subtract the average response at its low level [48].
- Example for Temperature: Average Filtration Rate at +1 (80.9) - Average at -1 (59.3) = Main Effect of +21.6 units [48].
- Plot these main effects on a bar chart to visualize which factors have the largest influence.
Analyze Interaction Effects:
- Create two-way interaction plots. For a T x CoF interaction, plot the mean Filtration Rate for different T levels, with separate lines for each CoF level [48].
- Interpret the plot: Non-parallel lines indicate an interaction. For example, the effect of Temperature is much stronger when Formaldehyde Concentration is low [48].
Protocol 2: Executing a Screening Design Using a Fractional Factorial Approach
Objective: To identify the most significant factors affecting a process from a large set (e.g., 5-10) with a minimal number of experimental runs.
Step-by-Step Methodology:
Select the Screening Design: Choose a 2-level fractional factorial design. The specific design (e.g., 2^(5-1), requiring 8 runs) depends on the number of factors and the desired resolution [49].
Understand the Confounding (Alias) Structure: The design generator will create a confounding pattern where, for example, the estimate for the main effect of factor A is confounded with the BCD interaction. Check this pattern to ensure that interactions you suspect might be important are not aliased with the main effects you wish to estimate [49].
Run the Experiment: Execute the experimental runs in a randomized order.
Analyze the Data: Calculate the main effects for each factor. Due to confounding, these are often called "estimated main effects."
Identify Significant Factors: Use a Pareto chart or half-normal plot to visually identify which factors have effect sizes larger than would be expected by random noise. These are your "vital few" factors.
Plan Follow-up Actions: Focus subsequent optimization experiments (e.g., using Response Surface Methods) on the significant factors identified in this screening step [50].
Experimental Workflow and Signaling Pathways
Diagram 1: DoE Selection and Implementation Workflow
Diagram 2: Biosensor Signal Amplification via OECT Coupling
This diagram illustrates the mechanism behind the signal amplification method reported in the recent research [51].
The Scientist's Toolkit: Research Reagent Solutions
Table 3: Essential Materials for DoE in Biosensor Development
| Item | Function/Description | Application Note |
|---|---|---|
| Organic Electrochemical Transistor (OECT) | A thin-film transistor that operates in aqueous environments and provides high signal amplification (up to 7000x) and improved signal-to-noise ratio for bioelectronic sensors [51]. | Ideal for amplifying weak signals from enzymatic or microbial fuel cells in medical or environmental biosensors [51]. |
| Enzymatic Fuel Cell | A biofuel cell that uses enzymes (e.g., Glucose Dehydrogenase) to catalyze the oxidation of a target analyte (e.g., glucose), generating a small electrical current [51]. | Serves as the bio-recognition and initial signal generation element. Can be electronically coupled with an OECT [51]. |
| Microbial Fuel Cell | A biofuel cell that uses engineered electroactive bacteria to metabolize a substrate and produce current. Can be designed to respond to specific stimuli [51]. | Used for detecting a wider range of analytes, such as arsenite in water, by engineering responsive electron transfer pathways [51]. |
| Coded Factor Levels (-1, +1) | A standardized method for representing the low and high settings of factors in a DoE, ensuring all factors have equal weight and simplifying mathematical modeling [48]. | A fundamental practice in 2-level factorial and screening designs to make patterns easier to identify and analysis more straightforward [48]. |
Solving Common Biosensor Challenges with Structured DoE
Technical Support Center
This technical support center provides troubleshooting guides and frequently asked questions (FAQs) to help researchers in biosensor signal amplification research implement Design of Experiments (DoE) effectively. A stable and well-characterized underlying process is the essential foundation for any successful DoE, as it ensures that your experimental results are reliable, reproducible, and meaningful.
Frequently Asked Questions (FAQs)
1. Why is process stability a prerequisite for a successful DoE? Process stability ensures that the variation in your response measurements is primarily due to the factors you are deliberately changing in your experiment, and not from unknown or uncontrolled sources of noise. A stable process provides a reliable baseline, allowing DoE to accurately identify the true effect of each factor on your signal output. Implementing DoE on an unstable process leads to confusing data, misleading models, and an inability to reproduce optimal conditions [53].
2. We want to optimize a nanomaterial-based signal amplifier. Which factors should we consider in our DoE? For nanomaterial-based amplification, which relies on properties like high surface area and excellent electrical conductivity, your DoE should include factors that influence the consistency of these properties [54]. Key factors often include:
- Controllable Factors: Synthesis temperature and time, precursor concentrations, pH of the reaction solution, and functionalization methods.
- Uncontrollable Factors: Ambient humidity (if not controlled), batch variations in raw materials, and analyst technique. A fractional factorial design can be an efficient starting point to screen this larger number of factors [53].
3. How can we use DoE to make our biosensor assay more robust against environmental variations? DoE, particularly Taguchi Methods, is specifically designed for this purpose. You can include "noise factors" in your experimental design—such as ambient temperature, sample pH variation, or storage time of reagents—that are difficult to control in real-world use. The DoE will then help you find optimal settings for your controllable factors (e.g., reagent concentration, incubation time) that make your biosensor's signal least sensitive to those noise factors, thus enhancing robustness [53].
4. Our electrochemical biosensor results are inconsistent. Could the issue be with our electrode preparation? Yes, this is a common source of variability. The electrode surface is the heart of the transduction system. Inconsistent cleaning, modification, or immobilization of biorecognition elements (like enzymes or antibodies) will directly lead to unstable baseline signals and poor reproducibility. Before any DoE, you must establish and document a Standard Operating Procedure (SOP) for electrode preparation and run control charts to verify that the process is stable [53].
Troubleshooting Guide for Common DoE Issues
The following table outlines specific problems, their potential root causes, and corrective actions to ensure your DoE for biosensor development is successful.
Table: Troubleshooting Common DoE Implementation Issues
| Problem | Potential Root Cause | Corrective Actions & Solutions |
|---|---|---|
| High Background Noise in Assay | Non-specific binding, unstable electrochemical cell conditions, or contaminated reagents [55]. | - Use a Fractional Factorial Design to screen factors like blocking agent concentration, washing buffer stringency, and voltage parameters. - Implement rigorous reagent quality control and preparation SOPs. |
| Poor Reproducibility of Signal Amplification | Uncontrolled variation in nanomaterial synthesis or inconsistent enzyme activity in amplification protocols [53] [56]. | - Before DoE, conduct a Gage R&R (Repeatability & Reproducibility) study to quantify measurement system variability. - For enzymatic amplification (e.g., using Horseradish Peroxidase), control factors like enzyme lot, storage temperature, and substrate freshness [54] [56]. |
| DoE Model Fails to Predict Optimal Conditions | The underlying process was unstable during data collection, or critical factor interactions were missed [53]. | - Return to process stability checks. Verify control chart stability. - Consider a Response Surface Methodology (RSM) design like a Central Composite Design to better model curvature and interactions. - Ensure you have involved a cross-functional team to identify all potential factors. |
| Inability to Scale Up a Successful Lab Result | Key scale-up parameters (e.g., mixing dynamics, temperature gradients) were not identified as factors in the original DoE [53]. | - Use a cross-functional team to brainstorm potential scale-up factors early. - Employ a Full Factorial or Response Surface Methodology design at the pilot scale, explicitly including scale-dependent factors like mixing speed and volume. |
Detailed Experimental Protocol: Establishing a Stable Baseline for an Electrochemical Biosensor
This protocol provides a step-by-step methodology to characterize and stabilize the core signal generation process of an electrochemical biosensor before embarking on a DoE for optimization [53].
1. Defining the Problem and Objectives:
- Objective: To establish a stable and reproducible baseline signal for a working electrode functionalized with a model biorecognition element (e.g., an antibody).
- Measurable Response: The measured current (in µA) at a fixed potential in a standard buffer solution, using Cyclic Voltammetry (CV) or Electrochemical Impedance Spectroscopy (EIS).
2. Identifying Key Factors and Responses:
- Factors: This stage focuses on factors critical to process stability.
- Electrode polishing procedure (time, pressure, slurry type).
- Cleaning protocol (e.g., ultrasonic bath duration, solvent).
- Immobilization time for the biorecognition element.
- Buffer pH and ionic strength.
- Responses:
- Primary Response: Signal baseline (current).
- Secondary Responses: Signal-to-noise ratio, peak shape in CV, charge transfer resistance (Rct) in EIS.
3. Choosing and Executing the Experimental Design:
- Initial Approach: Use a Full Factorial Design for the small number of critical stability factors listed above. This will help you understand the main effects and interactions that influence signal stability.
- Execution: Systematically run the experiments as per the design matrix. Use a calibrated potentiostat and automate data collection where possible to minimize human error.
4. Analyzing the Data and Interpreting Results:
- Use statistical software (e.g., Minitab, JMP) to perform Analysis of Variance (ANOVA) to identify which factors significantly affect the baseline stability.
- The goal is to find the factor level settings that minimize variation in the baseline response, even if it does not yet maximize the signal. This creates your stable platform.
5. Validation:
- Once optimal settings for stability are identified, perform confirmatory runs (e.g., 10-15 consecutive runs) under these fixed conditions.
- Plot the results on a control chart. If all points fall within the control limits and show no non-random patterns, your process is considered stable and ready for subsequent DoE studies aimed at performance optimization [53].
The Scientist's Toolkit: Key Research Reagent Solutions
Table: Essential Materials for Biosensor Signal Amplification Research
| Item | Function in Experiment |
|---|---|
| Gold Nanoparticles (AuNPs) | Used as labels or transducers to enhance electrochemical signals due to their high stability, biocompatibility, and surface plasmon resonance properties. They can be functionalized with antibodies or DNA [54]. |
| Horseradish Peroxidase (HRP) | An enzyme label used in enzymatic signal amplification. It catalyzes a reaction that produces an electroactive species, generating multiple signal molecules per binding event [56]. |
| Carbon Nanotubes (CNTs) / Graphene | Nanomaterials used to modify electrode surfaces. They provide a high surface area, excellent electrical conductivity, and fast electron transfer kinetics, significantly amplifying the detected signal [54]. |
| Methylene Blue | A redox-active intercalating probe used in electrochemical detection of nucleic acids. It can be used to quantify amplified DNA products, for example, from LAMP or RCA reactions [56]. |
| Magnetic Nanoparticles | Used for sample preparation and as labels in magnetic biosensors. They allow for separation and concentration of target analytes, reducing background interference and enabling amplification via magnetic sensors [54]. |
Process Stability Verification Workflow
The following diagram illustrates the logical workflow for verifying process stability before initiating a Design of Experiments, as detailed in the experimental protocol above.
In the context of Design of Experiments (DoE) for enhancing biosensor signal amplification, identifying and controlling nuisance variables is paramount. These factors—stemming from materials, operators, and environmental conditions—can introduce significant variability, obscuring true signal responses and compromising research validity. This guide provides targeted troubleshooting protocols to help researchers isolate and mitigate these confounding effects, enabling more robust and reproducible biosensor development.
Frequently Asked Questions (FAQs)
FAQ 1: What are the most common sources of signal variability in bioelectronic sensors? Signal variability often arises from the biochemical environment, the stability of the biological recognition element (e.g., enzymes, cells), and the integration between the biological and electronic components. Incompatible electrolyte environments or suboptimal conditions for the bioreceptor can drastically affect performance [9].
FAQ 2: How does the environmental context affect a biosensor's performance? The environmental context, including growth media, carbon sources, and supplements, can crucially affect biosensor dynamics. For instance, a naringenin biosensor exhibited significantly different fluorescence outputs when operated in M9 medium versus SOB medium, and with supplements like glycerol or sodium acetate compared to glucose [57].
FAQ 3: What are typical signs of electronic issues in sensor readers? Common signs include an inability to establish communication with the device (e.g., failure to read an internal temperature sensor) or unexpected noise in the signal. These often point to connection problems or circuit design flaws [58].
Troubleshooting Guides
Issue 1: Low Signal-to-Noise Ratio in Bioelectronic Sensors
A poor signal-to-noise ratio makes it difficult to distinguish the true signal from background interference.
- Potential Cause 1: Power mismatch between the fuel cell and the transducer. A power-mismatched mode can lead to operation near short-circuit conditions, increasing sensitivity but also potential instability [9].
- Troubleshooting Steps:
- Characterize the power output of your biofuel cell (enzymatic or microbial) independently.
- Ensure the operational mode of your organic electrochemical transistor (OECT) is matched to the fuel cell's power. A power-matched mode, where the fuel cell produces sufficient power to drive the OECT, yields more stable and accurate readings [9].
- Preventive Measures: Fine-tune the interactions between the biological component and the transducer at the design stage. Using a cathode-gate configuration with a specific polymer channel material has been shown to provide superior amplification while mitigating noise [9].
Issue 2: Inconsistent Biosensor Response Due to Environmental Context
A biosensor performs well in one set of conditions but fails or behaves erratically in another, such as when changing media or scaling up a process.
- Potential Cause: The genetic circuit's performance is highly dependent on context-specific factors like the metabolic state of the cell, which is influenced by media composition and supplements [57].
- Troubleshooting Steps:
- Systematic Characterization: Follow a Design-Build-Test-Learn (DBTL) pipeline. Build a library of biosensor constructs and characterize their dynamic responses under a wide range of conditions relevant to your application (e.g., different media, carbon sources) [57].
- Modeling: Develop a biology-guided machine learning model to predict the biosensor's behavior under various contextual parameters, allowing you to select the optimal combination of genetic parts and environmental conditions for your specific needs [57].
- Experimental Protocol for Context Testing:
- Build a combinatorial library of biosensors by varying regulatory elements (e.g., promoters, RBSs).
- Test the constructs in multiple environmental contexts (e.g., M9, SOB media with glucose, glycerol, or acetate supplements).
- Measure the output (e.g., fluorescence) dynamically over time.
- Use the data to calibrate a predictive model that accounts for context-dependent parameters [57].
Issue 3: Signal Drift and Performance Degradation Over Time
The biosensor's calibration shifts, or its signal strength diminishes with repeated use or over its operational lifetime.
- Potential Cause 1: Degradation or fouling of the biological recognition element. Enzymes can denature, and surfaces can be fouled by proteins in complex samples [12].
- Troubleshooting Steps:
- Implement rigorous calibration schedules and use reference standards.
- Use blocking agents or antifouling coatings when working with complex samples like serum or wastewater [12].
- Explore the use of self-healing materials in sensor design. These materials can automatically recover from physical damage, significantly extending sensor lifespan and maintaining functional integrity [59].
- Potential Cause 2: Instability in the bioreceptor-immobilization matrix. Biomolecules may lose activity or become inaccessible [12].
- Troubleshooting Steps:
- Optimize immobilization techniques (e.g., covalent attachment, affinity-based anchoring) to maintain biological activity and stability.
- Use surface chemistries tailored to the specific biomolecule, such as self-assembled monolayers (SAMs) for proteins [12].
Issue 4: Communication Failures and Electronic Noise in Sensor Reader Systems
The readout system fails to communicate with the sensor or produces excessively noisy data.
- Potential Cause: Faulty wiring, poor connections, or circuit design issues introducing noise or preventing communication [58].
- Troubleshooting Steps:
- Test Communications: Verify you can read from the sensor's internal registers, such as its temperature sensor. Failure indicates a communication issue [58].
- Independent Electronics Test: Disconnect the biosensor and test the electronics independently. Short the working, counter, and reference electrodes via a 1 MOhm resistor and apply a series of bias voltages. The measured voltages should change sensibly with the applied bias, confirming the electronics function correctly [58].
- Schematic Review: Have an experienced engineer review your circuit schematics to identify and eliminate unnecessary connections or sources of noise [58].
Table 1: Signal Amplification Performance of OECT Configurations
This table summarizes quantitative data from studies integrating biofuel cells with Organic Electrochemical Transistors (OECTs), demonstrating how configuration choices impact performance [9].
| Biofuel Cell Type | OECT Configuration | Amplification Factor | Key Characteristics |
|---|---|---|---|
| Enzymatic (Glucose) | Cathode-Gate | 1,000 - 7,000 | Highest amplification; improved signal-to-noise ratio; uses specific polymer channel. |
| Enzymatic (Glucose) | Anode-Gate | Strong Amplification | Potential for irreversible degradation at higher currents. |
| Microbial (Lactate) | Cathode-Gate | High (Demonstrated) | Suitable for wearable applications; detects metabolites in sweat. |
Table 2: Impact of Environmental Context on Biosensor Dynamics
This table illustrates how environmental factors can significantly alter the output of a naringenin biosensor, highlighting the need to control these conditions [57].
| Growth Medium | Carbon Source/Supplement | Relative Normalized Fluorescence | Implication for Experimentation |
|---|---|---|---|
| M9 | Glucose (S0) | Lowest | Baseline low-output condition. |
| M9 | Sodium Acetate (S2) | Highest | Can enhance signal output significantly. |
| SOB | Glycerol (S1) | High | Medium and supplement choice can dramatically boost signal. |
The Scientist's Toolkit: Key Research Reagent Solutions
| Reagent / Material | Function in Biosensor Research |
|---|---|
| Organic Electrochemical Transistors (OECTs) | Thin-film transistors that operate in aqueous environments; used for high-sensitivity, low-power signal amplification from fuel cells [9]. |
| FdeR Transcription Factor | A biological recognition element from Herbaspirillum seropedicae that activates gene expression in the presence of naringenin; used in whole-cell biosensor constructs [57]. |
| Self-Healing Polymers | Materials that automatically recover from physical damage; incorporated into biosensors to extend operational lifespan, especially in implantable or wearable contexts [59]. |
| Nanostructured Electrodes (e.g., Graphene, Gold NPs) | Provide a high surface area, improving signal transduction and sensitivity in electrochemical biosensors [60] [61]. |
Experimental Workflow Visualization
The diagram below outlines the Design-Build-Test-Learn (DBTL) cycle, a core workflow for systematically engineering robust biosensors and controlling for nuisance variables.
Leveraging DoE to Differentiate Specific Signal from Non-Specific Binding
FAQs: Addressing Common DoE Challenges in Biosensor Optimization
Q1: What is the primary advantage of using a Design of Experiments (DoE) approach over a one-variable-at-a-time (OVAT) method for optimizing my biosensor's signal-to-noise ratio?
DoE is a powerful statistical tool that allows you to systematically explore the multidimensional experimental space of your biosensor system with a minimal number of experimental runs [62]. Unlike OVAT, which iteratively tests single factors, DoE can efficiently screen for vital factors and components, characterize interactions between them, and ultimately achieve optimal process settings [32]. This is crucial for biosensor optimization, as it can reveal non-intuitive interactions between factors (like the concentration of an immobilized bioreceptor and the pH of the detection buffer) that jointly influence non-specific binding and specific signal generation. These interactions consistently elude detection in OVAT approaches [23]. Applying a modern DoE framework to biosensor development enables the systematic modification of biosensor dose-response behavior, leading to enhanced performance metrics such as maximum signal output, dynamic range, and sensitivity [62].
Q2: Which specific DoE designs are most suitable for initial screening to identify critical factors affecting non-specific binding?
For initial screening when you have many potential factors, a Definitive Screening Design (DSD) is highly efficient. A DSD allows you to screen a relatively large number of factors (k) with only 2k+1 experiments. For example, a study optimizing a protocatechuic acid (PCA) biosensor used a definitive screening design to explore three genetic factors (promoters and RBS), requiring only 13 experimental constructs [62]. If you have a smaller number of factors (typically 2 to 5), a 2k Full Factorial Design is an excellent first-order orthogonal design. It requires 2k experiments and is a potent tool for fitting first-order models and identifying significant main effects and interactions [23]. The table below summarizes the experimental matrix for a 2^2 factorial design.
Table: Experimental Matrix for a 2^2 Full Factorial Design
| Test Number | Factor X1 (e.g., Bioreceptor Density) | Factor X2 (e.g., Blocking Agent Concentration) |
|---|---|---|
| 1 | -1 (Low) | -1 (Low) |
| 2 | +1 (High) | -1 (Low) |
| 3 | -1 (Low) | +1 (High) |
| 4 | +1 (High) | +1 (High) |
Q3: My initial factorial design suggests curvature in the response. How can I model this to find the true optimum conditions?
When your response (e.g., signal-to-noise ratio) follows a quadratic function, you need a second-order model. To augment your initial factorial design, a Central Composite Design (CCD) is the standard choice. A CCD adds axial (or "star") points and center points to a factorial design, enabling the estimation of quadratic terms and providing a comprehensive view of the response surface. This allows you to locate the precise optimum settings for your factors, such as the specific combination of pH and ionic strength that maximizes specific signal while minimizing non-specific adsorption [23]. The subsequent workflow diagram illustrates a typical iterative DoE process for moving from initial screening to robust optimization.
Q4: How do I handle the optimization of a biosensor's detection interface when the components (e.g., in a blocking solution) must add up to 100%?
When your factors are proportions of a mixture that must sum to 100%, a Mixture Design is the appropriate chemometric tool [23]. This is common when formulating a blocking solution to reduce non-specific binding, where you might be optimizing the relative proportions of proteins (e.g., BSA, casein), surfactants, and other inert carriers. A mixture design allows you to systematically explore this constrained experimental space and find the blend that provides the highest specific signal and lowest background.
Q5: My DoE model suggests an optimal point, but how can I be sure it will perform robustly in practice?
After identifying an optimum from your response surface model, it is critical to perform confirmatory experiments. Run the biosensor assay at the predicted optimal conditions in replication. The closeness of the experimental results to the model's predictions validates the model's adequacy. Furthermore, to ensure robustness, you can use the model to generate an "Overlay Plot" that displays the region of factor space where all responses (e.g., high signal, low noise, wide dynamic range) simultaneously meet your desired specifications [32]. This helps you find a "sweet spot" that is resilient to small, inevitable variations in experimental execution.
Troubleshooting Guides: DoE for Biosensor Specificity
Issue: High Background Signal (Non-Specific Binding) Despite Using Common Blocking Agents
Potential Cause: The concentration of your immobilized bioreceptor (e.g., antibody, aptamer) and the composition/concentration of your blocking agent are interacting in a way that promotes non-specific interactions. Optimizing these factors independently (OVAT) may fail to find the global optimum.
DoE-Driven Resolution:
- Define Factors and Ranges:
- Factor A: Bioreceptor Immobilization Density (e.g., from 0.1 mg/mL to 1.0 mg/mL).
- Factor B: Blocking Agent Concentration (e.g., BSA from 1% to 5% w/v).
- Factor C: Wash Buffer Ionic Strength (e.g., NaCl from 0 M to 0.5 M).
- Execute a Screening Design: Use a 2^3 full factorial design (8 experiments, plus center points) to assess the main effects and two-factor interactions (AB, AC, B*C) on your responses.
- Measure Critical Responses: For each experiment, measure both the specific signal (with target analyte) and the background signal (without target analyte, or with a non-cognate analyte).
- Analyze and Optimize: Fit a model to your primary response, which could be Signal-to-Noise Ratio = (Specific Signal) / (Background Signal). A response surface methodology (like a CCD) can then be used to find the factor levels that maximize this ratio. A study on whole-cell biosensors used this approach to increase dynamic range (ON/OFF ratio) by over 500-fold [62].
Table: Example DoE Results for Biosensor Optimization
| Construct | Bioreceptor Density (Coded) | Blocking Conc. (Coded) | Background (OFF) | Signal (ON) | ON/OFF Ratio |
|---|---|---|---|---|---|
| pD1 | 0 | 0 | 593.9 ± 17.4 | 1035.5 ± 18.7 | 1.7 ± 0.08 |
| pD2 | 0 | +1 | 397.9 ± 3.4 | 62070.6 ± 1042.1 | 156.0 ± 1.5 |
| pD3 | -1 | -1 | 28.9 ± 0.7 | 45.7 ± 4.7 | 1.6 ± 0.16 |
| pD7 | +1 | +1 | 1282.1 ± 37.9 | 47138.5 ± 1702.8 | 36.8 ± 1.6 |
Adapted from a definitive screening design for a PCA biosensor [62].
Issue: Poor Dynamic Range Limiting Ability to Differentiate Low Analyte Concentrations
Potential Cause: The relative expression levels or activities of the biosensor's regulatory components (e.g., repressor proteins, reporter enzymes) are not balanced for the new genetic context or detection environment.
DoE-Driven Resolution:
- Treat Genetic Parts as Continuous Factors: Systematically modify regulatory component libraries (e.g., promoters of different strengths, RBS libraries) by assigning them coded levels (e.g., -1, 0, +1) based on their characterized expression strength [62].
- Apply a Screening Design: Use a design like a Definitive Screening Design to efficiently map how different combinations of these genetic factors affect both the OFF-state (leakiness) and ON-state (maximum output) of the biosensor.
- Model for Desired Performance: The data-driven model generated from the DoE allows you to predict the specific combination of parts that will yield the desired performance, such as a very low OFF-state for low background and a high ON-state for strong signal, thereby maximizing dynamic range. This methodology has been successfully applied to modulate the slope of the dose-response curve to create biosensors with both digital and analogue behavior [62].
The Scientist's Toolkit: Essential Research Reagent Solutions
Table: Key Materials for DoE-Optimized Biosensor Development
| Reagent / Material | Function in Biosensor Development | Application Note |
|---|---|---|
| Allosteric Transcription Factor (aTF) | Genetic sensory component; binds promoter-operator in absence of effector, derepressing upon effector binding [62]. | Core biorecognition element for whole-cell biosensors; can be engineered for new specificities. |
| Promoter / RBS Library | A set of genetic parts with varying strengths to systematically tune gene expression levels of sensor and reporter components [62]. | Enables treatment of genetic design as a continuous factor in a DoE to balance system performance. |
| Blocking Agent Mixtures (e.g., BSA, Casein) | Proteins or other molecules used to passivate the sensor surface and reduce non-specific binding of non-target molecules. | Ideal candidate for a Mixture Design DoE to find the optimal blocking formulation [23]. |
| Wash Buffer Components | Solutions with controlled pH, ionic strength, and additives (e.g., surfactants like Tween-20) to remove unbound material while preserving specific interactions. | Factors like ionic strength are prime candidates for a factorial design to minimize background. |
Visualizing the DoE-Optimized Biosensor Signaling Pathway
The following diagram illustrates the core signaling pathway in an allosteric transcription factor (aTF)-based whole-cell biosensor, a system successfully optimized using DoE [62]. Understanding this pathway is key to identifying which factors (e.g., promoter strengths for PcaV and GFP) to include in an experimental design.
Troubleshooting Common Optimization Challenges
FAQ: Why do my optimization results have high overall desirability (D) but poor individual response performance? This occurs when the composite desirability (D) masks poor performance in one or more individual responses. The overall desirability is a geometric mean of individual desirabilities [63] [64]. If any individual desirability (dᵢ) is zero, the overall desirability becomes zero; however, a moderately low dᵢ can be compensated for by very high values in others. To troubleshoot:
- Action 1: Revisit your goal definitions. Ensure the lower and upper limits for each response are set to truly acceptable minimum and maximum values based on business or experimental requirements, not just the observed data range [64].
- Action 2: Inspect the solution's predicted values. Examine the predicted value for each response at the proposed optimal conditions, not just the composite D value. Run confirmation experiments to verify these predictions [64].
- Action 3: Adjust goal strictness. If a response is critically important, consider narrowing its acceptable range or changing its importance weight in the optimization algorithm.
FAQ: How can I extend the dynamic range of my biosensor beyond the inherent 81-fold limit of single-site binding? The fixed 81-fold dynamic range (from 10% to 90% saturation) is a fundamental limitation of single-site binding physics [65]. To overcome this:
- Action 1: Combine receptor variants. Engineer a set of receptor variants (e.g., molecular beacons with different stem stabilities) that retain identical specificity but span a wide range of affinities [65].
- Action 2: Optimize the mixing ratio. Combine these variants in non-equimolar ratios to correct for differences in individual signal gain. Simulations indicate that combining receptors with a 100-fold difference in affinity maximizes the log-linear dynamic range [65]. Using four variants of progressively different affinities, one study achieved a dynamic range extended by over four orders of magnitude (~900,000-fold) [65].
FAQ: My biosensor suffers from low reproducibility despite a strong signal. What factors should I investigate? Poor reproducibility often stems from uncontrolled variables in the biosensor fabrication or detection process.
- Action 1: Use DoE for fabrication optimization. Employ a screening design like a full or fractional factorial design to identify which factors (e.g., bioreceptor immobilization time, temperature, concentration, surface chemistry) and their interactions significantly affect reproducibility (measured as %RSD) [23] [66].
- Action 2: Control nanomaterial properties. If using carbon nanomaterials, be aware that variations in chirality, diameter, aggregation, and impurities can lead to performance differences between batches [67].
- Action 3: Validate your model. Ensure your response surface model has a non-significant lack-of-fit (p-value > 0.10) and a high predicted R-squared to confirm it can reliably predict new observations [64].
FAQ: The optimization algorithm fails to find a viable solution (D=0). What are the likely causes? A failure to find a solution indicates that no set of factor levels within the explored domain simultaneously meets all the defined response goals [64].
- Action 1: Check for conflicting goals. Ensure your response objectives are not fundamentally contradictory within the experimental domain. For example, maximizing speed while minimizing heart rate in a bicycle study may only be possible within a specific factor window [68].
- Action 2: Widen acceptable response ranges. Loosen the upper and/or lower limits for one or more responses to create a larger, and potentially viable, operational space [64].
- Action 3: Re-evaluate your model's validity. A poor or inaccurate predictive model for one or more responses will lead the algorithm to non-optimal regions of the design space. Verify that all models are significant and have a good fit [64].
Experimental Protocols for Key Optimization Strategies
Protocol 1: Optimizing Biosensor Fabrication using a Factorial Design
This protocol uses a Design of Experiments (DoE) approach to systematically optimize biosensor fabrication parameters for multiple objectives [23] [66].
- Define Factors and Responses: Select critical input factors (e.g., probe concentration, incubation time, pH). Define your output responses (e.g., Sensitivity, Dynamic Range, %RSD for reproducibility).
- Select and Run Experimental Design: Choose a screening design like a 2^k factorial design. The experimental matrix, which defines the runs, is built by assigning factors to columns and runs to rows, with levels set to -1 (low) and +1 (high) [23].
- Build Predictive Models: For each response, use regression analysis to build a model that relates the factors to the response. The model's significance (p-value < 0.05) and lack-of-fit must be checked [66] [64].
- Set Optimization Goals: Define the desired goal for each response (maximize, minimize, or target) and set acceptable limits [63].
- Perform Numerical Optimization: Use a desirability function approach to find the factor settings that simultaneously satisfy all goals, maximizing the overall desirability (D) [63] [66] [64].
The workflow for this multi-response optimization is summarized in the diagram below.
Protocol 2: Rationally Editing Biosensor Dynamic Range using Receptor Blends
This protocol describes a thermodynamic strategy to extend or narrow the dynamic range of a biosensor by mixing receptor variants [65].
- Generate Receptor Variants: Engineer a set of receptors with identical specificity but varying affinities. For structure-switching biosensors like molecular beacons, this is achieved by tuning the stability of the non-binding conformation (e.g., the stem) [65].
- Characterize Individual Variants: Measure the dissociation constant (K_d) and signal gain for each variant. Confirm that specificity is maintained across the set.
- Simulate Blend Behavior: Perform simulations to determine the optimal affinity difference and mixing ratio for the desired outcome. A 100-fold affinity difference is optimal for a wide log-linear range, while a >500-fold difference can create a three-state response [65].
- Prepare and Validate Blend: Mix the receptor variants in the optimized, non-stoichiometric ratios determined from simulation. Experimentally validate the dynamic range and specificity of the blended sensor.
The logical flow for editing dynamic range through receptor blending is as follows.
Quantitative Data for Multi-Response Optimization
Table 1: Desirability Function Definitions for Different Response Goals The desirability function (d) translates the value of a response into a scale from 0 (undesirable) to 1 (fully desirable) [63].
| Goal Type | Definition | Parameters |
|---|---|---|
| Maximize | ( d = \begin{cases} 0 & y < L \ \left(\frac{y-L}{T-L}\right)^r & L \leq y \leq T \ 1 & y > T \end{cases} ) | L: Lower limitT: Target (theoretical max)r: Shape parameter |
| Minimize | ( d = \begin{cases} 1 & y < T \ \left(\frac{U-y}{U-T}\right)^r & T \leq y \leq U \ 0 & y > U \end{cases} ) | T: Target (theoretical min)U: Upper limitr: Shape parameter |
| Target | ( d = \begin{cases} 0 & y < L \ \left(\frac{y-L}{T-L}\right)^{r1} & L \leq y \leq T \ \left(\frac{U-y}{U-T}\right)^{r2} & T \leq y \leq U \ 0 & y > U \end{cases} ) | L: Lower limitT: Target valueU: Upper limitr₁, r₂: Shape parameters |
Table 2: Experimental Results for Dynamic Range Extension via Receptor Blending Data adapted from a study using structure-switching molecular beacons [65].
| Receptor Blend Composition | Affinity Difference | Achieved Dynamic Range | Signal Gain | Linearity (R²) |
|---|---|---|---|---|
| Single Molecular Beacon | - | 81-fold | Varies by variant | N/A |
| 59% 1GC / 41% 3GC | 100-fold | 8,100-fold | 9-fold | 0.995 |
| Optimized mix of 4 variants (0GC, 2GC, 3GC, 5GC) | >10,000-fold | ~900,000-fold | 3.6-fold | 0.995 |
The Scientist's Toolkit: Research Reagent Solutions
Table 3: Essential Materials for Biosensor Optimization Experiments
| Item | Function in Optimization | Example Use Case |
|---|---|---|
| Gold Nanoparticles (AuNPs) | Signal amplification; enhance electron transfer in electrochemical biosensors; carrier for aptamer probes [67]. | Modifying glassy carbon electrodes to improve conductivity and lower the limit of detection [67]. |
| Carbon Nanomaterials | Matrix support with high surface area; improve conductivity and bioreceptor immobilization [67]. | Using reduced graphene oxide (rGO) nanocomposites to create a highly reproducible sensor platform for bacterial detection [67]. |
| Nucleases & Enzymes | Enable signal amplification via catalytic target recycling [67]. | Used in nucleic acid-based biosensors to cleave probes and release targets for repeated binding cycles, amplifying the signal. |
| Receptor Variants | Rationally edit the dynamic range and sensitivity of a biosensor [65]. | Mixing molecular beacons with different stem stabilities to create a blend with an extended log-linear dynamic range. |
| Desirability Function Software | Statistically solve multi-response optimization problems by calculating an overall desirability index (D) [63] [64]. | Implemented in software like Minitab Response Optimizer and Stat-Ease to find factor settings that balance multiple, competing response goals. |
FAQs
1. What is ANOVA and when should I use it in my biosensor research?
ANOVA (Analysis of Variance) is a statistical test used to determine if there are statistically significant differences between the means of three or more groups [69] [70]. In biosensor research, you should use it when you want to compare the effects of different experimental factors on your results. For example, you could use a one-way ANOVA to determine if different bioreceptor immobilization methods (e.g., cross-linking, entrapment, physical adsorption, covalent bonding) lead to significantly different signal amplification outcomes [71]. Unlike t-tests which only compare two groups, ANOVA allows you to compare multiple groups simultaneously, preventing the increased error rate that comes with running multiple t-tests [69] [72].
2. What are the core assumptions that must be met for a valid ANOVA test?
ANOVA relies on three main assumptions that must be checked before interpreting results:
- Normality: The data within each experimental group should be approximately normally distributed [69] [73].
- Homogeneity of Variances: The variance within each group should be similar across all groups (homoscedasticity) [69] [70].
- Independence of Observations: The data points must be independent of each other; subjects in one group cannot also be in another group, and measurements should not influence each other [69] [72]. For repeated measurements on the same subjects, a Repeated Measures ANOVA should be used instead [73].
3. My ANOVA result is significant. What does this actually tell me?
A significant ANOVA result (typically p < 0.05) indicates that at least one group mean is statistically significantly different from the others [69] [73]. However, ANOVA is an "omnibus test" and does not specify which specific groups differ [72] [73]. For example, in testing multiple signal amplification strategies (e.g., silver staining, gold enhancement, enzymatic amplification), a significant ANOVA would tell you that not all strategies perform equally, but you would need post hoc tests to identify which specific strategies outperform others [37].
4. What should I do if my data violates the assumption of equal variances?
If your biosensor data shows unequal variances between groups, several alternatives are available:
- Welch's F-test ANOVA: This modification of ANOVA does not assume equal variances and is recommended when group sample sizes differ or homogeneity of variance is violated [72].
- Games-Howell pairwise test: This post hoc test can be used without the assumption of equal variances and is appropriate for identifying which specific groups differ [72].
- Data transformation: Applying transformations (e.g., log transform) to your response variable may help stabilize variances across groups.
5. How can ANOVA be applied to optimize biosensor signal amplification?
ANOVA can systematically evaluate multiple factors affecting biosensor performance. For instance, you could use a two-way ANOVA to simultaneously investigate the effects of nanoprobe type (gold, silver, silica, iron oxide) and enhancement protocol (with/without signal amplification) on detection sensitivity [37]. This would allow you to identify not only the main effects of each factor but also any interaction effects - such as whether certain nanoprobe types respond better to specific enhancement methods [72] [73]. This approach efficiently identifies statistically significant factor effects, guiding optimal biosensor design.
Troubleshooting Guides
Problem 1: Inconclusive or Confusing ANOVA Results
Symptoms:
- Significant ANOVA result but unclear which groups differ
- Uncertainty about how to proceed after obtaining F-statistic and p-value
Solution:
- Perform Post Hoc Testing: After a significant ANOVA result, apply post hoc tests to identify exactly which group means differ significantly [74] [73].
- Select Appropriate Post Hoc Test:
- For equal variances: Use Tukey's HSD (Honestly Significant Difference)
- For unequal variances: Use Games-Howell test [72]
- Interpret Results in Context: For biosensor applications, focus on both statistical significance and practical significance of differences in signal amplification.
Table: Common Post Hoc Tests and Their Applications
| Test Name | When to Use | Key Consideration |
|---|---|---|
| Tukey's HSD | Equal variances assumed; compares all possible pairs | Controls family-wise error rate |
| Bonferroni | Conservative approach for multiple comparisons | Reduces risk of Type I error |
| Scheffe's Procedure | Complex comparisons beyond pairwise | Most conservative post hoc test |
| Games-Howell | Unequal variances present | Does not assume homogeneity |
Problem 2: Violation of ANOVA Assumptions
Symptoms:
- Non-normal distribution of residuals
- Unequal variances between groups
- Dependent observations in experimental design
Solution:
- Test Assumptions Before ANOVA:
- Check normality using Shapiro-Wilk test or normal Q-Q plots
- Verify homogeneity of variances using Levene's test [74]
- Apply Corrective Measures:
- Document All Steps: Record assumption checks and any transformations applied for methodological transparency.
Problem 3: Designing Experiments for ANOVA in Biosensor Research
Symptoms:
- Uncertainty about sample size requirements
- Unclear how to structure experimental groups
- Difficulty identifying appropriate factors and levels
Solution:
- Implement Key Design Principles:
- Ensure equal sample sizes in each group when possible [69]
- Clearly define factors (independent variables) and levels relevant to biosensor optimization
- Include appropriate controls (e.g., negative controls, baseline signals)
- Plan for Sufficient Sample Size:
- Conduct power analysis before experimentation
- Include replication to account for experimental variability
- Structure Experimental Groups:
Table: ANOVA Experimental Design for Biosensor Signal Enhancement
| ANOVA Type | Experimental Factors | Levels Example | Biosensor Application |
|---|---|---|---|
| One-Way | Signal enhancement method | Silver staining, gold enhancement, enzymatic | Compare different signal amplification strategies [37] |
| Two-Way | Nanoprobe type + Buffer pH | Gold/Silica/Iron oxide + pH5/pH7/pH9 | Optimize multiple parameters simultaneously |
| Factorial | Multiple factors simultaneously | Various combinations | Comprehensive optimization of complex systems |
Experimental Protocols
Protocol 1: One-Way ANOVA for Comparing Signal Amplification Methods
Objective: To determine if different signal amplification methods produce statistically significant differences in biosensor detection sensitivity.
Materials:
- Functionalized biosensors with immobilized bioreceptors
- Target analyte at fixed concentration
- Signal amplification reagents (e.g., silver enhancement solution, gold enhancement solution, enzymatic amplification kit)
- Detection instrument (e.g., spectrophotometer, electrochemical workstation)
Methodology:
- Prepare Experimental Groups:
- Standardize Conditions:
- Use identical biosensor platforms across all groups
- Apply same target analyte concentration
- Maintain consistent temperature and incubation times
- Replicate Measurements:
- Include minimum of 5-6 replicates per group [69]
- Randomize processing order to avoid batch effects
- Data Collection:
- Measure signal intensity for each biosensor
- Record background noise for signal-to-noise calculation
- Statistical Analysis:
- Check assumptions of normality and homogeneity of variances
- Perform one-way ANOVA with signal intensity as dependent variable
- If significant (p < 0.05), conduct Tukey's HSD post hoc test
- Report F-statistic, degrees of freedom, p-value, and effect size
Protocol 2: Two-Way ANOVA for Multi-Factor Biosensor Optimization
Objective: To evaluate the individual and interactive effects of nanoprobe type and enhancement duration on biosensor signal output.
Materials:
- DNA-functionalized piezoelectric cantilever biosensors [75]
- miRNA let-7a target analyte [75]
- Different nanoprobes (gold, silver, silica, iron oxide) [37]
- Enhancement solutions (MES buffer, HAuCl₄·3H₂O, H₂O₂) [37]
- Frequency response measurement apparatus [75]
Methodology:
- Experimental Design:
- Factor A: Nanoprobe type (4 levels: AuNPs, AgNPs, SiNPs, IONPs)
- Factor B: Enhancement duration (3 levels: 2min, 5min, 10min)
- Full factorial design: 4 × 3 = 12 experimental conditions
- Biosensor Functionalization:
- Immobilize appropriate bioreceptors on sensor surface
- Apply consistent binding protocol across all conditions
- Signal Enhancement Application:
- Apply designated nanoprobe type to each biosensor
- Implement enhancement protocol for specified duration [37]
- Data Collection:
- Measure normalized dynamic biosensor response (θ(t)) [75]
- Calculate signal-to-noise ratio for each condition
- Record resonant frequency changes where applicable
- Statistical Analysis:
- Perform two-way ANOVA with signal amplification as dependent variable
- Evaluate main effects of nanoprobe type and enhancement duration
- Test for interaction effect between factors
- Use theory-guided feature engineering where appropriate [75]
The Scientist's Toolkit: Research Reagent Solutions
Table: Essential Materials for ANOVA-Guided Biosensor Optimization
| Reagent/Material | Function | Application Example |
|---|---|---|
| Gold Nanoparticles (AuNPs) | Signal amplification nanoprobe | Enhanced visual detection in microarray assays [37] |
| Silver Enhancement Solution | Signal amplification through metallic deposition | Improves detection limits in colorimetric biosensors [37] |
| MES Buffer | Controlled environment for enhancement reactions | Maintains optimal pH for gold enhancement protocols [37] |
| Hydrogen Peroxide (H₂O₂) | Reducing agent in enhancement solutions | Facilitates Au(III) to Au(0) reduction in signal amplification [37] |
| Chloroauric Acid (HAuCl₄) | Gold ion source for enhancement | Deposits Au(0) onto existing nanoprobes [37] |
| Functionalized Biosensors | Platform for assay development | DNA-functionalized cantilevers for miRNA detection [75] |
| Theory-Guided Feature Engineering | Improved data analysis | Enhances classification models for dynamic biosensor response [75] |
Common Mistakes and How to Avoid Them
Mistake 1: Using Multiple t-tests Instead of ANOVA
- Error: Conducting repeated t-tests to compare multiple groups, increasing Type I error rate
- Correction: Use ANOVA for comparing three or more groups, then apply post hoc tests only if ANOVA is significant [74]
Mistake 2: Ignoring Assumption Checks
- Error: Proceeding with ANOVA without verifying normality and homogeneity of variances
- Correction: Always test assumptions first using Levene's test (variances) and Shapiro-Wilk (normality) [74]
Mistake 3: Misinterpreting Significant ANOVA Results
- Error: Assuming significant ANOVA indicates all groups differ from each other
- Correction: Remember that significant ANOVA only indicates at least one difference exists; use post hoc tests to identify specific differences [73]
Mistake 4: Inadequate Sample Size and Replication
- Error: Using insufficient replicates per experimental group
- Correction: Include adequate replication (typically n=5-6 minimum) and conduct power analysis during experimental design [69]
Benchmarking and Validating DoE-Optimized Biosensor Performance
Correlating Impedance Changes with Gold-Standard ELISA Measurements
This technical support center provides a framework for researchers troubleshooting experiments that correlate electrochemical impedance spectroscopy (EIS) data with gold-standard ELISA measurements. This correlation is fundamental for the development and validation of novel biosensors within a Design of Experiments (DoE) context, where understanding the relationship between impedance signals and conventional protein quantification is crucial for optimizing signal amplification strategies [76] [77].
Electrochemical Impedance Spectroscopy (EIS) is a powerful, label-free technique that measures electrical impedance changes at an electrode surface upon biomolecular binding, such as an antigen-antibody interaction. The key parameter, charge transfer resistance (Rct), typically increases as target analytes bind to the sensor surface, providing a quantitative measure of concentration [76].
Enzyme-Linked Immunosorbent Assay (ELISA) is the established standard for protein quantification. It relies on enzyme-mediated colorimetric, fluorescent, or chemiluminescent signals for detection, providing a highly sensitive and specific reference method against which new EIS biosensors must be validated [78] [79].
The following workflow outlines the general process for conducting a correlation study:
Troubleshooting Common Correlation Issues
FAQ 1: My EIS signal shows a clear response, but it does not correlate with the ELISA absorbance data. What could be wrong?
A mismatch between EIS and ELISA signals often originates from fundamental differences in what each technique measures.
- Potential Cause 1: Differing Epitope Recognition. In a sandwich ELISA, the capture and detection antibodies must bind to distinct, non-overlapping epitopes. If they compete for the same epitope, the ELISA signal will be weak or absent, while the EIS signal, which may rely on a different capture antibody, could still detect binding [79].
- Solution: Verify that your ELISA antibody pair is a validated "matched pair" guaranteed to recognize different epitopes. If possible, use the same capture antibody for both the EIS sensor and the ELISA plate to ensure consistency.
- Potential Cause 2: Matrix Effects on the EIS Sensor. The EIS measurement can be highly sensitive to non-specific binding (NSB) from complex sample matrices (e.g., serum, blood), which may not interfere with the washed ELISA. This NSB can cause a large, non-specific Rct shift that obscures the specific signal [76].
- Solution: Optimize the blocking and washing steps for your EIS sensor. Use effective blocking agents like BSA, casein, or synthetic blockers. Incorporate control sensors (lacking the capture probe) to measure and subtract the non-specific background [76] [79].
FAQ 2: I am observing high variability between replicate measurements in my EIS data, making correlation unreliable. How can I improve reproducibility?
Poor reproducibility undermines the statistical power of your correlation study.
- Potential Cause 1: Inconsistent Sensor Surface Preparation. The foundation of a reliable EIS biosensor is a uniformly and stably modified electrode surface. Inconsistent immobilization of biorecognition elements (e.g., antibodies, aptamers) leads to variable active site density and thus variable signals [77].
- Solution: Standardize your immobilization protocol (e.g., covalent binding via gold-thiol chemistry, photochemical immobilization). Use a quality control method like chronocoulometry to quantify and ensure consistent probe surface density across all sensor batches [77].
- Potential Cause 2: Inconsistent Electrode Conditioning or Washing. Manual washing protocols can introduce significant well-to-well variation. Bubbles formed during measurement can also disrupt the impedance signal.
- Solution: Implement an automated plate washer for EIS cell washing to ensure consistency in wash volume, soak time, and aspiration. Centrifuge your EIS plate or sensor cartridge briefly before measurement to remove any bubbles [78] [79].
FAQ 3: The sensitivity (LOD) of my EIS biosensor is significantly worse than my ELISA. How can I enhance the EIS signal amplification?
Enhancing the limit of detection is a primary goal of DoE for biosensors.
- Potential Cause: Inherently Low Sensitivity of Label-Free EIS. The native ΔRct/decade for a direct, label-free EIS measurement can be low, limiting its sensitivity compared to the enzyme-amplified signal of an ELISA [76].
- Solution: Integrate Signal Amplification Strategies.
- Use Nanomaterials: Modify the electrode surface with gold nanoparticles (AuNPs), graphene, or carbon nanotubes. These materials increase the active surface area and enhance electron transfer, significantly boosting the Rct change upon binding [76] [77].
- Employ Enzyme-Labels: Develop an enzyme-linked EIS assay. After target capture, introduce an enzyme-conjugated secondary antibody (e.g., HRP-labeled). The enzymatic reaction product (e.g., an insoluble precipitate) deposited on the electrode surface creates a large, amplified change in impedance [80].
- Utilize Redox Mediators: Incorporate a solution-phase redox couple like [Fe(CN)₆]³⁻/⁴⁻. Binding of the target analyte inhibits the diffusion of these mediators to the electrode surface, leading to a large, measurable increase in Rct [76].
Detailed Experimental Protocols
Protocol 1: Standardized Workflow for EIS-ELISA Correlation
This protocol provides a step-by-step guide for generating paired data.
1. Experimental Design (DoE Phase):
- Prepare a dilution series of the target analyte in the relevant biological matrix (e.g., PBS, spiked serum).
- Include a blank (matrix only) and a negative control (non-target analyte).
- Randomize the order of sample analysis to avoid systematic bias.
2. Parallel Sample Processing:
- EIS Measurement: a. Sensor Preparation: Immobilize the capture antibody on a gold electrode via a standard protocol (e.g., 11-MUA SAM, EDC/NHS chemistry). b. Blocking: Incubate with 1% BSA for 1 hour to block non-specific sites. c. Sample Incubation: Apply 50-100 µL of each standard/sample to the sensor and incubate for 30-60 minutes. d. Washing: Wash 3x with PBS + 0.05% Tween-20. e. EIS Measurement: Perform EIS in a solution containing 5mM [Fe(CN)₆]³⁻/⁴⁻. Apply a DC potential near the formal potential of the mediator with a 10 mV AC amplitude, scanning frequencies from 0.1 Hz to 100 kHz. Record the Nyquist plot and extract Rct values.
- ELISA Measurement: a. Plate Coating: Coat a high-binding ELISA plate with the same capture antibody overnight at 4°C. b. Blocking: Block with 1% BSA for 2 hours. c. Sample & Detection: Apply the same standard/sample series. Follow with a biotinylated detection antibody and then an enzyme-linked streptavidin (e.g., HRP-Streptavidin). d. Development & Readout: Develop with TMB substrate for 15 minutes, stop with acid, and read the absorbance at 450 nm [78] [79].
3. Data Analysis:
- Plot the EIS response (ΔRct) vs. analyte concentration and the ELISA response (OD450) vs. concentration.
- Perform a linear regression analysis on the linear range of both curves.
- Calculate the correlation coefficient (e.g., Pearson's r) between the ΔRct values and the OD450 values across the sample series.
Protocol 2: EIS Sensor Surface Optimization for DoE
A robust sensor surface is critical. This protocol outlines a DoE-friendly optimization.
Objective: Systematically vary immobilization parameters to maximize specific Rct change and minimize non-specific binding.
Factors and Levels:
| Factor | Level 1 | Level 2 | Level 3 |
|---|---|---|---|
| Antibody Immobilization Time | 30 min | 60 min | O/N at 4°C |
| Antibody Concentration (µg/mL) | 10 | 50 | 100 |
| Blocking Agent | 1% BSA | 1% Casein | 5% Non-fat Milk |
Procedure:
- Fabricate multiple, identical electrode arrays.
- Follow the immobilization and blocking steps according to the DoE matrix.
- Challenge all sensors with a single, medium concentration of the target analyte and a blank.
- Measure the ΔRct (Sample - Blank) for each condition.
- The optimal condition is the one that yields the highest Signal-to-Noise Ratio (SNR = Mean ΔRctsample / Standard Deviation of ΔRctblank).
Data Presentation and Analysis
Table 1: Representative Correlation Data from a Model Assay
This table shows idealized data for the detection of a target protein, demonstrating a strong correlation between the two methods.
| Analyte Concentration (pM) | Mean ELISA OD450 (n=3) | SD (ELISA) | Mean EIS ΔRct (Ω) (n=3) | SD (EIS) |
|---|---|---|---|---|
| 0 (Blank) | 0.05 | 0.01 | 15 | 5 |
| 10 | 0.18 | 0.02 | 125 | 15 |
| 50 | 0.45 | 0.03 | 450 | 25 |
| 100 | 0.85 | 0.04 | 1050 | 50 |
| 500 | 1.50 | 0.08 | 3200 | 150 |
Calculated Correlation (Pearson's r) for dataset: r = 0.998
Table 2: Key Research Reagent Solutions
This table lists essential materials and their functions in EIS biosensor development and correlation studies.
| Reagent / Material | Function / Explanation |
|---|---|
| Gold Electrodes | Standard transducer surface due to its excellent conductivity and facile functionalization via thiol chemistry [77]. |
| Redox Mediators (e.g., [Fe(CN)₆]³⁻/⁴⁻) | A reversible couple used in Faradaic EIS to probe the electron transfer resistance at the electrode interface. Binding events hinder its access, increasing Rct [76]. |
| Thiol Linkers (e.g., 11-MUA) | Forms a self-assembled monolayer (SAM) on gold, providing carboxylic acid groups for subsequent covalent antibody immobilization [77]. |
| Gold Nanoparticles (AuNPs) | Nanomaterial used to modify the electrode surface, increasing its effective area and enhancing the impedance signal upon binding [76] [77]. |
| Validated Antibody Pair | A matched set of capture and detection antibodies confirmed to bind to distinct epitopes on the target analyte, crucial for both sandwich ELISA and specific EIS detection [79]. |
Advanced Troubleshooting Guide
The following decision tree can help diagnose persistent correlation problems:
Troubleshooting Guides & FAQs
Signal Strength & Amplification
Q: My biosensor produces a weak fluorescence signal in patient samples, leading to poor detection. What could be the cause?
- A: A weak signal often stems from suboptimal genetic part combinations or environmental context mismatches. The biosensor's performance is highly dependent on the promoter and RBS strength driving the transcription factor (TF) expression [57]. Furthermore, the medium and carbon sources in your sample can significantly impact the biosensor's dynamic response [57]. We recommend testing different combinations of promoters and RBSs from the characterized library (see Table 1) and ensuring the experimental medium is appropriate.
Q: How can I increase the signal-to-noise ratio of my biosensor during validation?
- A: To enhance the signal-to-noise ratio, consider using a promoter-RBS combination that offers a high dynamic range rather than just a high maximum output [57]. Our DBTL pipeline has identified that constructs with promoter P3 consistently exhibit higher fluorescence outputs across various conditions [57]. Additionally, supplements like sodium acetate (S2) have been shown to produce higher normalized fluorescence compared to glucose (S0) [57].
Context-Dependent Performance
Q: My biosensor works perfectly in buffer but fails in a complex patient sample matrix. Why?
- A: This is a classic issue of context dependence. The biosensor's behavior is crucially affected by the environmental context, including the growth medium and available metabolites [57]. The same genetic construct can show significantly different performance across different media (e.g., M9 vs. SOB) and with different carbon sources (e.g., glucose vs. glycerol) [57]. It is essential to characterize and, if necessary, re-optimize the biosensor's performance directly in the target patient sample matrix or a close mimic.
Q: What is the best way to account for patient sample variability in my assay?
- A: Implementing a Design of Experiments (DoE) approach is the most robust method. Instead of testing one variable at a time, a D-optimal experimental design allows you to systematically explore interactions between multiple factors, such as media, supplements, and genetic parts [57]. This helps build a predictive model to determine the optimal condition combinations that make your biosensor robust to expected sample variability [57].
Dynamic Range & Calibration
- Q: The dynamic range of my biosensor is too narrow for the expected analyte concentrations in patient samples. How can I tune it?
- A: The dynamic range can be engineered by modifying the regulatory elements of the biosensor construct [57]. Specifically, tuning the promoter strength and the RBS controlling the expression of the TF can shift the operational range of the biosensor [57]. Refer to the library in Table 1 to select a construct with a lower detection threshold or a wider operational window for your application.
General Functionality
- Q: I assembled a biosensor construct from the library, but it shows no fluorescence. What should I check?
- A: First, verify the assembly of both the TF module and the reporter module. Some high-strength combinations of promoters and RBSs may fail to assemble due to compatibility issues [57]. Ensure your construct is among the successfully assembled ones listed in the library. Second, confirm the presence of the target ligand (e.g., naringenin) at a concentration within the biosensor's detectable range (a reference concentration of 400 μM was used for naringenin) [57].
Quantitative Data from Biosensor Characterization
The following tables summarize key experimental data from the characterization of a library of FdeR-based naringenin biosensors, which can guide troubleshooting and optimization [57].
Table 1: Biosensor Library Performance under Standard Conditions (M9, 0.4% Glucose, 400 μM Naringenin) [57]
| Construct Name | Promoter | RBS | Relative Fluorescence Output (after 7h) |
|---|---|---|---|
| P1-R4 | P1 | R4 | High |
| P3-R1 | P3 | R1 | High |
| P3-R3 | P3 | R3 | High |
| P4-R1 | P4 | R1 | Low |
| P4-R2 | P4 | R2 | Low |
Table 2: Effect of Environmental Context on Reference Construct Fluorescence [57]
| Medium | Supplement (Carbon Source) | Normalized Fluorescence |
|---|---|---|
| M9 (M0) | S1 (Glycerol) | High |
| M9 (M0) | S2 (Sodium Acetate) | Highest |
| M9 (M0) | S0 (Glucose) | Low |
| SOB (M2) | S0 (Glucose) | Medium-High |
Experimental Protocols
Protocol 1: Characterizing Biosensor Dynamic Response
Purpose: To measure the fluorescence output of a biosensor construct over time in response to a target analyte [57].
- Culture Preparation: Inoculate a colony of E. coli harboring the biosensor construct into a suitable medium (e.g., M9). Grow overnight.
- Dilution and Induction: Dilute the overnight culture and allow it to grow to mid-log phase.
- Induction: Add the target analyte (e.g., naringenin) to a pre-determined reference concentration (e.g., 400 μM). Use a negative control without the analyte [57].
- Monitoring: Transfer the culture to a microplate reader or spectrophotometer.
- Data Collection: Measure the optical density (OD600) and fluorescence (e.g., Ex/Em for GFP) at regular intervals (e.g., every 30 minutes) for at least 7 hours [57].
- Analysis: Normalize the fluorescence readings to the cell density (e.g., Fluorescence/OD600) to calculate normalized fluorescence [57].
Protocol 2: Testing Context Dependence Using a DoE Approach
Purpose: To systematically evaluate the effect of different environmental conditions on biosensor performance [57].
- Factor Selection: Identify factors to test (e.g., Media: M9, SOB; Supplements: Glucose, Glycerol, Acetate).
- Experimental Design: Use a D-optimal design of experiments (DoE) to select the most informative set of condition combinations (e.g., 32 initial experiments) [57].
- Parallel Culturing: Inoculate the reference biosensor construct into the different media and supplement combinations as per the DoE matrix.
- Signal Measurement: Add the analyte and measure the normalized fluorescence as described in Protocol 1.
- Data Modeling: Use the collected data to build a predictive model (e.g., a biology-guided machine learning model) that describes the biosensor's dynamic response across the tested contexts [57].
Biosensor Optimization Workflow
The diagram below outlines the DBTL (Design-Build-Test-Learn) pipeline for optimizing biosensor performance for clinical validation, integrating the DoE methodology.
The Scientist's Toolkit: Research Reagent Solutions
Table 3: Essential Materials for Biosensor Development and Validation
| Item | Function / Explanation |
|---|---|
| FdeR Transcription Factor | The allosteric TF that acts as the core sensing element, activating gene expression in the presence of naringenin [57]. |
| Promoter Library (e.g., P1, P3, P4) | A collection of DNA parts of varying strengths to control the expression level of the TF, tuning the biosensor's sensitivity and dynamic range [57]. |
| RBS Library (e.g., R1, R3, R4) | A collection of ribosome binding sites to fine-tune the translational efficiency, further optimizing TF expression and biosensor performance [57]. |
| Reporter Gene (e.g., GFP) | Encodes a fluorescent protein (Green Fluorescent Protein) whose output is measured to quantify the biosensor's response to the target analyte [57]. |
| Naringenin | The target ligand (analyte) used in this study to activate the FdeR biosensor; serves as a model for clinical validation with patient samples [57]. |
| Varied Culture Media (M9, SOB) | Different growth media are used to test and model the context-dependence of the biosensor, ensuring robustness in complex environments like patient samples [57]. |
| Carbon Source Supplements (Glucose, Glycerol, Acetate) | Different supplements alter the metabolic context of the cell, which can significantly impact the biosensor's RNA/protein production rates and overall output signal [57]. |
Quantitative Performance Comparison
The table below summarizes key performance metrics from published studies that directly compare biosensors optimized via Design of Experiments (DoE) against those developed using the One-Variable-at-a-Time (OVAT) approach.
Table 1: Performance Metrics of DoE-Optimized vs. OVAT-Optimized Biosensors
| Biosensor Type & Target Analyte | Optimization Method | Key Performance Metrics | Reference |
|---|---|---|---|
| RNA Integrity Biosensor (mRNA cap) | DoE (Definitive Screening Design) | • 4.1-fold increase in dynamic range• Reduced RNA requirement by one-third• Maintained cap discrimination at lower concentrations | [29] |
| Conventional (OVAT) | • Lower dynamic range• Higher sample consumption | ||
| Electrochemical Biosensor (miRNA-29c) | DoE (D-optimal design) | • 5-fold improvement in Limit of Detection (LOD)• Higher sensitivity and repeatability• 30 experiments performed | [35] |
| Conventional (OVAT) | • Higher LOD• Lower sensitivity• 486 experiments required for comparable scope | ||
| Whole-Cell Biosensor (Protocatechuic Acid) | DoE (Definitive Screening Design) | • >500-fold improvement in dynamic range• Up to 30-fold increase in maximum signal output• Sensitivity improved by >1500-fold | [62] |
| Conventional (Iterative) | • Modest dynamic range and signal output |
Experimental Protocols for Biosensor Optimization
Protocol for DoE-Based Optimization
This protocol is adapted from studies that successfully employed Definitive Screening Design (DSD) to enhance biosensor performance [29] [62].
Step 1: Factor Identification and Experimental Design
- Identify critical factors influencing biosensor performance (e.g., reagent concentrations, incubation time, temperature, pH).
- Select an appropriate DoE model. A Definitive Screening Design (DSD) is suitable for efficiently exploring 5-12 factors with a minimal number of experimental runs [29].
- Define the high and low levels for each factor based on prior knowledge or preliminary experiments.
Step 2: Execution and Data Collection
- Execute the experiments as dictated by the designed matrix. For example, a DSD for 8 factors may require as few as 17 experimental runs [29].
- Measure the response variables for each run (e.g., dynamic range, signal intensity, LOD).
Step 3: Statistical Analysis and Model Building
- Analyze the data using statistical software to fit a regression model.
- Identify significant factors and their interaction effects. The model will predict the optimal combination of factors to maximize the desired response.
Step 4: Validation
- Experimentally validate the model's predictions by testing the biosensor under the identified optimal conditions.
- Confirm the performance improvements against the original, non-optimized biosensor.
Protocol for Conventional (OVAT) Optimization
Step 1: Baseline Establishment
- Establish a baseline assay using standard or literature-based conditions.
Step 2: Sequential Parameter Variation
- Select one parameter (e.g., concentration of Reporter Protein) and vary it across a range of values.
- Keep all other parameters constant at their baseline levels.
Step 3: Identification of Sub-Optimum
- Identify the value for the first parameter that gives the best result.
- Set this parameter to its new "optimal" value and proceed to vary the next parameter (e.g., concentration of poly-dT oligonucleotide).
Step 4: Iteration
- Repeat steps 2 and 3 for all parameters deemed important.
- This process is repeated until no further significant improvement in performance is observed.
Troubleshooting Guide: DoE-optimized vs. Conventional Assays
Table 2: Common Experimental Issues and Solutions
| Problem | Possible Cause (Conventional Assay) | Recommended Solution (DoE Framework) |
|---|---|---|
| Low Signal-to-Noise Ratio | Suboptimal concentration of a key reagent due to missed interactive effects. | Use the DoE model to identify factor settings that simultaneously maximize signal and minimize noise. Interaction effects are explicitly modeled in DoE [35] [23]. |
| Poor Reproducibility | The "optimum" found via OVAT is unstable due to unaccounted-for factor interactions. | The DoE model defines a robust operational window. Confirm reproducibility by running replicates at the DoE-predicted optimum [62]. |
| High Non-Specific Binding | Inefficient blocking or suboptimal buffer conditions identified in isolation. | Include blocking agent concentration, detergent type, and ionic strength as factors in the DoE to systematically find conditions that minimize non-specific binding [30]. |
| Assay works in development but fails in validation | The OVAT approach may find a local optimum that is not robust to small variations in sample matrix or reagent batches. | Use the DoE model to understand the influence of each factor. The "response surface" can be used to find a region where performance is robust to small variations in critical factors [23]. |
Frequently Asked Questions (FAQs)
Q1: When should I use DoE instead of a conventional OVAT approach for my biosensor development? A: DoE is particularly advantageous when:
- You suspect interactions between factors (e.g., the optimal concentration of one reagent depends on the concentration of another).
- The number of potential factors is large, and testing all combinations via OVAT is resource-prohibitive [35] [23].
- You need to find a robust and reproducible optimum quickly and efficiently.
Q2: My biosensor is based on a complex biological system (e.g., whole cells). Can DoE still be applied? A: Yes. DoE has been successfully applied to optimize whole-cell biosensors. Studies have systematically modified genetic parts like promoters and Ribosome Binding Sites (RBSs) to dramatically enhance dynamic range, sensitivity, and signal output [57] [62]. The key is to treat the expression levels of regulatory components as continuous factors for the DoE model.
Q3: What is the most significant drawback of the OVAT method? A: The primary limitation is its inability to detect interactions between factors. OVAT risks finding a local, sub-optimal point because it does not explore the multi-dimensional experimental space comprehensively. This can lead to poorer performance and a process that is not robust [35] [23].
Q4: How does DoE achieve performance improvements with fewer experiments? A: DoE uses statistically designed matrices that vary all factors simultaneously in a structured way. This allows for the efficient extraction of maximum information from a minimal number of experiments, revealing the global optimum and interaction effects that OVAT would miss [35] [23]. For instance, one study optimized six variables with only 30 DoE experiments, which would have required 486 OVAT experiments [35].
Essential Research Reagent Solutions
Table 3: Key Reagents for Biosensor Development and Optimization
| Reagent / Material | Function in Biosensor Assays | Example from Literature |
|---|---|---|
| Allosteric Transcription Factors (aTFs) | Serves as the biological recognition element; undergoes conformational change upon analyte binding to regulate reporter gene expression. | PcaV protein used in whole-cell biosensors for protocatechuic acid [62]. FdeR used in naringenin biosensors [57]. |
| Reporter Proteins (e.g., GFP, β-lactamase) | Generates a measurable signal (e.g., fluorescence, colorimetric change) correlated with analyte concentration. | β-lactamase fusion protein (B4E) for colorimetric RNA cap detection [29]. GFP for quantifying gene expression in whole-cell biosensors [57] [62]. |
| Functionalized Beads (e.g., Streptavidin) | Used in heterogeneous assays to immobilize capture probes (e.g., biotinylated poly-dT oligonucleotides) for separation and signal amplification. | Dynabeads MyOne Streptavidin T1 used to capture polyA tails of RNA [29]. |
| Specialized Membranes (e.g., Nitrocellulose) | The solid support in lateral flow and other paper-based biosensors; controls capillary flow and houses the capture lines. | Critical component in lateral flow immunoassays (LFAs); selection of membrane type, porosity, and treatment is vital for performance [30]. |
Workflow and Signaling Pathway Visualizations
Diagram 1: Biosensor Optimization Workflow
Diagram 2: Allosteric Transcription Factor Biosensor Mechanism
Frequently Asked Questions (FAQs) and Troubleshooting Guides
Challenges in Complex Matrices
FAQ 1: What are the most common causes of non-specific binding in serum and food samples, and how can they be mitigated? Non-specific binding (NSB) occurs when molecules other than the target analyte interact with the biosensor surface, leading to false-positive signals or inflated responses. In complex matrices like serum and food, this is often caused by matrix proteins, lipids, or other interfering compounds.
- Mitigation Strategies:
- Surface Blocking: Use blocking agents like Bovine Serum Albumin (BSA), casein, or ethanolamine to occupy any remaining active sites on the sensor chip post-immobilization [81] [82].
- Buffer Optimization: Supplement running buffers with additives. Surfactants like Tween-20 can minimize hydrophobic interactions, while dextran or polyethylene glycol (PEG) can sterically hinder non-specific interactions [81]. Using a matched buffer (e.g., buffer spiked with blank matrix) for both calibration and samples is crucial [82].
- Surface Chemistry Selection: Choose sensor chips with chemistries that minimize NSB. For instance, CM5 chips with carboxymethylated dextran or C1 chips with minimal modification can be selected based on the analyte [82].
- Reference Surface: Use a well-chosen reference channel immobilized with a non-binding compound (e.g., an irrelevant antibody or BSA) to subtract background signals arising from NSB [81].
FAQ 2: Why does my biosensor exhibit signal suppression or low recovery when analyzing food samples? Signal suppression, or a lower-than-expected signal for a given analyte concentration, often results from the matrix effect. In food samples, components like fats, polyphenols, or complex carbohydrates can foul the sensor surface, sterically block the target, or inhibit the biorecognition element itself.
- Troubleshooting Guide:
- Sample Pre-treatment: Implement simple dilution, filtration, or centrifugation steps to remove particulate matter and reduce the complexity of the sample matrix [83].
- Surface Regeneration: Develop a robust regeneration protocol to remove strongly adsorbed matrix components between analysis cycles. Solutions like 10 mM glycine (pH 2.0), 10 mM NaOH, or 2 M NaCl can be tested. Adding 10% glycerol can help maintain target stability during regeneration [81].
- Enhanced Biorecognition: Use robust biorecognition elements like aptamers, which offer high stability and affinity, and are less prone to denaturation in complex environments compared to some antibodies [83].
FAQ 3: How can I improve the reproducibility and stability of my biosensor in urine assays? Poor reproducibility can stem from sensor surface fouling, inconsistent immobilization of biorecognition elements, or baseline drift.
- Optimization Tips:
- Standardized Immobilization: Ensure consistent ligand density and orientation across all sensor surfaces. Pre-condition the sensor chip with several buffer cycles to stabilize the surface before immobilization [82].
- Control Baseline Drift: Baseline drift is often a sign of a poorly equilibrated sensor surface. Ensure the flow buffer and analyte buffer are perfectly matched. It may be necessary to run the flow buffer overnight or use several buffer injections before the experiment to minimize drift [84].
- Monitor Environmental Factors: Perform experiments in a controlled environment, as temperature fluctuations can impact interaction signals and reproducibility [82].
Signal Amplification and Sensitivity
FAQ 4: My biosensor lacks the sensitivity for detecting low-abundance targets in serum. What amplification strategies can I employ? Enhancing sensitivity is critical for detecting low-concentration analytes.
- Signal Amplification Strategies:
- Nanomaterials: Integrate nanomaterials (e.g., carbon nanotubes, graphene, metal nanoparticles) into the electrode or sensing interface. They provide high surface area, excellent conductivity, and can be functionalized to enhance signal transduction [55].
- Enzymatic Labeling: While this guide focuses on label-free detection, some advanced strategies use enzyme labels (e.g., horseradish peroxidase) in sandwich assays to catalytically generate an electroactive product, leading to significant signal amplification [55].
- Nucleic Acid Amplification: Techniques like polymerase chain reaction (PCR) can be coupled with biosensors to pre-amplify the target DNA or RNA, thereby lowering the detection limit significantly [55].
FAQ 5: The impedance biosensor shows a low ΔRct/decade sensitivity. How can this be optimized? A low change in charge-transfer resistance (ΔRct) per concentration decade is a common challenge in Electrochemical Impedance Spectroscopy (EIS)-based biosensors [85].
- Optimization Pathways:
- Nanomaterial Integration: The use of conductive or redox-active nanomaterials can dramatically enhance the change in electron-transfer resistance upon binding, improving the sensitivity of the readout [55] [85].
- Probe Immobilization Density: Optimize the surface density of the capture probe (e.g., antibody, aptamer). A too-dense layer can cause steric hindrance, while a too-sparse layer may yield a weak signal. Statistical modeling like Design of Experiments (DoE) is ideal for finding this balance [23].
- Faradaic vs. Non-Faradaic Modes: Explore using a redox probe (e.g., [Fe(CN)₆]³⁻/⁴⁻) in a Faradaic EIS mode, which often provides a more pronounced and quantifiable ΔRct compared to non-Faradaic (capacitive) measurements [85].
Summarized Experimental Data
Table 1: Biosensor Performance Across Different Complex Matrices
Table summarizing key performance metrics from cited literature for different sample types.
| Target Analyte | Sample Matrix | Biosensor Type | Limit of Detection (LOD) | Key Challenge Reported | Mitigation Strategy Employed |
|---|---|---|---|---|---|
| Pathogens [85] | Blood, Saliva | EIS-based | Not Specified | Non-specific binding, Matrix effects | Surface immobilization optimization, Nanomaterial integration |
| Pathogens [85] | Food, Environmental water | EIS-based | Not Specified | Matrix effects, Specificity | Integration with microfluidics, Use of specific biorecognition elements |
| Food Contaminants (Pesticides, Allergens) [83] | Food | Electrochemical / Optical | Varies by contaminant | Complexity of food matrix | Use of aptamers, Sample pre-treatment (dilution, filtration) |
| Volatile Organic Compounds (VOCs) [55] | Air / Food Headspace | Bioelectronic Nose (B-EN) | Not Specified | Similar structured chemicals | Use of specific olfactory receptors (ORs), Nanomaterial signal amplification |
Table 2: Common Troubleshooting Symptoms and Solutions
A quick-reference guide for diagnosing and addressing common experimental issues.
| Symptom | Potential Cause | Recommended Solution |
|---|---|---|
| High Background / Non-specific Binding [81] [82] | Matrix interferents, Inadequate blocking | Optimize buffer with surfactants (Tween-20), use blocking agents (BSA, casein), select appropriate reference surface. |
| Low Signal Intensity [82] | Low ligand density, Weak binding, Mass transport limitations | Increase ligand immobilization density, use high-sensitivity chips, optimize analyte concentration and flow rate. |
| Poor Reproducibility [82] | Inconsistent surface immobilization, Environmental fluctuations | Standardize immobilization protocol, use control samples, precondition sensor chips, control lab temperature. |
| Baseline Drift [84] | Un-equilibrated sensor surface, Buffer mismatch | Match flow and analyte buffers exactly, run extended buffer equilibration, use buffer injections before analyte. |
| Negative Binding Signal [81] | Buffer mismatch, Volume exclusion | Test analyte over a reference surface (e.g., BSA-coated), ensure buffer compatibility between sample and running buffer. |
Detailed Experimental Protocols
Protocol for Optimizing a Biosensor Assay using Design of Experiments (DoE)
Objective: To systematically optimize key parameters (e.g., probe density, incubation time, buffer pH) for an electrochemical biosensor assay to maximize signal-to-noise ratio in serum samples.
Principles: DoE is a model-based chemometric tool that is more efficient than "one-variable-at-a-time" approaches as it evaluates multiple variables and their interactions simultaneously [23].
Methodology:
- Factor Identification: Select the independent variables (factors) to be optimized (e.g., pH (X1), Immobilization Time (X2), and Blocking Agent Concentration (X3)).
- Define Experimental Domain: Set the high (+1) and low (-1) levels for each factor based on preliminary knowledge.
- Choose Experimental Design: A 2³ full factorial design is suitable for a first-order model with three factors. This requires 8 experiments (2³) [23].
- Construct Experimental Matrix: The matrix defines the conditions for each experimental run.
- Execution and Modeling: Perform all 8 experiments in a randomized order and record the signal-to-noise ratio. Use linear regression to fit a model and identify significant factors and interactions.
- Validation: Perform a confirmation experiment at the predicted optimal conditions to validate the model [23].
Protocol for Minimizing Non-Specific Binding in Food Samples for an SPR Biosensor
Objective: To establish a robust assay for detecting a food contaminant in a complex food homogenate with minimal non-specific binding on the SPR sensor chip.
Methodology:
- Surface Selection and Ligand Immobilization:
- Select a suitable sensor chip (e.g., CM5 for covalent coupling).
- Immobilize the specific capture antibody (ligand) onto the sensor surface using standard amine-coupling chemistry (EDC/NHS) [82].
- Critical Step: Aim for an optimal ligand density. Too high density can cause steric hindrance, while too low leads to weak signals.
- Surface Blocking:
- After immobilization, inject a solution of a blocking agent (e.g., 1 M ethanolamine) to deactivate and block any remaining activated ester groups on the surface [82].
- Buffer Optimization:
- Prepare the running buffer supplemented with additives to reduce NSB. A common starting point is HBS-EP buffer (0.01 M HEPES, 0.15 M NaCl, 3 mM EDTA, 0.005% v/v Surfactant P20) [81] [82].
- For particularly challenging matrices, adding a non-ionic detergent like Tween-20 (0.05-0.1%) or BSA (0.1-1%) can be highly effective.
- Sample Preparation:
- Dilute the food sample extract in the optimized running buffer. Centrifuge or filter the sample to remove any particulates that could clog the microfluidic system [83].
- Reference Surface Subtraction:
- Always use a reference flow cell on the sensor chip, which has been immobilized with an irrelevant protein or just the blocking agent. The signal from the reference cell is subtracted in real-time from the active cell signal, correcting for bulk refractive index shifts and non-specific binding to the chip surface [81].
Visualized Workflows and Signaling Pathways
DoE-Based Biosensor Optimization Workflow
EIS Biosensor Signal Transduction Pathway
The Scientist's Toolkit: Research Reagent Solutions
Table 3: Essential Reagents for Biosensor Assay Development in Complex Matrices
| Reagent / Material | Function | Example Use Case |
|---|---|---|
| Blocking Agents (BSA, Casein, Ethanolamine) | Reduces non-specific binding by saturating unoccupied sites on the sensor surface. | Blocking a CM5 chip surface after antibody immobilization for assays in serum [81] [82]. |
| Surfactants (Tween-20, Triton X-100) | Minimizes hydrophobic interactions between matrix components and the sensor surface. | Adding 0.005-0.05% Tween-20 to running buffer for analyzing fatty food extracts [81] [82]. |
| Aptamers | Single-stranded DNA/RNA oligonucleotides used as synthetic biorecognition elements; offer high stability and affinity. | Detecting heavy metals or small molecule contaminants in food samples [83]. |
| Conductive Nanomaterials (Carbon Nanotubes, Graphene Oxide, Gold NPs) | Enhances electrochemical signal transduction by increasing surface area and electron transfer kinetics. | Modifying a working electrode to lower the detection limit of a pathogen in saliva [55] [85]. |
| Regeneration Solutions (Low pH, High Salt, Surfactants) | Removes bound analyte from the immobilized probe without damaging it, allowing for sensor surface reuse. | Using 10 mM Glycine pH 2.0 to regenerate an antibody-coated surface between analyte injections [81]. |
| Microfluidic Chips & Systems | Enables precise fluid handling, sample delivery, and integration of multiple assay steps (e.g., mixing, separation). | Developing a compact, automated point-of-care device for pathogen detection in blood or water [85]. |
Frequently Asked Questions (FAQs)
Q1: What is the difference between Limit of Detection (LoD) and Limit of Quantification (LoQ)?
The Limit of Detection (LoD) is the lowest concentration of an analyte that can be reliably distinguished from a blank sample, but not necessarily quantified with precision. In contrast, the Limit of Quantification (LoQ) is the lowest concentration that can be measured with acceptable accuracy and precision for quantitative analysis [86] [87] [88].
- Formulas based on the calibration curve (per ICH Q2(R1)):
- LoD = 3.3σ / S
- LoQ = 10σ / S Where 'σ' is the standard deviation of the response (e.g., standard error from regression) and 'S' is the slope of the calibration curve [88].
- Alternative Definitions: LoD can also be defined as the concentration where the signal-to-noise ratio (S/N) is greater than 3, while LoQ is defined as S/N > 10 [86].
Q2: How can I improve the robustness and reliability of my biosensor assay?
A powerful strategy to enhance assay robustness is to adopt a ratiometric detection method. This approach uses an internal reference signal (e.g., a second redox probe) to correct for variations that affect the primary measurement signal [89].
- Mechanism: External factors like temperature fluctuations, sample matrix effects, electrode surface area variations, or instrument drift will affect both the primary signal and the internal reference signal similarly. By calculating the ratio of the two signals, these variations cancel out, leading to more accurate and reliable concentration measurements [89].
- Example: A ratiometric electrochemical DNA sensor using ferrocene (Fc) and methylene blue (MB) as dual labels demonstrated a significantly higher correlation coefficient (0.997) compared to a single-label "switch-off" approach (0.958), confirming improved reliability [89].
Q3: What is the distinction between biosensor 'Specificity' and 'Selectivity'?
These terms are often used interchangeably but have distinct meanings in biosensor evaluation [86] [90].
- Specificity refers to the ability of a biosensor to detect a single, exact analyte in a mixture, without responding to any other substances. An ideal specific sensor is like a perfectly matched "key and lock" [86] [90].
- Selectivity describes the ability of a biosensor to differentiate between multiple different analytes in a mixture. Selective sensors can respond to a class of related compounds but can tell them apart, often using an array of sensing elements that generate a unique fingerprint for each analyte [86] [90].
Q4: My biosensor signal drifts over time. How can I troubleshoot this?
Signal drift describes an unstable output signal even when all conditions are fixed. Troubleshooting involves identifying potential sources of this instability [86] [89].
- Check the Biosensor Platform: Many biological and chemical sensors have inherent drift. For example, pH electrodes are known to drift and require frequent calibration [86].
- Evaluate Assay Conditions: Factors like temperature, humidity, and sample volume can cause signal disparities. Using a ratiometric method with an internal standard can correct for this type of drift [89].
- Assess Transducer Stability: Ensure that the signal transducer (e.g., the electrode surface in an electrochemical sensor) is stable and not degrading or becoming fouled during the experiment.
Q5: How is 'Sensitivity' defined for a biosensor?
Biosensor sensitivity is defined as the change in the output signal per unit change in the analyte concentration [86]. It is a measure of how responsive the sensor is to small variations in concentration.
- Calculation: For a linear calibration curve, sensitivity is the slope of the curve. For example, a glucose sensor with a sensitivity of 67 nA/mM will generate 67 nanoamperes of current for every 1 millimolar increase in glucose concentration [86].
Key Metrics Reference Tables
Table 1: Key Performance Metrics for Biosensors
| Metric | Definition | Typical Calculation | Interpretation |
|---|---|---|---|
| Limit of Detection (LoD) | The lowest analyte concentration that can be reliably distinguished from a blank [87] [88]. | 3.3σ/S (ICH) or S/N > 3 [86] [88]. | The analyte is detectable, but concentration cannot be precisely quantified. |
| Limit of Quantification (LoQ) | The lowest analyte concentration that can be quantified with acceptable accuracy and precision [87] [88]. | 10σ/S (ICH) or S/N > 10 [86] [88]. | The concentration can be reliably measured and reported. |
| Sensitivity | The change in sensor signal per unit change in analyte concentration [86]. | Slope of the calibration curve (e.g., nA/mM) [86]. | A higher slope indicates a more responsive biosensor. |
| Specificity | The ability to assess an exact, single analyte in a mixture [86] [90]. | Demonstrated by lack of response to non-target analytes. | Ideal for detecting a specific biomarker when the target is well-defined. |
| Selectivity | The ability to differentiate between multiple different analytes in a mixture [86] [90]. | Use of cross-reactive sensor arrays and pattern recognition [90]. | Ideal for complex samples or when targeting a class of analytes. |
| Analytical Range | The interval between the upper and lower concentrations where the sensor is precise [86]. | From LoQ/LoD to the upper limit of linearity. | The working range of the biosensor. |
| Response Time (T90) | The time for the sensor output to reach 90% of its new signal after a concentration change [86]. | Measured directly from real-time response data. | Critical for real-time or rapid monitoring applications. |
Table 2: Comparison of Biorecognition Elements
| Biorecognition Element | Target Examples | Key Advantages | Key Limitations |
|---|---|---|---|
| Antibodies [91] | Proteins, Viruses, Whole Cells [91] | High specificity and affinity; well-established immobilization methods [91]. | Animal production can be costly/time-consuming; can denature [91] [90]. |
| Aptamers [91] | Metal Ions, Small Molecules, Proteins [91] | Synthetic (can be tailored via SELEX); generally stable; reusability [91]. | SELEX discovery process can be costly and time-consuming [91]. |
| Enzymes [91] | Substrates, Inhibitors, Cofactors [91] | Catalytic signal amplification; high specificity for substrates [91]. | Activity dependent on environmental conditions (pH, T); limited target scope [91]. |
| Nucleic Acids (Genosensors) [91] | Complementary DNA/RNA sequences [91] | High predictability and specificity for nucleic acid targets [91]. | Limited to nucleic acid detection; single-stranded probes can be flexible [91]. |
| Molecularly Imprinted Polymers (MIPs) [91] | Wide variety of templates [91] | High stability; synthetic and tunable; no need for biological discovery [91]. | Challenges with homogeneity and reproducibility of polymer binding sites [91]. |
Experimental Protocols
Protocol 1: Determining LoD and LoQ Using a Calibration Curve
This protocol follows the ICH Q2(R1) guidelines for determining LoD and LoQ based on the standard deviation of the response and the slope of the calibration curve [88].
- Preparation of Calibration Standards: Prepare a minimum of five standard solutions with concentrations spanning the expected low end of the biosensor's working range, including a blank (zero concentration) [87].
- Measurement: Analyze each standard solution with multiple replicate measurements (e.g., n=3-5) in random order to account for experimental noise.
- Data Analysis:
- Perform a linear regression analysis on the mean response (y) versus concentration (C) data. The regression will provide the slope (S) and the standard error (SE) of the regression, which is used as the estimate for σ [88].
- Calculate the LoD and LoQ using the formulas:
- LoD = 3.3 × SE / S
- LoQ = 10 × SE / S
- Experimental Validation: The calculated LoD and LoQ values must be validated experimentally. Prepare and analyze a suitable number of samples (e.g., n=6) at the LoD and LoQ concentrations. The LoD samples should yield a detectable signal (e.g., S/N ≥ 3), and the LoQ samples should demonstrate acceptable precision (e.g., ±15% RSD) and accuracy [88].
Protocol 2: Assessing Specificity and Selectivity
- Sample Preparation:
- Prepare a solution containing the target analyte at a concentration near the mid-point of your calibration curve.
- Prepare separate solutions of potential interfering substances that are likely to be present in the sample matrix. These should be at the upper end of their physiologically or environmentally relevant concentration.
- Measurement:
- Measure the response of the biosensor to the target analyte solution.
- Measure the response to each individual interfering substance solution.
- (For selectivity assessment) Measure the response to a mixture of the target and the interfering substances.
- Data Analysis:
- Specificity: A highly specific biosensor will show no significant response to the solutions containing only interfering substances. The signal should be indistinguishable from the blank.
- Selectivity: The response to the mixture of target and interferents should be comparable to the response of the target alone, indicating that the interferents do not cross-react or affect the measurement.
Signaling Pathways and Workflows
Diagram 1: Biosensor evaluation workflow.
Diagram 2: Specificity vs. selectivity.
The Scientist's Toolkit: Research Reagent Solutions
Table 3: Essential Reagents for Biosensor Development and Evaluation
| Reagent / Material | Function / Application | Key Considerations |
|---|---|---|
| Biorecognition Elements (e.g., Antibodies, Aptamers, Enzymes) [91] | Provide analyte specificity; the core of the biosensor. | Choose based on required specificity, stability, and availability for your target analyte [91]. |
| Redox Probes (e.g., Ferrocene, Methylene Blue) [89] | Act as labels in electrochemical biosensors; enable ratiometric detection. | Select probes with distinct, well-separated redox potentials to avoid signal overlap [89]. |
| Calibration Standards | Used to construct the calibration curve for determining LoD, LoQ, and sensitivity. | Prepare in a matrix that mimics the real sample to account for matrix effects. |
| Interferent Compounds | Used to test the specificity and selectivity of the biosensor. | Include structurally similar compounds and those common in the intended sample matrix. |
| Immobilization Reagents (e.g., crosslinkers, SAMs) | Used to attach the biorecognition element to the transducer surface. | Choice affects orientation, activity, and stability of the immobilized element. |
| Buffer Components | Maintain a stable pH and ionic strength for the biological elements. | Optimize composition and pH to maximize binding activity and sensor stability. |
Conclusion
The integration of a structured Design of Experiments framework is transformative for biosensor development, systematically enhancing signal amplification to achieve unprecedented sensitivity and reliability. By moving beyond traditional optimization methods, DoE efficiently unravels the complex interactions between nanomaterial properties, biochemical components, and operational parameters. This approach has been successfully validated against established techniques like ELISA, proving its power in creating robust biosensors for clinical and biomedical applications. Future directions will leverage these optimized platforms for point-of-care diagnostics, continuous monitoring of chronic diseases, and high-throughput drug screening, ultimately accelerating the translation of biosensor technology from the laboratory to real-world impact.
References
- 1. 5.2 Biosensors and Transducers - Biomedical Engineering I [https://fiveable.me/biomedical-engineering-i/unit-5/biosensors-transducers/study-guide/fGrpzz9Y3xwZxmEh]
- 2. Biosensors—Recent Advances and Future Challenges [https://pmc.ncbi.nlm.nih.gov/articles/PMC7699460/]
- 3. Introduction to biosensors - PMC [https://pmc.ncbi.nlm.nih.gov/articles/PMC4986445/]
- 4. Troubleshooting Stelo Glucose Biosensor | Stelo by Dexcom [https://www.stelo.com/en-us/support/faqs/troubleshooting?srsltid=AfmBOoq8S0ejC-510ZL5MWLhTzu_qOsR3Xg_igjWNF8dFDS90ppJOK_I]
- 5. Why doesn't my Stelo match my blood glucose meter? [https://www.stelo.com/en-us/faqs/troubleshooting/what-should-i-do-if-my-glucose-readings-seem-inaccurate?srsltid=AfmBOooE49bNxO25Ie1ASo2QltXLUlBCDuDZ3qMzmQj0i2kgNJ2QVSg9]
- 6. Technical Support [https://support.hellolingo.com/hc/en-us/categories/9920442144919-Technical-Support]
- 7. Resources - Biosensors Laboratory [https://home.iitm.ac.in/vvrsai/biomedical/sai/IITM_BS_Resources.html]
- 8. Algorithm assisted comprehensive optimization of SPR ... [https://www.sciencedirect.com/science/article/abs/pii/S0956566325007225]
- 9. New method developed to dramatically enhance ... [https://www.sciencedaily.com/releases/2025/02/250226125012.htm]
- 10. DoE Without Errors - 5 Steps to Reliable Experiment ... [https://www.automotivequal.com/doe-without-errors-5-steps-to-reliable-experiment-results/]
- 11. Recent Progress in DNA Biosensors: Target-Specific and ... [https://pmc.ncbi.nlm.nih.gov/articles/PMC12384124/]
- 12. A Closer Look at Biosensors: A Practical Tutorial for ... [https://www.spectroscopyonline.com/view/a-closer-look-at-biosensors-a-practical-tutorial-for-spectroscopists]
- 13. Advanced SPR biosensor with optimized gold-TiO2 D ... [https://www.nature.com/articles/s41598-025-24697-y]
- 14. Design optimization of high-sensitivity PCF-SPR biosensor ... [https://journals.plos.org/plosone/article?id=10.1371/journal.pone.0330944]
- 15. Biosensors, Volume 15, Issue 9 (September 2025) [https://www.mdpi.com/2079-6374/15/9]
- 16. Signal Amplification-Based Biosensors and Application in ... [https://www.mdpi.com/1424-8220/23/9/4237]
- 17. Perspectives on systematic optimization of ultrasensitive ... [https://pmc.ncbi.nlm.nih.gov/articles/PMC11403992/]
- 18. Advances and challenges in biosensor-based diagnosis of ... [https://pmc.ncbi.nlm.nih.gov/articles/PMC4104499/]
- 19. Nanomaterials for molecular signal amplification in ... [https://pubs.rsc.org/en/content/articlehtml/2020/me/c9me00135b]
- 20. Response Surface Methodology for the Optimisation of ... [https://www.mdpi.com/2079-6374/9/1/26]
- 21. How to Troubleshoot pH Biosensor Problems in 6 Steps [https://www.linkedin.com/advice/1/what-do-you-your-ph-biosensors-working-properly-zkpkf]
- 22. XNAs: A Troubleshooter for Nucleic Acid Sensing - PMC [https://pmc.ncbi.nlm.nih.gov/articles/PMC9096816/]
- 23. Perspectives on systematic optimization of ultrasensitive ... [https://pubs.rsc.org/en/content/articlehtml/2024/tc/d4tc02131b]
- 24. Perspectives on systematic optimization of ultrasensitive ... [https://pubmed.ncbi.nlm.nih.gov/39295842/]
- 25. An electrochemical biosensor utilizing CRISPR/Cas12a ... [https://pubs.rsc.org/en/content/articlelanding/2025/an/d4an01441c]
- 26. Challenges and Opportunities in Smart Biosensing for ... [https://pmc.ncbi.nlm.nih.gov/articles/PMC12455640/]
- 27. Detection limit matters. Sensitivity not really [https://www.biolinscientific.com/blog/qcm-sensitivity-vs-limit-of-detection-lod?update_2025=1]
- 28. Design of electrochemical aptameric biosensor for the ... [https://www.nature.com/articles/s41598-025-16913-6]
- 29. Enhancing the performance of an in vitro RNA biosensor ... [https://pmc.ncbi.nlm.nih.gov/articles/PMC12348311/]
- 30. Review Biosensors and lateral flow immunoassays [https://www.sciencedirect.com/science/article/abs/pii/S0009898125001512]
- 31. Webinars (Intermediate) [https://www.statease.com/webinars/category/intermediate/]
- 32. Design-Expert [https://www.statease.com/software/design-expert/]
- 33. Nanomaterials-based biosensor and their applications [https://www.sciencedirect.com/science/article/pii/S2405844023071372]
- 34. Nanomaterial-Assisted Signal Enhancement of ... [https://pmc.ncbi.nlm.nih.gov/articles/PMC3290467/]
- 35. Chemometrics-Assisted Enhancement of Electrochemical ... [https://pmc.ncbi.nlm.nih.gov/articles/PMC12019774/]
- 36. Signal amplification strategies in electrochemical ... [https://pubs.rsc.org/en/content/articlelanding/2022/ma/d2ma00427e]
- 37. Rapid signal enhancement method for nanoprobe-based ... [https://www.nature.com/articles/s41598-017-07030-0]
- 38. Real-time PCR probe optimization using design of ... [https://pmc.ncbi.nlm.nih.gov/articles/PMC4827641/]
- 39. Real-time PCR probe optimization using design of ... [https://www.sciencedirect.com/science/article/pii/S2214753515300139]
- 40. PCR Troubleshooting Guide | Thermo Fisher Scientific - US [https://www.thermofisher.com/us/en/home/life-science/cloning/cloning-learning-center/invitrogen-school-of-molecular-biology/pcr-education/pcr-reagents-enzymes/pcr-troubleshooting.html]
- 41. PCR Troubleshooting Guide [https://www.neb.com/en-us/tools-and-resources/troubleshooting-guides/pcr-troubleshooting-guide?srsltid=AfmBOorLsf6VT3OMMn4OsckYdWuSJkc8hpWXAPRyLJ45Wo8VZaSw-4B9]
- 42. LSPR Biosensor Signal Enhancement Using Nanoparticle- ... [https://pmc.ncbi.nlm.nih.gov/articles/PMC3109750/]
- 43. Mycotoxin Detection through Colorimetric Immunoprobing ... [https://www.mdpi.com/2079-6374/14/10/491]
- 44. Gold nanomaterials for optical biosensing and bioimaging [https://pubs.rsc.org/en/content/articlehtml/2021/na/d0na00961j]
- 45. DNA origami signal amplification in lateral flow ... [https://www.nature.com/articles/s41467-025-57385-6]
- 46. Peptide self-assembly-engineered signal amplification ... [https://www.sciopen.com/article/10.26599/NR.2025.94907541]
- 47. Click Chemistry-Mediated Nanosensors for Biochemical ... [https://www.thno.org/v06p0969.htm]
- 48. A step by step example of a full factorial design [https://experimentaldesignhub.com/blog/doe_06]
- 49. Screening DOE: Efficient Factorial Designs for Identifying ... [https://www.6sigma.us/six-sigma-in-focus/screening-doe/]
- 50. Screening designs - Minitab - Support [https://support.minitab.com/en-us/minitab/help-and-how-to/statistical-modeling/doe/supporting-topics/factorial-and-screening-designs/screening-designs/]
- 51. New method developed to dramatically enhance bioelectronic ... [https://news.rice.edu/news/2025/new-method-developed-dramatically-enhance-bioelectronic-sensors]
- 52. Biosensors: Design, Development and Applications [https://www.intechopen.com/chapters/76543]
- 53. Best Practices For Implementing Design Of Experiments ... [https://enertherm-engineering.com/best-practices-for-implementing-design-of-experiments-doe-in-industrial-settings/]
- 54. Biosensor signal amplification | Nanobiotechnology Class ... [https://fiveable.me/nanobiotechnology/unit-3/biosensor-signal-amplification/study-guide/6i9aXGTcfTfbvY0P]
- 55. Electrochemical Signal Amplification Strategies and Their ... [https://pmc.ncbi.nlm.nih.gov/articles/PMC9394270/]
- 56. Recent Advances in Signal Amplification to Improve ... [https://www.frontiersin.org/journals/chemistry/articles/10.3389/fchem.2022.911678/full]
- 57. Context-Aware Biosensor Design Through Biology-Guided ... [https://pmc.ncbi.nlm.nih.gov/articles/PMC12186671/]
- 58. LMP 91000 trouble shooting for biosensor readers [https://www.zimmerpeacocktech.com/knowledge-base/faq/lmp91000-trouble-shooting/]
- 59. Smart biosensors with self-healing materials - RSC Publishing [https://pubs.rsc.org/en/content/articlehtml/2025/tb/d5tb01139f]
- 60. Next-generation nanomaterials-based biosensors: Real- ... [https://www.sciencedirect.com/science/article/pii/S2589234724004044]
- 61. Advancing protein biosensors: redefining detection through ... [https://pubs.rsc.org/en/content/articlehtml/2025/ra/d4ra06791f]
- 62. Development of High-Performance Whole Cell Biosensors ... [https://pmc.ncbi.nlm.nih.gov/articles/PMC7146887/]
- 63. 11.1 - Multiple Responses | STAT 503 [https://online.stat.psu.edu/stat503/lesson/11/11.1]
- 64. Unraveling the Mystery of Multi-Response Optimization [https://www.statease.com/blog/unraveling-the-mystery-of-multi-response-optimization/]
- 65. Engineering biosensors with extended, narrowed, or ... [https://pmc.ncbi.nlm.nih.gov/articles/PMC3522460/]
- 66. Experimental design and multiple response optimization. ... [https://www.sciencedirect.com/science/article/abs/pii/S0039914014000459]
- 67. Research Progress on Aptamer Electrochemical ... [https://pmc.ncbi.nlm.nih.gov/articles/PMC12300297/]
- 68. 5. Multiple Response Surface Design and Analysis [https://www.theopeneducator.com/doe/Response-Surface-Methodology/Design-and-Analyze-Multiple-Response-Surface]
- 69. ANOVA Test Statistics: Analysis of Variance [https://www.simplypsychology.org/anova.html]
- 70. Analysis of variance [https://en.wikipedia.org/wiki/Analysis_of_variance]
- 71. Current Developments in Biosensor Applications and ... [https://www.intechopen.com/chapters/1210649]
- 72. What is ANOVA (Analysis Of Variance) Testing? [https://www.qualtrics.com/articles/strategy-research/anova/]
- 73. Analysis of Variance [https://www.openanesthesia.org/keywords/analysis-of-variance/]
- 74. Two Common Mistakes in Applying ANOVA Test [https://papers.ssrn.com/sol3/papers.cfm?abstract_id=4221619]
- 75. Reduction of Biosensor False Responses and Time Delay ... [https://pmc.ncbi.nlm.nih.gov/articles/PMC10683760/]
- 76. Electrochemical Impedance Spectroscopy-Based Biosensors ... [https://pmc.ncbi.nlm.nih.gov/articles/PMC12293632/]
- 77. Point-of-care biosensors for infectious disease diagnosis [https://pubs.rsc.org/en/content/articlehtml/2025/ra/d5ra03897a?page=search]
- 78. ELISA Troubleshooting Guide is Here!_AntibodySystem [https://www.antibodysystem.com/archive/469.html]
- 79. ELISA Troubleshooting Guide [https://www.bio-techne.com/resources/protocols-troubleshooting/elisa-troubleshooting]
- 80. State-of-the-art signal amplification strategies for nucleic ... [https://www.sciencedirect.com/science/article/pii/S2666053924000845]
- 81. Surface Plasmon Resonance Troubleshooting - SPR ... [https://bitesizebio.com/31665/spr-instrument-troubleshooting-surface-plasmon-resonance-assay-technology/]
- 82. Troubleshooting and Optimization Tips for SPR Experiments [https://www.creative-proteomics.com/resource/troubleshooting-optimization-tips-for-spr-experiments.htm]
- 83. Biosensors for Detecting Food Contaminants—An Overview [https://www.mdpi.com/2227-9717/13/2/380]
- 84. Troubleshooting [https://www.sprpages.nl/troubleshooting]
- 85. Electrochemical Impedance Spectroscopy-Based ... [https://www.mdpi.com/2079-6374/15/7/443]
- 86. Biosensors Metrics Glossary of Definitions - Zimmer & Peacock [https://www.zimmerpeacocktech.com/knowledge-base/faq/biosensors-glossary/]
- 87. On the Determination of Uncertainty and Limit of Detection in ... [https://pmc.ncbi.nlm.nih.gov/articles/PMC6068557/]
- 88. Determining LOD and LOQ Based on the Calibration Curve [https://www.sepscience.com/hplc-solutions-126-chromatographic-measurements-part-5-determining-lod-and-loq-based-on-the-calibration-curve-6959]
- 89. Ratiometric Electrochemistry: Improving the Robustness ... [https://pmc.ncbi.nlm.nih.gov/articles/PMC8068091/]
- 90. Selectivity and Specificity: Pros and Cons in Sensing - PMC [https://pmc.ncbi.nlm.nih.gov/articles/PMC6173322/]
- 91. Guide to Selecting a Biorecognition Element for Biosensors [https://pmc.ncbi.nlm.nih.gov/articles/PMC6416154/]