Overcoming Diffusion Barriers: Strategies to Enhance Mass Transfer and Activity in Immobilized Enzyme Systems
This article provides a comprehensive analysis of diffusion limitations in entrapped enzyme systems, a critical challenge in biocatalysis and drug delivery.
Overcoming Diffusion Barriers: Strategies to Enhance Mass Transfer and Activity in Immobilized Enzyme Systems
Abstract
This article provides a comprehensive analysis of diffusion limitations in entrapped enzyme systems, a critical challenge in biocatalysis and drug delivery. We first explore the foundational principles of mass transfer resistance, examining how microenvironments and partitioning effects reduce apparent enzyme activity. We then detail modern methodological approaches, including material engineering and reaction design, to mitigate these limitations. A dedicated troubleshooting section addresses common experimental pitfalls and optimization techniques. Finally, we present validation frameworks and comparative analyses of different immobilization strategies, offering researchers a roadmap to develop efficient, high-performance biocatalytic systems for biomedical and industrial applications.
Understanding the Barrier: The Science of Diffusion Limitations in Enzyme Entrapment
Diffusion limitations refer to the physical constraints on the transport of substrates and products to and from an immobilized enzyme within a porous support matrix. In entrapped enzymes research, these limitations matter profoundly because they directly reduce the observed catalytic efficiency, alter kinetic parameters, and can lead to inaccurate conclusions about enzyme performance. This creates a major hurdle in developing effective biocatalysts for industrial and pharmaceutical applications.
Troubleshooting Guides & FAQs
Q1: Why is my entrapped enzyme's activity significantly lower than the free enzyme in solution, even though it should be stable? A: This is the primary symptom of diffusion limitation. Substrates must diffuse through the support's pores to reach the enzyme, and products must diffuse out. This creates concentration gradients. The observed reaction rate is often controlled by this slow diffusion, not the enzyme's intrinsic kinetics.
- Troubleshooting Steps:
- Vary Substrate Concentration: Perform activity assays at a wide range of substrate concentrations. A shift in the apparent Michaelis constant (KM,app) to a higher value is a classic indicator of diffusion limitation.
- Vary Particle Size: If possible, test the same immobilization with different support particle sizes. A strong increase in observed activity with decreased particle size suggests severe internal diffusion limitations.
- Increase Agitation: Increase stirring speed in a batch reactor. If the observed rate increases, external mass transfer (film diffusion) is likely a contributing factor.
Q2: How can I experimentally determine if my system is diffusion-limited? A: Use the Weisz-Prater modulus (for internal diffusion) and the Damköhler number (for reaction vs. diffusion rate comparison).
- Experimental Protocol: The Weisz-Prater Criterion (Internal Diffusion)
- Measure the observed reaction rate per particle volume (robs).
- Measure the effective diffusivity (De) of the substrate in the porous particle, or estimate it using De = D * (ε / τ), where D is the bulk diffusivity, ε is porosity, and τ is tortuosity.
- Measure the substrate concentration at the particle surface (Cs) and the particle radius (R).
- Calculate: Φ = (robs * R²) / (De * Cs)
- Interpretation: If Φ << 1, no internal diffusion limitations. If Φ >> 1, severe limitations exist.
Q3: The pH-activity profile of my entrapped enzyme has shifted. Is this related to diffusion? A: Yes, this is a common and complex secondary effect. During reaction, protons are often consumed or produced. Their diffusion in and out of the particle can be slower than the reaction, creating a local pH microenvironment inside the particle that differs from the bulk solution.
- Troubleshooting Steps:
- Use a finer particle size to minimize internal pH gradients.
- Employ a buffer with high capacity and mobility within the pore network.
- Experimentally profile activity at different bulk pH levels and buffer concentrations to map the effect.
Table 1: Diagnostic Signatures of Diffusion Limitations in Entrapped Enzymes
| Parameter | No Limitation | With Diffusion Limitation | Experimental Test |
|---|---|---|---|
| Apparent KM | Equal to free enzyme KM | Significantly increased | Measure kinetics across [S] |
| Apparent Vmax | Equal to free enzyme Vmax | Decreased | Measure kinetics across [S] |
| Effectiveness Factor (η) | η ≈ 1 | η < 1 (can be <<1) | Compare observed vs. intrinsic rate |
| Particle Size Dependence | No effect | Rate increases with smaller size | Grind particles and re-assay |
| Agitation Dependence | No effect | Rate increases with agitation | Vary stir speed in batch reactor |
Table 2: Common Support Materials and Their Diffusive Properties
| Support Material | Typical Pore Size (nm) | Porosity (ε) | Tortuosity (τ) Range | Impact on Diffusion |
|---|---|---|---|---|
| Alginate Beads | 5 - 100 | 0.70 - 0.95 | 1.3 - 2.5 | High porosity aids diffusion, but large gel beads can cause severe limitations. |
| Polyacrylamide Gel | 1 - 10 | 0.85 - 0.95 | 1.5 - 3.0 | Small pores significantly hinder diffusion of large substrates. |
| Mesoporous Silica (e.g., SBA-15) | 5 - 15 | 0.60 - 0.80 | 1.5 - 2.2 | Ordered pores reduce tortuosity, but pore blockage is a risk. |
| Macroporous Polymers | 100 - 1000 | 0.50 - 0.80 | 1.1 - 1.8 | Large pores minimize internal diffusion; primary limit is film diffusion. |
Experimental Protocol: Determining the Effectiveness Factor (η)
Objective: Quantify the severity of internal diffusion limitation by comparing the observed activity of the immobilized enzyme to its intrinsic activity.
Materials: Immobilized enzyme particles, free enzyme solution, substrate solution, buffer, reactor vessel, spectrophotometer/analytical instrument.
Method:
- Intrinsic Rate Measurement:
- Homogenize a known mass of immobilized particles to completely destroy diffusion barriers (e.g., crush in a mortar with buffer).
- Use this slurry in a standard activity assay under well-mixed conditions. The measured rate (rintrinsic) is the maximum attainable.
- Observed Rate Measurement:
- Use the same mass of intact, original immobilized particles in an identical activity assay with vigorous agitation.
- Measure the observed reaction rate (robs).
- Calculation:
- Effectiveness Factor, η = robs / rintrinsic
- An η of 0.1 means diffusion reduces the observed activity to 10% of the enzyme's true capability.
Visualizations
Diagram 1: Concentration Gradients in a Diffusion-Limited System
Diagram 2: Troubleshooting Diffusion Limitation Workflow
The Scientist's Toolkit: Key Research Reagent Solutions
| Reagent/Material | Function & Rationale |
|---|---|
| Controlled-Pore Glass (CPG) or Silica Beads | Provides a well-defined, rigid pore structure for studying the pure effects of pore size on diffusivity and immobilization efficiency. |
| Fluorescently-Tagged Dextrans of Various Sizes | Used as diffusional probes to measure effective diffusivity (De) and pore accessibility within a hydrated support matrix via FRAP or other microscopy techniques. |
| Microreactors with Online Analytics (e.g., HPLC) | Allows precise measurement of reaction kinetics under controlled flow conditions, separating film and internal diffusion effects. |
| Spin Traps or pH-Sensitive Fluorophores | Embedded within particles to experimentally measure local microenvironmental conditions (e.g., ROS, pH) that differ from the bulk due to diffusion-reaction interactions. |
| Enzyme with a Colorimetric or Fluorometric Readout (e.g., HRP, Alkaline Phosphatase) | Enables easy visualization of substrate penetration and reaction zones within sliced particles, providing direct visual evidence of diffusion gradients. |
Troubleshooting Guide & FAQs
Q1: My entrapped enzyme system shows significantly lower activity than the free enzyme. How do I diagnose if this is due to external (film) or internal (pore) diffusion resistance?
A: Perform a Weisz modulus analysis combined with an effectiveness factor experiment.
- Vary Agitation Speed: Keep all other parameters constant (substrate concentration, temperature, particle size) and measure reaction rates at increasing agitation speeds. If the rate increases with speed, external film diffusion is likely limiting.
- Vary Particle Size: If changing agitation has no effect, systematically reduce the carrier/particle size (e.g., by grinding and sieving). If the observed rate increases with smaller particles, internal pore diffusion is the primary limitation.
Q2: When measuring kinetic parameters (Km, Vmax) for an entrapped enzyme, the apparent Km is much higher than for the free enzyme. What does this indicate and how can I confirm it?
A: An increased apparent Km is a classic signature of internal diffusion resistance. The substrate concentration gradient within the particle means the enzyme experiences a lower [S] than the bulk. To confirm:
- Protocol: Immobilize your enzyme on carriers of three different diameters (e.g., 100 µm, 500 µm, 1000 µm).
- Measure Michaelis-Menten kinetics for each.
- Result: If internal diffusion is significant, the apparent Km will increase with larger particle size, while Vmax may decrease. A constant Km across sizes suggests negligible internal resistance.
Q3: How can I experimentally determine the effectiveness factor (η) of my immobilized enzyme preparation?
A: The effectiveness factor (η) is the ratio of the observed reaction rate with immobilization to the rate with the free enzyme under identical bulk conditions.
- Direct Measurement Protocol:
- Conduct a reaction under standard conditions (pH, T, [S]) using a known amount of free enzyme. Measure the initial rate (rfree).
- Conduct the identical reaction using the same mass/activity unit of entrapped enzyme, ensuring perfect mixing to eliminate external film resistance (high agitation).
- Measure the initial rate (rimmob).
- Calculate: η = rimmob / rfree.
- Interpretation: An η < 1 indicates diffusion limitations. The closer η is to 1, the more efficient the mass transfer.
Q4: My system shows no agitation dependence, but reducing particle size is not feasible. What other strategies can reduce internal diffusion resistance?
A: Focus on modifying the internal microstructure of the carrier:
- Increase Porosity & Pore Diameter: Use a different immobilization matrix (e.g., switch from a dense alginate to a more porous chitosan or a synthetic polymer with larger macro-pores).
- Reduce Carrier Density: Create lighter, more hydrogel-like matrices to enhance substrate diffusivity.
- Functionalize the Pore Surface: To reduce non-specific binding of substrate that retards diffusion, consider coating pores with hydrophilic, neutral molecules (e.g., PEG derivatives).
Table 1: Diagnostic Tests for Diffusion Limitations
| Test | Parameter Varied | Observation Indicating External Limitation | Observation Indicating Internal Limitation |
|---|---|---|---|
| Agitation Study | Stirring Rate / Flow Velocity | Reaction rate increases significantly. | No change in reaction rate. |
| Particle Size Study | Carrier/Bead Diameter | No change in reaction rate. | Reaction rate increases with smaller size. |
| Kinetic Parameter Analysis | Apparent Km & Vmax | Little change from free enzyme values. | Apparent Km increases; Apparent Vmax may decrease. |
| Thiele Modulus (φ) Calculation | φ = L√(Vmax/(Km*Deff)) | φ << 1 (No limitation). | φ > 1 (Strong limitation). Effectiveness factor η < 1. |
Table 2: Common Immobilization Matrices & Their Diffusive Properties
| Matrix Material | Typical Pore Size Range | Relative Diffusivity (Substrate Dependent) | Susceptibility to Internal Resistance |
|---|---|---|---|
| Alginate (High G) | 5 - 100 nm | Low to Moderate | High |
| Polyacrylamide | 1 - 10 nm | Very Low | Very High |
| Silica Gel | 2 - 50 nm | Low to Moderate | High |
| Macroporous Acrylic Beads | 100 - 1000 nm | High | Low |
| Chitosan (Highly Porous) | 50 - 500 nm | Moderate to High | Moderate |
| Cellulose | 10 - 100 nm | Moderate | High |
Experimental Protocol: Determining the Weisz Modulus
Objective: To quantitatively distinguish between reaction control and internal diffusion control.
Materials: Immobilized enzyme beads, free enzyme, substrate solution, stirred reactor, spectrophotometer/analytical tool.
Method:
- Measure the observed rate of reaction (r_obs) for the entrapped enzyme under standard, well-mixed conditions.
- Determine the intrinsic kinetic parameters (Vmax, Km) using the free enzyme or very finely crushed immobilized particles under the same conditions.
- Characterize your bead: Measure the average radius (R) and estimate the effective diffusivity (D_eff) of the substrate within the bead, or obtain it from literature.
- Calculate the Weisz Modulus (Φ) using the formula: Φ = (robs * R²) / (Deff * [S]bulk) Where [S]bulk is the bulk substrate concentration.
- Interpretation:
- Φ << 1: No internal diffusion limitation (Kinetic control).
- Φ >> 1: Severe internal diffusion limitation.
Visualizing Diffusion & Reaction
The Scientist's Toolkit: Research Reagent Solutions
| Item | Function in Addressing Diffusion Resistance |
|---|---|
| Controlled-Pore Glass (CPG) or Silica | Provides a rigid, well-defined pore structure for studying the pure effects of pore size on internal diffusion. |
| Polyacrylamide/Albumin Glutaraldehyde Gel | Forms a dense, highly cross-linked network for creating severe internal resistance models. |
| Macroporous Polymeric Beads (e.g., Eupergit, Sepabeads) | Commercial carriers engineered with large pores to minimize internal diffusion limitations. |
| Fluorescently-Tagged Dextrans of Varying Sizes | Used as substrate analogs to probe and visualize pore accessibility and effective diffusivity. |
| Rotating Disk Reactor (RDR) | Experimental setup that perfectly controls fluid dynamics to eliminate external film resistance for pure internal diffusion studies. |
| Enzyme Activity Assay Kits (e.g., for Glucose Oxidase, HRP) | Standardized, sensitive assays to accurately measure intrinsic and observed reaction rates. |
| Dynamic Light Scattering (DLS) / BET Analyzer | Instruments to characterize particle size distribution and pore size/surface area of carriers. |
Troubleshooting Guides & FAQs
Q1: Why is my entrapped enzyme showing a significantly lower reaction rate than the free enzyme in solution?
A: This is a classic symptom of severe internal diffusion limitations. The substrate cannot reach the active sites fast enough. First, verify your pore size. If the pores are smaller than 100 nm for a large macromolecular substrate (e.g., a protein), diffusion will be severely restricted. Increase porogen concentration during matrix synthesis to create larger pores. Second, check matrix density. A highly dense, cross-linked gel will have a lower effective diffusion coefficient. Reduce polymer concentration or cross-linker ratio.
Q2: How can I determine if my system is limited by substrate diffusion or by enzyme kinetics?
A: Perform a Weisz-Prater or Thiele modulus analysis.
- Experimental Protocol: Measure the observed reaction rate at increasing enzyme loadings while keeping all other parameters (substrate concentration, temperature, particle size) constant. Use small, uniformly sized particles (e.g., 100 μm).
- Analysis: If the observed rate increases linearly with enzyme loading, the system is likely kinetically controlled. If it plateaus or increases sub-linearly, internal diffusion limitations are significant. Quantitatively, calculate the Thiele modulus (φ). If φ > 1, diffusion limitations are strong.
Q3: My product is accumulating inside the matrix, leading to feedback inhibition. How can I enhance product egress?
A: This issue is often linked to matrix hydrophobicity and pore tortuosity. Hydrophobic products will partition into and get stuck in a hydrophobic matrix.
- Solution: Increase matrix hydrophilicity. Incorporate hydrophilic monomers (e.g., 2-hydroxyethyl methacrylate) or use a more hydrophilic base polymer like agarose instead of polyvinyl acetate.
- Protocol for Hydrophilicity Adjustment: Synthesize a series of matrices with 0%, 10%, 20%, and 30% (w/w) hydrophilic co-monomer. Measure the partition coefficient (Kp) of your product between the buffer and each matrix. Select the formulation with the lowest Kp (closest to 1).
Q4: What is the optimal particle size to balance diffusion and practical reactor use?
A: The optimal size minimizes external film resistance and internal pore diffusion while maintaining mechanical stability and ease of separation.
- Guideline: For immobilized enzyme beads in a stirred-tank reactor, a diameter of 150-300 μm is often a practical starting point. Below 100 μm, you may face severe handling and pressure drop issues in packed beds. Above 500 μm, internal diffusion limitations become dominant for most reactions.
- Verification Test: Crush a sample of your larger beads and re-measure activity under identical conditions. If the specific activity (per mg enzyme) increases significantly, your original beads were diffusion-limited.
Q5: How do I accurately measure the effective diffusion coefficient (D_eff) of a substrate in my specific hydrogel matrix?
A: Use a diffusion cell or a release study from pre-loaded gels.
- Detailed Protocol (Release Method):
- Equilibrate blank gel particles (without enzyme) in a concentrated substrate solution for 24h.
- Rapidly transfer the loaded particles into a large, well-stirred volume of buffer (sink condition).
- Monitor the concentration of substrate in the bulk buffer over time using spectrophotometry or HPLC.
- Fit the early-time (<60% release) data to the Higuchi model or a solution of Fick's second law for spheres to estimate Deff. Compare Deff to the diffusivity in free water (Dab) to get the relative diffusivity (Deff/D_ab).
Table 1: Impact of Pore Size on Relative Diffusivity (Deff/Dab)
| Matrix Material | Average Pore Size (nm) | Small Molecule Substrate (MW < 500 Da) | Large Molecule Substrate (MW > 10 kDa) |
|---|---|---|---|
| Polyacrylamide (10%) | 10-50 | 0.15 - 0.30 | 0.01 - 0.05 |
| Alginate (2%) | 50-200 | 0.60 - 0.80 | 0.20 - 0.40 |
| Silica Gel (mesoporous) | 500-1000 | 0.80 - 0.95 | 0.60 - 0.85 |
| Critical Threshold | ~5x Solute Diameter | Minimal Limitation | Severe Limitation |
Table 2: Effect of Matrix Hydrophobicity on Substrate/Product Partition Coefficient (Kp)
| Matrix Type | Log P (Matrix) | Hydrophilic Substrate (Glucose) Kp | Hydrophobic Product (Cortisone) Kp |
|---|---|---|---|
| Poly(HEMA) - Hydrophilic | -0.5 | 0.9 - 1.1 | 1.5 - 2.5 |
| Polyurethane - Moderate | 2.1 | 0.7 - 0.9 | 5.0 - 10.0 |
| Polystyrene - Hydrophobic | 5.0 | 0.3 - 0.6 | > 20.0 |
| Target Range | Low/Moderate | ~1.0 (Ideal) | As low as possible |
Experimental Protocols
Protocol: Determining the Thiele Modulus and Effectiveness Factor (η)
Objective: Quantify the severity of internal diffusion limitations. Materials: Uniformly sized immobilized enzyme particles, substrate solution, well-controlled stirred reactor. Steps:
- Kinetic Constant: Determine the intrinsic kinetic parameters (Vmax, Km) using finely crushed particles or free enzyme under conditions where diffusion is eliminated (high agitation, very small particle size).
- Observed Rate: Measure the initial reaction rate (v_obs) using intact particles of known radius (R) under the same bulk substrate concentration.
- Calculation:
- First, calculate the Thiele Modulus (φ): φ = R * sqrt( Vmax / (Km * Deff) )
- Then, determine the Effectiveness Factor (η): η = (vobs) / (Rate without diffusion limitation) = (3/φ^2) * (φ * coth(φ) - 1) for a first-order reaction in a sphere.
- Interpretation: η = 1 (no limitation), η < 0.7 (significant limitation), η < 0.3 (severe limitation).
Diagrams
Title: Diagnosis Workflow for Enzyme Diffusion Limitations
Title: Substrate Diffusion Pathway to Entrapped Enzyme
The Scientist's Toolkit
| Research Reagent / Material | Primary Function in Addressing Diffusion |
|---|---|
| Porogens (e.g., PEG, Sucrose) | Added during polymerization and then washed out (leached) to create controlled, interconnected pores, directly increasing pore size. |
| Hydrophilic Co-monomers (e.g., HEMA, AAm) | Modify the polymer backbone's hydrophilicity to reduce non-productive hydrophobic adsorption of substrates/products, enhancing partitioning. |
| Controlled-Pore Glass/Silica | Provides a rigid, inert matrix with a narrow, pre-defined pore size distribution for fundamental diffusion studies. |
| Fluorescently-Labeled Dextrans | A series of probes with different molecular weights used to experimentally map pore size distribution and tortuosity via confocal microscopy. |
| Enzyme Inhibitor (Non-permeating) | Used in the "interrupted assay" to quench surface activity, allowing measurement of internal diffusion profiles within a particle. |
| Dynamic Light Scattering (DLS) | Instrumental technique to measure the hydrodynamic radius of substrates, critical for comparing to pore size. |
Technical Support Center: Troubleshooting Guide
FAQ: Common Issues in Entrapment Experiments
Q1: Our entrapped enzyme loses >50% activity within 5 operational cycles. What could be the cause? A: This is a classic symptom of microenvironment-induced instability. The localized pH shift within the matrix and accumulation of hydrophobic reaction products can denature the enzyme. First, measure the intraparticle pH using a fluorescent probe like SNARF-1-dextran. Compare it to the bulk solution pH. If a discrepancy >1.5 pH units is found, consider: 1) Using a higher buffer capacity (100-200 mM) in your bulk solution, or 2) Selecting a matrix with inherent buffering groups (e.g., alginate with high guluronate content).
Q2: How can we accurately measure the local polarity (hydrophobicity) inside an alginate bead? A: Use polarity-sensitive fluorescent probes (see Toolkit). The standard protocol: 1. Co-entrap your enzyme with 10 µM Prodan or Laurdan dye. 2. After polymerization, transfer beads to a quartz cuvette with buffer. 3. Measure fluorescence emission spectra (Ex: 360 nm, Em: 400-550 nm). 4. Calculate the Generalized Polarization (GP) index: GP = (I₄₄₀ - I₄₉₀) / (I₄₄₀ + I₄₉₀). A higher GP value indicates a more hydrophobic (less polar) microenvironment.
Q3: We observe a severe drop in reaction rate despite high enzyme loading. Is this a diffusion issue or a pH effect? A: It is likely a combination. Perform the following diagnostic: 1. Conduct a Thiele modulus analysis (see Table 1 for calculations). 2. If the modulus <0.3, diffusion limitation is minimal. The cause is likely kinetic (pH/polarity). 3. Experimentally, vary the bead size. If specific activity (rate per mg enzyme) increases with smaller bead diameter, diffusion is a key factor. If activity remains low, microenvironmental distortion is the primary culprit.
Table 1: Impact of Entrapment Matrix on Microenvironment Parameters
| Matrix Material | Avg. Intraparticle pH Shift (vs. Bulk) | Polarity Change (GP Index Shift) | % Activity Retention (Cycle 10) |
|---|---|---|---|
| Alginate (High M) | -1.2 ± 0.3 | +0.15 ± 0.04 | 42 ± 7 |
| Chitosan | +0.8 ± 0.2 | +0.22 ± 0.05 | 38 ± 5 |
| Polyacrylamide | -0.3 ± 0.1 | +0.45 ± 0.07 | 65 ± 6 |
| Silica Gel | -2.1 ± 0.4 | +0.08 ± 0.03 | 28 ± 9 |
Table 2: Diagnostic Experimental Outcomes & Solutions
| Observed Problem | Likely Primary Cause | Recommended Diagnostic Experiment | Mitigation Strategy |
|---|---|---|---|
| Rapid activity decay | Local acidification | Intraparticle pH imaging with SNARF-1 | Increase buffer concentration; use composite matrix with CaCO₃ |
| Unexpected product inhibition | Hydrophobic product accumulation | Measure local polarity with Prodan; HPLC of bead homogenate | Introduce co-entrapped adsorbent (e.g., cyclodextrin) |
| Michaelis constant (Km(app)) increase >5x | Diffusional limitation | Vary substrate concentration & bead size; fit to kinetic-diffusion model | Reduce bead size; increase pore size of matrix |
| Enzyme leaching >5% per cycle | Weak enzyme-matrix interaction | Measure protein in supernatant (Bradford assay) | Use covalent attachment or stronger affinity tags |
Detailed Experimental Protocols
Protocol 1: Measuring Intraparticle pH with Fluorescent Rationetric Dyes Objective: Quantify the pH gradient between the entrapment matrix and the bulk solution. Materials: SNARF-1 carboxylic acid, acetate, succinate, or dextran conjugate (10 mg/mL stock in DMSO), entrapped enzyme system, spectrofluorometer. Steps: 1. Dye Loading: Incubate pre-formed beads in 5 µM SNARF-1 solution for 2 hours. Rinse. 2. Calibration: Place beads in buffers of known pH (4.0, 5.0, 6.0, 7.0, 8.0). Acquire emission spectra at 580 nm and 640 nm (Ex: 514 nm). Calculate ratio R = I₆₄₀/I₅₈₀. Plot R vs. pH to create a standard curve. 3. Measurement: Place beads in your experimental buffer. Acquire spectra and use the standard curve to calculate the local pH. Note: Use the dextran-conjugated dye to prevent dye leaching.
Protocol 2: Thiele Modulus & Effectiveness Factor Analysis Objective: Distinguish between kinetic and diffusion-controlled reaction rates. Materials: Entrapped enzyme beads of three distinct radii (0.2, 0.5, 1.0 mm), substrate, assay reagents. Steps: 1. Measure the initial reaction rate (vobs) for each bead size at a fixed bulk substrate concentration [S]. 2. For the smallest beads (assumed diffusion-free), determine the intrinsic kinetic parameters Vmax and Km. 3. Calculate the Thiele modulus (φ): φ = R * sqrt( Vmax / (Km * Deff) ), where R is bead radius, Deff is effective substrate diffusivity (measured separately). 4. Determine the effectiveness factor (η) = vobs / v_intrinsic (rate in free solution). 5. Interpretation: If η < 1 and φ > 0.3, significant diffusion limitation exists. If η < 1 but φ is small, microenvironmental effects (pH, polarity) are dominant.
Visualizations
Diagram Title: Primary Causes of Entrapped Enzyme Performance Loss
Diagram Title: Troubleshooting Logic Flow for Entrapped Enzymes
The Scientist's Toolkit: Research Reagent Solutions
| Item | Function in Microenvironment Analysis | Example Product/Catalog |
|---|---|---|
| SNARF-1 Dextran Conjugate | Rationetric, non-leaching fluorescent probe for accurate intraparticle pH measurement. | Thermo Fisher S-22996; 10 mg/mL in DMSO. |
| Prodan / Laurdan | Polarity-sensitive fluorescent dyes to assess local hydrophobicity. Generalized Polarization (GP) is calculated. | Sigma-Aldrich P-8909 (Prodan); prepare 1 mM stock in DMSO. |
| Fluorescein Isothiocyanate-Dextran (FITC-dextran) | To visualize and quantify pore structure and diffusional pathways via confocal microscopy. | Millipore Sigma FD40S; various molecular weights. |
| 4-Methylumbelliferyl Substrates | Fluorogenic enzyme substrates for sensitive, continuous activity assays inside beads. | e.g., MUF-β-D-glucoside for cellulase; prepare in DMSO. |
| Cyclodextrins (β-, HP-β-) | Co-entrapped scavengers to adsorb hydrophobic products and reduce local polarity shifts. | Cayman Chemical 13855; use at 1-5% w/v in gel. |
| Buffer-Modified Polymers | Matrices with built-in buffering capacity (e.g., histidine-modified alginate). | Synthesized in-house or from specialized suppliers (e.g., NovaMatrix). |
| EPR Spin Probes (Tempamine) | Electron paramagnetic resonance probes to measure local viscosity and micropolarity. | Sigma-Aldrich 253688; 100 mM stock in water. |
Technical Support Center: Troubleshooting & FAQs
This support center addresses common experimental challenges related to substrate and product partitioning in enzyme immobilization systems, framed within the thesis context of overcoming diffusion limitations in entrapped enzyme research.
FAQ 1: Why do I observe a significant kinetic lag phase and reduced apparent Vmax in my entrapped enzyme system, even with high bulk substrate concentration?
Answer: This is a classic symptom of internal diffusion limitation combined by substrate partitioning. The substrate may be preferentially excluded from the hydrogel matrix (e.g., due to hydrophobicity or charge repulsion), creating a lower local concentration at the active site than in the bulk solution. This exacerbates mass transfer resistance. First, verify partitioning by measuring the equilibrium concentration of substrate inside vs. outside the bead (see Protocol A). To mitigate, consider modifying the matrix charge/hydrophobicity to be more favorable for your specific substrate, reducing particle size to decrease diffusion path length, or increasing bulk concentration to saturate the partitioning effect.
FAQ 2: My product yield plateaus unexpectedly, and I detect product accumulation outside the bead but not inside. What could be the cause?
Answer: This indicates strong product partitioning, where the product is actively expelled from or excluded by the matrix. This can be beneficial to reduce product inhibition but can also create a steep reverse concentration gradient if the reaction is reversible, halting net conversion. It confirms a partitioning-driven diffusion limitation for the product. Analyze product partitioning coefficients (see Protocol A). If product inhibition is not a concern, modifying the matrix to better retain the product can sometimes drive equilibrium-controlled reactions further to completion.
FAQ 3: How can I quantitatively distinguish between diffusion limitation and enzyme inactivation in my encapsulated system?
Answer: Perform an Effectiveness Factor (η) analysis. Compare the observed reaction rate of the entrapped enzyme to the rate of the same amount of free enzyme under identical bulk conditions. Then, crush or dissolve the beads to release the enzyme and measure its activity in free solution. Use Table 1 to diagnose.
Table 1: Diagnosis of Diffusion vs. Inactivation
| Observation | Crushed Bead Activity vs. Free Enzyme Control | Probable Cause |
|---|---|---|
| Low η, Low crushed bead activity | Significantly reduced | Primarily enzyme inactivation during/after immobilization. |
| Low η, High crushed bead activity | Similar | Primarily diffusion limitation (likely with partitioning). |
| Low η, Moderate crushed bead activity | Moderately reduced | Combined diffusion limitation and partial inactivation. |
Protocol A: Measuring Partition Coefficients (Kp) for Substrate and Product.
Objective: To determine the equilibrium concentration ratio of a solute between the matrix (gel bead) and the external bulk solution.
Materials: Prepared enzyme-loaded gel beads (e.g., alginate, chitosan), substrate solution, product standard, buffer, microcentrifuge tubes, spectrophotometer/HPLC.
Procedure:
- Equilibration: Incubate a known volume (e.g., 1 mL) of blank gel beads (without enzyme) with a known concentration of pure substrate (or product) in buffer. Use a control tube without beads.
- Separation: After 2-4 hours (ensure equilibrium), carefully separate the beads (via gentle filtration or large-pore centrifugation) from the external solution.
- Analysis: Measure the concentration of the solute in the external solution (Cext). Crush and extract the solute from the beads to measure the intra-matrix concentration (Cmat). Alternatively, calculate Cmat from the mass balance: Cmat = [(Cinitial * Vtotal) - (Cext * Vext)] / V_mat.
- Calculation: Compute the partition coefficient: Kp = Cmat / Cext. A Kp < 1 indicates exclusion; Kp > 1 indicates accumulation.
Protocol B: Determining the Substrate Concentration Gradient via Microelectrode.
Objective: To experimentally profile the substrate concentration from the bead surface to the center.
Materials: Enzyme-loaded large bead (>2mm), substrate-filled bath, micromanipulator, substrate-specific microelectrode (e.g., oxygen, hydrogen peroxide, pH), reference electrode, amplifier, data acquisition software.
Procedure:
- Calibration: Calibrate the microelectrode in the bulk solution with known substrate concentrations.
- Profiling: Immobilize a single bead in a substrate-filled chamber. Using a micromanipulator, advance the microelectrode tip stepwise (e.g., 100 μm steps) from the bulk solution, through the bead surface, and towards its center.
- Recording: At each step, allow the signal to stabilize and record the concentration value.
- Analysis: Plot concentration vs. penetration depth. A sharp decline from the surface inward confirms a steep diffusion gradient and severe internal mass transfer limitation.
Diagrams
Title: Four-Step Process of Substrate and Product Partitioning
Title: Diagnostic Flowchart for Low Entrapped Enzyme Activity
The Scientist's Toolkit: Key Research Reagent Solutions
Table 2: Essential Materials for Partitioning & Diffusion Studies
| Item | Function & Relevance |
|---|---|
| Alginate (e.g., Low Viscosity) | A common hydrogel polymer for ionotropic gelation (with Ca²⁺). Allows easy control of bead size and porosity. Model matrix for partitioning studies. |
| Chitosan | A cationic polysaccharide. Useful for studying charge-based partitioning effects with anionic/cationic substrates. Can form blends with alginate. |
| Polyethylene Glycol (PEG) | A common crowding agent. Used to simulate macromolecular crowding in matrices and study its effect on partitioning and enzyme activity. |
| Dextran Probes (Various MWs) | Fluorescently-labeled or unlabeled dextrans of defined molecular weights. Used as inert tracers to characterize effective pore size and diffusion coefficients within the matrix. |
| Substrate/Product Analog Dyes | Chromogenic or fluorogenic substrates (e.g., p-nitrophenol derivatives) that change optical properties upon conversion. Enable direct visualization of concentration gradients in beads via microscopy. |
| Microelectrodes (O₂, pH, H₂O₂) | Needle-type sensors for direct, real-time measurement of specific analyte concentrations at micro-locations within and around a bead, providing experimental gradient data. |
| Enzyme Activity Assay Kit | Standardized, sensitive kits (e.g., based on fluorescence) for accurately measuring residual free and entrapped enzyme activity after immobilization steps. |
| Dialysis Membrane/Tubing | Used in equilibrium dialysis setups to experimentally measure partition coefficients (Kp) between a polymer solution (simulating the matrix) and bulk buffer. |
Troubleshooting Guides & FAQs
Q1: In my batch reactor experiment, I observe a drastic drop in apparent reaction rate when I increase the particle size of my enzyme carrier. The enzyme loading is identical. What is the primary cause and how can I diagnose it?
A: This is a classic symptom of significant internal diffusion limitations. The Thiele modulus (φ) increases with particle size, reducing the effectiveness factor (η). To diagnose, perform the "Weisz-Prater Criterion" experiment. Measure the observed reaction rate (r_obs) and calculate the Weisz-Prater parameter: Φ = (r_obs * R²) / (D_eff * C_s). If Φ >> 1, internal diffusion is severely limiting. Reduce particle size or increase pore diffusivity (D_eff).
Q2: I calculated an effectiveness factor (η) greater than 1. Is this possible, or have I made an error? A: While η is typically ≤ 1 for simple kinetics, an η > 1 is possible and indicates non-isothermal conditions or more complex reaction schemes (e.g., substrate activation, inhibitory effects). For exothermic reactions, heat buildup inside the particle can increase the rate constant, leading to η > 1. Verify your temperature measurements inside and outside the particle and check your kinetic model assumptions.
Q3: My effectiveness factor is very low (η < 0.1). How can I redesign my biocatalyst to improve it? A: A low η indicates severe diffusion limitations. Redesign strategies focus on reducing the Thiele modulus (φ). Implement the following:
| Strategy | Target Parameter | Action |
|---|---|---|
| Reduce Diffusional Path Length | Characteristic Length (L) | Decrease carrier particle size. Use thinner membranes or coatings. |
| Increase Effective Diffusivity | D_eff | Use a macroporous support material. Adjust polymer cross-linking density. |
| Adjust Reaction Kinetics | Intrinsic Kinetics (Vmax, Km) | Lower enzyme loading to reduce apparent reaction density. |
Q4: During continuous packed-bed reactor operation, my system shows a rapid initial activity loss that then stabilizes. Is this enzyme deactivation or a diffusion issue? A: This can be a confounding result. It is likely a combination. Initial loss may be due to leaching of poorly entrapped enzyme or rapid deactivation of enzyme molecules near the surface. The stabilized rate may represent the performance of deeply entrapped, protected enzyme, which is now severely diffusion-limited. Run a control experiment in a well-mixed batch system with crushed particles to isolate intrinsic deactivation from diffusion effects.
Q5: How do I accurately determine the effective diffusivity (D_eff) of my substrate in the hydrogel matrix? A: Use a passive uptake experiment. The following protocol is standard:
Experimental Protocol: Determination of Effective Diffusivity (D_eff)
- Material Preparation: Create enzyme-free hydrogel particles identical to your biocatalyst in size, shape, and composition.
- Equilibration: Place particles in a buffer solution without substrate. Allow to swell fully.
- Uptake Experiment: Transfer particles to a well-stirred reservoir containing a known concentration of substrate (C_bulk). Monitor the decrease in reservoir concentration over time using spectrometry or HPLC.
- Data Modeling: Fit the concentration decay data to the solution of Fick's second law for the appropriate particle geometry (sphere, slab, cylinder). The fitting parameter is
D_eff.
Key Concepts & Quantitative Data
Table 1: Thiele Modulus & Effectiveness Factor Relationships for a First-Order Reaction in a Sphere
| Thiele Modulus (φ) | Effectiveness Factor (η) | Interpretation | Regime |
|---|---|---|---|
| φ < 0.3 | η ≈ 1 | Reaction rate >> Diffusion rate. No limitations. | Kinetic Control |
| 0.3 < φ < 3 | 1 > η > 0.3 | Reaction and diffusion rates are comparable. | Intermediate |
| φ > 3 | η ≈ 1/φ | Diffusion rate << Reaction rate. Severe limitations. | Diffusion Control |
Formula for sphere: φ = R * sqrt(V_max / (K_m * D_eff)) for M-M kinetics (generalized). For first-order: φ = R * sqrt(k / D_eff).
Table 2: Diagnostic Criteria for Diffusion Limitations
| Criterion | Formula | Threshold Indicating Limitation |
|---|---|---|
| Weisz-Prater (Internal) | Φ = (robs * R²) / (Deff * C_s) | Φ >> 1 |
| Mears (External) | ζ = (robs * R * n) / (kc * C_bulk) | ζ > 0.3 |
Where: R = particle radius, n = reaction order, k_c = external mass transfer coefficient.
Experimental Protocol: Determining the Effectiveness Factor (η)
Objective: To experimentally measure the effectiveness factor (η) of an entrapped enzyme catalyst and compare it to theoretical predictions.
Procedure:
- Prepare Two Reactor Systems:
- System A (Diffusion-Limited): Set up a stirred-tank reactor containing your intact, porous enzyme-loaded particles.
- System B (Kinetic Control): Set up an identical reactor containing the same mass of particles that have been finely crushed to eliminate internal diffusion gradients, or use an equivalent amount of free enzyme.
- Measure Initial Rates: Under identical conditions (pH, temperature, substrate concentration
C_bulk), measure the initial reaction rate (r_obs) for both systems. - Calculate η: The experimental effectiveness factor is the ratio of the observed rate of the intact catalyst to the rate of the catalyst free of internal diffusion resistance.
η_exp = (r_obs of System A) / (r_obs of System B) - Theoretical Comparison: Calculate the theoretical Thiele modulus (φ) using known or estimated parameters (kinetic constants, particle size,
D_eff). Use the standard plot or equation (e.g., for a sphere: η = (3/φ²) * (φ * coth(φ) - 1)) to findη_theory. Compareη_expandη_theory.
The Scientist's Toolkit: Research Reagent Solutions
| Item | Function in Experiment |
|---|---|
| Alginate (e.g., Sodium Alginate) | Common hydrogel polymer for ionic gelation entrapment, forming porous beads. |
| Glutaraldehyde | Cross-linking agent for creating stable enzyme aggregates (CLEAs) or hardening porous supports. |
| Eupergit C | A commercial, macroporous acrylic copolymer carrier designed for enzyme immobilization. |
| Polyethylenimine (PEI) | A polycation used for coating supports or creating layered immobilization, can affect local pH and diffusivity. |
| Dextran Blue | A high molecular weight tracer used to probe the effective pore size and exclusion limits of the support matrix. |
| Fluorescein Isothiocyanate (FITC) | Fluorescent dye for conjugating to enzyme or substrate to visualize diffusion profiles via confocal microscopy. |
Visualization of Concepts
Diagram Title: Decision Tree for Diagnosing Internal Diffusion Limits
Diagram Title: How Parameters Affect Observed Reaction Rate
Historical Context and Core Challenges in Early Immobilized Enzyme Systems
Technical Support Center: Troubleshooting Early Entrapment Systems
This support center addresses common experimental issues in the context of ongoing research focused on overcoming mass transfer limitations in enzyme entrapment.
Frequently Asked Questions (FAQs)
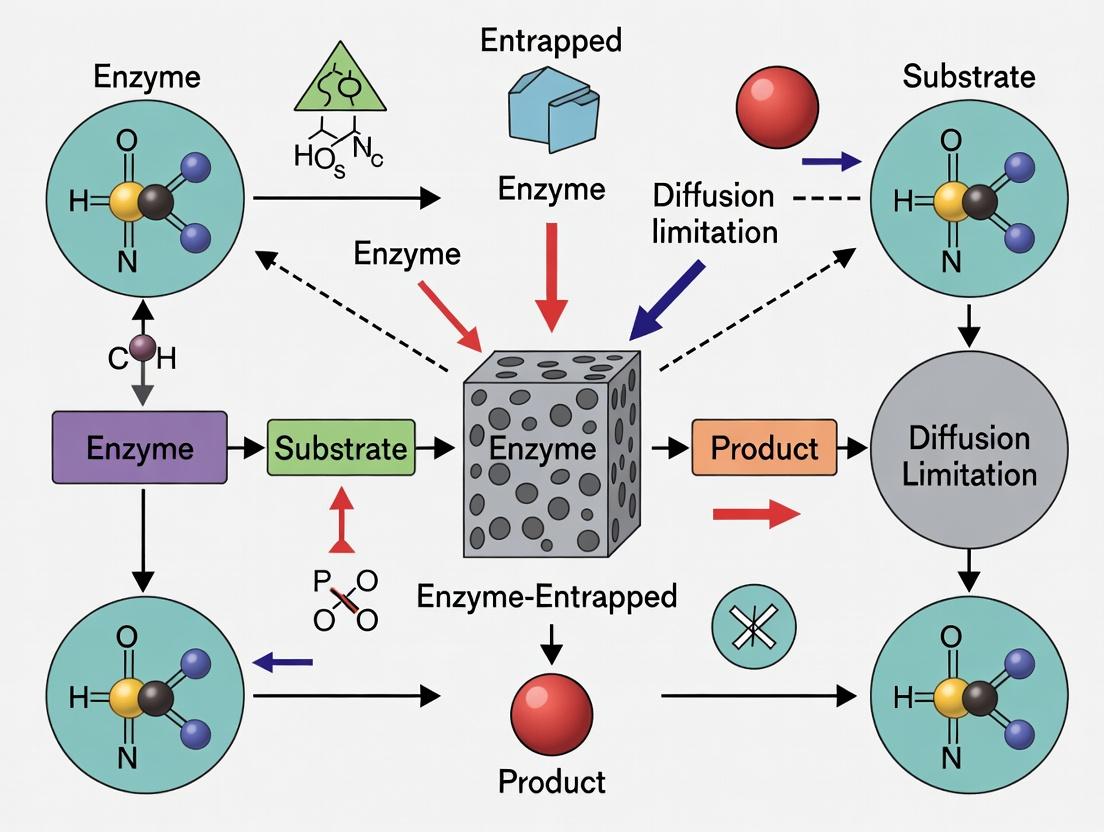
Q1: My entrapped enzyme shows a drastically reduced reaction rate compared to the free enzyme. Is this purely due to enzyme inactivation? A: Not necessarily. While some inactivation occurs during immobilization, a significant reduction in observed rate is often due to diffusion limitations. Substrates must diffuse through the gel matrix to reach the enzyme, and products must diffuse out. This creates concentration gradients. To diagnose, measure the effectiveness factor (η) by comparing the observed reaction rate of the immobilized system with the rate of an equivalent amount of free enzyme under identical bulk conditions. If η << 1, diffusion is likely limiting.
Q2: How can I determine if my system is suffering from internal (pore) diffusion vs. external (film) diffusion limitations? A: Perform a Weisz-Prater Criterion (for internal) and/or Damköhler number analysis (for external). A practical experimental test is to vary the agitation speed. If the observed reaction rate increases with higher agitation, external film diffusion is significant. If the rate remains constant, internal pore diffusion is the likely limiting step.
Q3: My gelatin/alginate beads are mechanically weak and disintegrate in the reactor. How can I improve bead stability? A: Mechanical strength is a classic challenge in early entrapment matrices. Consider:
- Cross-linking: For alginate, increase Ca²⁺ concentration or use a mixture of divalent cations (e.g., Ba²⁺, Sr²⁺). For gelatin or polyacrylamide, optimize glutaraldehyde or bis-acrylamide concentration.
- Composite Matrices: Incorporate reinforcing agents like silica, clay, or chitosan into your alginate or κ-carrageenan gel before bead formation.
- Hardening Protocols: After formation, subject beads to a post-hardening step (e.g., extended exposure to cross-linker solution).
Q4: I observe significant enzyme leaching from my polyacrylamide gel. What went wrong? A: Early polyacrylamide gels often had large, ill-controlled pore sizes. Leaching indicates the enzyme molecules are smaller than the average gel pore diameter. Solutions include:
- Increasing cross-linker (N,N'-methylenebisacrylamide) percentage during polymerization.
- Employing a two-step immobilization: entrapment followed by chemical cross-linking of the enzyme within the gel matrix.
- Switching to a matrix with a more controllable pore size distribution, like certain silica gels or refined agarose derivatives.
Q5: The pH-activity profile of my enzyme shifts after entrapment in a charged matrix (e.g., alginate, carrageenan). Why? A: This is a classic electrostatic effect. Polyanionic matrices (alginate, -COO⁻) create a local microenvironment with a higher concentration of H⁺ ions relative to the bulk solution. This makes the local pH lower than the measured bulk pH. The enzyme experiences this lower pH, shifting its optimal activity to a higher measured bulk pH. The opposite occurs for polycationic matrices.
Diagnostic Data & Parameters
Table 1: Key Diagnostic Parameters for Diffusion Limitations
| Parameter | Formula / Method | Interpretation | Threshold Indicating Limitation |
|---|---|---|---|
| Effectiveness Factor (η) | η = (Observed Rate) / (Rate at bulk conditions) | Catalyst utilization efficiency. | η < 0.7 suggests significant diffusion impact. |
| Thiele Modulus (φ) | φ = L * √(Vmax / (Deff * K_m)) | Ratio of reaction rate to diffusion rate. | φ > 1 indicates strong internal diffusion resistance. |
| Weisz-Prater Criterion | CWP = (Observed Rate * L²) / (Deff * C_s) | Observable version of Thiele modulus. | C_WP >> 1 indicates internal diffusion limitations. |
| Damköhler No. (Da II) | Da II = (Maximum reaction rate) / (Maximum diffusion rate) | External film diffusion vs. reaction. | Da II > 1 indicates external film diffusion limitation. |
Table 2: Common Early Matrices & Core Challenges
| Matrix (Historical) | Typical Immobilization Method | Primary Strength | Core Challenge (Diffusion-Linked) |
|---|---|---|---|
| Polyacrylamide Gel | Entrapment during radical polymerization | High enzyme loading capacity | Very high diffusion barriers; pore size control difficult. |
| Calcium Alginate | Ionic gelation (Ca²⁺ cross-linking) | Mild, fast formation | Gel compaction under flow, unstable at phosphate buffers. |
| κ-Carrageenan | Ionic gelation (K⁺ cross-linking) | Thermally reversible | Soft gel, high diffusion barrier for large substrates. |
| Collagen Membrane | Entrapment & cross-linking | Good mechanical stability | Heterogeneous pore distribution, severe channeling. |
Experimental Protocols
Protocol 1: Determining the Effectiveness Factor (η) Objective: Quantify the loss of apparent activity due to all immobilization effects (diffusion + inactivation).
- Free Enzyme Assay: Under precisely controlled conditions (pH, Temp, Stirring), measure the initial reaction rate (v_free) using a known amount of free enzyme.
- Immobilized Enzyme Assay: Under IDENTICAL bulk conditions, measure the initial reaction rate (v_immob) using the same total amount of enzyme now in immobilized form.
- Calculation: η = vimmob / vfree.
- Interpretation: An η of 1 means no loss. η < 1 indicates combined effects of diffusion and inactivation.
Protocol 2: Agitation Test for External Film Diffusion Objective: Experimentally check if external mass transfer is rate-limiting.
- Set up a stirred batch reactor with your immobilized enzyme particles.
- Measure the initial reaction rate at a controlled substrate concentration.
- Systematically increase the agitation speed (e.g., 100 rpm, 200 rpm, 400 rpm, 600 rpm) and measure the initial rate at each speed, ensuring all other conditions are constant.
- Plot Observed Rate vs. Agitation Speed. If the rate increases with speed, external film diffusion is significant. The plateau rate indicates the regime where external limitation is minimized, and pore diffusion or kinetics dominate.
Visualizations
The Scientist's Toolkit: Key Research Reagent Solutions
Table 3: Essential Materials for Entrapment & Diffusion Studies
| Reagent / Material | Function & Rationale |
|---|---|
| High-Purity Sodium Alginate (e.g., MV ~60 kDa) | Forms uniform, reproducible Ca²⁺-cross-linked beads. Purity minimizes inhibition and unwanted interactions. |
| N,N'-Methylenebisacrylamide (BIS) | Cross-linker for polyacrylamide gel entrapment. Concentration critically controls pore size. |
| Glutaraldehyde (25% Aqueous Solution) | Post-entrapment cross-linker to reduce enzyme leaching and stabilize gel matrices. |
| Dextran Blue (2,000 kDa) | A probe molecule used to estimate the effective pore size and diffusivity within gel matrices. |
| SigmaCell Cellulose (Type 20) | A common, inert carrier used in control experiments to study pure external diffusion without pore effects. |
| EDTA (0.1M Solution) | Used to selectively dissolve alginate beads post-experiment to recover and analyze entrapped enzyme. |
| Microspatula & Sieve Set (e.g., 100-500 µm) | For consistent sizing of gel beads, crucial for reproducible diffusion studies (size affects Thiele modulus). |
| Rotary Shaker / Controlled Agitation Reactor | Essential for performing agitation tests to diagnose external film diffusion limitations. |
Engineering Solutions: Cutting-Edge Strategies to Bypass Diffusion Barriers
Technical Support Center: Troubleshooting Diffusion Limitations in Enzyme Entrapment
This support center addresses common experimental challenges in synthesizing porous hydrogels and macroporous carriers for enzyme immobilization, framed within a thesis on overcoming mass transfer barriers.
Frequently Asked Questions (FAQs)
Q1: My entrapped enzyme shows significantly lower activity than the free enzyme. Is this solely due to diffusion limitation, or could the immobilization process have denatured the enzyme? A: This is a critical diagnostic question. First, perform a leaching assay to confirm the enzyme is fully entrapped and not leaking. Then, compare the activity of the free enzyme after exposure to your polymerization/crosslinking conditions (e.g., monomers, initiators, solvents) but without the solid matrix. If that activity is high, the issue is likely diffusion limitation. To confirm, systematically vary the substrate concentration and analyze the data using a Lineweaver-Burk plot. A large increase in apparent ( K_m ) for the immobilized enzyme compared to the free enzyme is a hallmark of diffusion restriction.
Q2: The porosity of my cryogel is inconsistent between batches. What factors in the freezing process should I control most rigorously? A: Inconsistent porosity in cryogels (macroporous carriers formed via cryogelation) is almost always due to variations in the freezing regime. You must control:
- Freezing Rate: This is the most critical parameter. A slower freezing rate (e.g., -20°C vs. -80°C) leads to larger ice crystals and thus larger pores. Use a programmable freezing bath for reproducibility.
- Final Freezing Temperature: This determines the final ice crystal size.
- Solvent Composition: The presence of salts, monomers, and cryoprotectants (like glycerol) alters freezing point and crystal growth.
- Solution Volume: Thicker samples freeze slower at the core than at the edges, creating a pore size gradient.
Q3: During porogen leaching (e.g., salt, sugar), my hydrogel scaffold collapses, losing its macroporous structure. How can I prevent this? A: Scaffold collapse indicates insufficient mechanical strength of the polymer network to withstand capillary forces during solvent evaporation. Solutions include:
- Increase Crosslinking Density: Use a higher crosslinker-to-monomer ratio.
- Alternative Drying: Use critical point drying (CPD) or freeze-drying (lyophilization) instead of air drying to avoid the liquid-vapor interface that causes collapse.
- Post-Crosslinking: After leaching, perform a second, mild crosslinking step (e.g., with glutaraldehyde vapor for polysaccharide gels) to strengthen the wet scaffold.
- Use a Stiffer Polymer: Consider incorporating a rigid component like cellulose nanocrystals or a higher proportion of a stiff monomer.
Q4: I am using an emulsion-templated method (HIPE) to create pores, but my pores are not interconnected. How do I ensure interconnectivity? A: In High Internal Phase Emulsion (HIPE) templating, interconnectivity is created by thinning and rupturing the thin film of the continuous phase between adjacent droplets. To promote this:
- Reduce Surfactant Concentration: Excess surfactant stabilizes the film too effectively. Titrate to find the minimum level needed to form the emulsion.
- Control Polymerization Rate: A very rapid polymerization can "freeze" the emulsion before film rupture occurs. Use a lower initiator concentration or a milder initiator to slow the reaction.
- Apply Post-Polymerization Shear: Gently stirring or compressing the polymerized wet foam can mechanically break residual films.
Troubleshooting Guide: Common Experimental Issues
| Symptom | Possible Cause | Diagnostic Test | Solution |
|---|---|---|---|
| Low enzyme activity | 1. Enzyme denaturation2. Substrate diffusion limitation3. Product inhibition | 1. Assay free enzyme post-synthesis conditions.2. Plot Lineweaver-Burk.3. Measure activity over time. | 1. Optimize synthesis pH/temp.2. Increase pore size/interconnectivity.3. Incorporate product-removal moiety. |
| Fragile, brittle hydrogel | Excessive crosslinking | Swelling ratio test (low ratio confirms) | Reduce crosslinker % or switch to a longer, more flexible crosslinker. |
| Non-uniform pore distribution | Uneven temperature during gelation/ freezing | SEM imaging of multiple cross-sections | Use a forced-convection freezer or a well-insulated mold for uniform heat transfer. |
| High enzyme leaching | Pores too large or network too loose | Incubate carrier in buffer; assay buffer for enzyme | Increase crosslinking density or use a post-entrapment crosslinking step on the enzyme itself. |
| Slow gelation time | Low initiator/ catalyst concentration or low temperature | Monitor vial tilt time | Increase initiator/catalyst within biocompatibility limits or slightly raise reaction temperature. |
Table 1: Impact of Carrier Porosity on Apparent Kinetic Parameters of Entrapped Glucose Oxidase (Theoretical Data Based on Literature Trends).
| Carrier Type | Avg. Pore Size (µm) | Porosity (%) | Apparent ( K_m ) (mM) | Relative Activity (%) |
|---|---|---|---|---|
| Dense Hydrogel (e.g., 10% PAAm) | < 0.05 | ~85 | 45.2 | 15-25 |
| Mesoporous Hydrogel (e.g., 0.5% Agarose) | 0.1 - 1.0 | ~92 | 28.7 | 40-60 |
| Macroporous Cryogel (e.g., PVA) | 10 - 100 | ~95 | 12.5 | 70-85 |
| Emulsion-Templated Foam (PolyHIPE) | 5 - 50 | ~98 | 9.8 | 80-95 |
| Free Enzyme (Control) | N/A | N/A | 8.1 | 100 |
Table 2: Common Porogen Methods and Their Typical Outputs.
| Porogen Method | Typical Materials | Pore Size Range | Key Controlling Parameter | Interconnectivity |
|---|---|---|---|---|
| Cryogelation | Water (ice crystals) | 1 - 200 µm | Freezing rate/temperature | Excellent |
| Porogen Leaching | Sucrose, Salt, Paraffin Spheres | 10 µm - 2 mm | Porogen particle size | Good (if packed well) |
| Gas Foaming | ( CO2 ), ( N2 ) | 50 - 500 µm | Gas pressure/saturation | Variable |
| Emulsion Templating | Oil/Water (HIPE) | 1 - 100 µm | Surfactant type/ratio, shear | Very Good |
| Phase Separation | Polymer/solvent/non-solvent | 0.1 - 10 µm | Solvent composition, temperature | Poor to Fair |
Experimental Protocols
Protocol 1: Synthesis of a Macroporous, Enzyme-Entrapping PVA Cryogel Objective: To create a mechanically robust polyvinyl alcohol (PVA) cryogel carrier with pores > 50µm for high-activity enzyme immobilization.
- Solution Preparation: Dissolve 8% (w/v) PVA (MW ~145,000) in deionized water at 90°C with stirring until clear. Cool to room temperature.
- Enzyme Addition & Mixing: Cool solution to 4°C. Gently add and mix your target enzyme (e.g., catalase) to a final concentration of 1-2 mg/mL. Avoid frothing.
- Crosslinking Initiation: Add glutaraldehyde (crosslinker) to 0.5% (v/v) and concentrated HCl (catalyst) to 10 mM. Mix quickly and thoroughly.
- Cryogelation: Immediately pour the solution into a sealed polypropylene mold (e.g., a syringe barrel). Place the mold in a static freezer at -20°C for 24 hours.
- Thawing & Leaching: Remove the mold and thaw at room temperature (~2 hrs). Wash the resulting elastic gel extensively with 0.1M phosphate buffer (pH 7.4) on a rotary shaker (24 hrs, buffer changes every 6 hrs) to remove unreacted species and leach out ice-templated pore contents.
- Storage: Store the hydrated cryogel at 4°C in buffer until use.
Protocol 2: Assessing Diffusion Limitation via Apparent Kinetics Objective: To diagnose and quantify the impact of mass transfer on entrapped enzyme activity.
- Activity Assay Series: Perform your standard activity assay on both free and entrapped enzyme using at least 6 different substrate concentrations spanning below and above the expected ( K_m ).
- Data Recording: Record initial reaction rates (V) for each substrate concentration [S] for both systems.
- Lineweaver-Burk Analysis: Plot 1/V vs. 1/[S] for both the free and entrapped enzyme.
- Interpretation: Calculate apparent ( Km ) (app) and ( V{max} ) (app) from the plot. A significant increase in ( Km ) (app) for the immobilized enzyme with little change in ( V{max} ) (app) indicates a diffusion limitation. A decrease in ( V_{max} ) (app) suggests enzyme inactivation or steric hindrance.
Visualizations
Diagram 1: Diagnostic Path for Low Enzyme Activity
Diagram 2: General Workflow for Porous Carrier Synthesis
The Scientist's Toolkit: Research Reagent Solutions
| Item | Function & Rationale |
|---|---|
| N,N'-Methylenebisacrylamide (BIS) | A common covalent crosslinker for acrylamide-based hydrogels, defining network mesh size. |
| Ammonium Persulfate (APS) / TEMED | Redox initiator pair for radical polymerization of vinyl monomers (e.g., acrylamide) at room temperature. |
| Polyvinyl Alcohol (PVA), High MW | Polymer for strong cryogels; forms physical crosslinks via freeze-thaw cycles and crystal domains. |
| Glutaraldehyde (25% soln.) | Bifunctional crosslinker for polymers with -OH or -NH₂ groups (e.g., PVA, chitosan, proteins). |
| Pluronic F127 | Non-ionic surfactant critical for stabilizing High Internal Phase Emulsions (HIPEs) for polyHIPE foams. |
| Porogens (Sucrose, NaCl crystals) | Particulate leaching agents; size defines pore diameter, concentration defines porosity. |
| Poly(ethylene glycol) diacrylate (PEGDA) | Biocompatible, photopolymerizable crosslinker for forming hydrogels under UV light with a photoinitiator. |
| Irgacure 2959 | A cytocompatible photoinitiator for UV-induced crosslinking of polymers like PEGDA. |
Nanostructured and Hierarchical Materials for Enhanced Surface Area and Permeability
Technical Support Center: Troubleshooting & FAQs
Frequently Asked Questions
Q1: During the synthesis of our hierarchical silica scaffold, we observe a collapse of the porous structure after lyophilization. What could be causing this and how can we prevent it?
A: Structural collapse is often due to high capillary forces during drying. The solution is to implement a solvent exchange protocol prior to lyophilization. Replace the water in your hydrogel with a low-surface-tension solvent like tert-butanol* or ethanol. Perform three gradual exchanges (25%, 50%, 100% v/v) over 12 hours before freezing and lyophilizing. This preserves the nano- and micro-scale architecture crucial for enzyme entrapment and diffusion.
Q2: Our entrapped enzyme activity drops by over 70% within 5 reaction cycles, despite high initial activity. Is this a leaching or deactivation issue?
A: This typically indicates poor enzyme-material binding or pore degradation. First, quantify leaching: Assay the supernatant after each cycle. If leaching >20%, you need to strengthen immobilization. We recommend using a crosslinker like glutaraldehyde (0.5% v/v) in your entrapment buffer for 2 hours. If leaching is low (<5%), the issue is likely enzyme deactivation from local pH shifts or mass transfer limitations. Incorporating a buffering agent (e.g., mesoporous carbon with amine groups) into your hierarchical composite can stabilize the micro-environment.
Q3: The permeability of our macroporous network seems insufficient, causing severe diffusion limitations in our kinetic assays. How can we quantitatively assess and improve this?
A: Use Mercury Intrusion Porosimetry (MIP) to quantify pore throat sizes. If throats are <2µm, diffusion is likely hindered. To improve permeability, introduce larger interstitial voids by adding a porogen (e.g., PEG 6000) at 10% w/w during synthesis. The table below summarizes key pore architecture targets for enzyme systems:
| Pore Type | Ideal Size Range | Primary Function | Optimal % of Total Volume |
|---|---|---|---|
| Macropores | 2 - 50 µm | Bulk fluid transport, reduced diffusion resistance | 60-70% |
| Mesopores | 2 - 50 nm | High surface area for enzyme attachment, substrate capture | 20-30% |
| Micropores | < 2 nm | Minimal; can cause trapping and steric hindrance | < 10% |
Q4: We are seeing inconsistent enzyme loading across different batches of our nanostructured zirconia material. What are the critical control parameters?
A: Inconsistent loading is 90% due to variations in surface hydroxyl (-OH) group density, which is the primary binding site. Strictly control: 1) Calcination temperature (±10°C tolerance), 2) Cooling atmosphere (always use dry N₂), and 3) Hydration time before use (soak in DI water for precisely 60 min). Confirm OH density using TGA-MS by measuring weight loss from 100-600°C attributed to dehydration.
Detailed Experimental Protocols
Protocol 1: Synthesis of Hierarchical Silica Monoliths with Tri-modal Porosity Objective: Create a scaffold with defined macro, meso, and microporosity for co-immobilization of multi-enzyme systems.
- Solution A: Mix 4.16g tetraethyl orthosilicate (TEOS) with 4.0g ethanol and 0.1M HCl (pH 1.5) under stirring for 1 hr at 60°C for pre-hydrolysis.
- Solution B: Dissolve 2.0g Pluronic F-127 (structure-directing agent) and 1.0g urea in 30g of 0.1M acetic acid buffer (pH 4.0).
- Combine Solutions A & B and stir for 2 mins. Add 1.5g of polyethylene oxide (PEO, MW 100kDa) as a macroporogen. Stir for 30 sec.
- Pour into polypropylene molds and incubate at 40°C for 24 hrs for gelation.
- Age the gel at 90°C for 48 hrs in a sealed container. This step develops the mesostructure.
- Wash with ethanol/water (3x) and perform solvent exchange with tert-butanol*.
- Lyophilize for 48 hrs.
- Calcinate in a muffle furnace using a ramped program: 1°C/min to 350°C, hold for 2 hrs, then 2°C/min to 550°C, hold for 4 hrs.
Protocol 2: Kinetic Assay for Quantifying Apparent Diffusion Limitations Objective: Determine the effectiveness factor (η) of an entrapped enzyme system.
- Prepare a standard curve for your product (e.g., p-nitrophenol for hydrolytic enzymes) via UV-Vis spectroscopy.
- Immobilize your enzyme using your standard protocol.
- In a stirred batch reactor, add a known mass of biocatalyst to a saturating substrate concentration (at least 10x Km).
- Measure initial reaction rate (V_obs) by taking 100µL aliquots every 30 sec for 5 mins, quenching, and assaying.
- Homogenize an identical mass of biocatalyst via sonication for 2 mins to destroy structural integrity.
- Measure the initial reaction rate of the homogenized sample (V_max).
- Calculate the Effectiveness Factor: η = Vobs / Vmax. An η < 0.8 indicates significant diffusion limitation requiring material redesign.
Diagrams
Decision Flow for Material Selection
Hierarchical Material Synthesis Workflow
The Scientist's Toolkit: Key Research Reagent Solutions
| Reagent/Material | Function | Key Consideration |
|---|---|---|
| Tetraethyl Orthosilicate (TEOS) | Primary silica precursor for sol-gel synthesis. Forms the oxide network. | Must be high-purity (>99%) and stored under anhydrous conditions to prevent premature hydrolysis. |
| Pluronic F-127 (PEO-PPO-PEO) | Structure-directing triblock copolymer. Creates ordered mesopores (2-10 nm). | Solution temperature must be kept below its critical micelle temperature (CMT) during initial mixing. |
| Polyethylene Oxide (PEO, MW 100kDa) | Macroporogen. Creates large, interconnected pores (5-50 µm) for enhanced permeability. | Molecular weight determines final macroporc size distribution. |
| Glutaraldehyde (25% Solution) | Homobifunctional crosslinker. Stabilizes enzymes on material surface, prevents leaching. | Always use fresh or freshly aliquoted solutions. Over-crosslinking ( >2hrs) can reduce enzyme activity. |
| tert-Butanol | Low surface tension solvent for solvent exchange prior to drying. Prevents pore collapse. | Must be anhydrous. Can be recovered and recycled by distillation. |
| Aminopropyltriethoxysilane (APTES) | Coupling agent. Introduces amine groups to oxide surfaces for covalent enzyme attachment. | Use in anhydrous toluene for monolayer functionalization; aqueous use creates polymerized multilayers. |
Technical Support Center
This support center addresses common experimental challenges in utilizing smart polymers to modulate solute diffusion for entrapped enzyme systems, a key methodology for overcoming diffusion barriers in biocatalysis and drug delivery.
Troubleshooting Guides
Issue 1: Inconsistent Solute Release Profiles from Temperature-Responsive Poly(N-isopropylacrylamide) (pNIPAM) Hydrogels.
- Problem: Observed release rate does not correlate sharply at the Lower Critical Solution Temperature (LCST).
- Potential Causes & Solutions:
- Cause: Imprecise temperature control at the gel-solution interface.
- Solution: Use a calibrated water bath with vigorous stirring. Verify temperature directly at the hydrogel surface with a micro-thermocouple.
- Cause: Non-uniform polymer network or incomplete crosslinking.
- Solution: Characterize hydrogel porosity via SEM. Ensure degassing of monomer solution before polymerization and validate crosslinker concentration via swelling ratio analysis.
- Cause: Solute hydrophobicity/hydrophilicity mismatch with polymer phase transition.
- Solution: Characterize solute logP. For hydrophobic solutes, consider copolymerizing pNIPAM with more hydrophilic monomers (e.g., acrylamide) to adjust the LCST and interaction.
- Cause: Imprecise temperature control at the gel-solution interface.
Issue 2: Poor Reversibility of pH-Responsive Poly(acrylic acid) (PAA) Based Systems.
- Problem: Swelling/deswelling and associated diffusion modulation is not fully reversible over multiple pH cycles.
- Potential Causes & Solutions:
- Cause: Insufficient ionic strength in buffer, leading to Donnan equilibrium effects dominating over pH response.
- Solution: Use buffers with ionic strength ≥ 0.1 M (e.g., phosphate, citrate) to screen electrostatic repulsion and ensure sharp transitions.
- Cause: Physical deformation or fracture of hydrogel during repeated swelling.
- Solution: Increase crosslinking density moderately or incorporate a mechanically reinforcing interpenetrating network (IPN). Monitor gel integrity visually and via rheology.
- Cause: Solute (enzyme) interacting irreversibly with charged polymer groups.
- Solution: Modify solute surface charge or incorporate a neutrally charged spacer (e.g., PEG) between the enzyme and the responsive polymer matrix.
- Cause: Insufficient ionic strength in buffer, leading to Donnan equilibrium effects dominating over pH response.
Issue 3: Low Efficiency of Light-Triggered Release from o-Nitrobenzyl (ONB) Functionalized Polymers.
- Problem: Incomplete solute release even after prolonged UV irradiation.
- Potential Causes & Solutions:
- Cause: Inadequate light penetration and scattering within the hydrogel.
- Solution: Use thinner hydrogel films (< 500 μm). Ensure light source wavelength (typically ~365 nm) matches the ONB absorption maximum. Consider using a two-photon excitation system for deeper tissue models.
- Cause: Quantum yield of photolysis is reduced in aqueous environment.
- Solution: Optimize polymer hydrophobic/hydrophilic balance to maintain a local microenvironment favorable for the photochemical reaction.
- Cause: Photocleavage byproducts modifying diffusion pathways.
- Solution: Characterize byproduct formation via HPLC/MS and test diffusion post-irradiation with a control solute to isolate network effects.
- Cause: Inadequate light penetration and scattering within the hydrogel.
Frequently Asked Questions (FAQs)
Q1: How do I accurately determine the effective diffusion coefficient (Deff) of a substrate through my smart polymer hydrogel? A: The most common method is using a Franz diffusion cell. Monitor solute concentration in the receiver chamber over time. Apply Fick's second law; the initial slope of the solute amount (Mt) vs. square root of time (t^1/2) plot is linear and related to Deff. Ensure sink conditions are maintained.
Q2: My temperature-responsive gel collapses but doesn't significantly accelerate enzyme substrate diffusion. Why? A: Collapse can create a dense, skin-like outer layer that traps solute inside (case II transport). This is a common diffusion limitation. To counteract this, copolymerize with ionic monomers or create macroporous structures via cryogelation to ensure expulsion of pore fluid and open channels.
Q3: Can I combine two stimuli (e.g., pH AND temperature) in one polymer for orthogonal control? A: Yes. These are "dual-responsive" polymers. For example, copolymerizing NIPAM (thermo-responsive) with acrylic acid (pH-responsive) creates a system where the LCST is itself dependent on pH. This allows for precise, multi-parameter diffusion tuning.
Q4: What is the best method to entrap enzymes without losing activity in these polymers? A: In situ entrapment during polymer network formation is common but exposes enzymes to radicals/heat. Preferred methods are: 1) Post-loading via swelling: Soak pre-formed, sterile hydrogel in enzyme solution at a pH favoring absorption. 2) Initiator-free photografting: Use polymers with photo-activable groups (e.g., benzophenone) to graft the polymer around the enzyme under mild UV.
Q5: How do I choose between bulk gels, microgels, and polymer brushes for diffusion studies? A: Bulk gels (>1mm) are for fundamental diffusion and sustained release studies. Microgels/Nanogels (100nm-10μm) offer rapid response and large surface area, ideal for in vitro cellular uptake or catalysis in flow. Polymer brushes (surface-grafted) are used to study 2D interfacial diffusion and create "gating" membranes.
Key Experimental Data
Table 1: Characteristic Parameters of Common Smart Polymers for Diffusion Control
| Polymer | Primary Stimulus | Critical Value (e.g., LCST, pKa) | Typical Response Time Scale | Key Application for Enzyme Diffusion |
|---|---|---|---|---|
| pNIPAM | Temperature | LCST ≈ 32°C | Seconds to Minutes | On/off substrate access to entrapped enzyme |
| Poly(acrylic acid) (PAA) | pH | pKa ≈ 4.5-5.0 | Minutes | Charge-based exclusion/adsorption of substrates |
| Poly(diethylaminoethyl methacrylate) (PDEAEMA) | pH | pKa ≈ 7.0-7.5 | Minutes | Pore gating near physiological pH |
| o-Nitrobenzyl (ONB) crosslinked polymers | Light (UV) | λ ≈ 340-365 nm | Milliseconds to Seconds | Spatiotemporally precise burst release of substrate |
Table 2: Comparison of Diffusion Measurement Techniques
| Technique | Measured Parameter | Throughput | Approx. Cost | Best for Polymer Type |
|---|---|---|---|---|
| Franz Diffusion Cell | Effective Diffusion Coeff. (Deff) | Low | $$ | Bulk hydrogels, membranes |
| Fluorescence Recovery After Photobleaching (FRAP) | Local Diffusion Coefficient | Medium | $$$ | Microgels, thin films, in situ |
| Dynamic Light Scattering (DLS) | Hydrodynamic Radius (Rh) change | High | $$ | Nanoparticles, microgels in suspension |
| Pulsed Field Gradient NMR | Self-diffusion coefficient | Low | $$$$ | Transparent/opaque gels, no label needed |
Experimental Protocol: Characterizing pH-Modulated Diffusion using a Franz Cell
Objective: To measure the effective diffusion coefficient (Deff) of a model substrate (e.g., glucose) through a poly(acrylic acid) hydrogel at pH 4.0 and 7.4.
Materials (Research Reagent Solutions):
- Poly(acrylic acid) hydrogel disc: Synthesized via free-radical polymerization, 10 mm diameter, 1 mm thickness.
- Franz diffusion cells: Receptor volume 5-7 mL, effective diffusion area ~1 cm².
- Phosphate Buffered Saline (PBS): 0.01 M, pH 7.4, ionic strength adjusted to 0.15 M with NaCl.
- Citrate-phosphate buffer: 0.01 M, pH 4.0, ionic strength adjusted to 0.15 M with NaCl.
- Model substrate stock solution: 100 mM glucose in respective buffer.
- Glucose assay kit: (e.g., GOPOD enzymatic colorimetric assay).
- Microplate reader or spectrophotometer.
- Water bath & magnetic stirrers: Maintained at 37°C ± 0.2°C.
Procedure:
- Hydration: Equilibrate PAA hydrogel discs in respective buffers (pH 4.0 or 7.4) for 24h at 4°C.
- Assembly: Place hydrated hydrogel disc between donor and receptor chambers of the Franz cell. Ensure no air bubbles. Fill receptor chamber completely with degassed buffer. Apply a gentle vacuum to the donor port to ensure full contact.
- Baseline: Replace receptor fluid with fresh, degassed buffer. Place cell in water bath with magnetic stirring.
- Donor Application: Carefully add 1 mL of 100 mM glucose solution in the corresponding pH buffer to the donor chamber.
- Sampling: At predetermined time intervals (e.g., 0, 15, 30, 60, 120, 180, 240 min), withdraw 200 µL aliquot from the receptor port and replace immediately with an equal volume of fresh, pre-warmed buffer.
- Analysis: Quantify glucose concentration in each aliquot using the GOPOD assay per manufacturer's instructions (incubate sample with reagent, measure absorbance at 510 nm).
- Calculation: Plot cumulative amount of glucose permeated per unit area (Q, µg/cm²) against square root of time (t^1/2, min^1/2). The linear portion's slope (S) is used to calculate Deff: Deff = (π * S²) / (4 * C₀²), where C₀ is the initial donor concentration.
Visualizations
Title: Troubleshooting Logic Flow for Failed Diffusion Modulation
Title: pH-Triggered Diffusion Control Mechanism in PAA Hydrogels
The Scientist's Toolkit: Key Research Reagent Solutions
| Item | Function & Relevance to Diffusion Modulation |
|---|---|
| N-Isopropylacrylamide (NIPAM) | Primary monomer for thermosensitive pNIPAM hydrogels. Purify by recrystallization for sharp LCST. |
| N,N'-Methylenebis(acrylamide) (BIS) | Common crosslinker. Concentration directly controls hydrogel mesh size (ξ) and thus Deff. |
| 2-Hydroxy-4'-(2-hydroxyethoxy)-2-methylpropiophenone (Irgacure 2959) | UV photoinitiator for cytocompatible, free-radical polymerization for in situ enzyme entrapment. |
| o-Nitrobenzyl (ONB) crosslinker (e.g., NB ester) | Photocleavable crosslinker. UV irradiation severs links, increasing ξ and Deff for light-triggered release. |
| D-(+)-Glucose | Common, inert, and easily assayed model hydrophilic solute for fundamental diffusion studies. |
| Fluorescein Isothiocyanate (FITC)-Dextran Conjugates | Size-defined, fluorescently labeled polysaccharides for visualizing and quantifying diffusion via FRAP/CLSM. |
| Phosphate & Citrate Buffer Salts | For precise pH control. Critical: Adjust ionic strength to >0.1M for consistent pH-response. |
| Enzymatic Glucose (GOPOD) Assay Kit | For sensitive, specific, and quantitative measurement of glucose diffusion in receiver solutions. |
Technical Support Center
Troubleshooting Guides & FAQs
Q1: Our co-immobilized multi-enzyme system shows a rapid decline in activity after just a few reaction cycles, despite successful initial immobilization. What could be causing this? A: This is a common issue often related to cofactor instability or leakage. NAD(P)H and ATP analogs are particularly prone to degradation or diffusion out of the immobilization matrix. Solution: Implement a covalent tethering strategy for the cofactor. Use chemically modified cofactors (e.g., NAD⁺-aminated) that can be linked to the carrier or to a polymer backbone (like polyethyleneimine) before co-entrapment with enzymes. Ensure your encapsulation hydrogel (e.g., alginate, silica) has a pore size small enough to retain the cofactor-polymer conjugate.
Q2: We are not observing the expected rate enhancement from substrate channeling in our spatially organized enzyme cascade. What should we check? A: The expected kinetic enhancement relies on precise inter-enzyme distances. Troubleshooting Steps:
- Verify Proximity: Use fluorescence resonance energy transfer (FRET) pairs tagged to your enzymes to confirm successful co-localization within the scaffold.
- Check Orientation: Random immobilization can block active sites. Switch to a site-specific immobilization method (e.g., using SNAP-tags, SpyTag/SpyCatcher, or His-tag/Ni-NTA定向 immobilization) to ensure active sites are aligned for optimal intermediate transfer.
- Assay Order: Perform control assays for each enzyme individually after co-immobilization to confirm each remains active.
Q3: Diffusion limitations in our agarose-based entrapment system are severe, leading to low overall throughput. How can we mitigate this? A: This directly addresses the core thesis of diffusion limitations. Solutions:
- Introduce Porosity: Create a macroporous structure by incorporating and later leaching out a porogen (e.g., PEG, salt crystals) during gel formation.
- Reduce Carrier Size: Scale down from monolithic gels to micro-sized beads or particles to minimize internal diffusion path lengths.
- Utilize Electrostatic Guidance: If your substrates/intermediates are charged, use a charged immobilization matrix (e.g., chitosan, modified alginate) to attract and guide substrate flow via electrostatic forces, enhancing local concentration.
Q4: How do we determine the optimal ratio of enzymes and cofactors to co-immobilize for a given cascade? A: There is no universal ratio, but a systematic approach is required.
- Kinetic Modeling: Start with a simple model based on the Km and kcat of each free enzyme. The rate-limiting enzyme often requires a higher molar amount.
- Experimental Design: Co-immobilize a series of ratios (e.g., 1:1, 1:2, 2:1) and measure overall cascade productivity.
- Account for Immobilization Yield: Always measure the actual immobilization yield (%) for each component, as adsorption/entrapment efficiency may differ. The final local ratio on the carrier is what matters.
Key Experimental Protocols
Protocol 1: Co-immobilization of Glucose-6-Phosphate Dehydrogenase (G6PDH) and Hexokinase (HK) with PEI-Tethered NADP⁺ in Alginate Microbeads Objective: Create a substrate-channeling system for glucose phosphorylation and subsequent oxidation with cofactor recycling.
Cofactor Tethering:
- Dissolve 10 mg of amino-NADP⁺ in 1 mL of 0.1 M MES buffer (pH 6.0).
- Add 10 mg of branched Polyethylenimine (PEI, 25 kDa) and 15 mg of EDC (1-ethyl-3-(3-dimethylaminopropyl)carbodiimide). React for 2 hours at room temperature with gentle stirring.
- Purify the PEI-NADP⁺ conjugate via dialysis (MWCO 10 kDa) against 50 mM HEPES buffer (pH 7.5) overnight.
Enzyme Preparation:
- Dialyze purified G6PDH and HK into the same HEPES buffer.
Co-immobilization:
- Mix the following in 1.5 mL of HEPES buffer: 20 U of G6PDH, 20 U of HK, and 2 mL of the purified PEI-NADP⁺ conjugate.
- Add this mixture dropwise via a syringe pump into a stirred 100 mM CaCl₂ solution containing 2% (w/v) sodium alginate.
- Stir gently for 30 minutes to allow bead hardening.
- Collect beads by sieving, wash extensively with HEPES buffer, and store at 4°C.
Protocol 2: Assembling a Three-Enzyme Cascade on a DNA Origami Scaffold for Precise Distance Control Objective: To study the direct effect of nanometer-scale inter-enzyme distance on channeling efficiency.
Enzyme Functionalization:
- Chemically modify each enzyme (E1, E2, E3) with a unique, single-stranded DNA handle using NHS-chemistry and maleimide-thiol coupling.
DNA Origami Assembly:
- Order a custom 100 nm x 70 nm rectangular DNA origami scaffold (from a commercial oligo provider) with three distinct "docking" strands positioned at pre-defined distances (e.g., 10 nm, 20 nm, 50 nm).
- Assemble the scaffold by annealing the M13mp18 scaffold strand with a 10-fold excess of staple strands in a thermal cycler (ramp from 80°C to 25°C over 12 hours).
Hierarchical Assembly:
- Mix the DNA-functionalized enzymes with the assembled origami scaffold at a 1:1 molar ratio (enzyme: docking site) in assembly buffer (Tris + Mg²⁺).
- Incubate at 30°C for 1 hour.
- Purify the final construct using agarose gel electrophoresis or PEG precipitation to remove unbound enzymes.
Data Presentation
Table 1: Comparison of Immobilization Matrices for Cofactor Retention
| Matrix Material | Cofactor Linkage Method | Cofactor Leakage (% after 10 cycles) | Relative Cascade Activity (%) | Best Use Case |
|---|---|---|---|---|
| Calcium Alginate | Physical Entrapment | 45-60% | 100 (Baseline) | Low-cost, simple cascades |
| Silica Sol-Gel | Covalent (APTES-glutaraldehyde) | 10-20% | 180 | Organic solvent stability |
| Chitosan Beads | Ionic (PEI-NADP⁺吸附) | 15-25% | 220 | Charged substrate guidance |
| Porous MOF (ZIF-8) | In-situ Encapsulation | <5% | 250 | Ultra-stable, size-selective systems |
| DNA Origami | Programmable Attachment | ~0% (tethered) | 300* | Fundamental distance studies |
*Activity highly dependent on precise nanometer-scale design.
Table 2: Troubleshooting Common Co-immobilization Problems
| Observed Problem | Potential Root Cause | Diagnostic Test | Recommended Fix |
|---|---|---|---|
| Low overall yield | Enzyme inactivation during immobilization | Assay each enzyme's activity post-immobilization | Gentler immobilization (e.g., affinity tags, slower sol-gel), add stabilizers (BSA, trehalose) |
| No channeling benefit | Enzymes immobilized too far apart | FRET or SEM imaging of enzyme distribution | Use scaffolds (nanoparticles, polymers) with high density of binding sites |
| Product inhibition | Final product cannot diffuse out | Measure intra-bead vs. bulk product concentration | Increase matrix porosity; add a product-removing enzyme to the cascade |
| Uneven enzyme distribution | Aggregation or poor mixing during gelation | Confocal microscopy of fluorescently labeled enzymes | Pre-mix enzymes thoroughly, use rapid gelation (e.g., photo-crosslinking) |
Visualizations
Diagram Title: Overcoming Diffusion Limits via Co-immobilization & Channeling
Diagram Title: Co-immobilization Experimental Workflow
The Scientist's Toolkit: Key Research Reagent Solutions
| Item | Function/Description | Example Use Case |
|---|---|---|
| Amino-Modified Cofactors (e.g., NH2-NAD+) | Enables covalent tethering to carriers or polymers via amine-reactive crosslinkers. | Preventing cofactor leakage in porous gels. |
| Branched Polyethylenimine (PEI) | Cationic polymer used to create a local "charge cloud" for adsorbing enzymes and conjugating cofactors. | Creating electrostatic substrate guidance and cofactor retention. |
| Heterobifunctional Crosslinkers (e.g., Sulfo-SMCC, NHS-PEG-Maleimide) | For controlled, oriented immobilization. One end reacts with a carrier/酶, the other with a specific tag/group. | Site-specific enzyme attachment to nanoparticles or scaffolds. |
| DNA Oligo Modification Kits (NHS-DNA, Maleimide-DNA) | Attaches unique single-stranded DNA handles to proteins for programmable assembly. | Precise positioning on DNA origami or nanoparticle scaffolds. |
| Porous Micro/Nano Carriers (e.g., mesoporous silica, MOF particles like ZIF-8) | High-surface-area scaffolds with tunable pore sizes for enzyme encapsulation and diffusion control. | Co-encapsulation of enzymes and cofactors with minimal leaching. |
| Fluorescent Protein/Dye Conjugates (e.g., GFP, mCherry, Alexa Fluor tags) | For visualizing enzyme distribution and proximity via FRET or confocal microscopy. | Diagnosing poor co-localization in a co-immobilized system. |
| Photo-crosslinkable Hydrogels (e.g., methacrylated gelatin, PEGDA) | Allow rapid, spatial control over gelation using UV light, enabling patterned immobilization. | Creating gradient or compartmentalized co-immobilization structures. |
Troubleshooting Guides & FAQs
Q1: After tethering my enzyme to the functionalized surface, I observe a significant loss (>70%) of specific activity compared to the free enzyme in solution. What could be the cause and how can I troubleshoot this? A: This is a common issue often related to improper orientation or surface-induced denaturation.
- Check Orientation: If using a His-tag/NTA or streptavidin-biotin tether, ensure the tethering site on the enzyme is distal from the active site. Use a different tag (e.g., switch from C-terminal to N-terminal) or a longer, more flexible linker/spacer arm (e.g., PEG) to allow for better conformational freedom.
- Assess Surface Chemistry: The functionalized surface may be too hydrophobic or charged, causing partial unfolding. Characterize the surface with techniques like water contact angle or ζ-potential. Try a different surface coating (e.g., a hydrophilic PEG-based monolayer) to create a more bio-friendly interface.
- Verify Protocol: Ensure your washing steps post-tethering are not too harsh. Use gentle buffer exchange without excessive shaking. Confirm immobilization yield via a protein assay (e.g., BCA) on the supernatant and wash fractions.
Q2: My entrapped enzyme system shows excellent stability but very low apparent reaction rates, suggesting severe diffusion limitation. How can I confirm and mitigate this? A: This is the core challenge of bulk entrapment.
- Diagnose: Perform a Thiele modulus analysis. Measure the reaction rate at varying particle sizes of your entrapping matrix (e.g., silica beads, hydrogel particles). If the observed rate increases significantly as you reduce particle size, internal diffusion is limiting.
- Mitigate via Design:
- Reduce Diffusion Path: Use smaller entrapment particles, create thinner membranes, or use monolithic structures with macropores.
- Increase Porosity: Optimize your polymerization or gelation conditions to create a more open pore network. For polyacrylamide gels, reduce the total monomer concentration (%T).
- Utilize Nanoporous Materials: Consider ordered mesoporous silicas (e.g., SBA-15) with uniform, tunable pore sizes that can be selected to match your enzyme's dimensions, reducing dead volume.
Q3: When comparing tethered vs. entrapped enzymes, my kinetic parameters (Km,app, Vmax,app) are inconsistent across replicate experiments. What are the key controls I might be missing? A: Inconsistency often stems from unmeasured variations in enzyme loading or accessibility.
- For Surface Tethering:
- Quantify Surface Density: Use a technique like quartz crystal microbalance (QCM), spectroscopic ellipsometry, or a labeled protein assay to measure the exact amount of enzyme immobilized per unit area for each experiment. Normalize your activity data to this density.
- Control Nonspecific Binding: Always run a control on a non-functionalized but otherwise identical surface. Subtract any background activity.
- For Bulk Entrapment:
- Measure Entrapment Efficiency Consistently: For every batch, quantify the amount of enzyme in the loading solution versus the wash solutions post-entrapment to calculate the precise loading percentage.
- Standardize Matrix Geometry: Ensure the physical form (bead size, membrane thickness) is identical. Sieve beads to a narrow size range or use a precision mold for membranes/hydrogels.
Q4: My tethered enzyme loses activity rapidly over multiple use cycles, while the entrapped one remains stable. Is this expected and how can I improve tethering stability? A: Surface-tethered enzymes can be more susceptible to shear forces and interfacial inactivation.
- Reinforce the Link: Ensure your covalent bond (e.g., amine-coupling via EDC/NHS) is stable at your operational pH. Consider using more stable chemistries like epoxide or thiol-ene coupling if applicable.
- Multipoint Attachment: A single-point tether can allow the enzyme to "flop" and denature. Use a surface with moderate functional group density or an enzyme with multiple tags to allow for gentle multipoint attachment, stabilizing the 3D structure.
- Add a Protective Layer: After tethering, consider passivating the surrounding surface with a blocking agent (e.g., BSA, casein, or ethanolamine) and/or applying an ultra-thin permeable hydrogel coating (like a sol-gel silicate layer) to create a protective nanoenvironment.
Research Reagent Solutions Toolkit
| Reagent/Material | Primary Function in This Context |
|---|---|
| NHS-PEGn-Maleimide | A heterobifunctional crosslinker with a flexible PEG spacer. Used for oriented, single-point tethering of cysteine-containing enzymes to amine-functionalized surfaces, reducing steric hindrance. |
| Ni-NTA Functionalized Surfaces (Gold chips, silica beads) | Allows for oriented, reversible immobilization of His-tagged enzymes via coordination chemistry. Enables study of the effect of controlled orientation on activity. |
| Aminopropyltriethoxysilane (APTES) | A common silanizing agent used to introduce primary amine groups onto oxide surfaces (e.g., glass, silica) for subsequent covalent enzyme coupling. |
| Tetraethyl orthosilicate (TEOS) | A precursor for sol-gel entrapment. Hydrolyzes and condenses to form a porous silica network that physically encapsulates enzymes, protecting them from aggregation and leaching. |
| Polyethylene glycol diacrylate (PEGDA) | A photocrosslinkable polymer used to form hydrogels for gentle entrapment of enzymes. Pore size can be tuned by molecular weight and concentration. |
| Mesoporous Silica SBA-15 | A scaffold with uniform, tunable hexagonal pores (5-30 nm). Ideal for studying the effect of pore confinement on enzyme stability and diffusion, bridging surface and bulk effects. |
| EDC (1-Ethyl-3-(3-dimethylaminopropyl)carbodiimide) | A carbodiimide crosslinker used with NHS to activate carboxyl groups for covalent coupling to primary amines on surfaces or other molecules. |
| Pluronic F-127 | A non-ionic triblock copolymer surfactant. Used as a pore-directing agent in sol-gel synthesis or as an additive to reduce nonspecific adsorption on surfaces. |
Table 1: Comparative Performance Metrics of Enzyme Immobilization Strategies
| Parameter | Free Enzyme (Solution) | Surface-Tethered (Oriented) | Bulk Entrapment (Sol-Gel) | Entrapped in Mesoporous Silica (SBA-15) |
|---|---|---|---|---|
| Immobilization Yield (%) | N/A | 60 - 85 | 70 - 95 | 80 - 99 |
| Activity Retention (%) | 100 (Reference) | 20 - 70 | 30 - 60 | 40 - 80 |
| Apparent Km (Relative Increase) | 1x | 1.5x - 5x | 3x - 10x | 2x - 8x |
| Thermal Stability (t½ at 60°C) | 2 hr | 5 - 15 hr | 8 - 48 hr | 20 - 100 hr |
| Operational Stability (Cycles to 50% Activity) | N/A | 5 - 20 | 10 - 30 | 15 - 50 |
| Effective Diffusivity of Substrate (Dₑ/D₀) | 1 | ~1 (External film only) | 0.01 - 0.2 | 0.1 - 0.5 |
Table 2: Key Protocol Variables and Their Impact
| Immobilization Method | Critical Variable | Typical Optimal Range | Impact of Deviation |
|---|---|---|---|
| Covalent Tethering | Surface Functional Group Density | 0.1 - 1 groups/nm² | Too low: poor loading. Too high: multipoint binding, denaturation, crowding. |
| Affinity Tethering (NTA-Ni²⁺) | Ionic Strength (Buffer) | 50 - 150 mM NaCl | Too low: nonspecific binding. Too high: weakening of His-tag-Ni²⁺ interaction. |
| Sol-Gel Entrapment | Water:Precursor (R value) | R = 4 - 10 (molar ratio) | Lower R: dense, small pores (high diffusion limit). Higher R: fragile, large pores (potential leaching). |
| Hydrogel Entrapment | Polymer % (w/v) | 5% - 15% PEGDA | Lower %: large pores, low diffusion limit but possible leaching. Higher %: small pores, high diffusion limit. |
Detailed Experimental Protocols
Protocol 1: Controlled Orientation Tethering via His-Tag on a Gold Sensor Chip Objective: To immobilize a His-tagged enzyme with a defined orientation on a Ni-NTA gold chip for surface plasmon resonance (SPR) or activity studies.
- Surface Preparation: Clean the Ni-NTA sensor chip with a 2% (v/v) SDS rinse, followed by extensive washing with deionized water and ethanol. Dry under a stream of N₂.
- Chelation: Inject a 0.5 mM NiCl₂ solution in water over the chip surface for 5 minutes to charge the NTA groups with Ni²⁺ ions.
- Enzyme Loading: Dilute the purified His-tagged enzyme in a running buffer (e.g., HBS-P, 10 mM HEPES, 150 mM NaCl, pH 7.4). Inject the enzyme solution (typical concentration 10-50 µg/mL) over the chip at a low flow rate (5-10 µL/min) for 10-15 minutes.
- Washing & Stabilization: Rinse with running buffer for 10 minutes to remove non-specifically bound protein. Optionally, inject a 0.35 M EDTA solution for 1 minute to remove any enzyme bound via nonspecific metal interactions, then re-inject NiCl₂.
- Activity Assay: Switch to the appropriate reaction buffer and introduce the substrate solution while monitoring the SPR response or collecting effluent for product quantification.
Protocol 2: Enzyme Entrapment in a Tetraethyl Orthosilicate (TEOS)-Based Silica Sol-Gel Objective: To encapsulate an enzyme within a macro/mesoporous silica monolith for batch or column reactor studies.
- Precursor Mix: In a polypropylene vial, mix 4.0 mL of TEOS, 1.0 mL of deionized water, and 0.1 mL of 0.1M HCl. Sonicate or stir vigorously for 60 minutes at room temperature until the mixture becomes clear and homogeneous (partial hydrolysis).
- Enzyme Addition: Cool the hydrolyzed sol on ice. In a separate vial, mix 1.0 mL of enzyme solution (in a buffered, aqueous solution at 2-4x the desired final concentration) with 1.0 mL of a cold 100 mM sodium phosphate buffer, pH 7.0.
- Gelation: Rapidly add the cold enzyme/buffer mixture to the cold hydrolyzed sol. Mix gently but thoroughly for 30 seconds. Quickly pipet the mixture into the desired mold (e.g., a 24-well plate, capillary). Gelation occurs within 2-10 minutes on ice.
- Aging & Drying: Seal the molds and allow the gels to age at 4°C for 24-48 hours. Carefully remove the wet gels and air-dry them slowly at 4°C for 3-7 days. The resulting xerogels can be crushed and sieved to a desired particle size.
Visualizations
Title: Enzyme Immobilization Types and Diffusion Paths
Title: Troubleshooting Flowchart for Tethered Enzyme Activity
Technical Support Center: Troubleshooting & FAQs
This technical support center is framed within a thesis addressing diffusion limitations in entrapped enzyme systems. The advanced fabrication methods detailed here are pivotal for creating controlled, hierarchical architectures that enhance mass transfer and substrate accessibility.
Frequently Asked Questions (FAQs) & Troubleshooting
Q1: During 3D bioprinting of enzyme-laden hydrogels, my constructs lack structural integrity and collapse. What could be the cause? A: This is often a crosslinking issue. Ensure your bioink has adequate mechanical properties pre-crosslinking. For ionic crosslinking (e.g., alginate with Ca²⁺), verify the concentration and pH of the crosslinking solution. For photo-crosslinkable bioinks (e.g., GelMA), check the photoinitiator concentration (e.g., LAP) and ensure UV light intensity and exposure time are calibrated. Increasing the polymer concentration or adding a temporary support polymer like Pluronic F-127 can improve print fidelity.
Q2: My electrospun fibers for enzyme immobilization are beaded and inconsistent, not forming a uniform mat. How do I resolve this? A: Bead formation typically indicates an imbalance in electrospinning parameters. Key factors to troubleshoot are:
- Polymer Solution Viscosity: Too low viscosity promotes bead formation. Increase polymer concentration.
- Solvent Volatility: Use a solvent system with appropriate volatility. A mix of high and low volatility solvents (e.g., DMF and Chloroform) can stabilize the jet.
- Applied Voltage: Optimal voltage is critical. Too high a voltage can cause instability. Adjust in 2-5 kV increments.
- Flow Rate: A flow rate that is too high does not allow sufficient time for solvent evaporation, leading to wet, beaded fibers. Reduce the flow rate gradually.
Q3: The enzymatic activity of my entrapped system decreases dramatically post-fabrication. Are the fabrication methods deactivating the enzyme? A: Yes, fabrication-induced deactivation is a major diffusion limitation. Mitigation strategies include:
- 3D Bioprinting: Use milder crosslinking conditions. For UV crosslinking, employ longer wavelengths (365-405 nm vs 254 nm) and lower intensity. Consider two-step crosslinking or post-printing diffusion-based crosslinking.
- Electrospinning: Use aqueous-based co-axial electrospinning to encapsulate the enzyme in a protective core (polymer A) while the shell (polymer B) forms the fiber. This shields the enzyme from harsh organic solvents or rapid pH changes in the shell solution.
Q4: How can I quantitatively assess the diffusion limitations in my 3D printed or electrospun scaffold? A: Perform a Michaelis-Menten kinetic analysis comparing free vs. entrapped enzyme. Calculate the Effectiveness Factor (η), which is the ratio of the reaction rate of the entrapped enzyme to that of the free enzyme under identical conditions. An η < 1 indicates diffusion limitations. Measure substrate concentration gradients within the scaffold using microsensors or confocal microscopy with fluorescent substrates.
Key Experimental Protocols
Protocol 1: Co-axial Electrospinning for Core-Shell Enzyme Encapsulation Objective: To create continuous fibrous mats with enzymes protected in the aqueous core.
- Solution Preparation: Prepare the shell polymer solution (e.g., 10% w/v PCL in DCM:DMF 70:30). Prepare the core solution containing the enzyme in a biocompatible aqueous buffer (e.g., PBS).
- Setup Configuration: Load solutions into separate syringes. Use a co-axial spinneret, connecting the core solution to the inner needle and the shell to the outer needle.
- Electrospinning Parameters: Set flow rates (Core: 0.1-0.3 mL/h, Shell: 1.0-1.5 mL/h). Apply high voltage (12-18 kV). Maintain a tip-to-collector distance of 15-20 cm. Use a rotating mandrel (≈500 rpm) to collect aligned fibers.
- Post-processing: Vacuum-dry scaffolds for 24h to remove residual solvents.
Protocol 2: 3D Bioprinting & Post-Printing Crosslinking for Enzyme Entrapment Objective: To fabricate a structurally defined gel scaffold with high enzyme viability.
- Bioink Formulation: Dissolve 8% w/v alginate and 4% w/v gelatin in enzyme-compatible buffer. Mix thoroughly with the enzyme solution at 4°C.
- Printing: Use a temperature-controlled (18-22°C) extrusion bioprinter. Print into a pre-cooled printing bed.
- Post-Printing Crosslinking: Immerse the printed construct in a 2% w/v CaCl₂ solution for 5-10 minutes for ionic crosslinking of alginate. Then, incubate in a genipin solution (0.5 mM) for 12-24h at 37°C for covalent crosslinking of gelatin, enhancing long-term stability.
Table 1: Comparison of Fabrication Method Impact on Enzyme Activity
| Parameter | Free Enzyme (Control) | 3D Bioprinted Entrapment (Alginate/Gelatin) | Co-axial Electrospun Entrapment (PCL/Aqueous Core) |
|---|---|---|---|
| Immobilization Yield (%) | N/A | 85 ± 5 | 70 ± 8 |
| Activity Retention (%) | 100 | 65 ± 7 | 80 ± 6 |
| Apparent Km (mM) | 1.0 ± 0.1 | 2.5 ± 0.3 | 1.8 ± 0.2 |
| Effectiveness Factor (η) | 1.0 | 0.62 | 0.75 |
| Operational Half-life (hours) | 12 | 48 | 72 |
Table 2: Optimized Electrospinning Parameters for Common Polymers
| Polymer | Solvent System | Concentration (w/v%) | Voltage (kV) | Flow Rate (mL/h) | Target Fiber Diameter (nm) |
|---|---|---|---|---|---|
| PCL | DCM:DMF (70:30) | 10-12 | 12-15 | 1.0-1.5 | 300-700 |
| PLGA | Hexafluoro-2-propanol | 8-10 | 15-18 | 0.8-1.2 | 200-500 |
| PVA (Aqueous) | Water | 7-9 | 10-12 | 0.3-0.5 | 150-300 |
The Scientist's Toolkit: Research Reagent Solutions
| Item | Function in Context of Enzyme Entrapment |
|---|---|
| Alginate (High G-Content) | Bioink polymer; forms gentle ionic hydrogel with Ca²⁺, preserving enzyme structure. |
| Gelatin Methacryloyl (GelMA) | Photo-crosslinkable bioink; provides cell-adhesive motifs and tunable mechanical properties. |
| Lithium Phenyl-2,4,6-trimethylbenzoylphosphinate (LAP) | Biocompatible photoinitiator for UV crosslinking of GelMA et al. (365-405 nm). |
| Polycaprolactone (PCL) | A common, biodegradable polymer for electrospinning; provides robust fibrous scaffolds. |
| Genipin | Natural, low-toxicity crosslinker for polymers with amine groups (e.g., gelatin, chitosan). |
| Fluorescent Tagged Dextran | Used as a model substrate in diffusion studies to visualize and quantify transport limitations. |
Visualizations
Title: Strategy to Overcome Diffusion Limits
Title: Mass Transfer Pathway in Entrapped Systems
Technical Support Center: Troubleshooting & FAQs
This support center addresses common experimental challenges within the thesis framework of overcoming diffusion limitations in entrapped enzyme systems for bioreactors, biosensors, and therapies.
FAQ & Troubleshooting Guide
Q1: In my packed-bed enzyme bioreactor, I observe a sharp decline in conversion efficiency after only 20 hours, despite theoretical enzyme stability being >100 hours. What is the most likely cause? A: This is a classic symptom of severe internal diffusion limitation combined with possible substrate/product fouling. The high initial activity creates a local acidic/alkaline microenvironment or product buildup within the carrier matrix, leading to rapid local enzyme denaturation. Thesis Context: This underscores the kinetic-diffusion trade-off; high enzyme loading exacerbates diffusion gradients. Troubleshooting Steps:
- Measure Gradient: Insert a microsensor probe at the reactor inlet and within the bed center to measure pH/product concentration.
- Reduce Loading: Decrease the immobilized enzyme loading by 50% and test activity longevity.
- Modify Carrier: Switch to a more porous, macroreticular carrier or introduce larger pore channels.
Q2: My enzyme-based electrochemical biosensor shows signal attenuation and increased hysteresis with repeated use. How can I restore consistent performance? A: This indicates biofouling of the electrode surface and/or leaching of the entrapped enzyme, creating diffusion barriers for the electron mediator or product. Thesis Context: Unstable entrapment leads to variable diffusion path lengths, corrupting signal calibration. Troubleshooting Steps:
- Clean Electrode: Gently polish the electrode with 0.05 µm alumina slurry and rinse thoroughly.
- Check Entrapment Matrix: Apply a secondary stabilizing layer (e.g., Nafion or polyurethane membrane) over the enzyme layer to prevent leaching.
- Calibrate: Perform a fresh 5-point calibration. If slope is reduced >15%, reconfigure the enzyme layer.
Q3: For an enzyme-loaded hydrogel therapeutic, how can I experimentally determine if the reaction rate is limited by substrate diffusion into the bead versus the enzyme kinetics itself? A: Perform a Weisz-Prater or Thiele Modulus analysis using a batch experiment. Experimental Protocol:
- Prepare a uniform batch of enzyme-loaded hydrogel beads.
- In a stirred batch reactor, measure the initial reaction rate at varying substrate concentrations under constant, vigorous agitation.
- Repeat the experiment with the same amount of free enzyme in solution.
- Compare the observed effectiveness factor (η): η = (Rateimmobilized) / (Ratefree).
- If η ≈ 1, kinetics are rate-limiting.
- If η << 1, internal diffusion is limiting. Data Table: Diagnostic Effectiveness Factors
| Effectiveness Factor (η) | Limitation Regime | Suggested Action |
|---|---|---|
| > 0.9 | Kinetic Limitation | Optimize enzyme activity or concentration. |
| 0.3 - 0.9 | Mixed Limitation | Consider smaller particle size or higher porosity. |
| < 0.3 | Severe Diffusion Limitation | Redesign carrier matrix (porosity, particle size). |
Q4: What is the optimal method to quantify enzyme leakage from an alginate/CaCl2 entrapment matrix over a 7-day operational period? A: Use a direct activity assay on the supernatant combined with a protein-specific stain. Experimental Protocol:
- Setup: Incubate your entrapped enzyme preparation in the operational buffer (without substrate) under standard reactor conditions (pH, T, agitation).
- Sample: At defined intervals (0, 12, 24, 72, 168 hrs), centrifuge a sample and collect the supernatant.
- Assay: a. Activity Assay: Add substrate to the supernatant and measure product formation rate. Compare to a standard curve of free enzyme. b. Protein Assay (Bradford): Quantify total protein in the supernatant to distinguish active from denatured enzyme leakage.
- Calculate: Express leaked enzyme as a percentage of initially loaded activity/protein.
Key Experimental Protocols
Protocol 1: Determining the Apparent Kinetic Parameters (Kmapp, Vmaxapp) for Immobilized Enzymes Purpose: To obtain kinetic constants under diffusion-affected conditions for bioreactor modeling. Methodology:
- Prepare immobilized enzyme particles of defined size and loading.
- In a well-mixed, temperature-controlled batch vessel, add a known mass of particles to a substrate solution.
- Measure initial reaction rates (v0) at a minimum of eight different substrate concentrations ([S]).
- Fit the v0 vs. [S] data to the Michaelis-Menten equation using nonlinear regression (e.g., Lineweaver-Burk, Eadie-Hofstee plots) to determine apparent Vmax and Km. Note: These are apparent values influenced by diffusion. Compare to free enzyme values to assess diffusion severity.
Protocol 2: Confocal Microscopy Visualization of Substrate Diffusion Gradient Purpose: To directly observe and measure the spatial concentration gradient within an immobilization matrix. Methodology:
- Labeling: Use a fluorescently-tagged substrate analogue or a pH-sensitive fluorescent dye (e.g., FITC-dextran, SNARF) that responds to reaction-induced local pH change.
- Immobilization: Entrap enzyme with the fluorescent probe or incubate immobilized beads with the tagged substrate.
- Imaging: Use a laser scanning confocal microscope to obtain Z-stack images through the bead cross-section.
- Analysis: Use image analysis software (e.g., ImageJ) to plot fluorescence intensity vs. radial position, revealing the concentration profile.
The Scientist's Toolkit: Research Reagent Solutions
| Item | Function & Relevance to Diffusion Limitations |
|---|---|
| Macroporous Silica Carriers (e.g., SBA-15) | Provides ordered, tunable large-pore structures (2-50 nm) to reduce internal diffusion resistance for substrate/product molecules. |
| Polyethyleneimine (PEI) | A highly branched cationic polymer used for enzyme cross-linking and coating; can create a favorable electrostatic environment but may add a diffusion layer. |
| Eupergit C | A macroporous acrylic copolymer carrier with epoxy groups for stable covalent immobilization, designed for low diffusion limitation. |
| Fluorescent Dextran Conjugates | Size-defined polysaccharides (e.g., 10 kDa, 70 kDa FITC-Dextran) used as tracer molecules to experimentally measure effective diffusivity in hydrogels. |
| Microcrystal Cellulose (Avicel PH-101) | A common, low-cost matrix for physical adsorption; pore size distribution is often broad and requires characterization for diffusion studies. |
| N-Hydroxysuccinimide (NHS) / EDC | Zero-length crosslinkers for carbodiimide coupling chemistry; used to attach enzymes to matrices without introducing bulky spacer arms that can affect local diffusion. |
| Alginate (High G-Content) | Forms dense, stiff gels with calcium; higher G-content increases mechanical stability but can reduce porosity, highlighting the material trade-off. |
Visualizations
Diagram Title: Substrate Diffusion vs. Kinetic Limitation
Diagram Title: Troubleshooting Signal Drift in Enzyme Biosensors
Data Table: Comparison of Immobilization Methods & Diffusion Impact
| Method | Typical Carrier | Diffusion Barrier Severity | Risk of Leaching | Best for Thesis Focus? |
|---|---|---|---|---|
| Entrapment | Alginate, Polyacrylamide | High (Dense Gel) | Moderate | Yes (Core Problem) |
| Adsorption | Silica, Cellulose | Low-Moderate | High | No (Unstable) |
| Covalent Binding | Eupergit, Chitosan | Moderate (Dependent on pore size) | Very Low | Yes (Stable System) |
| Cross-Linking (CLEAs) | Enzyme Aggregates | Moderate (Aggregate Density) | Very Low | Yes (No carrier) |
| Encapsulation | Liposomes, Polymersomes | Low (if thin membrane) | Low | Yes (Model system) |
Diagnosing and Solving Common Pitfalls in Entrapped Enzyme Performance
Technical Support Center
Frequently Asked Questions (FAQs)
Q1: In my assay with immobilized enzymes, I observe a lower reaction rate compared to the free enzyme. How do I know if this is due to intrinsic enzyme kinetics or substrate diffusion? A: A lower observed rate can arise from either cause. The primary diagnostic is to vary the enzyme loading while keeping the support geometry constant. If the observed rate per unit mass of catalyst increases with decreasing loading, it strongly suggests internal diffusion limitations. If the rate per unit mass is constant, the limitation is likely kinetic. Conduct an Activity vs. Enzyme Loading experiment (see Protocol 1).
Q2: What is the definitive experiment to confirm internal diffusion limitations within a porous support? A: The Weisz-Prater Criterion (Φ) for internal diffusion and the Observable Thiele Modulus (ϕ) are key. Calculate Φ using measured rates and estimated parameters. If Φ >> 1, internal diffusion limits the reaction. Experimentally, the Effect of Particle Size on observed activity is conclusive (see Protocol 2). If crushing or using smaller particles significantly increases the specific activity, internal diffusion is present.
Q3: How can I experimentally rule out external mass transfer (film diffusion) as the limiting factor? A: Vary the agitation speed or flow rate in a packed-bed reactor. Measure the observed reaction rate. If the rate increases with increased agitation/flow, external mass transfer is influencing the system. The point where the rate becomes independent of agitation is where external limitations are eliminated, and you can then assess internal kinetics/diffusion. See Protocol 3: External Mass Transfer Test.
Q4: My data from varying substrate concentration doesn't fit a standard Michaelis-Menten plot. What does this mean? A: Diffusion constraints can distort Michaelis-Menten kinetics. You may see an apparent increase in the measured Km (apparent Km) and a decrease in Vmax. Plotting data as an Eadie-Hofstee plot may reveal curvature. Perform a Batch Kinetics with Varying [S] experiment at different particle sizes or agitation speeds to decouple the effects (see Protocol 4).
Q5: How do temperature effects differ between kinetic and diffusion-controlled regimes? A: This is a critical diagnostic. The apparent activation energy (Ea) for a reaction limited by intrinsic kinetics is typically high (40-80 kJ/mol). For a reaction severely limited by internal diffusion, the apparent Ea is roughly half the intrinsic value. For external mass transfer, the apparent Ea is very low (~5-20 kJ/mol), similar to the temperature dependence of diffusion. Conduct an Arrhenius Plot Analysis (see Protocol 5).
Experimental Protocols
Protocol 1: Activity vs. Enzyme Loading Objective: To identify internal diffusion limitations by changing the amount of enzyme on a fixed mass and size of support. Method:
- Immobilize your enzyme onto your chosen porous support (e.g., silica beads, polymer resin) at 5 different loadings (e.g., 1, 5, 10, 20, 50 mg enzyme per g support).
- For each loading, use a fixed mass of the immobilized catalyst (e.g., 100 mg) in a standardized activity assay (fixed substrate concentration, pH, temperature, and agitation speed).
- Measure the initial reaction rate (vobs) for each loading. Analysis: Plot the Total Observed Activity (vobs * total catalyst mass) and the Specific Activity (v_obs per mg of enzyme) against the enzyme loading. A linear increase in total activity with loading suggests kinetic control. A plateau indicates diffusion control. A decreasing specific activity with increasing loading is a hallmark of diffusion limitations.
Protocol 2: Particle Size Variation Objective: To conclusively demonstrate internal diffusion limitations. Method:
- Prepare a large batch of enzyme immobilized on a porous support.
- Sieve or mechanically separate the batch into several distinct particle size ranges (e.g., 100-200 μm, 200-400 μm, 400-800 μm).
- Measure the initial reaction rate under identical, well-agitated conditions for each size fraction, using the same total enzyme mass or catalyst mass. Analysis: Plot the observed specific activity (rate per mg enzyme) against particle diameter or radius. If activity is constant across sizes, kinetics control. If activity increases with decreasing particle size, internal diffusion is significant.
Protocol 3: External Mass Transfer (Agitation/Reynolds Number) Test Objective: To eliminate and diagnose external film diffusion. Method (Batch Reactor):
- Place a fixed amount of immobilized enzyme in a stirred-tank reactor with standard substrate concentration.
- Measure the initial reaction rate at a series of increasing agitation speeds (e.g., 100, 200, 400, 600, 800 rpm).
- Ensure particle integrity is maintained at high speeds. Analysis: Plot observed reaction rate vs. agitation speed (or Reynolds Number). The rate will increase until a plateau is reached. The plateau region is free of external mass transfer effects. All kinetic and internal diffusion studies must be conducted within this plateau region.
Protocol 4: Batch Kinetics with Varying [S] for Apparent Parameters Objective: To determine apparent Michaelis-Menten parameters under potential diffusion influence. Method:
- Using a standardized, non-agitation-limited catalyst preparation (from Protocol 3 plateau), perform initial rate assays across a wide range of substrate concentrations.
- Repeat these kinetics using catalyst of a significantly larger particle size. Analysis: Fit data to the Michaelis-Menten model. Compare the apparent Km and Vmax between small and large particles. A significantly higher apparent Km for larger particles indicates diffusion restrictions. Create a Lineweaver-Burk or Eadie-Hofstee plot to observe linearity deviations.
Protocol 5: Arrhenius Plot Analysis for Apparent Activation Energy Objective: Use temperature dependence to identify the rate-limiting step. Method:
- Conduct activity assays at a minimum of 5 different temperatures (e.g., 10, 20, 30, 40, 50°C) under conditions proven free of external mass transfer.
- Use a constant, saturating substrate concentration if possible.
- Measure initial rates for both free and immobilized enzyme. Analysis: Plot ln(v_obs) vs. 1/T (in Kelvin) for both free and immobilized enzyme. Calculate the slope (-Ea/R). Compare the apparent Ea of the immobilized system to the intrinsic Ea of the free enzyme. An apparent Ea ~50% of the intrinsic value suggests strong internal diffusion limitations.
Data Presentation
Table 1: Diagnostic Summary of Kinetic vs. Diffusion Control
| Experimental Variable | Kinetic Control Observed Response | Internal Diffusion Control Observed Response | External Mass Transfer Control Observed Response |
|---|---|---|---|
| Enzyme Loading | Specific activity constant. Total activity linear. | Specific activity decreases with loading. Total activity plateaus. | Minor effect if film is limiting. |
| Particle Size | No change in specific activity. | Specific activity increases as size decreases. | Activity increases with agitation, not directly size. |
| Agitation Speed | No change in reaction rate. | No change (if external MT eliminated). | Rate increases to a plateau. |
| Apparent Ea | High (~intrinsic, 40-80 kJ/mol). | ~Half of intrinsic Ea (20-40 kJ/mol). | Low (5-20 kJ/mol, diffusion-like). |
| Apparent Km | Matches free enzyme Km. | Higher than free enzyme Km (Km,app > Km). | May be unaffected or slightly elevated. |
Table 2: Calculated Weisz-Prater Criterion (Φ) Interpretation
| Φ Value | Interpretation | Implication |
|---|---|---|
| Φ << 1 | No internal diffusion limitations. | Reaction is kinetically controlled. |
| Φ ~ 1 | Moderate diffusion influence. | Both kinetics and diffusion affect the rate. |
| Φ >> 1 | Severe internal diffusion limitations. | Reaction is strongly diffusion-controlled. |
Formula: Φ = (Observed Reaction Rate * (Particle Radius)^2) / (Effective Diffusivity * Substrate Concentration in bulk). Requires estimation of effective diffusivity (Deff).
Visualizations
Diagram 1: Decision Tree for Identifying Limiting Step
Diagram 2: Substrate Pathway in an Immobilized Enzyme System
The Scientist's Toolkit: Research Reagent Solutions
Table 3: Essential Materials for Diffusion/Kinetics Experiments
| Item/Reagent | Function & Rationale |
|---|---|
| Porous Support (e.g., Controlled-Pore Glass, Agarose Beads, Mesoporous Silica) | Provides a defined, rigid structure for enzyme immobilization with tunable pore size and particle diameter for diffusion studies. |
| Cross-linking Reagents (e.g., Glutaraldehyde, EDC/NHS) | Used to covalently attach enzymes to supports or to cross-link enzyme aggregates (CLEAs), creating defined immobilized systems. |
| Sieves/Mesh Screens | To fractionate immobilized catalyst into precise particle size ranges for Protocol 2. |
| Stirred-Tank or Packed-Bed Bioreactor | A vessel allowing precise control of agitation speed or flow rate for external mass transfer studies (Protocol 3). |
| Spectrophotometer / HPLC / Calorimeter | For accurate, time-resolved measurement of substrate depletion or product formation to determine initial reaction rates. |
| Temperature-Controlled Water Bath or Incubator | For maintaining precise temperatures required for Arrhenius analysis (Protocol 5). |
| Computational Software (e.g., MATLAB, Python with SciPy) | To fit kinetic data, calculate parameters (Km,app, Vmax,app, Ea), and model diffusion-reaction equations (Weisz-Prater Criterion). |
Technical Support Center: Troubleshooting Entrapment Matrices for Enzyme Applications
This support center addresses common experimental challenges in preparing polymeric matrices for enzyme entrapment. The focus is on optimizing cross-linking and porosity to mitigate diffusion limitations, a central thesis in advancing entrapped enzyme research.
Troubleshooting Guides & FAQs
Q1: My entrapped enzyme shows significantly lower activity than the free enzyme. What could be wrong? A: This is a classic symptom of mass transfer (diffusion) limitation. The substrate cannot easily reach the enzyme active sites within the matrix. Your primary tuning parameters are cross-linking density and porosity.
- Probable Cause & Solution: Excessively high cross-linking density creates a very tight mesh, hindering substrate diffusion. Action: Reduce the concentration of your cross-linker agent (e.g., glutaraldehyde, N,N'-methylenebisacrylamide) by 10-25% in your next synthesis run. Monitor the effect on both activity and mechanical stability.
Q2: My enzyme leaks from the matrix during operation, especially in aqueous buffers. How do I prevent this? A: Leaching indicates insufficient cross-linking density or pores that are too large relative to the enzyme size.
- Probable Cause & Solution 1: The cross-linking reaction was incomplete or the cross-linker concentration was too low. Action: Increase cross-linker concentration slightly, or extend the cross-linking reaction time/temperature. Ensure proper pH for the cross-linking chemistry.
- Probable Cause & Solution 2: The polymer backbone itself is too loose. Action: Increase the concentration of the primary polymer (e.g., alginate, chitosan, polyvinyl alcohol) before cross-linking to provide a denser initial network.
Q3: How do I quantitatively measure the porosity and cross-linking density of my synthesized hydrogel matrix? A: Use a combination of swelling studies and morphological analysis.
- Protocol: Equilibrium Swelling Ratio (ESR) for Cross-linking Density Estimation:
- Synthesize and dry your matrix to a constant weight (Wd).
- Immerse it in buffer (pH of intended use) until it reaches equilibrium swelling (no further weight gain).
- Gently blot surface water and weigh the swollen gel (Ws).
- Calculate ESR = (Ws - Wd) / Wd. A lower ESR indicates a higher cross-linking density.
- Protocol: Porosity Assessment via Scanning Electron Microscopy (SEM):
- Prepare a freeze-dried (lyophilized) sample of your swollen hydrogel to preserve pore structure.
- Sputter-coat with gold/palladium.
- Analyze SEM images with software (e.g., ImageJ) to determine average pore size and distribution.
Q4: My matrix is either too brittle or too soft for my reactor setup. How can I tune mechanical strength? A: Mechanical strength is directly correlated with cross-linking density, but a non-linear relationship exists.
- Probable Cause & Solution: An optimal "window" exists. Action: Perform a systematic study. Create a series of matrices with cross-linker concentration varying, for example, from 0.5% to 5.0% (w/v). Test each for compressive modulus (mechanical) and enzyme activity. The goal is to find the concentration that provides sufficient strength without causing excessive diffusion barriers.
Table 1: Effect of Glutaraldehyde Cross-Linker Concentration on Alginate-Based Matrix Properties Data is illustrative based on current literature synthesis.
| Glutaraldehyde (% w/v) | Equilibrium Swelling Ratio (ESR) | Relative Activity Retention (%) | Estimated Avg. Pore Size (nm) | Qualitative Mechanical Strength |
|---|---|---|---|---|
| 0.5 | 12.5 ± 1.2 | 85 ± 5 | 120 ± 25 | Soft, Friable |
| 1.0 | 8.2 ± 0.8 | 78 ± 4 | 85 ± 15 | Flexible, Robust |
| 2.0 | 4.1 ± 0.5 | 45 ± 6 | 35 ± 10 | Stiff, Less Elastic |
| 3.0 | 2.8 ± 0.3 | 22 ± 5 | <20 | Brittle |
Table 2: Key Performance Trade-offs in Matrix Tuning
| Parameter Increased | Effect on Diffusion | Effect on Enzyme Leaching | Effect on Mechanical Strength |
|---|---|---|---|
| Cross-Linking Density | Decreases (Negative) | Decreases (Positive) | Increases (Positive) |
| Primary Polymer Conc. | Decreases (Negative) | Decreases (Positive) | Increases (Positive) |
| Porogen/Pore Former Conc. | Increases (Positive) | Increases (Negative) | Decreases (Negative) |
Experimental Protocol: Synthesis of a Tunable Polyvinyl Alcohol (PVA) Hydrogel
Title: Standardized Protocol for PVA-Sodium Alginate Blend Hydrogel Entrapment.
Materials: Polyvinyl Alcohol (PVA, MW 85,000-124,000), Sodium Alginate, Glutaraldehyde (25% aqueous solution), HCl (1M), Enzyme Solution in buffer, Syringe & Needle, Calcium Chloride (2% w/v) bath.
Method:
- Dissolution: Dissolve PVA (8% w/v) and Sodium Alginate (1% w/v) in distilled water at 90°C with stirring for 2 hours. Cool to room temperature.
- Enzyme Incorporation: Gently mix the enzyme solution into the polymer blend at a 1:4 (v/v) ratio on an ice bath to prevent denaturation.
- Pre-gel Droplet Formation: Using a syringe pump, drip the mixture into a chilled 2% CaCl₂ solution to form preliminary ionotropic gelled beads. Incubate for 30 min.
- Cross-Linking Wash: Rinse beads with cold distilled water.
- Covalent Cross-Linking: Immerse beads in a glutaraldehyde solution (concentration varied per experimental design, e.g., 0.5-3.0% in 0.1M HCl) for 24 hours at 4°C.
- Quenching & Final Wash: Terminate the reaction by washing extensively with 0.1M Glycine solution, followed by copious washing with your target assay buffer.
- Storage: Store swollen beads at 4°C in buffer until use.
Visualization: The Optimization Workflow
Title: Workflow for Iterative Matrix Optimization
The Scientist's Toolkit: Research Reagent Solutions
Table 3: Essential Materials for Hydrogel Entrapment Research
| Reagent/Material | Primary Function & Rationale |
|---|---|
| Alginate (Sodium Salt) | Biocompatible anionic polymer; forms gentle ionotropic gels with Ca²⁺, providing a mild initial entrapment network. |
| Polyvinyl Alcohol (PVA) | Synthetic polymer offering high chemical control; forms strong, tunable hydrogels via freeze-thaw or chemical cross-linking. |
| Glutaraldehyde (25% soln.) | A small, bifunctional cross-linker; reacts with -NH₂ or -OH groups to create covalent bridges, drastically increasing stability. |
| N,N'-methylenebisacrylamide (BIS) | Standard cross-linker for free-radical polymerized gels (e.g., with acrylamide); defines mesh size of polyacrylamide networks. |
| Calcium Chloride (CaCl₂) | Divalent cation source for instantaneous, reversible ionic cross-linking of alginate and pectin. |
| Polyethylene Glycol (PEG) Diolefin | Porogen/Spacer; creates larger pores via leaching or acts as a flexible cross-linker to reduce mesh density. |
| Glycine | Quenching agent; used to neutralize unreacted glutaraldehyde by reacting with its free aldehyde groups. |
| Span-80 / Surfactants | Used in emulsion polymerization techniques to control bead size and morphology during droplet formation. |
Mitigating Substrate/Product Inhibition Within the Matrix
Troubleshooting Guides & FAQs
Q1: My entrapped enzyme system shows a sharp decline in reaction velocity at high substrate concentrations. Is this substrate inhibition, and how can I confirm it? A: Yes, this pattern is indicative of substrate inhibition. To confirm, perform a kinetic assay across a wide substrate concentration range [S]. Plot the initial velocity (V0) vs. [S]. A characteristic peak-followed-by-decline curve confirms substrate inhibition. Compare data from free vs. entrapped enzyme to see if the matrix exacerbates the issue.
Q2: Product accumulation in the matrix is halting my reaction prematurely. What are the primary mitigation strategies? A: The core strategies are: 1) In-situ Product Removal (ISPR): Couple the reaction with a secondary system (e.g., a subsequent enzyme or adsorbent) to immediately convert or bind the product. 2) Continuous Flow Reactor: Use a packed-bed reactor with continuous buffer flow to physically wash the inhibitory product away from the enzyme matrix. 3) Matrix Modification: Increase porosity or incorporate charged groups to repel the product, enhancing its diffusion out.
Q3: How does the immobilization method itself influence inhibition kinetics? A: The method critically alters local microenvironments. Covalent binding can sometimes rigidify the enzyme, potentially making it more susceptible to conformational strain from inhibitors. Entrapment/encapsulation creates a diffusion barrier that can lead to higher local concentrations of both substrate and product within the matrix compared to the bulk solution, intensifying inhibition effects.
Q4: What are the best practices for designing a matrix to minimize inhibition? A: Key design principles include:
- Controlled Porosity: Optimize pore size to allow free substrate influx while facilitating product efflux.
- Functionalization: Incorporate ionic groups (e.g., sulfonate, amine) to create electrostatic repulsion against similarly charged inhibitory molecules.
- Hydrophilicity/Hydrophobicity Tuning: Match the matrix's polarity to repel the inhibitory molecule (e.g., hydrophilic matrix to repel hydrophobic product).
- Gradient Matrices: Use multi-layer immobilization with outer layers containing scavengers or ISPR components.
Key Experimental Protocols
Protocol 1: Assessing Substrate Inhibition in Entrapped Enzymes
- Immobilize enzyme via your chosen entrapment method (e.g., alginate-Ca²⁺ gelation, silica sol-gel).
- Prepare substrate solutions in appropriate buffer across a concentration range (e.g., 0.1Km to 10Km and up to 50-100Km if inhibition is suspected).
- Incubate a fixed quantity of beads/gel with each substrate solution under controlled temperature and pH.
- Measure initial reaction rates (V0) by sampling the bulk solution at short, regular intervals (e.g., every 30 sec for 5 min). Use assays specific to your product (spectrophotometric, HPLC, etc.).
- Analyze data by plotting V0 vs. [S]. Fit data to the substrate inhibition model:
V0 = (Vmax * [S]) / (Km + [S] + ([S]²/Ki)), where Ki is the substrate inhibition constant.
Protocol 2: Implementing In-situ Product Removal (ISPR) in a Batch System
- Co-immobilize or co-entrap your primary enzyme with a secondary enzyme that converts the inhibitory product. (e.g., if Product P inhibits, include an enzyme that converts P to non-inhibitory Q).
- Alternatively, include an adsorbent (e.g., activated charcoal, ion-exchange resin particles) within the entrapment matrix.
- Run the reaction as in Protocol 1, but monitor both primary product P and final product Q.
- Compare the total turnover number (TTN) and reaction longevity against a system without ISPR.
Table 1: Comparison of Mitigation Strategies for Product Inhibition
| Strategy | Mechanism | Key Advantage | Typical Increase in Total Yield* | Complexity |
|---|---|---|---|---|
| Continuous Flow Reactor | Physical removal by convection | Excellent control, scalable | 150-300% | Medium-High |
| In-situ Conversion (Enzymatic) | Chemical conversion to non-inhibitor | Highly specific, efficient | 200-400% | Medium |
| In-situ Adsorption | Binding within the matrix | Broad applicability | 100-200% | Low |
| Matrix Functionalization | Electrostatic/ Hydrophobic repulsion | Built-in solution, no additives | 50-150% | Low-Medium |
*Compared to inhibited batch system; actual results vary by system.
Table 2: Kinetic Parameters: Free vs. Entrapped Enzyme Under Inhibition
| Condition | Vmax (μmol/min/mg) | Km (mM) | Ki (Substrate) (mM) | Ki (Product) (mM) |
|---|---|---|---|---|
| Free Enzyme | 10.2 ± 0.5 | 2.1 ± 0.2 | 45.0 ± 5.0 | 8.5 ± 1.0 |
| Entrapped (Alginate) | 6.5 ± 0.4 | 4.5 ± 0.3* | 22.0 ± 3.0* | 3.2 ± 0.5* |
| Entrapped + ISPR | 7.8 ± 0.6 | 4.3 ± 0.3 | 40.0 ± 6.0 | >50 |
Apparent values increased due to diffusion limitations. *Product inhibition significantly reduced.
Visualizations
Diagram 1: Logical flow for mitigating inhibition in enzyme matrices.
Diagram 2: In-situ product removal (ISPR) workflow in a matrix.
The Scientist's Toolkit: Research Reagent Solutions
| Item | Function in Mitigation Studies |
|---|---|
| Alginate (e.g., Sodium Alginate) | Common polysaccharide for ionic gelation entrapment; porosity adjustable with Ca²⁺ concentration. |
| Eupergit C / Sepabeads | Epoxy-activated acrylic carriers for stable covalent immobilization; can be modified pre- or post-binding. |
| Polyethylenimine (PEI) | A polycation used to coat matrices; can create electrostatic barriers to repel positively charged inhibitors. |
| Functionalized Silica (e.g., Aminopropyltriethoxysilane) | Sol-gel precursor for entrapment; amine groups allow crosslinking and charge modification. |
| Dextran Polymers | Can be used to create hydrophilic environments or as a crowding agent to tailor matrix microstructure. |
| Activated Charcoal / XAD Resins | Hydrophobic adsorbents for in-situ product removal (ISPR) via physical inclusion in beads. |
| Dialysis Membrane Cassettes | For simple diffusion studies, comparing inhibition inside a confined space vs. bulk solution. |
| Microfluidic Packed-Bed Reactor Systems | Enable precise study and application of continuous flow to wash away inhibitors. |
Preventing Enzyme Leakage and Ensuring Long-Term Operational Stability
Technical Support Center: Troubleshooting & FAQs
Q1: Why is my entrapped enzyme showing significant activity loss within the first few operational cycles, and how can I diagnose if leakage is the cause?
A: Rapid initial activity loss is a common symptom of enzyme leakage from the support matrix. To diagnose, follow this protocol:
- Post-Operation Assay: After each reaction cycle, centrifuge the reaction mixture (e.g., 10,000 x g, 10 min) to separate the immobilized enzyme beads/carrier from the supernatant.
- Supernatant Activity Test: Assay the clear supernatant for catalytic activity using your standard assay. Detectable activity confirms enzyme leakage.
- Carrier Analysis: Wash the recovered immobilized enzyme carrier and re-assay its activity. A combined decrease in carrier activity and increase in supernatant activity is conclusive for leakage.
Q2: What are the primary factors contributing to enzyme leakage from polymeric gels (e.g., alginate, chitosan) or mesoporous silica?
A: Leakage mechanisms differ by material. Key factors are summarized below:
| Factor | Polymeric Gels (Alginate/Chitosan) | Mesoporous Silica |
|---|---|---|
| Pore Size | Gel network too large; enzyme physically escapes. | Pores too large or size distribution too broad. |
| Binding Nature | Weak ionic/electrostatic interaction (e.g., Ca²⁺ cross-linking). | Weak physical adsorption (van der Waals, H-bonding). |
| Chemical Stability | Gel degrades (chelation of Ca²⁺, pH shifts). | Silica dissolves at extreme alkaline pH (>9). |
| Operational Stress | Shear forces from agitation disrupt gel matrix. | Shear forces desorb enzyme. |
Q3: What specific surface functionalization or cross-linking strategies are most effective in 2024 for covalently binding enzymes to prevent leakage?
A: Current best practices focus on targeted, stable covalent attachment. Below is a detailed protocol for amine-reactive coupling onto functionalized silica, a gold-standard method.
Protocol: Covalent Immobilization via Amine Coupling on Silica Objective: Create a stable, non-leaking enzyme preparation using glutaraldehyde cross-linking. Materials: Mesoporous silica (e.g., SBA-15), (3-aminopropyl)triethoxysilane (APTES), glutaraldehyde solution (2.5% v/v), phosphate buffer (0.1 M, pH 7.0), enzyme solution.
- Support Amination: Silica is stirred in a 2% (v/v) APTES/toluene solution under reflux (80°C, 24h). Wash with toluene and ethanol, then dry.
- Aldehyde Activation: Aminated silica is reacted with 2.5% glutaraldehyde in phosphate buffer (25°C, 2h). Wash thoroughly with buffer to remove excess cross-linker.
- Enzyme Coupling: Add the enzyme solution (in pH 7-8 buffer, optimal for lysine residues) to the activated support. Incubate with gentle mixing (4°C, 12-16h).
- Quenching & Washing: Quench unreacted aldehydes with 1M Tris-HCl buffer (pH 8.0, 1h). Wash extensively with buffer and assay. Leakage Test: Incubate the final preparation in operational buffer (37°C, 24-72h) and assay supernatant for activity.
Q4: How does improving immobilization chemistry to prevent leakage directly address diffusion limitations in the broader thesis context?
A: Leakage and diffusion are intrinsically linked in a trade-off. A porous, open matrix minimizes diffusion resistance for substrates but allows enzyme leakage. Conversely, a dense matrix prevents leakage but severely limits substrate diffusion. The thesis argues for targeted, nanoscale immobilization chemistry that anchors the enzyme precisely at multiple points without forming a dense protein layer or over-crosslinking the pore entrance. This secures the enzyme (prevents leakage) while meticulously preserving the engineered pore architecture for optimal mass transfer (addresses diffusion limitation).
The Scientist's Toolkit: Key Research Reagent Solutions
| Reagent / Material | Primary Function in Preventing Leakage |
|---|---|
| Functionalized Silicas (e.g., Amine-, Epoxy-, Carboxy-) | Provide reactive handles for stable covalent enzyme attachment, eliminating leakage from desorption. |
| Heterobifunctional Cross-linkers (e.g., NHS-PEG-Maleimide) | Enable controlled, oriented coupling between specific enzyme residues (e.g., cysteine) and the support, minimizing random multi-point attachment that can block pores. |
| Genetically Encoded Tags (e.g., HaloTag, SNAP-tag) | Allow for irreversible, specific covalent binding between the enzyme and a functionalized support, ensuring uniform, leak-proof immobilization. |
| Cross-linking Enzymes (e.g., Microbial Transglutaminase) | Catalyze site-specific formation of isopeptide bonds between enzyme and support (if suitably functionalized), offering a biocompatible, strong linkage. |
| Enhanced Entrapment Polymers (e.g., photo-crosslinkable alginate) | Form hydrogel networks with tunable, smaller mesh sizes upon UV exposure, physically entrapping enzymes more securely than ionotropic gelling. |
Q5: What is a step-by-step experimental workflow to systematically test and optimize for long-term operational stability, isolating leakage from inactivation?
A: Use this comprehensive workflow to deconvolute stability loss causes.
Balancing Activity Retention with Mechanical Robustness of the Support
Technical Support Center
Troubleshooting Guides & FAQs
Q1: My entrapped enzyme shows a drastic drop in catalytic activity compared to the free enzyme. What could be the cause and how can I address it?
A: This is a classic symptom of severe diffusion limitation. The substrate cannot readily access the enzyme's active site within the support matrix.
- Primary Cause: Excessively dense or thick polymer network at the micro-scale.
- Troubleshooting Steps:
- Quantify Pore Size: Perform BET surface area and BJH pore size distribution analysis on your support material before enzyme entrapment. Compare to the hydrodynamic radius of your substrate.
- Modify Entrapment Protocol: Reduce the cross-linker concentration or the polymerization time. Consider using a porogen (e.g., PEG) during synthesis to create larger pores.
- Verify Activity Assay: Ensure your assay is properly optimized for the immobilized system. Agitation speed should be sufficient to eliminate external diffusion limitations.
Q2: My enzyme-polymer composite beads are fracturing during stirred-batch reactor operation. How can I improve mechanical robustness without sacrificing more activity?
A: Fracture indicates insufficient mechanical strength, often tackled by increasing cross-linking, which can exacerbate diffusion issues.
- Primary Cause: Trade-off between polymer chain mobility (for diffusion) and cross-link density (for strength).
- Troubleshooting Steps:
- Alternative Cross-linkers: Shift from short, rigid cross-linkers (e.g., glutaraldehyde) to longer, flexible ones (e.g., polyethyleneglycol diacrylate). This can maintain network elasticity.
- Composite Materials: Incorporate reinforcing inert nanofibers (e.g., cellulose nanofibers, silica nanoparticles) into the polymer gel before entrapment. This strengthens the matrix without significantly altering the pore structure relevant for enzyme access.
- Mechanical Testing: Implement a simple compressive strength test for beads before and after protocol changes. Target a minimum stress threshold (e.g., > 2 N per bead for your reactor conditions).
Q3: I am observing a continuous, slow leakage of enzyme from my hydrogel support over time. Is this entrapment or adsorption? How do I stop it?
A: Slow leakage suggests physical entrapment within a mesh that is too large, not stable chemical conjugation.
- Primary Cause: The effective network mesh size (ξ) is dynamically fluctuating and larger than the enzyme's effective size.
- Troubleshooting Steps:
- Confirm Leakage: Run an SDS-PAGE gel of the supernatant from your immobilized enzyme preparation over several days.
- Increase Entrapment Efficiency: Lower the gelation temperature to form a finer initial network. Alternatively, employ a two-step polymerization: a mild primary gelation to mix enzyme uniformly, followed by a secondary, gentle cross-linking step to "lock" the network.
- Covalent Tethering (Last Resort): If leakage persists, introduce a weak covalent tether. Use a bis-epoxy cross-linker that can react with both the support's polymer chains and surface lysines on the enzyme, anchoring it within the porous matrix.
Q4: How do I systematically find the optimal cross-linking density that balances activity and strength for my specific enzyme?
A: This requires a designed experimental approach correlating two key performance indicators (KPIs).
- Recommended Protocol:
- Prepare a series of support matrices with increasing cross-linker molar percentage (e.g., 0.5%, 1.0%, 1.5%, 2.0%, 2.5%).
- Entrap your enzyme using a standardized method across all batches.
- Measure the Apparent Activity (using initial reaction rates under standardized conditions) and the Compressive Modulus (via micro-indentation or bulk rheology) for each sample.
- Plot both KPIs against cross-link density. The "optimal" point is typically at the knee of the activity retention curve before it plummets, while modulus is still acceptable.
Table 1: Impact of Cross-Linker Concentration on Entrapped Enzyme Performance
| Cross-Linker (% w/v) | Apparent Activity (U/mg) | Relative Activity (%) | Compressive Modulus (kPa) | Pore Size Avg. (nm) | Enzyme Leakage (24h, %) |
|---|---|---|---|---|---|
| 0.5 | 45.2 | 95 | 12.5 ± 1.8 | 35.2 | 8.5 |
| 1.0 | 43.1 | 91 | 28.4 ± 2.3 | 21.7 | 4.1 |
| 1.5 | 40.5 | 85 | 52.1 ± 3.5 | 14.5 | 1.2 |
| 2.0 | 28.9 | 61 | 85.7 ± 5.1 | 8.3 | 0.5 |
| 2.5 | 15.1 | 32 | 124.3 ± 8.7 | <5.0 | 0.2 |
Note: Data is illustrative. 1.5% cross-linker often represents a balanced point for a model hydrogel (e.g., alginate-Ca²⁺/polyacrylamide).
Table 2: Performance of Composite Reinforced Supports
| Support Material Composition | Activity Retention vs. Free Enzyme (%) | Tensile Strength (MPa) | Operational Stability (Half-life) |
|---|---|---|---|
| Pure Alginate Gel | 78 | 0.15 ± 0.02 | 5 cycles |
| Alginate + 0.1% Cellulose Nanofibers | 75 | 0.38 ± 0.04 | 12 cycles |
| Polyvinyl Alcohol (PVA) Cryogel | 82 | 0.42 ± 0.05 | 20+ cycles |
| PVA-Silica Nanoparticle Composite | 80 | 0.81 ± 0.07 | 25+ cycles |
Detailed Experimental Protocols
Protocol: Standardized Entrapment in Alginate-Polyacrylamide Composite Gel Objective: To reproducibly entrap enzymes in a tunable hydrogel matrix for diffusion/robustness studies. Materials: See "The Scientist's Toolkit" below. Procedure:
- Solution Preparation: Dissolve sodium alginate (2% w/v) in buffer. Separately, prepare a solution containing acrylamide monomer (10% w/v), N,N'-methylenebisacrylamide (BIS) cross-linker (varied, see Table 1), and your purified enzyme.
- Mixing: Gently combine the alginate and monomer-enzyme solutions at a 1:1 volume ratio. Keep on ice to prevent premature polymerization.
- Droplet Formation: Using a syringe pump and needle, drip the mixture into a stirred 0.1M CaCl₂ solution. This forms instantaneous alginate-Ca²⁺ gel beads.
- In-Situ Polymerization: Transfer the beads to the CaCl₂ solution containing 0.05% w/v ammonium persulfate (APS) and 0.1% v/v N,N,N',N'-Tetramethylethylenediamine (TEMED). Incubate for 1 hour at 4°C to initiate radical polymerization of the acrylamide within the alginate mesh.
- Washing: Reticulate the beads extensively with assay buffer (3 x 10 volumes) to remove unreacted monomers, initiators, and any non-entrapped enzyme.
Protocol: Measuring Apparent Activity of Entrapped Enzymes
- Standard Curve: Prepare a standard curve for product formation using the free enzyme under known, diffusion-unlimited conditions.
- Assay Setup: Add a precise mass (e.g., 100 mg) of washed, entrapped enzyme beads to a stirred reactor containing substrate solution. Maintain constant temperature and agitation speed (e.g., 300 rpm) to minimize external film diffusion.
- Initial Rate Measurement: Take aliquots of the supernatant at frequent, short time intervals (e.g., every 30 seconds for 5 minutes). Immediately stop the reaction in the aliquot.
- Analysis: Calculate the initial rate of product formation (μmol/min). Divide by the mass of beads (and the known enzyme loading) to report Apparent Activity (U/mg support or U/mg enzyme).
Visualizations
Diagram Title: The Activity-Robustness Trade-off & Optimization Pathways
Diagram Title: Composite Entrapment & Characterization Workflow
The Scientist's Toolkit: Research Reagent Solutions
Table 3: Essential Materials for Entrapment Experiments
| Item | Function & Rationale |
|---|---|
| Sodium Alginate (High G-Content) | Forms gentle ionotropic gel beads with Ca²⁺, creating the primary, macro-porous network for mild enzyme entrapment. |
| Acrylamide & Bis-Acrylamide (BIS) | Monomer and cross-linker pair for forming a tunable, secondary polyacrylamide network within the primary gel to control micro-scale mesh size. |
| Ammonium Persulfate (APS) & TEMED | Redox pair initiator system for free-radical polymerization of acrylamide; cold initiation allows slow, controlled network formation. |
| Poly(ethylene glycol) (PEG) of varying MW | Acts as a porogen during polymerization or a flexible spacer cross-linker to increase network elasticity and pore size. |
| Cellulose Nanocrystals (CNC) | Inert, bio-based nanomaterial added as a reinforcement filler to increase mechanical strength without major pore obstruction. |
| 3-(Glycidyloxypropyl)trimethoxysilane | Silane coupling agent for functionalizing silica nanoparticles or other inorganic supports for compatibility with polymer gels. |
| Micro-BCA Assay Kit | For quantifying protein (enzyme) loading on/within the support and monitoring potential leakage. |
| Rheometer with Parallel Plate Geometry | Essential for measuring the viscoelastic properties (Storage Modulus G', Loss Modulus G") of hydrogel supports to quantify mechanical robustness. |
Technical Support Center: Troubleshooting Diffusion Limitations in Entrapped Enzyme Systems
FAQs & Troubleshooting Guides
Q1: During scale-up of my entrapped enzyme reactor, I observe a significant drop in reaction yield despite maintaining identical substrate concentration and temperature. What is the most likely cause?
A: This is a classic symptom of increased diffusion limitations at scale. In lab-scale batch reactors (e.g., 100 mL), mixing is highly efficient, minimizing the external mass transfer resistance around biocatalyst particles. In larger stirred-tank or packed-bed reactors, mixing homogeneity decreases, leading to a thicker boundary layer around particles. This reduces the substrate's effective diffusion rate to the active site. Internal diffusion within the particle matrix can also become limiting if particle size was increased during scale-up.
Troubleshooting Protocol:
- Measure Effectiveness Factor (η): Perform a kinetic assay comparing initial reaction rates of free enzyme (Vfree) and entrapped enzyme (Vobs) under identical, well-mixed conditions with excess substrate. Calculate η = Vobs / Vfree. An η << 1 indicates significant intrinsic diffusion limitation.
- Vary Particle Size (Lab Test): Crush a sample of your biocatalyst beads and re-assay the initial rate. If the rate increases significantly, internal diffusion is a key constraint.
- Vary Agitation Speed (Lab Test): In a lab reactor, measure reaction rate at increasing agitation speeds. If the rate increases beyond your standard lab speed, external diffusion was limiting even at bench scale, a problem exacerbated upon scale-up.
Q2: My immobilized enzyme shows excellent stability in lab tests but deactivates rapidly in the pilot-scale reactor. Why?
A: Accelerated deactivation is often linked to shear forces and localized heating not present at the bench. Larger impellers or rapid pumping in recirculation loops generate shear that can distort the support matrix or strip the enzyme from the surface. Poor heat dissipation in large reactor cores creates localized hot spots, denaturing the enzyme.
Troubleshooting Protocol:
- Shear Stress Analysis: Conduct a shear stress test by stirring lab beads in a high-shear mixer (e.g., homogenizer) for timed intervals, then measure residual activity. A sharp drop confirms shear sensitivity.
- Temperature Mapping: Use an array of thermocouples in the pilot reactor to identify hot spots, especially near the heat exchanger inlet and in poorly mixed zones.
- Support Matrix Integrity Check: Use SEM imaging of fresh and used catalyst particles from the pilot reactor to check for cracks, abrasion, or erosion.
Q3: How can I predict the required catalyst loading for my industrial reactor based on my lab data?
A: You cannot use a simple linear scaling factor. You must develop a reaction-diffusion model that incorporates the Thiele modulus (φ) and the effectiveness factor (η). The key is to determine the kinetic parameters (Vmax, Km) from the free enzyme and the effective diffusivity (D_eff) of the substrate within your specific catalyst particle.
Experimental Protocol to Obtain Scaling Parameters:
- Determine Intrinsic Kinetics: Use free enzyme in a well-mixed, diffusion-unlimited batch system to find true Vmax and Km.
- Estimate Effective Diffusivity (Deff): Using uniformly sized catalyst particles, measure initial reaction rates at varying particle radii (R). Fit the data to the relationship for a first-order reaction: η = (3/φ^2) * (φ coth(φ) - 1), where φ = R * sqrt(Vmax / (Km * Deff)).
- Scale-Up Calculation: For your target industrial reactor volume and flow rate, use the model to calculate the necessary catalyst mass to achieve the desired conversion, accounting for the predicted η at the larger particle or process scale.
Table 1: Comparison of Key Parameters Across Scales for a Model Enzyme (Lipase) Entrapped in Alginate
| Parameter | Lab Scale (0.1 L Batch) | Pilot Scale (10 L CSTR) | Industrial Scale (1000 L PBR) | Scaling Consideration |
|---|---|---|---|---|
| Catalyst Particle Diameter | 1.0 mm | 2.0 mm | 2.5 mm | Increased size lowers η; trade-off with pressure drop in PBR. |
| Measured Effectiveness Factor (η) | 0.85 | 0.65 | 0.45 (estimated) | Decreases due to combined internal/external diffusion limits. |
| Superficial Velocity | N/A (Batch) | N/A (CSTR) | 0.05 m/s | In PBR, affects external mass transfer coefficient. |
| Space-Time Yield (g/L·h) | 15.2 | 11.8 | 8.1 (projected) | Directly proportional to η; critical for economic viability. |
| Average Shear Rate (1/s) | 50 | 200 | 150 (PBR pumping) | Impacts enzyme leaching and support integrity. |
Table 2: Research Reagent Solutions Toolkit for Diffusion Analysis
| Reagent / Material | Function | Example Product/Chemical |
|---|---|---|
| Enzyme-Specific Fluorogenic/Chromogenic Substrate | Allows real-time, spatially resolved measurement of reaction within a catalyst particle via confocal microscopy to visualize diffusion gradients. | Resorufin butyrate (for lipases), FDG (β-galactosidase) |
| Electron Paramagnetic Resonance (EPR) Spin Probes | Quantifies microviscosity and tortuosity inside the porous support matrix to calculate effective diffusivity (D_eff). | Tempamine, carboxyl-PROXYL |
| Mechanically Robust Immobilization Supports | Alternative matrices designed to withstand industrial shear forces while maintaining high enzyme loading. | Eupergit C, Immobead 150, controlled-pore silica |
| Computational Fluid Dynamics (CFD) Software | Models fluid flow, shear stress, and concentration gradients in large reactor geometries to identify dead zones and optimize design. | COMSOL Multiphysics, ANSYS Fluent |
Experimental Protocols
Protocol 1: Determining the Effectiveness Factor (η) for Entrapped Enzymes
Objective: To quantitatively assess the extent of diffusion limitation for an immobilized biocatalyst under defined conditions.
Materials:
- Free enzyme solution (known concentration)
- Uniformly sized entrapped enzyme particles
- Substrate solution (concentration >> expected K_m)
- Well-mixed batch reactor (e.g., stirred vial)
- Assay equipment (spectrophotometer, pH-stat, etc.)
Procedure:
- Place a known mass of entrapped enzyme (where the exact amount of active enzyme is known from loading efficiency studies) into the reactor with a large volume of substrate solution. Ensure perfect mixing (high agitation) to minimize external diffusion.
- Immediately measure the initial reaction rate (V_obs), typically from the first 5-10% of conversion.
- In a separate identical experiment, use the same total amount of active enzyme in its free form.
- Measure the initial reaction rate of the free enzyme (V_free) under identical conditions (pH, T, [S]).
- Calculate the Effectiveness Factor: η = Vobs / Vfree.
- An η of 1 indicates no diffusion limitation; values below 0.8 suggest significant limitations.
Protocol 2: Assessing External Mass Transfer Limitation via Agitation Study
Objective: To determine if the reaction rate is limited by the transfer of substrate from the bulk liquid to the surface of the biocatalyst particle.
Materials:
- Entrapped enzyme particles
- Lab-scale stirred-tank reactor with variable speed control
- Substrate solution
Procedure:
- Set up the reactor with a fixed catalyst loading and substrate concentration.
- Start at a low agitation speed (e.g., 100 rpm), allow conditions to stabilize, and measure the initial reaction rate.
- Systematically increase the agitation speed (e.g., 200, 400, 600, 800 rpm) and measure the initial rate at each step.
- Plot reaction rate vs. agitation speed.
- Interpretation: If the reaction rate increases with agitation speed, external diffusion is limiting in the lower speed range. The point where the rate plateaus and becomes independent of speed indicates the regime where external limitations are minimized, and intrinsic kinetics (or internal diffusion) control the rate. This plateau rate should be used for scale-up kinetic modeling.
Diagrams
Title: Scale-Up Challenges from Lab to Industry
Title: Reaction-Diffusion Steps in Entrapped Enzyme
Technical Support Center
Troubleshooting Guides & FAQs
Q1: Why are my measured Km_app values consistently much higher than the Km for the free enzyme?
- A: This is a classic indicator of severe external diffusion limitation. Substrate cannot diffuse into the carrier matrix fast enough to saturate the enzyme, making the enzyme appear to have a lower affinity (higher Km_app). Troubleshooting Steps:
- Reduce Particle Size: Grind or sieve your immobilized enzyme particles to a smaller, more uniform size.
- Increase Agitation: Significantly increase the stirring or shaking rate in your assay to minimize the stagnant liquid layer (Nernst layer) around the particle.
- Verify Assay Conditions: Ensure your reaction is truly initial rate (≤5% substrate conversion). Run a time course to confirm linear product formation.
Q2: My Vmax_app is drastically reduced after enzyme entrapment. Is my enzyme inactive?
- A: Not necessarily. A large drop in Vmaxapp can result from (a) internal diffusion resistance, (b) loss of enzyme during immobilization, or (c) conformational changes. Troubleshooting Steps:
- Perform an Activity Balance: Measure the activity of the enzyme in the wash fractions post-entrapment and compare to the initial activity used.
- Vary Particle Size: If Vmaxapp increases significantly with smaller particle size, internal diffusion is a major factor.
- Check for pH Shifts: The local microenvironment inside the carrier can have a different pH than the bulk solution. Use substrates or probes that sense the internal pH.
Q3: How can I experimentally distinguish between external and internal diffusion limitations?
- A: Conduct a "Stirring Rate Dependency" experiment.
- Protocol: Measure initial reaction rates at varying stirring speeds (e.g., 100, 200, 400, 600, 800 rpm) while keeping substrate concentration and particle size constant.
- Interpretation: If the rate increases with stirring speed, external diffusion is significant. The speed at which the rate becomes constant is the point where external limitations are minimized. Persistently low rates after this point indicate dominant internal diffusion limitations.
Q4: What is the most reliable way to calculate true kinetic parameters (Kmtrue, Vmaxtrue) for an entrapped enzyme?
- A: You must use a diffusion-reaction model and fit your data accordingly. A common method is the "Iterative Method for Varying Particle Sizes."
- Protocol:
- Prepare batches of entrapped enzyme with at least three distinct, controlled particle radii (R1, R2, R3).
- For each size, measure initial rates over a wide range of substrate concentrations [S] under conditions where external diffusion is eliminated (high stirring).
- Plot each dataset as 1/v vs. 1/[S] (Lineweaver-Burk) to get apparent parameters (Kmapp, Vmaxapp) for each size.
- Fit these apparent parameters to the "Effectiveness Factor (η) Model" (see diagram and table below) using non-linear regression software to solve for the true Km_true and the Thiele Modulus (φ), which contains the effective diffusivity (De).
- Protocol:
Data Presentation
Table 1: Summary of Apparent vs. True Kinetic Parameters for Entrapped Enzymes
| Parameter | Free Enzyme | Entrapped Enzyme (Apparent) | Entrapped Enzyme (True, Corrected) | Primary Cause of Discrepancy |
|---|---|---|---|---|
| Km | Km (µM) | Km_app >> Km | Km_true ≈ Km | Substrate diffusion gradient into/within carrier. |
| Vmax | Vmax (µmol/min) | Vmax_app << Vmax | Vmax_true ≤ Vmax | Combined effect of diffusion resistance & inherent activity loss. |
| Catalytic Efficiency (kcat/Km) | High | Severely Reduced | Moderately Reduced | Diffusion adds a limiting step to the overall reaction rate. |
Table 2: Key Research Reagent Solutions & Materials
| Item | Function & Rationale |
|---|---|
| Alginate (e.g., Sodium Alginate) | Common polysaccharide for ionic gel entrapment (e.g., with CaCl₂). Forms a porous matrix. |
| Polyvinyl Alcohol (PVA) | Used for cryogel entrapment. Creates a macro-porous structure with good mechanical stability. |
| Glutaraldehyde | A crosslinker used to stabilize entrapped enzyme gels or create composite carriers. |
| Substrate Analogue (Non-hydrolyzable) | Used in control experiments to measure static binding/substrate adsorption to the carrier matrix. |
| DEAE-Dextran or PEI | Polyelectrolytes used to create a charged microenvironment, which can affect local substrate concentration. |
| Enzyme Activity Assay Kit (e.g., for HRP, Trypsin) | Standardized colorimetric/fluorometric kits ensure accurate free enzyme activity measurement for baselining. |
| Size Exclusion Beads (for sieving) | To fractionate and obtain immobilized enzyme particles of uniform, known size ranges. |
Experimental Protocols
Protocol: Determining External Diffusion Limitation via Stirring Rate Experiment
- Prepare a standardized suspension of entrapped enzyme particles in buffer.
- Set up a stirred reactor with precise speed control and a thermostatic jacket.
- Add a known concentration of substrate solution to the reactor.
- Initiate the reaction by adding the entrapped enzyme suspension.
- Measure initial rate (e.g., by continuous spectrophotometric assay) at stirring speeds of 100, 200, 400, 600, and 800 rpm.
- Plot measured initial rate (v) vs. stirring speed. A plateau indicates the removal of external diffusion effects. All subsequent kinetic experiments must be conducted at a speed within this plateau region.
Protocol: Iterative Method to Correct for Internal Diffusion
- Generate Data: For three different particle radii (R), determine Michaelis-Menten curves (v vs. [S]) under non-external-limiting conditions.
- Fit Apparent Parameters: For each R, fit the data to
v = (Vmax_app * [S]) / (Km_app + [S])to obtain apparent values. - Model Fit: Fit the obtained Kmapp and Vmaxapp values across different R to the equations for a diffusion-influenced, first-order reaction in a spherical particle:
η = (3 / φ) * (1 / tanh(φ) - 1/φ)where η = Vmaxapp / Vmaxtrue (Effectiveness Factor)φ = R * sqrt(Vmax_true / (Km_true * De))(Thiele Modulus)Km_app = Km_true * (φ / tanh(φ)) / (1 - (φ / tanh(φ)))
- Extract True Parameters: Use numerical tools (e.g., in MATLAB, Python SciPy) to iteratively solve for Kmtrue, Vmaxtrue, and De that best fit all your apparent data across particle sizes.
Mandatory Visualizations
Diagram Title: Pathways of Substrate Diffusion Limitation in Enzyme Carriers
Diagram Title: Workflow to Calculate True Kinetic Parameters
Benchmarking Success: How to Validate and Compare Diffusion-Enhanced Immobilization Platforms
Troubleshooting Guide & FAQs for Entrapped Enzyme Systems
This guide supports researchers in diagnosing and resolving common issues related to the measurement and interpretation of key performance indicators (KPIs) for entrapped enzymes, within the context of addressing diffusion limitations.
FAQ 1: Why is my measured Effectiveness Factor (η) consistently below 0.1, and how can I improve it?
- Issue: A very low Effectiveness Factor (η < 0.1) indicates severe internal diffusion limitations. The substrate cannot reach the enzyme's active sites within the support matrix fast enough compared to the reaction rate.
- Causes & Solutions:
- Cause: Support pore diameter is too small.
- Solution: Switch to a macroporous support material (pore diameter > 50 nm) or increase porogen concentration during synthesis.
- Cause: Enzyme loading is too high, leading to overcrowding and pore blockage.
- Solution: Reduce the enzyme concentration during the immobilization protocol. Perform a loading vs. activity profile to find the optimum.
- Cause: Hydrophobic mismatch between support and substrate.
- Solution: Modify support hydrophilicity/hydrophobicity to match your substrate, or use a charged support to pre-concentrate charged substrates.
- Cause: Support pore diameter is too small.
- Diagnostic Protocol: Perform the Weisz-Prater Criterion experiment.
- Measure the observed reaction rate (
r_obs) under standard conditions. - Measure the effective diffusivity (
D_eff) of your substrate through the enzyme-loaded particle using a batch uptake cell. - Calculate: Φ = (
r_obs*R²) / (C_s*D_eff), where R is particle radius and C_s is surface substrate concentration. - If Φ >> 1, internal diffusion limitations are severe, confirming the low η diagnosis.
- Measure the observed reaction rate (
FAQ 2: My Turnover Number (k_cat) appears lower after immobilization. Is the enzyme damaged?
- Issue: A decrease in the intrinsic
k_catpost-immobilization suggests conformational changes or unfavorable microenvironments, not just diffusion. - Causes & Solutions:
- Cause: Harsh immobilization chemistry causing denaturation.
- Solution: Use gentler, site-specific attachment (e.g., His-tag affinity, glycan targeting) instead of random multipoint covalent binding.
- Cause: Altered local pH or ionic strength within the support microenvironment.
- Solution: Use supports with buffering capacity or measure the local pH with fluorescent probes. Adjust the bulk buffer to compensate.
- Cause: Steric hindrance at the active site.
- Solution: Introduce a longer, more flexible spacer arm between the enzyme and the support matrix.
- Cause: Harsh immobilization chemistry causing denaturation.
- Diagnostic Protocol: Conduct pH-Activity Profile Comparison.
- Measure and plot the activity of the free enzyme vs. pH (range 3-9).
- Measure and plot the activity of the crushed immobilized enzyme particles (to eliminate diffusion) vs. pH.
- A shift in the optimal pH for the immobilized enzyme indicates a change in the local proton concentration, explaining the apparent
k_catdrop.
FAQ 3: How do I distinguish between enzyme inactivation and product inhibition from a declining Operational Half-Life (t_1/2)?
- Issue: A short operational half-life can be due to true enzyme denaturation/leaching or reversible product inhibition.
- Causes & Solutions:
- Cause: Product Inhibition.
- Solution: Implement continuous product removal in the reactor (e.g., in-situ extraction, coupled reactions). Monitor activity after a wash/regeneration step; if restored, inhibition is likely.
- Cause: Enzyme Leaching.
- Solution: Ensure immobilization bonds are stable under operational conditions. Check the supernatant for activity after a batch run.
- Cause: Thermal or chemical denaturation under flow.
- Solution: Improve stabilization via multipoint immobilization after confirming the absence of diffusion limits.
- Cause: Product Inhibition.
- Diagnostic Protocol: Perform a Stop-Flow Recovery Test.
- Run the immobilized enzyme in a packed-bed reactor at steady state.
- Stop the flow for a period equal to 2-3 times the residence time.
- Restart the flow and measure initial activity.
- Full Recovery: Suggests decay was due to continuous inhibition from flow products.
- Partial/No Recovery: Suggests irreversible inactivation during operation.
Quantitative KPI Benchmarks for Entrapped Enzymes Table 1: Expected KPI Ranges and Diagnostic Thresholds
| KPI | Ideal Range (Minimized Diffusion) | Problem Range | Likely Cause |
|---|---|---|---|
| Effectiveness Factor (η) | 0.7 - 1.0 | < 0.3 | Severe Internal Diffusion Limitation |
| Turnover Number (k_cat) | ≥ 90% of free enzyme value | < 50% of free enzyme value | Conformational damage / hostile microenvironment |
| Operational Half-Life (t_1/2) | > 100 hours (process dependent) | < 10 hours | Leaching, denaturation, or strong inhibition |
Research Reagent Solutions Toolkit Table 2: Essential Materials for KPI Analysis in Entrapped Enzyme Research
| Item | Function | Example/Note |
|---|---|---|
| Macroporous Silica Beads (100-300µm, 50-100nm pores) | Provides high surface area & large pores to minimize diffusion resistance. | ChromoX Clarity series, Sigma-Aldrich Immobeads. |
| Epoxy-Activated Support | Enables stable, covalent multipoint immobilization via amine groups. | Sepabeads EC-EP, Agarose-based supports. |
| Fluorescent pH Probe (e.g., FITC-dextran) | Maps local pH microenvironment inside the porous support. | Used in confocal microscopy. |
| Stopped-Flow Spectrophotometer | Measures very fast initial kinetics to estimate intrinsic k_cat free of diffusion. |
Applied Photophysics SX series. |
| Packed-Bed Micro-Reactor | Allows precise measurement of long-term stability (t_1/2) under continuous flow. |
Omnifit glass columns with adjustable bed volume. |
| Effective Diffusivity Measurement Cell | Quantifies substrate diffusion rate (D_eff) through loaded particles. |
Custom or commercial batch adsorption cell. |
Experimental Workflow for Comprehensive KPI Assessment
Diagram Title: Workflow to Diagnose Diffusion Limits & Measure KPIs
Inter-KPI Relationships and Diagnostic Logic
Diagram Title: Diagnostic Logic from Low Activity to Root Cause
Technical Support Center: Troubleshooting Diffusion Limitations in Enzyme Immobilization
Troubleshooting Guides & FAQs
Q1: My entrapped enzyme shows a drastic drop in apparent activity compared to the free enzyme. What is the primary cause and how can I mitigate it? A: The primary cause is diffusion limitation. Substrates must diffuse through the gel or polymer matrix to reach the enzyme, and products must diffuse out. This creates concentration gradients.
- Solution: Reduce the particle size of the entrapped beads to increase surface-area-to-volume ratio. For hydrogel entrapment (e.g., alginate), consider using a higher porosity matrix or composite materials (e.g., alginate-silica). Increasing substrate concentration may also help overcome external diffusion barriers.
Q2: During CLEA preparation, my enzyme loses all activity. What went wrong? A: This typically indicates over-cross-linking or exposure of the enzyme to harsh conditions during precipitation.
- Solution: Optimize the cross-linker (usually glutaraldehyde) concentration and cross-linking time. Perform the precipitation step (using ammonium sulfate, acetone, or tert-butanol) at low temperature (0-4°C) to maintain enzyme stability. Consider co-aggregation with a protective agent like bovine serum albumin (BSA) or polyethylenimine (PEI) before cross-linking.
Q3: Enzymes covalently bound to a carrier show strong attachment but low operational stability in repeated batches. Why? A: While covalent binding prevents leaching, it can induce conformational stress or immobilize the enzyme in an unfavorable rigid orientation. Multipoint attachment can over-stabilize non-optimal conformations.
- Solution: Use a longer, flexible spacer arm (e.g., using glutaraldehyde as a spacer instead of a direct cross-linker) between the carrier and enzyme. Screen different functional groups on the carrier (epoxy, amino, glyoxyl) to alter the binding mode. Ensure the covalent reaction is performed at a pH that maintains enzyme activity, not just carrier reactivity.
Q4: My adsorbed enzyme leaches significantly from the support during washing or reaction, especially at high ionic strength. How do I fix this? A: Adsorption is based on weak physical forces (ionic, hydrophobic, van der Waals). Leaching is its main drawback.
- Solution: Switch to a support with opposite and multiple-point charges or optimized hydrophobic interaction. Alternatively, after adsorption, apply a mild cross-linking step to "lock" enzymes in place (creating Cross-Linked Enzyme Aggregates on the carrier, or CLEA-support composites). Ensure the reaction pH is between the pI of the enzyme and the support to maximize electrostatic attraction.
Q5: For large substrate molecules (e.g., proteins, polysaccharides), which immobilization method is least suitable and why? A: Entrapment in dense gels (e.g., polyacrylamide) is often least suitable. The pore size of the gel can physically restrict the diffusion of large substrates to the active site, causing severe internal diffusion limitations. CLEAs can also pose issues if the aggregation/cross-linking creates a densely packed structure.
- Solution: For large substrates, consider adsorption or covalent binding on the surface of a macroporous carrier with large pore diameters (>100 nm) to ensure unrestricted access. Alternatively, use a highly porous, composite entrapment matrix.
Quantitative Data Comparison
Table 1: Key Characteristics of Enzyme Immobilization Methods
| Feature | Entrapment | Adsorption | Covalent Binding | CLEAs |
|---|---|---|---|---|
| Binding Force | Physical confinement | Weak physical (ionic, hydrophobic) | Strong covalent bonds | Covalent (cross-links) & physical |
| Risk of Leaching | Low (if pore size is correct) | High | Very Low | Very Low |
| Impact on Enzyme Conformation | Low to Moderate | Low to Moderate | High (rigid fixation) | High (rigid network) |
| Diffusion Limitation | Very High (Primary Issue) | Low (surface-bound) | Low to Moderate | Moderate to High |
| Carrier/Matrix Required | Yes (gel, polymer, sol-gel) | Yes (porous support) | Yes (functionalized support) | No |
| Apparent Activity Yield | Often Low (30-60%) | High (70-90%) | Variable (40-80%) | Variable (50-80%) |
| Operational Stability | Good | Poor to Fair | Excellent | Excellent |
| Suitable for Large Substrates | Poor | Good | Good | Fair |
Table 2: Experimental Optimization Parameters to Address Diffusion Limits
| Method | Key Parameter to Vary | Target for Reducing Diffusion Limitation | Typical Optimal Range |
|---|---|---|---|
| Entrapment | Bead/Particle Size | Smaller diameter | 0.2 - 0.5 mm |
| Entrapment | Matrix Porosity | Larger pore size / lower polymer % | 2-4% (w/v) alginate; use porogens |
| Covalent/CLEAs | Particle Size after Immobilization | Smaller aggregate or carrier size | < 100 µm |
| All | Substrate Concentration | Higher [S] to drive diffusion | > 10 x Km (if practical) |
| All | Stirring/Agitation Rate | Reduce external liquid film layer | > 150 rpm (bench-scale) |
Detailed Experimental Protocols
Protocol 1: Assessing Diffusion Limitation in Calcium Alginate Entrapped Enzymes
- Immobilization: Dissolve sodium alginate (2% w/v) in buffer. Mix with enzyme solution (1:1 ratio). Dropwise add the mixture into 0.1M CaCl₂ solution using a syringe pump to form beads (~0.5 mm). Cure for 30 min. Wash.
- Activity Assay: Perform standard activity assays on free and immobilized enzyme at varying substrate concentrations (e.g., 0.5Km to 20Km).
- Diffusion Test: Crush a batch of beads and re-assay activity. Compare the activity of intact vs. crushed beads. A significant increase in crushed bead activity indicates severe internal diffusion limitation.
- Thiele Modulus Estimation: Use the observed effectiveness factor (η = Vimmob/Vfree) and substrate concentration data to approximate the Thiele modulus, quantifying diffusion resistance.
Protocol 2: Preparation and Optimization of CLEAs
- Precipitation: Cool enzyme solution in buffer (e.g., 0.1 M phosphate, pH 7.0) to 4°C. Slowly add pre-chilled tert-butanol* under gentle stirring until the solution becomes turbid (typically 1:1 v/v). Maintain at 4°C for 30 min.
- Cross-Linking: Centrifuge the aggregate suspension (5000 rpm, 5 min, 4°C). Resuspend the pellet in a small volume of cold buffer. Add glutaraldehyde (Grade I, 25% solution) dropwise to a final concentration of 10-50 mM. Stir gently at 4°C for 1-3 hours.
- Quenching & Washing: Stop the reaction by adding a glycine solution (final 1M) to quench unreacted glutaraldehyde. Wash aggregates thoroughly with cold buffer and then with deionized water.
- Optimization: Repeat the process varying glutaraldehyde concentration (10, 25, 50 mM) and cross-linking time (1, 2, 3 h). Measure activity recovery and operational stability (repeated batch use) to find the optimal condition.
Protocol 3: Covalent Binding to Epoxy-Activated Carriers
- Carrier Preparation: Use commercial epoxy-activated methacrylic polymer (e.g., Eupergit C) or silica.
- Immobilization: Suspend 1g of carrier in 10 mL of enzyme solution (2-5 mg/mL in 0.1-1.0 M phosphate buffer, pH 7.0-8.0). High ionic strength phosphate promotes multipoint covalent attachment via nucleophilic attack on the epoxy groups.
- Incubation: Shake the mixture gently at 25°C for 24-72 hours.
- Blocking & Washing: Filter the carrier and incubate in 1M ethanolamine (pH 8.0) for 4h to block remaining epoxy groups. Wash extensively with buffer and high-salt solution (1M NaCl) to remove adsorbed enzyme.
Diagrams
Diagram Title: Substrate Diffusion Pathway in Entrapment
Diagram Title: Entrapment vs CLEA Preparation
Diagram Title: Method Selection to Reduce Diffusion
The Scientist's Toolkit: Research Reagent Solutions
| Item | Function in Context of Diffusion Limitations |
|---|---|
| Sodium Alginate (Low Viscosity) | Hydrogel polymer for entrapment. Use low viscosity grades for easier handling and potentially more uniform pore structure. |
| Epoxy-Activated Carrier (e.g., Eupergit C) | For covalent binding. Provides stable, multipoint attachment. High porosity variants help reduce internal diffusion. |
| Glutaraldehyde (25%, Grade I) | Cross-linker for CLEAs and for stabilizing adsorbed enzymes. Optimize concentration critically to avoid excessive diffusion barriers. |
| tert-Butanol (HPLC Grade) | Precipitating agent for CLEA formation. Less denaturing than acetone or ethanol for many enzymes. |
| Polyethylenimine (PEI), Branched | Used as a proteic feeder in co-aggregation for CLEAs or as a coating. Can alter aggregate porosity and reduce diffusion limits. |
| Silica Nanopowder (Mesoporous) | Can be mixed into alginate gels to create composite entrapment matrices with higher mechanical strength and tailored porosity. |
| Porogens (e.g., PEG 6000) | Added to entrapment polymer solutions and later washed out to create larger, more defined pores in the matrix. |
| Dynamic Light Scattering (DLS) Instrument | For measuring the particle size of CLEAs or immobilized enzyme particles. Smaller, uniform size reduces diffusion path length. |
Technical Support Center: Troubleshooting and FAQs
This support center is designed for researchers working on characterizing enzyme entrapment systems to overcome diffusion limitations, a critical challenge in biocatalysis and drug development.
Frequently Asked Questions (FAQs)
Q1: My BET adsorption isotherm for my polymeric enzyme support shows no plateau at high P/P0, and the pore volume appears unrealistically high. What is the issue? A: This typically indicates the presence of macropores or non-rigid, swellable materials. The BET theory assumes Type II/IV isotherms for mesoporous materials. For polymeric gels or macroporous supports, nitrogen can condense in interparticle spaces, leading to overestimation. Solution: 1) Use a model like the t-plot or BJH method to separate micropore/mesopore volume from total uptake. 2) Consider using a non-swelling probe fluid (like mercury porosimetry for larger pores) or characterize swelling separately in your liquid reaction buffer.
Q2: My CLSM images of fluorescently-labeled entrapped enzymes show poor signal and high background noise. How can I improve image quality? A: This is common due to light scattering in porous matrices and potential dye quenching. Troubleshooting Protocol:
- Sample Preparation: Ensure thorough washing to remove unbound dye. Consider using a counterstain (e.g., for the carrier) with a spectrally separated channel.
- Microscope Settings: Increase the pinhole size slightly (e.g., to 2 Airy Units) to gather more light, but be aware of decreased Z-resolution. Use frame averaging (4-8x) to reduce noise.
- Dye Selection: Switch to a brighter, more photostable dye (e.g., Alexa Fluor 488 over FITC) and confirm its excitation maximum matches your laser lines.
Q3: FTIR spectra of my entrapped enzyme show broad, overlapping amide I bands, making it hard to assess conformational changes. What alternatives exist? A: The porous support's own IR absorption can obscure protein signals. Solution: Use ATR-FTIR (Attenuated Total Reflectance) mode for surface-specific analysis. For better resolution of amide I bands:
- Ensure complete dehydration of the sample (water vapor causes broad bands).
- Apply Fourier Self-Deconvolution or Second Derivative analysis to resolve overlapping peaks (e.g., α-helix at ~1655 cm⁻¹, β-sheet at ~1630 cm⁻¹).
- As a complementary technique, consider Fluorescence Spectroscopy using intrinsic tryptophan residues for microenvironment sensing.
Q4: How do I quantitatively correlate BET surface area with observed enzyme activity loss after entrapment? A: Surface area alone is insufficient. You must consider effective diffusivity. Experimental Protocol:
- Measure BET surface area (SBET) and average pore diameter (dp).
- Perform a kinetic assay with both free and entrapped enzyme. Calculate observed activity (Vobs).
- Estimate the Thiele modulus (Φ) and effectiveness factor (η) using formulas that incorporate dp, enzyme loading density, and substrate diffusivity (Deff). A low η (<0.7) confirms severe diffusion limitation despite high SBET.
- Correlate η with dp from BET.
Table 1: Common Characterization Data for Enzyme Entrapment Supports
| Support Material | BET Surface Area (m²/g) | Avg. Pore Diameter (nm) | CLSM Imaging Suitability (1-5)* | Key FTIR Band for Linkage |
|---|---|---|---|---|
| Mesoporous Silica (SBA-15) | 500 - 800 | 6 - 10 | 4 (Low autofluorescence) | Si-O-Si (~1080 cm⁻¹) |
| Alginate Gel Bead | 5 - 50 | >100 (mesh size) | 3 (Moderate scattering) | Carboxylate (~1600 cm⁻¹) |
| Macroporous Polymer (Polyacrylamide) | 150 - 300 | 30 - 100 | 2 (High scattering) | Amide I/II (~1650, ~1550 cm⁻¹) |
| Metal-Organic Framework (ZIF-8) | 1000 - 2000 | 1.5 - 2.5 | 1 (Opaque) | C=N (~1140 cm⁻¹) |
CLSM Suitability Scale: 5=Excellent, 1=Poor.
Table 2: Troubleshooting CLSM for Distribution Analysis
| Problem | Possible Cause | Diagnostic Test | Solution |
|---|---|---|---|
| No Fluorescence Signal | Dye quenching, Wrong laser line | Check dye absorbance spectrum | Use a different dye label (e.g., Rhodamine B) |
| Uneven Illumination ("Vignetting") | Misaligned laser or dirty optics | Image a uniform fluorescent slide | Perform microscope laser/PMT alignment |
| Poor Z-resolution (Blurry stacks) | Pinhole too open, Refractive index mismatch | Measure PSF with submicron beads | Adjust pinhole to 1 AU; Use correct immersion oil |
Experimental Protocols
Protocol 1: BET Analysis for Enzyme Support Porosity
- Degas: Pre-treat ~0.1g of dry sample at 120°C under vacuum (or N₂ flow) for 12 hours to remove adsorbates.
- Analysis: Load sample into analysis port. Use liquid N₂ (77K) as coolant. Measure N₂ adsorption/desorption isotherms across P/P₀ = 0.01 - 0.99.
- Calculation: Use the BET equation in the linear relative pressure range (typically P/P₀ = 0.05 - 0.30). The slope and intercept give the monolayer volume (Vm). Surface Area = (Vm * N * σ) / (M * m), where N=Avogadro's number, σ=cross-sectional area of N₂ (0.162 nm²), M=molar volume, m=sample mass.
- Pore Size: Apply the Barrett-Joyner-Halenda (BJH) model to the desorption branch to calculate pore size distribution.
Protocol 2: CLSM for 3D Enzyme Distribution
- Labeling: Covalently label enzyme with FITC or Alexa Fluor 488 via lysine residues. Purify via gel filtration.
- Entrapment & Sectioning: Immobilize labeled enzyme. For solid supports, create a thin slice (<1mm) with a microtome. For gels, mount directly.
- Imaging: Use a 20x or 40x immersion objective. Set excitation/emission for your dye (e.g., 488/510-550 nm for FITC). Acquire Z-stacks with a step size of 0.5 - 1.0 µm.
- Analysis: Use software (e.g., ImageJ, Imaris) to create 3D reconstructions and intensity profile plots to quantify distribution heterogeneity.
The Scientist's Toolkit: Research Reagent Solutions
| Item | Function in Characterization |
|---|---|
| Liquid Nitrogen | Cryogen for BET surface area analysis (77K) and for freezing CLSM samples. |
| Fluorescent Dye (NHS ester of Alexa Fluor 488) | Covalently labels primary amines (-NH₂) on enzymes for CLSM visualization. |
| Potassium Bromide (KBr) | IR-transparent matrix for preparing pellets for transmission FTIR analysis of solid supports. |
| Ethidium Homodimer or Propidium Iodide | Counterstain for CLSM to visualize porous matrix structure if it contains nucleic acids or specific polymers. |
| Deuterium Oxide (D₂O) | Solvent for FTIR analysis of enzymes to shift the broad O-H stretch of water away from the amide I region. |
| Non-ionic Detergent (e.g., Tween-20) | Added to washing buffers for CLSM samples to reduce non-specific binding of fluorescent labels. |
Workflow and Relationship Diagrams
Troubleshooting Low Activity in Entrapped Enzymes
Multi-Technique Workflow for Enzyme Support Analysis
Technical Support Center
Troubleshooting Guides & FAQs
Q1: In our continuous-flow packed-bed reactor, we observe a rapid drop in product yield after initial operation. What are the primary causes and solutions?
A: This is typically due to enzyme leaching or substrate/product diffusion limitations within the carrier matrix.
- Solution A (Leaching): Ensure covalent immobilization protocol was followed correctly. Check coupling buffer pH and confirm that functional groups on the support (e.g., epoxy, amine) are fresh. Monitor flow rate; excessive shear can cause physical detachment.
- Solution B (Diffusion): Reduce particle size of the immobilized enzyme carrier or switch to a monolithic flow reactor design to decrease internal diffusion path length. Increase residence time by reducing flow rate to allow for deeper substrate penetration.
Q2: Our immobilized enzyme system shows significant latency or lag time before reaching maximal catalytic rate in a flow system. How can this be mitigated?
A: This latency is a classic symptom of pore diffusion limitation.
- Mitigation Strategy: Employ a gradient pumping protocol. Start the reaction with a lower substrate concentration and a reduced flow rate for 10-15 minutes to allow for steady-state concentration gradients to establish within the catalyst particle, then gradually ramp up to operational parameters. Pre-wetting the biocatalyst cartridge with reaction buffer (without substrate) for 30 minutes prior to initiation can also help.
Q3: We encounter frequent clogging in our microfluidic drug delivery nanoparticle synthesis device. What steps should we take?
A: Clogging often stems from particle aggregation or unsuspended solids.
- Preventive Actions:
- Implement inline filters (e.g., 0.5 or 1.0 µm) immediately before the microfluidic chip inlet.
- Sonicate all reagent solutions for 5-10 minutes prior to loading into syringes.
- Include a surfactant (e.g., 0.01% v/v Tween 80) in aqueous phases to reduce fouling.
- Designate a regular cleaning protocol with 1M NaOH solution followed by copious amounts of purified water.
Q4: How can we accurately determine if our system is limited by reaction kinetics versus mass transfer (diffusion)?
A: Perform a Damköhler number (Da) analysis through a simple experiment.
- Protocol: Run the continuous reaction at a fixed temperature and substrate concentration but vary the flow rate (which changes the residence time, τ). Plot observed reaction rate vs. τ. If the rate increases linearly with τ and then plateaus, you are transitioning from kinetic to diffusion control. A complementary test is to reduce immobilized enzyme particle size by 50%. If the observed rate increases significantly, internal diffusion is limiting.
Experimental Protocols
Protocol 1: Assessing Effective Diffusivity in a Porous Immobilization Support
Objective: To determine the effective diffusivity (D_e) of a substrate within a porous enzyme carrier.
- Immobilize a non-catalytic, fluorescent probe molecule (e.g., FITC-dextran of similar MW to your substrate) onto your chosen carrier using the same chemistry used for your enzyme.
- Pack the carrier into a small column (0.5 cm diameter).
- Flow a buffer solution through the column at a low, constant rate (0.2 mL/min).
- Inject a pulse of a known concentration of the same probe molecule at the inlet.
- Measure the concentration of the probe at the outlet over time using a fluorescence detector.
- Analyze the breakthrough curve (outlet concentration vs. time). The dispersion and delay of the pulse compared to a non-porous control are used to calculate D_e via the moment method or curve fitting to an axial dispersion model.
Protocol 2: Continuous-Flow Synthesis of Enzyme-Loaded Therapeutic Nanoparticles
Objective: To reproducibly synthesize polymeric nanoparticles with entrapped enzyme drug via a micromixer.
- Prepare Solutions:
- Organic Phase: Dissolve 50 mg of PLGA polymer and 5 mg of the enzyme (lyophilized) in 5 mL of dichloromethane (DCM).
- Aqueous Phase: Dissolve 100 mg of polyvinyl alcohol (PVA) in 20 mL of deionized water.
- Assembly: Load each solution into separate syringes. Connect syringes to a T-junction or staggered herringbone micromixer via PTFE tubing.
- Process: Use a dual-syringe pump to drive both phases at a combined flow rate of 10 mL/min into the mixer. The turbulent mixing precipitates the PLGA, encapsulating the enzyme.
- Collection & Purification: Collect the emulsion in a beaker under magnetic stirring for 3 hours to evaporate DCM. Centrifuge the resulting nanoparticle suspension at 20,000 x g for 15 minutes, wash twice with water, and resuspend in buffer for characterization.
Data Presentation
Table 1: Impact of Carrier Properties on Observed Reaction Efficiency
| Carrier Material | Pore Size (nm) | Particle Diameter (µm) | Immobilization Yield (%) | Observed Effectiveness Factor (η)* | Primary Limitation Identified |
|---|---|---|---|---|---|
| Silica Gel | 10 | 150-200 | 85 | 0.15 | Internal Diffusion |
| Agarose Bead | 60 | 100-150 | 70 | 0.45 | Internal Diffusion |
| Methacrylate Monolith | 1000 | 1000 (disc) | 90 | 0.95 | Kinetics |
| Magnetic Nanoparticle | 15 | 0.5-1.0 | 60 | 0.98 | Enzyme Leaching |
*Effectiveness Factor (η): Ratio of observed reaction rate to the rate if all enzyme were freely exposed to bulk substrate concentration. η < 1 indicates diffusion limitation.
Table 2: Performance Metrics in Continuous-Flow Biocatalysis vs. Batch
| System Type | Residence Time (min) | Space-Time Yield (g·L⁻¹·h⁻¹) | Enzyme Productivity (kg product / kg enzyme) | Operational Stability (Half-life, days) |
|---|---|---|---|---|
| Stirred Batch Reactor | 180 | 5.2 | 0.8 | 7 |
| Packed-Bed Reactor (PBR) | 30 | 18.7 | 4.5 | 21 |
| Microfluidic Reactor (Laminar Flow) | 5 | 42.1 | 10.2 | 15 |
| CSTR Cascade (3 reactors) | 60 (total) | 28.5 | 6.8 | 35 |
Diagrams
Title: Mass Transfer Steps in an Immobilized Enzyme System
Title: Diagnostic Flowchart for Diffusion Limitations
The Scientist's Toolkit: Research Reagent Solutions
| Item | Function & Rationale |
|---|---|
| Epoxy-Activated Agarose Beads | A common support for covalent enzyme immobilization. The epoxy group reacts with amine, thiol, or hydroxyl groups on the enzyme under mild pH conditions, providing a stable linkage resistant to leaching. |
| PLGA (Poly(lactic-co-glycolic acid)) | A biodegradable, FDA-approved copolymer used for nanoparticle drug delivery. Its erosion time can be tuned by the LA:GA ratio, allowing controlled release of entrapped therapeutic enzymes. |
| Spacer Arms (e.g., 1,6-Diaminohexane) | Used in immobilization chemistry to create a molecular "arm" between the carrier surface and the enzyme. This reduces steric hindrance, improving substrate access and catalytic efficiency. |
| Fluorescent Dextran Probes | Molecules of known molecular weight used as inert tracers in diffusion experiments. They help map flow paths and quantify effective diffusivity within porous supports without catalytic interference. |
| Staggered Herringbone Micromixer | A microfluidic chip design that induces chaotic advection at low Reynolds numbers, ensuring rapid and complete mixing of phases for uniform nanoparticle synthesis or efficient substrate-enzyme contact. |
| Multi-Enzyme Cofactor Regeneration System (e.g., NADH/NAD+ with Formate Dehydrogenase) | Essential for running continuous-flow reactions requiring expensive cofactors. A second, sacrificial enzyme regenerates the active cofactor form in situ, making the process economically viable. |
Technical Support Center: Troubleshooting Entrapped Enzyme Systems
Context: This support content is designed for researchers working within a thesis framework focused on overcoming diffusion limitations in entrapped enzyme systems for biocatalysis and drug delivery. The following guides address common computational and experimental challenges.
Frequently Asked Questions (FAQs) & Troubleshooting
Q1: My computational model of substrate diffusion into a hydrogel particle shows significantly faster uptake than my experimental data. What could be the cause? A: This is a classic sign of over-simplified model parameters. Key factors to check:
- Pore Size Distribution: Your model likely uses an average pore size. In reality, hydrogels have a distribution. Implement a stochastic element for pore size in your simulation.
- Obstructed Diffusion: The model may assume free aqueous diffusion. Incorporate an obstruction factor (γ) which reduces the effective diffusivity. The equation is typically: ( D{eff} = D{bulk} * \frac{\epsilon}{\tau} ), where ε is porosity and τ is tortuosity. Ensure your τ value is >1.
- Polymer-Solute Interactions: Check for unaccounted hydrophobic or electrostatic interactions between the substrate and polymer network that slow diffusion.
Q2: When simulating multi-enzyme cascades in a microsphere, how do I model the effect of local pH change from the first reaction on the activity of the second enzyme? A: You need to couple reaction-diffusion equations with a pH-dependent activity function.
- Define Variables: Concentration of Substrate 1 (S1), Product 1/Substrate 2 (P1/S2), Product 2 (P2), and local [H⁺].
- Couple Equations: For each species, solve ( \frac{\partial C}{\partial t} = D_{eff} \nabla^2 C + R ) where R is the reaction rate term.
- Incorporate pH Effect: Modify the kinetic rate constant (kcat or KM) for the pH-sensitive enzyme using a Bell-shaped or similar activity-pH function derived from experimental characterization. The simulation must update local kinetic parameters at each computational node based on the instantaneous local [H⁺].
Q3: My experimental data on product formation rate plateaus earlier than the model predicts. What experimental factors should I investigate? A: This suggests an unmodeled deactivation or limitation.
- Enzyme Instability: The model assumes constant enzyme activity. Run a control experiment to measure free enzyme stability under reaction conditions. Incorporate a time-dependent deactivation term (e.g., first-order decay) into your model.
- Product Inhibition: Check literature or perform assays to see if the product inhibits your enzyme. Add a competitive or non-competitive inhibition term to your model's kinetics.
- Internal Mass Transfer Limitation (Thiele Modulus): The enzyme loading might be too high, causing severe diffusion limitations. Estimate the Thiele modulus (φ). If φ >> 1, the effectiveness factor (η) is low, and most enzyme in the core is underutilized. Consider using smaller particles or reducing loading in your next experiment.
Experimental Protocols Cited in Support Content
Protocol 1: Determining Effective Diffusivity (D_eff) in a Hydrogel Slab Objective: To experimentally measure the effective diffusivity of a substrate through an enzyme-entrapping hydrogel for validation of computational models. Materials: See "Research Reagent Solutions" table. Method:
- Prepare and cast hydrogel (e.g., 4% alginate) with uniform thickness (L) in a diffusion cell, separating a donor and acceptor chamber.
- Fill the donor chamber with a known concentration of substrate (C₀). The acceptor chamber contains buffer.
- Stir both chambers continuously to eliminate external film resistance.
- At regular time intervals, sample a small volume from the acceptor chamber and assay for substrate concentration (C_t).
- Calculate Deff using the solution for Fick's second law for a slab under sink conditions: ( \frac{Mt}{M\infty} = 1 - \sum{n=0}^{\infty} \frac{8}{(2n+1)^2\pi^2} \exp\left(\frac{-D{eff}(2n+1)^2\pi^2 t}{L^2}\right) ), where Mt is mass transferred at time t and M∞ is at equilibrium. Fit the early-time data (Mt/M∞ < 0.6) to a simplified form: ( \frac{Mt}{M\infty} = \frac{4}{L}\sqrt{\frac{D{eff} t}{\pi}} ).
Protocol 2: Measuring Enzyme Activity and Leakage from Porous Silica Nanoparticles Objective: To quantify immobilization efficiency and operational stability. Method:
- Immobilization: Incubate porous silica particles (e.g., SBA-15) with enzyme solution at 4°C for 24h. Separate particles by centrifugation.
- Leakage Assay: Measure protein content (via Bradford assay) in the supernatant pre- and post-immobilization to calculate loading efficiency. Resuspend immobilized enzyme particles in buffer and incubate at operational temperature (e.g., 37°C). Sample supernatant at set intervals (1h, 24h, 48h) and measure protein/content and/or activity to assess leakage.
- Activity Assay: For both free and immobilized enzyme, add excess substrate and measure initial product formation rate spectrophotometrically. Compare rates to determine retained activity post-immobilization.
Data Presentation Tables
Table 1: Comparison of Simulated vs. Experimental Diffusion Parameters for Common Matrices
| Material | Simulated Avg. Pore Size (nm) | Experimental Pore Size (nm) via BET | Simulated Deff/Dbulk | Experimental Deff/Dbulk (Protocol 1) |
|---|---|---|---|---|
| Alginate (2%) | 15.2 | 12.4 ± 3.8 | 0.45 | 0.38 ± 0.05 |
| Mesoporous Silica (SBA-15) | 8.5 | 8.1 ± 0.5 | 0.22 | 0.25 ± 0.03 |
| Polyacrylamide (10%) | 5.1 | 4.8 ± 1.5 | 0.18 | 0.12 ± 0.02 |
Table 2: Impact of Thiele Modulus (φ) on Observed Reaction Efficiency
| Enzyme Loading (mg/g support) | Calculated φ | Effectiveness Factor (η) | Observed Rate (µmol/min/g) | % of Theoretical Max Rate |
|---|---|---|---|---|
| 10 | 0.8 | 0.85 | 85 | 85% |
| 50 | 1.8 | 0.55 | 137 | 55% |
| 100 | 3.6 | 0.28 | 140 | 28% |
Assumption: First-order kinetics, spherical particle radius 100µm.
The Scientist's Toolkit: Research Reagent Solutions
| Item | Function in Entrapped Enzyme Research |
|---|---|
| Sodium Alginate (High G-Content) | Forms strong, porous hydrogels via divalent cation crosslinking (e.g., Ca²⁺); allows gentle enzyme entrapment. |
| Aminopropyltriethoxysilane (APTES) | Silane coupling agent; functionalizes silica surfaces with -NH₂ groups for covalent enzyme immobilization. |
| Glutaraldehyde (25% solution) | Crosslinker; creates covalent bonds between enzyme amine groups and support -NH₂ groups, reducing leakage. |
| Fluorescein Isothiocyanate (FITC)-Dextran Probes | Sized polymeric probes (e.g., 4kDa, 40kDa) used to experimentally map pore accessibility and diffusion coefficients. |
| Thiele Modulus Calculator (Custom Script) | MATLAB/Python script to estimate φ from particle size, loading, and kinetics; predicts severity of diffusion limits. |
| Multi-Physics Simulation Software (COMSOL, ANSYS) | Platforms for solving coupled reaction-diffusion-conjugation equations in complex 3D geometries. |
Visualizations
Title: Iterative Model-Experiment Workflow for Material Design
Title: Sequential Resistance Model for Entrapped Enzyme
Economic and Feasibility Assessment for Industrial and Clinical Translation
Technical Support Center
FAQs & Troubleshooting for Enzymatic Diffusion Limitation Experiments
Q1: During assay of my entrapped enzyme (e.g., in a silica gel), I observe a rapid initial product formation that quickly plateaus. What is the likely cause and how can I diagnose it? A: This is a classic symptom of severe internal diffusion limitation. The initial burst represents reaction at the periphery of the carrier, while substrate cannot diffuse inwards rapidly enough to sustain the rate.
- Troubleshooting Steps:
- Vary Particle Size: Repeat the assay with systematically crushed/sieved carrier particles of different diameters (e.g., 500µm, 200µm, 50µm). If the initial rate increases significantly with smaller size, diffusion is limiting.
- Check the Thiele Modulus: Calculate this dimensionless number. A value >>1 confirms strong diffusion limitation. The formula is: Φ = L * √(Vmax / (Km * Deff)), where L is particle radius, Deff is effective substrate diffusivity.
- Increase Agitation: If increasing stir speed in a batch reactor increases the observed rate, external film diffusion may also be contributing.
Q2: My enzyme leaching studies show >5% loss after 24 hours of operation, compromising economic feasibility. How can I improve immobilization stability? A: Leaching indicates weak or insufficient binding.
- Solutions:
- Cross-linking: Post-immobilization treatment with a mild cross-linker (e.g., glutaraldehyde) can create a stabilizing network. Optimize concentration and time to avoid active site blockage.
- Multipoint Attachment: Switch from simple adsorption to covalent attachment using a functionalized carrier (e.g., amino-, epoxy-, or glyoxyl-activated supports). This provides multiple covalent bonds between enzyme and matrix.
- Carrier Surface Modification: Introduce hydrophilic spacers (like polyethylene glycol) on the carrier before activation to reduce unfavorable enzyme-carrier interactions that can destabilize the protein.
Q3: When scaling up my packed-bed reactor with immobilized enzyme, the conversion drops significantly compared to the small-scale column. What are the key scale-up parameters? A: This often results from poor flow distribution and exacerbated diffusion gradients.
- Checklist:
- Bed Height & Diameter Ratio: Ensure proper column geometry. Tall, narrow beds can cause high pressure drop and channeling.
- Flow Distribution System: Verify the design of inlet/outlet manifolds. Use flow distributors (e.g., sintered discs) for uniform flow.
- Damköhler Number Analysis: Compare the reaction rate to the flow rate. Da = (Vmax/Km) * (Bed Volume) / (Flow Rate). A Da >>1 at scale suggests the residence time is insufficient due to flow maldistribution, not intrinsic kinetics.
Q4: How do I accurately determine the effective diffusivity (Deff) of a substrate in my porous biocatalyst particle? A: Deff is critical for modeling and is measured experimentally.
- Protocol: Moment Analysis in a Packed-Bed Reactor:
- Prepare: Pack a small column with enzyme-free carrier material.
- Pulse Input: Inject a sharp pulse of your substrate solution into the carrier bed.
- Measure: Use an in-line detector (e.g., UV, conductivity) at the outlet to record the residence time distribution (RTD) curve.
- Calculate: Deff is obtained by analyzing the variance (spread) of the RTD curve, factoring in bed porosity and particle geometry. The formula relates variance (σ²) to Deff: σ² ∝ (L * u) / Deff, where L is bed length, u is superficial velocity.
Table 1: Comparative Economic Indicators for Enzyme Immobilization Methods
| Method | Typical Enzyme Loading (mg/g carrier) | Relative Cost (Carrier + Chemistry) | Operational Stability (Half-life) | Reusability (Cycles) | Suitability for Diffusion-Sensitive Reactions |
|---|---|---|---|---|---|
| Adsorption | 10-50 | Low | Low (Hours-Days) | 5-20 | Poor (Leaching risk) |
| Covalent Binding | 5-100 | Medium-High | High (Days-Months) | 50-500 | Good (Rigid attachment) |
| Entrapment/Encapsulation | 20-200 | Low-Medium | Medium-High | 20-100 | Critical (Diffusion barrier is inherent) |
| Cross-Linked Enzyme Aggregates (CLEAs) | 200-500 (pure enzyme) | Low | High | 100-1000 | Medium (Dependent on aggregate size) |
Table 2: Impact of Diffusion on Observed Kinetic Parameters
| Diffusional Regime | Thiele Modulus (Φ) | Effectiveness Factor (η) | Observed Reaction Rate vs. Intrinsic Rate | Impact on Apparent Km |
|---|---|---|---|---|
| Kinetic Control | < 0.3 | ≈ 1 | Same | No change |
| Internal Diffusion Limitation | > 3 | < 1 (η ≈ 1/Φ) | Significantly Reduced | Appears Increased |
| Severe Pore Diffusion | > 10 | << 1 | Drastically Reduced | Greatly Increased |
Experimental Protocols
Protocol 1: Determining the Effectiveness Factor (η) to Quantify Diffusion Limitation Objective: To measure the ratio of the actual observed reaction rate to the intrinsic rate of the free enzyme.
- Free Enzyme Assay: Perform a standard kinetic assay with the native enzyme in solution. Determine the intrinsic maximum velocity (Vmax,intrinsic) and Michaelis constant (Km,intrinsic).
- Immobilized Enzyme Assay: Under identical bulk conditions (pH, T, substrate concentration), assay the immobilized enzyme. Use finely crushed particles (<50µm) to minimize diffusion resistance and approximate the intrinsic rate of the immobilized form (Vmax,immob).
- Calculation: The effectiveness factor (η) is calculated at a specific substrate concentration [S]: η = (Observed rate with intact immobilized particle) / (Rate from Step 2 with crushed particles at the same [S]). An η < 0.9 indicates significant diffusion limitation.
Protocol 2: Batch Reactor Reusability & Leaching Test for Feasibility Assessment Objective: To assess operational stability and economic potential over multiple cycles.
- Setup: Conduct a standard reaction in a stirred-tank batch reactor using a known amount of immobilized enzyme.
- Cycle Execution: Run the reaction for a fixed time (e.g., 1 hour) or to a target conversion (e.g., 80%). Separate the biocatalyst via filtration or centrifugation.
- Analysis: Measure product concentration in the supernatant to calculate activity.
- Wash & Reuse: Gently wash the biocatalyst with buffer. Reintroduce it to fresh substrate solution for the next cycle.
- Leaching Measurement: After each cycle, assay the supernatant (from step 3) for protein content (e.g., Bradford assay) and/or residual catalytic activity after removing the solid catalyst. Report activity retention (%) and cumulative leached protein per cycle.
Visualizations
Diagram 1: Substrate Diffusion & Reaction in a Porous Carrier
Diagram 2: Workflow for Economic Feasibility Assessment
The Scientist's Toolkit: Key Research Reagent Solutions
Table 3: Essential Materials for Entrapped Enzyme Diffusion Studies
| Item | Function & Relevance to Diffusion Studies |
|---|---|
| Amino-functionalized Silica Beads | Covalent immobilization carrier. Particle size and porosity are critical variables for tuning diffusion path length. |
| Glutaraldehyde (Cross-linker) | Stabilizes immobilized enzymes against leaching. Concentration must be optimized to prevent excessive pore blockage. |
| Fluorescently-tagged Substrate Analog (e.g., FITC-Dextran) | A probe for visualizing and quantifying substrate penetration depth into porous carriers via confocal microscopy. |
| Enzyme Activity Assay Kit (e.g., Glucose Oxidase/Peroxidase coupled) | For precise, high-throughput measurement of reaction rates (observed activity) under different diffusion regimes. |
| Particle Size Analyzer | To characterize and ensure uniform carrier particle size distribution, a key parameter in Thiele modulus calculation. |
| Packed-Bed Reactor (Miniature) | Bench-scale system for determining effective diffusivity (Deff) via moment analysis and studying flow-related diffusion effects. |
Standardization and Reporting Best Practices for Reproducible Research
Technical Support Center
Troubleshooting Guides & FAQs
Q1: Our entrapped enzyme assay shows high initial activity that rapidly declines. What could be causing this, and how do we troubleshoot?
A: This is a classic symptom of substrate or product diffusion limitation. Follow this troubleshooting protocol:
- Confirm Diffusion Limitation: Perform the "Activity vs. Enzyme Loading" test. If increasing the amount of entrapped enzyme beyond a certain point does not increase reaction velocity, diffusion is limiting.
- Check Immobilization Matrix: Increase porosity by adjusting polymer concentration or cross-linker ratio during entrapment. Refer to Table 1 for optimization guidelines.
- Assay Conditions: Increase agitation speed in your reactor/batch assay to reduce the external boundary layer. For substrates, consider increasing concentration if possible.
Q2: How should we report immobilization efficiency to ensure other labs can replicate our work?
A: You must report a minimum set of quantitative parameters. Use the following standardized calculation and report data as in Table 2.
- Immobilization Yield (%) =
(Total activity of entrapped biocatalyst / Total activity of initial free enzyme used) * 100 - Activity Recovery (%) =
(Specific activity of entrapped biocatalyst / Specific activity of free enzyme) * 100 - Loading Capacity (mg enzyme / g support) =
(Mass of enzyme initially offered - Mass of enzyme in supernatant) / Mass of support
Always specify the method for determining protein content (e.g., Bradford assay) and activity assay conditions (pH, T, substrate conc., assay time).
Q3: Our Michaelis-Menten kinetics for an entrapped enzyme are inconsistent between batches. What reporting standards are we missing?
A: Inconsistent apparent kinetics (Km_app, Vmax_app) point to unreported variables in diffusion-influenced systems. Ensure your methodology section details:
- Particle Geometry & Size: Report the average diameter and distribution of beads/particles.
- Assay Hydrodynamics: Specify the type of mixer (magnetic stirrer, orbital shaker), vessel dimensions, and precise agitation speed (RPM).
- Substrate Concentration Range: Use a range that is 0.2-5.0 x the estimated
Km. Data must be fitted using nonlinear regression, not Lineweaver-Burk plots. - Table Presentation: Summarize kinetic parameters in a table comparing free vs. entrapped enzyme, like Table 3.
Experimental Protocols
Protocol 1: Standardized Assay for Determining Effectiveness Factor (η)
- Purpose: Quantify the impact of diffusion limitation on observed reaction rate.
- Materials: See "Research Reagent Solutions" table.
- Method:
- Prepare identical reaction conditions (buffer, pH, temperature, substrate concentration) for both free and entrapped enzyme.
- For entrapped enzyme, use a known mass of beads with precisely measured diameter.
- Initiate reactions simultaneously under controlled agitation (e.g., 200 RPM in an orbital shaker).
- Measure initial reaction velocities (
v_obsfor entrapped,v_freefor free enzyme). - Calculate: Effectiveness Factor,
η = v_obs / v_free. - Report
ηalongside all experimental conditions.
Protocol 2: Systematic Variation of Matrix Porosity
- Purpose: To optimize the entrapment matrix to minimize diffusion barriers.
- Method:
- Choose your polymer (e.g., alginate, silica gel).
- Prepare a series of solutions where the polymer concentration varies (e.g., 1%, 2%, 3%, 4% w/v) while keeping all other components (enzyme, buffer, cross-linker concentration) constant.
- Form beads/particles using a standardized method (e.g., drip size, flow rate).
- Measure the activity recovery and apparent
Kmfor each batch as in Protocol 1. - The optimal concentration maximizes activity recovery while maintaining mechanical stability.
Data Presentation
Table 1: Optimization of Alginate Matrix for Enzyme Entrapment
| Alginate Conc. (% w/v) | CaCl₂ Cross-linker Conc. (M) | Avg. Bead Diameter (mm) | Activity Recovery (%) | Relative Apparent Km |
|---|---|---|---|---|
| 1.5 | 0.1 | 2.1 ± 0.2 | 75 | 1.8 |
| 2.0 | 0.1 | 2.3 ± 0.1 | 65 | 2.5 |
| 2.5 | 0.1 | 2.4 ± 0.2 | 45 | 3.8 |
| 2.0 | 0.05 | 2.2 ± 0.3 | 80 | 1.5 |
Table 2: Standardized Reporting Table for Immobilization Efficiency
| Parameter | Free Enzyme | Entrapped Enzyme Batch A | Entrapped Enzyme Batch B |
|---|---|---|---|
| Total Activity (U) | 100 ± 5 | 82 ± 4 | 78 ± 3 |
| Specific Activity (U/mg) | 10.0 ± 0.5 | 7.2 ± 0.4 | 6.9 ± 0.3 |
| Immobilization Yield (%) | - | 82 | 78 |
| Activity Recovery (%) | 100 | 72 | 69 |
| Loading Capacity (mg/g) | - | 12.5 | 12.1 |
Table 3: Comparative Kinetic Parameters (Free vs. Entrapped)
| Enzyme Form | Vmax (U/mg) | Km (mM) | Km_app / Km (fold increase) | Effectiveness Factor (η) |
|---|---|---|---|---|
| Free (Solution) | 10.2 ± 0.3 | 2.1 ± 0.2 | 1.0 | 1.00 |
| Alginate Entrapped | 7.5 ± 0.4 | 5.8 ± 0.5 | 2.8 | 0.61 |
Mandatory Visualization
Title: Workflow for Diagnosing Diffusion Limitation
Title: Substrate & Product Diffusion in an Entrapped Enzyme System
The Scientist's Toolkit: Research Reagent Solutions
| Item | Function in Entrapped Enzyme Research |
|---|---|
| Sodium Alginate (High G-Content) | Polysaccharide polymer for forming hydrogel entrapment matrices via ionic cross-linking (e.g., with Ca²⁺). Controls porosity. |
| Calcium Chloride (CaCl₂) Solution | Cross-linking agent for alginate hydrogels. Concentration determines gel strength and density. |
| Peristaltic Pump with Fixed Needle | Standardizes bead size during entrapment by controlling drip rate into cross-linking solution, critical for reproducibility. |
| Oxygen/Substrate Microsensor | Measures concentration gradients within the immobilized bead to directly quantify diffusion limitations. |
| Bradford or BCA Assay Kit | Quantifies protein content in supernatant and (after dissolution) in beads to calculate immobilization yield and loading. |
| Controlled Environment Shaker | Provides consistent and reported hydrodynamic conditions (RPM) during activity assays to manage external diffusion layers. |
| MatLab or Python with SciPy | For nonlinear regression fitting of kinetic data (to get Kmapp, Vmaxapp) and modeling diffusion-reaction processes. |
| FAIR Data Repository Access | Platform (e.g., Zenodo, Figshare) to deposit raw kinetic data, immobilization protocols, and material details with a DOI. |
Conclusion
Addressing diffusion limitations is not merely an engineering hurdle but a fundamental requirement for unlocking the full potential of entrapped enzymes. As synthesized from the four intents, success hinges on a deep foundational understanding of mass transfer, the strategic application of advanced material and immobilization methodologies, rigorous troubleshooting to optimize real-world performance, and robust comparative validation. The convergence of nanostructured materials, smart polymers, and computational design points toward a future of 'diffusion-engineered' biocatalysts. For biomedical research, this progress promises more efficient enzyme replacement therapies, sophisticated biosensing platforms, and implantable biocatalytic devices with precisely controlled activity. Future directions must focus on creating universally applicable design rules, integrating machine learning for predictive material selection, and developing in vivo validation models to bridge the gap from robust in vitro systems to effective clinical applications.