Portable Biosensors for On-Site Organophosphate Detection: Current Technologies, Applications, and Future Directions
Organophosphate (OP) pesticides, while crucial for agriculture, pose severe health risks due to their acetylcholinesterase (AChE)-inhibiting neurotoxicity.
Portable Biosensors for On-Site Organophosphate Detection: Current Technologies, Applications, and Future Directions
Abstract
Organophosphate (OP) pesticides, while crucial for agriculture, pose severe health risks due to their acetylcholinesterase (AChE)-inhibiting neurotoxicity. The limitations of conventional detection methods have accelerated the development of portable biosensors for rapid, on-site analysis. This article provides a comprehensive review for researchers and drug development professionals, covering the foundational principles of OP detection mechanisms, the latest methodological advances in electrochemical and optical biosensors, critical troubleshooting and optimization strategies for real-world application, and a comparative validation of emerging technologies against gold-standard methods. The review synthesizes how these portable platforms are revolutionizing environmental monitoring, food safety, and clinical diagnostics.
The Urgent Need and Fundamental Principles of Organophosphate Biosensing
The Global Health Burden of Organophosphate Poisoning and Morbidity
Organophosphate (OP) compounds, primarily used as pesticides, represent a significant global public health challenge due to their high toxicity and widespread availability. Acute poisoning contributes substantially to global morbidity and mortality, particularly in developing countries and agricultural communities [1] [2]. The primary mechanism of toxicity involves irreversible inhibition of acetylcholinesterase (AChE), leading to accumulation of acetylcholine and overstimulation of muscarinic and nicotinic receptors [3] [2]. This application note synthesizes current epidemiological data on OP poisoning morbidity and outlines standardized experimental protocols for developing portable biosensors, which are crucial for rapid on-site detection and clinical intervention.
Epidemiological Profile of Organophosphate Poisoning
Global Burden and Demographic Characteristics
Table 1: Global Epidemiological Characteristics of Organophosphate Poisoning
| Epidemiological Parameter | Reported Value | Context and Population |
|---|---|---|
| Mean Age | 42.22 ± 9.29 years | Systematic review of 28,593 patients [1] |
| Gender Distribution | 70.4% Male (20,127/28,593) | Systematic review of 28,593 patients [1] |
| Mean Time to Hospital Arrival | 5.97 ± 2.48 hours | Systematic review of OP poisoning patients [1] |
| Complication Rate | 11.6% (3,331/28,593) | Systematic review of OP poisoning patients [1] |
| Mechanical Ventilation Requirement | 71.7% (2,387/3,331) | Among patients who developed complications [1] |
| Mortality Rate | 3.7% (1,059/28,593) | Systematic review of OP poisoning patients [1] |
| Global Age-Standardized Mortality Rate (2021) | 0.45 per 100,000 | For childhood poisoning (0-14 years), all causes [4] |
| Intentional Poisoning (Self-Harm) | 70.9% (285/402) | Hospital-based study in Nepal; pesticides were primary agent [5] |
The systematic review by Alva et al. (2025) provides comprehensive data on acute OP poisoning characteristics, highlighting a predominance of male patients and significant delays in hospital presentation, which is a critical factor in clinical outcomes [1]. The high rate of mechanical ventilation among complicated cases underscores the severe respiratory compromise typical of acute OP poisoning. While global mortality from unintentional poisoning has declined, the burden remains disproportionately high in low-resource settings [4] [5].
Regional Variations and Socioeconomic Disparities
Table 2: Regional and Socioeconomic Variations in Poisoning Burden
| Parameter | High-SDI Countries | Low-SDI Countries | Data Source |
|---|---|---|---|
| Age-Standardized Incidence Rate (ASIR) | Highest (e.g., Norway) | Lower | GBD Study 2021 [4] |
| Age-Standardized Mortality Rate (ASMR) | Lower | Highest (e.g., South Sudan) | GBD Study 2021 [4] |
| Age-Standardized DALY Rate (ASDR) | Lower | Highest | GBD Study 2021 [4] |
| Common Poisoning Agents | Therapeutic drugs, household chemicals | Pesticides (e.g., Organophosphates) | Hospital-based study, Nepal [5] |
| Primary Context | Unintentional | Intentional (self-harm) linked to mental health | Hospital-based study, Nepal [5] |
The Global Burden of Disease (GBD) 2021 study reveals significant health inequalities, with low-SDI countries bearing a disproportionately higher burden of fatal poisoning outcomes despite higher incidence rates in developed nations [4]. This disparity underscores the need for improved emergency response systems and medical infrastructure in developing regions. In Nepal, for instance, OP pesticides were the leading agent of poisoning, predominantly used for intentional self-harm, often related to family conflict and mental health issues [5].
Experimental Protocols for Organophosphate Detection
The following sections provide detailed methodologies for developing biosensing platforms for OP detection, with a focus on portability and applicability in resource-limited settings.
Acetylcholinesterase (AChE) Inhibition-Based Assay
Principle: This protocol leverages the enzymatic activity of AChE, which is selectively inhibited by OPs. The residual enzyme activity, inversely proportional to the OP concentration, is measured via colorimetric, fluorometric, or electrochemical readouts [3] [6].
Materials:
- Acetylcholinesterase (AChE) from electric eel or human recombinant
- Substrate: Acetylthiocholine (ATCh) or Acetylcholine (ACh)
- Colorimetric Indicator: 5,5'-Dithio-bis-(2-nitrobenzoic acid) (DTNB)
- Buffer: Phosphate Buffered Saline (PBS, 0.1 M, pH 7.4)
- OP standard solutions (e.g., parathion, chlorpyrifos)
- Spectrophotometer, fluorometer, or potentiostat
Procedure:
- Enzyme Immobilization: Immobilize AChE (0.1-1 U/mL) on the sensor transducer surface (e.g., screen-printed electrode, paper strip). For electrochemical sensors, common substrates include graphene, carbon nanotubes (CNTs), or gold nanoparticles to enhance electron transfer [3] [7].
- Inhibition Phase: Incubate the immobilized AChE with the sample containing the target OP for a fixed period (e.g., 10-15 minutes) at room temperature.
- Washing: Gently rinse the sensor surface with buffer to remove unbound OP and potential interferents.
- Enzymatic Reaction: Introduce the substrate mixture.
- Colorimetric/Fluorometric Detection: Add ATCh and DTNB. The active AChE hydrolyzes ATCh to thiocholine, which reacts with DTNB to produce 2-nitro-5-thiobenzoate (TNB⁻), a yellow-colored anion, measurable at 412 nm [3]. The signal decrease correlates with OP concentration.
- Electrochemical Detection: Apply a fixed potential and monitor the amperometric current generated by the enzymatic hydrolysis of ACh or ATCh. The inhibition of AChE by OPs causes a decrease in the oxidation current [7].
- Quantification: Calculate the percentage of enzyme inhibition using the formula:
% Inhibition = [(I₀ - I)/I₀] × 100, where I₀ is the signal from the blank (no OP) and I is the signal from the sample. Determine the OP concentration by interpolating the % inhibition value against a standard calibration curve.
Voltammetric Detection of OPs Using Nanomaterial-Modified Electrodes
Principle: This non-enzymatic protocol detects OPs through their direct oxidation or reduction on an electrode surface. Nanomaterials are used to modify the electrode, enhancing its surface area, catalytic properties, and conductivity, thereby improving sensitivity and lowering the detection limit [7].
Materials:
- Working Electrode: Glassy carbon electrode (GCE) or screen-printed carbon electrode (SPCE)
- Nanomaterials: Multi-walled carbon nanotubes (MWCNTs), graphene oxide (GO), gold nanoparticles (AuNPs), or metal oxides (e.g., CuO, ZrO₂)
- Supporting Electrolyte: PBS (0.1 M, pH 7.0) or acetate buffer
- Potentiostat/Galvanostat
- Standard OP solutions
Procedure:
- Electrode Modification:
- Polish the bare GCE with alumina slurry (0.05 µm) and sonicate in ethanol and deionized water.
- Disperse the nanomaterial (e.g., 1 mg/mL of MWCNTs) in a solvent like dimethylformamide (DMF) and deposit a fixed volume (e.g., 5-10 µL) onto the cleaned electrode surface. Allow it to dry under an infrared lamp [7].
- Electrochemical Measurement:
- Place the modified electrode in an electrochemical cell containing the supporting electrolyte and the OP sample.
- Utilize a voltammetric technique such as Differential Pulse Voltammetry (DPV) or Square Wave Voltammetry (SWV). These methods enhance sensitivity by minimizing capacitive current.
- Scan the potential across a predetermined window (e.g., +0.5 V to +1.2 V for oxidation of certain OPs). The applied pulses in DPV and SWV help in achieving lower detection limits.
- Analysis: Record the current peak height/area, which is proportional to the concentration of the OP. Plot the calibration curve of peak current versus OP concentration for quantitative analysis.
Signaling Pathways and Experimental Workflows
AChE Inhibition Pathway in Organophosphate Toxicity
The following diagram illustrates the core biochemical mechanism of OP toxicity, which is exploited by AChE inhibition-based biosensors.
Biosensor Development Workflow
This workflow outlines the key stages in developing a portable biosensor for on-site OP detection.
The Scientist's Toolkit: Key Research Reagent Solutions
Table 3: Essential Reagents and Materials for OP Detection Research
| Item | Function/Application | Key Characteristics |
|---|---|---|
| Acetylcholinesterase (AChE) | Primary biorecognition element in inhibition-based sensors. Catalyzes substrate hydrolysis. | High specific activity, purity, and stability. Source (electric eel, human recombinant) can affect sensitivity [3] [8]. |
| Acetylthiocholine (ATCh) / Acetylcholine (ACh) | Enzymatic substrate. Hydrolysis product generates measurable signal. | ATCh is preferred for electrochemical/thiol-detecting colorimetric assays. Stability in solution is key [3]. |
| DTNB (Ellman's Reagent) | Colorimetric indicator. Reacts with thiocholine to produce yellow TNB⁻. | Allows for simple visual or spectrophotometric detection at 412 nm [3]. |
| Carbon Nanotubes (CNTs) / Graphene | Electrode nanomaterial. Enhances electron transfer kinetics and surface area for sensor signal amplification. | High conductivity, functionalizable surface. CNTs can be carboxylated for better enzyme immobilization [2] [7]. |
| Gold Nanoparticles (AuNPs) | Transducer nanomaterial. Facilitates electron transfer and serves as a platform for bioreceptor immobilization. | Excellent biocompatibility, tunable surface chemistry, and optical properties for colorimetric sensors [2] [6]. |
| Molecularly Imprinted Polymers (MIPs) | Synthetic antibody mimics for non-enzymatic, selective OP recognition. | High chemical stability, reusable, tailored for specific OP molecules [2] [7]. |
| Screen-Printed Electrodes (SPEs) | Disposable, miniaturized electrochemical cell for portable sensor design. | Enable mass production, low cost, and integration into handheld devices for field testing [2] [7]. |
The widespread use of organophosphate (OP) and carbamate (CM) pesticides in agriculture poses significant health risks due to their inhibition of acetylcholinesterase (AChE), a crucial enzyme for neurological function [9] [2]. This application note details the core principle of AChE inhibition and presents standardized protocols for leveraging this mechanism in portable biosensors for on-site pesticide detection. Conventional methods like chromatography and mass spectrometry, while accurate, are costly, time-intensive, and require specialized facilities and personnel, making them unsuitable for rapid field testing [2] [10]. The protocols herein are designed for researchers and developers aiming to create accessible, efficient, and cost-effective biosensing platforms for public health protection and environmental monitoring [9].
Core Principle and Mechanism
The detection strategy is founded on the specific inhibition of AChE by OP and CM pesticides. AChE normally hydrolyzes the neurotransmitter acetylcholine, terminating its action at neuronal synapses. OPs and CMs irreversibly (OPs) or reversibly (CMs) bind to the serine hydroxyl group in the active site of AChE, preventing it from performing its catalytic function [2].
This inhibition is quantified indirectly by providing the enzyme with an artificial substrate, such as acetylthiocholine (ATCh). In an uninhibited system, AChE hydrolyzes ATCh to produce thiocholine (TCh) and acetate. The generated TCh can then be measured electrochemically or colorimetrically. In the presence of OP or CM pesticides, AChE activity is reduced, leading to a corresponding decrease in TCh production. This decrease in signal is quantitatively related to the concentration of the inhibiting pesticide [9] [11].
The following diagram illustrates the logical workflow of this detection principle.
Quantitative Sensor Performance Data
The following tables summarize key performance metrics for AChE-based biosensors reported in recent literature, providing a benchmark for researchers.
Table 1: Detection Limits for Specific Pesticides
| Pesticide | Class | Sensor Platform | Limit of Detection (LOD) | Reference |
|---|---|---|---|---|
| Mevinphos | Organophosphate | Personal Glucose Meter (PGM) | 0.138 ppm | [9] |
| Carbofuran | Carbamate | Personal Glucose Meter (PGM) | 0.113 ppm | [9] |
| Ethyl-paraoxon (Model OP) | Organophosphate | Paper-based (PesticidePAD) | 0.09 ppm | [11] |
Table 2: Comparison of AChE Substrate Performance
| Substrate | Assay Type | Apparent Km (mM) | Vmax (kat) | Advantage | Disadvantage | |
|---|---|---|---|---|---|---|
| Indoxyl Acetate (IOA) | Colorimetric | 1.0 ± 0.2 | Not Specified | Superior sensitivity (Lower LOD) | Narrower detection range | |
| Acetylthiocholine (ATCh) | Electrochemical | 6.6 ± 3.2 | 123.8 ± 6.1 | Broader detection range (1.56–100 ppm) | Higher Km indicates lower affinity | [11] |
Detailed Experimental Protocols
Protocol A: Personal Glucose Meter (PGM)-Based Detection
This protocol adapts ubiquitous personal glucose meters for pesticide detection by measuring thiocholine production electrochemically [9].
Research Reagent Solutions
| Item | Specification | Function |
|---|---|---|
| Cholinesterase (ChE) | Cricket ChE or Human Whole Blood | Target enzyme whose inhibition is measured. |
| Acetylthiocholine Iodide (ATCh) | 15 mM solution in distilled water | Enzymatic substrate; hydrolysis produces thiocholine. |
| Phosphate Buffered Saline (PBS) | pH 7.4 or pH 8.0 | Reaction buffer to maintain optimal pH. |
| Personal Glucose Meter (PGM) | Sannuo Safe AQ smart | Portable device to read electrochemical signal from test strips. |
| Pesticide Standards | e.g., Mevinphos, Carbofuran | Analytes for calibration and validation. |
Step-by-Step Procedure
- Reagent Preparation:
- Sample Preparation:
- For blood samples, perform a 1:10 dilution by mixing 100 µL of whole blood with 900 µL of PBS [9].
- For vegetable samples, perform a standard extraction in PBS.
- Reaction Setup:
- Test Reaction: Combine 50 µL of sample (diluted blood or extract), 125 µL of PBS, and 25 µL of 15 mM ATCh solution [9].
- Sample Blank: Combine 50 µL of sample and 150 µL of PBS.
- Reagent Blank: Combine 175 µL of PBS and 25 µL of ATCh.
- Incubation:
- Incubate the test reaction at 25°C for a predetermined time (e.g., 5, 10, or 15 minutes) [9].
- Measurement & Data Analysis:
- Apply the incubated test reaction mixture directly to a PGM test strip and record the measured result.
- Calculate the Corrected PGM Readout using the formula:
Corrected PGM Readout (mg/dL) = Measured Result - Sample Blank - Reagent Blank[9]. - The corrected readout is proportional to AChE activity. Lower values indicate higher pesticide concentration and greater enzyme inhibition.
The workflow for this protocol, from sample preparation to data interpretation, is outlined below.
Protocol B: Paper-Based Colorimetric Biosensor (PesticidePAD)
This protocol describes a low-cost, colorimetric paper sensor for on-site screening of pesticide residues on vegetables [11].
Research Reagent Solutions
| Item | Specification | Function |
|---|---|---|
| Acetylcholinesterase (AChE) | Electric eel or recombinant source | Recognition element; inhibition is measured. |
| Chromogenic Substrate | Indoxyl Acetate (IOA) or Acetylthiocholine (ATCh) | Hydrolyzed by AChE to produce a color change. |
| Paper Substrate | Chromatography or filter paper | Platform for reagent immobilization and reaction. |
| Stabilization Matrix | Sucrose/Trehalose Mix | Preserves enzyme and substrate activity during storage. |
Step-by-Step Procedure
- Sensor Fabrication:
- Immobilize AChE enzyme and the chromogenic substrate (IOA or ATCh) onto separate zones of a paper matrix.
- For long-term stability, use the Sandwich Method of Stabilization (SMS): layer the paper with enzyme and substrate between protective films, maintaining ~90% enzymatic activity for over five months at ambient conditions [11].
- Assay Execution:
- Crush or introduce a liquid sample (e.g., vegetable extract) directly onto the PesticidePAD.
- If pesticides are present, they inhibit the pre-immobilized AChE.
- Add a developer solution or rely on inherent moisture to dissolve and mix the substrate with the enzyme.
- Signal Acquisition:
- Incubate the sensor for a defined period to allow for color development.
- The color intensity generated is inversely proportional to the pesticide concentration.
- Read the result visually or by using a smartphone camera with color analysis software for semi-quantification.
The Scientist's Toolkit: Essential Research Reagents
The following table consolidates key materials required for developing and executing AChE-based biosensors.
Table 3: Essential Research Reagents for AChE-Based Biosensing
| Category | Item | Function & Application |
|---|---|---|
| Enzyme | Acetylcholinesterase (AChE) | Primary recognition element. Source can be electric eel, cricket, or human blood [9] [11]. |
| Substrates | Acetylthiocholine (ATCh) | Electrochemical substrate; hydrolyzed to thiocholine [9] [11]. |
| Indoxyl Acetate (IOA) | Colorimetric substrate; offers higher sensitivity in colorimetric assays [11]. | |
| Buffer Systems | Phosphate Buffered Saline (PBS) | Maintains physiological pH (7.4-8.0) for optimal enzyme activity [9]. |
| Sensor Platforms | Personal Glucose Meter (PGM) | Low-cost, portable transducer for electrochemical detection [9]. |
| Paper-based Matrix | Low-cost substrate for building disposable, colorimetric sensors [11]. | |
| Screen-Printed Electrodes (SPEs) | Customizable electrodes for electrochemical biosensing [9]. | |
| Signal Mediators | Potassium Ferricyanide | Mediator in PGM test strips; oxidizes thiocholine [9]. |
| Stabilizers | Sucrose/Trehalose Matrices | Preserve enzyme and substrate activity in paper-based sensors during storage [11]. |
Limitations of Traditional Chromatography and Mass Spectrometry Methods for Field Use
For researchers and drug development professionals working on environmental monitoring and food safety, the detection of organophosphate (OP) compounds is a critical task. Traditional laboratory-based methods like gas chromatography-mass spectrometry (GC-MS) and high-performance liquid chromatography (HPLC) are considered reference techniques for their sensitivity and specificity [12] [13]. However, their applicability is severely limited in field settings, such as on-site farm testing or emergency response to potential pesticide exposure, where rapid, portable, and user-friendly detection is paramount. This application note details the specific limitations of these traditional methods and contrasts them with emerging biosensor technology, providing a framework for selecting appropriate detection strategies in field-based research on organophosphates.
Core Limitations of Traditional Analytical Methods
While powerful in the laboratory, traditional chromatography and mass spectrometry techniques face significant practical challenges that hinder their deployment for on-site organophosphate detection. The table below summarizes the key constraints.
Table 1: Key Limitations of Traditional Methods for Field-Based Organophosphate Detection
| Limitation Category | Chromatography (GC, HPLC) | Mass Spectrometry (MS) |
|---|---|---|
| Portability & Cost | Systems are large, benchtop-bound, and require significant laboratory space [14]. | MS systems are expensive to purchase and maintain, making them cost-prohibitive for many field applications [14] [15]. |
| Sample Preparation | Requires careful preparation, including extraction, cleanup, and derivatization, which is time-consuming and requires specialized expertise [12] [14]. | Sample preparation can be complex. The presence of a sample matrix can cause ion suppression or other interferences, affecting accuracy [14] [15]. |
| Analysis Time & Throughput | Analysis times can be long (minutes to hours), not including sample preparation, making true rapid on-site screening impossible [12] [16]. | The technology is highly complex and requires skilled operation, which is often incompatible with the workflow and personnel in field settings [13] [15]. |
| Operational Complexity | Operation and troubleshooting require a high level of technical expertise and are not suitable for novice users [16]. | Not a standalone technique; requires coupling with a separation technique like GC or LC, adding to system complexity [13]. |
| Sample Compatibility | GC is primarily suitable for volatile and semi-volatile compounds, requiring derivatization for many OPs [12] [14]. HPLC is incompatible with highly viscous or watery samples [14]. | Limited linear range, meaning it can only accurately measure analyte concentrations within a certain range without dilution [14]. |
| Environmental Robustness | Sensitive to environmental conditions like vibrations, temperature fluctuations, and power supply quality, which are common in field environments. | Requires high vacuum conditions and stable power, making it inherently non-portable and fragile for field use [13]. |
The Emergence of Biosensors as a Field-Compatible Alternative
In response to these limitations, biosensor technology has emerged as a promising solution for on-site organophosphate detection. These devices are designed to be fast, disposable, and cheap while maintaining a high degree of accuracy [17]. A prominent detection mechanism is the inhibition of the enzyme acetylcholinesterase (AChE), which is the same mechanism by which OP compounds exert their toxicity in organisms [18] [17].
The following workflow diagram illustrates the core principle of an AChE-based biosensor for OP detection.
AChE Biosensor Principle
Experimental Protocol: Potentiometric Biosensor for OP Detection
The following detailed protocol is adapted from research on developing a transducer-based biosensor with a small device potentiometer (SDP) for determining organophosphate pesticides [18].
Research Reagent Solutions
Table 2: Essential Materials and Reagents
| Item | Function / Description | Source / Example |
|---|---|---|
| Acetylcholinesterase (AChE) | Biological recognition element; catalyzes the hydrolysis of the substrate. Inhibition is measured. | Electric eel, Sigma-Aldrich [18] [17] |
| Cellulose Acetate (CA) | Forms a membrane matrix for the immobilization of the AChE enzyme. | 15% (w/v) in acetone [18] |
| Glutaraldehyde (GA) | Cross-linking agent; stabilizes the enzyme within the cellulose acetate membrane. | 25% (v/v) in H₂O [18] |
| Acetylthiocholine Chloride (ATCl) | Enzyme substrate; hydrolysis product is measured potentiometrically. | Prepared in PBS solution (e.g., 10⁻³ M) [18] |
| Phosphate Buffered Saline (PBS) | Provides a stable pH environment (pH 8.0) for the enzymatic reaction. | 0.2 M Na₂HPO₄/NaH₂PO₄ [18] |
| Gold (Au) Electrode | Working electrode where the enzymatic reaction and inhibition occur. | Coated with CA/GA/AChE membrane [18] |
| Ag/AgCl Reference Electrode | Provides a stable and reproducible reference potential for measurements. | Can be prepared in-lab by electrolyzing Ag wire [18] |
| Small Device Potentiometer (SDP) | Transducer; measures the potential value generated from the biochemical reaction. | Portable potentiometric device [18] |
Step-by-Step Methodology
Part A: Biosensor Preparation
- Electrode Preparation: A gold (Au) electrode tip is immersed in a 15% (w/v) cellulose acetate (CA) membrane solution prepared in acetone.
- Cross-linking: The formed CA membrane is rinsed with distilled water and then dipped in 25% (v/v) glutaraldehyde (GA) solution for 6 hours to create a cross-linked matrix.
- Enzyme Immobilization: The electrode membrane (Em) is rinsed with distilled water and PBS (pH 8.0), then immersed in the AChE enzyme solution for 2 x 24 hours at 4°C to allow for immobilization.
- Curing: Before measurement, the biosensor components are stabilized at room temperature for approximately 2 hours to ensure a good response.
Part B: Measurement of Organophosphate Inhibition
- Baseline Measurement: The prepared Em is immersed in PBS (pH 8.0) for 10 minutes. It is then placed in a cell with the substrate solution (10⁻³ M ATCl), and the constant potential value is measured using the SDP.
- Inhibition Step: The Em is removed, rinsed, and immersed in the sample solution containing the organophosphate pesticide (e.g., diazinon or profenofos) for 30 minutes. During this time, the OP compound inhibits the AChE enzyme.
- Post-Inhibition Measurement: The Em is removed from the pesticide solution, rinsed with PBS (pH 8.0), and dipped again into the ATCl substrate solution.
- Signal Recording: The potential value is measured again. The difference between the baseline potential and the post-inhibition potential is correlated to the concentration of the OP inhibitor.
The entire experimental workflow, from biosensor preparation to signal measurement, is summarized below.
Biosensor Experimental Workflow
Performance Metrics of a Potentiometric Biosensor
Research has demonstrated that a well-optimized biosensor can achieve performance suitable for field analysis. The table below quantifies the performance for two common organophosphate pesticides.
Table 3: Exemplary Performance of an AChE-based Potentiometric Biosensor [18]
| Organophosphate Pesticide | Sensitivity (mV decade⁻¹) | Limit of Detection (LoD) | Accuracy (%) |
|---|---|---|---|
| Diazinon | 21.204 | 10⁻⁷ mg L⁻¹ | 99.497 |
| Profenofos | 20.035 | 10⁻⁷ mg L⁻¹ | 94.765 |
The limitations of traditional chromatography and mass spectrometry methods—including their lack of portability, complex operation, and lengthy analysis times—render them unsuitable for rapid, on-site detection of organophosphate pesticides. For researchers developing field-deployable solutions, acetylcholinesterase-based biosensors present a viable and high-performance alternative. The provided experimental protocol and performance data illustrate that these sensors can be designed to be highly sensitive, accurate, and compatible with the demands of field use, offering a promising tool for enhancing environmental and food safety monitoring.
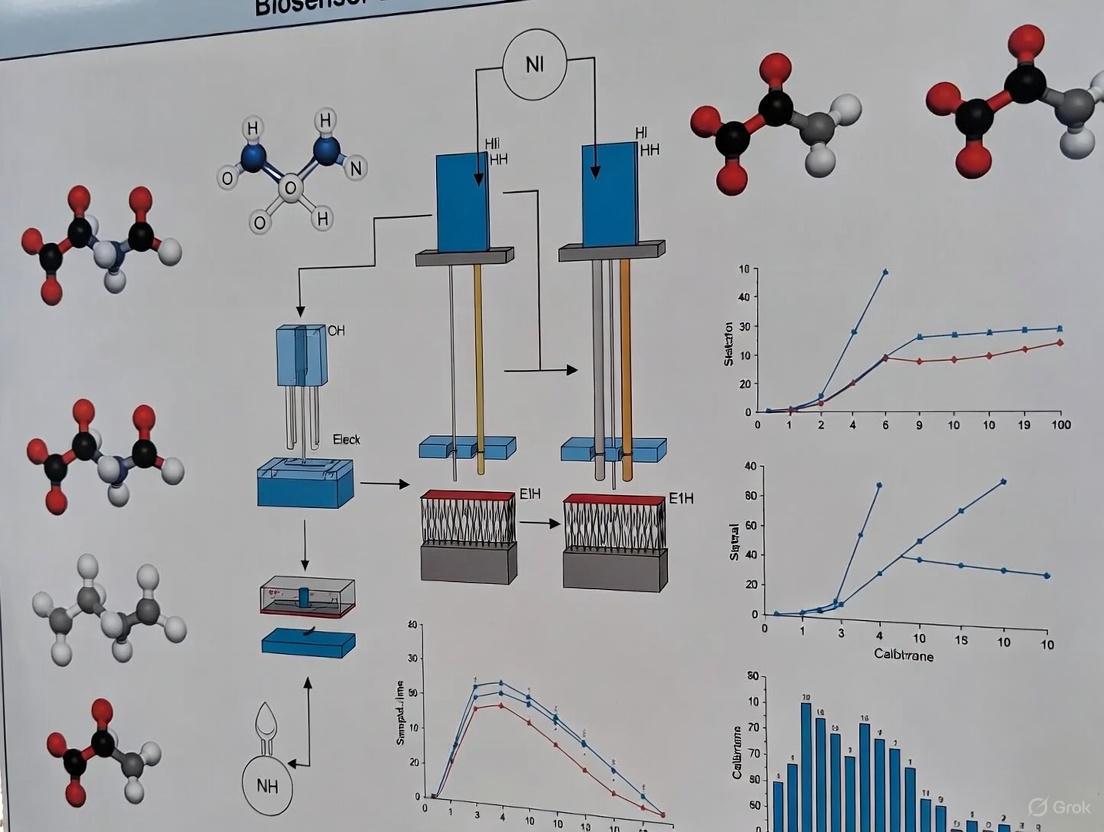
Biosensors are analytical devices that combine a biological recognition element with a physicochemical detector to provide quantitative or semi-quantitative analytical information. These systems have gained paramount importance in environmental monitoring, particularly for the on-site detection of organophosphate (OP) pesticides, which pose significant threats to human health and ecosystem balance through their inhibition of acetylcholinesterase (AChE) in the nervous system [3] [19]. The fundamental architecture of all biosensors consistently comprises three essential components: a bioreceptor that specifically interacts with the target analyte, a transducer that converts this biological recognition event into a measurable signal, and a readout system that displays the results in a user-interpretable form [20]. This application note delineates the core principles, components, and practical methodologies for developing and implementing biosensors within the context of portable devices for organophosphate detection, providing researchers with structured protocols and performance data to advance this critical field.
Core Components of a Biosensor
The Bioreceptor
The bioreceptor is the biological recognition element that imparts specificity to the biosensor by interacting selectively with the target analyte. In organophosphate detection, several classes of bioreceptors are employed, each with distinct mechanisms and advantages.
- Enzymes: Acetylcholinesterase (AChE) is a widely used bioreceptor for OP detection based on the inhibition principle. OPs irreversibly phosphorylate the serine residue in the active site of AChE, decreasing its enzymatic activity, which can be quantified to determine OP concentration [3] [19]. Alternatively, organophosphorus hydrolase (OPH) or methyl parathion hydrolase (MPH) enables direct detection by catalytically hydrolyzing OP compounds into measurable products [21].
- Antibodies: Immunosensors utilize antibodies as bioreceptors for specific OP antigens. The binding specificity is the primary characteristic, and the efficiency of the sensor depends on the antibody's specificity, stability, and sensitivity [19].
- Aptamers: These are single-stranded DNA or RNA oligonucleotides that bind to specific targets with high affinity. Aptamer-based sensors (aptasensors) are emerging for pesticides like malathion, offering advantages in stability and design flexibility [22].
- Whole Cells: Genetically engineered microorganisms expressing specific enzymes like OPH or MPH on their surface can serve as living bioreceptors, potentially offering cost-effective and regenerative sensing platforms [19].
The Transducer
The transducer transforms the biological recognition event into a quantifiable electronic signal. The choice of transducer depends on the nature of the biochemical change occurring at the bioreceptor layer.
- Electrochemical Transducers: These are highly prevalent in portable biosensor systems due to their sensitivity, low cost, and potential for miniaturization [20]. They encompass:
- Amperometric Sensors: Measure the current generated by the oxidation or reduction of an electroactive species at a constant potential.
- Potentiometric Sensors: Measure the potential difference between a working electrode and a reference electrode at zero current.
- Impedimetric Sensors: Monitor changes in the impedance (resistance to alternating current) at the electrode-electrolyte interface, often resulting from the binding of a target analyte [20].
- Optical Transducers: These measure changes in light properties. For OP detection, common optical methods include:
- Absorbance-based Sensors: Measure the concentration of a chromogenic product, such as the yellow p-nitrophenol produced from MP hydrolysis by MPH, by its light absorption at a specific wavelength [21].
- Fluorescence-based Sensors: Detect changes in fluorescence intensity, wavelength, or polarization. Quantum dots and other fluorescent materials are often employed as labels or signal reporters [3].
- Electrochemiluminescence (ECL): A combined electrochemical and optical method where an electrochemical reaction generates luminescent species. ECL-based aptasensors have been developed for ultrasensitive malathion detection [22].
- Other Transducers: These include piezoelectric (mass-sensitive) and thermal (enthalpy-sensitive) transducers, though they are less common for portable OP detection [3].
The Readout System
The readout is the final component that processes, interprets, and displays the signal from the transducer in a human-readable format. For portable biosensors, the readout system must be compact, low-power, and user-friendly.
- Electronic Displays: Simple liquid crystal displays (LCDs) or light-emitting diode (LED) screens integrated into the device can directly show numerical concentration values or qualitative results.
- Signal Interfaces: Portable systems often interface with smartphones or tablets via Bluetooth or wired connections, leveraging their powerful processors and displays for advanced data visualization, storage, and sharing [20] [3].
- Auditory or Visual Alarms: For field applications, simple LED color changes (e.g., green/red) or auditory beeps can provide immediate go/no-go results for pesticide contamination.
Table 1: Core Components of a Biosensor for Organophosphate Detection
| Component | Function | Common Types for OP Detection | Key Characteristics |
|---|---|---|---|
| Bioreceptor | Selective recognition of the target analyte | Enzymes (AChE, OPH/MPH), Antibodies, Aptamers | Defines specificity; Stability and immobilization are critical |
| Transducer | Converts biological event into measurable signal | Electrochemical, Optical (Absorbance, Fluorescence, ECL) | Defines sensitivity; Must be matched to the biorecognition event |
| Readout | Displays the processed result for the user | Integrated LCD/LED, Smartphone Interface, Visual Alarms | Should be intuitive and suitable for the deployment environment |
System Workflow and Logical Relationships
The following diagram illustrates the integrated workflow and logical relationships between the core components of a biosensor, from sample introduction to final result.
Experimental Protocol: Amperometric AChE-Based Biosensor for OP Detection
This protocol details the construction and operation of a disposable screen-printed amperometric biosensor for the detection of organophosphates based on acetylcholinesterase inhibition.
Principle
The sensor measures the amperometric current generated from the enzymatic hydrolysis of a substrate, acetylthiocholine. In the absence of OP, AChE catalyzes the hydrolysis of acetylthiocholine to thiocholine and acetate. Thiocholine is then oxidized at the electrode surface, producing a measurable current. When OP is present, it inhibits AChE, reducing the amount of thiocholine produced and consequently decreasing the oxidation current. The percentage of inhibition is proportional to the concentration of OP in the sample [3] [19].
Materials and Reagents
Table 2: Research Reagent Solutions and Essential Materials
| Item | Function/Description | Specifications/Notes |
|---|---|---|
| Screen-printed Carbon Electrode (SPCE) | Transducer platform | Disposable; typically features carbon working and counter electrodes and a silver/silver chloride reference. |
| Acetylcholinesterase (AChE) | Bioreceptor | Enzyme from Electrophorus electricus or recombinant source; specific activity >500 U/mg. |
| Acetylthiocholine chloride | Enzymatic substrate | Converted to electroactive thiocholine by AChE. |
| Phosphate Buffered Saline (PBS) | Electrolyte and dilution buffer | 0.1 M, pH 7.4, containing 0.1 M KCl. |
| Organophosphate Standard | Target analyte | Parathion-methyl or chlorpyrifos stock solution in methanol or acetonitrile. |
| Glutaraldehyde / BSA | Crosslinker / Stabilizer | For enzyme immobilization on the electrode surface. |
| Potentiostat | Readout Instrument | Portable potentiostat for amperometric measurements. |
Step-by-Step Procedure
Part A: Electrode Modification and AChE Immobilization
- Surface Preparation: Clean the working electrode surface of the SPCE by cycling the potential in 0.1 M PBS (pH 7.4) between -0.5 V and +0.8 V until a stable voltammogram is obtained.
- Enzyme Immobilization: Prepare a 10 μL mixture containing 0.5 U of AChE and 0.25% (w/v) BSA in a small volume of PBS. Add 0.5 μL of 2.5% (v/v) glutaraldehyde to this mixture and vortex briefly.
- Drop-Casting: Immediately deposit 5 μL of the AChE/BSA/glutaraldehyde mixture onto the clean working electrode area. Allow it to dry at 4°C for 2 hours to complete the cross-linking process.
- Storage: Store the modified AChE-SPCEs at 4°C when not in use.
Part B: Amperometric Measurement and OP Detection
- Baseline Measurement: Place the AChE-SPCE into a portable potentiostat. Apply a constant potential of +0.5 V (vs. the on-chip Ag/AgCl reference) to the working electrode. After the background current stabilizes, inject 50 μL of 2 mM acetylthiocholine chloride (in PBS) into the electrochemical cell. Record the steady-state current (I₀) generated by the oxidation of thiocholine.
- Inhibition (Sample Exposure): Incubate the AChE-SPCE in 1 mL of the sample (or OP standard solution of known concentration) for 10 minutes. Rinse the electrode gently with PBS to remove unbound OP.
- Post-Inhibition Measurement: Repeat the amperometric measurement as in Step B1, injecting 50 μL of 2 mM acetylthiocholine chloride and recording the new steady-state current (I₁).
- Data Analysis: Calculate the percentage of enzyme inhibition using the formula: Inhibition (%) = [(I₀ - I₁) / I₀] × 100. The OP concentration in the sample is determined by interpolating the inhibition percentage against a calibration curve prepared with standard OP solutions.
Performance Data and Comparison of Biosensor Types
The performance of different biosensor configurations for OP detection varies significantly in terms of sensitivity, detection limit, and analysis time. The following table summarizes key performance metrics from recent developments.
Table 3: Performance Comparison of Biosensors for Organophosphate Detection
| Biosensor Type | Bioreceptor | Transducer | Target OP | Detection Limit | Linear Range | Analysis Time |
|---|---|---|---|---|---|---|
| Electrochemical (Inhibition) [3] [19] | AChE | Amperometry | Various OPs | ~ μg•L⁻¹ level | Varies | 15-20 min |
| Electrochemical (Aptasensor) [22] | DNA Aptamer | ECL | Malathion | 0.219 fM | 1.0×10⁻¹³ – 1.0×10⁻⁸ mol·L⁻¹ | Rapid |
| Optical (Direct) [21] | MPH | Absorbance | Methyl Parathion | 4 μM | Not Specified | Rapid |
| Immunosensor [19] | Antibody | Electrochemical | Specific OPs | Varies | Varies | Varies |
The Scientist's Toolkit: Essential Research Reagent Solutions
Table 4: Key Reagents and Materials for Biosensor Development
| Item | Function | Critical Notes for Use |
|---|---|---|
| Nanomaterials (e.g., MWCNTs, ZnO, AuNPs) | Transducer enhancement | Increase electrode surface area, enhance electron transfer, and improve biosensor sensitivity and stability [20] [22]. |
| Methyl Parathion Hydrolase (MPH) | Catalytic Bioreceptor | Directly hydrolyzes methyl parathion to p-nitrophenol; can be immobilized via His-tag on Ni-NTA agarose for reusable sensor surfaces [21]. |
| Portable Potentiostat | Readout device | Essential for field-deployable electrochemical sensors; must be compact, low-power, and capable of connecting to mobile devices [20]. |
| Ni-NTA Agarose | Immobilization matrix | Provides oriented and stable immobilization of His-tagged recombinant enzymes (e.g., MPH), preserving activity and allowing for regeneration [21]. |
Biosensors represent a cornerstone technology for analytical detection, blending biology, chemistry, and engineering to convert specific biological responses into quantifiable signals. Within the strategic context of developing portable biosensors for on-site organophosphate (OP) detection, this document details the operational principles, key performance metrics, and standardized experimental protocols for three principal biosensor platforms: electrochemical, optical, and piezoelectric. The content is structured to serve researchers and scientists engaged in the design and implementation of biosensing systems for environmental monitoring and food safety, with a particular emphasis on miniaturized, on-site application. Data on sensitivity, linear range, and detection limits are summarized in comparative tables, and foundational methodologies for each platform are provided to ensure experimental reproducibility.
A biosensor is an analytical device that integrates a biological recognition element with a physicochemical transducer to detect a specific analyte [23] [24]. The core function of any biosensor relies on the specific binding or catalytic conversion of the target analyte by the biorecognition element (e.g., enzymes, antibodies, nucleic acids, or whole cells). This interaction produces a physical or chemical change that is converted by the transducer into an electronic signal, which is then processed and relayed to the user [24]. The general architecture and workflow of a biosensor are illustrated below.
The critical performance parameters for any biosensor, especially in the context of portable OP detection, include:
- Sensitivity: The magnitude of signal change per unit change in analyte concentration.
- Detection Limit: The lowest concentration of analyte that can be reliably distinguished from background noise.
- Selectivity: The ability to respond exclusively to the target analyte in complex sample matrices.
- Response Time: The time required to achieve a stable signal upon analyte exposure.
- Stability and Robustness: Essential for field-deployable devices, encompassing operational lifetime and resistance to environmental variations [23] [24].
Biosensor Platforms: Principles and Quantitative Comparison
Biosensors are primarily classified based on their transduction principle. The following sections and comparative table delineate the core attributes of the three major platforms relevant to portable biosensor development.
Table 1: Comparative Analysis of Major Biosensor Platforms
| Feature | Electrochemical | Optical | Piezoelectric |
|---|---|---|---|
| Transduction Principle | Measures electrical properties (current, potential, impedance) changes due to bio-recognition event [24]. | Measures changes in light properties (absorbance, fluorescence, FRET) [25]. | Measures change in resonant frequency or acoustic wave propagation due to mass adsorption on sensor surface [26]. |
| Common Sub-types | Amperometric, Potentiometric, Impedimetric [24]. | Fluorescence, FRET-based, Surface Plasmon Resonance (SPR). | Quartz Crystal Microbalance (QCM), Surface Acoustic Wave (SAW) [26]. |
| Key Performance Metrics | Sensitivity (μA/mM), Limit of Detection (LOD), Linear Range. | Signal-to-Noise Ratio (SNR), Ratiometric Output (for FRET), LOD [27] [25]. | Frequency Shift (Hz), Mass Sensitivity (ng/cm²), Dissipation Factor [26]. |
| Typical LOD (General) | nM to fM range [23] | Varies with method; single molecules possible. | ng/cm² range [26] |
| Example LOD (OPs) | Glyphosate: 1.24 × 10⁻¹³ M [28] | Information not specified in search results. | Carbaryl: 0.14 ng/mL [26] |
| Advantages | High sensitivity, easy miniaturization, portable, low-cost, works in turbid solutions [24]. | High spatial resolution, multiplexing capability, real-time kinetic monitoring [25]. | Label-free, real-time monitoring, studies viscoelastic properties [26]. |
| Disadvantages | Susceptible to electrical interference, surface fouling. | Can be affected by ambient light, sample auto-fluorescence, requires sophisticated optics [27]. | Sensitive to environmental vibrations, viscosity and density of medium affect signal [26]. |
Electrochemical Biosensors
Electrochemical biosensors are among the most prevalent platforms for portable devices due to their high sensitivity, inherent capacity for miniaturization, and low power requirements [24]. Their operation is based on the detection of electrical signals generated from biochemical reactions at the sensor-solution interface.
The fundamental mechanism for enzyme-based OP detection involves the inhibition of acetylcholinesterase (AChE). The normal enzymatic hydrolysis of acetylcholine produces electroactive products, generating a measurable current. The presence of OPs inhibits AChE, reducing the catalytic current proportionally to the OP concentration [28].
Optical Biosensors
Optical biosensors transduce biological recognition events into changes in the properties of light, such as intensity, wavelength, polarization, or phase [25]. A prominent class for intracellular and quantitative sensing is the Genetically Encoded Fluorescent Biosensor (GEFB), which often uses Förster Resonance Energy Transfer (FRET).
In a ratiometric FRET biosensor, the target analyte binding induces a conformational change in the sensor protein, altering the distance and/or orientation between a donor fluorophore and an acceptor fluorophore. This change modulates the efficiency of energy transfer, which is quantified as a ratio of the two emission intensities, making the measurement robust against variations in sensor concentration or excitation light intensity [25].
A critical performance parameter for optical biosensors is the Signal-to-Noise Ratio (SNR). A higher SNR facilitates faster and more accurate results [27]. SNR is calculated as the ratio of the average signal amplitude to the standard deviation of the noise. For optical measurements with DC signals: SNR = (Signal Average) / (Standard Deviation of Signal). This can also be expressed in decibels (dB) as SNR (dB) = 20 log₁₀(Signal Average / Noise Standard Deviation) [27].
Piezoelectric Biosensors
Piezoelectric biosensors, most commonly based on a Quartz Crystal Microbalance (QCM), are mass-sensitive devices that operate by measuring the decrease in resonant frequency of a piezoelectric crystal when a mass (such as a bound analyte) is adsorbed onto its surface [26]. This relationship is quantitatively described by the Sauerbrey equation for rigid, thin films in air/gas phase:
Δf = - (2 f₀² Δm) / (A (ρₐ μₐ)^½)
Where:
- Δf is the change in resonant frequency.
- f₀ is the fundamental resonant frequency of the crystal.
- Δm is the mass change.
- A is the active area of the crystal.
- ρₐ and μₐ are the density and shear modulus of the quartz, respectively [26].
When operating in a liquid environment, the frequency is also affected by the liquid's viscosity and density, and the adsorbed biolayers often have viscoelastic properties. Therefore, modern QCM systems often also measure the dissipation (D), which quantifies energy losses and provides information about the rigidity of the adsorbed layer [26].
Experimental Protocols
Protocol: Electrochemical Biosensor for Organophosphorus Pesticides (OPs)
This protocol outlines the procedure for developing a portable electrochemical biosensor for the detection of multiple OPs, based on the work by Wu et al. (2024) [28].
1. Sensor Fabrication:
- Working Electrode Preparation: Clean the gold working electrode surface with alumina slurry and sonicate in ethanol and deionized water.
- IMOF Modification: Deposit a suspension of the synthesized amino-modified ionic metal-organic framework (NH₂-IMOF) in chitosan (CS) solution onto the electrode surface. Dry at room temperature.
- Enzyme Immobilization: Drop-cast an acetylcholinesterase (AChE) solution onto the NH₂-IMOF@CS modified electrode and incubate in a humid chamber at 4°C to form the final NH₂-IMOF@CS@AChE biosensor. Rinse gently with buffer to remove unbound enzyme.
2. Measurement Setup (Portable Operation):
- Integrate the biosensor with a near-field communication (NFC) module and potentiostat for touchless, battery-free operation [28].
- Use a standard three-electrode system (fabricated working electrode, Ag/AgCl reference electrode, Pt counter electrode) connected to the portable potentiostat.
3. Detection Procedure (Differential Pulse Voltammetry - DPV):
- Baseline Acquisition: Immerse the biosensor in a stirred buffer solution and run the DPV method to obtain a stable baseline current.
- Inhibition Phase: Incubate the biosensor in a sample solution containing the target OP for a fixed period (e.g., 10-15 minutes). OPs will inhibit the AChE enzyme.
- Substrate Addition & Measurement: Transfer the biosensor to a buffer solution containing the substrate (acetylthiocholine). Record the DPV signal. The reduction in the oxidation current of the enzymatic product (thiocholine) is proportional to the OP concentration [28].
- Regeneration (for re-use): Regenerate the inhibited biosensor by incubating in a solution of a reactivator like pralidoxime (2-PAM).
Protocol: Piezoelectric (QCM) Immunosensor Operation
This protocol describes the steps for conducting a label-free affinity biosensing experiment using a QCM, adaptable for antibody-antigen interactions such as the detection of pesticide residues [26].
1. Sensor Preparation and Baseline Establishment:
- Mount a gold-coated QCM crystal (e.g., 10 MHz) in the flow cell.
- Establish a stable baseline by flowing a running buffer (e.g., phosphate-buffered saline) at a constant rate and temperature. Record the resonant frequency (f) and dissipation (D).
- For advanced characterization, use a QCM-D instrument that can monitor multiple overtones.
2. Surface Functionalization:
- Immobilization Layer: Flow a solution of the capture molecule (e.g., a specific antibody for a target OP) over the crystal surface. This can be done via direct adsorption or through a pre-formed self-assembled monolayer (SAM).
- Washing: Flush with running buffer to remove loosely bound molecules. A stable frequency shift (Δf) indicates successful immobilization.
3. Analyte Binding and Measurement:
- Sample Injection: Introduce the sample containing the target analyte (antigen) into the flow system.
- Real-time Monitoring: Monitor the decrease in resonant frequency (Δf) and increase in dissipation (ΔD) in real-time as the analyte binds to the immobilized capture molecule.
- Kinetic Analysis: The binding curve (Δf vs. Time) can be analyzed to extract association and dissociation rate constants.
4. Sensor Regeneration:
- After measurement, flow a regeneration solution (e.g., low pH glycine buffer) over the sensor surface to break the affinity bonds and remove the bound analyte, returning the frequency close to its post-immobilization value. The sensor can then be used for a new measurement cycle.
The Scientist's Toolkit: Essential Research Reagent Solutions
Table 2: Key Reagents and Materials for Biosensor Development
| Item | Function / Application | Example & Rationale |
|---|---|---|
| Amino-modified Ionic Metal-Organic Frameworks (NH₂-IMOFs) | Electrochemical sensor substrate. Enhances electron transfer and provides a high-surface-area, charged matrix for stable enzyme immobilization [28]. | NH₂-IMOF used in a portable OP sensor; the framework's positive charge enhances electrostatic attraction for enzymes like AChE [28]. |
| Acetylcholinesterase (AChE) | Biorecognition element for organophosphate and carbamate pesticides. | The enzyme's catalytic activity is inhibited by OPs, providing the basis for detection in electrochemical and optical platforms [28]. |
| Gold Electrodes / QCM Crystals | Transducer surface. Provides an inert, conductive, and easily functionalizable platform for biomolecule immobilization. | Standard in electrochemical and piezoelectric (QCM) systems. Gold allows for strong thiol-based chemisorption for creating self-assembled monolayers (SAMs) [26] [24]. |
| Genetically Encoded FRET Biosensors | For intracellular, ratiometric quantification of ions, metabolites, and signaling molecules. | ABACUS (for ABA) and roGFP (for redox potential) are examples. They enable direct, real-time sensing in live cells with high spatiotemporal resolution [25]. |
| Chitosan (CS) | A biopolymer used for enzyme immobilization. Forms a biocompatible hydrogel matrix that entraps enzymes while allowing substrate and product diffusion. | Used in the NH₂-IMOF@CS@AChE biosensor to stabilize the enzyme layer on the electrode surface [28]. |
Advanced Biosensing Platforms and Their Real-World Deployment
Electrochemical biosensors for thiocholine detection represent a cornerstone technology in the development of portable, on-site analytical tools for organophosphate (OP) pesticide monitoring [3] [29]. These biosensors leverage the enzymatic hydrolysis of acetylthiocholine (ATCh) by acetylcholinesterase (AChE) to produce thiocholine, an electroactive compound whose measurement serves as the basis for detecting AChE-inhibiting neurotoxic agents [30] [31]. The inhibition of AChE by OPs provides the fundamental recognition mechanism, with the degree of inhibition correlating directly with pesticide concentration [3]. The selection of specific electrochemical transduction methods—amperometry, potentiometry, or impedimetry—determines critical sensor parameters including sensitivity, detection limit, and suitability for field deployment [32] [33]. This document provides detailed application notes and experimental protocols to guide researchers in developing and optimizing these biosensing platforms for environmental monitoring and food safety applications.
Core Principles and Signaling Pathways
The detection of organophosphates using AChE-based biosensors follows a consistent biochemical pathway, with variations occurring at the electrochemical transduction stage. The fundamental mechanism involves AChE catalyzing the hydrolysis of acetylthiocholine to produce thiocholine and acetate. The subsequent oxidation of thiocholine at the electrode surface generates the measurable electrochemical signal [31]. When OPs are present, they inhibit AChE activity, reducing thiocholine production and causing a corresponding decrease in the electrochemical signal that is proportional to the pesticide concentration [3].
The following diagram illustrates the core signaling pathway and the points of transduction for different electrochemical techniques:
Research Reagent Solutions
The following table details essential materials and their specific functions in developing electrochemical biosensors for thiocholine detection.
Table 1: Essential Research Reagents for Thiocholine Biosensor Development
| Reagent | Function and Application Notes |
|---|---|
| Acetylcholinesterase (AChE) | Biological recognition element; catalyzes ATCh hydrolysis to thiocholine. Source (electric eel, bovine erythrocytes) and immobilization method significantly impact biosensor stability and sensitivity [30] [3]. |
| Acetylthiocholine (ATCh) Chloride/Iodide | Enzymatic substrate. ATCh chloride is preferred for amperometry to avoid interference from iodide oxidation, whereas either salt can be used for potentiometric detection [31]. |
| Carbon Nanotubes (CNTs) | Electrode nanomaterial; enhances electron transfer kinetics, increases effective surface area, and lowers thiocholine oxidation overpotential (~360 mV) [29] [31]. |
| Cobalt Phthalocyanine (CoPC) | Electron mediator; significantly reduces working overpotential for thiocholine oxidation to ~110 mV, minimizing interference from coexisting electroactive species [30] [31]. |
| Glutaraldehyde/BSA | Crosslinking system; standard mixture for enzyme immobilization on electrode surfaces via co-crosslinking, ensuring stable biorecognition layer formation [34] [31]. |
| Organophosphate Standards | Target analytes for inhibition-based detection (e.g., paraoxon, carbofuran). Used for biosensor calibration and evaluation of analytical performance [30] [3]. |
Detection Modalities: Principles and Protocols
Amperometric Detection
Amperometric biosensors measure the steady-state current generated by the electrochemical oxidation of thiocholine at a constant applied potential. The current magnitude is directly proportional to the thiocholine concentration, which in turn reflects AChE activity [30] [34].
Table 2: Performance Comparison of Amperometric Biosensors
| Electrode Material | Applied Potential (vs. Ag/AgCl) | Detection Limit | Linear Range | Key Advantage |
|---|---|---|---|---|
| FePC-modified Carbon Paste | +0.35 V (for H₂O₂ detection) | 10⁻¹⁰ M Paraoxon | Not Specified | Low operating potential in bienzymatic system [30] |
| CoPC-modified SPE | ~+0.11 V | Not Specified | Not Specified | Very low overpotential for thiocholine oxidation [31] |
| CNT-modified SPE | ~+0.36 V | Not Specified | Not Specified | High sensitivity and good electrocatalysis [31] |
| Pt/Overoxidized Ppy-ChOx | +0.7 V (vs. SCE) | 0.5 U L⁻¹ BChE | Wide | Interference removal by polypyrrole layer [34] |
Protocol 1: Amperometric Biosensor for AChE Inhibition
- Objective: To fabricate an amperometric biosensor and measure AChE inhibition by organophosphates.
Materials: Screen-printed electrode (SPE, carbon, Pt, or Au); AChE enzyme; Acetylthiocholine chloride (ATCh-Cl); Glutaraldehyde (0.25%); Bovine Serum Albumin (BSA, 0.1%); Phosphate Buffer Saline (PBS, 0.1 M, pH 7.0-8.0) [34] [31].
Experimental Workflow:
- Critical Notes:
- Potential Optimization: The working potential must be optimized for each electrode type to maximize the signal-to-noise ratio for thiocholine oxidation while minimizing interference [31].
- Substrate Choice: Acetylthiocholine chloride is strongly recommended over the iodide salt to avoid parasitic currents from iodide oxidation, which can obscure the thiocholine signal and prevent observation of complete enzyme inhibition [31].
Potentiometric Detection
Potentiometric biosensors measure the potential difference between working and reference electrodes under conditions of negligible current flow. This potential change often results from ion fluxes generated by enzymatic activity, such as the production of protons during thiocholine hydrolysis [32].
Protocol 2: Potentiometric Transducer Setup
- Objective: To configure a potentiometric system for monitoring AChE-catalyzed reactions.
Materials: Ion-Selective Electrode (ISE) or Metal Electrode; High-Impedance Potentiometer; Reference Electrode (e.g., Ag/AgCl); Magnetic stirrer [32].
Procedure:
- Immobilize AChE on the surface of the ion-selective electrode or a conventional solid-contact electrode. This can be done via cross-linking with BSA/glutaraldehyde or entrapment within a polymer membrane (e.g., Nafion, chitosan) [32].
- Place the modified working electrode and the reference electrode in a stirred buffer solution containing the sample.
- Record the baseline potential until a stable reading is obtained.
- Inject a known concentration of acetylthiocholine substrate into the solution.
- Monitor the potential shift over time. The rate and magnitude of the potential change are related to the enzymatic activity.
- For inhibition assays, pre-incubate the biosensor with the OP sample before adding the substrate. The degree of inhibition is quantified by the reduced rate of potential change compared to the uninhibited control [32].
Critical Notes:
- Potentiometric sensors are highly sensitive to ionic strength and buffer capacity. Use a low-capacity buffer to maximize the pH shift signal from the enzymatic reaction.
- These sensors are susceptible to drift, requiring a stable reference electrode and temperature control for accurate measurements.
Impedimetric Detection
Electrochemical Impedance Spectroscopy (EIS) detects changes in the charge transfer resistance (Rₑₜ) at the electrode-solution interface resulting from the enzymatic generation of thiocholine or the binding of inhibitors. EIS is a label-free technique that provides rich information about interfacial properties [35] [33].
Protocol 3: Label-Free Impedimetric Biosensing of AChE Inhibition
- Objective: To detect OPs by measuring impedance changes due to AChE inhibition.
Materials: SPE (Gold or carbon); Impedance Analyzer; Redox probe (e.g., [Fe(CN)₆]³⁻/⁴⁻); AChE enzyme; ATCh-Cl; OPs standard [35] [29].
Procedure:
- Modify the Electrode: Immobilize AChE on the SPE surface.
- Record EIS Spectrum (Initial): Measure the impedance in a solution containing a redox probe (e.g., 5 mM [Fe(CN)₆]³⁻/⁴⁻ in PBS) over a frequency range (e.g., 0.1 Hz to 100 kHz) at a fixed DC potential. Fit the data to a Randles equivalent circuit to extract the initial charge transfer resistance (Rₑₜ,ᵢₙᵢₜᵢₐₗ) [35].
- Incubate with Analyte: Expose the biosensor to the sample containing the target OP for a fixed period (e.g., 10 minutes).
- Record EIS Spectrum (Post-Inhibition): Wash the electrode and measure the impedance again in the fresh redox probe solution to obtain the new charge transfer resistance (Rₑₜ,ᵢₙₕᵢᵦᵢₜₑ𝒹).
- Data Analysis: The percentage of AChE inhibition can be calculated using the formula: % Inhibition = [ (Rₑₜ,ᵢₙₕᵢᵦᵢₜₑ𝒹 - Rₑₜ,ᵢₙᵢₜᵢₐₗ) / Rₑₜ,ᵢₙᵢₜᵢₐₗ ] × 100% This value is then correlated with the concentration of the inhibiting OP [29].
Amperometric, potentiometric, and impedimetric biosensors each offer distinct advantages for the detection of thiocholine and the monitoring of AChE-inhibiting organophosphates. The choice of technique involves a trade-off between sensitivity, simplicity, portability, and robustness. The ongoing integration of nanomaterials, novel immobilization strategies, and microfluidic platforms is steadily enhancing the performance of these biosensors, pushing detection limits to sub-nanomolar concentrations and making them increasingly viable for rigorous on-site environmental and food safety analysis [3] [29] [33]. The protocols outlined herein provide a foundational framework for researchers to develop and refine these critical analytical tools.
Ion-Sensitive Field-Effect Transistor (ISFET) biosensors represent a advanced class of electronic sensors that combine the sensitivity of field-effect transistors with the specificity of biological recognition elements. Initially pioneered in 1970, these devices substitute the traditional metal gate of a MOSFET with an ion-sensitive film and an electrolyte solution, creating a platform exquisitely sensitive to biochemical changes at its surface [36] [37]. The fundamental operating principle hinges on the modulation of the transistor's threshold voltage (Vth) when target analytes interact with the biologically sensitized gate region. This interaction alters the surface potential, subsequently changing the channel conductivity between the source and drain electrodes, thereby converting biological recognition events into quantifiable electrical signals [36].
The significance of ISFETs in modern biosensing stems from their numerous advantages, including label-free operation, miniaturization potential, high sensitivity, and rapid response times [36]. Their structure typically comprises a silicon semiconductor gate, an ion-selective membrane, a reference electrode, and an insulating layer. The gate region is functionalized with a recognition element (e.g., enzymes, antibodies, aptamers, or whole cells) tailored to the specific analyte of interest [36] [38]. This configuration allows ISFETs to detect a wide palette of targets, from ions and nucleic acids to proteins and cellular components, making them indispensable in fields ranging from clinical diagnostics to environmental monitoring [36].
Recent advancements have further propelled ISFET biosensors to the forefront of sensing technology. The integration of novel nanomaterials and microelectronic fabrication techniques has significantly enhanced sensor performance, steering their development toward higher sensitivity, seamless integration, and multifaceted detection capabilities [36]. These improvements are particularly relevant for applications in portable and on-site detection, such as the monitoring of organophosphorus pesticides (OPPs) in agricultural and environmental settings [39].
Application Note: ISFET Biosensor for Organophosphorus Pesticide Detection
Sensing Principle and Mechanism
The detection of organophosphorus pesticides (OPPs) using ISFET biosensors operates on the principle of enzyme inhibition [39]. A specific portable biosensor prototype utilizing the microalgae Chlorella sp. immobilized on a Ta₂O₅ ISFET has been developed for this purpose. In this system, the detection mechanism is based on the pesticide-induced inhibition of the enzyme alkaline phosphatase (AP) [39]. The enzymatic activity of AP typically leads to the production of ascorbic acid. When OPPs are present, they inhibit this enzyme, resulting in a measurable decrease in ascorbic acid production. This change in the concentration of the enzymatic product directly alters the local ionic environment at the gate surface of the ISFET, transducing the biochemical event into a potentiometric signal—a change in the output current or voltage—that is correlated with the pesticide concentration [39].
This mechanism is visually summarized in the following workflow:
Performance and Analytical Figures of Merit
The developed ISFET biosensor demonstrates exceptional performance for the detection of specific OPPs. The sensitivity, selectivity, and detection limit were rigorously evaluated for a range of pesticides, including acephate, triazophos, chlorpyrifos, and malathion [39]. The biosensor's performance metrics are summarized in the table below.
Table 1: Analytical Performance of the ISFET Biosensor for Organophosphorus Pesticides
| Pesticide | Detection Limit | Linear Range | Response Time | Key Performance Notes |
|---|---|---|---|---|
| Acephate | 10⁻¹⁰ M | 10⁻¹⁰ to 10⁻² M | 4 minutes | Remarkably high sensitivity and selectivity [39] |
| Triazophos | 10⁻¹⁰ M | 10⁻¹⁰ to 10⁻² M | 4 minutes | Remarkably high sensitivity and selectivity [39] |
| Chlorpyrifos | - | 10⁻⁷ to 10⁻² M | 4 minutes | - |
| Malathion | - | - | 4 minutes | Reduced sensitivity and inconsistent trends [39] |
The biosensor achieves an ultra-low detection limit of 10⁻¹⁰ M for acephate and triazophos, showcasing its capability to detect trace-level pesticide concentrations [39]. The linear response across a wide concentration range (from 10⁻¹⁰ M to 10⁻² M for some OPPs) ensures utility in both highly contaminated and lightly contaminated samples. The rapid response time of just 4 minutes facilitates near real-time monitoring, a critical feature for on-site applications [39]. Furthermore, the biosensor's accuracy was validated against the standard laboratory method of High-Performance Liquid Chromatography (HPLC) using real-time soil samples, with an observed average deviation of less than 10%, confirming its reliability for real-world analysis [39].
Experimental Protocol
Biosensor Fabrication and Functionalization
This protocol details the procedure for fabricating a portable potentiometric biosensor using Chlorella sp. immobilized on a Ta₂O₅ ISFET for the detection of organophosphorus pesticides [39].
Table 2: Research Reagent Solutions and Essential Materials
| Item/Chemical | Function / Role in the Experiment | Specifications / Notes |
|---|---|---|
| Ta₂O₅ ISFET Chip | Transducer platform; converts biological event to electrical signal. | Gate insulator sensitive to pH/ionic changes [39] [36]. |
| Chlorella sp. Culture | Whole-cell bio-recognition element; source of alkaline phosphatase enzyme. | Cultivated and harvested prior to immobilization [39]. |
| 2-Phospho-L-ascorbic acid (PAA) | Enzyme substrate for alkaline phosphatase. | Concentration optimized at 0.4 mL for the assay [39]. |
| Glutaraldehyde | Crosslinking agent for immobilizing algal cells on the ISFET gate. | Creates stable covalent bonds [39]. |
| Bovine Serum Albumin (BSA) | May be used as a blocking agent to reduce non-specific binding. | - |
| Tris-HCl Buffer | Provides a stable pH environment for the biochemical reaction. | - |
| Magnesium Chloride (MgCl₂) | Enzyme activator for alkaline phosphatase. | - |
| Organophosphorus Pesticide Standards | Analytic targets for validation (e.g., acephate, triazophos). | Prepared in a range of concentrations from 10⁻¹⁰ to 10⁻² M [39]. |
Procedure:
- ISFET Preparation: Clean the surface of the Ta₂O₅ ISFET chip to ensure it is free from contaminants.
- Algal Immobilization: Mix 20 μL of the prepared Chlorella sp. suspension (optimal concentration) with a crosslinking agent such as glutaraldehyde. Apply this mixture to the gate region of the ISFET and allow it to immobilize, forming a stable bio-recognition layer [39].
- System Assembly: Integrate the functionalized ISFET into a portable potentiometric measurement device. This includes connecting the source, drain, and reference electrodes to the appropriate readout circuitry.
- Baseline Measurement: Introduce the substrate solution, 0.4 mL of PAA, in Tris-HCl buffer with MgCl₂ to the biosensor. Measure the initial output signal (current or voltage), which corresponds to the uninhibited enzymatic production of ascorbic acid [39].
Measurement and Detection Protocol
Procedure:
- Sample Introduction: Introduce the sample (e.g., extracted soil solution suspected to contain OPPs) to the biosensor chamber containing the substrate.
- Incubation and Reaction: Allow the sample to incubate for the optimized response time of 4 minutes. During this period, any OPPs present will inhibit the alkaline phosphatase enzyme in the immobilized Chlorella sp. cells [39].
- Signal Measurement: After the 4-minute response time, measure the final output signal from the ISFET. The difference from the baseline signal is inversely proportional to the enzymatic activity and, therefore, directly proportional to the concentration of the inhibiting pesticide [39].
- Quantification: Correlate the measured signal change (e.g., threshold voltage shift or drain current change) with pesticide concentration using a pre-established calibration curve plotted for known standard concentrations of the target OPP [39] [36].
- Validation (Optional): For research validation, compare the results obtained with the ISFET biosensor against a standard method like HPLC for the same sample to confirm accuracy and reliability [39].
The following diagram illustrates the key components and operational workflow of the ISFET biosensor:
Discussion and Comparative Analysis
The ISFET biosensor platform using Chlorella sp. presents a compelling alternative to conventional pesticide detection methods like spectrophotometry and chromatography, which are often constrained by complex procedures, high costs, and lack of portability [39]. The core strength of this technology lies in its use of whole algal cells as the bio-recognition element. Compared to biosensors relying on purified enzymes, whole-cell systems offer enhanced stability, viability, and functional robustness under in vitro conditions, maintaining consistent performance with less rigorous stabilization protocols [39].
The presented biosensor exemplifies the key trends in modern biosensing: portability, cost-effectiveness, and high reproducibility [39]. Its design aligns with the growing demand for point-of-care testing (POCT) and on-site environmental monitoring tools. When benchmarked against other enzymatic biosensors, this ISFET-based device stands out for its ultra-low detection limits and rapid analysis time [39]. The successful validation against HPLC for real soil sample analysis underscores its practical utility and trueness, moving it beyond a mere laboratory prototype [39].
Future advancements in this field may involve the integration of other novel biorecognition elements like aptamers or antibody fragments to expand the range of detectable analytes or improve specificity [40] [36]. Furthermore, the convergence of ISFET technology with smartphone-based readout systems and AI-powered data analytics, as seen in broader biosensor market trends, promises to create even more intelligent, proactive, and accessible diagnostic tools for environmental and agricultural monitoring [41] [42].
The detection and monitoring of organophosphorus pesticides (OPs) are critical for ensuring environmental safety and public health. Conventional techniques like chromatography, while sensitive, are laboratory-bound, costly, and time-consuming, making them unsuitable for rapid, on-site screening [39] [43]. Biosensors present a promising alternative, and among them, whole-cell biosensors utilizing microorganisms like the microalga Chlorella sp. offer distinct advantages in robustness, cost-effectiveness, and functional stability for field-deployable applications [39] [44] [45].
Whole-cell biosensors leverage intact living cells as the biorecognition element. Algal cells, in particular, provide a sustainable and resilient biological component, tolerating quasi-physiological conditions better than purified enzymes and maintaining consistent performance under variable conditions [39] [45]. Their ease of cultivation, extended lifespan, and high metabolic productivity make them ideal candidates for sensor modification [39]. This application note details the use of Chlorella sp.-based biosensors for OPs detection, providing validated protocols and analytical data tailored for researchers developing portable on-site detection systems.
Application Notes
Whole-cell algal biosensors primarily operate on two core principles: enzyme inhibition and photosystem disruption. The selection of the sensing mechanism depends on the target analyte and the desired sensor configuration.
- Enzyme Inhibition-Based Detection: This mechanism exploits the inhibitory effect of OPs on specific algal enzymes. A prominent example involves the inhibition of the enzyme alkaline phosphatase (AP). The detection is based on the pesticide-induced inhibition of AP activity, which leads to a measurable decrease in the production of ascorbic acid. This biochemical change is then transduced into an electrical signal, typically using a potentiometric Ion-Sensitive Field-Effect Transistor (ISFET) [39].
- Photosystem II (PS II)-Based Detection: This approach utilizes the inherent photosynthetic machinery of the algal cell. Organophosphorus pesticides can inhibit electron transport within PS II, typically by binding to the D1 protein. Under illumination, this disruption causes a measurable change (usually a decrease) in the photocurrent generated by the algal cells, which can be detected amperometrically [44].
The following diagram illustrates the two primary signaling pathways for algal whole-cell biosensors.
Algal whole-cell biosensors have been successfully configured into different formats, each with its own performance characteristics, as summarized in the table below.
Table 1: Performance comparison of suspended vs. immobilized Chlorella sp. biosensors.
| Parameter | Suspended Cell Configuration | Immobilized Cell Configuration |
|---|---|---|
| Immobilization Method | Cells free in solution | Glutaraldehyde cross-linking on electrode surface (e.g., Glassy Carbon Electrode) [44] |
| Detection Principle | Amperometric (PS II inhibition) [44] | Amperometric (PS II inhibition) [44] |
| Typical Algal Volume | 0.3 mL [44] | 25 µL [44] |
| Optimal pH | 7.0 [44] | 7.0 [44] |
| Response Time | Minutes [44] | Minutes [44] |
| Signal Trend (e.g., for Acephate) | Current decrease [44] | Current decrease [44] |
| Signal Trend (e.g., for Triazophos) | Current increase [44] | Current decrease [44] |
| Key Advantages | Simpler preparation, direct interaction with analyte [44] | Enhanced stability, reusability, consistent signal output, better suited for portable devices [44] [46] |
The core advantage of whole-cell systems lies in their robustness. Algal cells provide a more practical and stable alternative to biosensors relying on purified enzymes. They endure fluctuations in environmental conditions better, maintaining consistent performance and reducing the need for rigorous stabilization protocols [39]. Furthermore, the use of whole cells is often more cost-effective than isolating and purifying enzymes [45] [46].
Experimental Protocols
Protocol 1: ISFET-Based Potentiometric Biosensor Using ImmobilizedChlorellasp.
This protocol describes the construction and use of a portable, potentiometric biosensor for OPs detection based on the inhibition of alkaline phosphatase in Chlorella sp. [39].
1. Materials and Reagents
- Algal Strain: Chlorella sp. culture
- Buffer: Tris-HCl buffer (reaction medium)
- Substrate: 2-Phospho-L-ascorbic acid (PAA)
- Enzyme Activator: Magnesium chloride (MgCl₂)
- Immobilization Reagents: Glutaraldehyde, Bovine Serum Albumin (BSA)
- Pesticide Standards: Acephate, triazophos, chlorpyrifos, malathion
- Equipment: Ta₂O₅-Ion Sensitive Field-Effect Transistor (ISFET), potentiometric measuring device, portable prototype setup
2. Algal Immobilization on ISFET 1. Harvest Chlorella sp. cells from a cultured medium during the logarithmic growth phase via centrifugation. 2. Wash the cell pellet with Tris-HCl buffer to remove residual growth medium. 3. Prepare an immobilization mixture containing 20 µL of algal suspension, BSA, and glutaraldehyde as a cross-linking agent. 4. Carefully deposit the mixture onto the open gate surface of the Ta₂O₅-ISFET and allow it to cross-link and dry, forming a stable biofilm on the transducer.
3. Measurement Procedure 1. Place the algal-modified ISFET sensor and a reference electrode into the measurement cell. 2. Add 0.4 mL of PAA substrate and MgCl₂ activator into the cell containing the sample or standard solution in Tris-HCl buffer. 3. Allow the system to stabilize for approximately 4 minutes (the optimized response time). 4. Record the potentiometric signal (change in gate voltage) generated due to the enzymatic production of ascorbic acid. 5. For inhibition assays, incubate the sensor with the OP-containing sample for a set time before adding the substrate to measure the inhibition of the alkaline phosphatase activity.
4. Data Analysis 1. Measure the signal output (voltage change) for standard solutions of known OP concentrations. 2. Construct a calibration curve by plotting the signal response (or the percentage of enzyme inhibition) against the logarithm of the pesticide concentration. 3. Use the calibration curve to interpolate the concentration of OPs in unknown samples.
The workflow for this protocol is as follows:
Protocol 2: Amperometric Biosensor in Suspended and Immobilized Configurations
This protocol outlines the steps for detecting OPs via inhibition of Photosystem II (PS II) in Chlorella sp. using amperometry, applicable to both suspended and immobilized cell formats [44].
1. Materials and Reagents
- Algal Strain: Chlorella sp. culture
- Buffer: Phosphate buffer saline (PBS), pH 7.0
- Immobilization Reagents: Glutaraldehyde
- Pesticide Standards: Acephate, triazophos
- Equipment: Glassy Carbon Electrode (GCE), potentiostat for chronoamperometry, electrochemical cell
2. Sensor Preparation * Suspended Configuration: Harvest and wash Chlorella sp. cells. Resuspend in PBS to the optimal concentration (e.g., 0.3 mL algal suspension per measurement) [44]. * Immobilized Configuration: Immobilize 25 µL of algal cells directly onto the surface of a Glassy Carbon Electrode (GCE) using glutaraldehyde as a cross-linking agent [44].
3. Amperometric Measurement 1. Place the working electrode (GCE with or without immobilized algae) into the electrochemical cell containing PBS under illumination. 2. Apply a constant potential and allow the photocurrent generated by the algal cells to stabilize. 3. Introduce the OP sample into the cell. 4. Monitor the change in current (using chronoamperometry) over time. The inhibition of PS II will manifest as a decrease in the anodic photocurrent. 5. Record the steady-state current after inhibition.
4. Data Analysis
1. Calculate the percentage of inhibition for each standard concentration: % Inhibition = [(I₀ - I) / I₀] × 100, where I₀ is the initial current and I is the current after exposure to the pesticide.
2. Generate a calibration curve by plotting the % inhibition against the pesticide concentration.
3. Determine the concentration of unknown samples from the calibration curve.
The Scientist's Toolkit: Research Reagent Solutions
Table 2: Essential materials and reagents for algal whole-cell biosensor construction.
| Reagent/Material | Function/Application | Specification Notes |
|---|---|---|
| Chlorella sp. Culture | Biological recognition element; provides alkaline phosphatase or Photosystem II for inhibition-based detection. | Use cultures in the logarithmic growth phase for maximum enzymatic activity and consistency [39] [44]. |
| Tris-HCl Buffer | Reaction medium for maintaining optimal pH for enzymatic (alkaline phosphatase) activity. | Ensures stable pH conditions during potentiometric measurements [39]. |
| 2-Phospho-L-ascorbic acid (PAA) | Enzyme substrate for alkaline phosphatase. | Conversion to ascorbic acid produces a measurable pH change [39]. |
| Glutaraldehyde | Cross-linking agent for immobilizing algal cells on transducer surfaces. | Enhances stability and reusability of the biosensor [44]. |
| Bovine Serum Albumin (BSA) | Used in combination with glutaraldehyde to form a stable protein-based matrix for cell immobilization. | Improves the mechanical strength and adhesion of the biofilm [39]. |
| Ta₂O₅-ISFET Transducer | Potentiometric transducer; detects ionic changes (H⁺) in the medium with high sensitivity. | The core of the portable biosensor prototype for on-site detection [39]. |
| Glassy Carbon Electrode (GCE) | Working electrode for amperometric measurements. | Used for detecting photocurrent changes in PS II-based biosensors [44]. |
Analytical Data and Validation
The performance of Chlorella sp.-based biosensors has been rigorously quantified, demonstrating high sensitivity and applicability for environmental monitoring.
Table 3: Quantitative detection performance for various organophosphorus pesticides.
| Pesticide | Biosensor Type | Linear Detection Range (M) | Detection Limit (M) | Real-Sample Validation |
|---|---|---|---|---|
| Acephate | ISFET-Potentiometric [39] | 10⁻¹⁰ to 10⁻² | 10⁻¹⁰ | Soil samples, compared with HPLC [39] |
| Triazophos | ISFET-Potentiometric [39] | 10⁻¹⁰ to 10⁻² | 10⁻¹⁰ | Soil samples, compared with HPLC [39] |
| Chlorpyrifos | ISFET-Potentiometric [39] | 10⁻⁷ to 10⁻² | 10⁻⁷ | - |
| Acephate | Amperometric (Immobilized) [44] | 10⁻⁷ to 10⁻² | Not Specified | - |
| Triazophos | Amperometric (Immobilized) [44] | 10⁻⁹ to 10⁻² | Not Specified | - |
| Methyl Parathion | Amperometric (Macroalgae) [47] | Sub-ppm levels | Not Specified | Water samples, compared with GC-MS [47] |
Validation against standard analytical techniques is crucial for establishing credibility. For instance, the ISFET-based biosensor was successfully validated for detecting acephate and triazophos in real-time soil sample analysis, showing less than 10% average deviation when compared to the reference High-Performance Liquid Chromatography (HPLC) method [39]. Similarly, a macroalgae-based amperometric biosensor for methyl parathion showed a good correlation with Gas Chromatography-Mass Spectrometry (GC-MS) results in water analysis [47].
Colorimetric and Distance-Based Paper Sensors for Instrument-Free, Naked-Eye Readout
The need for rapid, on-site detection of organophosphates (OPs) has driven the development of innovative biosensing platforms that prioritize portability, ease of use, and visual readout without sophisticated instrumentation. Paper-based sensors represent a transformative approach in analytical chemistry, leveraging the inherent advantages of paper as a low-cost, disposable, and versatile substrate for fluid transport and reagent immobilization [48] [17]. These sensors have evolved significantly, moving from traditional enzyme-dependent systems to more robust enzyme-free configurations, and from single-mode colorimetric signals to dual-mode detection that enhances reliability through cross-validation [48]. Within the context of portable biosensor research for on-site organophosphate detection, colorimetric and distance-based paper sensors offer distinct advantages: they eliminate the need for expensive, laboratory-bound equipment like gas chromatography-mass spectrometry (GC-MS) and high-performance liquid chromatography (HPLC), reduce analysis time from hours to minutes, and empower non-specialists to perform complex analytical measurements through intuitive visual interpretation [7] [49]. This protocol details the application of these advanced paper sensors, providing a framework for their implementation in field-deployable biosensing platforms for environmental and food safety monitoring.
The landscape of paper-based sensors for organophosphate detection is primarily divided into two innovative categories: colorimetric/fluorescent dual-mode sensors and distance-based quantitative sensors. The dual-mode sensors utilize nanozymes, such as Zn-doped Fe-based metal-organic frameworks (MIL-88B-Fe/Zn), which exhibit peroxidase-like activity. In the presence of organophosphates, the inhibition of this catalytic activity leads to measurable changes in both color and fluorescence, providing two independent readout channels for enhanced reliability [48]. Conversely, distance-based sensors transform quantitative chemical information into a measurable flow distance on a paper strip, typically based on hydrogel formation or viscosity changes in response to the target analyte, enabling semi-quantitative analysis through a simple, ruler-like measurement [50].
Table 1: Comparative Performance of Paper-Based Sensor Technologies for Organophosphate Detection
| Sensor Technology | Detection Principle | Linear Range | Detection Limit | Key Advantages |
|---|---|---|---|---|
| Dual-Mode Colorimetric/Fluorescent (Nanozyme-based) [48] | Inhibition of MIL-88B-Fe/Zn nanozyme activity, monitored via color change (TMB oxidation) and fluorescence recovery (NR-CDs). | Not explicitly specified | Glyphosate: 1.04 ng/mL (colorimetric), 1.22 ng/mL (fluorescent) | Dual-signal self-validation; device-free visual detection; high sensitivity; bio-enzyme-free stability. |
| Enzymatic Colorimetric (AChE-based) [17] | Inhibition of Acetylcholinesterase (AChE), preventing the hydrolysis of acetylthiocholine and subsequent color generation with DTNB. | Quantitative up to 200 ppm malathion | Malathion: 2.5 ppm | Well-established biochemical principle; cost-effective reagents; suitable for a broad class of AChE-inhibiting pesticides. |
| Distance-Based (Hydrogel Formation) [50] | Chelation between sodium alginate and Ca2+/Mg2+ induces hydrogel formation, altering solution viscosity and lateral flow distance. | Ca2+: 0–10 mmol L-1Mg2+: 4–20 mmol L-1 | Dependent on the specific ion concentration and its contribution to water hardness. | Truly instrument-free quantification; simple operation; very low cost; ideal for semi-quantitative field screening. |
| Organophosphate Hydrolase (OPH)-Based Biosensor [51] | Direct hydrolysis of OPs by OPH, integrated with a portable imaging system for signal readout. | 100 ng mL−1 to 0.1 ng mL−1 | Linear down to 0.1 ng mL−1 | Functional superiority over AChE; no need for reactivation steps; designed for high-throughput field use. |
Detailed Experimental Protocols
Protocol 1: Bio-enzyme-free Dual-Mode Paper Sensor
This protocol outlines the procedure for fabricating and using a dual-mode paper sensor that does not rely on biological enzymes, thereby offering improved stability and lower cost [48].
Key Research Reagent Solutions:
- MIL-88B-Fe/Zn Nanozyme: Serves as the peroxidase mimic, catalyzing the colorimetric reaction. Its activity is inhibited by OPs.
- TMB (3,3',5,5'-Tetramethylbenzidine): A chromogenic substrate that turns blue when oxidized by the nanozyme in the presence of H2O2.
- NR-CDs (Neutral Red-derived Carbon Dots): Provides a stable red fluorescence signal, which is quenched by oxTMB via the Inner Filter Effect (IFE) and recovered upon OP-induced inhibition.
- H2O2 (Hydrogen Peroxide): The core reactant for the peroxidase-like catalytic cycle.
Methodology:
- Sensor Fabrication (T-N Paper):
- Prepare a solution containing TMB and NR-CDs in an appropriate buffer.
- Immobilize the TMB/NR-CDs mixture onto filter paper (e.g., Whatman grade 1) using a physical deposition method. This can be achieved by drop-casting a precise volume of the solution onto the paper.
- Dry the modified paper at room temperature in a desiccator to complete the fabrication of the "T-N paper" sensor [48].
- Detection Procedure:
- Sample Incubation: In a well plate or tube, mix the sample solution (suspected to contain OPs) with the MIL-88B-Fe/Zn nanozyme suspension and H2O2. Incubate for a predefined time (e.g., 10-30 minutes).
- Sensor Application: Apply a drop of the reacted mixture onto the prepared T-N paper.
- Signal Development and Readout: Allow the solution to absorb and react on the paper.
- Colorimetric Mode: Observe the color under daylight. A blue color indicates low OP concentration (high nanozyme activity), while a red color (from the NR-CDs) indicates high OP concentration (inhibited nanozyme activity).
- Fluorescence Mode: Observe the sensor under a UV lamp (e.g., 365 nm). Weak red fluorescence indicates low OP concentration, while strong red fluorescence indicates high OP concentration due to the recovery of the NR-CDs fluorescence [48].
- Quantification: Capture images of the sensor under both daylight and UV light using a smartphone. Use color recognition software (e.g., ImageJ, Adobe Photoshop) or a dedicated app to analyze the Red/Blue/Green (RGB) values. Plot the R/B value (for colorimetric) or the R value (for fluorescence) against the OP concentration to generate a calibration curve for quantitative analysis.
Protocol 2: Distance-Based Paper Sensor for Hardness Ions as a Model System
This protocol describes a distance-based sensor for detecting water hardness ions (Ca2+/Mg2+), which serves as an excellent model for the principles that can be applied to develop similar sensors for organophosphates [50].
Key Research Reagent Solutions:
- Sodium Alginate (Alg): A natural polymer that forms a hydrogel "egg-box" structure upon chelation with di- or trivalent cations like Ca2+ and Mg2+.
- Tris-HCl Buffer (pH = 7.4): Provides a stable pH environment for the chelation reaction.
- pH Indicator Paper Strips: Serve as the substrate for the lateral flow, providing a contrasting background to visualize the water flow distance.
Methodology:
- Sample Pre-treatment:
- Prepare a sodium alginate solution at an optimized concentration (e.g., 0.1-0.5 wt%) in Tris-HCl buffer.
- Mix the water sample (containing Ca2+/Mg2+) with the alginate solution and vortex thoroughly.
- Incubate the mixture to allow for hydrogel formation via chelation. The formation of the hydrogel network consumes alginate, reducing the viscosity of the remaining solution [50].
- Sensor Operation and Readout:
- Centrifuge the incubated mixture to separate the formed hydrogel from the supernatant.
- Pipette a fixed volume (e.g., 30 µL) of the supernatant onto one end of a pH test strip.
- Hold the strip at a slight angle or lay it flat, and allow the liquid to flow laterally for a fixed time (e.g., 2 minutes).
- Measure the lateral flow distance of the liquid front. A longer flow distance corresponds to a higher concentration of target ions (Ca2+/Mg2+), as the viscosity of the supernatant is lower due to greater hydrogel formation and alginate consumption [50].
- Quantification: Photograph the strip and use image analysis software to calculate the water trace coverage ratio (Cr = Pmark / Ptotal). Create a calibration curve by plotting Cr values against known concentrations of the target ions.
Signaling Pathways and Workflow Visualizations
Dual-Mode Sensor Signaling Mechanism
The following diagram illustrates the signaling mechanism of the bio-enzyme-free dual-mode paper sensor.
Experimental Workflow for Sensor Fabrication and Use
This workflow outlines the key steps in creating and utilizing a typical colorimetric paper sensor.
The Scientist's Toolkit: Essential Research Reagents and Materials
The successful development and deployment of paper-based sensors rely on a core set of reagents and materials. The following table details these essential components and their functions within the sensing platform.
Table 2: Key Research Reagent Solutions for Paper-Based Sensor Development
| Reagent/Material | Function / Role in Sensing | Examples / Notes |
|---|---|---|
| Nanozymes [48] | Mimics the catalytic activity of natural enzymes (e.g., peroxidase) to trigger a signal reaction; inhibited by OPs. | MIL-88B-Fe/Zn; offers stability and avoids the cost and fragility of biological enzymes. |
| Chromogenic Substrates [48] [17] | Produces a visible color change upon enzymatic or nanozymatic oxidation, enabling colorimetric readout. | TMB (turns blue); DTNB (Ellman's reagent, used with AChE, produces yellow color). |
| Fluorescent Probes [48] | Provides a fluorescence signal that can be modulated (quenched/recovered) by the sensing reaction for a second detection mode. | NR-CDs (Neutral Red-derived Carbon Dots); fluorescence is quenched by oxTMB via IFE. |
| Stabilizers [17] | Enhances the shelf-life of biological components (e.g., enzymes) in the sensor by preserving their activity during storage. | Glucose, Trehalose, Bovine Serum Albumin (BSA). |
| Paper Substrate [48] [17] [50] | Serves as the physical platform for reagent immobilization, fluid transport via capillary action, and the site for signal generation. | Filter paper (e.g., Munktell), pH test strips. Chosen for porosity, wet strength, and low background. |
| Hydrogel Polymers [50] | Undergoes a viscosity change or gel-sol transition in response to the analyte, enabling distance-based detection. | Sodium Alginate (forms hydrogel with Ca2+/Mg2+). |
| Cell-Based Recognition Elements [49] | Uses live cells (e.g., neuroblastoma) as the sensing element; the cell membrane potential changes in response to AChE inhibitors. | N2a cells immobilized in alginate beads; integrated into a Bioelectric Recognition Assay (BERA). |
Fluorometric biosensors have emerged as powerful tools for the highly sensitive detection of organophosphorus pesticides (OPs), leveraging the unique photophysical properties of quantum dots and other fluorescent nanomaterials. These sensors operate on the principle that when electrons in fluorescent materials absorb low-wavelength light and become excited, their return to ground states emits light of a longer wavelength, providing a measurable signal for detection [52]. The exceptional sensitivity of these methods stems from their ability to detect changes in fluorescence intensity, absorption/emission wavelengths, and through mechanisms such as Förster resonance energy transfer (FRET) and the inner filter effect (IFE) [53] [52].
For OP detection specifically, most fluorometric sensors utilize the enzyme acetylcholinesterase (AChE) as a biorecognition element. OPs inhibit AChE activity, which can be quantitatively measured through fluorescent signals [3] [54]. The integration of nanomaterials has significantly advanced this field by providing enhanced sensitivity, selectivity, and stability compared to conventional detection methods. These fluorescent platforms offer substantial advantages over traditional chromatographic techniques like GC-MS and HPLC, which despite their high precision, require expensive equipment, expert technicians, and tedious analytical procedures [55] [56]. In contrast, fluorometric sensors enable rapid, cost-effective, and on-site detection capabilities that are particularly valuable for environmental monitoring and food safety applications [57] [58].
Signaling Mechanisms in Fluorescent Biosensors
Fundamental Photophysical Processes
The operational principles of fluorometric sensors for OP detection primarily rely on three well-established photophysical mechanisms, each with distinct characteristics and applications. The Förster Resonance Energy Transfer (FRET) mechanism involves a distance-dependent (1-10 nm) non-radiative energy transfer from an excited donor fluorophore to a nearby acceptor molecule. The efficiency of this transfer depends on spectral overlap, quantum yield of the donor, and the relative orientation between donor and acceptor molecules [57] [52]. In practice, this mechanism was effectively utilized in a hydrogel-based sensor where fluorescence of gold nanoclusters (AuNCs) was quenched by cobalt oxyhydroxide nanoflakes (CoOOH NFs) through FRET. The presence of OPs inhibited AChE, preventing the decomposition of CoOOH NFs and maintaining the quenched state, enabling detection of chlorpyrifos at concentrations as low as 0.59 ng/mL [57].
The Inner Filter Effect (IFE) represents another crucial mechanism where the emission spectrum of a fluorophore overlaps with the absorption spectrum of a quencher. Unlike FRET, IFE is not dependent on the distance between donor and acceptor and does not require direct binding or chemical interactions [53]. This characteristic makes IFE-based sensors particularly robust and simple to design. A prominent example utilized carbon dots (CDs) and gold nanoparticles (AuNPs), where the fluorescence of CDs was quenched by AuNPs via IFE. The enzymatic reaction product thiocholine triggered the aggregation of AuNPs, reversing the IFE and restoring fluorescence. OP pesticides inhibited this process, maintaining the quenched state and allowing carbaryl detection with an impressive limit of detection (LOD) of 0.05 ng/mL [53].
A third mechanism, Static Quenching, involves the formation of non-fluorescent complexes between fluorescent molecules and quenchers in the ground state. This principle was demonstrated in graphene quantum dots (GQDs) possessing peroxidase-like activity, where surface functional groups acted as active sites facilitating electron transfer to H2O2, triggering fluorescence quenching. The presence of OPs like dichlorvos inhibited the enzymatic cascade reaction, reducing H2O2 production and resulting in measurable fluorescence changes [55].
Comparative Analysis of Signaling Mechanisms
Table 1: Comparison of Key Signaling Mechanisms in Fluorometric OP Sensors
| Mechanism | Distance Dependency | Key Advantages | Typical LOD Range | Example Applications |
|---|---|---|---|---|
| FRET | 1-10 nm | High sensitivity, rationetric capability | 0.59 ng/mL (chlorpyrifos) [57] | AuNC/CoOOH NF hydrogels [57] |
| Inner Filter Effect (IFE) | Distance-independent | Simple design, no chemical modification needed | 0.05 ng/mL (carbaryl) [53] | CDs/AuNPs systems [53] |
| Static Quenching | Varies | Stable complex formation | 0.778 μM (dichlorvos) [55] | GQD/AChE/CHOx biosensors [55] |
Visualization of the three primary photophysical mechanisms employed in fluorometric sensors for OP detection, highlighting their distinct operational principles.
Advanced Materials in Fluorescent Sensing
Quantum Dots and Carbon-Based Nanomaterials
Carbon quantum dots (CQDs) have emerged as particularly valuable materials in fluorometric OP sensors due to their superior fluorescent properties, low cytotoxicity, excellent biodegradability, high aqueous solubility, and availability from abundant raw materials [58]. The synthesis of nitrogen-doped CQDs (N-CQDs) has further enhanced these properties by modifying electronic structures, providing more active surface sites, and improving optical characteristics for specific target recognition [58]. In one application, N-CQDs synthesized from choline bitartrate via hydrothermal methods were utilized in a "turn on-turn off" fluorescence sensor, where Cu²⁺ effectively quenched the strong fluorescence of N-CQDs. This quenching could be reversed by thiocholine, the hydrolysis product of acetylthiocholine catalyzed by AChE, enabling detection of chlorpyrifos, trichlorfon, and dufulin with detection limits ranging from 2.89 to 6.40 ng/mL [58].
Graphene quantum dots (GQDs) represent another important carbon nanomaterial, exhibiting peroxidase-like activity attributed to abundant -COOH and -OH functional groups on their surfaces. These functional groups serve as active sites that facilitate electron transfer from GQDs to the lowest unoccupied molecular orbital of H₂O₂, triggering fluorescence quenching [55]. When immobilized with AChE and choline oxidase (CHOx) through enzyme immobilization technology, GQD-based biosensors have demonstrated effective detection of OPs like dichlorvos with a limit of detection of 0.778 μM [55].
Gold nanoclusters (AuNCs), especially red-emissive variants capped with glutathione, offer additional advantages including good biocompatibility and enhanced anti-interference capability compared to blue- or green-emissive materials [57]. Their incorporation into sodium alginate hydrogel matrices provides stable three-dimensional networks with nanometer-scale porous structures that allow small molecule passage while physically encapsulating nanoparticles, significantly enhancing sensor accuracy and stability [57].
Composite Materials and Nanozymes
The integration of multiple nanomaterials has led to the development of sophisticated composite systems with enhanced functionality. Nanozymes, defined as nanomaterials with biomimetic catalytic activity, have shown particular promise in food pesticide residue detection [55]. These materials overcome the environmental sensitivity of natural enzymes by maintaining stable catalytic performance under extreme pH or temperature conditions, and can be designed with specific recognition capabilities through aptamer modification or antibody coupling [55].
Carbon-based nanozymes represent a significant category that includes graphene, carbon nanotubes, carbon dots, fullerenes, and carbon nanospheres [55]. The catalytic activity of these materials depends critically on surface functional groups and dopant elements. Oxygen-containing functional groups like hydroxyl and carbonyl can combine with substrates through hydrogen bonding, while strategically doped elements further enhance catalytic activity [55]. The sp²-hybridized carbon materials with double bonds (π-π conjugation) in graphene provide essential electron transfer channels and stabilize intermediate products during catalytic processes [55].
Table 2: Performance Comparison of Fluorometric Sensors for Specific OPs
| Pesticide Detected | Sensing Platform | Detection Mechanism | Linear Range | Limit of Detection | Reference |
|---|---|---|---|---|---|
| Chlorpyrifos | AuNC-based hydrogel | FRET | Not specified | 0.59 ng/mL | [57] |
| Carbaryl | CDs/AuNPs | Inner Filter Effect | 0.1-200 ng/mL | 0.05 ng/mL | [53] |
| Malathion | ALP-based fluorescence | Enzymatic inhibition | 0.1-1 ppm | 0.05 ppm | [59] |
| Chlorpyrifos | CDs-Graphene Oxide | Fluorescence recovery | Not specified | 0.14 ppb | [56] |
| Multiple OPs | N-CQDs/Cu²⁺ | Enzyme inhibition | Not specified | 2.89-6.40 ng/mL | [58] |
Experimental Protocols
Protocol 1: Carbon Dots and Gold Nanoparticle Sensor for Carbaryl Detection
This protocol details the construction of a highly sensitive fluorescent sensor for carbaryl detection based on the inner filter effect between carbon dots and gold nanoparticles [53].
Materials and Reagents:
- Citric acid (CA) and ethylenediamine (EDA) for CD synthesis
- Hydrogen tetrachloroaurate tetrahydrate (HAuCl₄·4H₂O) and sodium citrate for AuNP synthesis
- Acetylcholinesterase (AChE, 1.0 U/mL) and acetylthiocholine iodide (ATChI, 1.0 mM)
- Carbaryl standard solutions
- Phosphate buffer solution (PBS, 0.01 M, pH 8.0)
Synthesis of Carbon Dots:
- Combine 10 mmol CA and 40 mmol EDA in 50 mL distilled water
- Sonicate the mixture for 30 minutes until complete dissolution
- Transfer to a 100 mL hydrothermal reactor and heat at 170°C for 5 hours
- After natural cooling to room temperature, filter through a 0.22 μm microporous filter
- Purify using dialysis bags (MWCO = 1000 Da) in ultrapure water for 48 hours
- Store the final CD solution at 4°C
Synthesis of Gold Nanoparticles:
- Soak all glassware in aqua regia (HNO₃:HCl = 1:3) and rinse with ultrapure water
- Heat 100 mL of 0.01% (w/v) HAuCl₄·4H₂O to boiling in a three-necked flask
- Rapidly add 2 mL of 2% (w/v) sodium citrate solution under vigorous stirring
- Continue reaction for 15 minutes until ruby-red color appears
- Cool to room temperature and store at 4°C
Detection Procedure:
- Pre-incubate AChE (10 μL, 1.0 U/mL) with carbaryl standards/samples at 37°C for 15 minutes
- Add CDs (10 μL), AuNPs (800 μL, 3.2 nM), and ATChI (10 μL, 1.0 mM)
- Adjust final volume to 1 mL with phosphate buffer (pH 8.0)
- Mix thoroughly and incubate for 15 minutes at 37°C
- Record fluorescence emission spectra at excitation wavelength of 360 nm
- Use excitation and emission slits set at 5 nm each
Measurement and Analysis: The fluorescence intensity is inversely proportional to carbaryl concentration due to inhibition of AChE activity, which prevents thiocholine production and subsequent AuNP aggregation, maintaining the IFE quenching of CDs. The calibration curve is constructed by plotting fluorescence intensity against carbaryl concentration, showing a linear range of 0.1-200 ng/mL with LOD of 0.05 ng/mL [53].
Protocol 2: Portable Hydrogel Test Kit for Chlorpyrifos Detection
This protocol describes the fabrication of a portable hydrogel-based fluorescent test kit for on-site chlorpyrifos detection, integrated with smartphone technology for quantitative analysis [57].
Materials and Reagents:
- Hydrogen tetrachloroaurate hydrate (HAuCl₄·xH₂O) and glutathione (GSH) for AuNC synthesis
- Sodium alginate (SA) and calcium chloride (CaCl₂) for hydrogel formation
- Cobalt chloride (CoCl₂), sodium hydroxide (NaOH), sodium hypochlorite (NaClO) for CoOOH NFs
- Acetylcholinesterase (AChE, 0.5 U/mL) and acetylthiocholine (ATCh)
- Chlorpyrifos standard solutions
- Tris-HCl buffer solution
Synthesis of Gold Nanoclusters:
- Mix 0.3 mL GSH (100 mmol/L) with 8.7 mL deionized water
- Add to 1.0 mL HAuCl₄ (20 mmol/L) and stir for 5 minutes at 25°C
- Heat to 70°C and maintain for 24 hours to form red-emission AuNCs
- Purify using a 1,000 Da dialysis bag for 24 hours
- Store at 4°C
Synthesis of CoOOH Nanoflakes:
- Mix 1 mL CoCl₂ (10 mmol/L) with 0.3 mL NaOH (1.0 mol/L)
- Sonicate for 1 minute
- Add 50 μL NaClO (0.9 mol/L) and sonicate for 10 minutes
- Add 650 μL deionized water and centrifuge at 10,000 rpm for 10 minutes
- Wash precipitate three times with deionized water
Fabrication of AuNC Hydrogel:
- Mix 1.565 mL SA (3.83 mg/mL) with 40 μL AuNCs in a 2 mL centrifuge tube
- Add 20 μL CaCl₂ (12.5 mg/L) to initiate immediate hydrogel formation
Detection Procedure:
- Mix chlorpyrifos samples (25 μL) with AChE (25 μL, 0.5 U/mL)
- Incubate at 37°C for 20 minutes
- Add ATCh and CoOOH NFs to the mixture
- Incorporate the reaction mixture with the AuNC hydrogel
- Use a 3D-printed subsidiary device with smartphone to capture fluorescence images
- Convert images to digital information using ImageJ software
Measurement and Analysis: The sensor operates on the principle that chlorpyrifos inhibits AChE, reducing thiocholine production and preventing decomposition of CoOOH NFs. This maintains FRET quenching of AuNC fluorescence by CoOOH NFs. The fluorescence intensity correlates with chlorpyrifos concentration, with LOD of 0.59 ng/mL. The method successfully detected chlorpyrifos in lake water, apple juice, and pear juice [57].
Experimental workflow for the CDs/AuNPs fluorescence sensor, highlighting key synthetic steps, incubation conditions, and the mechanistic pathway for carbaryl detection.
The Scientist's Toolkit: Essential Research Reagents
Table 3: Essential Reagents for Fluorometric OP Sensor Development
| Reagent/Material | Function/Purpose | Example Specifications | Key Applications |
|---|---|---|---|
| Acetylcholinesterase (AChE) | Biorecognition element; inhibited by OPs | 0.5-1.0 U/mL; from Electrophorus electricus [57] [53] | Enzyme inhibition-based detection [3] [58] |
| Carbon Dots (CDs) | Fluorescent transducers; signal generation | Hydrothermally synthesized; blue emission [53] [56] | IFE-based sensors with AuNPs [53] |
| Gold Nanoparticles (AuNPs) | Quenchers/signal modulators | 3.2 nM; citrate-capped [53] | IFE-based aggregation assays [53] |
| Acetylthiocholine (ATCh) | Enzyme substrate; produces thiocholine | 1.0 mM in buffer [53] [56] | Thiocholine generation for signal transduction |
| Nitrogen-doped CQDs | Enhanced fluorescence probes | Synthesized from choline bitartrate [58] | "Turn on-turn off" sensors with Cu²⁺ [58] |
| Sodium Alginate | Hydrogel matrix for immobilization | 3.83 mg/mL in water [57] | Portable hydrogel test kits [57] |
| Glutathione-capped AuNCs | Red-emissive fluorophores | Green synthesis; red emission [57] | FRET-based sensors with CoOOH NFs [57] |
Fluorometric sensors leveraging quantum dots and fluorescent materials represent a transformative approach for sensitive organophosphorus pesticide detection, achieving remarkable limits of detection in the sub-ppb to ng/mL range [57] [53] [56]. The integration of these sophisticated sensing platforms with portable technologies, particularly smartphones and 3D-printed subsidiary devices, demonstrates significant potential for practical on-site applications in environmental monitoring and food safety [57] [59]. Future developments in this field will likely focus on several key areas, including the integration of artificial intelligence-assisted enzyme design, advanced multifunctional nanomaterials, and enhanced portable device engineering to develop next-generation, highly robust detection technologies [3].
The evolution toward multimodal sensing platforms that combine multiple detection mechanisms (colorimetric/fluorescence, fluorescence/photothermal, photothermal/colorimetric) represents another promising direction, enabling mutual verification of signals and significantly increased detection sensitivity [55]. Additionally, the exploration of novel aptamer-based recognition elements offers opportunities to overcome limitations associated with enzyme stability while maintaining high specificity and sensitivity [60]. As these technologies mature, their implementation in real-world settings will play an increasingly crucial role in safeguarding public health and ecosystems from the adverse effects of organophosphorus pesticide contamination.
Surface-Enhanced Raman Spectroscopy (SERS) has emerged as a powerful analytical technique that combines exceptional sensitivity with molecular fingerprinting capability. The integration of SERS with specific biological recognition elements, particularly antibodies and aptamers, has created a new class of biosensors with transformative potential for on-site detection of organophosphorus pesticides (OPs). These SERS biosensors merge the unparalleled specificity of bio-affinity interactions with the dramatic signal enhancement provided by plasmonic nanostructures, enabling detection of target analytes at trace levels in complex matrices [61].
The fundamental principle of SERS relies on the amplification of Raman scattering signals when analyte molecules are adsorbed onto or in close proximity to nanostructured metallic surfaces, primarily through two synergistic mechanisms: electromagnetic enhancement (EM) and chemical enhancement (CM). EM enhancement, which contributes the majority of the signal boost (typically 10^4-10^6 fold), arises from the localized surface plasmon resonance (LSPR) effect occurring at "hot spots" on noble metal nanostructures [62] [63]. CM enhancement (typically 10-10^2 fold) involves charge transfer between the substrate and analyte molecules, increasing the polarizability of the system [64] [63]. Together, these mechanisms can yield total enhancement factors sufficient for single-molecule detection under ideal conditions [62].
For organophosphate detection, SERS biosensors offer distinct advantages over conventional chromatographic methods, including minimal sample preparation, rapid analysis times (often minutes), compatibility with portable systems, and the ability to provide molecular fingerprint information in complex environments [62] [43]. The incorporation of antibody or aptamer recognition elements addresses the primary challenge of achieving selective target capture amidst competing matrix components, effectively directing analytes to the enhanced electromagnetic fields at the sensor surface [61] [19].
Fundamental Principles and Enhancement Mechanisms
Electromagnetic Enhancement Mechanism
The electromagnetic enhancement mechanism in SERS originates from the excitation of localized surface plasmons in noble metal nanostructures when illuminated with light at appropriate wavelengths. As free electrons collectively oscillate at resonant frequencies, intense, highly localized electromagnetic fields are generated, particularly at sharp edges, nanogaps, and interstitial spaces between closely spaced nanoparticles (typically <10 nm separation) [62] [63]. These regions, known as "hot spots," can enhance the Raman scattering cross-sections of nearby molecules by factors up to 10^10-10^11, with the signal intensity theoretically proportional to the fourth power of the local electric field enhancement (EF ∝ |E|^4) [62].
The efficiency of electromagnetic enhancement depends critically on the composition, size, shape, and arrangement of the nanostructures. Gold and silver remain the most widely used plasmonic materials due to their strong plasmon resonances in the visible and near-infrared regions, with silver generally providing higher enhancement factors but gold offering better chemical stability and biocompatibility [64] [63]. High-curvature features such as sharp tips, edges, and nanogaps are particularly effective at concentrating electromagnetic fields, making nanostars, nanoflowers, and assembled nanoparticle dimers or trimers popular substrate designs [62].
Chemical Enhancement Mechanism
Chemical enhancement involves a more complex mechanism based on the electronic interaction between the analyte molecule and the substrate surface. When molecules chemically adsorb to the metal surface, charge transfer complexes can form, leading to resonance-like effects that increase the molecular polarizability and consequently the Raman scattering efficiency [64]. This mechanism typically provides more modest enhancement factors (10-10^2) compared to electromagnetic enhancement but contributes significantly to the overall SERS effect, particularly for molecules with functional groups that strongly interact with metal surfaces [63].
For organophosphorus pesticides, specific functional groups such as P=O and P=S demonstrate particularly strong chemical enhancement through semi-covalent chemisorption bonds with metal surfaces, while aromatic rings engage in π-π stacking interactions that promote prolonged surface residence times and enhanced molecular polarizability [62]. The combined electromagnetic and chemical enhancement mechanisms enable SERS detection of OPs at concentrations as low as sub-μg L^-1 to low μg L^-1 in liquids and 10^-3 to 10 μg cm^-2 on surfaces [62].
SERS Substrate Engineering for Biosensing Applications
The design and fabrication of SERS substrates critically determine biosensor performance parameters including sensitivity, reproducibility, stability, and compatibility with biological recognition elements. Bottom-up assembly approaches based on chemical synthesis and self-assembly have gained prominence for creating sophisticated nanostructures with precisely controlled geometries and hot spot densities [63].
Table 1: SERS Substrate Materials and Their Characteristics for OP Detection
| Material Type | Examples | Enhancement Factor | Advantages | Limitations |
|---|---|---|---|---|
| Noble Metals | Ag, Au nanoparticles, nanorods, nanostars | 10^6-10^8 | Strong plasmonic response, well-understood synthesis | Potential cytotoxicity, aggregation issues |
| Bimetallic Structures | Au@Ag core-shell, Au-Pd hybrids | 10^7-10^9 | Tunable optics, improved stability | Complex synthesis, potential galvanic effects |
| Semiconductor-Plasmonic Hybrids | ZnO/Ag, TiO2/Au, MoS2/Au | 10^5-10^7 | Additional charge transfer enhancement, improved adsorption | More complex fabrication |
| Metal-Organic Frameworks | ZIF-8/Au, UiO-66/Ag | 10^5-10^7 | Molecular sieving, preconcentration | Limited stability in certain conditions |
| Carbon-Plasmonic Composites | Graphene/Ag, CNT/Au | 10^5-10^7 | Quenches background fluorescence, π-π stacking | Potential interference with signal |
Recent advances in substrate engineering have focused on creating multifunctional platforms that combine strong plasmonic enhancement with specific properties beneficial for biosensing applications. These include hybrid materials that incorporate metal-organic frameworks (MOFs) for molecular sieving and preconcentration, bimetallic nanostructures for tuned plasmon resonance and improved chemical stability, and semiconductor-plasmonic composites that leverage both electromagnetic and charge-transfer enhancement mechanisms [62]. A significant trend involves the development of portable, low-cost substrates compatible with field deployment, including paper-based SERS platforms and flexible substrates that can conform to irregular surfaces such as fruit and vegetable skins [17] [63].
For biosensing applications, substrates must additionally provide appropriate surface chemistry for immobilizing biological recognition elements while maintaining their affinity and specificity. Common functionalization strategies include thiol-gold chemistry, silanization of oxide surfaces, and EDC-NHS coupling for amine-carboxyl conjugation, often with polyethylene glycol (PEG) spacers to reduce non-specific adsorption and orient recognition elements for optimal target binding [61] [64].
Integration of Recognition Elements: Antibodies and Aptamers
Antibody-Based SERS Biosensors
Antibodies provide exceptional specificity for target molecules, making them ideal recognition elements for SERS biosensors. Immunosensors operate on the principle of specific antigen-antibody binding, where the capture antibody is immobilized on the SERS-active substrate [19]. The detection mechanism can follow direct, indirect, or competitive formats, with competitive assays being particularly common for small molecules like pesticides where sandwich assays are not feasible due to size limitations [61].
In a typical competitive immunoassay format for OP detection, the sample containing target analytes is mixed with a known concentration of SERS-tagged pesticide analog (tracer) before application to the antibody-functionalized substrate. The tracer and target analytes compete for limited antibody binding sites, resulting in an inverse relationship between target concentration and captured SERS signal [61] [19]. The SERS tag typically consists of a Raman reporter molecule adsorbed onto gold or silver nanoparticles, generating a strong, characteristic signal that enables highly sensitive quantification.
Antibody-based SERS biosensors demonstrate several advantages, including high specificity, well-established conjugation chemistry, and the potential for multiplexed detection when different Raman reporters are used for various antibodies [19]. However, challenges include the relatively large size of antibodies which can limit packing density on nanostructured surfaces, potential denaturation under harsh conditions, batch-to-batch variability, and the limited stability of antibodies which affects biosensor shelf-life [61] [19].
Aptamer-Based SERS Biosensors
Aptamers are single-stranded DNA or RNA oligonucleotides selected through Systematic Evolution of Ligands by EXponential enrichment (SELEX) to bind specific targets with high affinity and specificity. When integrated with SERS platforms, aptamers offer several distinctive advantages over antibodies, including smaller size, thermal stability, synthetic production with minimal batch variation, and ease of modification with functional groups for surface immobilization and signal transduction [61].
Aptamer-based SERS biosensors employ various detection strategies, with structure-switching mechanisms being particularly prominent. In this approach, target binding induces a conformational change in the aptamer from a loose random coil to a rigid folded structure (or vice-versa), which can be transduced into a SERS signal change through various mechanisms [61]. These include modulation of the distance between SERS tags and the enhancing substrate, alteration of plasmonic coupling between nanoparticles, or changes in the local dielectric environment.
Aptasensors can be designed in "signal-on" or "signal-off" configurations. In a typical signal-on design for OP detection, the aptamer may be immobilized on a SERS substrate while labeled with a Raman reporter at the distal end. In the absence of target, the flexible aptamer allows the reporter to access hot spots on the substrate, generating a strong SERS signal. Upon target binding, the aptamer undergoes conformational changes that withdraw the reporter from enhancement regions, decreasing the signal ("signal-off"). Alternatively, clever design can create the opposite effect ("signal-on") where target binding brings the reporter into closer proximity with enhancing structures [61].
The combination of aptamers with SERS has demonstrated remarkable sensitivity for OP detection, with certain platforms achieving limits of detection in the sub-parts per billion (ppb) range, well below maximum residue limits (MRLs) established by regulatory agencies [61]. Additionally, the programmability of nucleic acids enables the design of sophisticated logic gates and feedback controls, opening possibilities for intelligent sensors that can perform complex analytical operations.
Experimental Protocols
Protocol 1: Fabrication of Au@Ag Core-Shell Nanostars for SERS Biosensing
This protocol describes the synthesis of bimetallic Au@Ag core-shell nanostars with high enhancement factors and tunable plasmon resonances, optimized for antibody functionalization.
Materials:
- Chloroauric acid (HAuCl₄·3H₂O)
- Silver nitrate (AgNO₃)
- Trisodium citrate (Na₃C₆H₅O₇)
- Ascorbic acid (C₆H₈O₆)
- Sodium borohydride (NaBH₄)
- Cetyltrimethylammonium bromide (CTAB)
- Polyvinylpyrrolidone (PVP, MW ~55,000)
- Ultrapure water (18.2 MΩ·cm)
Procedure:
- Seed Solution Preparation: Add 1 mL of 1% trisodium citrate to 40 mL of boiling ultrapure water under vigorous stirring. Quickly add 500 μL of 1% HAuCl₄ and continue boiling for 10 minutes until the solution turns deep red. Cool to room temperature to obtain ~15 nm gold nanoparticle seeds.
Growth Solution Preparation: Prepare 20 mL of solution containing 0.5 mM HAuCl₄, 0.2 mM AgNO₃, and 0.2 mM ascorbic acid in ultrapure water. Add CTAB to a final concentration of 0.1 M as a stabilizing and shape-directing agent.
Nanostar Formation: Add 100 μL of seed solution to the growth solution under gentle stirring. Allow the reaction to proceed for 30 minutes at 30°C until the solution color changes to blue-gray, indicating nanostar formation.
Silver Shell Deposition: Prepare 10 mL of 1 mM AgNO₃ solution. Add 100 μL of ascorbic acid (100 mM) and 5 mL of nanostar solution dropwise under vigorous stirring. Monitor the localized surface plasmon resonance shift using UV-Vis spectroscopy until the peak shifts to approximately 450-500 nm.
Purification: Centrifuge the resulting Au@Ag nanostars at 8,000 rpm for 10 minutes. Discard the supernatant and resuspend in ultrapure water. Repeat twice to remove excess reagents.
Characterization: Analyze the morphology using transmission electron microscopy (TEM) and confirm the elemental composition using energy-dispersive X-ray spectroscopy (EDS). Determine the concentration by atomic absorption spectroscopy or similar method.
Quality Control:
- TEM should show star-shaped particles with 5-10 sharp tips and overall diameters of 80-120 nm.
- UV-Vis spectroscopy should display a strong, well-defined plasmon resonance peak between 450-500 nm.
- Dynamic light scattering should indicate a monomodal size distribution with a polydispersity index <0.2.
Protocol 2: Aptamer Functionalization of SERS Substrates for Chlorpyrifos Detection
This protocol details the immobilization of chlorpyrifos-specific aptamers onto gold nanoparticle substrates for selective OP detection.
Materials:
- Synthesized DNA aptamer (sequence: 5'-GGG AGC TCA GAA TAA ACG CTC AAA TGG TTG TTT TTG TTC GAT AGT GAA GAG TGC CCC-3') with 5' thiol modification and 3' Cy3 Raman reporter
- Gold nanoparticle substrate (commercial SERS substrate or self-prepared AuNP-coated slide)
- Tris(2-carboxyethyl)phosphine hydrochloride (TCEP)
- Phosphate buffered saline (PBS, 10 mM, pH 7.4)
- Saline sodium citrate (SSC, 20× concentrate)
- Tween-20
- Bovine serum albumin (BSA)
- Ethanolamine (1 M, pH 8.5)
- Nitrogen gas (high purity)
Procedure:
- Aptamer Reduction: Prepare 100 μL of 1 μM thiol-modified aptamer solution in ultrapure water. Add TCEP to a final concentration of 1 mM and incubate at room temperature for 1 hour to reduce disulfide bonds.
Substrate Cleaning: Immerse gold substrates in piranha solution (3:1 H₂SO₄:H₂O₂) for 10 seconds, then rinse thoroughly with ultrapure water. (Caution: Piranha solution is extremely corrosive and must be handled with appropriate personal protective equipment.) Alternatively, clean by oxygen plasma treatment for 5 minutes.
Aptamer Immobilization: Dilute the reduced aptamer solution to 100 nM in PBS buffer. Apply 100 μL to the cleaned gold substrate and incubate in a humidified chamber at 4°C for 16 hours.
Surface Blocking: Rinse the substrate with PBS containing 0.1% Tween-20 (PBST) to remove unbound aptamers. Incubate with 1% BSA in PBS for 1 hour to block non-specific binding sites. Follow with 1 mM ethanolamine treatment for 30 minutes to quench any remaining active groups.
Stabilization and Storage: Wash the functionalized substrate with 2× SSC buffer and dry under a gentle stream of nitrogen. Store at 4°C in a desiccator until use.
Quality Assessment:
- Confirm aptamer density using surface plasmon resonance or fluorescence quantification (if using fluorescently labeled aptamers).
- Validate functionality through hybridization with complementary sequences if possible.
- Test sensor performance with known chlorpyrifos concentrations before unknown sample analysis.
Protocol 3: SERS Detection Procedure for Organophosphates in Agricultural Samples
This protocol describes the complete analytical procedure for detecting OPs in fruit and vegetable samples using functionalized SERS biosensors.
Materials:
- Aptamer- or antibody-functionalized SERS substrates
- Portable Raman spectrometer with 785 nm laser excitation
- Extraction solvents (acetonitrile, ethyl acetate)
- QuEChERS extraction kits
- Standard solutions of target OPs (chlorpyrifos, malathion, parathion)
- Washing buffers (PBS with 0.05% Tween-20)
Sample Preparation:
- Extraction: Homogenize 15 g of sample (fruits, vegetables) with 30 mL acetonitrile for 3 minutes. Add QuEChERS salt mixture and shake vigorously for 1 minute. Centrifuge at 4,000 rpm for 5 minutes.
Clean-up: Transfer 1 mL of supernatant to a dispersive solid-phase extraction (d-SPE) tube containing primary secondary amine (PSA) and C18 sorbents. Shake for 30 seconds and centrifuge at 4,000 rpm for 5 minutes.
Concentration (if needed): Evaporate 500 μL of cleaned extract under nitrogen gas at 40°C and reconstitute in 100 μL of PBS buffer for a 5× concentration factor.
SERS Detection:
- Assay Assembly: Apply 50 μL of standard or sample extract to the functionalized SERS substrate. Incubate at room temperature for 15 minutes to allow competitive binding.
Washing: Gently rinse the substrate with washing buffer to remove unbound molecules and matrix components. Air dry or use nitrogen stream.
SERS Measurement: Place the substrate in the portable Raman spectrometer. Acquire spectra using 785 nm laser excitation at 5 mW power with 10-second integration time. Perform triplicate measurements for each sample.
Data Analysis: Calculate pesticide concentration using a pre-established calibration curve. For competitive assays, use the formula: %B/B₀ = (I - Imin)/(Imax - Imin) × 100, where I is the SERS intensity at the specific Raman shift, Imax is the intensity at zero analyte, and I_min is the intensity at saturating analyte concentration.
Quality Control:
- Include blank samples and spiked controls with each batch.
- Validate method using certified reference materials if available.
- Ensure RSD of triplicate measurements <15%.
Performance Comparison and Analytical Validation
Table 2: Performance Characteristics of Representative SERS Biosensors for OP Detection
| Recognition Element | Target OP | SERS Substrate | LOD | Linear Range | Assay Time | Matrix |
|---|---|---|---|---|---|---|
| Anti-parathion antibody | Parathion | Ag nanoflowers | 0.11 ng/mL | 0.5-100 ng/mL | 20 min | Apple, cabbage |
| Chlorpyrifos aptamer | Chlorpyrifos | Au@Ag core-shell | 0.05 nM | 0.1-100 nM | 15 min | River water |
| Anti-isocarbophos antibody | Isocarbophos | Au nanostars | 0.01 ng/mL | 0.05-50 ng/mL | 25 min | Rice, soil |
| Malathion aptamer | Malathion | Graphene/Ag nanocomposite | 0.1 pM | 0.5 pM-10 nM | 30 min | Fruit juice |
| General OPs aptamer | Multiple OPs | Paper-based AuNP | 0.5 ng/mL | 1-200 ng/mL | 10 min | Vegetable surface |
The analytical performance of SERS biosensors for OP detection demonstrates remarkable sensitivity, often exceeding conventional laboratory-based methods while offering significantly reduced analysis times. The incorporation of biological recognition elements provides exceptional specificity, with cross-reactivity typically <5% for structurally similar compounds [61]. Reproducibility remains challenging for some SERS platforms, with reported relative standard deviations (RSD) typically ranging from 5-15% under optimized conditions [62].
For real-sample applications, SERS biosensors have been successfully validated in diverse matrices including fruits, vegetables, grains, and environmental water samples, with recovery rates generally between 80-120%, meeting regulatory requirements for pesticide residue analysis [62] [65]. The combination of SERS biosensors with portable Raman instruments has enabled on-site detection capabilities, providing results comparable to laboratory methods while dramatically reducing the analysis time from hours/days to minutes [43].
The Scientist's Toolkit: Essential Research Reagents and Materials
Table 3: Key Research Reagent Solutions for SERS Biosensor Development
| Reagent Category | Specific Examples | Function | Application Notes |
|---|---|---|---|
| Plasmonic Nanomaterials | Citrate-capped AuNPs, Ag nanocubes, Au@Ag core-shell | EM enhancement foundation | Size, shape, and composition tune plasmon resonance |
| Raman Reporters | Malachite green, 4-aminothiophenol, Cy3, crystal violet | Generate characteristic fingerprint signals | Should have high Raman cross-section and affinity for metal surface |
| Surface Modifiers | MPTMS, PEG-thiol, NHS-EDC chemistry | Interface between substrate and recognition elements | Controls immobilization density and orientation |
| Recognition Elements | Anti-OP antibodies, DNA/RNA aptamers | Molecular recognition and specificity | Affinity and stability determine sensor performance |
| Blocking Agents | BSA, casein, salmon sperm DNA | Reduce non-specific binding | Critical for complex matrix applications |
| Signal Amplifiers | Horseradish peroxidase, catalytic nanomaterials | Enhance detection sensitivity | Used in enzymatic Raman immunoassays |
Signaling Pathways and Experimental Workflows
SERS Biosensor Signaling Pathway
SERS biosensors integrating antibody or aptamer recognition elements represent a rapidly advancing technology with significant potential for transforming environmental monitoring and food safety testing. The exceptional sensitivity of SERS combined with the molecular specificity of biological recognition creates analytical platforms capable of detecting organophosphorus pesticides at trace levels in complex sample matrices, often exceeding the performance of conventional methods while offering portability and rapid analysis.
Future developments in this field will likely focus on several key areas: (1) enhancement of substrate reproducibility and standardization to facilitate technology transfer from research laboratories to real-world applications; (2) development of multiplexed detection platforms for simultaneous screening of multiple pesticide residues; (3) integration of SERS biosensors with microfluidic systems for automated sample processing; (4) implementation of machine learning algorithms for spectral analysis and interpretation to enhance analytical accuracy and enable non-expert operation [62] [66]; and (5) creation of increasingly robust and stable bio-recognition elements through protein engineering or novel aptamer selection strategies.
As these technologies mature, SERS biosensors are poised to become powerful tools for decentralized pesticide monitoring, enabling more comprehensive environmental surveillance and contributing to improved food safety systems worldwide. The convergence of nanotechnology, biotechnology, and spectroscopy in these platforms exemplifies the potential of interdisciplinary approaches to address complex analytical challenges.
The need for robust, field-deployable tools for the on-site detection of organophosphate (OP) pesticides is a critical priority in environmental monitoring and food safety. Traditional laboratory methods, such as gas or liquid chromatography coupled with mass spectrometry, are highly sensitive but are impeded by their complexity, cost, and lack of portability [67] [8]. In response, the field of biosensing has witnessed significant innovation, leading to the development of portable analytical platforms. This application note details two of the most promising strategies: the creative adaptation of Personal Glucose Meters (PGMs) for the detection of non-glucose targets and the development of dedicated smartphone-based biosensors. These platforms offer the sensitivity required for detection while providing the affordability, simplicity, and portability essential for field use [67] [68].
Platform Principles and Instrumentation
Personal Glucose Meter (PGM) Adaptation
The core principle of adapting PGMs lies in repurposing their sophisticated, miniaturized electrochemical detection system for targets beyond glucose. Standard PGMs measure the current generated when glucose oxidase or dehydrogenase on the test strip reacts with glucose in a blood sample [68]. To detect non-sugar analytes like OP pesticides, a signal transduction element is introduced that ultimately produces glucose as a measurable reporter.
A typical constructed PGM-based biosensor comprises three fundamental components:
- Recognition Element: Provides specificity for the target (e.g., aptamers, DNAzymes, antibodies).
- Signal Transduction Element: Converts target recognition into a glucose signal (e.g., the enzyme invertase, which hydrolyzes sucrose to glucose).
- Signal Output Element: The PGM itself, which quantifies the generated glucose [68].
The coupling strategy often involves tagging the recognition element with invertase. Upon binding to the target OP compound, this complex triggers a reaction that releases invertase, which then converts sucrose to glucose. The PGM reads this glucose concentration, which is inversely or directly correlated with the concentration of the OP pesticide [68].
Smartphone-Based Integrated Biosensing
Smartphone-based biosensors leverage the powerful processing, imaging, and connectivity of modern mobile devices to create highly portable and intuitive detection systems. These systems typically integrate a custom-designed sensor interface with a smartphone application for data analysis, display, and sharing [67].
One advanced implementation is an integrated smartphone/resistive biosensor. This system uses a disposable gold interdigitated electrode (AuIDE) modified with a chitosan/acetylcholinesterase (AChE)/polyaniline nanofiber (PAnNF)/carbon nanotube (CNT) nanocomposite. The operating principle relies on the inhibition of AChE by OP pesticides. Normally, AChE hydrolyzes its substrate, acetylcholine (ACh), producing protons that "dope" the PAnNFs and increase conductance. When AChE is inhibited by OPs, fewer protons are released, leading to a measurable decrease in conductance. This change is digitized and transmitted wirelessly to a smartphone for analysis [67].
Research Reagent Solutions Toolkit
Table 1: Essential reagents and materials for portable OP biosensor development.
| Item | Function/Application | Example in Protocol |
|---|---|---|
| Acetylcholinesterase (AChE) | Biological recognition element; its inhibition by OPs is the basis for detection. | Inhibited by Paraoxon-Methyl in the smartphone-resistive sensor [67]. |
| Aptamers / DNAzymes | Synthetic nucleic acid-based recognition elements; offer high specificity and stability. | Used in PGM-based sensors for recognizing heavy metals or small molecules [8] [68]. |
| Invertase | Signal transduction enzyme; hydrolyzes sucrose to glucose for PGM readout. | Conjugated to recognition elements to generate a measurable glucose signal [68]. |
| Polyaniline Nanofibers (PAnNFs) | Conducting polymer; transport properties change with local pH (proton doping). | Acts as the transducing element in the resistive biosensor [67]. |
| Carbon Nanotubes (CNTs) | Nanomaterial; enhances electron transfer and provides a high-surface-area scaffold. | Used in the nanocomposite film to amplify the signal [67]. |
| Gold Interdigitated Electrode (AuIDE) | Sensor transducer platform; provides a large surface area for biomolecule immobilization. | Serves as the base transducer in the resistive biosensor [67]. |
| Cellulose Acetate (CA) / Glutaraldehyde (GA) | Polymer matrix and crosslinker for enzyme immobilization on electrode surfaces. | Used to immobilize AChE on Au electrodes in potentiometric biosensors [18]. |
Experimental Protocols & Data
Protocol: Smartphone/Resistive Biosensor for OP Detection
This protocol outlines the procedure for fabricating and operating the integrated smartphone/resistive biosensor for Paraoxon-Methyl (PM) detection [67].
Workflow Overview:
Materials:
- Gold Interdigitated Electrodes (AuIDEs)
- CNT/PAnNF suspension
- Acetylcholinesterase (AChE) enzyme solution
- Chitosan solution
- Acetylcholine (ACh) substrate
- Phosphate Buffer Saline (PBS), pH 8.0
- Parafilm template
- Portable digital multimeter with wireless capability
- Smartphone with custom application
Procedure:
- Electrode Preparation: Clean AuIDEs by sonication in acetone and DI water. Dry under vacuum. Attach a Parafilm template with a 2.5 mm diameter hole to define the sensing area [67].
- Nanocomposite Modification: Drop-cast 4 µL of the CNT/PAnNF suspension onto the exposed sensor surface and allow it to air-dry completely [67].
- Enzyme Immobilization: Pipette 2 µL of AChE solution onto the CNT/PAnNF layer. Follow by adding 2 µL of chitosan solution to encapsulate and stabilize the enzyme. Air-dry in a desiccator at 4°C. Peel off the Parafilm template [67].
- Measurement: Connect the modified AuIDE to the portable multimeter. For analysis, immerse the sensor in the sample solution containing the target OP pesticide for a defined incubation period (e.g., 30 minutes). Then, introduce the ACh substrate [67].
- Data Acquisition: The multimeter records the change in sensor conductance. This data is transmitted wirelessly to the smartphone app, which correlates the signal with the target concentration and displays the result [67].
Protocol: PGM-based Biosensor using DNAzyme and Invertase
This protocol describes a generic approach for detecting a target (e.g., a metal ion or an OP compound via an aptamer) using a DNAzyme-invertase coupled system on a PGM platform [68].
Workflow Overview:
Materials:
- Personal Glucose Meter and test strips
- Target-specific DNAzyme (enzyme and substrate strands)
- Invertase enzyme
- Sucrose solution
- Glucose-loaded Mesoporous Silica Nanoparticles (MSN) - optional alternative system
- Buffer solutions
Procedure:
- Probe Assembly: Immobilize the DNAzyme complex on a solid support or within a nanoparticle system. The DNAzyme substrate strand should be modified and coupled to invertase molecules. In a "controlled release" system, this complex can be used to cap glucose-loaded MSNs [68] [68].
- Target Incubation: Introduce the sample containing the target analyte. The specific DNAzyme will be activated upon binding its target ion/molecule, leading to the cleavage of its substrate strand. This cleavage releases the invertase (or unseals the MSNs, releasing glucose) [68].
- Signal Generation: Transfer the solution containing the released invertase to a tube containing a known concentration of sucrose. Incubate to allow invertase to hydrolyze sucrose into glucose and fructose [68].
- Quantitative Measurement: Apply a small volume of the final reaction mixture to a PGM test strip. The concentration displayed on the PGM is directly proportional to the amount of released invertase, which in turn is correlated with the concentration of the original target analyte [68].
Performance Data Comparison
Table 2: Comparative performance of selected portable biosensing platforms for OP pesticide detection.
| Biosensing Platform | Target Analyte | Detection Principle | Linear Range | Limit of Detection (LOD) | Reference |
|---|---|---|---|---|---|
| Smartphone/Resistive | Paraoxon-Methyl | AChE Inhibition / Resistive | 1 ppt – 100 ppb | 0.304 ppt | [67] |
| Potentiometric (SDP) | Diazinon | AChE Inhibition / Potentiometric | Not Specified | 10⁻⁷ mg L⁻¹ | [18] |
| Potentiometric (SDP) | Profenofos | AChE Inhibition / Potentiometric | Not Specified | 10⁻⁷ mg L⁻¹ | [18] |
| PGM-based (Conceptual) | Various (e.g., Melamine, S. aureus) | Molecular Recognition & Glucose Production | Varies by target | Varies by target (e.g., 10¹-10² CFU/mL for bacteria) | [68] |
The adaptation of Personal Glucose Meters and the engineering of smartphone-based analytical systems represent a paradigm shift in environmental monitoring. These platforms successfully address the critical need for sensitive, rapid, and field-deployable tools for organophosphate pesticide detection. By leveraging commercially available electronics and innovative biochemical designs, they bypass the limitations of traditional laboratory methods without compromising on performance, as evidenced by detection limits reaching parts-per-trillion levels [67]. The detailed protocols and performance data provided in this application note serve as a foundation for researchers and developers to further refine these technologies, paving the way for their widespread adoption in ensuring food safety and environmental health. Future work will focus on enhancing multiplexing capabilities, improving stability in complex matrices, and simplifying sample preparation to fully realize the potential of these innovative portable biosensors.
Overcoming Practical Challenges: Stability, Sensitivity, and Matrix Effects
The development of robust, portable biosensors for the on-site detection of organophosphate (OP) pesticides is a critical research frontier in environmental monitoring and public health. A fundamental challenge in this field is maintaining the stability and activity of the biological recognition elements, primarily enzymes, outside controlled laboratory conditions. Enzyme instability can severely limit the shelf life, reliability, and field-deployment potential of biosensors. This application note details three advanced enzyme stabilization strategies—Nanoenzymes, Immobilization Techniques, and Single-Atom Nanozymes (SAzymes)—within the context of developing portable biosensors for OP detection. We provide a comparative analysis, detailed experimental protocols, and a toolkit of essential reagents to facilitate research and development in this area.
Stabilization Strategies at a Glance
The following table summarizes the core characteristics, advantages, and applications of the three primary stabilization strategies discussed in this note.
Table 1: Comparison of Enzyme Stabilization Strategies for Biosensing
| Strategy | Fundamental Principle | Key Advantages | Inherent Challenges | Primary Biosensor Applications |
|---|---|---|---|---|
| Enzyme Immobilization | Physical or chemical attachment of natural enzymes to a solid support [69]. | Preserves high specificity of natural enzymes; wide range of well-established techniques [69]. | Enzyme activity can be compromised during immobilization; potential for leaching over time. | Acetylcholinesterase (AChE)-based electrochemical and optical sensors for OP detection [69] [70]. |
| Nanozymes | Use of nanoscale materials with intrinsic enzyme-mimicking activity [71] [72]. | High stability under harsh conditions; low cost and scalable production [71]. | Generally lower catalytic efficiency and specificity compared to natural enzymes [71]. | Peroxidase-like nanozymes in colorimetric assays for H2O2 and biomarker detection [72]. |
| Single-Atom Nanozymes (SAzymes) | Isolated metal atoms stabilized on a support, mimicking natural enzyme active sites [71] [72]. | Maximum atom utilization; well-defined, uniform active sites; high catalytic efficiency and tunability [71]. | Complex synthesis to prevent atom aggregation; requires advanced characterization [72]. | High-sensitivity biosensing and targeted catalytic therapy due to superior ROS regulation [71] [72]. |
Strategy 1: Enzyme Immobilization for Acetylcholinesterase (AChE)-Based Biosensors
Enzyme immobilization enhances the operational stability and reusability of natural enzymes like AChE, which is crucial for OP detection based on inhibition assays [69].
Application Note in OP Detection
AChE catalyzes the hydrolysis of acetylcholine. OP pesticides inhibit AChE, and this reduction in activity is measured to quantify OP concentration [69] [70]. Immobilizing AChE on a transducer surface is key to creating reusable, stable biosensor strips or chips.
Protocol: Covalent Immobilization of AChE on a Glassy Carbon Electrode
This protocol outlines the steps for creating an AChE-based electrochemical biosensor.
Materials:
- Acetylcholinesterase (AChE) from Electrophorus electricus
- Glassy Carbon Electrode (GCE)
- Carbodiimide (EDC) and N-Hydroxysuccinimide (NHS)
- Chitosan solution (0.5% w/v in dilute acetic acid)
- Acetylthiocholine (ATCh) substrate
- Phosphate Buffer Saline (PBS, 0.1 M, pH 7.4)
Procedure:
- Electrode Pretreatment: Polish the GCE with alumina slurry (0.05 µm) on a microcloth. Rinse thoroughly with deionized water and dry.
- Surface Activation: Deposit 10 µL of a mixed solution of EDC (0.05 M) and NHS (0.1 M) onto the GCE surface. Incubate for 15 minutes at room temperature to activate carboxyl groups.
- Enzyme Immobilization: Rinse the activated electrode and cover it with 10 µL of AChE solution (5 U/mL in PBS). Incubate for 2 hours in a humid chamber at 4°C.
- Stabilization Layer: Apply a thin layer of chitosan (5 µL of 0.5% solution) over the immobilized enzyme to entrap it and enhance stability. Allow it to dry at room temperature.
- Storage: Store the prepared biosensor at 4°C in PBS when not in use.
Experimental Workflow: The following diagram illustrates the multi-step process of enzyme immobilization and the subsequent inhibition-based detection of organophosphates.
Strategy 2: Single-Atom Nanozymes (SAzymes) as Stable Enzyme Mimics
SAzymes represent the cutting edge of nanozyme development, offering catalytic efficiency that often surpasses traditional nanozymes and approaches that of natural enzymes [71] [72].
Application Note in OP Detection
SAzymes with peroxidase (POD)-like activity can catalyze reactions that generate colored or fluorescent products. While not used in classical inhibition assays like AChE, they can be integrated into biosensing platforms for detecting OP hydrolase activity or as highly sensitive signal amplifiers in associated assays [72].
Protocol: Synthesis of Fe-N-C SAzyme via Pyrolysis
This is a common method for preparing carbon-supported SAzymes [72].
Materials:
- Zeolitic Imidazolate Framework-8 (ZIF-8) precursor
- Iron (III) nitrate nonahydrate (Fe(NO3)3·9H2O)
- Argon and Ammonia gas cylinders
- Tube furnace
- N,N-Dimethylformamide (DMF)
Procedure:
- Precursor Preparation: Dissolve ZIF-8 precursors (zinc nitrate and 2-methylimidazole) in methanol. Combine the solutions and stir for 24 hours at room temperature. Collect the white ZIF-8 powder by centrifugation and dry.
- Iron Doping: Dissolve the as-synthesized ZIF-8 in DMF. Add a solution of Fe(NO3)3 to achieve the desired Fe doping level (e.g., 1-5 wt%). Stir vigorously for 12 hours.
- Pyrolysis: Place the Fe-doped ZIF-8 in a quartz boat and load it into a tube furnace. Pyrolyze the material under a continuous Ar gas flow (e.g., 100 sccm) with a temperature ramp (e.g., 5°C/min) to 900°C. Hold at this temperature for 1-2 hours.
- Activation: Switch the gas flow to NH3 and maintain at 900°C for an additional 30 minutes to facilitate the formation of active Fe-Nx sites.
- Cooling and Storage: Allow the furnace to cool to room temperature under an inert atmosphere. The resulting black powder (Fe-N-C SAzyme) should be stored in a desiccator.
Table 2: Synthesis Methods for Single-Atom Nanozymes (SAzymes)
| Method | Key Principle | Advantages | Disadvantages |
|---|---|---|---|
| Pyrolysis [72] | Thermal treatment of metal-doped precursors (e.g., MOFs) in inert/active atmosphere. | High metal loading; well-defined structure; scalable potential. | High energy consumption; possible aggregation; poor biocompatibility. |
| Defect Engineering [72] | Utilizing defects on support materials (e.g., graphene) to trap single metal atoms. | Better biocompatibility; controllable particle size; lower cost. | Limited application systems; fewer activity modulation routes. |
| Atomic Layer Deposition (ALD) [72] | Sequential, self-limiting surface reactions for precise deposition of metal atoms. | Ultimate precision in active center control; ideal for structure-property studies. | High cost; difficult to scale for mass production. |
Strategy 3: Intrinsic Protein Stabilization via Engineering with the CysGA Biosensor
Beyond using external mimics or supports, the intrinsic stability of a protein itself can be engineered. The CysGA tripartite biosensor is a powerful tool for high-throughput screening of stabilized protein variants [73].
Application Note
This biosensor is not a stabilization technique per se, but a platform for discovering stabilizing mutations in any protein of interest (POI), which could include enzymes used in biosensing. It couples the stability of the POI to the fluorescence output of a reporter enzyme [73].
Protocol: Deep Mutational Scanning for Protein Stabilization
This protocol uses the CysGA biosensor to profile the stability effects of thousands of mutations in parallel [73].
Materials:
- CysGA tripartite biosensor plasmid (N-CysGA / POI / C-CysGA)
- Mutagenesis library of the POI
- Competent E. coli cells
- LB growth medium
- Fluorescence-activated cell sorter (FACS)
- Next-generation sequencing (NGS) platform
Procedure:
- Library Construction: Clone a comprehensive mutant library of the POI into the permissive site of the CysGA biosensor plasmid.
- Transformation and Expression: Transform the mutant plasmid library into competent E. coli cells. Grow the cells under conditions that induce the expression of the biosensor fusion construct.
- Fluorescence Screening: Harvest the cells and analyze them via FACS. Cells expressing stable POI variants will reconstitute CysGA activity, producing a red fluorescent compound, and thus exhibit high fluorescence. Unstable POI variants will result in low fluorescence.
- Sorting and Sequencing: Sort cell populations based on high, medium, and low fluorescence. Isolate genomic DNA from each population and subject the POI gene region to NGS.
- Data Analysis: Calculate the enrichment or depletion of each mutation in the high-fluorescence (stable) population compared to the low-fluorescence (unstable) population. This enrichment score maps the stability landscape of the POI, identifying stabilizing mutations.
CysGA Biosensor Workflow: The diagram below illustrates the principle of the CysGA biosensor and how it is used to screen for stabilized protein variants.
The Scientist's Toolkit: Research Reagent Solutions
Table 3: Essential Materials for Enzyme-Stabilized Biosensor Research
| Reagent / Material | Function / Application | Key Characteristics |
|---|---|---|
| Acetylcholinesterase (AChE) [69] [70] | Biological recognition element in inhibition-based OP biosensors. | High specific activity; sensitivity to OP inhibition. |
| Chitosan [69] | Biopolymer for enzyme immobilization via entrapment. | Biocompatible; forms stable hydrogel films; promotes adhesion. |
| EDC / NHS Crosslinkers [69] [56] | Activate carboxyl groups for covalent enzyme immobilization. | Zero-length crosslinkers; standard for amide bond formation. |
| ZIF-8 Precursors [72] | Metal-Organic Framework (MOF) precursor for SAzyme synthesis. | High surface area; porous; can be doped with transition metals. |
| Acetylthiocholine (ATCh) [70] | Substrate for AChE in electrochemical and colorimetric assays. | Hydrolyzed to thiocholine, which is electroactive or reacts with DTNB. |
| Metal Salts (Fe, Pt, Cu) [71] [72] | Active center precursors for nanozyme and SAzyme synthesis. | High purity; define the core catalytic activity of the mimic. |
Mitigating Matrix Interference in Complex Samples like Blood, Food, and Soil
Matrix interference from co-extracted substances in complex samples (e.g., blood, food, soil) remains a significant challenge in the analysis of organophosphate (OP) compounds, adversely affecting assay sensitivity, accuracy, and reliability. For portable biosensors intended for on-site detection, these interferences can be particularly detrimental, as they often lack extensive sample cleanup capabilities of laboratory instruments. This application note provides detailed protocols and strategies to mitigate these effects, framed within the context of developing robust, field-deployable biosensing systems for organophosphate pesticide (OPP) detection. We summarize optimized sample preparation techniques across different matrices and present experimental data on biosensor performance, enabling researchers to achieve higher fidelity in their analytical measurements.
Sample Preparation Protocols for Matrix Interference Mitigation
Effective sample preparation is crucial for reducing matrix effects. The following protocols are optimized for different sample types to ensure compatibility with subsequent biosensor detection.
Protocol for Hair and Protein-Rich Matrices (as a Surrogate for Blood Analysis)
Hair analysis provides a non-invasive method for assessing chronic exposure to OPs by measuring dialkyl phosphate (DAP) metabolites. Its protein-rich nature also offers valuable insights for handling other keratinous or protein-based matrices [74].
- Principle: Under basic pH conditions, DAP metabolites and hair amino acids become negatively charged, minimizing ionic interactions and facilitating analyte dissociation from the hair matrix into the solvent [74].
- Reagents: Methanol (Optima grade), Ammonium Hydroxide (NH₄OH, 25%), Deionized Water, Acetone.
- Equipment: Ball mill (e.g., Biospec), reinforced plastic vials, end-over-end rotator (e.g., Gilson Automix), sonication water bath (e.g., Branson 2510), centrifuge, LC-MS/MS system.
- Procedure:
- Decontamination: Wash ~50 mg hair successively in 20 mL water (5 min shaking), 20 mL methanol (1 min shaking), and air-dry overnight [74].
- Homogenization: Cut dried hair into snippets, place in a vial with stainless-steel beads, and homogenize using a ball mill for 6 minutes [74].
- Extraction: Add 1 mL of basic methanol (methanol with 2% NH₄OH) to 50 mg of milled hair. Agitate the mixture on an end-over-end rotator for 16-18 hours [74].
- Post-Extraction Processing: Sonicate the sample for 1 hour, then centrifuge at 12,000 rpm for 15 minutes at 35°C [74].
- Analysis: The supernatant can be directly injected into an LC-MS/MS system for the quantification of six DAP metabolites: DMP, DMTP, DMDTP, DEP, DETP, and DEDTP [74].
Protocol for Food Samples (Vegetables, Fruits, and Grains) using a Distance-Based Paper Biosensor
This protocol utilizes a enzyme inhibition-mediated distance-based paper (EIDP) biosensor, designed for simple, instrument-free detection of OPs in food, minimizing interference through specific enzymatic reactions [70].
- Principle: Acetylcholinesterase (AChE) hydrolyzes acetylthiocholine (ATCh) to produce thiocholine, which disrupts a copper alginate (Cu-Alg) hydrogel, releasing water that flows on pH paper. OP pesticides inhibit AChE, reducing water flow distance proportionally to OP concentration [70].
- Reagents: Sodium alginate, Cupric chloride (CuCl₂), Acetylcholinesterase (AChE), Acetylthiocholine (ATCh), Tris-HCl buffer, Malathion (or other OP standard), pH paper.
- Equipment: Polyvinyl chloride (PVC) board, scanning electron microscope (e.g., ZEISS GeminiSEM 360).
- Procedure:
- Biosensor Assembly: Affix a strip of pH paper (60 mm x 5 mm) to a PVC board [70].
- Hydrogel Preparation: Synthesize Cu-Alg hydrogel by mixing 0.2% (w/v) sodium alginate with 1.5-2.0 mM CuCl₂ [70].
- Sample Extraction: Homogenize the food sample (e.g., pumpkin, rice) and extract the pesticides using a suitable buffer like Tris-HCl.
- Incubation and Detection:
- Incubate the food extract with AChE (0.06 U/mL) for a defined period (e.g., 10-30 minutes) to allow enzyme inhibition [70].
- Add ATCh (3 mM) to the mixture and incubate for an additional 10 minutes.
- Place a aliquot of the final mixture onto the Cu-Alg hydrogel on the pH paper.
- Measurement: Measure the distance traveled by the water front on the pH paper. The distance is inversely correlated with the OP concentration in the sample [70].
Protocol for Soil Samples using a Modified QuEChERS Approach
This protocol is adapted for comprehensive pesticide screening in soil, effectively reducing co-extractives that cause matrix interference in chromatographic analysis [75].
- Principle: The QuEChERS method involves solvent extraction, salt-induced partitioning, and a dispersive solid-phase extraction (d-SPE) clean-up to remove organic acids, polar pigments, and sugars [75].
- Reagents: Acetonitrile (GC-grade), QuEChERS extraction salts (MgSO₄, NaCl), d-SPE sorbents (e.g., PSA, C18).
- Equipment: Centrifuge, comprehensive two-dimensional gas chromatography coupled with time-of-flight mass spectrometry (GC×GC-TOF-MS).
- Procedure:
- Extraction: Weigh 10 g of soil into a centrifuge tube. Add 10 mL of acetonitrile and shake vigorously for 1 minute [75].
- Partitioning: Add extraction salts (e.g., MgSO₄ to remove residual water, NaCl to induce partitioning). Shake and centrifuge to separate the organic layer [75].
- Clean-up: Transfer an aliquot of the upper acetonitrile layer to a d-SPE tube containing clean-up sorbents. Shake and centrifuge [75].
- Analysis: Analyze the purified extract using GC×GC-TOF-MS. The enhanced separation power of GC×GC effectively resolves co-eluting pesticides and matrix components, enabling sensitive detection at levels of 10 μg/kg [75].
Experimental Data and Performance Metrics
The following tables summarize the performance of various detection methods and sample preparation techniques for OPs across different matrices.
Table 1: Performance Metrics of Biosensor Platforms for OP Detection
| Biosensor Platform | Detection Principle | Target Analyte | Linear Range | Limit of Detection (LoD) | Reference |
|---|---|---|---|---|---|
| EIDP Biosensor [70] | AChE inhibition / Distance measurement | Malathion (model OP) | 18–105 ng/mL | 18 ng/mL | [70] |
| Potentiometric Biosensor [18] | AChE inhibition / Potential change | Diazinon, Profenofos | Not specified | 0.001 μg/L (10⁻⁷ mg/L) | [18] |
| OPH-based Biosensor [51] | OPH catalysis / Optical detection | Organophosphates (general) | 0.1–100 ng/mL | Not specified | [51] |
| Pedestal HCG Optical Sensor [76] | Refractometric (Avidin-Biotin model) | Avidin (model analyte) | Not specified | 2.1 ng/mL | [76] |
Table 2: Efficiency of Sample Preparation Methods for Matrix Interference Mitigation
| Sample Matrix | Preparation Method | Key Mitigation Strategy | Performance Outcome | Reference |
|---|---|---|---|---|
| Hair | Basic Solvent Extraction | Use of MeOH with 2% NH₄OH to weaken analyte-matrix interactions | Recovery of 72%–152% for six DAPs; minimal matrix effect | [74] |
| Soil | QuEChERS + GC×GC-TOF-MS | d-SPE clean-up coupled with high-resolution separation | Mean recovery: 74.2%–118.3%; LoD: 10 μg/kg | [75] |
| Food (Produce) | AChE-inhibition Biosensor | Specific enzymatic reaction; no complex cleanup needed | Recovery in food samples: 93%–103% | [70] |
The Scientist's Toolkit: Essential Research Reagents and Materials
Table 3: Key Reagent Solutions for OP Biosensor Research
| Reagent/Material | Function and Role in Research | Example Application |
|---|---|---|
| Acetylcholinesterase (AChE) | Recognition element in inhibition-based biosensors; its activity is inhibited by OPs. | EIDP biosensor [70]; Potentiometric biosensor [18] |
| Organophosphate Hydrolase (OPH) | Catalytic recognition element; directly hydrolyzes OPs, often used in direct detection assays. | OPH-based on-spot biosensing device [51] |
| Acetylthiocholine (ATCh) | Enzyme substrate for AChE; hydrolysis product (thiocholine) generates a measurable signal. | Used in electrochemical and distance-based biosensors [70] [18] |
| Cellulose Acetate (CA) / Glutaraldehyde (GA) | Polymer and crosslinker for enzyme immobilization on electrode surfaces. | Membrane for AChE immobilization on Au electrodes [18] |
| Copper Alginate (Cu-Alg) Hydrogel | Signal transduction material; its structural disintegration is triggered by enzyme product. | Core component in the EIDP biosensor for water release control [70] |
| Biotin-Avidin System | High-affinity binding pair for surface functionalization and assay development in optical sensors. | Functionalization of pedestal high-contrast gratings (HCG) for avidin detection [76] |
Workflow and Signaling Pathways
The following diagrams illustrate the core experimental workflow for complex sample analysis and the signaling mechanism of a representative biosensor.
Workflow for OP Analysis in Complex Samples
Diagram 1: Generic workflow for OP analysis in complex samples, highlighting the critical sample preparation step for mitigating matrix interference.
Signaling Mechanism of an EIDP Biosensor
Diagram 2: Signaling mechanism of an Enzyme Inhibition-Mediated Distance-Based Paper (EIDP) biosensor for OP detection. The presence of OPs inhibits AChE, preventing the reaction that triggers water flow.
The development of portable biosensors for on-site organophosphate (OP) detection represents a significant advancement in environmental monitoring and public health protection. However, a critical challenge persists: the ability to accurately differentiate between OPs and carbamate pesticides. Both chemical classes function as acetylcholinesterase (AChE) inhibitors, leading to cross-reactivity in many standard biosensing platforms [77]. This application note details targeted strategies and experimental protocols to enhance biosensor selectivity, enabling precise discrimination between these neurotoxic compounds for researchers and drug development professionals working on field-deployable detection systems.
The Selectivity Challenge: OPs vs. Carbamates
Organophosphates and carbamates both exert their toxicity through inhibition of acetylcholinesterase, yet they differ fundamentally in their binding mechanisms and kinetic profiles. OPs typically phosphorylate the serine hydroxyl group in the AChE active site, forming a stable, largely irreversible covalent bond [77]. In contrast, carbamates carbamylate the same site, creating a reversible complex that undergoes relatively rapid hydrolysis [77]. This biochemical distinction provides the theoretical foundation for developing differentiation strategies in biosensor design.
Key Differentiation Strategies
Kinetic Analysis-Based Differentiation
The most reliable method for discriminating between OPs and carbamates exploits the significant difference in enzyme-inhibition complex stability. The protocol below outlines a standardized approach for kinetic monitoring.
Experimental Protocol 1: Kinetic Analysis of Enzyme Reactivation
- Objective: To distinguish OP and carbamate inhibition based on spontaneous enzyme reactivation rates.
- Principle: Carbamate-inhibited AChE exhibits significantly faster spontaneous recovery of enzymatic activity compared to OP-inhibited AChE.
- Materials:
- Purified Acetylcholinesterase (AChE)
- Acetylthiocholine iodide (ATCh) substrate
- 5,5'-dithio-bis-(2-nitrobenzoic acid) (DTNB) chromogen
- Phosphate buffer (0.1 M, pH 7.4)
- OP and carbamate standard solutions
- Spectrophotometer or portable colorimetric detector
- Procedure:
- Inhibit a standardized AChE solution by incubating with either an OP or carbamate compound for 10 minutes at 25°C.
- Remove excess inhibitor via rapid gel filtration or dialysis.
- Immediately assay residual AChE activity by adding ATCh/DTNB mixture and monitoring absorbance at 412 nm (A₁).
- Incubate the inhibited enzyme at 25°C for 30 minutes.
- Re-assay the AChE activity under identical conditions (A₂).
- Calculate the percentage reactivation: % Reactivation = [(A₂ - A₁) / A₁] × 100.
- Data Interpretation: Samples showing >20% reactivation typically indicate carbamate inhibition, while OP-inhibited samples generally show <5% spontaneous reactivation over this timeframe.
Table 1: Characteristic Kinetic Parameters for Differentiation
| Inhibition Type | Binding Nature | Spontaneous Reactivation Rate (t½) | % Reactivation (30 min) | Oxime-Induced Reactivation |
|---|---|---|---|---|
| Organophosphate | Irreversible | Hours to days | <5% | Significant |
| Carbamate | Reversible | Minutes to hours | 20-80% | Minimal |
pH-Based Selective Detection
Carbamate inhibition demonstrates greater pH sensitivity compared to OP inhibition, providing another discrimination pathway.
Experimental Protocol 2: pH-Dependent Inhibition Profiling
- Objective: To utilize pH manipulation to selectively detect OPs in the presence of carbamates.
- Principle: Carbamate-enzyme bonds are labile under alkaline conditions, while OP-enzyme bonds remain stable.
- Materials:
- AChE-immobilized biosensor platform (e.g., electrochemical, colorimetric)
- Buffer solutions of varying pH (6.0, 7.4, 8.5, 10.0)
- Standard solutions of OP and carbamate
- Procedure:
- Expose the AChE-biosensor to a sample containing a mixture of OP and carbamate at pH 7.4. Record the initial inhibition signal.
- Rinse the sensor with alkaline buffer (pH 10.0) for 2-3 minutes.
- Re-assay the biosensor activity at pH 7.4.
- The recovered activity corresponds to the decarbamylation of the enzyme. The remaining inhibition is attributed to the OP component.
- Data Interpretation: Calculate carbamate concentration from the recovered signal and OP concentration from the residual inhibition after alkaline treatment.
Biosensor Design and Transducer Selection
The choice of biosensor platform and transducer significantly influences selectivity. Recent advancements in portable systems show great promise.
Table 2: Biosensor Platforms for Selective Pesticide Detection
| Biosensor Platform | Transducer Type | Selectivity Mechanism | Limit of Detection | Key Advantage |
|---|---|---|---|---|
| ISFET-based Algal Biosensor [78] | Potentiometric | Inhibition of algal alkaline phosphatase | 10⁻¹⁰ M for acephate | Ultra-sensitive, portable, uses whole cells |
| Paper-Based Biosensor [17] | Colorimetric | AChE inhibition + kinetic analysis | 2.5 ppm for malathion | Low-cost, disposable, rapid (5 min) |
| Microwave Ring Resonator [79] | Dielectric | Dielectric property changes | N/A for pesticides | Label-free, non-destructive |
| Electrochemical Sensor [2] | Amperometric | Enzyme inhibition with surface modification | Varies by design | High sensitivity, miniaturization potential |
Experimental Protocol 3: ISFET-Based Algal Biosensor for Selective OP Detection
- Objective: To fabricate a portable Ion-Sensitive Field-Effect Transistor (ISFET) biosensor using Chlorella sp. for selective OP detection.
- Principle: OPs inhibit alkaline phosphatase activity in algal cells, reducing ascorbic acid production and causing a measurable pH shift detected by the Ta₂O₅-ISFET.
- Materials:
- Ta₂O₅-ISFET chips
- Chlorella sp. culture
- 2-Phospho-L-ascorbic acid (PAA) substrate
- Tris-HCl buffer (0.1 M, pH 8.5)
- Glutaraldehyde and Bovine Serum Albumin (BSA) for immobilization
- Procedure: [78]
- Immobilize 20 μL of concentrated Chlorella sp. cells onto the Ta₂O₅ gate of the ISFET using BSA-glutaraldehyde crosslinking.
- Condition the biosensor in Tris-HCl buffer.
- Introduce sample containing pesticide and 0.4 mL PAA substrate.
- Monitor the potentiometric output for 4 minutes.
- The signal inhibition is correlated with OP concentration. The sensor's inherent design offers reduced sensitivity to carbamates.
- Validation: Compare results with standard HPLC methods for accuracy confirmation.
The Scientist's Toolkit: Essential Research Reagents
Table 3: Key Research Reagent Solutions for OP/Carbamate Differentiation Studies
| Reagent | Function/Application | Key Consideration |
|---|---|---|
| Acetylcholinesterase (AChE) | Primary biorecognition element for inhibition | Source (electric eel, human recombinant) affects sensitivity and specificity |
| Acetylthiocholine Iodide (ATCh) | Artificial substrate for AChE activity assay | Hydrolyzes to thiocholine, which reacts with DTNB |
| DTNB (Ellman's Reagent) | Chromogen producing yellow 2-nitro-5-thiobenzoate | Allows spectrophotometric or visual detection at 405-412 nm [17] |
| Pralidoxime (2-PAM) | Cholinesterase reactivator | Can be used to confirm OP inhibition due to its ability to dephosphorylate AChE [77] |
| Whole Algal Cells (Chlorella sp.) | Alternative biocatalyst expressing alkaline phosphatase | Offers enhanced stability over purified enzymes; suitable for field sensors [78] |
| Enzyme Stabilizers (Glucose, BSA, Trehalose) | Maintain enzyme activity in storage | Critical for extending shelf-life of bioactive papers and biosensors [17] |
Workflow and Signaling Pathways
The following diagrams illustrate the core biochemical principles and experimental workflows for differentiating OPs and carbamates.
Biochemical Inhibition Pathways
Kinetic Differentiation Workflow
The strategic integration of kinetic analysis, pH manipulation, and advanced biosensor design provides a robust framework for effectively differentiating between organophosphate and carbamate pesticides. The experimental protocols and application notes detailed herein offer researchers practical methodologies to enhance the selectivity of portable biosensors, thereby improving the accuracy of on-site detection and risk assessment. As the field evolves, the combination of these discriminatory strategies with emerging nanomaterials and microfluidic platforms will further advance the development of sophisticated, field-deployable analytical tools for public health protection.
The development of robust, portable biosensors for the on-site detection of organophosphate pesticides (OPs) is a critical response to global food safety and environmental monitoring challenges. These biosensors often rely on the inhibition of enzymes like acetylcholinesterase (AChE) by OPs. The analytical performance of these devices is not inherent but is profoundly influenced by key operational parameters. This Application Note provides detailed protocols and consolidated data for optimizing bioreceptor concentration, incubation time, and pH to ensure maximum sensitivity, stability, and detection efficiency for on-site applications. The guidance is framed within a broader research context aimed at transitioning laboratory assays into reliable field-deployed tools [80] [43].
The table below synthesizes optimized parameters from recent studies for AChE-based biosensors, providing a benchmark for assay development.
Table 1: Summary of Optimized Parameters for AChE-Based Biosensors
| Sensor Platform / Study | Bioreceptor (AChE) Concentration | Optimum pH | Optimum Incubation Time | Target Analytic |
|---|---|---|---|---|
| Paper-Based Bioactive Sensor [17] | 12 U/mL | Not Specified | 5 minutes | Malathion |
| On-Glove Electrochemical Biosensor [80] | Not Specified | Not Specified | Not Specified | Dichlorvos |
| Smartphone/Resistive Biosensor [81] | Not Specified | Not Specified | Not Specified | Paraoxon-Methyl |
| Distance-Based Paper Biosensor [70] | 0.06 U/mL | Not Specified | 10 minutes | Malathion |
| Alginate-Chitosan Film Sensor [82] | 200 units/mL (immobilization) | 7.0 | 1 minute | Profenofos |
| Optical Biosensor (MPH-based) [21] | N/A (Uses MPH enzyme) | Assessed range 4-9 | Not Specified | Methyl Parathion |
| Personal Glucose Meter Sensor [83] | Diluted whole blood (1:10) | 8.0 | 10-15 minutes | Mevinphos, Carbofuran |
Detailed Experimental Protocols
Optimization of Bioreceptor (AChE) Concentration
Principle: The concentration of the bioreceptor (e.g., AChE) directly influences the catalytic turnover rate and the dynamic range of the inhibition assay. An optimal concentration ensures a strong initial signal without causing substrate depletion or nonlinear kinetics [17] [70].
Protocol for Colorimetric Paper-Based Sensor [17]:
- Reagent Preparation: Prepare a stock solution of AChE in a suitable buffer (e.g., 0.1 M phosphate buffer, pH ~7-8).
- Sensor Spotting: Prepare a series of AChE solutions with concentrations ranging from 0 to 0.06 U/mL.
- Immobilization: Apply a fixed volume (e.g., 15 µL) of each AChE solution onto separate, pre-sterilized filter paper discs (1x1 cm). Dry the spots in a desiccator at -600 mmHg for 20 minutes.
- Assay Execution: Apply a fixed volume of substrate solution containing acetylthiocholine (ATCh) and the chromogen DTNB (5,5'-dithiobis-(2-nitrobenzoic acid)) to each spotted disc.
- Signal Measurement: Precisely 5 minutes after substrate addition, measure the color intensity. This can be done via a desktop scanner or a smartphone camera, converting the image to grayscale or using RGB analysis with software like ImageJ.
- Data Analysis: Plot the color intensity (or the initial reaction rate) against the AChE concentration. The optimal concentration is the point just before the signal plateaus, indicating saturation. For the referenced study, 12 U/mL was selected as it provided a strong, distinguishable color change suitable for visual or digital analysis [17].
Optimization of Incubation Time
Principle: Incubation time is critical for the inhibition step. A longer incubation allows for more interaction between the OP and AChE, increasing sensitivity, but must be balanced with the need for rapid on-site analysis [70] [82].
Protocol for Inhibition Incubation [70]:
- Sample and Enzyme Prep: Prepare a standard solution of the target OP (e.g., malathion) and the optimal AChE concentration (e.g., 0.06 U/mL).
- Inhibition Reaction: Mix the AChE solution with the OP standard. Allow the inhibition reaction to proceed for a range of times (e.g., 0 to 30 minutes).
- Residual Activity Assay: After each incubation time, transfer the mixture to a system containing the substrate ATCh to measure the remaining AChE activity.
- Signal Measurement: In a distance-based paper biosensor, the residual activity is measured by the water flow distance on pH paper. In a colorimetric film sensor [82], the signal is the color intensity measured via RGB values.
- Data Analysis: Plot the normalized signal (e.g., % inhibition or flow distance) against the incubation time. The optimal time is selected at the point where the inhibition curve begins to plateau, ensuring near-complete inhibitor-enzyme binding without excessive delay. Studies have successfully used incubation times as short as 1 minute [82] and up to 10-15 minutes [70] [83].
Optimization of pH
Principle: Enzyme activity and stability are highly dependent on pH. The optimal pH ensures maximum catalytic efficiency, which translates to the highest signal-to-noise ratio for the assay [17] [84].
Protocol for pH Profiling [17] [84]:
- Buffer Preparation: Prepare a series of buffers covering a broad pH range (e.g., pH 1-13 using potassium hydrogen phthalate, phosphate, and sodium tetraborate buffers).
- Assay Setup: Conduct the AChE activity assay (enzyme + substrate) in each buffer. Ensure the ionic strength is consistent across buffers.
- Signal Measurement: Measure the initial reaction rate for each pH condition. For an electrochemical biosensor [84], this would be the peak current in Differential Pulse Voltammetry (DPV). For a colorimetric sensor, it is the initial rate of color development.
- Data Analysis: Plot the measured signal (e.g., current in µA or initial velocity) against the pH. The optimal pH is identified at the peak of this curve. Multiple studies confirm that a neutral pH of 7.0-8.0 is optimal for AChE activity in sensing platforms [82] [84]. The smartphone-integrated resistive biosensor also showed a wide operational pH range, a desirable trait for analyzing real samples with variable acidity [81].
Signaling Pathways and Workflows
The following diagrams illustrate the core mechanisms and experimental workflows for OP detection.
AChE Inhibition-Based OP Detection Mechanism
Experimental Workflow for Parameter Optimization
The Scientist's Toolkit: Research Reagent Solutions
This table details essential materials and their functions for developing and optimizing AChE-based biosensors.
Table 2: Key Research Reagents for Biosensor Development
| Reagent / Material | Function in the Assay | Example from Literature |
|---|---|---|
| Acetylcholinesterase (AChE) | Primary biorecognition element; its inhibition by OPs is the basis of detection. | Electric eel AChE is commonly used (e.g., 0.06 U/mL for paper sensor) [70]. |
| Acetylthiocholine (ATCh) | Artificial substrate for AChE; hydrolysis produces thiocholine for signal generation. | Used at 3-4 μg/mL in colorimetric assays and 15 mM in PGM-based sensors [17] [83]. |
| DTNB (Ellman's Reagent) | Chromogenic agent; reacts with thiocholine to produce a yellow-colored product. | Used at 4 μg/mL in paper-based bioactive sensors for colorimetric readout [17]. |
| Silver Nanoparticles (AgNPs) | Colorimetric probe; aggregation or redox reaction induced by assay products causes a visible color change. | 10 μg/mL biogenic AgNPs immobilized in an alginate-chitosan film [82]. |
| Personal Glucose Meter (PGM) | Portable, off-the-shelf electrochemical transducer for quantifying thiocholine. | Sannuo AQ smart meter used to detect thiocholine from AChE activity [83]. |
| Prussian Blue / Carbon Black | Electron mediators in electrochemical biosensors to enhance signal and lower working potential. | Used in a bio-hybrid probe for an on-glove electrochemical biosensor [80]. |
| Metal-Organic Frameworks (MOFs) | Nanomaterials for enzyme immobilization; provide high surface area and a protective microenvironment. | Zinc-based Basolite Z1200 used to immobilize AChE on a gold microelectrode [84]. |
| Screen-Printed Electrodes (SPEs) | Disposable, low-cost electrochemical platforms suitable for mass production and field use. | Carbon-based SPEs used with a polyaniline nanofiber/AChE/carbon nanotube nanocomposite [81]. |
Improving Shelf-Life and Operational Stability for Field-Deployable Devices
For researchers developing portable biosensors for on-site organophosphate (OP) detection, the operational stability of the biological recognition element and the device's shelf life are critical determinants of real-world applicability. Field-deployable devices must maintain sensitivity and accuracy over time and through variable environmental conditions, moving beyond single-use laboratory prototypes to reliable, robust analytical tools. This Application Note details validated protocols and material strategies to significantly enhance these parameters, focusing on the stabilization of enzymatic components and the adoption of advanced, green immobilization techniques. The strategies presented herein are framed within the context of a broader thesis on portable biosensors for organophosphate detection, providing a practical roadmap for researchers and scientists aiming to transition their technology from the bench to the field.
Stabilization Strategies and Performance Data
The stability of enzyme-based biosensors can be dramatically improved through the use of protein-based stabilizing agents and innovative immobilization techniques. The quantitative performance of these strategies is summarized in the table below.
Table 1: Performance of Biosensor Stabilization Strategies
| Stabilization Strategy | Target Analyte | Key Reagent / Technique | Improvement in Operational Stability | Improvement in Shelf Life |
|---|---|---|---|---|
| Protein-Based Stabilization [85] | Glucose & Sucrose | Lysozyme (incorporated during immobilization) | • Glucose: >750 analyses over 230 days• Sucrose: >400 analyses over 40 days | N/R |
| Advanced Immobilization [86] | Lactate | Ambient Electrospray Deposition (ESD) | Reusable for 24 measurements without performance loss | 90 days at room temperature and pressure |
Detailed Experimental Protocols
Protocol 1: Enhancing Stability with Protein-Based Stabilizing Agents (PBSAs)
This protocol is adapted from research on glucose and sucrose biosensors, where the incorporation of lysozyme as a PBSA considerably enhanced operational stability [85]. The method can be investigated for its applicability in stabilizing organophosphate-detecting enzymes like acetylcholinesterase or alkaline phosphatase.
- Objective: To stabilize an immobilized enzyme system against inactivation and denaturation, thereby extending its reusable operational life.
Materials:
- Biological recognition element (e.g., Alkaline Phosphatase for OP detection [59]).
- Protein-Based Stabilizing Agent (PBSA): e.g., Lysozyme, Bovine Serum Albumin (BSA), or Gelatin.
- Glutaraldehyde solution (cross-linking agent).
- Appropriate buffer (e.g., 50 mM Phosphate Buffer, pH 6.0-7.0).
- Transducer surface (e.g., Screen-printed electrode, membrane).
- Oxygen-permeable membrane (e.g., Teflon).
Procedure:
- Enzyme-PBSA Mixture Preparation: Prepare a solution containing your enzyme and the PBSA (e.g., Lysozyme) in a suitable buffer. The optimal ratio of enzyme to PBSA must be determined empirically [85].
- Immobilization by Cross-linking: Add a glutaraldehyde solution to the enzyme-PBSA mixture to achieve a low concentration (e.g., 0.5% v/v). Mix thoroughly. Glutaraldehyde acts as a bifunctional cross-linker, creating covalent bonds between the enzyme, PBSA, and the support matrix.
- Deposition and Drying: Deposit the mixture onto the surface of your transducer. Allow it to dry under mild conditions to form a stable, cross-linked film.
- Membrane Sealing: Protect the immobilized enzyme layer by sealing it with an oxygen-permeable membrane (e.g., Teflon) [85].
- Stability Testing: Conduct repeated analyses with standard analyte solutions. Monitor the sensor's response (e.g., current, fluorescence intensity) over time and number of uses to quantify the enhancement in operational stability.
Protocol 2: Ambient Electrospray Deposition (ESD) for Immobilization
This protocol describes the use of ESD, a green immobilization technique that has demonstrated unprecedented reuse and storage capabilities for an unstable lactate oxidase enzyme [86]. This method is highly recommended for creating robust, field-ready biosensing interfaces.
- Objective: To immobilize an enzyme onto an electrode surface using ESD, conferring excellent reuse capability and long-term storage stability at room temperature.
Materials:
- Enzyme of interest (e.g., L-lactate oxidase, Organophosphate-hydrolyzing enzyme).
- Screen-printed electrode (e.g., Prussian blue/carbon working electrode).
- Potentiostat.
- 0.1 M Phosphate-Buffered Saline (PBS), pH 7.0.
- LC-MS grade water.
- Ambient Electrospray Deposition apparatus.
Procedure:
- Sample Preparation: Dissolve the enzyme in a compatible solvent, typically a mixture of LC-MS grade water and a volatile solvent like isopropanol [86].
- Electrospray Setup: Load the enzyme solution into the ESD apparatus. Position the screen-printed electrode as the deposition target.
- Soft-Landing Immobilization: Apply a high voltage to create a stable Taylor cone, generating a fine mist of charged microdroplets containing the enzyme. The droplets are softly landed onto the electrode surface, resulting in a uniform enzyme layer without the need for harsh chemicals or entrapment matrices.
- Biosensor Assembly: The electrode is ready for use after ESD. No additional membrane is required.
- Storage and Recycling:
- Storage: Store the fabricated biosensor at ambient temperature and pressure.
- Performance Testing: Test the biosensor periodically by amperometric measurement in a standard analyte solution.
- Recycling: If performance degrades after extensive use, a new electrospray deposition cycle can be applied to the same electrode to restore its performance to levels comparable to a freshly made device [86].
Signaling Pathways and Workflows
Organophosphate Detection Mechanism
This diagram illustrates the signaling pathway for an alkaline phosphatase (ALP)-based fluorescence biosensor for organophosphate detection, as described in the literature [59].
Biosensor Stabilization Workflow
This workflow outlines the logical sequence for applying the stabilization strategies discussed in this note to the development of a field-deployable biosensor.
The Scientist's Toolkit: Research Reagent Solutions
Table 2: Essential Materials for Developing Stable Biosensors
| Item | Function / Role in Stabilization | Example Use Case |
|---|---|---|
| Lysozyme [85] | Protein-based stabilizing agent (PBSA) that minimizes deleterious intramolecular cross-linking during immobilization, enhancing operational stability. | Mixed with Glucose Oxidase and cross-linked with glutaraldehyde for glucose sensing. |
| Prussian Blue [86] | A mediator that lowers the working potential for H₂O₂ detection, reducing interference from easily oxidizable compounds and improving selectivity. | Used on carbon screen-printed electrodes as a substrate for Lactate Oxidase immobilization via ESD. |
| Ambient Electrospray Deposition (ESD) [86] | A green, one-step immobilization technique that softly lands enzymes onto electrodes, preserving activity and enabling room-temperature storage. | Immobilizing Lactate Oxidase on Prussian blue/carbon electrodes for lactate detection. |
| Cryoprotectants (e.g., Trehalose) [87] | Protect sensitive biological molecules during freezing and drying by reducing ice crystal formation and stabilizing protein structure. | Used in lyophilized formulations of vaccines, biologics, and diagnostic reagents to extend shelf life. |
| Glutaraldehyde [85] | A bifunctional cross-linking agent that creates covalent bonds between enzymes, stabilizing proteins, and the support matrix. | Used to co-cross-link enzymes with inert proteins like BSA or lysozyme on biosensor surfaces. |
The performance of modern biosensors, particularly for on-site detection of low-abundance analytes like organophosphorus pesticides (OPs), is often constrained by sensitivity limits. Achieving detection at clinically and environmentally relevant concentrations requires sophisticated signal amplification strategies. The integration of nanomaterials into biosensing platforms has emerged as a pivotal solution to this challenge, enabling the transition from laboratory-based assays to portable, field-deployable diagnostic tools. These materials leverage unique physicochemical properties—such as high surface-to-volume ratios, superior catalytic activity, and tunable optical and electronic characteristics—to significantly enhance signal generation and transduction [88] [89]. Within the specific context of portable biosensors for OP detection, nanomaterial-based amplification is not merely an improvement but a fundamental necessity for developing rapid, sensitive, and quantitative point-of-care devices capable of operating in resource-limited settings [90] [28].
The core challenge in detecting OPs lies in their low mandated residue limits, which often reside in the pico-molar to nano-molar range. Conventional detection methods struggle to achieve the requisite sensitivity and portability simultaneously. Nanomaterials bridge this gap by serving multiple roles: they act as superior immobilization matrices for biorecognition elements like enzymes, facilitate efficient electron transfer in electrochemical sensors, and function as powerful signal labels or catalysts in optical assays [91] [92]. For instance, the integration of nanoscale materials with affinity ligand immobilization has been decisively contributing to the field of developing highly sensitive electrochemical sensors [91]. This document outlines the principal nanomaterial amplification strategies and provides detailed application notes and protocols for their implementation in portable OP biosensing.
Nanomaterial-Based Signal Amplification Strategies
The selection of an appropriate nanomaterial and its integration strategy is paramount for successful biosensor development. The following section catalogs the primary materials and their mechanisms of action, with quantitative performance data summarized in Table 1.
Table 1: Performance of Nanomaterial-Based Biosensors for Organophosphorus Pesticide Detection
| Nanomaterial | Transducer | Bioreceptor | Target OP | Linear Range | Detection Limit | Reference |
|---|---|---|---|---|---|---|
| Amino-modified Ionic Metal-Organic Framework (NH₂-IMOF) | Electrochemical (DPV) | Acetylcholinesterase (AChE) | Glyphosate | 1 × 10⁻¹⁵ to 1 × 10⁻⁹ M | 1.24 × 10⁻¹³ M | [28] |
| Alkaline Phosphatase (ALP)-based Fluorescent System | Fluorescence (Smartphone) | Alkaline Phosphatase (ALP) | Malathion | 0.1–1 ppm | 0.05 ppm | [90] |
| Gold Nanoparticles (Lateral Flow) | Colorimetric / SERS | Antibody / AChE | Model OPs | - | 10⁴-fold improvement vs. conventional LFA | [93] |
| Gold Nanobipyramids (AuNBPs) | Colorimetric | Acetylcholinesterase (AChE) | Model OPs | - | - | [90] |
Noble Metal Nanomaterials
Gold nanoparticles (AuNPs) and related nanostructures are among the most widely used nanomaterials for signal amplification. Their utility stems from exceptional optical properties governed by localized surface plasmon resonance (LSPR). In lateral flow assays (LFAs), the aggregation of AuNPs induces a visible color shift from red to blue, providing a simple, naked-eye readout [93]. More advanced strategies exploit the LSPR effect under laser excitation to generate significantly stronger signals. These include:
- Surface-Enhanced Raman Scattering (SERS): When Raman reporter molecules are adsorbed onto roughened gold or silver surfaces (e.g., hollow gold NPs), their inelastic scattering signal can be enhanced by up to 10 orders of magnitude. This allows for ultra-sensitive and multiplexed detection, with demonstrated improvements in the limit of detection (LOD) by up to 10,000-fold compared to conventional LFAs [93].
- Photothermal Effect: The same LSPR properties enable efficient conversion of light to heat. The resulting photothermal signal can be quantified with a portable infrared camera, offering a highly sensitive and quantitative alternative to colorimetric measurements [93].
Carbon and Quantum Dot Nanomaterials
Carbon-based nanomaterials like graphene, carbon nanotubes (CNTs), and quantum dots (QDs) offer excellent electrical conductivity and large surface areas, making them ideal for electrochemical biosensors. They enhance sensitivity by facilitating electron transfer between the bioreceptor and the electrode surface and by providing a high-density platform for immobilizing enzymes or aptamers [88] [92]. For example, integrating these materials as electrode modifiers can lower the overpotential for electrochemical reactions and increase the electroactive surface area, leading to higher signal-to-noise ratios [91]. Quantum dots, with their size-tunable fluorescence and high quantum yield, serve as robust fluorescent tags that are superior to traditional organic dyes, thereby improving the sensitivity of fluorescence-based OP detection platforms [88].
Metal-Organic Frameworks (MOFs) and Hybrid Structures
Ionic metal-organic frameworks (IMOFs) represent a cutting-edge class of porous, crystalline materials that combine organic linkers with metal ions. Their high surface area, tunable porosity, and unique charge properties make them exceptional transducers and immobilization matrices. A recent study developed a portable biosensor using an amino-modified IMOF (NH₂-IMOF) [28]. The -NH₂ functional group imparts a stronger positive charge to the framework, enhancing electrostatic attraction for the immobilization of acetylcholinesterase (AChE). Furthermore, uncoordinated oxygen atoms and dimethylammonium groups within the framework form strong hydrogen bonds with the enzyme, stabilizing it and boosting biosensor performance. This synergy resulted in an exceptionally low detection limit of 1.24 × 10⁻¹³ M for glyphosate [28].
Experimental Protocols for Key Methodologies
Protocol: Fabrication of a Portable IMOF-Based Electrochemical Biosensor
This protocol details the construction of a highly sensitive, portable electrochemical biosensor for multiplex OP detection, based on the work of Wu et al. [28].
Research Reagent Solutions & Materials:
- Amino-modified IMOF (NH₂-IMOF): Serves as the core transducer and enzyme immobilization matrix.
- Acetylcholinesterase (AChE) Enzyme: Biorecognition element whose activity is inhibited by OPs.
- Chitosan (CS) Solution: Natural biopolymer used to form a stable hydrogel for embedding AChE and NH₂-IMOF.
- Screen-Printed Electrode (SPE) or NFC-Integrated Electrode: Platform for portable, on-site sensing.
- Phosphate Buffered Saline (PBS): Reaction buffer.
- Acetylthiocholine (ATCh): Substrate for AChE.
Step-by-Step Procedure:
- IMOF Synthesis and Functionalization: Synthesize the ionic metal-organic framework followed by post-synthetic modification with an amino group (-NH₂) to create the NH₂-IMOF.
- Biocomposite Preparation: Prepare a homogeneous suspension by thoroughly mixing 2 mg of NH₂-IMOF with 1 mL of 0.5% (w/v) chitosan solution. Add 0.2 U of AChE enzyme to the mixture and vortex gently to form the final biocomposite (NH₂-IMOF@CS@AChE).
- Electrode Modification: Deposit 5 µL of the NH₂-IMOF@CS@AChE biocomposite onto the working surface of a screen-printed electrode (SPE). Allow the modified electrode to dry overnight at 4°C to form a stable film.
- Electrochemical Measurement Setup: Connect the modified SPE to a portable potentiostat or a smartphone-based Near-Field Communication (NFC) module for battery-free, touchless operation.
- Assay Execution: Incubate the modified electrode with a sample solution (standard or unknown) for 10 minutes. OPs in the sample will inhibit the AChE enzyme.
- Signal Generation and Readout: Transfer the electrode to an electrochemical cell containing PBS and acetylthiocholine. Record the Differential Pulse Voltammetry (DPV) signal. The oxidation current of the enzymatic product (thiocholine) is inversely proportional to the OP concentration due to enzyme inhibition.
The following workflow diagram illustrates the biosensor fabrication and sensing mechanism:
Protocol: Smartphone-Based Fluorescence Biosensor for OP Detection
This protocol describes a fluorescence method for detecting OPs like malathion by inhibiting the enzyme alkaline phosphatase (ALP), adapted from a published smartphone-based approach [90].
Research Reagent Solutions & Materials:
- Alkaline Phosphatase (ALP) Enzyme: Biorecognition element inhibited by OPs.
- L-ascorbic acid 2-phosphate (AAP): Enzymatic substrate.
- o-phenylenediamine (OPD): Fluorogenic reagent.
- Custom Portable Fluorescence Device: Houses excitation light source and sample holder.
- Smartphone with RGB Analysis App: For signal capture and quantification.
Step-by-Step Procedure:
- Enzymatic Reaction Inhibition: In a microcentrifuge tube, mix a fixed concentration of ALP with the sample containing the target OP (e.g., malathion). Incubate for 15 minutes. The OP will inhibit ALP activity.
- Fluorophore Generation: Add the substrate AAP to the mixture. The active ALP hydrolyzes AAP to produce ascorbic acid (AA). Subsequently, add OPD, which reacts specifically with AA to form the highly fluorescent compound DFQ.
- Signal Measurement: Transfer the reaction solution to a cuvette or a microfluidic chip compatible with the portable fluorescence device. Illuminate with the appropriate excitation wavelength and use the smartphone camera to capture the fluorescence emission image.
- Data Analysis: A dedicated smartphone application instantly converts the captured image into the RGB color model. The intensity of the relevant color channel (e.g., blue for DFQ fluorescence) is quantified. The intensity is proportional to ALP activity and, thus, inversely proportional to the OP concentration.
The diagram below outlines the signaling pathway and detection principle:
The Scientist's Toolkit: Essential Research Reagents
Table 2: Key Research Reagent Solutions for Nanomaterial-Enhanced OP Biosensing
| Reagent / Material | Function in the Experiment | Key Characteristics |
|---|---|---|
| Amino-modified IMOF | Transducer and enzyme support matrix | Enhances electron transfer, provides high surface area, improves enzyme immobilization via electrostatic and hydrogen bonding. |
| Acetylcholinesterase (AChE) | Biorecognition element | Enzyme whose hydrolysis of substrates (e.g., ATCh) is selectively inhibited by OPs, forming the basis of detection. |
| Alkaline Phosphatase (ALP) | Biorecognition element | Enzyme used in alternative inhibition assays; catalyzes conversion of AAP to AA for fluorogenic reaction. |
| Gold Nanoparticles (AuNPs) | Optical label / Signal amplifier | Exhibits strong LSPR for colorimetric detection; can be used in SERS and photothermal modes for extreme sensitivity. |
| Chitosan (CS) | Immobilization matrix | Biocompatible polymer forming a hydrogel to entrap and stabilize enzymes on the sensor surface. |
| Screen-Printed Electrodes (SPE) | Portable sensing platform | Disposable, low-cost, mass-producible electrodes ideal for field-deployable electrochemical devices. |
Benchmarking Performance: Analytical Validation and Comparative Analysis with Gold Standards
The need for robust, field-deployable tools for monitoring organophosphate (OP) pesticides is driven by their extensive use in agriculture and associated risks to human health and environmental safety. Traditional analytical techniques, such as gas chromatography-mass spectrometry (GC-MS) and high-performance liquid chromatography (HPLC), are characterized by high costs, complex operation, and lack of portability, confining them to centralized laboratories [67] [29]. Electrochemical biosensors have emerged as a promising alternative, offering the potential for rapid, sensitive, and on-site analysis. For researchers and development professionals, a critical evaluation of these biosensors hinges on understanding four key performance metrics: the Limit of Detection (LOD), the Linear Range, Selectivity, and Reproducibility. This document synthesizes recent advancements in portable biosensors for OP detection, providing a structured comparison of these metrics and detailed protocols to guide research and development.
Performance Metrics of Portable Biosensors for OP Detection
The following table summarizes the key performance metrics reported for a selection of portable biosensing platforms for organophosphate pesticides. The data highlights the diversity in transducer principles, biological recognition elements, and their resultant analytical figures of merit.
Table 1: Key Performance Metrics of Portable Biosensors for Organophosphate Pesticide Detection
| Biosensor Platform / Transducer | Biorecognition Element | Target Analyte(s) | Linear Range | Limit of Detection (LOD) | Reproducibility (RSD) | Selectivity Demonstration |
|---|---|---|---|---|---|---|
| Smartphone/Resistive Nanosensor [67] | Acetylcholinesterase (AChE) | Paraoxon-Methyl | 1 ppt – 100 ppb | 0.304 ppt | < 5% | Not explicitly stated |
| Ionic Metal-Organic Framework (IMOF) Electrochemical Biosensor [28] | Acetylcholinesterase (AChE) | Glyphosate | 1×10⁻¹⁵ M – 1×10⁻⁹ M | 1.24×10⁻¹³ M | Not specified | Distinguished multiple OPs via unique DPV signals |
| Potentiometric Biosensor (SDP) [18] | Acetylcholinesterase (AChE) | Diazinon, Profenofos | Not fully specified | 10⁻⁷ mg L⁻¹ (for both) | Not specified | Selectivity coefficient -1 < Kᵢ,ⱼ < 1 |
| Personal Glucose Meter (PGM)-Based Sensor [9] [83] | Cholinesterase (ChE) | Mevinphos, Carbofuran | Not fully specified | 0.138 ppm (Mevinphos), 0.113 ppm (Carbofuran) | Strong correlation (R > 0.99) in fortified samples | Inherent to ChE inhibition mechanism |
| Electrochemical µ-Device (EµAD) with MOF [84] | Acetylcholinesterase (AChE) | Chlorpyrifos | 10 – 100 ng L⁻¹ | 6 ng L⁻¹ | Not specified | Successful detection in real vegetable samples |
| Organophosphate Hydrolase (OPH)-Based Biosensor [51] | Organophosphate Hydrolase (OPH) | Multiple OPs | 0.1 – 100 ng mL⁻¹ | Implied from linear range | Not specified | Inherent to OPH catalytic mechanism |
| Paper-Based Colorimetric Sensor [17] | Acetylcholinesterase (AChE) | Malathion | Not fully specified | 2.5 ppm | Stable for 60 days at 4°C | Inherent to AChE inhibition mechanism |
Experimental Protocols for Key Biosensor Architectures
Protocol: Smartphone-Integrated Resistive Biosensor
This protocol details the fabrication and measurement process for a chitosan/AChE/PAnNF/CNT nanocomposite-based resistive biosensor integrated with a smartphone [67].
Research Reagent Solutions:
- Acetylcholinesterase (AChE): Biological recognition element that hydrolyzes acetylcholine.
- Polyaniline Nanofibers (PAnNFs): Conducting polymer; its doping state changes with local pH, transducing the biochemical signal.
- Carbon Nanotubes (CNTs): Nanomaterial used to enhance electron transfer and sensor conductivity.
- Chitosan: A biopolymer used to form a hydrogel matrix for enzyme entrapment and prevention of enzyme leakage.
- Acetylcholine (ACh): Enzyme substrate; its hydrolysis produces protons, doping the PAnNFs.
- Gold Interdigitated Electrodes (AuIDEs): Transducer platform with a large surface area for sensitive resistive measurements.
Procedure:
- Electrode Preparation: Clean AuIDEs by sonication in acetone followed by ultrapure water for 15 minutes each. Dry under vacuum.
- Sensor Fabrication: a. Attach a Parafilm template with a 2.5 mm diameter hole to define the sensing area. b. Treat the exposed surface with 10 µL of 0.002% Tween-20 for 15 minutes, then rinse and dry. c. Drop-cast 4 µL of a pre-sonicated CNT/PAnNF suspension onto the sensor surface and air-dry. d. Immobilize 2 µL of AChE solution onto the CNT/PAnNF layer. e. Drop-cast 2 µL of chitosan solution to encapsulate the enzyme and prevent leakage. Air-dry in a desiccator at 4°C.
- Pad Preparation: Pre-load glass fiber (GF) pads (2.5 mm diameter) with substrate (ACh) and pre-treatment reagents (e.g., EDTA, pH buffer), then dry and store in a desiccator.
- Measurement: a. Place the pre-treatment pad on the sensor and add the sample. b. After a brief interval, place the ACh-loaded signal generation pad on the sensor. c. Connect the sensor to a portable digital multimeter. d. Measure the conductance change via a smartphone app, which records, analyzes, and displays the data. The signal decrease is proportional to OP concentration due to AChE inhibition.
Protocol: Personal Glucose Meter (PGM)-Based Sensor
This protocol adapts ubiquitous PGM technology for the detection of cholinesterase activity and its inhibition by OPs [9] [83].
Research Reagent Solutions:
- Cholinesterase (ChE): Enzyme from blood or other sources (e.g., cricket); its activity is inhibited by OPs and carbamates.
- Acetylthiocholine (ATCh): Artificial substrate for ChE; hydrolysis produces thiocholine.
- Personal Glucose Meter (PGM): Off-the-shelf device that measures thiocholine oxidation via its built-in electrochemical cell.
- Phosphate Buffered Saline (PBS): Provides a stable pH environment for the enzymatic reaction.
Procedure:
- Sample Preparation: For blood analysis, dilute whole blood 1:10 with PBS (pH 8.0).
- Assay Setup: a. Test Reaction: Mix 50 µL of sample (e.g., diluted blood), 125 µL PBS, and 25 µL of ATCh (e.g., 15 mM). Incubate at 25°C for 5-15 minutes. b. Sample Blank: Mix 50 µL of sample with 150 µL PBS. c. Reagent Blank: Mix 175 µL PBS with 25 µL of ATCh.
- PGM Measurement: Apply a portion of the test reaction mixture to a standard PGM test strip and record the glucose readout (in mg/dL). This readout is proportional to the thiocholine produced, which correlates with ChE activity.
- Data Calculation: Calculate the corrected PGM readout using the formula: Corrected PGM readout (mg/dL) = Measured result - Sample blank - Reagent blank A lower corrected readout indicates higher inhibition of ChE by OPs or carbamates in the sample.
Signaling Pathways and Workflows
Acetylcholinesterase Inhibition Pathway
The following diagram illustrates the fundamental biochemical principle of enzyme inhibition-based detection of organophosphate pesticides.
Integrated Smartphone Biosensor Workflow
This workflow outlines the operational steps for using an integrated smartphone/resistive biosensor from sample application to result acquisition.
The Scientist's Toolkit: Essential Research Reagents
The development and operation of portable biosensors for OP detection rely on a core set of reagents and materials, as detailed below.
Table 2: Essential Research Reagents for Portable OP Biosensors
| Reagent/Material | Function in the Biosensing System | Example Applications in Cited Research |
|---|---|---|
| Acetylcholinesterase (AChE) | Primary biological recognition element; its inhibition by OPs is the basis for signal generation. | Used in smartphone/resistive sensor [67], potentiometric SDP sensor [18], and paper-based sensor [17]. |
| Organophosphate Hydrolase (OPH) | Catalytic biorecognition element; directly hydrolyzes OPs, often leading to a proportional signal. | Employed in a portable device for direct, proportional detection of OPs [51]. |
| Acetylthiocholine (ATCh) | Artificial enzyme substrate; hydrolysis by AChE produces thiocholine, which is electrochemically active. | Key substrate in PGM-based sensor [9] [83] and EµAD protocol [84]. |
| Screen-Printed Electrodes (SPEs) | Disposable, low-cost, mass-producible electrochemical transducers ideal for field use. | Highlighted as prevalent in point-of-care diagnostics and used in PGM adaptations [9] [29]. |
| Metal-Organic Frameworks (MOFs) | Nano-porous materials used to immobilize enzymes; provide high surface area and a protective environment, enhancing stability and sensitivity. | Zinc-based MOF used in EµAD for chlorpyrifos detection [84]. Amino-modified IMOF used in electrochemical biosensor [28]. |
| Carbon Nanotubes (CNTs) | Nanomaterials used to modify electrodes; enhance electron transfer, increase surface area, and improve sensor conductivity and sensitivity. | Integrated with polyaniline nanofibers in the resistive nanosensor [67]. |
| Personal Glucose Meter (PGM) | Commercial, portable electrochemical platform adapted for detecting non-glucose targets (e.g., thiocholine) via enzyme-coupled assays. | Core transducer in a thiocholine-based sensor for blood ChE activity and pesticides [9] [83]. |
The development of any new analytical method, particularly for detecting hazardous compounds like organophosphorus pesticides (OPs), is incomplete without rigorous validation to ensure its accuracy and reliability in real-world scenarios. For a thesis focused on portable biosensors for on-site organophosphate detection, recovery studies in real samples represent a critical cornerstone, demonstrating the method's performance outside of controlled laboratory conditions. These studies are indispensable for proving that the biosensor can accurately quantify analyte concentrations in the presence of complex sample matrices, which may contain interfering substances that affect the analytical signal. Organophosphorus pesticides are extensively used in agriculture worldwide, and their detection in food and environmental samples is crucial for food safety and regulatory compliance [94]. The transition from conventional laboratory techniques to portable biosensing platforms necessitates even more stringent recovery validation to build confidence in the results produced at the point of need. This document outlines the principles, protocols, and key considerations for conducting recovery studies to validate the accuracy of analytical methods across food, environmental, and clinical matrices, with a specific focus on applications within organophosphate detection research.
Principles of Recovery Studies
Definition and Importance
A recovery study, in analytical chemistry, involves determining the efficiency with which an analytical method can extract and quantify an analyte from a specific sample matrix. It is expressed as a percentage and calculated by comparing the measured concentration of the analyte to the known concentration that was intentionally added to the sample. The formula for calculating percent recovery is:
Recovery (%) = (Measured Concentration / Fortified Concentration) × 100
The primary purpose of a recovery experiment is to validate the accuracy of an analytical method and identify any potential matrix effects—the influence of other components in the sample on the quantification of the target analyte. These effects can cause signal suppression or enhancement, leading to inaccurate results [95]. For portable biosensors, which often forego extensive sample preparation, understanding and compensating for matrix effects is paramount. Proper recovery validation supports the method's fitness-for-purpose, ensuring it meets the required standards for sensitivity, reliability, and applicability to real samples [96].
Guidelines and Acceptance Criteria
International guidelines provide frameworks for method validation, including recovery criteria. The SANTE guidelines, a key document for pesticide residue analysis, typically specify acceptable recovery ranges between 70% and 120%, with relative standard deviations (RSD) that should be ≤20% [97]. These criteria may vary slightly depending on the analyte concentration and the complexity of the matrix. Recovery studies must be performed at multiple fortification levels to demonstrate method accuracy across the dynamic range. Adherence to these guidelines is fundamental for methods intended for regulatory compliance, as it provides evidence that the results are trustworthy and defensible.
Recovery Studies in Food Matrices
Challenges and Considerations
Food matrices are exceptionally complex and varied, presenting unique challenges for analytical methods. The high water, acid, starch, protein, or fat content in different foods can significantly interfere with analyte detection [95]. For instance, matrix effects are a well-documented phenomenon in chromatographic methods, where co-extracted compounds can enhance or suppress the analyte signal [95]. This is equally relevant for biosensors, where matrix components may foul the sensing surface or inhibit enzymatic reactions. The QuEChERS method is widely adopted for sample preparation in multi-residue pesticide analysis due to its effectiveness in mitigating these interferences [94]. For portable biosensors, which prioritize minimal sample preparation, optimizing a simple and effective clean-up step is often essential to achieve satisfactory recovery rates.
Protocol: Recovery Study for OPs in Animal-Derived Foods using LC-MS/MS
The following protocol, adapted from a study on detecting OPs in animal-derived foods, provides a robust template for recovery validation [97].
1. Sample Preparation (Modified QuEChERS):
- Homogenization: Homogenize the food sample (e.g., beef, pork, chicken, milk, eggs).
- Fortification: Weigh 2 g of the homogenized sample into a centrifuge tube. Fortify with a known volume of a standard OP solution to achieve the desired concentration levels (e.g., 0.01, 0.05, and 0.1 mg/kg).
- Extraction: Add 10 mL of an extraction solvent (a mixture of acetonitrile and acetone). Vortex vigorously for 1 minute.
- Partitioning: Add a salt mixture (e.g., MgSO₄ and NaCl) to induce phase separation. Shake and centrifuge.
- Clean-up: Transfer the supernatant to a dSPE tube containing clean-up sorbents (e.g., MgSO₄, PSA, and C18). Vortex and centrifuge. The cleaned extract is then ready for analysis.
2. Analysis: Analyze the fortified samples alongside blank samples and calibration standards using the validated LC-MS/MS method or the portable biosensor.
3. Data Calculation: Calculate the recovery percentage for each fortification level using the formula provided in Section 2.1.
Key Findings from Literature: This protocol achieved recovery efficiencies ranging from 71.9% to 110.5% with standard deviations from 0.2% to 12.5%, successfully meeting the SANTE guideline criteria [97].
Quantitative Recovery Data in Food Matrices
The table below summarizes recovery data for organophosphate detection from various studies, illustrating performance across different matrices and methods.
Table 1: Recovery Data for Organophosphate Detection in Food Matrices
| Matrix | Analytes | Sample Preparation | Analytical Technique | Recovery Range (%) | Reference |
|---|---|---|---|---|---|
| Animal-derived foods (beef, pork, chicken, milk, eggs) | 27 OPs | Modified QuEChERS (acetonitrile/acetone, dSPE) | LC-MS/MS | 71.9 - 110.5 | [97] |
| Various fruits and vegetables | Multiple OPs | QuEChERS | GC-MS/MS, LC-MS/MS | 77 - 119 | [98] |
| Pumpkin and Rice | Malathion (model OP) | Minimal preparation for biosensor | Distance-based Paper Biosensor | 93 - 103 | [70] |
Recovery Studies in Environmental and Clinical Matrices
Environmental Water Samples
Monitoring OPs in aquatic environments is critical for assessing pollution and ecological risk. The primary challenge is the typically low concentration of pesticides, requiring highly sensitive methods. Furthermore, dissolved organic matter and salts in water can interfere with detection.
- Protocol Highlights for Water:
- Sample Collection: Collect water samples in clean glass or plastic containers, preserving them if necessary.
- Fortification: Spike water samples with OP standards at relevant concentrations (e.g., ng/L to μg/L).
- Extraction/Pre-concentration: For biosensors with insufficient sensitivity, a pre-concentration step such as solid-phase extraction (SPE) or liquid-liquid extraction may be required.
- Analysis: Analyze using the biosensor. Recovery rates should be assessed against a pure solvent standard to evaluate matrix effects.
Clinical/Biological Matrices
Detecting OPs and their metabolites in biological matrices (e.g., blood, urine, hair) is essential for forensic and clinical toxicology. These matrices are highly complex, with high levels of proteins, lipids, and salts.
- Protocol Highlights for Biological Matrices (e.g., Blood, Urine):
- Sample Preparation: Proteins must often be precipitated. For blood, this can be achieved by adding acetonitrile or methanol, followed by centrifugation.
- Fortification: Spike the biological fluid with the analyte of interest.
- Extraction: Techniques like solid-phase microextraction (SPME) or liquid-liquid extraction (LLE) are commonly used to isolate the analyte from the matrix [99].
- Analysis: Analyze the extract. Recovery studies in forensic toxicology have utilized techniques like GC-MS/MS and LC-MS/MS, demonstrating high sensitivity and specificity [99].
Experimental Protocols for Biosensor Recovery Studies
Protocol: Recovery Study using a Distance-Based Paper Biosensor
This protocol details a recovery study for a novel, instrument-free biosensor, highlighting a methodology highly applicable to portable platforms [70].
1. Principle: The biosensor operates on enzyme inhibition. Acetylcholinesterase (AChE) hydrolyzes acetylthiocholine (ATCh) to produce thiocholine, which disrupts a copper alginate (Cu-Alg) hydrogel, releasing water that flows on a paper strip. When OPs inhibit AChE, less water is released, and the flow distance decreases, providing a quantitative measure of OP concentration.
2. Reagents and Materials:
- Acetylcholinesterase (AChE)
- Acetylthiocholine (ATCh)
- Sodium alginate
- Cupric chloride (CuCl₂)
- pH paper strips
- PVC board
- OP standard (e.g., Malathion)
- Real food samples (e.g., pumpkin, rice)
3. Procedure:
- Sample Preparation: Homogenize the food sample. A simple extraction with a buffer or solvent may be performed.
- Fortification: Spike the sample extract with a known concentration of the OP standard.
- Biosensor Assay:
- Pre-incubate AChE with the fortified sample extract for a set time (e.g., 10-30 min).
- Mix the inhibited AChE with ATCh and the Cu-Alg hydrogel.
- Incubate the mixture for a fixed time (e.g., 10 min).
- Place the mixture onto the pH paper strip affixed to the PVC board.
- Measure the water flow distance after a fixed time.
- Calibration: Perform the same assay with standard OP solutions of known concentration to create a calibration curve (flow distance vs. log concentration).
- Calculation: The concentration of OP in the fortified sample is determined from the calibration curve. The recovery percentage is then calculated.
4. Key Results: This biosensor method achieved excellent recoveries of 93% to 103% in pumpkin and rice samples, demonstrating its high accuracy for on-site food testing [70].
Workflow Visualization: Biosensor Recovery Study
The following diagram illustrates the logical workflow and signaling pathway of the enzyme inhibition-mediated biosensor used in the recovery protocol.
Diagram 1: Signaling pathway and workflow for an enzyme inhibition-based biosensor recovery assay. The presence of organophosphate (OP) inhibits acetylcholinesterase (AChE), reducing thiocholine production and subsequent water flow, which is the measured signal.
The Scientist's Toolkit: Key Research Reagent Solutions
The table below lists essential reagents and materials critical for conducting recovery studies in organophosphate detection, particularly with biosensor applications.
Table 2: Essential Research Reagents for Organophosphate Recovery Studies
| Reagent/Material | Function/Application | Key Considerations |
|---|---|---|
| Acetylcholinesterase (AChE) | Core biorecognition element in enzyme inhibition-based biosensors. Hydrolyzes substrate to produce signal. | Enzyme purity, specific activity, and stability are crucial for assay reproducibility and sensitivity. |
| Acetylthiocholine (ATCh) | Enzymatic substrate for AChE. Produces thiocholine upon hydrolysis. | Serves as the precursor to the compound that generates the detectable signal (e.g., in optical or electrochemical sensors). |
| Organophosphate Standards | Used for method calibration and sample fortification in recovery studies. | High-purity certified reference materials are essential for accurate quantification. |
| QuEChERS Kits | Sample preparation for complex food matrices. Involves extraction and dispersive solid-phase clean-up. | Select kits based on matrix type (e.g., high water, acid, or fat content) to optimize recovery and reduce matrix effects [94] [95]. |
| dSPE Sorbents (e.g., PSA, C18) | Used in QuEChERS clean-up to remove interfering compounds like fatty acids, sugars, and pigments. | PSA is effective for organic acids and sugars; C18 is effective for lipids [97]. |
| Matrix-Matched Calibration Standards | Calibration standards prepared in a blank sample extract to compensate for matrix effects. | Critical for achieving accurate quantification in GC-MS/MS and LC-MS/MS, and a key consideration for biosensor calibration [95]. |
Recovery studies are a non-negotiable component of analytical method validation, providing the critical data needed to prove a method's accuracy and reliability when applied to real-world samples. For the field of portable biosensing in organophosphate detection, successfully conducting these studies in complex food, environmental, and clinical matrices demonstrates the technology's practical utility and readiness for deployment. The protocols and data presented herein, drawn from current literature, provide a framework for validating new biosensor platforms. By adhering to established guidelines, carefully selecting sample preparation methods, and thoroughly investigating matrix effects, researchers can generate robust validation data that bridges the gap between laboratory innovation and on-field application, ultimately contributing to enhanced food safety, environmental monitoring, and public health.
The detection of organophosphate pesticides (OPPs) is critical in forensic, environmental, and food safety contexts due to their high toxicity and widespread use. Traditional laboratory techniques such as High-Performance Liquid Chromatography (HPLC), Gas Chromatography-Mass Spectrometry (GC-MS), and Liquid Chromatography-Tandem Mass Spectrometry (LC-MS/MS) are considered gold standards for sensitive and accurate OPP identification [99] [100]. However, their operational complexity, cost, and lack of portability limit their use for on-site, rapid screening [101] [8]. In response, portable biosensors have emerged as a promising alternative, offering instrument-free, cost-effective detection suited for field applications [70]. This application note provides a comparative analysis of these technologies, focusing on their operational principles, performance metrics, and practical applicability for OPP detection, framed within the context of advancing portable biosensor research.
Technology Comparison: Performance Metrics and Characteristics
The following tables summarize the key quantitative and qualitative parameters of OPP detection technologies, highlighting the complementary strengths of laboratory-based and portable field-based methods.
Table 1: Quantitative Performance Metrics of OPP Detection Technologies
| Technology | Typical Limit of Detection (LOD) | Analysis Time | Sample Throughput | Multiplexing Capability |
|---|---|---|---|---|
| Portable Biosensors (e.g., Paper-based) | ~18 ng/mL (for Malathion) [70] | Minutes (< 30 min) [70] | Low to Moderate | Low [101] |
| HPLC | Varies by compound and detector [99] | 30 minutes to several hours [100] | Moderate | Moderate |
| GC-MS / LC-MS/MS | High sensitivity (precise LOD method-dependent) [99] | 30 minutes to several hours (incl. sample prep) [100] | High with automation | High [99] |
Table 2: Operational Characteristics of OPP Detection Technologies
| Characteristic | Portable Biosensors | HPLC | GC-MS / LC-MS/MS |
|---|---|---|---|
| Portability | High [101] | Low (Benchtop) [102] | Low (Benchtop) [103] |
| Cost | Low (device and operation) [8] | High (equipment and maintenance) [100] | Very High (equipment, maintenance, and skilled operation) [99] [100] |
| Ease of Use | Simple, minimal training [70] | Requires trained technician [100] | Requires highly trained analyst [99] |
| Quantification | Semi-quantitative to Quantitative | Fully Quantitative [99] | Fully Quantitative [99] |
| Data Robustness | Qualitative to Semi-Quantitative; suitable for screening [101] | High accuracy and reproducibility [99] | Very high accuracy, specificity, and reproducibility [99] |
| Primary Use Case | On-site rapid screening, point-of-care testing [101] | Laboratory quantification and confirmation [99] | Laboratory confirmation, trace analysis, and metabolomic studies [99] [104] |
| Sample Prep Complexity | Minimal (e.g., filtration, dilution) [70] | Moderate to High (e.g., extraction, purification) [99] | High (requires sophisticated extraction and cleanup) [99] |
Experimental Protocols
Protocol for OPP Detection Using an Enzyme Inhibition-Mediated Distance-Based Paper (EIDP) Biosensor
This protocol is adapted from a recent study detailing a biosensor for detecting malathion in food samples [70].
Principle: The assay is based on the inhibition of acetylcholinesterase (AChE) by OPPs. In a positive reaction, active AChE hydrolyzes acetylthiocholine (ATCh) to produce thiocholine, which interacts with a copper-alginate (Cu-Alg) hydrogel, disrupting its structure and releasing trapped water. The water flows along a pH paper strip, and the distance traveled is measured. When AChE is inhibited by OPPs, less thiocholine is produced, the hydrogel remains intact, and water flow is reduced. The reduction in flow distance is proportional to the OPP concentration [70].
Materials & Reagents:
- Acetylcholinesterase (AChE) from Electrophorus electricus
- Acetylthiocholine (ATCh)
- Sodium alginate
- Cupric chloride (CuCl₂)
- Tris-HCl buffer
- pH paper strips
- Polyvinyl chloride (PVC) board
- Food samples (e.g., pumpkin, rice)
Procedure:
- Biosensor Assembly: Cut pH paper to 60 mm x 5 mm and affix it to a PVC board.
- Hydrogel Preparation: Synthesize the Cu-Alg hydrogel by mixing 0.2% (w/v) sodium alginate with 1.5-2.0 mM CuCl₂.
- Sample Pre-incubation: Incubate AChE (0.06 U/mL) with the standard or pre-treated food sample for 20-30 minutes to allow OPPs to inhibit the enzyme.
- Enzymatic Reaction: Add ATCh (3 mM) to the pre-incubated mixture and allow it to react for 10 minutes.
- Detection: Place the final reaction mixture onto the Cu-Alg hydrogel, then deposit the hydrogel at the origin of the pH paper strip.
- Measurement: Allow the sample to migrate for a fixed time and measure the distance of water flow on the pH paper.
- Quantification: Compare the flow distance to a calibration curve generated with OPP standards to determine the concentration in the sample.
Protocol for OPP Detection Using LC-MS/MS
This protocol outlines the standard methodology for confirmatory analysis of OPPs in biological or environmental matrices, as referenced in systematic reviews [99].
Principle: OPPs are extracted from the sample matrix, separated using liquid chromatography, and then ionized. The mass spectrometer filters and detects specific ion fragments from each OPP, providing highly sensitive and selective quantification [99] [100].
Materials & Reagents:
- LC-MS/MS system
- C18 reversed-phase analytical column
- Methanol, Acetonitrile (HPLC grade)
- Formic acid or Ammonium acetate
- OPP analytical standards
- QuEChERS or Solid-Phase Extraction (SPE) kits for cleanup
Procedure:
- Sample Extraction: Homogenize the sample. Extract OPPs using an appropriate solvent (e.g., acetonitrile) via shaking or vortexing.
- Sample Cleanup: Purify the extract using a technique such as QuEChERS or SPE to remove interfering matrix components.
- Chromatographic Separation: Inject the purified extract into the LC system. Elute OPPs using a gradient of water and organic solvent (e.g., methanol or acetonitrile), often with a volatile buffer modifier.
- Mass Spectrometric Detection: Analyze the eluent using MS/MS in Multiple Reaction Monitoring (MRM) mode. Quantify OPPs by comparing the peak areas of samples to those of external standards with known concentrations.
Visualized Workflows and Signaling Pathways
EIDP Biosensor Workflow and Mechanism
The following diagram illustrates the operational principle and procedural steps of the Enzyme Inhibition-Mediated Distance-Based Paper biosensor.
AChE Inhibition Signaling Pathway by OPPs
This diagram details the biochemical pathway of acetylcholinesterase inhibition by organophosphates, which is the foundational principle for many biosensors.
The Scientist's Toolkit: Key Research Reagent Solutions
This table lists essential reagents and materials for developing and operating enzyme inhibition-based biosensors for OPP detection, as derived from the cited protocols [8] [70].
Table 3: Essential Reagents for Enzyme Inhibition-Based OPP Biosensing
| Reagent/Material | Function in Experiment | Typical Specification / Notes |
|---|---|---|
| Acetylcholinesterase (AChE) | Biological recognition element; its inhibition by OPPs is the core detection mechanism. | Source (e.g., Electrophorus electricus); specific activity (e.g., 0.06 U/mL in assay) [70]. |
| Acetylthiocholine (ATCh) | Enzyme substrate. Hydrolyzed by AChE to produce thiocholine. | Concentration optimized (e.g., 3 mM) to ensure sufficient signal generation [70]. |
| Copper Chloride (CuCl₂) | Component of the transducer system. Cu²⁺ ions interact with thiocholine to disrupt the hydrogel. | Used at specific concentrations (e.g., 1.5-2.0 mM) for optimal gel formation and reactivity [70]. |
| Sodium Alginate | Polymer for forming the hydrogel matrix that traps water. | Purified grade; concentration critical for viscosity (e.g., 0.2% w/v) [70]. |
| pH Paper / Chromatography Paper | Platform for the distance-based measurement; enables capillary flow. | Specific dimensions (e.g., 60mm x 5mm); unmodified [70]. |
| Tris-HCl Buffer | Provides a stable pH environment for the enzymatic reaction. | Common biological buffer, pH typically 7.0-8.0 [70]. |
| Enzyme Inhibitors (e.g., 2-PAM) | Used as control reagents to validate the inhibition mechanism and assay performance. | 2-PAM is a known reactivator of OPP-inhibited AChE [70]. |
This comparative analysis underscores a clear technological synergy: portable biosensors are unparalleled for rapid, on-site screening of OPPs, while traditional chromatographic and spectrometric methods remain indispensable for laboratory-based confirmation and precise quantification. The future of OPP detection lies in the continued development of robust, sensitive, and intelligent biosensors, potentially integrated with AI for data analysis [105], which will enhance field-deployment capabilities. For comprehensive analysis, a hybrid approach is recommended, using biosensors for initial field screening and HPLC-MS/MS for definitive confirmation in the laboratory.
The development of robust, sensitive, and portable biosensors for the on-site detection of organophosphate (OP) pesticides is of paramount importance for safeguarding environmental and public health. The core of any biosensor is its biorecognition element, which dictates the sensor's specificity, sensitivity, and operational stability. This application note provides a systematic evaluation of the four primary classes of bioreceptors—enzymes, antibodies, aptamers, and whole cells—within the context of portable biosensor design for OP detection. We summarize their key characteristics in a comparative table, detail specific experimental protocols for their implementation, list essential research reagents, and visualize their underlying sensing mechanisms.
Comparative Analysis of Bioreceptors
The selection of a bioreceptor is a critical first step in biosensor design. Table 1 provides a quantitative comparison of the four bioreceptor types, highlighting their performance in OP detection.
Table 1: Comparative Performance of Bioreceptors for Organophosphate Detection
| Bioreceptor | Detection Principle | Key Analytes | Sensitivity (LoD) | Assay Time | Pros | Cons |
|---|---|---|---|---|---|---|
| Enzymes (e.g., AChE, OPH) | Inhibition (AChE) or Catalytic degradation (OPH) | Chlorpyrifos, paraoxon, malathion [19] [106] | ~10⁻⁷ to 10⁻⁹ M [18] | 5 - 30 min [17] | High catalytic activity, well-understood mechanism [106] | Limited to enzyme inhibitors, susceptible to environmental conditions [106] |
| Antibodies | Immunoassay (Antigen-Antibody binding) | Specific OP compounds [19] | High (varies by assay) [107] | 30+ min | Exceptional specificity and affinity [108] [107] | Difficult to produce against small molecules, batch-to-batch variation, costly [108] |
| Aptamers | Conformational change upon target binding | Diverse OPs and micropollutants [109] | High (pM-nM range) [110] | Rapid (min) [110] | Chemical stability, ease of modification, in vitro production [108] [109] | Susceptibility to nuclease degradation (RNA), SELEX process can be complex [108] |
| Whole Cells | Whole-cell metabolism or enzymatic activity | Broad-spectrum OP compounds | Moderate | Can be slow (hrs) | Provides toxicological data, robust | Long response time, complex to maintain in biosensor [19] |
Experimental Protocols for Bioreceptor Implementation
Protocol 1: Acetylcholinesterase (AChE)-Based Potentiometric Biosensor
This protocol details the construction of a portable potentiometric biosensor for OPs using AChE inhibition, adapted from a study that achieved a detection limit of 10⁻⁷ mg L⁻¹ for diazinon [18].
Workflow Overview:
Materials & Reagents:
- Working Electrode: Gold (Au) electrode.
- Reference Electrode: Ag/AgCl electrode.
- Bioreceptor: Acetylcholinesterase (AChE) from Electrophorus electricus.
- Immobilization Matrix: Cellulose Acetate (CA) 15% (w/v) in acetone; Glutaraldehyde (GA) 25% (v/v).
- Substrate: Acetylthiocholine chloride (ATCl), 10⁻³ M in phosphate buffer (PB, pH 8.0).
- Analyte: Standard solutions of OP pesticides (e.g., diazinon, profenofos) in ethanol/water.
Procedure:
- Electrode Preparation: Clean the Au electrode surface thoroughly.
- Membrane Formation: Dip the Au electrode into a 15% (w/v) CA solution in acetone to form a thin membrane. Rinse with distilled water.
- Cross-linking: Immerse the CA-coated electrode in a 25% (v/v) glutaraldehyde solution for 6 hours. Rinse with distilled water and PB (pH 8.0). This creates the enzyme immobilization matrix (Em).
- Enzyme Immobilization: Incubate the Em electrode in an AChE enzyme solution for 2 x 24 hours at 4°C to immobilize the enzyme via cross-linking.
- Baseline Measurement: Immerse the biosensor (working and reference electrodes) in PB (pH 8.0) for 10 min. Transfer to a 10⁻³ M ATCl solution and measure the stable potentiometric baseline signal (E_baseline) using a portable potentiometer.
- Inhibition Step: Rinse the biosensor and immerse it in the sample/standard OP solution for 30 minutes. OPs will inhibit the immobilized AChE.
- Post-Inhibition Measurement: Rinse the biosensor and measure the potential (Einhibition) again in the 10⁻³ M ATCl solution. The difference in potential (ΔE = Ebaseline - E_inhibition) is proportional to the OP concentration.
- Calibration: Construct a calibration curve by plotting ΔE against the logarithm of known OP concentrations.
Protocol 2: Aptamer-Based Electrochemical Biosensor
This protocol outlines the general steps for developing an electrochemical aptasensor, leveraging the conformational change of an aptamer upon binding its target [110].
Workflow Overview:
Materials & Reagents:
- Working Electrode: Gold (Au) or screen-printed carbon electrode.
- Bioreceptor: Thiol- or amino-modified DNA/RNA aptamer specific to the target OP.
- Chemical Linkers: MPA (3-Mercaptopropionic acid) or similar for creating a self-assembled monolayer (SAM).
- Signal Probe: e.g., Methylene Blue or Ferrocene for redox-based detection.
Procedure:
- Electrode Pretreatment: Clean and polish the working electrode according to standard electrochemical practices.
- Aptamer Immobilization:
- For Au electrodes, incubate with the thiol-modified aptamer solution to form a self-assembled monolayer via Au-S bonds.
- Alternatively, the electrode surface can be first functionalized with a SAM (e.g., MPA), followed by covalent attachment of an amino-modified aptamer using EDC/NHS chemistry.
- Blocking: Treat the electrode surface with a blocking agent (e.g., 6-mercapto-1-hexanol for Au surfaces or BSA) to minimize non-specific binding.
- Target Binding: Incubate the functionalized electrode with the sample containing the target OP for a defined period (e.g., 15-30 minutes).
- Signal Measurement:
- Electrochemical Impedance Spectroscopy (EIS): Measure the electron transfer resistance (Rₑₜ) in a solution containing a redox probe (e.g., [Fe(CN)₆]³⁻/⁴⁻). Aptamer-OP binding often increases Rₑₜ, which is quantified.
- Differential Pulse Voltammetry (DPV): If the aptamer is labeled with a redox tag (e.g., Ferrocene), measure the current change before and after target binding. The binding-induced conformational change alters the distance between the tag and the electrode, modulating the current signal.
- Quantification: Relate the change in impedance or current to the concentration of the target OP using a calibration curve.
The Scientist's Toolkit: Essential Research Reagents
Successful development and deployment of these biosensors rely on key reagents and materials. Table 2 lists critical components for assembling OP detection biosensors.
Table 2: Essential Research Reagents for Biosensor Development
| Reagent/Material | Function | Example Applications |
|---|---|---|
| Acetylcholinesterase (AChE) | Primary bioreceptor for inhibition-based detection of neurotoxic OPs [17] [106] | Potentiometric, amperometric, and colorimetric biosensors [18] |
| Organophosphate Hydrolase (OPH) | Catalytic bioreceptor that degrades OPs, producing a detectable product [106] | Direct catalytic biosensors for OPs |
| OP-Specific Aptamers | Synthetic recognition element; binds target with high specificity [109] [110] | Electrochemical and optical aptasensors for specific OPs [110] |
| Cellulose Acetate (CA) / Glutaraldehyde (GA) | Polymer matrix and crosslinker for stable enzyme immobilization on solid surfaces [18] | Entrapment and cross-linking of enzymes on electrode surfaces |
| Acetylthiocholine (ATCh) / DTNB | Enzyme substrate and chromogenic/electroactive indicator for AChE activity [17] | Ellman's assay for colorimetric and electrochemical detection |
| Gold Electrodes / Screen-Printed Electrodes (SPEs) | Versatile and common transducer platforms for electrochemical sensing [18] [110] | Foundation for immobilizing bioreceptors and transducing binding events |
Signaling Pathways and Detection Mechanisms
The fundamental working principles of enzyme and aptamer-based biosensors are distinct. The following diagram illustrates the core signaling pathways for these two primary bioreceptors.
The escalating concerns regarding organophosphorus pesticide (OP) residues in food and the environment have underscored the critical need for analytical techniques that are not only accurate but also suitable for rapid, on-site screening [43]. Conventional laboratory methods, such as gas chromatography-mass spectrometry (GC-MS) and liquid chromatography-mass spectrometry (LC-MS), offer high sensitivity and reliability but are impeded by their high operational costs, requirement for experienced technicians, and lack of portability, making them unsuitable for resource-limited settings [43] [6]. In this context, portable biosensors, particularly those integrated with smartphones, have emerged as a promising alternative, offering the potential for high detection efficiency, user-friendly operation, and low cost [43] [59]. This application note provides a structured cost-benefit analysis (CBA) framework to evaluate the financial and operational viability of deploying these portable biosensors for routine OP screening, juxtaposed with traditional methods. The analysis encompasses instrumentation, recurring operational expenditures, and sample throughput, supplemented by detailed protocols for biosensor operation to aid researchers and drug development professionals in making informed strategic decisions.
Cost-Benefit Analysis of Screening Methodologies
A systematic cost-benefit analysis is indispensable for evaluating the economic viability of portable biosensors against conventional techniques. The following section provides a detailed comparison of associated costs and benefits, structured according to established CBA principles [111] [112].
Framework for Analysis
The CBA framework involves tallying all projected costs and benefits associated with a project or decision [111]. For this analysis:
- Goal: To determine whether the benefits of implementing portable biosensors for routine OP screening outweigh the costs compared to conventional laboratory methods.
- Metric: All costs and benefits are quantified and compared in monetary terms to facilitate a direct comparison [111].
- Perspective: The analysis is conducted from the perspective of a testing laboratory or research institution implementing the screening program.
Identification and Valuation of Costs and Benefits
Costs are categorized as follows [111] [112]:
- Direct Costs: Expenses directly tied to the acquisition and operation of the detection platform.
- Indirect Costs: Overhead expenses such as utilities and administrative support.
- Intangible Costs: Non-monetary costs that are difficult to quantify, such as potential delays in receiving results with off-site laboratory testing.
Benefits are categorized as [111] [112]:
- Direct Benefits: Immediate financial gains, such as increased revenue from higher sample throughput or cost savings from reduced reagent use.
- Indirect Benefits: Secondary positive effects, like improved brand reputation from demonstrating a commitment to food safety.
- Intangible Benefits: Non-monetary advantages, such as enhanced public health protection through more widespread and timely monitoring.
Table 1: Comprehensive Cost-Benefit Analysis of OP Detection Methods
| Category | Component | Conventional Lab Methods (GC-MS/LC-MS) | Portable Smartphone Biosensors |
|---|---|---|---|
| Initial Instrumentation Cost | Equipment Purchase | High (> $1,000,000 RMB / ~$140,000 USD) [6] | Low (Leverages consumer smartphone) [43] |
| Accessory cost: Custom optical/electrochemical components [43] [21] | |||
| Operational Costs | Consumables & Reagents | High-cost solvents, columns, carrier gases [43] | Low-cost enzymes, nanomaterials [43] [21] |
| Maintenance & Utilities | High (Specialized service contracts, high energy use) | Low (Minimal maintenance, battery-operated) | |
| Labor | Requires highly qualified technicians [43] [6] | Minimal training required for operation [43] | |
| Throughput & Efficiency | Sample Preparation | Tedious, time-consuming (Hours) [43] [6] | Simplified, minimal processing (Minutes) [43] [59] |
| Analysis Time per Sample | Long (30+ minutes) | Rapid (5 - 30 minutes) [6] | |
| On-Site Capability | No, requires transport to central lab | Yes, enables real-time, field-deployable monitoring [43] [21] | |
| Key Benefits | Primary Benefit | High accuracy, established gold standard [43] | Rapid, portable, cost-effective for mass screening [43] |
| Tangible Benefits | High sensitivity and reproducibility | Lower overall cost per test, high detection efficiency [43] | |
| Intangible Benefits | Regulatory acceptance | Democratizes testing, empowers remote areas [43] |
Calculation and Interpretation
To perform a quantitative analysis, the Net Present Value (NPV) and Cost-Benefit Analysis (CBA) Ratio should be calculated [112]. The general formulas are:
- NPV = PV of Benefits - PV of Costs
- CBA Ratio = PV of Benefits / PV of Costs
A project is considered economically viable if the NPV is positive and the CBA ratio is greater than 1 [112]. For portable biosensors, the significantly lower initial investment and operational costs, combined with the tangible benefits of high throughput and rapid results, typically result in a favorable CBA ratio and positive NPV compared to conventional methods, especially in high-volume screening scenarios or resource-limited settings. A sensitivity analysis should be conducted to examine how changes in key assumptions—such as sample volume, reagent costs, or the useful life of the device—affect the outcome [112].
Experimental Protocols for Portable Biosensors
This section outlines detailed methodologies for two primary types of smartphone-equipped biosensors used for OP detection: optical and electrochemical sensors.
Protocol 1: Colorimetric/Optical Biosensor for Methyl Parathion Detection
This protocol is adapted from the methyl parathion hydrolase (MPH)-based optical biosensor described in the literature [21].
3.1.1 Principle The biosensor relies on the enzymatic hydrolysis of methyl parathion (MP) by recombinant MPH. The enzyme catalyzes the conversion of colorless MP into a yellow product, p-nitrophenol. The concentration of this product, which is proportional to the original MP concentration, is determined by measuring its absorbance at 400 nm using a smartphone's camera and a custom-built optical sensing accessory [21].
3.1.2 Workflow Diagram
3.1.3 Materials and Reagents
- Recombinant MPH Enzyme: His-tagged methyl parathion hydrolase, purified from E. coli expression system [21].
- Ni-NTA Agarose: Solid support for immobilizing the MPH enzyme via metal-chelate affinity [21].
- Methyl Parathion Standard: Prepare stock solution in ethanol:water (1:9) and store at 4°C [21].
- Buffer Solutions: Potassium hydrogen phthalate (PHP, pH 4.0), phosphate buffer (PBS, pH 6.86), sodium tetraborate (ST, pH 9.18) [21].
- Custom Optical Device: Comprising two LEDs (400 nm 'signal' and 610 nm 'reference'), a photodiode, and a filtration unit [21].
3.1.4 Step-by-Step Procedure
- Enzyme Immobilization: Pack the bottom chamber of the filtration component with Ni-NTA agarose. Load the His-tagged MPH enzyme onto the agarose, allowing it to bind via the histidine tags.
- Sample Introduction: Add the sample solution (e.g., extracted from a food matrix) containing MP to the chamber containing the immobilized MPH.
- Incubation: Allow the enzymatic reaction to proceed for a defined period (e.g., 10-15 minutes) to convert MP to p-nitrophenol.
- Filtration: Use the plunger in the upper chamber to slowly push and pull, filtering the liquid reaction product through the 0.45 μm membrane into the optical cell.
- Absorbance Measurement: Place the optical cell in the sensor. The smartphone-based system measures the absorbance of the solution at 400 nm (signal) and 610 nm (reference) using the two LEDs and photodiode.
- Data Analysis: The smartphone application calculates the concentration of p-nitrophenol based on the absorbance, which is directly correlated to the MP concentration in the sample. The reported detection limit for this method is 4 μM [21].
Protocol 2: Fluorescence Biosensor for Malathion Detection
This protocol is based on the alkaline phosphatase (ALP) inhibition assay adapted for smartphone detection [59].
3.2.1 Principle The assay is based on the inhibition of ALP enzyme activity by OPs like malathion. In the absence of the pesticide, ALP converts the substrate L-ascorbic acid 2-phosphate (AAP) to L-ascorbic acid (AA). AA then reacts with o-phenylenediamine (OPD) to form a highly fluorescent compound, DFQ. When OPs are present, they inhibit ALP, leading to less AA and DFQ formation, and a corresponding decrease in fluorescence intensity [59].
3.2.2 Workflow Diagram
3.2.3 Materials and Reagents
- Alkaline Phosphatase (ALP): The enzyme whose activity is inhibited by OPs.
- Substrate Solution: L-ascorbic acid 2-phosphate sesquimagnesium salt hydrate (AAP).
- Developer: o-phenylenediamine (OPD).
- Malathion Standard: For creating calibration curves.
- Portable Fluorescence Device: A custom accessory for the smartphone that includes an excitation light source and a filter to measure the fluorescence emission of DFQ. The device converts fluorescence intensity into RGB values for the smartphone app to process [59].
3.2.4 Step-by-Step Procedure
- Reaction Setup: Pre-mix the sample (suspected to contain malathion) with a known activity of ALP enzyme. Incubate for a few minutes to allow for inhibition to occur.
- Substrate Addition: Add the substrate AAP to the mixture. If ALP is not inhibited, it will convert AAP to AA.
- Fluorescence Development: Add OPD to the reaction. The generated AA will react with OPD to form the fluorescent product DFQ.
- Fluorescence Measurement: Transfer the solution to a cuvette or a microfluidic chip compatible with the portable fluorescence device. The smartphone measures the fluorescence intensity of DFQ.
- Data Analysis: The fluorescence intensity is inversely proportional to the concentration of the OP inhibitor. The smartphone application provides a calibration curve, and the detection limit for malathion with this method is 0.05 ppm, with a linear range of 0.1-1 ppm [59].
The Scientist's Toolkit: Essential Research Reagents and Materials
Table 2: Key Research Reagent Solutions for Portable OP Biosensors
| Item | Function/Description | Application in Protocols |
|---|---|---|
| Recombinant MPH with His-Tag | Engineered organophosphorus hydrolase that directly hydrolyzes specific OPs like methyl parathion. The His-tag allows for oriented, stable immobilization on Ni-NTA supports [21]. | Protocol 1 (Colorimetric) |
| Ni-NTA Agarose | Solid resin that chelates Ni²⁺ ions, which in turn bind specifically to the histidine tags on recombinant enzymes, enabling reusable and robust enzyme immobilization [21]. | Protocol 1 (Colorimetric) |
| Alkaline Phosphatase (ALP) | Enzyme used in inhibition assays. Its activity is selectively inhibited by OPs, providing an indirect method for their quantification [59]. | Protocol 2 (Fluorescence) |
| Fluorescent Probe (OPD/DFQ) | o-Phenylenediamine (OPD) reacts with ascorbic acid (AA) to form the fluorescent molecule DFQ (3-(1,2-dihydroxyethyl)furo[3,4-b]quinoxalin-1(3H)-one), which serves as the measurable signal in the inhibition assay [59]. | Protocol 2 (Fluorescence) |
| Smartphone with Optical Accessory | Acts as a signal processor, controller, and display. High-resolution cameras capture colorimetric/fluorescent changes, which are converted to quantitative data via custom apps [43] [59]. | All Protocols |
| Nanomaterials (e.g., MOFs, Gold Nanoparticles) | Used to enhance signal transduction, improve enzyme stability, and increase the effective surface area for biorecognition events, thereby boosting sensor sensitivity and performance [43] [6]. | Signal Enhancement |
The pervasive use of organophosphorus pesticides (OPs) in modern agriculture necessitates robust monitoring tools to mitigate associated environmental and health risks. Conventional detection techniques, such as high-performance liquid chromatography (HPLC), offer high precision but are laboratory-bound, costly, and require trained personnel, limiting their utility for rapid on-site screening [6]. The development of portable biosensors addresses this critical gap, offering the potential for real-time, in-field pollutant monitoring [3] [45].
This application note details the validation of a novel, portable Ion-Sensitive Field Effect Transistor (ISFET)-based microalgal biosensor against the standard HPLC method for detecting acephate and triazophos. The biosensor utilizes Chlorella sp. as a biological recognition element, capitalizing on the inhibition of the algal enzyme alkaline phosphatase by organophosphorus pesticides, with the subsequent change in ascorbic acid production serving as the measurable signal [113]. This protocol provides a comprehensive framework for researchers to fabricate, optimize, and validate this biosensor technology, supporting advancements in the field of on-site analytical chemistry.
Experimental Design and Analytical Principles
Biosensor Detection Mechanism
The core detection principle relies on the specific inhibition of the enzyme alkaline phosphatase in Chlorella sp. by organophosphorus pesticides. In a pesticide-free environment, the active enzyme converts the substrate L-ascorbic acid 2-phosphate (AAP) into ascorbic acid (AA). The production of AA leads to a measurable change in the local pH, which is sensitively detected by the Ta₂O₅-gate ISFET. The presence of OPs like acephate or triazophos inhibits this enzymatic activity, resulting in a dose-dependent reduction of AA production and a corresponding attenuation of the ISFET signal [113]. This mechanism provides high specificity for detecting enzyme-inhibiting pesticides. The following diagram illustrates this signaling pathway.
Biosensor Fabrication and Setup
ISFET-Algal Biosensor Assembly [113]:
- ISFET Preparation: Utilize a commercially available or fabricated Ta₂O₅-gate ISFET sensor. The sensor should be cleaned and calibrated according to the manufacturer's specifications prior to immobilization.
- Algal Immobilization: Cultivate Chlorella sp. in a suitable growth medium (e.g., BG-11) to the mid-exponential growth phase. Harvest the cells by gentle centrifugation and wash with a sterile phosphate buffer (e.g., 0.1 M, pH 7.4).
- Immobilization on ISFET: Resuspend the algal pellet to achieve the optimal cell density. Deposit a 20 µL aliquot of the algal suspension directly onto the sensitive gate area of the ISFET. Allow the algae to immobilize under mild drying conditions or using a thin layer of a biocompatible polymer like alginate to entrap the cells.
Instrumentation Setup:
- Readout System: Connect the ISFET to a portable, high-impedance potentiometric reader for signal acquisition.
- Data Acquisition: Software should be configured to record the potential change (in mV) relative to a reference electrode over time. The system must be housed in a portable, stable enclosure.
Results and Validation Data
The performance of the ISFET-algal biosensor was rigorously evaluated for its sensitivity, linear range, and limit of detection (LOD) for acephate and triazophos. The results were quantitatively compared with those obtained from the standard HPLC method to establish validity.
Table 1: Analytical Performance of the ISFET-Algal Biosensor vs. HPLC
| Pesticide | Analytical Method | Linear Range (M) | Limit of Detection (LOD) | Matrix |
|---|---|---|---|---|
| Acephate | ISFET-Algal Biosensor | (10^{-10}) to (10^{-2}) M | (10^{-10}) M | Soil |
| HPLC [113] | Not Specified in Results | Comparably Low | Soil | |
| Triazophos | ISFET-Algal Biosensor | (10^{-10}) to (10^{-2}) M | (10^{-10}) M | Soil |
| HPLC [113] | Not Specified in Results | Comparably Low | Soil | |
| Chlorpyrifos | ISFET-Algal Biosensor | (10^{-7}) to (10^{-2}) M | (10^{-7}) M | Soil |
Table 2: Optimization Parameters for the ISFET-Algal Biosensor [113]
| Parameter | Optimized Condition | Impact on Performance |
|---|---|---|
| Algal Concentration | 20 µL aliquot | Ensures sufficient biocatalyst load without hindering mass transfer. |
| Substrate (PAA) Concentration | 0.4 mL | Provides saturating substrate conditions for maximum enzymatic rate. |
| Response Time | 4 minutes | Allows for stable signal development, enabling rapid analysis. |
The biosensor demonstrated remarkably high sensitivity for acephate and triazophos, achieving a low detection limit of 10⁻¹⁰ M. The response was linear across a wide concentration range of 10⁻¹⁰ to 10⁻² M for these pesticides [113]. When deployed for the analysis of real soil samples, the results obtained from the biosensor showed strong agreement with those from HPLC, confirming its practical applicability and reliability for environmental analysis [113].
Detailed Experimental Protocols
Protocol 1: Biosensor Detection of Acephate and Triazophos
Purpose: To quantitatively detect acephate and triazophos in a standardized buffer system using the ISFET-algal biosensor.
Reagents:
- Pesticide standard solutions (acephate, triazophos) in a suitable solvent.
- Substrate solution: 0.4 mL of L-ascorbic acid 2-phosphate (AAP) in buffer.
- Assay buffer (e.g., 0.1 M Tris-HCl, pH 9.0).
Procedure:
- Baseline Acquisition: Immerse the fabricated ISFET-algal biosensor in the assay buffer and initiate potentiometric recording. Allow the signal to stabilize for 1-2 minutes to establish a stable baseline.
- Substrate Addition: Add the optimized volume of 0.4 mL of AAP substrate solution to the measurement cell. Observe a sharp potential shift due to the enzymatic production of ascorbic acid. Record this maximum response.
- Inhibition Assay: Incubate the biosensor with a sample containing the target pesticide (e.g., acephate) for a fixed period (e.g., 5-10 minutes). The pesticide will inhibit the algal alkaline phosphatase.
- Post-Inhibition Substrate Addition: Add the same volume of AAP substrate (0.4 mL) again. The resulting potential shift will be proportionally lower due to the inhibited enzyme.
- Data Analysis: The percentage of enzyme inhibition is calculated based on the signal reduction, which is correlated to the pesticide concentration using a pre-established calibration curve. The entire workflow is summarized below.
Protocol 2: HPLC Validation Method
Purpose: To validate the biosensor's performance by quantifying acephate and triazophos residues using a reference HPLC method.
Reagents and Equipment:
- HPLC system with UV or MS detector.
- C18 reversed-phase analytical column (e.g., 250 mm x 4.6 mm, 5 μm).
- Pesticide analytical standards.
- Acetonitrile and water (HPLC grade).
- Sample Preparation: Follow a validated QuEChERS-based extraction procedure [114].
- Homogenize the soil or environmental sample.
- Extract using acetonitrile with shaking.
- Partition by adding salts (e.g., MgSO₄, NaCl) and centrifuging.
- Clean-up the extract using dSPE (e.g., with PSA and C18 sorbents) to remove co-extracted interferents.
- Concentrate the extract and reconstitute in a solvent compatible with the HPLC mobile phase.
HPLC Conditions (Example):
- Mobile Phase: Gradient of (A) water and (B) acetonitrile.
- Flow Rate: 1.0 mL/min.
- Detection: UV at 210-230 nm or MS/MS in multiple reaction monitoring (MRM) mode for higher specificity.
- Injection Volume: 10-20 μL.
Quantification: Generate a calibration curve by analyzing a series of standard solutions. Calculate the concentration in the sample extracts by comparing the peak areas of the target analytes to the calibration curve.
The Scientist's Toolkit: Essential Research Reagents and Materials
Table 3: Key Research Reagents and Materials for ISFET-Algal Biosensor Development
| Item | Function/Application | Examples/Specifications |
|---|---|---|
| Ta₂O₅-gate ISFET | Signal transducer; detects pH changes at the sensor surface. | Commercial ISFET probes or custom-fabricated chips. |
| Chlorella sp. | Biological recognition element; source of alkaline phosphatase enzyme. | Axenic cultures maintained in BG-11 or similar medium. |
| L-Ascorbic Acid 2-Phosphate (AAP) | Enzyme substrate; converted to ascorbic acid by alkaline phosphatase. | High-purity grade, dissolved in appropriate buffer (e.g., Tris-HCl, pH 9.0). |
| Organophosphorus Pesticide Standards | Analytes for calibration and validation. | Certified reference materials (e.g., acephate, triazophos, chlorpyrifos). |
| QuEChERS Extraction Kits | Sample preparation for complex matrices prior to HPLC validation. | Kits containing MgSO₄, NaCl, and dSPE sorbents (PSA, C18, GCB) [114]. |
| Portable Potentiostat | Portable signal readout for the ISFET sensor. | Compact, battery-operated devices with data logging capabilities. |
| Nanomaterials | Potential interface for enhancing sensor sensitivity and stability. | Metal-organic frameworks (MOFs), gold nanoparticles, carbon quantum dots [3] [6]. |
This application note validates the ISFET-algal biosensor as a highly sensitive, reproducible, and portable analytical tool for the on-site detection of organophosphorus pesticides like acephate and triazophos. The biosensor's performance is comparable to the standard HPLC method, with the distinct advantages of rapid analysis (~4 minutes), cost-effectiveness, and suitability for field deployment. Future work will focus on integrating artificial intelligence for data analysis and employing advanced nanomaterials to further enhance robustness and enable multi-analyte detection across diverse environmental matrices.
Conclusion
Portable biosensors for organophosphate detection represent a paradigm shift from centralized laboratory analysis to rapid, on-site decision-making. The integration of diverse bioreceptors with advanced transducers has yielded devices with impressive sensitivity, specificity, and user-friendliness. While challenges in long-term stability and handling complex matrices persist, ongoing innovations in nanozymes, whole-cell systems, and material science are providing robust solutions. The future of this field points towards multiplexed detection of multiple contaminants, the widespread integration with Internet-of-Things (IoT) platforms for real-time environmental surveillance, and the development of highly personalized biosensors for point-of-care clinical diagnosis of OP exposure, ultimately creating a safer and more sustainable ecosystem for human health.
References
- 1. Epidemiologic characteristics, the length of hospital stay, ... [https://www.sciencedirect.com/science/article/pii/S2213398425000211]
- 2. Combatting Organophosphate Toxicity: Novel Strategies ... [https://www.sciencedirect.com/science/article/abs/pii/S016599362500319X]
- 3. Advance in Organophosphorus Pesticides Detection ... [https://www.sciencedirect.com/science/article/abs/pii/S0957582025011139]
- 4. Global, regional, and national burden of unintentional ... [https://www.frontiersin.org/journals/public-health/articles/10.3389/fpubh.2025.1596599/full]
- 5. Epidemiology of Poisoning Cases at Lumbini Medical College ... [https://pmc.ncbi.nlm.nih.gov/articles/PMC12241821/]
- 6. Research Progress of Biosensors in the Detection ... [https://www.mdpi.com/2079-6374/15/12/778]
- 7. A Review of Voltammetric Techniques for Sensitive Detection ... [https://pmc.ncbi.nlm.nih.gov/articles/PMC12290964/]
- 8. A Review on the Application of Biosensors for Monitoring ... [https://pmc.ncbi.nlm.nih.gov/articles/PMC12390133/]
- 9. Thiocholine-Based Sensor for Monitoring Blood... Portable [https://pmc.ncbi.nlm.nih.gov/articles/PMC11988904/]
- 10. Current Advances in Aptasensors for Pesticide Detection [https://pmc.ncbi.nlm.nih.gov/articles/PMC11930883/]
- 11. Development and stabilization of a paper-based biosensor for on-site... [https://chemrxiv.org/engage/chemrxiv/article-details/690e4a25a482cba122b2aef1]
- 12. Chromatography - StatPearls - NCBI Bookshelf [https://www.ncbi.nlm.nih.gov/books/NBK599545/]
- 13. Explained: Principles & Applications Mass Spectrometry [https://www.vedantu.com/chemistry/mass-spectrometry]
- 14. Limitations and disadvantages of GC-MS [https://labioscientific.com/limitations-and-disadvantages-of-gc-ms/]
- 15. Mass Spectrometry in the Clinical Laboratory—Challenges ... [https://www.chromatographyonline.com/view/mass-spectrometry-clinical-laboratory-challenges-quality-assurance-1]
- 16. The Essence of Modern HPLC: Advantages, Limitations ... [https://www.chromatographyonline.com/view/essence-modern-hplc-advantages-limitations-fundamentals-and-opportunities]
- 17. Portable Bioactive Paper-Based Sensor for Quantification of ... [https://pmc.ncbi.nlm.nih.gov/articles/PMC3736481/]
- 18. The Performance of Organophosphate Pesticides ... [https://www.mdpi.com/2673-4583/5/1/69]
- 19. Biosensors for detection of organophosphate pesticides [https://www.sciencedirect.com/science/article/abs/pii/S0026265X2200248X]
- 20. Electrochemical Biosensors: A Prospective Insight to ... [https://www.sciencedirect.com/science/article/abs/pii/S2451910325001358]
- 21. Development of a Novel Optical Biosensor for Detection of ... [https://pmc.ncbi.nlm.nih.gov/articles/PMC3444059/]
- 22. Biosensors, Volume 15, Issue 1 (January 2025) – 64 articles [https://www.mdpi.com/2079-6374/15/1]
- 23. Recent advances in biosensors: structure, principles ... [https://www.sciencedirect.com/science/article/pii/S1046202325001665]
- 24. Electrochemical Biosensors - Sensor Principles and ... [https://pmc.ncbi.nlm.nih.gov/articles/PMC3663003/]
- 25. Looking through the lens of quantitative biology [https://pmc.ncbi.nlm.nih.gov/articles/PMC10095858/]
- 26. Piezoelectric biosensors: shedding light on principles and ... [https://pmc.ncbi.nlm.nih.gov/articles/PMC10920441/]
- 27. Signal-to-Noise Ratio as a Quantitative Measure for Optical ... [https://www.analog.com/en/resources/design-notes/signaltonoise-ratio-as-a-quantitative-measure-for-optical-biosensors.html]
- 28. A Portable Electrochemical Biosensor Based on an Amino- ... [https://pubmed.ncbi.nlm.nih.gov/39363450/]
- 29. Enhancing Sensitivity and Selectivity: Current Trends in ... [https://www.mdpi.com/2079-6374/14/10/496]
- 30. Detection of pesticides using an amperometric biosensor ... [https://www.sciencedirect.com/science/article/abs/pii/S0956566302001732]
- 31. Critical Evaluation of Acetylthiocholine Iodide and ... [https://www.mdpi.com/1424-8220/13/2/1603]
- 32. Recent Advances in Potentiometric Biosensing - PMC [https://pmc.ncbi.nlm.nih.gov/articles/PMC8162913/]
- 33. Electrochemical Biosensors Driving Model Transformation ... [https://www.mdpi.com/2304-8158/14/15/2669]
- 34. Assay of Serum Cholinesterase Activity by an ... [https://pubmed.ncbi.nlm.nih.gov/29363680/]
- 35. An Emerging Tool for Combating the COVID-19 Pandemic [https://www.mdpi.com/2079-6374/13/2/204]
- 36. Ion-sensitive field effect transistor biosensors for biomarker ... [https://pubs.rsc.org/en/content/articlehtml/2024/tb/d4tb00719k]
- 37. Biologically sensitive field-effect transistors: from ISFETs to ... [https://pmc.ncbi.nlm.nih.gov/articles/PMC4986460/]
- 38. Field-Effect Transistor-Based Biosensors for Environmental ... [https://www.mdpi.com/1424-8220/22/11/4178]
- 39. Design and development of ISFET-based portable ... [https://www.sciencedirect.com/science/article/abs/pii/S0039914025008306]
- 40. Field-Effect Transistor Biosensors for Biomedical Applications [https://www.mdpi.com/1424-8220/19/19/4214]
- 41. Smartphone-Based Biosensors: Current Trends ... [https://www.mdpi.com/2673-4591/106/1/10]
- 42. Future of Biosensors Market 2025 to 2030: Innovation ... [https://www.marketsandmarketsblog.com/future-of-biosensors-market-2025-to-2030-innovation-integration-and-intelligence.html]
- 43. Review Portable sensors equipped with smartphones for ... [https://www.sciencedirect.com/science/article/abs/pii/S0308814623020745]
- 44. Development of a novel amperometric biosensor utilising ... [https://www.sciencedirect.com/science/article/abs/pii/S2589014X25002609]
- 45. Algal Biosensors for Detection of Potentially Toxic ... [https://www.mdpi.com/2227-9040/12/11/235]
- 46. Whole Cells of Microorganisms—A Powerful Bioanalytical ... [https://www.mdpi.com/2079-6374/15/5/290]
- 47. Design of a macroalgae amperometric biosensor [https://www.sciencedirect.com/science/article/abs/pii/S0045653514006626]
- 48. Smart paper-based sensor: A novel bio-enzyme-free dual ... [https://www.sciencedirect.com/science/article/abs/pii/S138589472510346X]
- 49. Assessment of Organophosphate and Carbamate ... [https://www.mdpi.com/1424-8220/8/4/2818]
- 50. A portable lateral flow distance-based paper sensor for ... [https://pmc.ncbi.nlm.nih.gov/articles/PMC11379162/]
- 51. On-spot biosensing device for organophosphate pesticide ... [https://www.sciencedirect.com/science/article/pii/S2590262821000320]
- 52. Organic Fluorescent Sensors for Environmental Analysis [https://www.mdpi.com/2079-4991/15/19/1512]
- 53. A Highly Sensitive Fluorescent Sensor Based on Carbon Dots ... [https://pmc.ncbi.nlm.nih.gov/articles/PMC12563238/]
- 54. Fluorometric and Colorimetric Biosensors for the Assay of ... [https://pmc.ncbi.nlm.nih.gov/articles/PMC12074314/]
- 55. Nanozyme-Powered Multimodal Sensing for Pesticide ... [https://www.mdpi.com/2304-8158/14/11/1957]
- 56. Highly Sensitive Fluorescent Biosensor Based on ... [https://www.frontiersin.org/journals/environmental-science/articles/10.3389/fenvs.2022.825112/full]
- 57. A Portable Fluorescent Hydrogel-Based Device for On-Site ... [https://www.frontiersin.org/journals/chemistry/articles/10.3389/fchem.2022.855281/full]
- 58. Rapid determination of organophosphorus insecticides ... [https://www.sciencedirect.com/science/article/abs/pii/S0889157524008500]
- 59. A fluorescence biosensor for organophosphorus pesticide ... [https://pubmed.ncbi.nlm.nih.gov/39486239/]
- 60. Current Advances in Aptasensors for Pesticide Detection [https://link.springer.com/article/10.1007/s41061-025-00498-9]
- 61. Surface-enhanced Raman spectroscopy biosensor ... [https://link.springer.com/article/10.1007/s44462-025-00031-7]
- 62. Recent Advances in SERS-Based Detection of Organophosphorus Pesticides in Food: A Critical and Comprehensive Review - PMC [https://pmc.ncbi.nlm.nih.gov/articles/PMC12610478/]
- 63. Surface Enhanced Raman Spectroscopy: Applications in ... [https://www.mdpi.com/2304-6732/8/12/568]
- 64. Recent development of surface-enhanced Raman ... [https://pmc.ncbi.nlm.nih.gov/articles/PMC10163864/]
- 65. Advances in Detection Technologies for Pesticide Residues and Heavy Metals in Rice: A Comprehensive Review of Spectroscopy, Chromatography, and Biosensors - PMC [https://pmc.ncbi.nlm.nih.gov/articles/PMC11941943/]
- 66. Recent Trends in SERS-Based Plasmonic Sensors for Disease Diagnostics, Biomolecules Detection, and Machine Learning Techniques - PubMed [https://pubmed.ncbi.nlm.nih.gov/36979540/]
- 67. Development of integrated smartphone/resistive biosensor for ... [https://pmc.ncbi.nlm.nih.gov/articles/PMC10732357/]
- 68. Recent Advances in Personal Glucose Meter-Based ... [https://www.mdpi.com/2304-8158/12/21/3947]
- 69. Advances in Enzyme-Based Biosensors: Emerging Trends ... [https://www.mdpi.com/2673-4591/106/1/5]
- 70. Enzyme Inhibition-Mediated Distance-Based Paper ... [https://www.mdpi.com/2227-9040/13/4/147]
- 71. Single-atom enzymes: from nano-enzyme evolution to the ... [https://www.sciencedirect.com/science/article/abs/pii/S0010854525008872]
- 72. Single-Atom Nanozymes: Fabrication, Characterization ... [https://pmc.ncbi.nlm.nih.gov/articles/PMC9457768/]
- 73. An enzyme-based biosensor for monitoring and engineering ... [https://pmc.ncbi.nlm.nih.gov/articles/PMC8020752/]
- 74. Rapid LC-MS/MS quantification of Organophosphate non- ... [https://pmc.ncbi.nlm.nih.gov/articles/PMC10474783/]
- 75. Quantitative screening of organophosphorus and ... [https://www.sciencedirect.com/science/article/pii/S2772391724000276]
- 76. Pedestal High-Contrast Gratings for Biosensing [https://www.mdpi.com/2079-4991/12/10/1748]
- 77. Organophosphate and Carbamate Toxicity: Understanding, ... [https://jpmsonline.com/article/organophosphate-and-carbamate-toxicity-understanding-diagnosing-and-treating-poisoning-585/]
- 78. Design and development of ISFET-based portable ... [https://www.sciencedirect.com/science/article/pii/S0039914025008306]
- 79. Quantitative Detection of Carbamate Pesticide Residues in ... [https://www.mdpi.com/2076-3417/15/21/11775]
- 80. Organophosphorus pesticide detection directly on fruit peels [https://www.sciencedirect.com/science/article/pii/S0039914024014723]
- 81. Development of integrated smartphone/resistive biosensor ... [https://www.sciencedirect.com/science/article/pii/S2590137023000997]
- 82. Inhibitive determination of organophosphate pesticides ... [https://www.eeer.org/journal/view.php?number=1541]
- 83. Portable Thiocholine-Based Sensor for Monitoring Blood ... [https://www.mdpi.com/2304-8158/14/7/1136]
- 84. Electrochemical micro analytical device interfaced with ... [https://www.nature.com/articles/s41598-019-56510-y]
- 85. Enhancement of operational stability of an enzyme ... [https://www.sciencedirect.com/science/article/abs/pii/S0956566302000210]
- 86. Improved reuse and storage performances at room ... [https://pubs.rsc.org/en/content/articlehtml/2023/gc/d3gc00494e]
- 87. Lyophilisation in Pharmaceutical Manufacturing [https://pharmasource.global/content/guides/category-guide/lyophilisation-in-pharmaceutical-manufacturing-enhancing-drug-stability-and-shelf-life/]
- 88. Nanomaterial-Powered Biosensors: A Cutting-Edge ... [https://www.mdpi.com/2072-666X/16/9/1042]
- 89. Nanoplasmonic Biosensors: A Comprehensive Overview ... [https://pubmed.ncbi.nlm.nih.gov/40356858/]
- 90. A fluorescence biosensor for organophosphorus pesticide ... [https://www.sciencedirect.com/science/article/pii/S1386142524014963]
- 91. Signal amplification strategies in electrochemical ... [https://pubs.rsc.org/en/content/articlelanding/2022/ma/d2ma00427e]
- 92. Nanomaterials as signal amplification elements in aptamer ... [https://pubmed.ncbi.nlm.nih.gov/35659689/]
- 93. Signal amplification and quantification on lateral flow assays ... [https://pmc.ncbi.nlm.nih.gov/articles/PMC7150487/]
- 94. Recent developments in monitoring of organophosphorus ... [https://www.sciencedirect.com/science/article/pii/S2666154325000808]
- 95. Matrix Effect Evaluation in GC/MS-MS Analysis of Multiple ... [https://www.mdpi.com/2304-8158/12/21/3991]
- 96. Insights Powered by Artificial Intelligence - PubMed Central [https://pmc.ncbi.nlm.nih.gov/articles/PMC12186521/]
- 97. Organophosphate Detection in Animal-Derived Foods ... [https://pubmed.ncbi.nlm.nih.gov/39200569/]
- 98. Pesticide Residue Analysis in Food: Advances, Challenges ... [https://www.chromatographyonline.com/view/pesticide-residue-analysis-in-food-advances-challenges-and-case-studies]
- 99. A systematic review of organophosphorus pesticides ... [https://link.springer.com/10.1007/s12024-025-01094-5]
- 100. Uncovering Analytical Patterns for Hazardous Components in ... [https://pmc.ncbi.nlm.nih.gov/articles/PMC12469952/]
- 101. Lab-on-paper for point-of-care detection of pesticides [https://www.sciencedirect.com/science/article/pii/S0026265X25018417]
- 102. New HPLC, MS, and CDS Products from 2024–2025 [https://www.chromatographyonline.com/view/new-hplc-ms-and-cds-products-from-2024-2025-a-brief-review]
- 103. Top Portable GC-MS Companies & How to Compare Them ... [https://www.linkedin.com/pulse/top-portable-gc-ms-companies-how-compare-them-2025-uukse/]
- 104. Pesticide residue detection techniques for increasing ... [https://www.frontiersin.org/journals/plant-science/articles/10.3389/fpls.2025.1694779/full]
- 105. Recent advances and Future outlooks towards engineered ... [https://www.sciencedirect.com/science/article/pii/S2590137025001335]
- 106. Advances in Enzyme-Based Biosensors for Pesticide ... [https://pmc.ncbi.nlm.nih.gov/articles/PMC6022933/]
- 107. Aptamers and antibodies in optical biosensing [https://link.springer.com/article/10.1007/s44371-025-00094-2]
- 108. Nucleic Acid Aptamer-Based Biosensors: A Review - PMC [https://pmc.ncbi.nlm.nih.gov/articles/PMC10741014/]
- 109. Current trends of aptamer-based portable biosensing ... [https://www.sciencedirect.com/science/article/abs/pii/S138589472408985X]
- 110. A Brief Review of Aptamer-Based Biosensors in Recent ... [https://www.mdpi.com/2079-6374/15/2/120]
- 111. What Is Cost-Benefit Analysis? 4 Step Process - HBS Online [https://online.hbs.edu/blog/post/cost-benefit-analysis]
- 112. Cost-Benefit Analysis: Step-by-Step Guide & Examples [https://www.rippling.com/blog/cost-benefit-analysis-example]
- 113. Design and development of ISFET-based portable ... [https://pubmed.ncbi.nlm.nih.gov/40414044/]
- 114. Optimization and Validation of a QuEChERS-Based ... [https://pmc.ncbi.nlm.nih.gov/articles/PMC12156414/]