QCM vs. SAW Biosensors: A Performance Comparison for Biomedical Research and Drug Development
This article provides a comprehensive comparison of Quartz Crystal Microbalance (QCM) and Surface Acoustic Wave (SAW) biosensors, two leading label-free detection technologies.
QCM vs. SAW Biosensors: A Performance Comparison for Biomedical Research and Drug Development
Abstract
This article provides a comprehensive comparison of Quartz Crystal Microbalance (QCM) and Surface Acoustic Wave (SAW) biosensors, two leading label-free detection technologies. Tailored for researchers and drug development professionals, it explores the fundamental principles, operational mechanisms, and distinct performance characteristics of each sensor type. We delve into their specific applications in biomolecular interaction analysis, clinical diagnostics, and drug discovery, while also addressing key troubleshooting and optimization strategies. A direct performance comparison equips scientists with the knowledge to select the optimal biosensor platform for their specific research or development goals, from foundational research to point-of-care diagnostic applications.
Understanding QCM and SAW Biosensors: Core Principles and Gravimetric Sensing
Piezoelectric acoustic biosensors represent a powerful class of label-free detection tools that exploit the piezoelectric effect to transform biointeractions at the sensor surface into measurable electrical signals. Unlike conventional analytical techniques that require fluorescent, enzymatic, or radioactive labels, these devices detect target analytes based on their intrinsic physical properties, primarily mass, thereby simplifying assay procedures and reducing analysis time and cost [1] [2]. The core principle involves the generation of mechanical acoustic waves within a piezoelectric material when an alternating electric field is applied. When target biomolecules, such as proteins, nucleic acids, or whole cells, bind to a recognition layer on the sensor surface, they alter the propagation characteristics of these acoustic waves. This change is measured with high sensitivity, enabling the real-time monitoring of binding events without the need for sample labeling [1] [3].
The significance of these sensors is particularly evident in fields like medical diagnostics, drug development, and environmental monitoring, where real-time, label-free analysis provides critical insights into biomolecular interactions [4] [2]. Among the family of acoustic wave devices, Quartz Crystal Microbalance (QCM) and Surface Acoustic Wave (SAW) sensors are two of the most prominent technologies. While both are piezoelectric and label-free, they differ fundamentally in their wave propagation modes, operational frequencies, and consequent performance in various applications, especially in liquid environments [3]. This guide provides a structured comparison of QCM and SAW biosensors, detailing their working principles, performance characteristics, and experimental applications to inform their selection for specific research needs.
Fundamental Principles and Working Mechanisms
The Piezoelectric Effect and Mass Sensing
The foundational phenomenon behind all acoustic biosensors is the direct piezoelectric effect, discovered by Jacques and Pierre Curie in 1880, wherein certain anisotropic crystals, such as quartz, lithium niobate, or zinc oxide, generate an electrical charge in response to applied mechanical stress [5]. In biosensing applications, the converse piezoelectric effect is utilized: applying an alternating electrical field across the crystal induces mechanical vibrations or acoustic waves [1] [3]. The most critical relationship for gravimetric sensing is the Sauerbrey equation, which establishes a linear relationship between the mass adsorbed on the sensor surface and the observed shift in its resonant frequency [4] [1] [2]:
Δf = -C_f • Δm
Where Δf is the frequency shift, Δm is the change in mass per unit area, and C_f is the mass sensitivity constant of the crystal. This equation is strictly valid for rigid, evenly distributed mass in air or vacuum. For operations in a liquid environment, the frequency is also influenced by the liquid's density and viscosity, as described by the Kanazawa-Gordon equation [2]. When dealing with soft, viscoelastic biological layers, monitoring the dissipation factor (D), which quantifies energy losses, alongside the frequency shift provides additional information about the structural properties of the adlayer [1] [2].
Comparative Working Principles: QCM vs. SAW
Although both QCM and SAW sensors are based on piezoelectricity, their design and wave propagation mechanisms are distinct, leading to different performance characteristics.
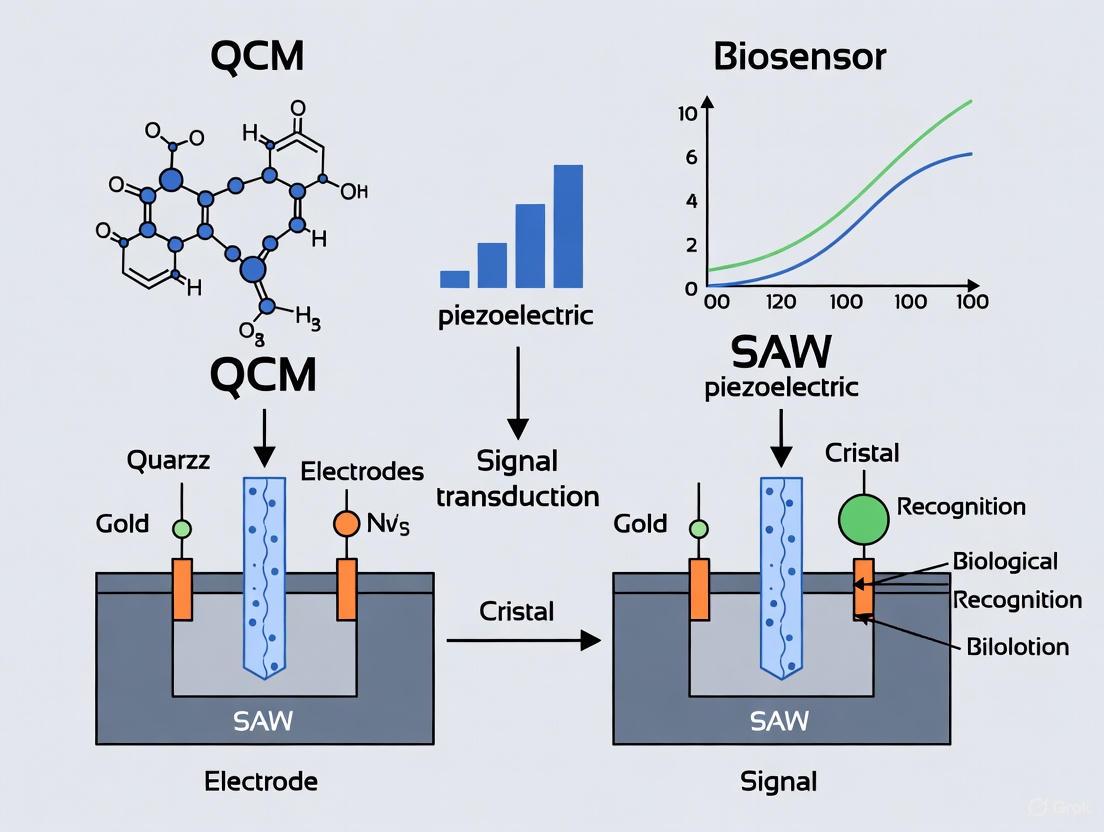
Quartz Crystal Microbalance (QCM) is a Bulk Acoustic Wave (BAW) device. A typical QCM sensor consists of a thin, AT-cut quartz disc sandwiched between two metal electrodes. When an alternating voltage is applied, the crystal undergoes thickness shear mode (TSM) deformation, meaning the crystal surfaces move in a lateral, sliding motion [3] [5]. This shear wave propagates through the bulk of the crystal. A key advantage of the shear motion is that it minimally radiates energy into an adjacent liquid, making QCM highly suitable for operation in liquid solutions, which is essential for most biosensing applications [6] [3]. The fundamental resonance frequency for commercial QCM sensors typically ranges from 5 to 20 MHz, though higher overtone frequencies are also used [1] [3].
Surface Acoustic Wave (SAW) sensors, in contrast, confine acoustic energy to the surface of the piezoelectric substrate. The most common type is the Rayleigh wave device, where the wave has both a longitudinal and a vertical shear component, creating an elliptical particle motion that extends about one wavelength into the substrate [3] [5]. A key design feature of SAW devices is the Interdigital Transducer (IDT), which is patterned metallic fingers on the substrate surface that convert electrical energy into acoustic waves and vice versa [3]. However, the out-of-plane component of Rayleigh waves couples strongly with liquids, leading to significant energy dissipation. Therefore, for liquid-phase sensing, Shear Horizontal (SH)-SAW and Love wave devices are employed. In SH-SAW, the particle displacement is parallel to the sensor surface and perpendicular to the direction of wave propagation, minimizing energy loss into the liquid [7] [5]. Love wave sensors incorporate a waveguide layer on top of the SH-SAW device to further confine energy at the sensing surface, enhancing mass sensitivity [5]. SAW devices generally operate at much higher frequencies (tens to hundreds of MHz) than fundamental-mode QCM, leading to inherently higher mass sensitivity [3].
The diagrams below illustrate the core operational principles of each sensor type.
QCM: Thickness Shear Mode (TSM) Operation. The acoustic wave propagates through the bulk of the quartz crystal, with the surfaces moving in a lateral, sliding motion. This shear-horizontal movement is ideal for liquid environments [3] [5].
SAW Sensor with Interdigital Transducers (IDTs). Acoustic waves are generated and detected by IDTs and travel along the surface of the substrate, confining energy to the sensitive region where biointeractions occur [3] [5].
Performance Comparison: QCM vs. SAW Biosensors
The fundamental differences in the design and wave propagation of QCM and SAW sensors result in distinct performance profiles. The table below summarizes their key characteristics for easy comparison.
Table 1: Performance Comparison between QCM and SAW Biosensors
| Performance Parameter | Quartz Crystal Microbalance (QCM) | Surface Acoustic Wave (SAW) |
|---|---|---|
| Wave Type | Bulk Acoustic Wave (BAW) | Surface Acoustic Wave [3] |
| Propagation Mode | Thickness Shear Mode (TSM) | Rayleigh, Shear Horizontal (SH), or Love Wave [3] [5] |
| Typical Frequency Range | 5 - 20 MHz (fundamental); Overtone operation common [3] | Tens to hundreds of MHz; can reach GHz range [3] |
| Mass Sensitivity | ~Hz cm² ng⁻¹ for 10-30 MHz devices [6] [3] | Significantly higher than QCM due to higher operating frequency [3] |
| Liquid Phase Operation | Excellent; low damping due to shear motion [6] [3] | Challenging for Rayleigh-SAW; SH-SAW and Love Wave are suitable [3] [5] |
| Key Strengths | Ruggedness, simplicity, low cost, well-established for liquid use [3] | Very high sensitivity, miniaturization potential [3] |
| Main Limitations | Lower fundamental frequency limits sensitivity | Rayleigh-SAW suffers high damping in liquids; fabrication can be complex [3] |
Analysis of Comparative Data
Sensitivity and Frequency: The mass sensitivity of an acoustic sensor is proportional to the square of its fundamental resonant frequency [6]. SAW devices, with their operational frequencies often in the hundreds of MHz, inherently offer higher mass sensitivity compared to standard QCMs operating at a fundamental frequency of 5-20 MHz. For instance, while a 30 MHz QCM has a sensitivity of about 2 Hz cm² ng⁻¹, high-frequency SAW and other devices like FBARs (Film Bulk Acoustic Resonators) can operate in the GHz range, pushing sensitivity to pg levels [3].
Performance in Liquids: This is a critical differentiator. QCM's thickness shear mode is ideal for liquid environments because the lateral motion of the crystal surface does not efficiently couple energy into the liquid, leading to stable operation with manageable damping [6] [3]. Conversely, the out-of-plane component of a Rayleigh SAW causes intense energy radiation into a liquid, making it unsuitable for most biosensing applications. This limitation is overcome by using SH-SAW or Love wave devices, which feature in-plane displacement that minimizes energy dissipation [7] [5]. A 2021 study on an SH-SAW biosensor operating at 250 MHz successfully demonstrated the detection of C-reactive protein (CRP) in a liquid buffer, highlighting the viability of this approach [7].
Instrumentation and Cost: QCM systems are generally more mature, cost-effective, and widely available. SAW sensor fabrication, which involves lithography to create the IDT patterns, can be more complex and expensive, though it is compatible with semiconductor processes, enabling miniaturization and integration into lab-on-a-chip systems [3].
Experimental Protocols and Data Interpretation
A Standard QCM Immunosensing Experiment
To illustrate a typical experimental workflow, we describe a QCM-based immunosensor for detecting a specific antigen.
1. Sensor Functionalization: The gold electrode of the QCM crystal is first cleaned and modified with a self-assembled monolayer (SAM), often using alkanethiols, to create a well-defined surface chemistry. The capture antibody (e.g., a monoclonal IgG) is then immobilized onto this surface. This can be done via covalent coupling (e.g., using EDC-NHS chemistry to form amide bonds) or through physical adsorption [2] [7].
2. Baseline Acquisition: The functionalized sensor is placed in a measurement chamber, and a stable buffer flow (e.g., Phosphate Buffered Saline, PBS) is initiated. The resonant frequency and dissipation are monitored until a stable baseline is established.
3. Sample Injection and Binding: The sample containing the target antigen is injected over the sensor surface. If the antigen is present, it binds specifically to the immobilized antibodies, forming a layer on the crystal. This increases the surface mass, causing a decrease in the resonant frequency (Δf). This binding event is monitored in real-time, producing a sensorgram [4] [2].
4. Signal Amplification (Optional - Sandwich Assay): For enhanced sensitivity, a secondary antibody that recognizes a different epitope on the captured antigen can be injected. This forms an "antibody-antigen-antibody" sandwich, adding more mass and generating a larger frequency shift [7].
5. Regeneration and Reuse: To regenerate the sensor surface for a new measurement, a mild acidic or basic solution is injected to dissociate the antibody-antigen complex without denaturing the immobilized capture antibodies [8].
The following diagram outlines this standard experimental workflow.
QCM Experimental Workflow for Immunosensing. This step-by-step process from sensor preparation to regeneration allows for real-time, label-free monitoring of affinity interactions [2] [7].
An SH-SAW Biosensor Experiment with Signal Amplification
A 2021 study provides a clear example of an advanced SAW experiment using a sandwich assay and nanoparticles for signal enhancement [7].
Objective: To detect C-reactive protein (CRP) using a 250 MHz SH-SAW biosensor and investigate the effect of the size of gold nanoparticles (AuNPs) on the sensor signal.
Methodology:
- The SH-SAW device was fabricated on a 36Y-90X quartz substrate with gold IDTs.
- Capture Immobilization: Anti-CRP monoclonal antibodies were immobilized on the sensing area using a crosslinker (dithiobis[succinimidylpropionate] - DSP).
- Antigen Capture: A solution of recombinant CRP was introduced and captured by the surface antibodies.
- Signal Amplification with AuNPs: Secondary anti-CRP antibodies, conjugated to AuNPs of varying diameters (10, 15, 20, and 30 nm), were injected to form a sandwich structure. The large mass of the AuNPs caused a significant change in the SAW propagation velocity and amplitude.
Results and Interpretation: The study found a correlation between the size of the AuNPs and the sensor's response. The larger nanoparticles, which extended further into the liquid medium interacted more significantly with the decaying shear wave field (evanescent field), leading to a greater change in the measured signals. This demonstrates that SH-SAW biosensors are sensitive not only to mass but also to the dimensional profile of the bound adlayer, providing an additional parameter for analysis [7].
Essential Research Reagents and Materials
The following table lists key reagents and materials required for conducting experiments with piezoelectric acoustic biosensors, as evidenced in the cited protocols.
Table 2: Key Research Reagent Solutions for Acoustic Biosensor Experiments
| Reagent/Material | Function in the Experiment | Example from Literature |
|---|---|---|
| Piezoelectric Sensor | The core transducer element that converts mass change into a frequency signal. | AT-cut quartz crystal with gold electrodes (QCM) [4]; 36Y-90X quartz with IDTs (SH-SAW) [7]. |
| Capture Antibody | The primary biorecognition element immobilized on the sensor for specific target capture. | Monoclonal anti-CRP antibody [7]; Antibodies against target antigens [2]. |
| Crosslinking Chemistry | A chemical used to covalently and stably attach biorecognition elements to the sensor surface. | Dithiobis[succinimidylpropionate] (DSP) [7]; EDC/NHS chemistry. |
| Secondary Antibody & Conjugate | Used in sandwich assays for signal amplification; can be conjugated to nanoparticles. | Anti-CRP monoclonal antibody conjugated to gold nanoparticles (10-30 nm) [7]. |
| Buffer Solutions | To maintain a stable pH and ionic strength during baseline and sample injection. | Phosphate Buffered Saline (PBS) [4] [2]. |
| Regeneration Solution | A solution (e.g., low pH or detergent) to break affinity bonds and clean the sensor surface for reuse. | Mild acidic glycine solution or alkaline solutions [8]. |
QCM and SAW biosensors are both powerful, label-free technologies that have revolutionized the real-time analysis of biomolecular interactions. The choice between them is not a matter of which is superior, but which is more appropriate for a specific application.
QCM is the workhorse technology, prized for its robustness, simplicity, and proven reliability in liquid environments. It is an excellent choice for studying cell adhesion, protein adsorption, and a wide range of affinity biosensing applications where extreme sensitivity is not the primary requirement [4] [2].
SAW sensors, particularly SH-SAW and Love wave devices, offer a clear advantage in sensitivity and miniaturization potential due to their higher operating frequencies. They are the preferred choice when detecting very low analyte concentrations or when integration into compact, portable diagnostic systems is the goal [7] [3] [5].
Future developments are focused on pushing the boundaries of sensitivity through higher frequency devices like FBARs, improving integration with microfluidics for minimal sample consumption, and developing advanced surface chemistries for greater specificity and reduced non-specific binding [3] [9]. By understanding their fundamental principles and performance trade-offs, researchers and drug development professionals can effectively leverage these versatile tools to advance their scientific objectives.
In the fields of pharmaceutical development and biomedical research, the label-free, real-time monitoring of biomolecular interactions is a critical capability. Among the technologies that enable this, acoustic wave sensors have emerged as powerful tools. This guide focuses on the Quartz Crystal Microbalance (QCM), a type of Bulk Acoustic Wave (BAW) sensor, and its foundational model—the Sauerbrey equation. QCM transducers are distinguished by their high sensitivity, ruggedness, and ability to operate in liquid environments, making them particularly suitable for investigating biological analytes in diagnostic and drug development applications [3]. The core principle of QCM is a mass-frequency effect, where a change in mass on the sensor surface leads to a proportional shift in the resonant frequency of the oscillating quartz crystal [3]. This guide will objectively compare QCM's performance with a key alternative, Surface Acoustic Wave (SAW) sensors, and provide the experimental data and methodologies necessary for researchers to make an informed selection for their specific applications.
Fundamental Operating Principles
QCM and SAW sensors, while both based on piezoelectricity, operate through fundamentally different acoustic wave propagation modes, leading to distinct performance characteristics.
QCM (Bulk Acoustic Wave): In a QCM sensor, a thin disc of piezoelectric material (typically AT-cut quartz) is sandwiched between two metal electrodes. Applying an alternating voltage induces a thickness shear mode (TSM) deformation, meaning the acoustic wave propagates through the bulk of the crystal in the direction of its thickness [3]. This shear-horizontal motion is crucial as it does not radiate significant energy into adjacent liquids, permitting stable operation in solution—a prerequisite for most biosensing applications [3] [10].
SAW (Surface Acoustic Wave): SAW devices feature Interdigital Transducers (IDTs) patterned on a piezoelectric substrate. When a voltage is applied, a surface acoustic wave (typically a Rayleigh wave) is generated that travels along the surface of the material [3]. This wave has both longitudinal and shear vertical components, which couple strongly with the medium in contact with the surface. This coupling makes conventional SAW devices susceptible to excessive damping in liquids, limiting their use in many biological sensing contexts without specialized designs like Love wave sensors [3] [11].
Performance Comparison Table
The following table summarizes the key technical and performance characteristics of QCM and SAW biosensors, highlighting their differences.
| Characteristic | Quartz Crystal Microbalance (QCM) | Surface Acoustic Wave (SAW) Biosensor |
|---|---|---|
| Wave Type | Bulk Acoustic Wave (BAW) [3] | Surface Acoustic Wave [3] |
| Propagation Mode | Thickness Shear Mode (TSM) [3] | Rayleigh Wave, Love Wave, etc. [3] [11] |
| Typical Frequency Range | 5–20 MHz (Fundamental); up to ~200 MHz with HFF-QCMs [3] | 80–300 MHz and higher [3] [11] |
| Mass Sensitivity | ~177 pg/Hz·mm² for a 5 MHz crystal [11] | Higher than QCM; e.g., Love wave can reach ~19 pg/Hz·mm² [11] |
| Liquid Phase Operation | Excellent; low damping due to shear wave [3] [10] | Poor for Rayleigh SAW; requires specialized designs (e.g., Love wave) for liquid use [3] |
| Primary Sensing Outputs | Frequency shift (Δf) and Dissipation (ΔD) [12] [10] | Phase shift (mass) and Amplitude change (viscosity) [11] |
| Key Advantage | Robust liquid operation, cost-effective, well-established | Higher mass sensitivity, potential for multiplexing |
| Key Limitation | Lower fundamental sensitivity compared to SAW | Liquid damping challenges, more complex fabrication |
The Sauerbrey Equation: Theory, Application, and Limitations
Theoretical Foundation
The Sauerbrey equation is the foundational model connecting the mass adsorbed on a QCM sensor surface to the observed change in its resonant frequency. It was derived for a thin, rigid, and uniformly distributed mass that oscillates synchronously with the quartz crystal itself [12] [10]. The equation is expressed as:
Δf = - (2 * f₀² * Δm) / (A * √(μq * ρq))
Where:
- Δf is the measured frequency shift in Hz.
- f₀ is the fundamental resonant frequency of the quartz crystal.
- Δm is the mass change in grams.
- A is the piezoelectrically active area in cm².
- μq is the shear modulus of quartz (2.947 × 10¹¹ g·cm⁻¹·s⁻²).
- ρq is the density of quartz (2.648 g·cm⁻³) [10].
For a 5 MHz AT-cut quartz crystal, the constant terms are often consolidated, simplifying the equation to Δf = -C * Δm, where C is the mass sensitivity constant (17.7 ng·cm⁻²·Hz⁻¹ for a 5 MHz crystal) [13].
When is the Sauerbrey Equation Valid?
The Sauerbrey equation is a deceptively simple model with strict conditions for its validity. Its proper application is critical for accurate mass quantification.
Condition 1: The Film Must Be Thin and Rigid. The model assumes the adsorbed layer is an extension of the crystal itself. A "thin" film is generally one that causes a frequency shift of less than 2% of ( f0 ) [10]. A "rigid" film does not dissipate energy, meaning it is purely elastic. The rigidity can be assessed by measuring the dissipation (D) or half-bandwidth shift (ΔΓ) using a QCM-D instrument. For a rigid film, the change in dissipation (ΔD) is close to zero, and the dissipation shift is significantly smaller than the frequency shift (ΔD << Δf / ( f{01} )) [12] [10].
Condition 2: The Film Must Be Uniformly Attached. The mass must be firmly anchored to the sensor surface to ensure coupled oscillation.
Experimental Diagnosis with QCM-D: The validity of the Sauerbrey equation can be confirmed experimentally by observing two key signatures in QCM-D data:
- Low Energy Dissipation: ΔD is minimal for all measured harmonics (overtones) [12].
- Overlapping Harmonics: The normalized frequency shifts (Δf / n) for all measured harmonics (e.g., 3rd, 5th, 7th) overlap nearly perfectly [12]. If the normalized shifts diverge, it indicates the film is viscoelastic, and the Sauerbrey equation should not be used.
Flowchart: Decision process for Sauerbrey equation validity. A valid scenario requires low dissipation and overlapping harmonics [12] [10].
Advanced Considerations and Practical Models
The classical Sauerbrey equation assumes a uniform mass sensitivity across the entire electrode area. However, research has demonstrated that the mass sensitivity of a QCM follows a Gaussian distribution, with the highest sensitivity at the center of the electrode and decreasing exponentially towards the edges [13]. Furthermore, the electrodes' size, shape, and thickness influence this distribution.
This has led to the development of more practical models that replace the constant ( C ) in the Sauerbrey equation with an equivalent mass sensitivity (( C^* )) that integrates the sensitivity function over the specific area where mass is loaded [13]. The error from using the classic Sauerbrey equation becomes more significant as the electrode size decreases, which is particularly relevant for high-frequency microbalances [13].
Experimental Data and Methodologies
Experimental Protocol: Validating a Practical QCM Model
Objective: To verify a practical QCM model that accounts for Gaussian mass sensitivity distribution and electrode effects, challenging the classical Sauerbrey equation [13].
Materials:
- QCM Sensors: 10 MHz AT-cut quartz wafers (8.7 mm diameter).
- Deposition System: Gold sputtering/evaporation system.
- Frequency Monitor: High-precision network or impedance analyzer.
Methodology:
- Initial Electrode Deposition: Divide quartz wafers into groups. Sputter circular gold electrodes of defined diameters (e.g., 5.1 mm) and thicknesses (500 Å or 1000 Å) onto both sides of the wafers. Measure and record the resonant frequency (( f_1 )).
- Secondary Mass Loading: In a second deposition step, add a second, smaller circular gold layer (e.g., 4.5 mm or 4.0 mm diameter, 300 Å thick) to the upper surface of different sensor groups.
- Frequency Measurement: Precisely measure the new resonant frequency (( f2 )) after the second deposition. The frequency shift is ( Δf = f2 - f_1 ).
- Data Analysis: Compare the experimentally observed frequency shift with the shifts predicted by both the classical Sauerbrey equation and the new practical model. The practical model, which incorporates the Gaussian sensitivity distribution, has been shown to align more closely with the experimental data, especially for smaller electrode sizes [13].
Comparative Sensor Performance
QCM in Dew Point Sensing: A 2024 study systematically evaluated the role of electrode wettability on QCM performance as a dew point sensor [14]. QCM electrodes were functionalized with different silanes (PFOTMS, MPTMS) and cleaning methods (ultrasonic, plasma) to create surfaces with varying wettability.
- Key Finding: Electrodes with lower wettability (higher contact angle, such as those treated with plasma-PFOTMS) promoted the formation of more spherical and densely distributed dew droplets. This rigid condensation behavior resulted in a sensor with superior identification characteristics and a very low maximum measurement error of < 0.38 °C at the dew point [14]. This underscores the importance of surface properties for QCM performance even in gas-phase sensing.
SAW in Pharmaceutical Quality Control: SAW biosensors are being developed for the functional characterization of biopharmaceuticals. A study used a Love-wave SAW biosensor to characterize the binding affinity and kinetics between somatropin (recombinant human growth hormone) and a specific antibody [11].
- Key Advantage: The SAW biosensor provided not only affinity (KD) data but also information on viscoelastic effects, offering a more comprehensive functional profile than just mass loading. This showcases SAW's utility in critical quality control and biosimilar development within a pharmaceutical context [11].
The Scientist's Toolkit: Essential Research Reagents and Materials
Successful QCM and SAW experiments require careful selection of materials and surface chemistry. The following table details key solutions and their functions.
| Item / Solution | Function in QCM/SAW Experiments |
|---|---|
| AT-cut Quartz Crystals | The piezoelectric substrate that generates the acoustic wave. AT-cut provides stable temperature performance around room temperature [3]. |
| Gold Electrode Sensors | The most common electrode material; provides a stable, bio-compatible surface for functionalization [13]. |
| Self-Assembled Monolayer (SAM) Kits | Provide organosulfur compounds (e.g., alkanethiols) to form a well-defined, functionalized monolayer on gold for biomolecule immobilization. |
| Carboxymethyldextran | A hydrogel polymer coated on sensor surfaces to create a 3D matrix that increases binding capacity and minimizes non-specific binding [11]. |
| EDC/NHS Crosslinking Kit | A common carbodiimide chemistry kit for covalent immobilization of biomolecules (e.g., antibodies, proteins) onto carboxylated surfaces [11]. |
| Phosphate Buffered Saline (PBS) | A standard buffer for diluting samples and maintaining a stable pH and ionic strength during biological experiments. |
| BSA or Surfactant Solutions | Used to block unused binding sites on the sensor surface to minimize non-specific adsorption of analyte. |
QCM and SAW biosensors are complementary, not competing, technologies. The selection between them should be driven by the specific requirements of the experiment.
- Choose QCM when the experimental environment involves liquids, when cost-effectiveness and operational simplicity are priorities, and when the system under study is amenable to analysis with a robust, well-understood technology. Its compatibility with the Sauerbrey equation for rigid masses provides a straightforward path to mass quantification.
- Choose SAW when the highest possible mass sensitivity is required, the application can accommodate specialized liquid-handling designs (e.g., Love wave), or the platform is intended for gas-phase sensing or telecommunications-integrated devices.
The future of acoustic biosensing is bright, driven by trends in both technologies. For QCM, advances include the development of high-frequency fundamental (HFF) QCMs (e.g., 195 MHz) for enhanced sensitivity and more sophisticated modeling that moves beyond the Sauerbrey equation for soft, viscoelastic films [3] [13]. For SAW, the push is towards multiplexed, point-of-care diagnostic platforms and their inclusion in pharmaceutical quality control guidelines, leveraging their high sensitivity for label-free detection of clinical biomarkers [15] [11]. For researchers in drug development, both technologies offer powerful, label-free methods to characterize biomolecular interactions, with the optimal choice residing in a careful balance of sensitivity, operational environment, and analytical need.
In the field of label-free biosensing, piezoelectric acoustic sensors have emerged as powerful tools for detecting a wide range of biological and chemical analytes. These devices transform the binding events between a sensor surface and target molecules into measurable electrical signals based on mass changes, without requiring fluorescent or radioactive labels [3]. Among these technologies, Quartz Crystal Microbalance (QCM) and Surface Acoustic Wave (SAW) sensors represent two principal transducer types with distinct operational principles and performance characteristics. While both leverage the piezoelectric effect, they differ fundamentally in how acoustic waves propagate through the device structure, leading to significant implications for their sensitivity, applications, and operational constraints [3] [16]. SAW sensors, which confine acoustic energy to the surface, typically offer higher sensitivity and operational frequencies compared to QCM systems, where wave propagation occurs through the bulk of the material [16]. This performance advantage is largely enabled by two critical components: Rayleigh waves, a specific type of surface acoustic wave, and Interdigital Transducers (IDTs), the electrode structures that generate and detect these waves. Understanding the interplay between these components provides the foundation for selecting appropriate biosensing platforms for specific applications in pharmaceutical research, clinical diagnostics, and environmental monitoring.
Table 1: Fundamental Comparison of Acoustic Wave Sensor Types
| Characteristic | SAW Sensor | QCM Sensor |
|---|---|---|
| Acoustic Wave Type | Surface Wave | Bulk Wave (Thickness Shear Mode) |
| Typical Frequency Range | 10 MHz to 3 GHz [16] | 5-30 MHz [3] [16] |
| Primary Sensing Mechanism | Changes in wave velocity and amplitude due to surface perturbations [3] [17] | Mass loading and viscoelastic effects [3] |
| Sensitivity Level | High (picogram range) [16] | Lower than SAW [16] |
| Liquid Phase Operation | Challenging for Rayleigh waves due to energy radiation [3] [16] | Well-suited [3] |
| Temperature Range | 25°C to 1000°C (dependent on materials) [16] | -190°C to 125°C [16] |
Theoretical Foundations: Rayleigh Waves and IDTs
Rayleigh Wave Propagation
Rayleigh waves, first identified by Lord Rayleigh in 1885, are surface acoustic waves that travel along the surface of elastic half-spaces, with their energy concentrated within approximately one wavelength depth from the surface [18] [16]. In piezoelectric materials, these waves exhibit both mechanical displacement components and an accompanying electrical potential wave, making them highly sensitive to surface perturbations. The mechanical displacement occurs in an elliptical pattern, combining both surface-normal and surface-parallel components with respect to the propagation direction [16]. This specific displacement characteristic is what makes standard Rayleigh waves susceptible to significant energy loss in liquid environments, as the surface-normal component couples strongly with the fluid medium, leading to excessive damping [3] [16]. In layered structures consisting of a piezoelectric film on a substrate, multiple Rayleigh modes can propagate when the shear bulk acoustic wave velocity in the substrate exceeds that in the overlayer, creating what is known as a "slow on fast" structure [18]. The ZnO/fused silica combination represents a typical example of this configuration, with shear BAW velocities of 3766 m/s in fused silica and 2829 m/s in ZnO respectively [18].
Interdigital Transducer Design and Function
Interdigital Transducers serve as the critical components for both generating and detecting surface acoustic waves in piezoelectric substrates. These transducers consist of a series of thin-film metallic electrodes arranged in a periodic pattern on the surface of the piezoelectric material [18]. When an alternating voltage is applied to the input IDT, it creates a periodic electric field that induces a corresponding periodic strain field in the piezoelectric substrate through the inverse piezoelectric effect, thereby generating surface acoustic waves [18]. These waves propagate along the surface and are subsequently converted back into an electrical signal by the output IDT through the direct piezoelectric effect. The geometric parameters of IDTs, including finger width and spacing, finger overlap length, and the number of finger pairs, fundamentally determine the operational characteristics of the SAW device [18]. The finger periodicity defines the wavelength (λ) of the travelling acoustic mode, which directly influences the operating frequency according to the relationship f = v/λ, where v is the acoustic velocity of the substrate material [18]. Split-finger IDT configurations with a metallization ratio of 0.5 are particularly effective for suppressing unwanted harmonics and enabling highly efficient excitation of the third harmonic, thereby allowing operation at higher frequency ranges without requiring advanced nanofabrication techniques [18].
Performance Comparison: SAW vs. QCM Biosensors
Quantitative Performance Metrics
Direct comparison of SAW and QCM technologies reveals distinct performance advantages and limitations that inform their appropriate application domains. SAW sensors typically operate at significantly higher frequencies (ranging from hundreds of MHz to several GHz) compared to QCM devices (generally limited to 5-30 MHz) [3] [16]. This frequency differential translates directly to mass sensitivity, with SAW sensors capable of detecting mass changes in the picogram range (10⁻¹² g), while QCM sensitivity typically reaches the nanogram level (10⁻⁹ g) [3] [16]. The higher operational frequency of SAW devices stems from their surface-confined acoustic energy, which enables more efficient coupling to surface-bound analytes. However, this surface confinement also presents challenges for liquid-phase applications when using conventional Rayleigh wave devices, as the energy loss through coupling with the liquid medium can reduce sensitivity by up to 40% compared to gas-phase performance [19]. QCM devices, as thickness shear mode resonators, do not radiate considerable energy into liquids and therefore maintain stable operation in liquid environments, making them preferable for many biological sensing applications involving aqueous solutions [3].
Table 2: Comprehensive Performance Comparison for Biosensing Applications
| Performance Parameter | SAW Sensor | QCM Sensor |
|---|---|---|
| Detection Limit | ~Picograms (10⁻¹² g) [16] | ~Nanograms (10⁻⁹ g) [16] |
| Liquid Phase Performance | Excessive damping for Rayleigh waves [3]; requires specialized configurations | Excellent; minimal damping loss [3] |
| Temperature Stability | High (with quartz substrates) [20] | Moderate [16] |
| Fundamental Sensitivity | Higher due to energy concentration at surface [16] | Lower due to bulk wave propagation [16] |
| Manufacturing Cost | Low (established piezoelectric supply chains) [19] | Low to moderate [16] |
| Integration Potential | High (compatible with CMOS) [16] | Moderate |
Application-Specific Performance
The selection between SAW and QCM technologies depends heavily on the specific application requirements and operational environment. SAW sensors excel in gas-sensing applications, high-temperature environments (up to 1000°C with appropriate materials like langasite), and situations demanding ultra-high sensitivity to surface mass changes [17] [16]. Their compatibility with CMOS technology and capacity for miniaturization make them particularly suitable for integration into portable monitoring systems and IoT devices [19] [21]. Recent innovations in SAW biosensing have employed alternative wave modes like Love waves or shear horizontal waves to overcome the liquid damping limitations of Rayleigh waves, expanding their applicability to biological detection [16]. QCM systems demonstrate superior performance for liquid-phase applications, including biomedical diagnostics, protein adsorption studies, and cell adhesion monitoring [3] [22]. A recent QCM biosensor for SARS-CoV-2 detection achieved a detection limit of 53.3 TCID₅₀/mL with results available in approximately 15 minutes, demonstrating the clinical utility of this platform for rapid diagnostics [22]. Recent advancements in microfluidic QCM (μ-QCM) designs have demonstrated a remarkable 10-fold improvement in dissipation compared to conventional QCM when operating in liquids, significantly enhancing their potential for point-of-care applications [9].
Experimental Protocols and Methodologies
Fabrication of Rayleigh Wave SAW Sensors
The implementation of high-performance SAW sensors requires meticulous fabrication methodologies to ensure precise electrode patterning and optimal acoustic wave propagation. A representative protocol for creating a ZnO/SiO₂ SAW sensor begins with the deposition of a high-quality piezoelectric zinc oxide (ZnO) layer, typically ranging from 1.8 to 6.6 μm thick, onto a fused silica substrate using radio frequency magnetron sputtering [18]. This process creates a highly oriented c-axis ZnO film essential for efficient piezoelectric coupling. The IDT patterning follows, employing photolithographic techniques to define the interdigitated electrode structure with specific wavelength parameters (e.g., λ = 80 μm) [18]. For Rayleigh wave devices, a split-finger configuration with a metallization ratio of 0.5 is often implemented to minimize internal reflections and enable efficient excitation of harmonic frequencies [18]. Aluminum represents the most common electrode material due to its favorable acoustic properties and compatibility with standard semiconductor fabrication processes, with thicknesses typically around 150 nm [20]. To suppress unwanted transversal modes that can degrade device performance, dummy finger structures are incorporated at the busbars, creating an energy barrier that concentrates more acoustic energy in the aperture region [20]. Finally, the sensing area may be functionalized with appropriate recognition layers (e.g., antibodies, aptamers, or molecularly imprinted polymers) specific to the target analyte [3] [17].
QCM Biosensor Implementation
QCM biosensor implementation follows a distinct protocol leveraging the thickness shear mode operation of AT-cut quartz crystals. A standard methodology involves functionalizing the gold electrode surface of quartz crystals (typically 5-20 MHz fundamental frequency) with a polyethylene glycol-based coating to improve sensitivity and specificity for target analytes [22]. This surface modification creates a stable foundation for immobilizing biological recognition elements such as antibodies, DNA probes, or aptamers. For biosensing applications, the functionalized QCM crystal is incorporated into a flow cell system that allows precise control of sample introduction and temperature regulation [22]. The measurement apparatus typically includes a network analyzer or specialized QCM measurement system to monitor resonance frequency (Δf) and dissipation (ΔD) shifts simultaneously as the target analyte binds to the sensor surface [22] [9]. Recent innovations in microfluidic QCM (μ-QCM) design have demonstrated that confining sample liquids in parallel rigid microfluidic channels (e.g., 2 μm × 10 μm cross-section) oriented perpendicular to the shearing direction of the QCM crystal can reduce dissipation by an order of magnitude while maintaining significant mass coupling [9]. This approach enables direct data interpretation, reduces sample volume requirements to microliter levels, and simplifies temperature control, making it particularly advantageous for point-of-care diagnostic applications [9].
The Scientist's Toolkit: Essential Research Reagents and Materials
Table 3: Key Research Materials for Acoustic Wave Biosensor Development
| Material/Reagent | Function | Application Examples |
|---|---|---|
| Piezoelectric Substrates (Quartz, LiNbO₃, LiTaO₃) [3] [16] | Provides the medium for acoustic wave generation and propagation | ST-cut quartz for temperature-stable SAW devices; AT-cut quartz for QCM [16] [20] |
| IDT Electrode Materials (Aluminum, Gold) [18] [20] | Forms interdigital transducers for wave generation/detection; provides surface for functionalization | Aluminum electrodes for standard SAW devices; Gold electrodes for QCM biosensors [22] [20] |
| Piezoelectric Thin Films (ZnO, AlN) [18] [16] | Enables SAW generation on non-piezoelectric substrates; enhances electromechanical coupling | ZnO films on fused silica for cost-effective SAW sensors [18] |
| Surface Recognition Layers (Antibodies, Aptamers, MIPs) [3] [17] | Provides selective binding sites for target analytes | Anti-SARS-CoV-2 antibodies for COVID detection; DNA aptamers for E. coli detection [22] [16] |
| Polymer Coatings (PEG, Parylene) [22] [17] | Improves biocompatibility; reduces non-specific binding; protects from harsh environments | PEG-based functionalization for SARS-CoV-2 QCM biosensor [22] |
| Nanomaterial Composites (MOFs, Graphene Oxide) [17] | Enhances sensitivity and selectivity; increases surface area for analyte capture | Metal-organic frameworks for SAW gas sensors [17] |
Technological Visualizations
The comparative analysis of SAW and QCM biosensor technologies reveals complementary strengths that position each platform for specific application domains. SAW sensors, leveraging Rayleigh waves and sophisticated IDT designs, offer superior sensitivity, higher operational frequencies, and enhanced miniaturization potential, making them ideal for gas sensing, high-temperature applications, and detection scenarios demanding ultimate sensitivity [17] [16]. Recent material advances, including the development of langasite substrates for ultra-high-temperature operation and hybrid substrate designs, continue to expand the capabilities of SAW sensing platforms [19] [21]. Conversely, QCM systems provide robust performance in liquid environments, simpler implementation protocols, and proven reliability for biomedical applications including pathogen detection and protein interaction studies [3] [22]. Emerging innovations such as microfluidic QCM designs address traditional limitations in dissipation, further enhancing their potential for point-of-care diagnostics [9]. For researchers and drug development professionals, selection between these technologies should be guided by specific application requirements: SAW sensors for ultimate sensitivity in gas-phase or specialized liquid-phase configurations, and QCM platforms for straightforward implementation in biological liquids. Future developments in both fields will likely focus on increasing integration with wireless platforms, enhancing multi-analyte detection capabilities, and further improving sensitivity through nanomaterial incorporation and advanced signal processing methodologies.
Acoustic wave devices represent a cornerstone of modern sensing and frequency control technology. These devices function as gravimetric chemical and biochemical sensors, operating on a label-free detection mechanism where the fundamental property of any target analyte—its mass—is monitored by the transducer [3]. The core principle involves the transformation of an electrical signal into a mechanical wave; this wave's propagation characteristics are altered by interactions at the device's surface, and these changes are subsequently converted back into a measurable electrical signal [23]. This electromechanical coupling is enabled by the use of piezoelectric materials, such as quartz, lithium niobate, or aluminum nitride, which generate acoustic waves in response to an applied electric field [3] [23].
The significance of these transducers lies in their exceptional sensitivity, capability for miniaturization, and ability to function in diverse environments, making them indispensable in applications ranging from telecommunications to clinical diagnostics [3]. Acoustic wave devices are primarily categorized into two distinct classes based on their wave propagation mode: Bulk Acoustic Wave (BAW) devices, where the acoustic wave travels through the bulk of the piezoelectric material, and Surface Acoustic Wave (SAW) devices, where the acoustic wave propagates along the surface of the substrate [3]. This article provides a detailed comparative analysis of these two technologies, focusing on their underlying mechanics, performance characteristics, and suitability for specific applications, particularly in biosensing.
Working Principles and Fundamental Mechanics
Bulk Acoustic Wave (BAW) Transducers
In Bulk Acoustic Wave (BAW) devices, the acoustic energy propagates through the entire thickness of the piezoelectric material. A key representative of this family is the Quartz Crystal Microbalance (QCM), which is a type of thickness shear mode (TSM) resonator [3]. A typical QCM consists of a thin, AT-cut quartz wafer with electrodes patterned on both sides. When an alternating voltage is applied across these electrodes, it induces a shear deformation that propagates through the bulk of the crystal. This device is highly sensitive to any surface perturbations, such as mass adsorption [3]. The resonance frequency of a BAW resonator is inversely proportional to the thickness of the piezoelectric layer. Consequently, achieving higher operating frequencies requires thinner wafers, which presents manufacturing and durability challenges [3]. A more advanced BAW variant, the Film Bulk Acoustic Resonator (FBAR), utilizes a thin piezoelectric film that can resonate at much higher frequencies, often in the GHz range, making it suitable for high-frequency radio frequency (RF) applications [3] [24].
Surface Acoustic Wave (SAW) Transducers
Surface Acoustic Wave (SAW) devices operate by confining acoustic energy to the surface of the piezoelectric substrate. The wave propagation is typically described by Rayleigh waves, which possess both longitudinal and shear vertical components [3]. A defining feature of SAW devices is the Interdigital Transducer (IDT), which is fabricated directly onto the piezoelectric material's surface. The IDT functions as the primary component for both generating and detecting the acoustic waves [3]. When an electric voltage is applied to the IDT, it generates mechanical waves that travel along the substrate surface between the transducers. The confinement of energy to the surface makes SAW devices extremely sensitive to surface interactions, including mass loading, changes in conductivity, and viscoelastic properties [3]. However, a significant limitation of conventional Rayleigh-wave-based SAW devices is their excessive damping loss in liquid media, which restricts their use in many biochemical sensing applications that require aqueous environments [3]. To overcome this, specialized modes like the Shear Horizontal Surface Acoustic Wave (SH-SAW) have been developed, which are more suitable for liquid-phase operation [25].
The following diagram illustrates the fundamental structural and wave propagation differences between BAW and SAW resonators.
Comparative Performance Analysis
The fundamental differences in the mechanics of BAW and SAW transducers lead to distinct performance characteristics, which determine their suitability for various applications. The following table provides a structured summary of their key attributes.
Table 1: Comprehensive Comparison of BAW and SAW Transducer Characteristics
| Aspect | Bulk Acoustic Wave (BAW) | Surface Acoustic Wave (SAW) |
|---|---|---|
| Full Name | Bulk Acoustic Wave [23] | Surface Acoustic Wave [23] |
| Working Principle | Acoustic waves travel through the bulk of the piezoelectric material [3] [23]. | Acoustic waves travel along the surface of the substrate [3] [23]. |
| Typical Frequency Range | QCM: 5-20 MHz; FBAR: GHz range [3]. | Typically up to 2-3 GHz, with some higher frequency variants [3] [23]. |
| Liquid Phase Operation | Excellent; shear waves do not radiate considerable energy into the liquid, making QCM and FBAR suitable for biosensing in liquids [3]. | Poor for conventional SAW; excessive damping loss in liquids. SH-SAW is better suited for liquid sensing [3] [25]. |
| Mass Sensitivity | High (pg level) [3]. | Extremely high; energy confinement at the surface enhances sensitivity to surface perturbations [3]. |
| Temperature Stability | Good (BAW filters offer better thermal stability) [23]. | Less stable at higher temperatures [23]. |
| Quality (Q) Factor | BAW resonators generally have a better Q factor than SAW in the 2+ GHz range [24]. | Lower Q factor compared to BAW at higher frequencies [24]. |
| Key Advantages | Ruggedness, ability to work in liquids, high Q factor at high frequencies (for FBAR) [3] [24]. | High sensitivity, compact size, cost-effectiveness for lower frequencies [3] [23]. |
| Primary Limitations | Higher frequency operation requires fragile, thinner wafers [3]. | Poor performance in liquids, limited high-frequency performance, lower thermal stability [3] [23]. |
Experimental Protocols and Methodologies
Resonance and Quality Factor Measurement
A fundamental experimental protocol for characterizing both BAW and SAW devices involves measuring their resonance frequency and quality factor (Q factor). The Q factor is a critical parameter indicating the sharpness of the resonance and directly influences sensor resolution, particularly for detecting small analyte concentrations [26].
Methodology:
- Equivalent Circuit Modeling: The piezoelectric resonator is modeled using a Butterworth-van Dyke (BVD) equivalent circuit. This circuit consists of a motional arm (L~m~, C~m~, R~m~) in parallel with a static capacitance (C~0~). The motional branch represents the electromechanical resonance, while C~0~ accounts for the electrode capacitance [26].
- Electrical Response Measurement: The electrical response (admittance, impedance, or scattering parameter S~11~) of the resonator is measured over a frequency range spanning its resonance using a vector network analyzer (VNA) [26].
- Parameter Extraction: The values of L~m~, C~m~, R~m~, and C~0~ are extracted by fitting the measured data to the BVD model. The series resonant frequency (f~s~) is calculated as f~s~ ≈ 1 / (2π√(L~m~C~m~)) [26].
- Q Factor Calculation: The quality factor can be calculated from the S~11~ spectrum using the formula: Q ≈ f~min~ / Δf~3dB~, where f~min~ is the frequency at which the magnitude of S~11~ is minimum, and Δf~3dB~ is the -3 dB bandwidth around f~min~ [26].
Advanced Technique: Q Factor Enhancement via Fano Resonance Recent experimental work has demonstrated a method to significantly enhance the Q factor of piezoelectric sensors by exploiting Fano resonances. This is achieved by connecting an external shunt capacitor (C~p~) in parallel to the static capacitor (C~0~) of the resonator. By carefully adjusting C~p~, the series (f~s~) and parallel (f~p~) resonant frequencies are brought closer together, creating an asymmetric Fano lineshape with a very steep dispersion. This method has been shown to enhance the Q factor of a SAW resonator by a factor of up to 8, dramatically improving its potential sensing resolution [26].
Liquid Sensing and Viscosity Measurement Protocol
For biosensing applications, characterizing device performance in liquid environments is essential. The following protocol outlines a method for optimizing and testing a SAW resonator for liquid sensing.
Methodology:
- Device Design and Fabrication: A one-port SAW resonator is fabricated on a piezoelectric substrate like LiNbO~3~. The gap between the Interdigital Transducer (IDT) and the reflector is a critical design parameter and can be optimized (e.g., to 1.5λ, where λ is the wavelength) to contain most of the piezoelectric displacement [25].
- Microfluidic Cell Integration: A microfluidic cell is designed and positioned to place a liquid droplet precisely over the optimized IDT-reflector gap region. Studies suggest that optimal sensing performance is achieved when the liquid droplet size is about 10% of the device's aperture and placed in the middle of the gap [25].
- Sample Introduction and Measurement: Aqueous solutions with varying concentrations of an analyte (e.g., glycerine solutions from 0% to 100% to study viscosity) are introduced into the microfluidic cell [25].
- Signal Response Analysis: The resonant frequency, magnitude of the S-parameter, and phase of the propagating wave are measured for each solution. For liquids with higher viscosity, the phase response becomes a key sensing parameter. A formulated equation can be used to determine the "turnover viscosity," which indicates a shift in the direction of the signal response [25].
The experimental workflow for such a liquid sensing study is visualized below.
Essential Research Reagent Solutions and Materials
The development and application of BAW and SAW biosensors require a suite of specialized materials and reagents. The following table details key components and their functions in sensor fabrication and experimental procedures.
Table 2: Key Research Reagents and Materials for Acoustic Biosensor Development
| Reagent/Material | Function and Application |
|---|---|
| Piezoelectric Substrates (Quartz, Lithium Niobate (LiNbO~3~), Aluminum Nitride (AlN)) | The foundational material that generates and propagates acoustic waves. Quartz (AT-cut) is standard for QCM; LiNbO~3~ is common for SAW for its strong piezoelectric coefficient; AlN is used for high-performance BAW/FBAR devices [3] [23]. |
| Receptor Coatings (Antibodies, Aptamers, DNA, Molecularly Imprinted Polymers (MIPs)) | The biorecognition element immobilized on the sensor surface. These layers provide selectivity by specifically binding to the target analyte (e.g., virus, protein, biomarker) [3]. |
| Functionalized Polymeric Layers (e.g., PMMA) | Used as a matrix for receptor immobilization or as a sensitive layer itself. Can be doped with nanoparticles (e.g., Graphene Oxide) to enhance sensitivity or specificity, for instance in humidity sensing [26]. |
| Nanoparticles & Nanomaterials (Gold Nanoparticles, Carbon Nanotubes, Graphene Oxide) | Used to enhance the sensor's surface area, improve signal transduction, and facilitate the immobilization of biorecognition elements, thereby amplifying the sensor response [3]. |
| Standard Analytic Solutions (Glycerine, Ethanol, BSA) | Used for sensor calibration and performance characterization in liquid phase. Glycerine solutions of varying concentrations are commonly used to study viscosity-dependent response [25]. |
| External Shunt Capacitor | A discrete electronic component used in experimental setups to induce Fano resonance, which drastically enhances the quality factor (Q factor) and thus the resolution of the piezoelectric sensor [26]. |
Application in Biosensing and Market Outlook
The distinct characteristics of BAW and SAW transducers define their niches in biosensing and commercial markets. BAW-based devices, particularly QCM, are extensively used for label-free biosensing in liquid environments, including the detection of bacteria, viruses, clinical biomarkers, and whole cells [3]. Their ruggedness and reliable performance in fluids make them a workhorse in research and diagnostic laboratories.
In contrast, SAW sensors find stronger application in gas and vapor phase sensing due to their high surface sensitivity [3]. While their use in liquids is limited, specialized designs like Shear Horizontal (SH)-SAW are engineered for liquid-phase applications such as monitoring binding events in microfluidic systems [25].
The commercial market for both SAW and BAW filters is experiencing robust growth, projected to reach a multi-billion dollar market by 2032-2033 with a Compound Annual Growth Rate (CAGR) of 5.4% to 9.5% [27] [28]. This growth is primarily fueled by the proliferation of 5G wireless technology, the Internet of Things (IoT), and advanced consumer electronics [27] [28]. In this commercial landscape, BAW filters are increasingly favored for high-frequency applications (above 3 GHz) in 5G smartphones and infrastructure, as well as in Wi-Fi 6/6E systems, due to their superior performance, thermal stability, and lower insertion loss at these frequencies [28] [23]. SAW filters remain dominant in cost-sensitive, lower-frequency applications (up to ~2.5 GHz), including standard cellular bands and GPS, benefiting from a simpler manufacturing process and lower cost [24] [23].
The comparative analysis of Bulk Acoustic Wave and Surface Acoustic Wave transducers reveals a clear trade-off between sensitivity, operational frequency, environmental suitability, and cost. BAW technology, exemplified by QCM and FBAR, offers robustness, high Q factors, and excellent performance in liquid media, making it the preferred choice for detailed biochemical interaction analysis and high-frequency RF filtering. SAW technology provides exceptional mass sensitivity at the surface and cost advantages for lower-frequency applications but is generally limited in liquid-phase sensing and extreme thermal environments. The choice between BAW and SAW is therefore not a matter of superiority, but of application-specific suitability. Future developments will likely focus on hybrid approaches, advanced materials like gradient piezoelectric composites [29], and novel resonance schemes [26] to further push the boundaries of sensitivity, integration, and operational range for these versatile transducers.
Piezoelectric acoustic biosensors are a class of analytical devices that transform a biological binding event into a measurable electrical signal through mechanical acoustic waves [3]. Among these, Quartz Crystal Microbalance (QCM) and Surface Acoustic Wave (SAW) devices represent two prominent technological approaches with distinct operational principles and performance characteristics. The core advantage of these transducers lies in their label-free detection mechanism, which allows for the recognition of target analytes based on intrinsic properties without requiring external reagents or labeling steps [3]. This review provides a systematic comparison of QCM and SAW biosensors, focusing specifically on their operational frequency ranges and the fundamental design constraints that ultimately determine their applicability in biosensing. As the demand for highly sensitive, real-time, and portable biosensing platforms grows in pharmaceutical and diagnostic applications, understanding these inherent technological trade-offs becomes essential for researchers selecting appropriate transducer platforms for specific biological detection challenges.
Fundamental Operating Principles and Frequency Characteristics
Operational Mechanisms and Wave Propagation
QCM and SAW devices operate based on distinct acoustic wave propagation mechanisms that fundamentally influence their design and performance. QCM devices are classified as Bulk Acoustic Wave (BAW) resonators, specifically as thickness shear mode (TSM) devices, where the acoustic wave propagates through the entire thickness of the piezoelectric crystal [3]. A typical QCM consists of an AT-cut quartz wafer with symmetrically patterned electrodes on both sides. When an alternating voltage is applied between these electrodes, it induces a shear deformation throughout the crystal bulk, making the device sensitive to surface perturbations [3].
In contrast, SAW devices utilize waves that travel parallel to the surface of the piezoelectric substrate. These devices employ Interdigital Transducers (IDTs) fabricated directly onto the piezoelectric material [3] [30]. When an electric voltage is applied to these IDTs, acoustic waves are generated that travel across the substrate surface, with their energy highly confined to the sensing interface. This fundamental difference in wave propagation—through the bulk versus along the surface—represents the primary distinction between these two transducer technologies and underlies their differing performance characteristics and applications.
Table 1: Fundamental Operating Principles of QCM and SAW Biosensors
| Parameter | QCM | SAW |
|---|---|---|
| Acoustic Wave Type | Bulk Acoustic Wave (BAW) | Surface Acoustic Wave |
| Wave Propagation | Through thickness of crystal | Parallel to surface |
| Primary Mechanism | Thickness Shear Mode (TSM) | Rayleigh or Shear Horizontal waves |
| Transducer Design | Electrodes on both sides | Interdigital Transducers (IDTs) on one side |
| Energy Distribution | Throughout crystal bulk | Confined to surface |
| Typical Substrate | AT-cut quartz | ST-cut quartz, LiNbO₃, LiTaO₃ |
Operational Frequency Ranges
The operational frequency ranges of QCM and SAW sensors differ significantly due to their distinct design architectures, with important implications for their sensing performance. QCM devices typically operate in the 5-30 MHz range for standard commercial applications, with research-grade devices reaching up to 195 MHz [3] [31] [16]. This frequency limitation arises from the inverse relationship between crystal thickness and resonant frequency—higher frequencies require thinner quartz wafers, which eventually become mechanically fragile and impractical to handle [31].
SAW sensors operate at significantly higher frequencies, typically ranging from several hundred MHz to several GHz [16]. This elevated operational range is possible because SAW devices generate acoustic waves along the surface rather than through the bulk material, eliminating the need for excessively thin substrates. The higher achievable frequencies of SAW devices contribute directly to their enhanced mass sensitivity, as predicted by fundamental acoustic sensor theory.
Table 2: Frequency Characteristics and Mass Sensitivity
| Parameter | QCM | SAW |
|---|---|---|
| Standard Frequency Range | 5-30 MHz [16] | 100 MHz - 3 GHz [16] |
| High-Frequency Examples | Up to 195 MHz [3] | Up to GHz range [3] |
| Theoretical Mass Sensitivity | 17.7 ng/(cm²·Hz) for 5 MHz [31] | Significantly higher than QCM [16] |
| Fundamental Relationship | Sensitivity ∝ f₀² [31] | Sensitivity increases with frequency |
| Practical Detection Limit | ~10⁻⁹ g [16] | Picogram range (10⁻¹² g) [16] |
Critical Design Constraints and Performance Limitations
Physical and Mechanical Design Limitations
The pursuit of higher operational frequencies in both QCM and SAW sensors introduces significant design constraints that balance performance against practical implementation. For QCM devices, the most pronounced limitation is the inverse relationship between crystal thickness and resonant frequency, described by the equation: ( h \propto 1/f0 ), where ( h ) is crystal thickness and ( f0 ) is the fundamental frequency [31]. This relationship means that a standard 5 MHz QCM crystal has a thickness of approximately 334 μm, while a 10 MHz crystal must be only half as thick (~167 μm) [31]. As frequencies increase into the hundreds of MHz range, the quartz wafers become exceedingly thin and fragile, presenting substantial manufacturing and handling challenges that limit practical implementation.
SAW sensors circumvent the thickness-frequency constraint through their surface-wave architecture but face different limitations related to IDT design and fabrication. The operational frequency of a SAW device is determined by the periodicity of the IDT fingers (( p )) and the acoustic velocity (( v0 )) of the substrate material according to the relationship ( f0 = v_0 / p ) [30]. Higher frequencies require progressively finer electrode patterns, pushing the limits of photolithographic fabrication techniques. Additionally, SAW devices exhibit strong temperature-frequency dependencies that must be compensated for in precision applications [3].
Diagram 1: Design constraint pathways for QCM (blue) and SAW (red) biosensors showing how fundamental physical limitations affect maximum achievable frequencies.
Liquid-Phase Operation and Viscoelastic Limitations
Operation in liquid environments presents distinct challenges for both QCM and SAW technologies, with important implications for biosensing applications. QCM devices function effectively in liquid media because their thickness shear mode generates shear-horizontal waves that do not radiate considerable energy into the contacting liquid [3]. This characteristic has made QCM the traditional choice for biological sensing in aqueous environments. However, a significant limitation arises when dealing with soft, viscoelastic biological layers, where the Sauerbrey equation—which assumes rigid, uniformly distributed mass—becomes inadequate [32] [33]. Under these conditions, non-monotonic frequency responses can occur, where frequency may paradoxically increase with increased adhered mass for highly lossy, thick films [32].
Conventional Rayleigh-wave SAW devices experience excessive damping in liquids due to their surface-normal displacement component that couples strongly with the fluid medium, radiating compressional waves that severely attenuate the signal [3] [16] [30]. To overcome this limitation, specialized SAW configurations including Shear Horizontal (SH-SAW), Love-wave sensors, and Surface Transverse Wave (STW) devices have been developed [16] [30]. These specialized wave modes minimize vertical displacement components, enabling effective liquid-phase operation while retaining the sensitivity advantages of SAW technology.
Table 3: Liquid-Phase Operation Characteristics
| Parameter | QCM | SAW (Conventional) | SAW (Shear Horizontal/Love Wave) |
|---|---|---|---|
| Liquid Compatibility | Excellent [3] | Poor [16] | Good [16] [30] |
| Wave Energy Loss | Minimal [3] | Severe attenuation [16] | Controlled attenuation |
| Primary Liquid Constraint | Viscoelastic effects [32] | Radiation into liquid [30] | Viscous coupling |
| Sensing Depth in Liquid | ~250 nm (5 MHz) to ~100 nm (30 MHz) [31] | Not applicable | Confined to surface layer |
| Modeling Complexity | Requires viscoelastic models [34] | Not applicable for liquids | Requires specialized models |
Experimental Implementation and Validation
Experimental Protocols for Biosensing Applications
Validating the performance of QCM and SAW biosensors requires carefully designed experimental protocols that account for their distinct operational principles. For SAW biosensor implementation, particularly in pathogen detection, a representative experimental workflow begins with surface functionalization of the sensing area with appropriate capture molecules (antibodies, aptamers, etc.) [16]. The Love-wave biosensor platform has demonstrated particular effectiveness for foodborne pathogen detection, with experimental validation including sensitivity assessment using serial dilutions of target analytes such as E. coli O157:H7 [16]. Measurement typically involves monitoring phase shifts or frequency changes in the SAW device upon analyte binding, with detection limits reaching clinically relevant concentrations (e.g., <20 CFU g⁻¹ for E. coli) [16].
For QCM biosensors, experimental protocols must account for viscoelastic effects when dealing with biological samples [32] [34]. Advanced QCM with dissipation monitoring (QCM-D) provides simultaneous measurement of frequency and energy dissipation changes, enabling distinction between rigid mass deposition and soft, viscoelastic layer formation [32]. Experimental validation often includes comparison with complementary techniques such as spectroscopic ellipsometry for independent thickness measurements [32]. For humidity sensing applications, QCM experimental protocols involve characterizing sensor response across a humidity range (typically 0-100% RH) while monitoring frequency shifts with precision instrumentation [33].
Research Reagent Solutions and Essential Materials
The experimental implementation of QCM and SAW biosensors requires specific materials and reagents tailored to their respective transduction mechanisms. The table below outlines essential components for biosensing applications based on cited research.
Table 4: Essential Research Reagents and Materials for Piezoelectric Biosensing
| Category | Specific Examples | Function/Purpose | Compatible Platform |
|---|---|---|---|
| Piezoelectric Substrates | AT-cut quartz [3], ST-cut quartz [16], LiNbO₃ [16] [30], LiTaO₃ [30] | Wave generation and propagation | QCM, SAW |
| Recognition Elements | Antibodies [3] [16], aptamers [3], DNA probes [3] | Target capture and specificity | QCM, SAW |
| Sensitive Coatings | Oxides, polymers, graphene oxide [33], metal-organic frameworks [17] | Enhanced sensitivity and selectivity | QCM, SAW (humidity/gas) |
| Microfluidic Components | PDMS chips [35], flow cells | Sample delivery and handling | QCM, SAW |
| Electronic Interfaces | Network analyzers [35], oscillator circuits [30], vector voltmeters | Signal generation and detection | QCM, SAW |
Comparative Performance Analysis and Applications
Integrated Performance Comparison
When selecting between QCM and SAW technologies for specific biosensing applications, researchers must consider multiple performance parameters simultaneously. The following integrated comparison highlights the fundamental trade-offs between these platforms.
Table 5: Comprehensive Performance Comparison: QCM vs. SAW Biosensors
| Performance Parameter | QCM | SAW |
|---|---|---|
| Mass Sensitivity | Moderate [16] | High [16] |
| Liquid Operation | Excellent [3] | Requires specialized designs [30] |
| Temperature Stability | Good (AT-cut) [3] | Variable (substrate-dependent) [3] |
| Manufacturing Cost | Low to moderate [16] | Moderate to high [35] |
| Miniaturization Potential | Moderate | High [16] |
| Commercial Availability | Widespread [30] | Limited to specialized applications [30] |
| Power Consumption | Low (typically <1 mW) [33] | Low to moderate |
| Multiplexing Capability | Limited | Good (multiple channels) [16] |
Application-Specific Recommendations
Based on their inherent strengths and limitations, QCM and SAW biosensors each excel in distinct application domains. QCM technology is particularly well-suited for biological interaction studies in liquid environments, including protein adsorption, cell adhesion monitoring, and biomolecular recognition events [3] [33]. Its robust liquid-phase operation, combined with relatively simple instrumentation and lower cost, makes it ideal for laboratory-based biological investigations where ultra-high sensitivity is not the primary requirement. QCM also demonstrates excellent performance in humidity sensing applications, where its digital output, high sensitivity to mass changes, and strong anti-interference capabilities are advantageous [33].
SAW biosensors find their optimal applications where maximum sensitivity is required, particularly in gas sensing [17] and specialized liquid-phase detection using shear-horizontal or Love-wave configurations [16] [35]. Their higher operational frequencies, compact design, and compatibility with CMOS technology make them suitable for portable monitoring systems and applications requiring detection of ultralow analyte concentrations [16] [17]. The integration of SAW sensors with wireless technology has further expanded their potential for remote environmental monitoring and point-of-care diagnostic applications [17].
The comparative analysis of QCM and SAW biosensors reveals a clear technological trade-off: while SAW devices offer superior theoretical mass sensitivity through higher operational frequencies, QCM platforms provide more robust and straightforward implementation for liquid-phase biological applications. The fundamental design constraints of each technology—primarily the thickness-frequency relationship in QCM and liquid compatibility challenges in conventional SAW devices—directly influence their appropriate application domains. For researchers and drug development professionals, selection between these platforms should be guided by specific application requirements: QCM for general laboratory-based biological interaction studies in aqueous environments, and specialized SAW configurations for applications demanding ultimate sensitivity or specific form-factor considerations. Future developments in both technologies will likely focus on overcoming these inherent limitations through novel materials, advanced signal processing, and integrated microfluidic systems, further expanding their capabilities for biomedical research and diagnostic applications.
Biosensing in Action: Methodologies and Real-World Applications for QCM and SAW
Piezoelectric acoustic biosensors have emerged as powerful tools for label-free, real-time analysis of biomolecular interactions in liquid phases. Among these, the Quartz Crystal Microbalance (QCM) and Surface Acoustic Wave (SAW) sensors are prominent technologies, each with distinct operational principles and performance characteristics [36]. This guide provides an objective comparison of their robustness for applications in drug development and life science research, focusing on analytical performance, experimental requirements, and practical implementation in liquid-phase sensing.
The fundamental principle of acoustic sensing involves monitoring changes in the propagation of acoustic waves through a piezoelectric substrate due to interactions at the sensor surface [36]. While both technologies transduce molecular binding events into measurable signals, their operational mechanisms, penetration depths, and sensitivity profiles differ significantly, making each suitable for specific application niches in biomolecular interaction analysis.
Fundamental Operating Principles and Comparative Performance
Technology Comparison Table
Table 1: Fundamental characteristics of QCM and SAW biosensors for liquid-phase applications.
| Characteristic | QCM (Thickness Shear Mode) | SAW (Love-Wave Configuration) |
|---|---|---|
| Operating Frequency | 5-27 MHz (fundamental) [36] | 25-500 MHz [36] |
| Wave Propagation | Perpendicular to surface [36] | Parallel to surface [36] |
| Penetration Depth | ~250 nm (at 5 MHz) [36] | More confined to surface [36] |
| Primary Sensing Parameters | Frequency (F), Dissipation (D) or Resistance (R) [36] | Phase shift (ΔPh), Amplitude (ΔA) [36] |
| Mass Sensitivity | ~ng/cm² [2] | ~pg/cm² (higher due to frequency) [36] |
| Commercial Availability | Widely available [36] | Limited availability [36] |
| Liquid Operation | Well-established [2] | Requires special waveguide [36] |
Operational Principles Visualization
Diagram 1: Operational principles of QCM and SAW biosensors showing distinct signal transduction pathways.
Experimental Performance Data and Applications
Quantitative Performance Comparison
Table 2: Experimental performance data for QCM and SAW biosensors in various applications.
| Application | Sensor Type | Target Analyte | Detection Limit | Response Time | Reference |
|---|---|---|---|---|---|
| Infectious Disease Diagnostics | QCM | SARS-CoV-2 nucleocapsid protein | 53.3 TCID₅₀/mL | 15 min | [22] |
| Cancer Biomarker Detection | QCM with graphene oxide | PCA3 (prostate cancer) | 0.268 nM | 20 min | [37] |
| Cardiomyocyte Beating Analysis | QCM with EIS | Drug-induced contractility changes | Comparable to gold standard EIS | Real-time | [38] |
| Respiratory Disease Diagnosis | QCM (virusmeter) | SARS-CoV-2 in exhaled air | 40-210 pfu/mL | 5 min | [39] |
| Cell Adhesion Studies | Love-wave SAW | Cell-substrate bonds | 2D kinetic parameters | Real-time | [36] |
Key Research Reagent Solutions
Table 3: Essential materials and reagents for QCM and SAW biosensor experiments.
| Reagent/Material | Function | Example Application |
|---|---|---|
| PEG-based surface chemistry | Reduces non-specific binding, improves sensitivity | SARS-CoV-2 detection [22] |
| Graphene Oxide (GO) | Enhances surface area and biomolecular recognition | Prostate cancer marker detection [37] |
| 3-mercaptopropionic acid | Forms self-assembled monolayer for antibody immobilization | Virusmeter for COVID-19 detection [39] |
| EDC/NHS chemistry | Activates carboxyl groups for covalent biomolecule attachment | General antibody immobilization [37] [39] |
| L-cysteine | Provides thiol group for gold surface functionalization | Graphene oxide incorporation on QCM [37] |
| Fibronectin | Promotes cell adhesion to sensor surface | Cardiomyocyte pulsation studies [38] |
| Specific antibodies | Provides molecular recognition for target analytes | Pathogen and biomarker detection [2] [39] |
Experimental Protocols and Methodologies
QCM Sensor Functionalization Protocol
The following protocol for QCM sensor surface functionalization has been adapted from multiple studies demonstrating robust biomolecular detection [22] [37] [39]:
Step 1: Surface Cleaning
- Clean gold-coated QCM crystals in piranha solution (3:1 H₂SO₄:H₂O₂) for 20 seconds
- Rinse thoroughly with deionized water and ethanol
- Dry under nitrogen stream [37]
Step 2: Self-Assembled Monolayer Formation
- Immerse sensors in 10 mM 3-mercaptopropionic acid (in ethanol) overnight
- This forms a carboxyl-terminated surface for further functionalization [39]
Step 3: Surface Activation
- Treat with fresh EDC/NHS solution (46 mM in DI water) for 1 hour
- This activates carboxyl groups for covalent amine coupling [39]
Step 4: Bioreceptor Immobilization
- Incubate with specific antibodies (30-50 μg/mL in PBS) for 1-2 hours
- Rinse with PBS to remove non-covalently bound antibodies [39]
Step 5: Blocking
- Treat with 1% BSA or ethanolamine to block non-specific binding sites
- Store in PBS at 4°C until use [22]
Experimental Workflow for Biomolecular Interaction Analysis
Diagram 2: Generalized experimental workflow for biomolecular interaction analysis using acoustic biosensors.
Comparative Analysis of Robustness Factors
Technical Advantages and Limitations
QCM Strengths:
- Proven liquid-phase operation: QCM has extensive documentation for robust operation in liquid environments, making it suitable for biological samples [2]
- Viscoelastic sensitivity: The ability to monitor energy dissipation (D) provides insights beyond mass adsorption, including structural information about bound layers [36]
- Commercial maturity: Widely available instruments and standardized protocols reduce implementation barriers [36]
- Electrochemical integration: QCM can be combined with electrochemical techniques (EQCM) for simultaneous mass and electrochemical measurements [36]
SAW Advantages:
- Higher mass sensitivity: Due to higher operational frequencies, SAW sensors typically offer superior mass sensitivity compared to QCM [36]
- Surface confinement: Love-wave devices confine acoustic energy to the sensing surface, potentially reducing bulk liquid effects [36]
QCM Limitations:
- Limited penetration depth: The typical penetration depth of ~250 nm at 5 MHz may not probe entire cell structures [36]
- Bulk liquid contribution: Signals can be influenced by liquid properties beyond the specific binding events [2]
SAW Challenges:
- Liquid operation complexity: Requires specialized waveguide layers for efficient liquid operation [36]
- Limited commercial availability: Fewer commercial options may slow adoption and standardization [36]
QCM technology demonstrates significant robustness for biomolecular interaction analysis in liquid phases, supported by extensive experimental validation across diverse applications from pathogen detection to cellular analysis. While SAW sensors offer potential sensitivity advantages, QCM's operational maturity, commercial availability, proven performance in complex biological matrices position it as the more robust choice for most biomolecular interaction studies in drug development and life science research.
The incorporation of advanced materials like graphene oxide and continuous development of surface chemistry protocols further enhance QCM performance, maintaining its relevance alongside emerging sensing technologies. For researchers seeking a balance of sensitivity, operational robustness and experimental flexibility, QCM remains the preferred piezoelectric biosensing platform for liquid-phase applications.
Acoustic wave biosensors have emerged as powerful tools for label-free, high-sensitivity detection in gas and vapor sensing applications. These devices, primarily Quartz Crystal Microbalance (QCM) and Surface Acoustic Wave (SAW) sensors, function as gravimetric transducers that detect target analytes by measuring mass changes on their piezoelectric surface without requiring fluorescent or radioactive labels [3] [40]. The fundamental principle underlying both technologies is the piezoelectric effect, where certain materials like quartz generate an electrical charge in response to applied mechanical stress, and conversely, undergo mechanical deformation when an electrical field is applied [40]. This reversible phenomenon enables the generation and reception of acoustic waves for sensing applications.
When target analyte molecules interact with a specialized sensing layer on the device surface, they alter the propagation characteristics of the acoustic wave—including its velocity, amplitude, and frequency [3] [41]. These changes are detected electrically and correlated to the concentration of the analyte. The exceptional sensitivity of these devices stems from their ability to detect minuscule mass changes; SAW sensors, for instance, can detect mass deposition down to the picogram level [3]. This physical transduction mechanism allows acoustic sensors to overcome limitations of optical and electrochemical methods, particularly for analytes lacking pronounced optical or electrochemical properties [3]. As research continues to advance material science and fabrication technologies, SAW and QCM biosensors are finding expanding applications in environmental monitoring, industrial safety, food safety, and medical diagnostics [17] [42].
Technology Comparison: QCM vs. SAW Biosensors
While both QCM and SAW sensors operate on acoustic wave principles, they differ significantly in their wave propagation mechanisms, design architectures, and operational characteristics. Understanding these distinctions is crucial for selecting the appropriate transducer for specific sensing applications.
QCM devices are Bulk Acoustic Wave (BAW) resonators where the acoustic wave propagates through the thickness of the piezoelectric crystal [3]. They are typically implemented as Thickness Shear Mode (TSM) resonators consisting of an AT-cut quartz wafer with electrodes on both sides [3] [40]. When voltage is applied, shear deformation occurs, making the crystal sensitive to surface perturbations. A significant advantage of this shear wave propagation is that it doesn't radiate substantial energy into adjacent media, making QCMs suitable for operation in liquid environments without excessive damping losses [3]. Standard QCMs typically operate in the 5-20 MHz frequency range, though High Fundamental Frequency (HFF) QCMs can reach up to 195 MHz [3].
SAW sensors, in contrast, are surface-based devices where the acoustic wave travels parallel to the surface of the piezoelectric substrate with penetration depth limited to approximately one wavelength [3]. These devices employ Interdigital Transducers (IDTs) patterned on the piezoelectric surface that generate acoustic waves when alternating voltage is applied [3] [41]. The wave propagation in SAW devices can be described by Rayleigh waves, which have both longitudinal and shear vertical components that strongly couple with material at the device interface [3]. This surface confinement makes SAW devices exceptionally sensitive to surface interactions but also more susceptible to excessive damping in liquid media, which has limited their traditional application to gas and vapor sensing [3]. SAW sensors operate at significantly higher frequencies than conventional QCMs, typically ranging from 100 MHz to several GHz [3].
Table 1: Fundamental Operational Characteristics of QCM and SAW Sensors
| Parameter | QCM | SAW |
|---|---|---|
| Wave Type | Bulk Acoustic Wave (BAW) | Surface Acoustic Wave |
| Propagation Direction | Through thickness | Parallel to surface |
| Typical Frequency Range | 5-20 MHz (Standard); Up to 195 MHz (HFF) | 100 MHz - Several GHz |
| Liquid Phase Operation | Suitable with minimal damping | Challenging due to excessive damping (especially Rayleigh waves) |
| Mass Sensitivity | Good | Excellent (higher due to higher operating frequencies) |
| Design Architecture | Thickness Shear Mode (TSM) resonator with electrode on both sides | Interdigital Transducers (IDTs) on piezoelectric substrate |
| Primary Sensing Mechanism | Mass loading and viscoelastic changes | Mass loading, elastic effects, and acoustoelectric effect |
Experimental Performance Comparison
Direct comparative studies between QCM and SAW sensors reveal significant differences in their sensing performance across various applications. The following experimental data from published research provides objective performance metrics for these competing technologies.
Mercury Vapor Detection
A 2014 study directly compared SAW and QCM-based sensors for portable, online mercury vapor sensing [43]. Both sensors were tested simultaneously toward low concentrations (24 to 365 ppbv) of elemental mercury vapor at near-room temperature (35°C). The results demonstrated the superior sensitivity of the SAW-based platform, which showed up to 80 times higher response magnitude than the QCM-based sensor when exposed to identical mercury vapor concentrations [43]. The study also calculated a lower Limit of Detection (LOD) of ~2.6 ppbv for the SAW sensor compared to ~8 ppbv for the QCM device [43]. Furthermore, the coefficient of variance (COV) measurements indicated slightly better precision for the SAW sensor (±5 ppbv) compared to the QCM sensor (±7 ppbv) at a mercury vapor concentration of 104 ppbv [43].
Carbaryl Pesticide Detection
Research presented in 2013 compared High Fundamental Frequency QCM (HFF-QCM) and Love Mode Surface Acoustic Wave (LM-SAW) devices for detecting low molecular weight compounds, using carbaryl pesticide as a model analyte [44]. Love Mode SAW devices are specifically designed to overcome the limitations of conventional SAW sensors in liquid environments by using a waveguide layer that confines acoustic energy closer to the sensing surface. In this study, the LM-SAW device demonstrated superior sensitivity with an I50 value (50% inhibition concentration) of 0.31 µg/L compared to 0.66 µg/L for the HFF-QCM [44]. Similarly, the Limit of Detection (I90 value) was lower for the LM-SAW device (0.09 µg/L) than for the HFF-QCM (0.14 µg/L) [44]. The study noted that both advanced acoustic technologies outperformed traditional QCM and Surface Plasmon Resonance (SPR) methods, approaching the sensitivity of Enzyme-Linked Immunosorbent Assay (ELISA) techniques [44].
Table 2: Experimental Performance Comparison in Detection Applications
| Detection Application | Performance Metric | SAW Sensor | QCM Sensor |
|---|---|---|---|
| Mercury Vapor [43] | Response Magnitude | Up to 80× higher | Baseline |
| Limit of Detection (LOD) | ~2.6 ppbv | ~8 ppbv | |
| Coefficient of Variance (at 104 ppbv) | ±5 ppbv | ±7 ppbv | |
| Carbaryl Pesticide [44] | Sensitivity (I50 value) | 0.31 µg/L | 0.66 µg/L |
| Limit of Detection (I90 value) | 0.09 µg/L | 0.14 µg/L |
Theoretical Basis for Sensitivity Differences
The superior mass sensitivity of SAW sensors compared to QCM devices has a fundamental theoretical basis rooted in their operational frequencies. According to the Sauerbrey equation, which describes the relationship between mass deposition and frequency shift in acoustic sensors, the frequency shift (Δf) is directly proportional to the square of the fundamental resonance frequency (f₀²) [3]. Since SAW devices operate at significantly higher frequencies than QCMs (often by an order of magnitude), they theoretically offer substantially higher mass sensitivity. This frequency-dependent sensitivity relationship explains why SAW sensors consistently demonstrate lower detection limits and greater response magnitudes in comparative studies.
SAW Sensor Operational Principles and Signaling Pathways
The exceptional sensitivity of SAW gas sensors stems from sophisticated physical interactions between acoustic waves and surface perturbations. The core mechanism involves changes in wave propagation characteristics induced by analyte adsorption on the specialized sensing film.
Acoustoelectric Effect and Signaling Mechanism
The acoustoelectric effect plays a crucial role in SAW gas sensing, particularly for conducting or semiconducting sensing materials [41]. When a SAW propagates through a piezoelectric material, it generates an oscillating electric field that extends above the surface. If a sensing film with specific electrical properties is deposited in the path of the SAW, interaction occurs between the electric field and charge carriers in the film. This acoustoelectric interaction results in energy transfer between the wave and the film, causing changes to the wave's velocity and attenuation [41]. The relationship between the normalized sheet conductivity (ξ = σs/σM, where σs is the sheet conductivity of the sensing film and σM is the characteristic sheet conductivity) and the wave parameters is governed by the following equations [41]:
- Attenuation per wavenumber: α/k ≈ (K²/2) × (ξ/(1+ξ²))
- Fractional velocity perturbation: Δv/vs ≈ - (K²/2) × (ξ²/(1+ξ²))
Where K² represents the electromechanical coupling coefficient of the piezoelectric substrate. These relationships produce a non-monotonic response where maximum attenuation occurs at ξ = 1, while the velocity shift increases monotonically with ξ [41]. For gas sensing applications, the adsorption of target gas molecules alters the sheet conductivity of the sensing film, thereby changing the wave characteristics that are measured as frequency shifts, insertion loss variations, or phase changes [41].
SAW Gas Sensing Signaling Pathway
Mass Loading and Elastic Effects
Beyond the acoustoelectric effect, SAW sensors are also sensitive to mass loading and elastic effects when non-conductive sensing films are used [41]. The adsorption of analyte molecules increases the mass on the sensor surface, which decreases the acoustic wave velocity according to the mass loading effect. Additionally, changes in the viscoelastic properties of the sensing layer upon gas absorption can further modify wave propagation characteristics. These combined effects enable SAW sensors to detect a wide range of analytes regardless of their electrical properties, though the specific sensing mechanism dominates depending on the nature of the sensing film and target analyte.
Advanced SAW Sensor Experimental Protocols
The development of high-performance SAW gas sensors requires meticulous experimental procedures encompassing material synthesis, device fabrication, functionalization, and testing. The following protocol details the methodology for creating an advanced NH3 SAW sensor based on AuNPs-Cu2O/rGO/PPy hybrid nanocomposites, which demonstrated exceptional sensitivity (2 Hz/ppb) and selectivity in recent research [45].
Sensing Film Nanocomposite Synthesis
Materials Preparation:
- Pyrrole monomer: Purified through reduced-pressure distillation before polymerization
- Copper (II) chloride (CuCl2): precursor for Cu2O formation
- Citric acid trisodium salt: serves as reducing agent
- Gold nanoparticles (50 nm diameter): catalytic enhancement component
- Polystyrene sulfonic acid (PSS) and Sodium dodecyl sulfate (SDS): surfactants for dispersion control
- Ammonium peroxydisulfate (APS): polymerization initiator for polypyrrole
Cu2O/rGO Nanocomposite Synthesis:
- Combine 20 mL of 0.01 M CuCl2 aqueous solution with 2.0 mL of 2.0 M NaOH solution with continuous stirring for 30 minutes
- Add 2.0 mg of GO and 2.0 mL of 0.6 M trisodium citrate solution to reduce Cu(OH)2 to Cu2O while simultaneously converting GO to rGO
- Heat the resulting brown solution in a water bath at 55°C for 5 hours
- Rinse multiple times in ethanol-water solution (1:99 ratio) to remove impurities
- Anneal at 400°C for 2 hours under nitrogen atmosphere to yield final Cu2O/rGO nanocomposites
PPy Matrix Formation and Composite Integration:
- Dissolve 30 mg of Cu2O/rGO powder in 30 mL DI water with 0.1 M SDS as surfactant
- Add 30 μL pyrrole monomer to the solution with stirring
- Initiate polymerization by adding 2.0 mL of 0.35 M APS solution
- Continue stirring for 3 hours until solution turns black
- Centrifuge the resulting precipitate and wash repeatedly with DI water
- Add 1.5 mL of AuNPs solution to enhance catalytic properties
- Dry the final AuNPs-Cu2O/rGO/PPy nanocomposite at 60°C for 12 hours
Sensor Fabrication and Testing Protocol
Device Fabrication:
- Utilize ST-cut quartz SAW resonator with 200 MHz center frequency
- Prepare nanocomposite suspension in deionized water (1 mg/mL)
- Deposit sensing film using spin-coating technique at 2000 rpm for 60 seconds
- Dry deposited film at 60°C for 2 hours to remove residual solvent
Gas Testing Procedure:
- Place SAW sensor in sealed testing chamber with controlled temperature and humidity
- Establish baseline frequency with synthetic air or nitrogen carrier gas
- Introduce target NH3 gas at varying concentrations (12-1000 ppb) using mass flow controllers
- Monitor frequency shift, insertion loss, and phase changes in real-time
- Measure response time (typically ~2 minutes to reach 90% response) [45]
- Purge system with carrier gas to measure recovery time
- Test selectivity against interfering gases (CO2, H2, CO)
- Evaluate long-term stability over 30 days with periodic testing
SAW Sensor Fabrication and Testing Workflow
Research Reagent Solutions and Essential Materials
The development and implementation of high-sensitivity SAW gas sensors requires specialized materials and reagents carefully selected for their specific functions in the sensing system. The table below details essential components and their roles in creating advanced SAW gas sensors.
Table 3: Essential Research Reagents and Materials for SAW Gas Sensor Development
| Material/Reagent | Function | Application Example |
|---|---|---|
| Piezoelectric Substrates (ST-cut quartz, LiNbO3) | SAW wave generation and propagation | ST-cut quartz for 200 MHz resonators [45] |
| Gold Nanoparticles (AuNPs) | Enhance catalytic activity and surface area | NH3 detection enhancement [45] |
| Metal Oxides (Cu2O, ZnO) | Primary sensing material with gas selectivity | Cu2O for NH3 selectivity [45] |
| Carbon Nanomaterials (rGO, graphene) | High surface area, conductivity enhancement | rGO for improved electrical conductivity [45] |
| Conductive Polymers (Polypyrrole, PEDOT:PSS) | Room-temperature operation, mechanical stability | PPy matrix for flexible sensing film [45] |
| Metal-Organic Frameworks (MOFs) | Ultra-high surface area, selective adsorption | ZIF-67 for enhanced sensitivity [46] |
| Polymerization Initiators (APS) | Initiate conductive polymer formation | PPy polymerization [45] |
| Surfactants (SDS, PSS) | Dispersion control and film formation | Nanocomposite dispersion stabilization [45] |
The comprehensive comparison between SAW and QCM technologies reveals a consistent performance advantage for SAW sensors in high-sensitivity gas and vapor detection applications. Experimental evidence demonstrates that SAW sensors offer substantially higher response magnitude (up to 80× in mercury vapor detection), lower detection limits (2.6 ppb vs. 8 ppb for mercury vapor), and enhanced sensitivity in pesticide detection compared to QCM alternatives [43] [44]. These performance advantages stem from fundamental operational differences, particularly the higher operating frequencies of SAW devices and their enhanced sensitivity to surface interactions through the acoustoelectric effect [3] [41].
The choice between SAW and QCM technologies ultimately depends on specific application requirements. SAW sensors clearly dominate in gas and vapor sensing applications where maximum sensitivity is paramount, while QCM maintains utility in liquid-phase applications where its robustness to damping provides an operational advantage [3]. Future developments in Love Mode SAW devices and advanced nanocomposite sensing films are progressively overcoming traditional SAW limitations in liquid environments while further enhancing gas sensing capabilities [44] [45]. As material science advances continue to produce novel sensing films with enhanced selectivity and stability, SAW biosensors are poised to expand their application domains in medical diagnostics, environmental monitoring, and industrial safety systems.
Piezoelectric biosensors, particularly those based on Quartz Crystal Microbalance (QCM) and Surface Acoustic Wave (SAW) technologies, have emerged as powerful tools in analytical science and medical diagnostics due to their label-free detection capability, high sensitivity, and real-time monitoring features [3]. The core principle underlying these sensors is the conversion of a mass change on the sensor surface into a measurable electrical signal—specifically, a shift in resonant frequency [3] [47]. According to the Sauerbrey equation, which establishes the fundamental relationship between mass accumulation and frequency shift, the sensitivity of these devices is profoundly influenced by their fundamental resonance frequency, making higher frequency transducers inherently more sensitive to minute mass changes [3].
While the piezoelectric substrate and transducer design form the hardware foundation of these biosensors, it is the functionalization layer—the biological recognition element immobilized on the sensor surface—that determines their analytical specificity and performance in complex media [3] [48]. The immobilization of biorecognition elements such as antibodies and aptamers onto sensor surfaces presents significant challenges, including maintaining biomolecular orientation, stability, and activity while maximizing binding site accessibility [48] [49]. Recent advances have incorporated low-dimensional nanomaterials as enhancing components to improve sensitivity, stability, and functionality of these biosensing platforms [50] [51].
This guide provides a comprehensive comparison of functionalization strategies for QCM and SAW biosensors, examining their respective performance characteristics, detailing experimental protocols, and evaluating the impact of various nanomaterials on biosensor efficacy. By objectively presenting experimental data and methodological details, we aim to equip researchers with the necessary information to select optimal functionalization approaches for their specific biosensing applications.
Fundamental Comparison of QCM and SAW Biosensing Platforms
QCM and SAW devices represent two distinct classes of piezoelectric transducers with different wave propagation mechanisms and operational characteristics. QCMs are bulk acoustic wave (BAW) devices where acoustic waves propagate through the thickness of the piezoelectric crystal, typically operating in a thickness shear mode (TSM) that makes them particularly suitable for liquid-phase sensing [3]. Their resonance frequency generally ranges from 5-20 MHz for standard models, though high-frequency variants can reach up to 195 MHz [3]. The ability of QCMs to operate in liquid environments with minimal signal attenuation has established their position as versatile workhorses in biosensing research and commercial applications [3] [47].
In contrast, SAW sensors are surface-based devices where acoustic waves travel along the surface of the piezoelectric substrate, confining energy to the sensing interface and making them exceptionally sensitive to surface perturbations [3] [50]. SAW devices typically operate at significantly higher frequencies than QCMs (often above 100 MHz), reaching into the GHz range with film bulk acoustic resonators (FBARs) [3]. However, conventional Rayleigh wave-based SAW sensors experience substantial damping in liquid environments, limiting their liquid-phase applications unless specialized wave modes like shear horizontal (SH) waves or Love waves are implemented [3] [52].
Table 1: Fundamental Characteristics of QCM and SAW Biosensors
| Parameter | QCM | SAW |
|---|---|---|
| Wave Type | Bulk Acoustic Wave (BAW) | Surface Acoustic Wave |
| Propagation | Through thickness | Along surface |
| Frequency Range | 5-20 MHz (standard), up to 195 MHz (HFF) | 100 MHz - GHz range |
| Liquid Phase Operation | Excellent (minimal damping) | Challenging for Rayleigh waves; requires SH modes |
| Mass Sensitivity | ~ng-level | ~pg-level (higher frequency) |
| Primary Sensing Mechanism | Mass loading | Mass loading, viscoelastic, acoustoelectric |
| Temperature Sensitivity | Moderate (AT-cut minimizes dependency) | High (often requires compensation) |
The selection between QCM and SAW platforms depends heavily on the intended application. QCM technology offers robustness and reliability for liquid-phase sensing, while SAW devices provide superior mass sensitivity and are particularly advantageous for gas-phase sensing or when the highest possible detection sensitivity is required [3] [17].
Antibody Immobilization Strategies and Performance
Antibodies serve as highly specific biorecognition elements in immunosensors, and their immobilization strategy profoundly impacts biosensor performance. Proper orientation that presents antigen-binding sites toward the solution phase is critical for maximizing immunological activity and assay sensitivity [48] [49].
Orientation-Control Immobilization Methods
Various antibody immobilization approaches have been developed, each with distinct advantages for biosensor functionalization:
Physical Adsorption: This simplest method involves non-specific physical adsorption of antibodies onto gold sensor surfaces. While it achieves high surface coverage (30% more bound antibody compared to covalent methods), it results in random antibody orientation, potentially obscuring antigen-binding sites and reducing immunological activity [49].
Protein A-Mediated Immobilization: Protein A, immobilized on the sensor surface, selectively binds the Fc region of antibodies, presenting a uniform orientation with antigen-binding sites available. This approach enhances subsequent antibody binding and immunological activity compared to physical adsorption [49].
Photonic Immobilization Technique (PIT): This UV irradiation-based method creates upright-oriented antibody layers on gold surfaces. When implemented for parathion detection, PIT achieved a remarkably low limit of detection (LOD) of 0.8 μg/L (<1 ppb) by ensuring optimal antibody orientation and surface coverage [48].
Cyanogen Bromide (CNBr) Covalent Attachment: For SAW sensors with protective polyimide layers, CNBr activation creates reactive groups for covalent antibody coupling. This approach successfully functionalized a SAW biosensor for glucose oxidase detection, demonstrating frequency shifts of 210 kHz upon analyte binding [52].
BS3-Activated Amide Coupling via Protein G: This strategy employs BS3 crosslinker to immobilize antibodies through Protein G, optimizing orientation. Validation for E. coli L-asparaginase quantification demonstrated excellent performance with 102.4% recovery and 8.5% RSD precision [53].
Table 2: Performance Comparison of Antibody Immobilization Methods
| Immobilization Method | Sensor Platform | Target Analyte | Limit of Detection | Key Advantages |
|---|---|---|---|---|
| Physical Adsorption | QCM | Immunoglobulin G | Not specified | Simple procedure, high antibody loading |
| Protein A-Mediated | QCM | Immunoglobulin G | Not specified | Improved orientation, enhanced binding |
| PIT Method | QCM | Parathion | 0.8 μg/L | Optimal orientation, high sensitivity |
| CNBr Activation | SAW | Glucose Oxidase | Not specified | Covalent attachment, stable linkage |
| BS3/Protein G | SAW | L-Asparaginase | Not specified | Reliable precision and accuracy |
The experimental protocol for PIT-based immobilization involves several critical steps. First, QCM gold surfaces are rigorously cleaned with sulfuric acid and hydrogen peroxide (piranha solution) to remove organic contaminants. Antibody solutions (typically 0.25 mg/mL concentration) are then applied to the gold surface, followed by controlled UV irradiation. This photonic treatment promotes the formation of upright-oriented antibody layers through specific photophysical processes. After immobilization, remaining non-specific binding sites are blocked with inert proteins like Bovine Serum Albumin (BSA) to minimize background interference in subsequent assays [48].
Aptamer Functionalization Approaches
Aptamers—single-stranded DNA or RNA oligonucleotides selected through SELEX (Systematic Evolution of Ligands by Exponential Enrichment)—offer several advantages as recognition elements, including thermal stability, reversible denaturation, and facile chemical modification [47]. Their relatively small size and synthetic nature make them particularly suitable for biosensor applications where robustness and reproducibility are essential.
Aptamer Immobilization Strategies
A common and effective approach for aptamer immobilization involves biotin-streptavidin affinity coupling. In a recently developed QCM-D biosensor for thrombin detection, researchers created a supported lipid bilayer (SLB) composed of 1-palmitoyl-2-oleoyl-glycero-3-phosphocholine (POPC) and biotinylated phosphoethanolamine (biotin-PE) on the sensor surface [54]. This biomimetic membrane environment provides a physiologically relevant context for biomolecular interactions. Streptavidin was subsequently bound to the biotinylated lipid heads, serving as an anchor for biotinylated thrombin-specific aptamers. This architecture enabled specific thrombin detection with successful sensor regeneration using 5 M urea solution, which dissociates the thrombin-aptamer complex without damaging the immobilized aptamer layer [54].
Direct thiol-gold chemisorption provides another reliable aptamer immobilization method. Thiol-modified aptamers form self-assembled monolayers on gold electrode surfaces through strong Au-S bonds. The packing density and orientation of aptamers can be controlled by varying the surface concentration and incorporating spacer molecules [47]. This method benefits from simplicity and stability, though careful optimization is required to prevent excessive density that might sterically hinder target binding.
QCM Aptasensor Performance
QCM-based aptasensors have demonstrated exceptional performance across diverse applications. Their versatility spans detection of viruses, bacteria, cells, proteins, and small molecule disease biomarkers [47]. The real-time, label-free detection capability combined with the high specificity and affinity of aptamers (with dissociation constants in the picomolar to nanomolar range) enables development of highly sensitive diagnostic platforms. The stability of aptamers compared to protein-based receptors further enhances their utility in point-of-care applications where storage conditions may be suboptimal [47].
Integration of Low-Dimensional Nanomaterials
Low-dimensional nanomaterials have revolutionized biosensor technology by providing exceptional physical, optical, and electronic properties that significantly enhance sensor performance [50] [51]. Their high surface-to-volume ratio increases the available area for biomolecule immobilization and target binding, while their tunable chemical characteristics enable precise customization for specific sensing applications.
Dimensional Classification and Properties
0D Nanomaterials: Including carbon quantum dots (CQDs), graphene quantum dots (GQDs), and fullerenes, these materials exhibit quantum confinement effects and exceptional optical properties such as photoluminescence and electroluminescence [51]. Their small size (typically <100 nm) and facile functionalization make them ideal signal amplifiers in electrochemical and optical biosensors.
1D Nanomaterials: Carbon nanotubes (CNTs)—both single-walled (SWNTs) and multi-walled (MWNTs)—represent prominent 1D materials with extraordinary electrical conductivity and mechanical strength [51]. Their high aspect ratio and ability to facilitate electron transfer make them valuable for electrochemical biosensors.
2D Nanomaterials: Graphene and transition metal dichalcogenides (e.g., MoS₂, WS₂) offer atomically thin layers with exceptional electrical, thermal, and mechanical properties [50] [51]. The extensive surface area and rich chemistry of 2D materials enable high biomolecule loading capacity and versatile functionalization.
Nanomaterial-Enhanced Signal Amplification
Gold nanoparticles (AuNPs) have been extensively employed for signal amplification in QCM biosensors, particularly for small molecule detection where minimal mass change would otherwise limit sensitivity. In a paradigmatic example, researchers developed a sandwich assay for parathion detection where the pesticide was first captured by immobilized antibodies and then "weighed down" with secondary antibodies conjugated to 10-nm AuNPs [48]. This nanoparticle ballasting approach dramatically improved the detection limit to sub-ppb levels (0.8 μg/L), demonstrating the powerful amplification achievable with nanomaterial integration.
The protocol for AuNP functionalization involves several precise steps. First, amino-coated AuNPs are mixed with antibody solutions (0.25 mg/mL concentration) in specific ratios with reaction buffers. After incubation periods allowing antibody conjugation, quencher solutions are added to stop the reaction [48]. The functionalized AuNPs are then characterized to verify antibody coupling efficiency before implementation in sandwich assays. The high density of gold (19.3 g/cm³) significantly increases the mass load per binding event, thereby amplifying the frequency shift detectable by QCM measurements [48].
Low-dimensional carbon materials have also demonstrated remarkable utility in SAW sensors. Graphene oxide and its functionalized derivatives provide abundant binding sites for analyte capture while contributing minimal additional noise to the sensing system [50] [17]. When deployed as sensing layers in SAW devices, these materials enhance both sensitivity and selectivity through their specific interactions with target molecules—particularly in gas sensing applications where their large surface area facilitates analyte concentration at the active sensor region [17].
Table 3: Low-Dimensional Nanomaterials in Biosensing
| Nanomaterial | Dimensionality | Key Properties | Biosensing Applications |
|---|---|---|---|
| Gold Nanoparticles | 0D | High density, easy functionalization | Signal amplification, mass enhancement |
| Graphene Quantum Dots | 0D | Photoluminescence, tunable bandgap | Optical and electrochemical sensing |
| Carbon Nanotubes | 1D | High conductivity, aspect ratio | Electrochemical sensors, field-effect transistors |
| Graphene Oxide | 2D | Large surface area, rich chemistry | SAW gas sensors, molecular capture |
| Transition Metal Dichalcogenides | 2D | Semiconducting, tunable bandgaps | Flexible SAW devices, photodetectors |
Comparative Analysis of QCM vs. SAW Functionalization
The fundamental differences in operating principles and transducer design between QCM and SAW platforms necessitate distinct considerations for functionalization strategies. QCM's thickness shear mode operation makes it inherently suitable for liquid-phase applications, allowing more flexibility in functionalization approaches that may involve hydrophilic/hydrophobic interactions or solution-based chemistry [3] [47]. The relatively lower operating frequency of standard QCMs (compared to SAW devices) also makes them less susceptible to non-specific binding effects that become increasingly problematic at higher frequencies.
SAW sensors, with their energy confinement at the surface, exhibit exceptional sensitivity to minute mass changes but require more meticulous surface functionalization to maintain specificity [3] [50]. The higher operating frequencies of SAW devices (often exceeding 100 MHz) make them particularly vulnerable to interfacial viscoelastic changes and non-specific adsorption, necessitating highly specific and stable recognition layers. For liquid-phase applications, SAW sensors require specialized wave modes like shear horizontal waves or Love waves to minimize energy dissipation into the liquid [52].
Both platforms benefit significantly from nanomaterial integration, though the enhancement mechanisms differ. In QCM, nanomaterials primarily function as mass amplifiers or surface area expanders, directly increasing the Sauerbrey mass response [48] [47]. In SAW sensors, nanomaterials often modify both mass loading and acoustic wave propagation characteristics, potentially affecting wave velocity and attenuation through electrical/mechanical coupling effects [50] [17].
The Scientist's Toolkit: Essential Research Reagents
Successful implementation of biosensor functionalization requires specific materials and reagents carefully selected for their proven performance characteristics:
Piezoelectric Substrates: AT-cut quartz crystals for QCM (providing temperature-stable operation); 36° rot. Y-cut LiTaO₃ or LiNbO₃ for SAW sensors (offering high electromechanical coupling) [3] [52].
Recognition Elements: Anti-target antibodies (purified via Protein A kits); DNA/RNA aptamers (selected through SELEX with biotin or thiol modifications for immobilization) [48] [47].
Immobilization Chemicals: Cyanogen bromide (CNBr) for polyimide surface activation; BS³ crosslinker for amine coupling; sulfosuccinimidyl-4-(N-maleimidomethyl)cyclohexane-1-carboxylate for thiol-reactive surfaces [52] [53].
Nanomaterials: Gold nanoparticles (10-20 nm diameter for mass amplification); graphene oxide suspensions (for enhanced surface area); carbon quantum dots (for signal enhancement) [48] [51].
Surface Blocking Agents: Bovine serum albumin (BSA); casein; ethanolamine hydrochloride (for blocking unreacted NHS esters after immobilization) [48].
Solvents and Buffers: Phosphate buffered saline (PBS) for biological interactions; 2-(N-morpholino)ethanesulfonic acid buffer for carbodiimide coupling chemistry; urea solutions (5-8 M) for sensor regeneration [48] [54].
Functionalization strategies employing antibodies, aptamers, and low-dimensional nanomaterials have dramatically advanced the capabilities of both QCM and SAW biosensing platforms. Antibody-based immobilization, particularly with orientation-control methods like PIT and Protein A/G, provides exceptional specificity and sensitivity for target recognition. Aptamer-based approaches offer advantages in stability, reversibility, and customization for diverse targets. Integration of low-dimensional nanomaterials further enhances performance through signal amplification, increased surface area, and improved electronic properties.
The selection between QCM and SAW platforms depends fundamentally on the specific application requirements. QCM technology offers robustness and reliability for liquid-phase sensing, while SAW devices provide superior mass sensitivity. For both platforms, continued refinement of functionalization methodologies—particularly in controlling biorecognition element orientation and incorporating engineered nanomaterials—will further expand their applications in medical diagnostics, environmental monitoring, and pharmaceutical development.
Surface Acoustic Wave (SAW) and Quartz Crystal Microbalance (QCM) sensors represent two pivotal technologies in the realm of piezoelectric biosensing. Both systems transduce a biological binding event, such as the attachment of a pathogen or biomarker, into a measurable physical signal—typically a shift in resonant frequency or wave velocity. QCM sensors operate based on the thickness shear mode (TSM), where an oscillating piezoelectric crystal experiences a decrease in its resonant frequency when mass is added to its electrode surface. This relationship is quantitatively described by the Sauerbrey equation, making QCM exceptionally sensitive to mass changes in gaseous environments or thin, rigid films in liquid. [55] In contrast, SAW sensors propagate an acoustic wave along the surface of a piezoelectric substrate. Interactions with the analyte affect the wave's velocity and amplitude, making SAW devices sensitive not only to mass loading but also to viscoelastic properties and electrical conductivity of the interfacial layer. The Love wave and Shear Horizontal (SH-SAW) configurations are particularly advantageous for liquid-phase applications, as they confine acoustic energy at the surface while minimizing radiative losses into the fluid. [17] [56] [57]
The selection between QCM and SAW technologies is application-dependent, involving trade-offs between sensitivity, miniaturization potential, integration with microfluidics, and operational stability in complex media. This guide provides a structured comparison of their performance across key application areas to inform researchers and development professionals.
Performance Comparison in Key Application Areas
The quantitative performance of QCM and SAW biosensors varies significantly across different application domains, driven by their underlying physical principles and design configurations. The following tables summarize key experimental data for direct comparison.
Table 1: Performance in Pathogen, Biomarker, and Gas Detection
| Application | Sensor Type / Configuration | Target Analyte | Sensitivity / LoD | Key Experimental Findings | Ref. |
|---|---|---|---|---|---|
| Virus Identification | QCM with MXene-Cu/Cu₂O/C | Glucose (Model) | High (Specific value not stated) | Functionalized nanocomposites enhance selectivity and sensitivity for biomarker detection. | [58] |
| Virus Identification | SAW (Acoustic Platform) | Viruses, Small Molecules | High Sensitivity | Label-free, real-time detection capability; sensitive to environmental conditions. | [59] |
| Clinical Biomarker Sizing | SH-SAW (250 MHz, 36° Y-cut quartz) | Lipoproteins (ApoA1, ApoB, etc.) | N/A (Size Differentiation) | Layer-parameter analysis enabled lipoprotein size distinction directly from human plasma. | [56] |
| Hydrogen Gas Sensing | SAW with Graphene | Hydrogen (H₂) | 0.276 kHz/ppm, LoD: 2 ppm | High sensitivity at room temperature; performance degrades over time. | [60] |
| Hydrogen Gas Sensing | Piezoelectric Micro Diaphragm (PMD) with Pd | Hydrogen (H₂) | 18.5 kHz/% H₂, LoD: <4% (LFL) | Unprecedented FOM >10⁴; stress-based mechanism; minimal cross-sensitivity. | [61] |
| Mercury Detection | QCM with Au Electrode | Mercury (Hg) | ~1 µg/m³ (Gas), ~0.05 µg/L (Liquid) | Utilizes amalgamation reaction; suitable for environmental and occupational monitoring. | [55] |
Table 2: General Sensor Characteristics and Performance Metrics
| Characteristic | Quartz Crystal Microbalance (QCM) | Surface Acoustic Wave (SAW) Sensor |
|---|---|---|
| Typical Operating Frequency | MHz range (e.g., 10 MHz, 165 MHz) [62] [61] | Tens to hundreds of MHz (e.g., 82.5 MHz, 250 MHz) [56] [57] |
| Primary Sensing Mechanism | Mass loading (Sauerbrey equation) [55] | Mass loading, viscoelastic, and conductivity changes [17] |
| Sensitivity to Mass | High in gas phase [55] | Ultra-high; enhanced by nanomaterials (ZnO, MOFs, graphene) [17] |
| Performance in Liquids | Effective; requires film optimization [55] | Excellent with SH-SAW/Love mode; minimal energy loss [56] [57] |
| Miniaturization & Integration | Moderate [61] | High; compact structure, easy integration with microfluidics [17] [57] |
| Key Advantage | Well-established, robust for mass-based detection in gas | High sensitivity and multi-parameter sensing in liquid |
| Common Challenge | Sensitive to environmental conditions and vibrations [59] | Sensitive to environmental conditions and mechanical vibrations [59] |
Detailed Experimental Protocols
To ensure reproducibility and provide a clear basis for performance comparison, this section outlines standardized experimental methodologies for key application areas.
Protocol 1: Lipoprotein Sizing with SH-SAW Biosensors
This protocol details the methodology for distinguishing lipoprotein subclasses by size using a Shear Horizontal Surface Acoustic Wave (SH-SAW) biosensor, as demonstrated by Cheng et al. [56]
- Objective: To quantitatively differentiate lipoprotein particles (e.g., those containing ApoA1, ApoB48, ApoB100, and Lp(a)) based on their size using the layer-parameter of an SH-SAW biosensor.
- Sensor Preparation:
- Substrate: Use a 3 × 5 mm chip on 36° rotated Y-cut 90° X-propagating quartz substrates.
- IDT Fabrication: Fabricate Interdigitated Transducers (IDTs) to operate at a fundamental frequency of 250 MHz.
- Antibody Immobilization: Functionalize the gold surface between IDTs by immobilizing specific antibodies (e.g., ApoA1, ApoB48, ApoB100, Lp(a)) to capture target lipoproteins from human plasma samples.
- Measurement and Data Analysis:
- Sample Introduction: Introduce the sample (e.g., diluted human plasma) to the sensor surface via a flow cell system.
- Signal Acquisition: Monitor changes in the acoustic wave's velocity (Δv/v) and attenuation (ΔA/A) in real-time upon lipoprotein binding.
- Layer-Parameter Calculation: For each captured lipoprotein, calculate the layer-parameter (LP) as the ratio of the velocity change to the attenuation change: LP = (Δv/v) / (ΔA/A).
- Size Correlation: Correlate the calculated layer-parameter values with the hydrodynamic size of the lipoproteins, as determined by orthogonal techniques (e.g., NMR), to establish a calibration curve.
Protocol 2: Mercury Detection in Air and Water using QCM
This protocol describes the detection of mercury in both gaseous and aqueous phases using a Quartz Crystal Microbalance (QCM) with a gold electrode, as reviewed by Yoshikawa et al. [55]
- Objective: To detect trace levels of mercury in air and water samples via direct amalgamation with a gold-coated QCM crystal.
- Sensor Configuration:
- QCM Crystal: Use an AT-cut quartz crystal with a fundamental resonant frequency (f₀). The gold electrode serves as both the oscillator and the sensing layer.
- Oscillation Circuit: Integrate the QCM into an oscillation circuit capable of tracking frequency shifts (Δf) with high resolution.
- Procedure for Gaseous Mercury Detection:
- Sampling: Draw the air sample through the measurement cell housing the QCM sensor at a controlled flow rate using a pump.
- Measurement: Record the steady-state frequency shift (Δf) upon exposure. The mass of mercury adsorbed (Δm) is directly proportional to Δf according to the Sauerbrey equation: Δf = -2Δm n f₀²/(A μq¹ᐟ² ρq¹ᐟ²).
- Procedure for Aqueous Mercury Detection (Reduction-Vaporization Method):
- Sample Preparation: Add a ferrous tin chloride (SnCl₂) solution to the aqueous sample to reduce ionic mercury (Hg²⁺) to metallic mercury (Hg⁰).
- Vaporization and Purge: Bubble an inert gas (e.g., N₂) through the solution to purge the volatile Hg⁰ from the liquid phase.
- Detection: Direct the gas stream containing Hg⁰ into the measurement cell of the QCM-Hg sensor for detection as described above.
Protocol 3: Optimization of QCM Impedance Measurements using Machine Learning
This protocol employs machine learning to efficiently optimize QCM parameters for improved Limit of Detection (LoD), as presented by Gülce et al. [62]
- Objective: To minimize the number of experiments required to optimize impedance measurement parameters for QCM, thereby enhancing the detection limit for analytes like glycerol.
- Experimental Design and Clustering:
- Parameter Selection: Identify key parameters to optimize (e.g., oscillator settings, network analyzer configurations).
- Initial Data Set: Conduct a limited set of experiments that capture the variation space of the selected parameters.
- k-means Clustering: Apply the k-means clustering algorithm to group experimental conditions and identify a representative subset that preserves the overall parameter variation.
- Model Building and Validation:
- Supervised Classification: Train a Support Vector Machine (SVM) classifier to predict the performance category of a given parameter set.
- Model Compatibility: Validate the model by ensuring a high compatibility (e.g., >80%) between results from the clustering and classification approaches.
- LoD Assessment: Use the optimized parameter set to measure glycerol solutions of varying concentrations. The refined setup can improve the LoD by an order of magnitude compared to non-optimized parameters.
Signaling Pathways and Workflow Visualizations
The following diagrams, generated using DOT language, illustrate the core operational principles and experimental workflows for QCM and SAW biosensors.
Fundamental Sensing Mechanisms
Diagram 1: Core operational principles of QCM and SAW biosensors.
SH-SAW Lipoprotein Sizing Workflow
Diagram 2: Experimental workflow for lipoprotein particle sizing using an SH-SAW biosensor.
The Scientist's Toolkit: Essential Research Reagents and Materials
Successful experimentation with QCM and SAW biosensors requires specific materials and functional layers. The following table catalogs key components used in the featured research.
Table 3: Essential Materials for Piezoelectric Biosensor Research
| Item Name | Function / Application | Specific Example from Research |
|---|---|---|
| Piezoelectric Substrates | Provides the medium for acoustic wave generation and propagation. | AT-cut Quartz (QCM), 36° Y-cut Quartz (SH-SAW), Lithium Niobate (SAW). [60] [56] |
| Interdigitated Transducers (IDTs) | Electromechanical conversion; launch and receive acoustic waves. | Metal electrodes (e.g., Al, Au) fabricated on piezoelectric substrate. [57] |
| Sensitive Layers / Nanomaterials | Enhances selectivity and sensitivity by interacting with the target analyte. | Reduced Graphene Oxide (rGO) for H₂, Pd/Ni films, Metal-Organic Frameworks (MOFs), ZnO nanostructures. [17] [60] |
| Recognition Elements | Provides high specificity for the target analyte. | Immobilized antibodies (e.g., for lipoproteins), enzymes, DNA aptamers. [56] |
| Microfluidic Channels | Guides liquid samples, minimizes sample volume, and integrates with sensor chips. | Polydimethylsiloxane (PDMS) channels for particle detection in liquid media. [57] |
| Catalyst Layers | Facilitates specific chemical reactions on the sensor surface. | Platinum (Pt) doped reduced graphene oxide for hydrogen dissociation. [60] |
| Optimization Software | Uses machine learning to optimize sensor parameters and reduce experiments. | k-means clustering and Support Vector Machine (SVM) algorithms for QCM impedance optimization. [62] |
Point-of-Care Testing (POCT) is transforming healthcare by moving diagnostic testing from centralized laboratories to locations close to the patient, enabling rapid turnaround times and timely clinical decision-making [63]. Technological advancements, particularly in biosensor technology, are the driving force behind this shift. Among the most promising are piezoelectric acoustic biosensors, including the Quartz Crystal Microbalance (QCM) and Surface Acoustic Wave (SAW) sensors, which offer label-free, highly sensitive detection of analytes [3]. This guide provides a detailed, objective comparison of QCM and SAW biosensor performance, supported by experimental data and methodologies, to inform researchers and drug development professionals.
Operating Principles and Transducer Characteristics
QCM and SAW sensors, while both piezoelectric acoustic transducers, operate on fundamentally different physical principles, which directly influence their design, capabilities, and optimal applications.
Quartz Crystal Microbalance (QCM) is a Bulk Acoustic Wave (BAW) device. In a QCM, an AT-cut quartz crystal wafer is sandwiched between two electrodes. When an alternating voltage is applied, it induces a thickness-shear mode (TSM) deformation, where the acoustic wave propagates through the bulk of the crystal in the direction of its thickness [3] [6]. The key measurement is the change in the sensor's resonant frequency (Δf) due to mass adsorption on the electrode surface. This relationship is quantitatively described by the Sauerbrey equation [3] [55] [6]:
Δf = −2Δm n f₀²/(A μq^(1/2) ρq^(1/2))
where Δm is the mass change, f₀ is the fundamental resonant frequency, n is the harmonic number, A is the electrode area, μq is the elastic coefficient of quartz, and ρq is the crystal density [55]. This makes QCM an intrinsically gravimetric (mass-sensitive) sensor.
Surface Acoustic Wave (SAW) devices, in contrast, are surface-generated acoustic wave (SGAW) sensors. Acoustic waves, typically Rayleigh waves with both longitudinal and shear vertical components, travel along the surface of the piezoelectric substrate [3]. These waves are generated and detected by Interdigital Transducers (IDTs) patterned on the substrate surface. The energy of the acoustic wave is highly confined to the surface, making SAW sensors exceptionally sensitive to surface perturbations, including mass, pressure, and conductivity changes [3].
Shear Horizontal SAW (SH-SAW) is a variant where the wave propagation is parallel to the surface with a shear horizontal polarization, making it more suitable for operation in liquid environments [56].
The following diagram illustrates the core operational logic and key differences between these two transducer types.
Performance Data and Comparison
The fundamental differences in the operating principles of QCM and SAW sensors lead to distinct performance profiles. The table below summarizes key characteristics based on current literature and experimental findings.
Table 1: Performance Comparison of QCM and SAW Biosensors
| Performance Parameter | QCM (Quartz Crystal Microbalance) | SAW (Surface Acoustic Wave) |
|---|---|---|
| Typical Operating Frequency | 5–20 MHz (Standard); up to 195 MHz (HFF-QCM) [3] | ~250 MHz [56] to GHz range [3] |
| Mass Sensitivity | Proportional to f₀²; ~2 Hz cm² ng⁻¹ at 30 MHz [6] | Higher than QCM due to higher frequency and energy confinement at surface [3] |
| Limit of Detection (LoD) | SARS-CoV-2: 53.3 TCID₅₀/mL [22]; Mercury: ~1 µg/m³ in air, ~0.05 µg/L in water [55] | Hydrogen: 2 ppm [60] |
| Liquid Phase Operation | Excellent; shear wave design minimizes energy loss [3] [6] | Poor for Rayleigh SAW; possible with Shear Horizontal (SH-SAW) design [3] [56] |
| Key Measurable Outputs | Resonant frequency shift (Δf) [55] | Velocity change (Δv) & attenuation change [56]; Frequency shift [60] |
| Multiplexing Potential | Limited | Higher, facilitated by IDT design [3] |
| Key Advantages | Ruggedness, proven liquid operation, cost-effectiveness [3] | Very high sensitivity, high-frequency operation [3] |
| Main Limitations | Lower intrinsic sensitivity vs. SAW/FBAR; limited multiplexing [3] | Excessive damping in liquids (standard Rayleigh SAW) [3] |
Experimental Protocols and Methodologies
To illustrate how performance data is generated, here are detailed methodologies from recent studies for each biosensor type.
QCM Experimental Protocol: SARS-CoV-2 Detection
A recent study developed a rapid and ultrasensitive QCM biosensor for detecting the SARS-CoV-2 nucleocapsid protein [22].
1. Sensor Functionalization:
- Surface Cleaning: The gold electrode of a QCM sensor is first cleaned using an oxygen plasma treatment.
- PEG Layer Formation: The sensor is functionalized with a polyethylene glycol (PEG)-based layer. This layer serves as a matrix for antibody immobilization, reduces non-specific binding, and significantly improves sensitivity and specificity [22].
- Antibody Immobilization: Specific anti-SARS-CoV-2 nucleocapsid antibodies are immobilized onto the functionalized PEG surface.
2. Measurement and Data Acquisition:
- The functionalized QCM sensor is placed in a flow cell system.
- A baseline resonance frequency is established using a buffer solution.
- The sample containing the SARS-CoV-2 antigen is introduced over the sensor surface.
- The specific binding between the antibody and antigen increases the mass on the sensor surface, leading to a measurable decrease in the resonant frequency.
- The frequency shift (Δf in Hz) is monitored in real-time for approximately 15 minutes [22].
- Cross-reactivity Testing: To confirm specificity, the sensor is tested against other viruses, such as Influenza A [22].
3. Data Analysis:
- The frequency shift is correlated with antigen concentration using a calibration curve.
- The limit of detection (LoD) is calculated, which was reported to be 53.3 TCID₅₀/mL with a sensitivity of 0.263 Hz/TCID₅₀/mL [22].
SAW Experimental Protocol: Lipoprotein Sizing
A 2025 study utilized a Shear Horizontal SAW (SH-SAW) biosensor for sizing lipoprotein particles, demonstrating an application beyond simple detection [56].
1. Sensor Fabrication and Functionalization:
- Sensor Chip: A 250 MHz SH-SAW device is fabricated on 36° rotated Y-cut 90° X-propagating quartz substrates (3 × 5 mm chip) [56].
- Antibody Immobilization: Different capture antibodies (e.g., ApoA1, ApoB48, ApoB100, Lp(a)) are immobilized on distinct gold surfaces of the sensor chip.
2. Measurement and Data Acquisition:
- A reflective-type design and unique packaging technology are employed [56].
- A sample of human plasma is introduced to the sensor.
- Lipoproteins are captured by their specific antibodies on the sensor surface.
- The SH-SAW device measures two parameters simultaneously: the change in acoustic wave velocity (Δv) and the change in attenuation (damping).
3. Data Analysis and Sizing:
- The core of this methodology is the calculation of the "layer-parameter," defined as the ratio of the velocity change to the attenuation change [56].
- Numerical calculations validate the experimental results.
- The calculated layer-parameter values for different lipoproteins (e.g., -0.398 for ApoA1, -1.133 for ApoB48) demonstrate a strong correlation (R = 0.9987) with the size of the captured particles, allowing for particle sizing [56].
The workflow for these experimental processes, from setup to analysis, is summarized below.
The Scientist's Toolkit: Essential Research Reagents and Materials
Successful implementation of QCM or SAW-based assays requires a suite of specialized materials and reagents. The following table details key components and their functions in a typical biosensing experiment.
Table 2: Essential Research Reagent Solutions for Piezoelectric Biosensing
| Reagent/Material | Function in the Experiment | Example from Cited Research |
|---|---|---|
| Piezoelectric Substrate | The core material that generates the acoustic wave. | AT-cut quartz wafer for QCM [3]; 36° Y-cut X-prop. quartz for SH-SAW [56]; Lithium Niobate [60]. |
| Bio-recognition Element | Provides specificity by binding the target analyte. | Anti-SARS-CoV-2 antibodies [22]; ApoA1, ApoB antibodies for lipoproteins [56]. |
| Surface Chemistry Reagents | Modify the sensor surface to enable robust receptor immobilization and reduce non-specific binding. | Polyethylene glycol (PEG) [22]; reduced Graphene Oxide (rGO) for SAW hydrogen sensor [60]. |
| Blocking Agents | Passivate unused surface sites to minimize non-specific adsorption of non-target molecules. | Bovine Serum Albumin (BSA) [64] casein, or other proprietary commercial blockers. |
| Regeneration Buffers | Gentle acidic or basic solutions that disrupt antibody-antigen binding, allowing sensor reuse. | Used in repeated binding/regeneration cycles for kinetics studies [64]. |
| Microfluidic Flow Cell | Provides controlled delivery of sample and buffers to the sensor surface. | Integrated flow cell for QCM SARS-CoV-2 detection [22]; reflective-type cell for SH-SAW [56]. |
Both QCM and SAW technologies are powerful platforms advancing the field of point-of-care diagnostics. The choice between them is not a matter of superiority but of application-specific suitability. QCM remains the workhorse for liquid-phase biosensing, valued for its ruggedness, proven performance in complex fluids, and relative simplicity [3] [22]. Its application in detecting SARS-CoV-2 proteins and environmental mercury highlights its practical versatility [22] [55]. SAW sensors, particularly SH-SAW, offer higher inherent sensitivity and have demonstrated unique capabilities like particle sizing [56]. They excel in gas sensing and are finding niches in liquid sensing where their multi-parameter output (velocity and attenuation) provides richer information [56] [60]. The ongoing integration of machine learning for sensor optimization and data analysis, alongside material science advancements like graphene-based sensitive layers, will further enhance the sensitivity, specificity, and reliability of both platforms, solidifying their role in the future of decentralized healthcare [62] [65].
Enhancing Performance: Troubleshooting Common Challenges and Optimization Strategies
For researchers developing acoustic biosensors, operating in liquid media presents a fundamental challenge. Viscous damping significantly compromises sensor performance by dissipiating acoustic energy into the surrounding fluid, reducing sensitivity and signal-to-noise ratio. This comparison guide objectively examines the performance differential between Surface Acoustic Wave (SAW) and Quartz Crystal Microbalance (QCM) sensors in liquid environments and details the engineered solutions that enable SAW technology to overcome these limitations. While QCM devices, as thickness shear mode resonators, inherently resist damping in liquids and have been widely used for liquid-phase sensing [3], conventional Rayleigh SAW sensors suffer from excessive damping loss in liquid media due to their radiation of compressional waves into the fluid [3]. This performance limitation has driven innovative approaches in SAW design, including wave propagation mode engineering, specialized waveguide implementation, and device structure optimization, making modern SAW sensors viable for sophisticated biological and chemical sensing applications in liquid media.
Performance Comparison: QCM vs. SAW in Liquid Environments
The table below summarizes the core performance characteristics and challenges of QCM and SAW sensors when operating in liquid media.
Table 1: Performance Comparison of QCM and SAW Sensors in Liquid Media
| Parameter | QCM Sensors | Conventional Rayleigh SAW Sensors | Advanced SAW Sensors (Love Wave, SH-SAW) |
|---|---|---|---|
| Wave Propagation | Bulk Acoustic Wave (Thickness Shear Mode) [3] | Surface Wave (Longitudinal & Shear Vertical Components) [3] [66] | Shear Horizontal or Love Wave [57] [67] |
| Liquid Damping | Low (Shear wave does not radiate much energy) [3] | Very High (Radiates compressional waves) [3] | Low (Energy confined to sensing surface) [57] [67] |
| Primary Liquid Challenge | Temperature effects due to viscosity changes [68] | Severe wave energy loss leading to signal attenuation [3] | Design complexity, fabrication precision |
| Typical Frequency Range | 5-20 MHz (Higher frequencies make wafers fragile) [3] | Tens to hundreds of MHz [3] | Tens to hundreds of MHz (e.g., 82.5 MHz [57]) |
| Mass Sensitivity | Good (ng to pg level) [3] [69] | High, but often unusable in liquids due to damping [3] | Very High (e.g., GHz range FBARs) [3] |
Engineered Strategies for SAW Performance in Liquids
Wave Propagation Mode Engineering
The primary strategy to overcome viscous damping involves altering the acoustic wave's propagation mode to minimize energy radiation into the liquid.
Shear-Horizontal (SH-SAW) Modes: Devices based on 36°Y-cut LiTaO₃ (Lithium Tantalate) substrates generate shear-horizontal waves where particle displacement is parallel to the sensor surface and perpendicular to the direction of wave propagation [67]. This motion does not couple efficiently with the liquid, which is ideal for liquid sensing. The high electroacoustic coupling coefficient (K²) of LiTaO₃ ensures stable signal generation even when energy is partially absorbed by microfluidic components [67].
Love Wave Devices: Love wave sensors employ a waveguide layer (e.g., SiO₂) on top of the piezoelectric substrate that traps acoustic energy near the surface [57]. This configuration enhances mass sensitivity and protects the wave from liquid damping. A 2025 study demonstrated a Love wave device with a PDMS microfluidic channel that acted as a dual-function waveguide, effectively localizing wave confinement and converting Rayleigh waves to Love waves, resulting in minimal dissipative losses in liquids [57].
Material and Design Optimizations
Material selections and device design are critical for stabilizing SAW sensor performance in liquids.
Protective Waveguide Layers: Depositing a Zinc Oxide (ZnO) layer on a LiTaO₃ substrate serves multiple functions: it reduces the temperature coefficient of frequency and increases mass sensitivity [67]. This coating makes the device more robust against environmental fluctuations during liquid sensing.
Microfluidic Integration: The design of the fluidic chamber is integral to performance. Using a PDMS (Polydimethylsiloxane) microchannel with optimized sidewall thickness can reduce the damping effect of the channel material on wave propagation, thereby increasing sensitivity [67]. PDMS is biocompatible and widely used in biomedical devices [67].
IDT Electrode Configuration: The physical dimensions of the Interdigital Transducers (IDTs) determine operating frequency and performance. Research shows that a configuration with 12 μm electrode width and spacing outperforms a 38 μm configuration, achieving a lower insertion loss of -57 dB (FEA) and a higher Q-factor, which is crucial for maintaining a strong signal in lossy liquid environments [57].
The following diagram illustrates the typical architecture of a Love wave SAW biosensor designed for liquid operation, incorporating the key strategies of a waveguide layer and microfluidic integration.
Experimental Validation and Protocol
A typical experiment to characterize and validate SAW sensor performance in liquid involves monitoring frequency shifts in response to known particle concentrations or cellular masses.
Table 2: Key Research Reagent Solutions for SAW Liquid-Phase Sensing
| Reagent/Material | Function in Experiment | Example from Literature |
|---|---|---|
| PDMS (Polydimethylsiloxane) | Forms a biocompatible microfluidic channel that acts as a waveguide to minimize acoustic energy loss. | Used as a dual-function waveguide to convert Rayleigh waves to Love waves and confine energy [57]. |
| ZnO (Zinc Oxide) Sputtering Target | Source material for depositing a thin film waveguide layer on the substrate to enhance mass sensitivity and temperature stability. | A 200 nm thick ZnO film was sputtered on a LiTaO₃ substrate at 150°C [67]. |
| Polystyrene Microbeads | Function as well-defined analog particles for sensitivity calibration and limit of detection studies. | 10 μm diameter PS particles were used as Lactobacillus analogs to validate sensor response [57]. |
| Lithium Tantalate (LiTaO₃) Wafer | Serves as the high-performance piezoelectric substrate for generating shear-horizontal SAWs. | 36°Y-cut LiTaO₃ wafers were used as the substrate for their high electroacoustic coupling coefficient [67]. |
Detailed Experimental Methodology for Micro-particle Detection:
A 2025 study by Ali et al. provides a clear protocol for testing SAW sensor performance in liquid [57]:
- Device Fabrication: Create IDTs with specific widths (e.g., 12 μm and 38 μm) on a piezoelectric substrate using traditional micro-lithography. Subsequently, sputter a 200 nm ZnO layer at 150°C. Fabricate a PDMS microchannel via molding and bond it to the substrate using oxygen plasma treatment [57].
- System Characterization: Connect the SAW device to a vector network analyzer to measure key parameters like insertion loss (S21) and reflection coefficient (S11). A low insertion loss (e.g., -57 dB from FEA, -64.86 dB experimentally for the 12 μm device) confirms efficient operation and minimal energy loss [57].
- Liquid Introduction & Calibration: Introduce a liquid medium (e.g., buffer solution) into the PDMS channel. Establish a baseline frequency or insertion loss.
- Analyte Introduction and Sensing: Flow a suspension of target particles (e.g., 10 μm Polystyrene beads as bacterial analogs) at varying concentrations through the microchannel.
- Data Acquisition and Analysis: Monitor changes in insertion loss (ΔIL) as the primary metric for quantifying particle-induced perturbations. The relationship between ΔIL and particle concentration is established to determine the sensor's sensitivity and limit of detection (LoD) [57].
The workflow below summarizes the logical process of developing and validating a liquid-phase SAW sensor, from problem identification to performance confirmation.
The strategic engineering of wave propagation modes and device architectures has successfully transformed SAW sensors from being primarily gas-phase devices into powerful tools for liquid-phase analysis. While QCM remains a robust and simpler option for many liquid sensing applications, advanced SAW sensors like Love wave and SH-SAW devices offer superior sensitivity and are highly competitive in applications demanding the detection of low analyte concentrations, such as in single-cell analysis [70] or the detection of viral antigens [17]. Future developments will likely focus on further integration with microfluidics, enhanced temperature stability, and the application of novel nanomaterial coatings to improve selectivity and sensitivity, solidifying the role of SAW technology in the next generation of portable, high-performance biosensors.
Minimizing Non-Specific Binding and Improving Signal-to-Noise Ratio in Complex Samples
Piezoelectric biosensors, particularly Quartz Crystal Microbalance (QCM) and Surface Acoustic Wave (SAW) devices, have emerged as powerful label-free tools for detecting a wide range of analytes in complex biological samples [3]. Their ability to provide real-time, high-sensitivity detection makes them invaluable for applications from clinical diagnostics to environmental monitoring [58] [71]. However, their performance in complex matrices such as blood, serum, or food samples is critically dependent on effectively minimizing non-specific binding (NSB) while maximizing the signal-to-noise ratio (SNR).
NSB occurs when non-target molecules interact with the sensor surface, leading to increased background noise and reduced detection accuracy [22]. The fundamental challenge lies in distinguishing specific binding events from this background interference, a task complicated by the diverse composition of real-world samples containing proteins, lipids, and other confounding biomolecules [72]. This comparison guide examines how QCM and SAW technologies address these challenges through different physical principles, surface functionalization strategies, and detection methodologies.
The following sections provide an objective performance comparison between QCM and SAW biosensors, supported by experimental data and detailed protocols. We evaluate their respective capabilities in complex sample analysis, with particular focus on sensitivity limits, operational frequencies, and practical implementation considerations for research and drug development applications.
Operating Principles and Technical Specifications
QCM and SAW sensors operate on distinct acoustic wave principles that fundamentally influence their performance characteristics. QCM devices are bulk acoustic wave (BAW) resonators where acoustic waves propagate through the thickness of the piezoelectric crystal, typically operating in the 5-30 MHz frequency range [3] [16]. These thickness-shear mode (TSM) resonators exhibit minimal damping in liquid environments, making them suitable for biological applications [3].
In contrast, SAW sensors are surface-based devices where acoustic waves travel parallel to the piezoelectric substrate surface, confining energy to the sensing region [3] [73]. This fundamental difference enables SAW devices to achieve significantly higher operating frequencies (hundreds of MHz to several GHz), resulting in enhanced mass sensitivity approximately 10-100 times greater than conventional QCM [16]. The energy concentration at the surface makes SAW sensors exceptionally responsive to surface perturbations but presents different challenges for liquid-phase operation.
Table 1: Fundamental Operating Principles of QCM and SAW Biosensors
| Parameter | QCM | SAW |
|---|---|---|
| Acoustic Wave Type | Bulk Acoustic Wave (BAW) | Surface Acoustic Wave |
| Wave Propagation | Through thickness of crystal | Parallel to substrate surface |
| Typical Frequency Range | 5-30 MHz [16] | Hundreds of MHz to GHz [16] |
| Primary Displacement | Shear horizontal [3] | Rayleigh (vertical & horizontal) or Shear Horizontal (SH) [71] |
| Liquid Phase Operation | Suitable with minimal damping [3] | Challenging for Rayleigh mode; SH-SAW and Love wave preferred [16] [71] |
| Energy Penetration Depth | Entire substrate thickness | ~1-2 wavelengths from surface [3] |
| Mass Sensitivity | ~10⁻⁹ g [16] | ~10⁻¹² g (picogram range) [16] |
Performance Comparison in Complex Samples
Sensitivity and Detection Limits
The substantial difference in operational frequencies between QCM and SAW sensors translates directly to their mass detection capabilities. According to the Sauerbrey equation, the mass sensitivity of acoustic devices is proportional to the square of the fundamental resonance frequency [3]. This fundamental relationship gives SAW sensors a significant advantage in detection limit performance.
Table 2: Performance Comparison for Bioanalytical Applications
| Performance Metric | QCM | SAW |
|---|---|---|
| Mass Detection Limit | ~10⁻⁹ g [16] | ~10⁻¹² g (picogram range) [16] |
| Typical Applications | Bacteria, proteins, clinical biomarkers [3] [22] | Viruses, cancer biomarkers, VOCs [17] [71] |
| Temperature Stability | Good (AT-cut quartz) [3] | Varies with substrate [73] |
| Liquid Operation Robustness | Excellent (shear wave decoupling) [3] | Requires specific configurations (Love wave, SH-SAW) [16] [71] |
| Commercial Availability | Widespread, low-cost [3] | Growing, moderate cost [3] |
| Non-Specific Binding Susceptibility | Moderate | Higher due to surface confinement |
Experimental data demonstrates these differences in practical applications. For SARS-CoV-2 detection, a PEG-functionalized QCM biosensor achieved a detection limit of 53.3 TCID₅₀/mL with a sensitivity of 0.263 Hz/TCID₅₀/mL [22]. In comparison, SAW biosensors for H1N1 influenza virus detection demonstrated detection limits as low as 1 ng/mL, leveraging their superior mass sensitivity [73].
Non-Specific Binding Management Strategies
Managing NSB requires different approaches for these platforms due to their distinct operational principles. For QCM systems, the penetration depth extends through the entire crystal, making them less susceptible to very thin non-specifically bound layers but more vulnerable to bulk liquid property changes [3]. For SAW sensors, the energy concentration within 1-2 wavelengths from the surface makes them exquisitely sensitive to any surface interactions but requires more sophisticated surface chemistry to differentiate specific from non-specific binding [16].
Both platforms benefit from advanced surface functionalization strategies. Polyethylene glycol (PEG) coatings have proven particularly effective for creating non-fouling surfaces. In QCM SARS-CoV-2 detection, PEG-based functionalization significantly improved both sensitivity and specificity, enabling reliable detection in complex samples [22]. Similarly, SAW biosensors employing nanomaterials like graphene oxide, zinc oxide (ZnO), and metal-organic frameworks (MOFs) have demonstrated improved selectivity and reduced NSB through precise chemical tuning of surface properties [17] [73].
Experimental Protocols for Performance Validation
QCM Biosensor for SARS-CoV-2 Detection
Surface Functionalization Protocol [22]:
- Sensor Cleaning: Standard piranha solution treatment (3:1 H₂SO₄:H₂O₂) for 30 minutes, followed by oxygen plasma treatment
- PEG Immobilization: Incubate crystal in 2 mM methoxy-PEG-thiol solution for 12 hours at 4°C to form anti-fouling monolayer
- Antibody Immobilization: Covalent attachment of anti-SARS-CoV-2 nucleocapsid antibodies via EDC-NHS chemistry in MES buffer (pH 6.0)
- Blocking: Treat with 1% BSA for 1 hour to minimize non-specific binding sites
- Validation: Characterize modified surface using SEM, Digital Holographic Microscopy, and Raman Spectroscopy
Assay Procedure:
- Baseline Establishment: Flow phosphate-buffered saline (PBS) until stable frequency baseline achieved (±2 Hz over 10 minutes)
- Sample Introduction: Inject clinical sample or spiked buffer, incubate for 15 minutes
- Washing: Remove unbound material with PBS wash
- Detection: Monitor frequency shift in real-time, calculate concentration using calibration curve
- Regeneration: Use 10 mM glycine-HCl (pH 2.0) to remove bound antibodies for sensor reuse
This protocol achieved a detection limit of 53.3 TCID₅₀/mL for SARS-CoV-2 with minimal cross-reactivity against Influenza A, demonstrating excellent specificity in complex matrices [22].
Love-Wave SAW Biosensor for E. coli Detection
Sensor Fabrication and Functionalization [16]:
- Substrate Preparation: Use ST-cut quartz or 36° YX LiTaO₃ with SiO₂ waveguide layer
- IDT Fabrication: Create interdigital transducers (IDTs) using photolithography and metal deposition (typically Au/Cr)
- Microfluidic Integration: Bond PDMS microfluidic chamber using oxygen plasma treatment
- Surface Activation: Treat with oxygen plasma followed by (3-aminopropyl)triethoxysilane (APTES) vapor deposition
- Antibody Immobilization: Covalent attachment of anti-E. coli antibodies using glutaraldehyde crosslinking
- Blocking: Incubate with 2% casein in PBS for 2 hours to minimize NSB
Detection Methodology:
- Reference Compensation: Utilize dual-channel design with reference sensor for differential measurement
- Sample Introduction: Flow sample through microfluidic chamber at optimized flow rate (typically 10-50 μL/min)
- Real-time Monitoring: Track phase and amplitude changes at operating frequency (typically 100-500 MHz)
- Data Analysis: Employ vector network analyzer for precise S-parameter measurements
- Quantification: Correlate frequency shift with bacterial concentration using established calibration
This approach has demonstrated detection capabilities for E. coli O157:H7 below the dangerous threshold of 1 CFU in 25g of food, representing significant improvement over conventional detection methods [16].
Signal Enhancement and Noise Reduction Technologies
Advanced Transduction Methods
Recent innovations in transduction methodologies have significantly improved SNR characteristics for both platforms. Fano resonance enhancement has emerged as a particularly promising approach for SAW sensors, where connecting an external shunt capacitor to the resonator can increase the quality factor (Q-factor) by up to 8 times (from 929 to 7682 in experimental demonstrations) [26]. This dramatic improvement in Q-factor directly enhances frequency stability and detection resolution without requiring changes to the resonator structure or materials.
For QCM systems operating in liquid environments, multiharmonic monitoring provides valuable insights into viscoelastic properties of the bound layer, enabling better discrimination between specific binding and non-specific adsorption. By analyzing the overtone-dependent frequency and dissipation responses, researchers can differentiate between rigidly bound target molecules and weakly adsorbed interferents [3].
Nanomaterial-Enhanced Sensing Interfaces
The integration of nanomaterials has revolutionized both QCM and SAW biosensing platforms by providing enhanced surface area, improved binding kinetics, and reduced non-specific interactions:
MXene-composite functionalization in QCM sensors has demonstrated significantly improved glucose detection capabilities through enhanced electron transfer and reduced fouling [58]. Similarly, graphene oxide-based interfaces on SAW sensors have shown remarkable improvements in NO₂ capture and detection, with applications extending to biological systems [58].
Metal-Organic Frameworks (MOFs) have been successfully employed in SAW sensors for breath analysis and VOC detection, providing exceptional molecular sieving capabilities that selectively exclude interfering molecules based on size and chemical properties [17]. This approach is particularly valuable for analyzing cancer biomarkers in exhaled breath, where discriminating against abundant molecules like water vapor is essential for reliable detection [71].
Table 3: Research Reagent Solutions for Enhanced Biosensing
| Reagent/Category | Function | Application Examples |
|---|---|---|
| Polyethylene Glycol (PEG) | Anti-fouling polymer reduces non-specific binding | QCM SARS-CoV-2 detection [22] |
| MXene-Composites | Enhanced electron transfer, reduced fouling | QCM glucose detection [58] |
| Graphene Oxide | High surface area, tunable chemistry | SAW NO₂ sensing, biological detection [58] |
| Metal-Organic Frameworks (MOFs) | Molecular sieving, selective exclusion | SAW VOC cancer biomarker detection [17] [71] |
| Gold Nanoparticles | Signal amplification, biomolecule conjugation | SAW DNA detection, E. coli sensors [73] |
| SH-SAW Substrates | Minimizes energy loss in liquids | SAW biosensing in serum, blood [71] |
The comparative analysis of QCM and SAW biosensors reveals complementary strengths for different application scenarios in complex sample analysis. QCM technology offers robust liquid-phase operation with simpler instrumentation and lower implementation costs, making it particularly suitable for applications where moderate sensitivity suffices and budget constraints exist [3] [16]. Its established surface chemistry protocols and tolerance to varying liquid environments make it accessible for diverse research settings.
Conversely, SAW biosensors provide superior sensitivity with picogram-level detection limits, enabled by their higher operational frequencies and energy confinement at the sensing surface [16]. While requiring more sophisticated engineering for liquid-phase operation through SH-SAW or Love-wave configurations, these platforms deliver exceptional performance for detecting low-abundance analytes like cancer biomarkers, viruses, and trace environmental contaminants [17] [73] [71].
The optimal selection between these technologies depends fundamentally on the specific analytical requirements. For applications demanding ultimate sensitivity and where technical complexity can be managed, SAW biosensors present compelling advantages. For more routine analyses where operational robustness and cost-effectiveness are prioritized, QCM remains an excellent choice. Both platforms continue to benefit from ongoing advancements in nanomaterial interfaces, surface functionalization strategies, and signal processing techniques, further expanding their capabilities for reliable analysis in challenging sample matrices.
Piezoelectric biosensors are a class of analytical devices that exploit the piezoelectric effect—where certain materials generate an electrical charge in response to applied mechanical stress—to detect biological interactions. Among these, Quartz Crystal Microbalance (QCM) and Surface Acoustic Wave (SAW) sensors are two prominent technologies. Both are mass-sensitive devices, but they differ fundamentally in their design and operational principles, making them suitable for a range of applications from clinical diagnostics to environmental monitoring [74].
QCM sensors typically utilize a quartz crystal disc sandwiched between two electrodes. When an alternating voltage is applied, it induces a shear horizontal oscillation in the crystal. The fundamental principle is that the resonance frequency of this crystal shifts when mass adsorbs to its surface, a relationship quantitatively described by the Sauerbrey equation [74]. This makes QCM exceptionally sensitive to mass changes, even at the nanogram level.
SAW sensors, in contrast, operate by generating and detecting acoustic waves that travel along the surface of a piezoelectric substrate. These waves are highly sensitive to changes in the physical and chemical properties of the surface and its immediate environment. SAW devices are broadly classified into delay line types and resonator types, and can propagate different wave modes, such as Rayleigh waves or Shear Horizontal (SH) waves, with the latter being particularly suitable for liquid environments [50]. Changes in wave velocity or amplitude, often measured as a frequency shift, correspond to the detection event.
The integration of advanced nanomaterials such as graphene, metal-organic frameworks (MOFs), and metal oxide nanostructures into the sensing interfaces of both QCM and SAW devices has dramatically enhanced their performance. These materials increase the active surface area, provide more binding sites, and can be functionalized to improve the sensors' sensitivity, selectivity, and stability [17] [75] [76].
Comparative Operating Principles and Sensing Mechanisms
Fundamental Principles of QCM
The core of a QCM sensor is a thin disc of AT-cut quartz crystal, chosen for its temperature stability, positioned between two metal electrodes. The application of an alternating electric field induces a standing acoustic wave with a resonance frequency primarily determined by the crystal's physical thickness and properties. The Sauerbrey equation establishes the direct proportionality between the mass of a rigid, thin film adsorbed on the crystal surface and the observed decrease in resonance frequency [74]:
Δf = - (2 * f₀² * Δm) / (A * √(ρᵩ * μᵩ))
Where:
Δfis the measured frequency change.f₀is the fundamental resonant frequency of the crystal.Δmis the mass change.Ais the active area of the crystal.ρᵩis the density of quartz (2.648 g/cm³).μᵩis the shear modulus of quartz (2.947 × 10¹¹ g/cm·s²) [74].
When operating in a liquid environment, the sensor's response is also influenced by the liquid's viscosity and density, as described by the Kanazawa and Gordon equation [74]. This makes QCM a powerful tool not only for measuring adsorbed mass but also for studying viscoelastic properties at the sensor-liquid interface.
Fundamental Principles of SAW
SAW sensors are fabricated on piezoelectric substrates like lithium niobate (LiNbO₃) or lithium tantalate (LiTaO₃). The key components are Interdigital Transducers (IDTs) patterned on the surface. An input IDT converts an applied electrical signal into a mechanical acoustic wave that propagates along the substrate's surface. A second, output IDT then reconverts this wave back into an electrical signal [50].
The propagation characteristics of the surface wave are exquisitely sensitive to surface perturbations. The resonant frequency (f) is given by f = v/λ, where v is the phase velocity of the acoustic wave and λ is the wavelength, determined by the geometry of the IDTs. Any interaction on the sensing path—such as mass adsorption, changes in conductivity, or viscoelasticity—alters the wave's velocity or amplitude, resulting in a measurable frequency or phase shift [50].
SAW sensors can operate in different modes:
- Rayleigh waves, which involve surface-normal displacement, are highly sensitive but are strongly damped in liquids.
- Shear Horizontal (SH) waves, such as Love waves, have an in-plane displacement, making them ideal for operation in liquid media and biosensing applications, as they minimize energy loss into the liquid [17] [50].
Table 1: Core Operational Principles of QCM and SAW Sensors.
| Feature | Quartz Crystal Microbalance (QCM) | Surface Acoustic Wave (SAW) |
|---|---|---|
| Core Principle | Bulk acoustic wave (thickness-shear mode) | Surface-propagating acoustic wave |
| Primary Measurand | Change in resonant frequency (Δf) |
Change in wave velocity / frequency (Δf or Δv) |
| Governed by | Sauerbrey equation (mass) / Kanazawa (liquid) | f = v/λ (velocity & wavelength) |
| Key Substrate | AT-cut Quartz | LiNbO₃, LiTaO₃, Quartz |
| Wave Type | Shear Horizontal (SH) | Rayleigh, Shear Horizontal (SH), Love |
| Liquid Operation | Suitable, with viscosity coupling | Requires Shear Horizontal modes (e.g., Love wave) |
Visualization of Working Principles
The following diagram illustrates and contrasts the fundamental working principles and signal transduction pathways of QCM and SAW biosensors.
Advanced Sensing Materials and Functionalization
The performance of piezoelectric biosensors is critically dependent on the properties of the sensing layer. Advanced nanomaterials, with their high surface-to-volume ratio and tunable surface chemistry, are pivotal in enhancing sensor capabilities.
Graphene and its Derivatives
Graphene, a single layer of carbon atoms, and its derivatives like graphene oxide (GO) are widely used due to their exceptional electrical conductivity, mechanical strength, and vast specific surface area. GO, in particular, is rich in oxygen-containing functional groups (e.g., epoxide, hydroxyl, carboxyl), which facilitate the covalent immobilization of biorecognition elements like antibodies and aptamers [17] [76]. Its use in SAW sensors has been shown to significantly boost sensitivity for gases like NO₂, while in QCM, it forms a robust platform for building highly specific sensing interfaces [58] [76].
Metal-Organic Frameworks (MOFs) and Covalent Organic Frameworks (COFs)
MOFs and COFs are crystalline porous materials known for their extraordinarily high surface area and tunable pore structures. MOFs consist of metal ions or clusters coordinated to organic linkers, while COFs are formed by strong covalent bonds between organic molecules [75]. Their integration into QCM and SAW sensors dramatically increases the adsorption capacity for target analytes. The selectivity can be finely tuned by tailoring the pore size and functionalizing the internal surfaces, making them ideal for discriminating between volatile organic compounds (VOCs) or specific biomolecules [75]. COFs offer the added advantage of exceptional chemical and thermal stability [75].
Metal Oxide Nanostructures
Metal oxide nanostructures, particularly zinc oxide (ZnO), are prized for their piezoelectric and semiconductor properties. They can be synthesized in various morphologies such as nanowires, nanorods, and thin films, which provide a large surface area for interaction [17] [50]. In SAW sensors, a ZnO nanostructured layer can act as both a piezoelectric medium and a sensitive coating, enhancing the sensor's response to UV light, gases, and biological molecules. Their high isoelectric point also makes them suitable for the electrostatic adsorption of biomolecules like DNA and proteins [17] [76].
Table 2: Key Advanced Materials and Their Roles in Sensor Enhancement.
| Material | Key Properties | Role in QCM/SAW Sensing | Example Application |
|---|---|---|---|
| Graphene Oxide (GO) | Large surface area, oxygen functional groups, good hydrophilicity | Increases binding sites; platform for bioreceptor immobilization | SAW NO₂ sensors; QCM immunosensors [17] [76] |
| Metal-Organic Frameworks (MOFs) | Ultra-high porosity, tunable pore size, vast surface area | Enhances vapor/analyte adsorption capacity; improves selectivity via pore design | QCM sensors for VOCs and hazardous gases [17] [75] |
| ZnO Nanostructures | Piezoelectric, semiconducting, high IEP, various morphologies | Acts as sensitive coating and signal amplifier; used for UV and gas sensing | SAW UV sensors; Biosensing [17] [50] |
| MXenes | Metallic conductivity, hydrophilic surface, functional groups | Boosts signal transduction; enhances sensitivity in gas/analyte detection | SAW humidity and gas sensors [58] [76] |
Performance Comparison and Experimental Data
The integration of advanced materials directly translates into superior sensor performance, as evidenced by numerous experimental studies. The data below summarizes key performance metrics for both QCM and SAW sensors functionalized with different nanomaterials.
Table 3: Comparative Experimental Performance of Advanced Material-Modified QCM and SAW Sensors.
| Sensor Platform | Sensing Material | Target Analyte | Experimental Limit of Detection (LOD) / Sensitivity | Key Performance Highlights |
|---|---|---|---|---|
| QCM [22] | PEG-functionalized surface | SARS-CoV-2 Nucleocapsid Protein | LOD: 53.3 TCID₅₀/mL | Rapid result (~15 min), high specificity vs. Influenza A, cost-effective. |
| QCM [75] | MOF-based substrate | Volatile Organic Compounds (VOCs) | Detection in nanogram levels | High selectivity, quick response, good stability at room temperature. |
| SAW [17] | ZnO, Graphene, MOFs | Gaseous Compounds (e.g., NO₂) | Ultra-low concentration detection | High sensitivity, stability; wireless capability for remote monitoring. |
| SAW [50] | Low-dimensional materials (e.g., TMDs) | NO₂, H₂, Humidity | High sensitivity, ppm-level gas detection | Rapid response, cost-effectiveness, suitability for flexible devices. |
Detailed Experimental Protocol: QCM for SARS-CoV-2 Detection
A representative experiment demonstrating high-performance QCM biosensing involved the detection of the SARS-CoV-2 nucleocapsid protein [22].
- Sensor Functionalization: A gold-coated QCM crystal was functionalized with a polyethylene glycol (PEG)-based self-assembled monolayer (SAM). This layer serves to minimize non-specific binding and provides a platform for the covalent attachment of specific anti-SARS-CoV-2 antibodies.
- Antibody Immobilization: The antibodies were immobilized onto the PEGylated surface using standard EDC-NHS chemistry, which creates amide bonds between the antibody's carboxyl groups and the amine groups on the sensor surface.
- Sample Incubation: Serial dilutions of inactivated SARS-CoV-2 virus (or the purified nucleocapsid protein) in a suitable buffer were flowed over the sensor surface and incubated.
- Measurement and Data Acquisition: The QCM resonator was connected to an oscillator circuit, and the frequency shift (
Δf) was monitored in real-time using a network analyzer or a dedicated QCM reader. The frequency stabilized after washing, and the maximum shift was recorded for each sample concentration. - Data Analysis: The frequency shifts were plotted against analyte concentration to generate a calibration curve. The LOD was calculated as the concentration corresponding to a signal three times the standard deviation of the blank (zero concentration) signal. Comprehensive surface characterization using techniques like Scanning Electron Microscopy (SEM) and Raman Spectroscopy confirmed the stability and integrity of the functionalized sensor surface [22].
Detailed Experimental Protocol: SAW for Gas Sensing
A common protocol for fabricating a SAW gas sensor using a metal oxide nanostructure is as follows [50]:
- SAW Device Fabrication: A delay-line SAW device is fabricated on a 128° Y-X lithium niobate (LiNbO₃) substrate using photolithography to pattern the Interdigital Transducers (IDTs).
- Sensing Layer Deposition: The sensitive material, for instance, ZnO nanowires, is deposited onto the delay path between the IDTs. This can be achieved via methods like drop-casting, spin-coating, or chemical vapor deposition (CVD).
- Sensor Testing Setup: The SAW device is mounted in a sealed gas chamber with electrical feedthroughs. The input IDT is connected to a radio-frequency (RF) signal generator, and the output IDT is connected to a frequency counter or vector network analyzer.
- Gas Exposure and Measurement: A constant flow of a carrier gas (e.g., synthetic air) is maintained. Pulses of the target gas (e.g., NO₂) at varying concentrations are introduced into the carrier gas stream. The change in the oscillator frequency (or insertion loss/phase) is recorded in real-time.
- Performance Evaluation: The sensor's response is defined as the frequency shift (
Δf) upon exposure to the target gas. Parameters like sensitivity (slope ofΔfvs. concentration), response/recovery time (time to reach 90% of the total signal change), and limit of detection are calculated. The sensor's selectivity is tested by exposing it to different interfering gases.
The Scientist's Toolkit: Essential Research Reagents and Materials
The development and deployment of high-performance piezoelectric biosensors rely on a suite of specialized materials and reagents.
Table 4: Essential Research Reagents and Materials for Sensor Development.
| Item | Function & Application |
|---|---|
| AT-cut Quartz Crystal | The standard piezoelectric substrate for QCM sensors, providing temperature-stable resonance. |
| Lithium Niobate (LiNbO₃) Wafer | A high-coupling-coefficient piezoelectric substrate widely used for high-frequency SAW sensors. |
| Photoresist & Developer | Essential for photolithography processes to pattern Interdigital Transducers (IDTs) on SAW substrates. |
| Gold/Titanium Evaporation Targets | For depositing electrode layers (e.g., for QCM crystals or SAW IDTs); Ti is often used as an adhesion layer. |
| Graphene Oxide (GO) Dispersion | A ready-to-use aqueous dispersion for depositing graphene oxide sensing layers via spin/drop-coating. |
| MOF/COF Crystals (e.g., ZIF-8) | Pre-synthesized porous materials that can be dispersed and coated onto sensors to enhance vapor adsorption. |
| ZnO Nanostructure Powder | For creating metal oxide sensing layers; can be formulated into an ink or used for CVD growth. |
| Functionalization Reagents (e.g., PEG-Thiol, APTES) | Silane and thiol-based chemicals used to form self-assembled monolayers (SAMs) for surface modification. |
| Bioconjugation Kit (EDC, NHS, Sulfo-SMCC) | A set of crosslinkers for covalent immobilization of antibodies, aptamers, or other biorecognition elements. |
| Specific Antibodies/Aptamers | The biorecognition elements that confer molecular specificity to the biosensor for a given target analyte. |
The objective comparison of QCM and SAW biosensor technologies reveals a complementary landscape. QCM excels in liquid-phase biosensing, offering a well-established, cost-effective platform for real-time, label-free monitoring of binding interactions, as powerfully demonstrated in the sensitive detection of SARS-CoV-2 [22] [74]. In contrast, SAW sensors offer higher fundamental operating frequencies and greater versatility, finding strong applications in gas sensing, UV detection, and, with appropriate wave modes, liquid-phase biosensing [17] [50]. The advent of flexible SAW devices also opens avenues for wearable health monitoring.
The critical role of advanced materials like graphene, MOFs/COFs, and metal oxide nanostructures is unequivocal. They serve as a universal lever to enhance the performance of both platforms by drastically increasing the active surface area, introducing specific binding sites, and improving signal transduction [17] [75] [76]. The functionalization of sensor surfaces with these nanomaterials is a primary strategy for achieving the ultra-sensitive detection required in modern diagnostics and environmental monitoring.
Future development will focus on several key areas: advancing flexible and wearable sensor platforms for continuous health monitoring; integrating artificial intelligence and machine learning to handle complex sensor data and improve pattern recognition [77]; developing multi-analyte detection (multiplexing) capabilities on a single chip; and simplifying fabrication to create highly miniaturized, portable, and cost-effective point-of-care devices [72] [77]. As these trends converge, the synergy between sophisticated piezoelectric platforms and multifunctional nanomaterials will continue to push the boundaries of sensing technology, enabling unprecedented capabilities in healthcare, environmental safety, and beyond.
Sensor Regeneration, Reusability, and Long-Term Stability Considerations
Piezoelectric acoustic sensors, particularly Quartz Crystal Microbalances (QCM) and Surface Acoustic Wave (SAW) devices, are pivotal in chemical and biochemical sensing due to their high sensitivity, label-free detection mechanism, and real-time response capabilities [3]. A critical aspect often overlooked in fundamental research is their operational longevity, which encompasses the ability to regenerate the sensing surface, reuse the transducer multiple times, and maintain stable performance over extended periods. For researchers and drug development professionals, these factors directly impact the cost-effectiveness, reliability, and practicality of deploying these sensors for continuous monitoring or high-throughput screening [78] [79]. This guide objectively compares the regeneration protocols, reusability, and long-term stability of QCM and SAW biosensors by synthesizing and presenting experimental data from recent studies, providing a foundational resource for informed sensor selection.
QCM and SAW sensors, while both based on the piezoelectric effect, differ fundamentally in their wave propagation mechanics, which influences their design, sensitivity, and suitability for different applications. QCM is a Bulk Acoustic Wave (BAW) device where acoustic waves propagate through the thickness of the piezoelectric crystal, typically operating in a Thickness Shear Mode (TSM) [3] [16]. They are renowned for their robust performance in liquid environments. In contrast, SAW devices confine acoustic energy to the surface, with waves traveling parallel to the substrate. This design leads to higher energy concentration at the surface, which can translate to greater mass sensitivity [3] [16].
Table 1: Fundamental Comparison of QCM and SAW Sensor Technologies
| Technical Parameter | QCM | SAW |
|---|---|---|
| Acoustic Wave Type | Bulk Acoustic Wave (BAW) | Surface Acoustic Wave |
| Typical Frequency Range | 5–100 MHz [3] [16] | Hundreds of MHz to GHz [3] [17] |
| Mass Sensitivity | Lower (∼ng) [3] | Higher (∼pg) [3] [16] |
| Liquid Phase Operation | Excellent; low damping loss [3] | Challenging for Rayleigh mode; requires special designs (e.g., Love mode) [3] [80] |
| Primary Sensing Domains | Biosensing in liquids, gas/vapor sensing [3] | Gas sensing, biosensing (with specific designs) [3] [17] |
The following diagram illustrates the core operational principles and key considerations for regeneration and stability for both sensor types.
Experimental Protocols for Sensor Regeneration and Reusability
A critical step in sensor reuse is the effective regeneration of the sensing surface, which involves removing the bound analyte and/or the receptor layer without damaging the transducer. The following experimental workflow outlines a comparative approach to evaluating different regeneration methods, derived from established research practices [79].
Detailed Regeneration Methodologies
The following protocols are adapted from a systematic study comparing regeneration techniques for QCM biosensors [79].
Piranha Solution Cleaning
- Procedure: Immerse the sensor chip in a freshly prepared Piranha solution (a 7:3 v/v mixture of concentrated sulphuric acid (H₂SO₄) and 30% hydrogen peroxide (H₂O₂)) for a designated time (e.g., 10 minutes). Caution: This solution is highly exothermic, corrosive, and reactive. Use appropriate personal protective equipment and handle in a fume hood.
- Rationale: The solution is a powerful oxidizing agent that effectively removes organic residues, including self-assembled monolayers (SAMs) and peptides, from the gold electrode surface.
- Evaluation: After cleaning, rinse the sensor thoroughly with deionized water and methanol, then dry in a desiccator. The effectiveness is assessed by measuring the resonant frequency recovery and via Atomic Force Microscopy (AFM) to inspect surface morphology [79].
Oxygen Plasma Cleaning
- Procedure: Place the sensor in a plasma chamber. Expose it to oxygen plasma generated under standard conditions (e.g., RF power, specific exposure time).
- Rationale: Oxygen plasma generates reactive oxygen species that ash organic compounds and contaminants from the sensor surface, effectively cleaning it without the use of liquid chemicals.
- Evaluation: Similar to the Piranha method, frequency recovery and AFM imaging are used to assess cleaning efficiency and potential surface oxidation [79].
Electrochemical Cleaning
- Procedure: Using the gold electrode as a working electrode in a standard three-electrode electrochemical cell, perform cyclic voltammetry (CV) scans in a suitable electrolyte (e.g., 0.5 M H₂SO₄) over a potential range that facilitates the formation and reduction of gold oxide (e.g., -0.2 V to +1.5 V vs. a reference electrode).
- Rationale: The repeated oxidation and reduction of the gold surface disrupts and desorbs the thiol-gold bonds of the SAM, stripping the receptor layer.
- Evaluation: The voltammogram provides in-situ feedback on the cleaning process. Post-cleaning, the frequency is measured to confirm mass removal [79].
Comparative Experimental Data on Reusability and Stability
QCM Reusability and Regeneration Efficiency
A key study directly compared the three regeneration methods for peptide-based QCM biosensors, quantifying their efficiency over multiple cycles [79]. The results are summarized in the table below.
Table 2: Comparison of QCM Regeneration Method Performance [79]
| Regeneration Method | Key Principle | Advantages | Disadvantages & Performance Impact |
|---|---|---|---|
| Piranha Solution | Chemical oxidation | Highly effective at removing organic layers | Most invasive; caused a 25% decrease in sensor performance after 3 regeneration cycles due to surface erosion. |
| Oxygen Plasma | Reactive ion etching | "Greener" method; avoids hazardous liquids | Can cause surface oxidation; less performance degradation than Piranha. |
| Electrochemical | Electrochemical desorption | Controlled, in-situ process; minimal chemical waste | Requires specialized setup; showed good efficiency with less damage than Piranha. |
Beyond laboratory-scale regeneration, the operational reusability of a fully functional QCM biosensor in complex samples was demonstrated in a separate study [78]. A QCM biosensor with a stable antifouling nano-coating was subjected to 60 sequential injections of hamburger sample homogenate without the target pathogen (E. coli O157:H7). The sensor maintained its function with only a minor shift in the detection limit toward the end of the test series, proving exceptional reusability for on-site analysis of "real-world" samples [78].
SAW Sensor Long-Term Stability
While direct, side-by-side comparisons of SAW and QCM long-term stability are limited in the literature, evidence supports the excellent stability of properly coated SAW sensors. A three-year study investigated the long-term stability of an array of eight Surface Transverse Wave (STW) resonators—a type of SAW sensor—coated with different polymers for gas sensing [81].
- Methodology: The sensor array was used at semi-annual intervals over three years to detect solvent vapors (chloroform, octane, xylene). The absolute frequency shifts and normalized signal patterns were analyzed [81].
- Findings: The study concluded that no significant time-related changes in sensor signals or characteristic vapor response patterns were observed. The polymer coatings retained their physicochemical properties and sensing performance over the entire period, establishing that polymer-coated SAW sensors are robust devices capable of stable qualitative and quantitative vapor detection for several years [81].
The Scientist's Toolkit: Essential Research Reagents and Materials
The experimental work cited in this guide relies on a set of core materials and reagents. The following table details these key items and their functions in the context of sensor development and regeneration studies.
Table 3: Key Research Reagents and Materials for Sensor Development & Regeneration
| Reagent/Material | Function in Research Context | Example Application |
|---|---|---|
| AT-cut Quartz Crystals | The piezoelectric substrate for QCM transducers; chosen for its temperature stability [3]. | Base transducer for QCM biosensors [79]. |
| Gold Electrodes | The functional surface for immobilizing thiolated receptors via gold-thiol chemistry. | Standard electrode material on QCM crystals [79]. |
| Synthetic Peptides | Serve as robust biorecognition elements that can be designed to bind specific targets (e.g., volatiles, proteins). | Used as the receptor layer in QCM regeneration studies [79]. |
| Antifouling Terpolymer Brushes | Nano-coatings that resist non-specific adsorption from complex samples, enabling analysis in real-world matrices. | Critical for reusable QCM biosensors in food analysis [78]. |
| Functional Polymers (e.g., PIB, PDMS) | Selective coatings for gas/VOC sensing; interaction with analytes causes mass/viscoelastic changes. | Used as the sensing layer on SAW/STW sensor arrays for long-term stability tests [81]. |
| Piranha Solution (H₂SO₄/H₂O₂) | A powerful, highly oxidative chemical mixture for stripping organic layers from sensor surfaces. | A benchmark (though invasive) method for regenerating QCM electrodes [79]. |
The experimental data presented in this guide reveals distinct profiles for QCM and SAW sensors regarding their regeneration, reusability, and long-term stability.
QCM biosensors demonstrate high practical reusability, particularly in liquid-phase biosensing. Studies show they can withstand numerous measurement cycles when protected by advanced antifouling coatings [78]. Furthermore, multiple regeneration protocols exist for the gold electrode surface, with electrochemical and plasma methods offering less invasive alternatives to harsh chemical cleaning, thereby extending the sensor's operational life [79].
SAW sensors excel in long-term stability for gas-sensing applications. Robust polymer coatings maintain their performance over several years without significant degradation, making SAW arrays reliable for extended environmental monitoring and "electronic nose" systems [81].
The choice between QCM and SAW for long-term or reusable sensing applications must be context-dependent. For liquid-phase biosensing requiring multiple uses, QCM's robustness and developed regeneration protocols are advantageous. For long-term gas/vapor monitoring, SAW sensors with stable polymer coatings are a superior choice. Future developments will likely focus on standardizing regeneration protocols and engineering even more durable, surface-specific coatings to further enhance the lifespan and economic value of both sensor platforms.
Integration with Microfluidics and Wireless Technology for Next-Generation Devices
Quartz Crystal Microbalance (QCM) and Surface Acoustic Wave (SAW) devices represent two pivotal transducer platforms in the realm of piezoelectric biosensing. Both technologies operate on the principle of converting mechanical stress into electrical signals and vice versa, but they differ fundamentally in their wave propagation mechanics and operational characteristics. QCM devices are bulk acoustic wave (BAW) resonators where acoustic energy propagates through the thickness of the piezoelectric crystal, typically operating in a thickness shear mode (TSM) that makes them particularly suitable for liquid-phase sensing [3]. In contrast, SAW devices confine acoustic energy to the surface of the piezoelectric substrate, with wave propagation parallel to the surface, enabling exceptional mass sensitivity but presenting challenges for direct liquid immersion [3].
The integration of these biosensing platforms with microfluidics and wireless technology has emerged as a critical frontier in developing next-generation diagnostic systems. Microfluidic integration enables automated sample processing, precise fluid control, and reduced reagent consumption, while wireless connectivity facilitates remote monitoring, real-time data transmission, and deployment in resource-limited settings [82] [15]. This technological convergence is particularly relevant for applications in point-of-care diagnostics, environmental monitoring, and pharmaceutical development, where rapid, sensitive, and portable detection systems are increasingly demanded [74] [83].
Fundamental Operating Principles and Theoretical Frameworks
QCM Theoretical Foundation
The operational principle of QCM biosensors centers on an oscillating crystal that resonates at a specific natural frequency when an electrical signal is applied [84]. The core relationship governing QCM response is the Sauerbrey equation, which establishes a linear proportionality between mass changes on the sensor surface and the resulting resonance frequency shift [74] [85]. The equation is expressed as:
Δf = -2f₀²Δm / [A(ρqμq)¹ᐟ²]
where Δf represents the frequency change, f₀ is the fundamental resonance frequency, Δm is the mass change, A is the active sensor area, ρq is the density of quartz (2.648 g/cm³), and μq is the shear modulus of quartz (2.947 × 10¹¹ g/cm·s²) [74]. This relationship forms the quantitative foundation for gravimetric sensing in QCM systems, allowing precise measurement of bound mass at the nanogram level.
When operated in liquid environments, QCM systems experience additional damping effects described by the Kanazawa equation, which accounts for the frequency shift due to liquid viscosity and density:
Δf = -f₀³/²(ηₗρₗ/πρqμq)¹ᐟ²
where ηₗ represents the liquid viscosity and ρₗ is the liquid density [74]. This theoretical framework enables QCM operation in biologically relevant media, though it necessitates careful calibration for viscous samples.
SAW Biosensor Fundamentals
SAW biosensors operate through the generation and detection of acoustic waves traveling parallel to the surface of a piezoelectric substrate [3]. These waves are typically generated and detected by interdigital transducers (IDTs) patterned photolithographically on the substrate surface [3]. The wave propagation characteristics, including velocity and amplitude, are highly sensitive to surface perturbations, making SAW devices exceptionally responsive to mass loading, viscosity changes, and surface conductivity.
The mass sensitivity of SAW devices significantly exceeds that of QCM systems, with frequency shifts proportional to both the mass loaded on the sensing region and the square of the operating frequency [3]. This enhanced sensitivity stems from the energy confinement at the device surface, where the penetration depth is limited to approximately one acoustic wavelength. However, conventional Rayleigh wave-based SAW devices experience substantial energy radiation into liquid media, necessitating the development of specialized wave modes such as Shear Horizontal Surface Acoustic Waves (SH-SAW) or Love waves for liquid-phase operation [17] [3].
Figure 1: Fundamental signaling pathway of SAW biosensors showing the conversion of electrical signals to acoustic waves and their sensitivity to various surface perturbations.
Comparative Performance Analysis: QCM vs. SAW Biosensors
Table 1: Fundamental characteristics comparison between QCM and SAW biosensors
| Parameter | QCM Biosensors | SAW Biosensors |
|---|---|---|
| Wave Type | Bulk Acoustic Wave (BAW) | Surface Acoustic Wave |
| Propagation Mode | Thickness Shear Mode (TSM) | Rayleigh/Love Wave |
| Frequency Range | 5-100 MHz [3] | 50-500 MHz [3] |
| Mass Sensitivity | ~ng-μg [85] | ~pg-ng [3] |
| Liquid Operation | Excellent [3] | Limited (requires special wave modes) [3] |
| Detection Method | Frequency shift [84] | Velocity/amplitude shift [17] |
| Manufacturing Cost | Low to moderate [3] | Moderate to high [83] |
| Integration Complexity | Low [82] | Moderate to high [15] |
Table 2: Performance comparison in integrated systems with microfluidics and wireless technology
| Performance Metric | QCM with Microfluidics | SAW with Microfluidics |
|---|---|---|
| Detection Limit | 10² CFU/mL (E. coli) [82] | Comparable or better (theoretical) [15] |
| Response Time | Minutes [82] | Seconds to minutes [17] |
| Multiplexing Capability | Moderate [85] | High [15] |
| Sample Volume | μL-mL [82] | nL-μL [15] |
| Wireless Integration | Demonstrated [82] | Emerging [17] [15] |
| Power Consumption | Low to moderate [82] | Low [83] |
The comparative analysis reveals a complementary relationship between QCM and SAW technologies. QCM systems offer robust performance in liquid environments, simpler fabrication processes, and lower associated costs, making them particularly suitable for laboratory-based analysis and portable diagnostic systems where complex fluid handling is required [3] [85]. The demonstrated integration of QCM with PDMS microfluidics and Bluetooth connectivity in a palm-sized device for E. coli detection highlights its practical implementation potential [82].
Conversely, SAW biosensors provide superior mass sensitivity and faster response times, advantages that become particularly pronounced in gas-phase sensing and applications requiring minimal sample volumes [17] [3]. Recent advancements in Love wave devices and specialized polymer coatings have progressively addressed the historical limitations of SAW sensors in liquid environments [17]. The ongoing development of wireless SAW biosensors leveraging technologies like near-field communication (NFC) demonstrates the potential for autonomous monitoring applications [15] [86].
Microfluidic Integration Methodologies
QCM Microfluidic Integration
The integration of QCM sensors with microfluidics typically employs polydimethylsiloxane (PDMS)-based fluidic channels bonded to the sensor surface [82]. This configuration enables precise sample delivery to the active sensing region while minimizing dead volumes and optimizing mass transport to the functionalized surface. A representative implementation demonstrated a palm-sized wireless piezoelectric immunosensing system incorporating a gold-coated QCM sensor functionalized with protein A-immobilized antibodies and a PDMS microfluidic channel for efficient sample handling [82]. This integrated system achieved detection of E. coli O157:H7 with a limit of 10² CFU/mL, highlighting the practical efficacy of QCM-microfluidics integration.
The microfluidic design for QCM integration often incorporates enhanced mass transport mechanisms to overcome diffusion limitations, particularly for larger analytes such as bacterial cells or viral particles. Strategies include herringbone patterns to induce chaotic mixing, pulsed flow protocols to promote surface contact, and nanobead-assisted pre-concentration to improve detection sensitivity for low-abundance targets [82]. The compatibility of QCM with continuous flow operation makes it particularly suitable for monitoring dynamic biochemical processes, such as antibody-antigen binding kinetics or receptor-ligand interactions, in real time.
SAW Microfluidic Integration
SAW biosensor integration with microfluidics presents distinct engineering challenges due to the interference of liquids with acoustic wave propagation [3]. Conventional Rayleigh wave-based SAW devices experience substantial energy dissipation in liquid environments, necessitating the implementation of specialized approaches. The primary strategies include the use of Love wave devices, which employ a waveguide layer to confine acoustic energy at the surface while minimizing radiation into the liquid, and the implementation of segmented flow systems that separate aqueous samples with air bubbles to reduce continuous liquid contact [17].
Advanced SAW-microfluidic platforms often incorporate microfluidic packaging that isolates the IDTs from liquid contact while allowing the sensing region to interact with the sample fluid [15]. This configuration preserves the integrity of the electrical components while enabling liquid-phase sensing. Recent innovations have demonstrated the integration of SAW sensors with microfluidic channels featuring surface-functionalized detection zones tailored for specific biomarker capture, enabling highly sensitive multiplexed detection in sub-microliter sample volumes [15]. The significantly smaller sample requirements of SAW-based systems compared to QCM platforms represent a distinct advantage in applications with limited sample availability.
Figure 2: Experimental workflow for microfluidics-integrated piezoelectric biosensing showing the pathway from sample introduction to data transmission.
Wireless Connectivity Implementation
Wireless QCM Systems
The implementation of wireless functionality in QCM biosensors has been demonstrated through several approaches, including Bluetooth connectivity for short-range data transmission and loop antenna systems for broader signal dissemination [82]. A representative wireless QCM immunosensing system featured a flexible loop antenna for wireless signal transmission and real-time data delivery to a smartphone application via Bluetooth [82]. This integration maintained detection sensitivity while significantly enhancing portability and user accessibility, making the technology suitable for field deployment and point-of-care testing scenarios.
Advanced wireless QCM platforms increasingly incorporate energy harvesting technologies to enable self-powered operation, further enhancing their deployment flexibility. These systems may leverage piezoelectric nanogenerators that convert mechanical energy from ambient vibrations or body movements into electrical power, or biofuel cells that generate electricity from biological fluids [86]. Such energy autonomy is particularly valuable for wearable monitoring devices and implantable sensors where battery replacement is impractical.
Wireless SAW Systems
Wireless SAW biosensors typically employ passive operation principles where the sensor itself requires no internal power source, instead being interrogated remotely by a radio frequency (RF) reader unit [17] [15]. This implementation is particularly advantageous for applications in hazardous environments, implanted medical devices, or sealed monitoring systems where battery replacement is impossible. The wireless interrogation capability stems from the piezoelectric nature of the substrate itself, which converts incoming RF signals to acoustic waves and back to RF signals modulated by the sensing interaction.
Recent advancements in wireless SAW technology have focused on frequency coding techniques to enable multiplexed detection with a single interrogation unit, and the development of conformable SAW sensors that can be applied to curved surfaces for wearable health monitoring [15]. The integration of SAW sensors with near-field communication (NFC) protocols, commonly available in smartphones, represents a particularly promising direction for consumer-facing diagnostic applications [86]. Market analysis projects significant growth in wireless SAW biosensor applications, with the market expected to reach $1,500 million by 2025, expanding at a compound annual growth rate of 12% through 2033 [15].
Experimental Protocols and Performance Validation
Representative QCM Experimental Protocol
A validated experimental approach for wireless QCM biosensing of pathogenic bacteria exemplifies the integrated methodology [82]:
Sensor Functionalization: Gold-coated QCM crystals are modified with protein A to enable oriented immobilization of anti-E. coli O157:H7 antibodies, ensuring optimal antigen-binding capacity.
Microfluidic Integration: The functionalized QCM is incorporated into a PDMS microfluidic chamber with precisely defined channel architecture (typically 100-500 μm width, 50-200 μm height) to ensure uniform laminar flow across the sensing surface.
Sample Processing: Bacterial samples are introduced via the microfluidic network, with analysis times under 30 minutes. For low-concentration detection, antibody-functionalized nanobeads are introduced as signal amplifiers, enhancing sensitivity through increased mass loading.
Signal Acquisition: Frequency shifts are monitored in real-time using an oscillator circuit connected to a frequency counter. The mass change is calculated using the Sauerbrey equation, with appropriate corrections for liquid loading based on the Kanazawa relationship.
Wireless Data Transmission: Acquired data is processed by a microcontroller and transmitted via a Bluetooth module to a smartphone application for visualization and analysis.
This protocol achieved detection of E. coli O157:H7 with a limit of 10² CFU/mL, with minimal cross-reactivity against other bacterial species, demonstrating both high sensitivity and specificity [82].
Representative SAW Experimental Protocol
A standardized methodology for SAW biosensor implementation with microfluidics includes the following key steps:
Sensor Preparation: A ST-cut quartz substrate with patterned IDTs is coated with a waveguide layer (e.g., SiO₂) for Love wave devices to minimize acoustic energy radiation into the liquid phase.
Surface Functionalization: The sensing region between IDTs is modified with appropriate capture elements (antibodies, aptamers, or molecularly imprinted polymers) specific to the target analyte using silane chemistry or physical adsorption.
Microfluidic Coupling: A microfluidic manifold is aligned and bonded to the SAW device, ensuring precise channel alignment with the sensing pathway while protecting the IDTs from liquid contact.
Flow Control Implementation: Sample introduction employs either continuous flow for kinetic studies or segmented flow with air bubbles separating sample plugs to reduce acoustic damping.
Remote Interrogation: A wireless reader unit transmits an RF signal to the SAW sensor, which returns a frequency- or phase-modulated response correlated with analyte binding.
Signal Processing: Advanced algorithms differentiate specific binding signals from non-specific adsorption and environmental fluctuations, enhancing detection reliability.
The Scientist's Toolkit: Essential Research Reagents and Materials
Table 3: Essential research reagents and materials for developing integrated piezoelectric biosensors
| Material/Reagent | Function | Application in QCM | Application in SAW |
|---|---|---|---|
| AT-cut Quartz Crystals | Piezoelectric substrate | Standard material [3] | Less common (ST-cut preferred) [3] |
| Gold Electrodes | Electrical contact and biofunctionalization | Standard electrode material [82] [84] | IDT fabrication [3] |
| PDMS | Microfluidic channel fabrication | Excellent compatibility [82] | Limited due to damping effects |
| Protein A/G | Antibody orientation | Improved antigen binding [82] | Similar benefits |
| Specific Antibodies | Biorecognition elements | Pathogen detection [82] [85] | Biomarker detection [15] |
| Functionalized Nanoparticles | Signal amplification | Magnetic/gold nanoparticles [85] | Less commonly used |
| Silane Coupling Agents | Surface modification | APTES, MPTMS for functionalization [85] | Similar surface chemistry |
| Waveguide Polymers | Acoustic energy confinement | Not required | Essential for liquid operation (PMMA, SU-8) [17] |
The integration of microfluidics and wireless technology with both QCM and SAW biosensing platforms has substantially advanced the capabilities of next-generation detection systems. Each technology offers distinct advantages: QCM provides robust liquid-phase operation and simpler implementation, while SAW offers superior sensitivity and broader multiplexing capabilities. The selection between these platforms depends fundamentally on the specific application requirements, with QCM being particularly suitable for complex biological samples and SAW excelling in applications demanding ultimate sensitivity and minimal sample volumes.
Future development trajectories will likely focus on several key areas. Multiplexed detection capabilities are being enhanced through array-based configurations and advanced frequency-coding strategies [15]. Energy harvesting technologies are progressing toward complete self-powering using biomechanical or biochemical energy sources [86]. Advanced materials including graphene, metal-organic frameworks (MOFs), and piezoelectric biomaterials are being explored to enhance sensitivity and specificity [17] [84]. Artificial intelligence integration is enabling more sophisticated data analysis, improving discrimination between specific and non-specific binding events [87]. Additionally, miniaturization efforts are producing increasingly compact systems, with SAW sensors particularly amenable to chip-scale implementation [15] [83].
The convergence of microfluidics, wireless technology, and piezoelectric biosensing represents a powerful paradigm shift in detection methodologies, offering the potential for highly sensitive, portable, and user-friendly diagnostic platforms that can be deployed across diverse settings from clinical laboratories to point-of-care environments and remote monitoring applications. As these technologies continue to mature, they are poised to significantly impact healthcare delivery, environmental monitoring, and pharmaceutical development through enhanced accessibility and performance of biosensing systems.
Head-to-Head Comparison: Validating QCM and SAW Performance Against Established Methods
Piezoelectric biosensors have emerged as powerful tools for label-free, real-time detection of biological analytes. Among them, Quartz Crystal Microbalance (QCM) and Surface Acoustic Wave (SAW) sensors represent two prominent technologies with distinct operational principles and performance characteristics. This guide provides a direct performance comparison between QCM and SAW biosensors, focusing on the critical parameters of sensitivity, selectivity, and limit of detection (LOD) that researchers must consider when selecting an appropriate platform. The fundamental distinction lies in their wave propagation mechanisms: QCM operates as a bulk acoustic wave (BAW) device where energy travels through the piezoelectric substrate, while SAW devices confine energy to the surface, making them exceptionally responsive to surface perturbations [3]. Understanding these core differences is essential for selecting the optimal technology for specific biosensing applications, particularly in clinical diagnostics and drug development where reliability and sensitivity are paramount.
Working Principles and Theoretical Foundations
QCM Operational Theory
The QCM operates as a thickness shear mode (TSM) resonator. When an alternating voltage is applied across its electrodes, it induces a shear deformation in the quartz crystal that is highly sensitive to surface mass changes [3]. The foundational relationship governing QCM response is the Sauerbrey equation, which establishes a linear proportionality between mass change at the sensor surface and the observed resonance frequency shift [3] [2] [1]:
Δf = -2.26 × 10⁻⁶ × f₀² × (Δm/A)
Where Δf is the frequency change (Hz), f₀ is the fundamental resonant frequency (MHz), Δm is the mass change (g), and A is the active area (cm²) [1]. For operation in liquid environments, the frequency response incorporates viscosity and density contributions, extending the Sauerbrey equation to account for liquid damping effects [2] [1]. QCM typically operates in the 5-20 MHz frequency range, though high-frequency variants up to 195 MHz exist for enhanced sensitivity [3] [1].
SAW Operational Theory
SAW sensors utilize acoustic waves that propagate along the surface of a piezoelectric substrate. These waves are typically Rayleigh waves with both longitudinal and shear vertical components that strongly couple with interfacial materials [3]. The mass sensitivity of SAW devices is governed by a similar but distinct relationship [88]:
Δf = (k₁ + k₂) × f₀² × (Δm/A)
Where k₁ and k₂ are piezoelectric substrate constants. SAW sensors operate at significantly higher frequencies than standard QCM devices, typically in the 100-500 MHz range, with some devices reaching GHz-level operation [3] [88]. This higher operating frequency fundamentally provides SAW sensors with greater mass sensitivity, though it comes with specific limitations in liquid environments.
Comparative Performance Analysis
Sensitivity and Limit of Detection
The following table summarizes key performance metrics for QCM and SAW biosensors based on experimental data from recent studies:
Table 1: Direct Performance Comparison of QCM and SAW Biosensors
| Parameter | QCM Biosensors | SAW Biosensors | Experimental Context |
|---|---|---|---|
| Typical Operating Frequency | 5-20 MHz (fundamental)Up to 195 MHz (HFF-QCM) [3] | 100-500 MHzUp to GHz range [3] [88] | Sensor design and operation [3] [88] |
| Limit of Detection (LOD) | 0.07 pg/mL (SARS-CoV-2 S-RBD) [89]53.3 TCID₅₀/mL (SARS-CoV-2) [22] | Demonstrated for gas sensing [88]Ultra-low concentrations in gas phase [17] | Virus detection [22] [89]Chemical detection [88] [17] |
| Detection Range | 1 pg/mL - 0.1 μg/mL (SARS-CoV-2 S-RBD) [89] | Wide dynamic range in gas sensing [88] [17] | Linear response characterization [88] [89] |
| Liquid Phase Performance | Excellent stability in liquidsMinimal damping loss [3] [2] | Excessive damping in liquidsPrimarily for gas sensing [3] | Operation in different media [3] [2] |
| Response Time | ~15 minutes for SARS-CoV-2 detection [22] | Rapid response in gas sensingSeconds to minutes [88] [17] | Complete assay time [22] [88] |
Selectivity and Specificity
Both QCM and SAW biosensors achieve high selectivity through surface functionalization with biological recognition elements. The most common approaches include:
- Antibodies and Antigens: Provide high selectivity and affinity for protein targets, enabling reproducible results in clinical diagnostics [2] [1].
- DNA Aptamers: Short, single-stranded DNA or RNA molecules with configurable binding properties, superior stability, and ease of synthesis compared to antibodies [89].
- Functionalized Polymers: Synthetic affinity materials like polyphosphonamide-based polymers (PPD-F2) for chemical sensing [88].
- Nanomaterial Coatings: ZnO, graphene oxide, metal-organic frameworks (MOFs) to enhance sensitivity and selectivity [17].
QCM biosensors have demonstrated exceptional specificity in complex biological matrices. For SARS-CoV-2 detection, QCM aptasensors showed negligible non-specific interactions with competing proteins and maintained functionality in human plasma and saliva [89]. SAW sensors exhibit high specificity in gas sensing applications, with polyphosphonamide-based polymer coatings showing selective response to 2-chloroethyl ethyl sulfide (2-CEES), a simulant for mustard gas, while minimizing interference from other compounds [88].
Experimental Protocols and Methodologies
QCM Biosensor Fabrication and Measurement
Sensor Functionalization Protocol
- Surface Cleaning: Immerse AT-cut quartz crystals with gold electrodes in basic Piranha solution (ammonium:water:hydrogen peroxide, 1:5:1 v/v) at elevated temperature [89].
- Aptamer Immobilization:
- Prepare thiol-modified DNA aptamer solution (1 μM in binding buffer)
- Reduce disulfide bonds using Tris(2-carboxyethyl)phosphine hydrochloride (TCEP)
- Heat aptamer to 95°C for 3 minutes, then cool on ice for 10 minutes
- Incubate cleaned gold surface with aptamer solution for 16-24 hours [89]
- Surface Passivation: Treat with 1-dodecanethiol or 6-mercapto-1-hexanol (MCH) to minimize non-specific binding [89].
- Validation: Characterize modified surface using SEM, Digital Holographic Microscopy, or Raman Spectroscopy [22].
Measurement Configuration
- Utilize flow cell system with constant flow rate (50 μL/min)
- Monitor frequency changes with 0.1 Hz accuracy
- Maintain temperature stability (±0.1°C)
- Use phosphate-buffered saline (PBS) with 0.55 mM MgCl₂ as running buffer [89]
SAW Biosensor Fabrication and Measurement
Sensor Design and Fabrication
- Substrate Selection: Use ST-cut quartz with +42° tilt angle for temperature stability [88].
- IDT Fabrication: Pattern interdigital transducers (IDTs) with specific wavelength (e.g., 12.632 μm for 250 MHz sensor) [88].
- Delay Line Configuration: Set optimal delay line length (e.g., 1 mm) with minimal loss for receptor coating [88].
- Polymer Coating: Deposit sensing material (e.g., PPD-F2) on delay line using spin-coating or drop-casting [88].
Gas Sensing Measurement
- Environmental Control: Conduct measurements across temperature range (-20°C to 50°C) with controlled relative humidity (30-70% RH) [88].
- Gas Delivery: Use precision gas dilution system to control analyte concentration [88].
- Frequency Monitoring: Measure resonance frequency shifts using network analyzer with high frequency stability [88].
- Data Analysis: Correlate frequency shifts with analyte concentration using mass-loading equation [88].
Table 2: Essential Research Reagent Solutions for Piezoelectric Biosensing
| Reagent/Category | Specific Examples | Function in Biosensor Development |
|---|---|---|
| Piezoelectric Substrates | AT-cut quartz crystals [89], ST-cut quartz [88] | Provides stable piezoelectric foundation for sensor operation |
| Recognition Elements | Thiol-modified DNA aptamers [89], antibodies [2], polyphosphonamide polymers [88] | Provides selective binding to target analytes |
| Surface Chemistry Reagents | 1-dodecanethiol, 6-mercapto-1-hexanol (MCH) [89], Tris(2-carboxyethyl)phosphine (TCEP) [89] | Enables controlled surface functionalization and passivation |
| Buffer Systems | Phosphate-buffered saline (PBS) with MgCl₂ [89], TE buffer [89] | Maintains optimal physiological conditions for biomolecular interactions |
| Characterization Tools | Network analyzers [88], SEM, Digital Holographic Microscopy [22] | Validates sensor surface quality and functionalization success |
Application-Specific Performance Considerations
Biosensing in Liquid Environments
QCM demonstrates superior performance for biological sensing in liquid phases due to its shear wave propagation that minimizes energy radiation into the liquid [3] [2]. The technology has been successfully implemented for:
- Infectious disease diagnosis: Detection of SARS-CoV-2 nucleocapsid protein and spike RBD in clinical samples [22] [89].
- Clinical biomarker monitoring: Quantification of disease biomarkers in complex samples like plasma and saliva [2] [89].
- Real-time binding kinetics: Monitoring antibody-antigen interactions and cellular responses [1].
Gas and Vapor Phase Sensing
SAW sensors excel in gas detection applications where their high surface sensitivity and operating frequency provide exceptional performance:
- Chemical warfare agent detection: Identification of 2-CEES (mustard gas simulant) with high sensitivity [88].
- Environmental monitoring: Detection of volatile organic compounds and toxic gases at ultra-low concentrations [17].
- Explosives detection: Identification of nitroaromatic compounds and other explosive materials [17].
The direct performance comparison between QCM and SAW biosensors reveals complementary strengths that make each technology suitable for distinct application domains. QCM biosensors demonstrate clear advantages for liquid-phase biological sensing, with proven capabilities in clinical diagnostics, excellent stability in complex matrices, and detection limits reaching sub-picogram per milliliter levels. Their robustness in liquid environments and established surface functionalization protocols make them ideal for biomedical research and clinical applications. Conversely, SAW biosensors offer superior sensitivity in gas-phase sensing applications, operating at higher fundamental frequencies that enable detection of ultra-low analyte concentrations. Their limitations in liquid environments currently restrict their biomedical utility but make them exceptional tools for environmental monitoring, chemical threat detection, and vapor phase analytics. The selection between these technologies should be guided by the specific application requirements, with QCM representing the optimal choice for biological liquid samples and SAW sensors providing unparalleled performance for gas and vapor detection. Future developments in high-frequency QCM devices and liquid-compatible SAW designs may further blur these boundaries, enhancing the applicability of both platforms across broader sensing domains.
In the fields of biosensing and bioanalysis, the performance of any new sensing technology is ultimately measured against established laboratory gold standards. For researchers focusing on the development of piezoelectric biosensors, such as Quartz Crystal Microbalance (QCM) and Surface Acoustic Wave (SAW) devices, this benchmarking is a critical step in validation. These acoustic transducers operate on gravimetric (mass-sensitive) principles, where the binding of a target analyte to the sensor surface causes a change in the resonant frequency of the device [3]. Their label-free nature, real-time monitoring capability, and potential for miniaturization make them attractive for diverse applications, from clinical diagnostics to environmental monitoring [17] [3].
This guide provides an objective comparison of three foundational analytical techniques—Enzyme-Linked Immunosorbent Assay (ELISA), Liquid Chromatography-Tandem Mass Spectrometry (LC-MS/MS), and Surface Plasmon Resonance (SPR)—against which QCM and SAW sensor performance is often evaluated. Understanding the capabilities, limitations, and experimental protocols of these benchmark methods is essential for designing rigorous validation studies and correctly interpreting the resulting data.
Each benchmark method operates on a distinct physical principle, which directly influences its application scope, data output, and operational requirements.
Enzyme-Linked Immunosorbent Assay (ELISA) is a plate-based assay technique designed for detecting and quantifying soluble substances such as peptides, proteins, antibodies, and hormones. It relies on the specific binding of an antibody to its antigen and employs an enzyme-linked conjugate to generate a measurable, typically colorimetric, signal. The readout is an endpoint measurement, providing information on the presence and quantity of the analyte but not on the kinetics of the interaction [90] [91].
Liquid Chromatography-Tandem Mass Spectrometry (LC-MS/MS) is a hyphenated analytical technique that combines the physical separation capabilities of liquid chromatography with the mass analysis capabilities of tandem mass spectrometry. It first separates components in a sample mixture and then identifies and quantifies individual molecules based on their mass-to-charge ratio. This method is highly specific and can detect multiple analytes simultaneously in a single run [92].
Surface Plasmon Resonance (SPR) is an optical technique used to study biomolecular interactions in real-time without the need for labels. It detects changes in the refractive index on a sensor chip surface when molecules bind to or dissociate from their immobilized partners. SPR provides rich kinetic data, including association and dissociation rates, from which the affinity constant is derived [93] [90].
Table 1: Core Characteristics of Gold Standard Techniques
| Feature | ELISA | LC-MS/MS | SPR |
|---|---|---|---|
| Principle | Antibody-antigen binding with enzymatic signal amplification [90] | Chromatographic separation followed by mass-based detection [92] | Label-free detection of refractive index changes [93] |
| Primary Data | Total analyte concentration (end-point) [91] | Analytic identity and absolute quantification [92] | Binding kinetics and affinity (real-time) [90] |
| Throughput | High (plate-based) | Moderate | Moderate to High (multi-channel systems) |
| Label Required | Yes (enzyme-linked) [90] | No (intrinsic property) | No [93] [90] |
| Key Advantage | Cost-effective, high throughput, well-established | High specificity, multiplexing, detects modifications [92] | Real-time kinetic profiling [90] |
Table 2: Performance Metrics in Practical Applications
| Application / Metric | Technique | Reported Performance | Experimental Context |
|---|---|---|---|
| Protein Detection (ALCAM) | SPR | Detection limit < ng/mL, similar to sandwich ELISA [93] | Analysis in buffer and human serum [93] |
| Protein Detection (ALCAM) | Sandwich ELISA | Detection limit < ng/mL [93] | Analysis in buffer and human serum [93] |
| Anti-Drug Antibody (ADA) Detection | SPR | Positivity rate 4%, 7-490x higher levels than ELISA [91] | Patient serum analysis [91] |
| Anti-Drug Antibody (ADA) Detection | ELISA | Positivity rate 0.3% [91] | Patient serum analysis [91] |
| Mycotoxin (DON) Detection | SPR | High matrix interference in wheat/dust [94] | Screening in complex food matrices [94] |
| Mycotoxin (DON) Detection | BLI / ELISA | Suitable for validated screening [94] | Screening in complex food matrices [94] |
| Biomolecular Analysis | LC-MS/MS | Superior precision, specificity, and sensitivity for trace levels [92] | Drug concentration analysis, biomarker discovery [92] |
Detailed Experimental Protocols
To ensure meaningful benchmarking, the experimental protocols for each method must be rigorously applied. The following are generalized workflows for each technique, as cited in the literature.
ELISA Protocol for Protein Detection (e.g., ALCAM)
The following protocol is adapted from a comparative study of SPR and ELISA for measuring CD166/ALCAM levels in human serum [93].
- Coating: Dilute the capture monoclonal antibody in a coating buffer (e.g., phosphate-buffered saline, PBS). Add the solution to the wells of a microplate and incubate overnight at room temperature to allow passive adsorption to the plastic surface.
- Blocking: Aspirate the coating solution and wash the wells multiple times with a wash buffer (e.g., PBS containing 0.05% Tween 20, PBST). Add a blocking buffer (e.g., PBS with 1% Bovine Serum Albumin or BSA) to all wells and incubate for at least 1 hour to cover any remaining protein-binding sites.
- Sample Incubation: Prepare serial dilutions of the standard (e.g., recombinant ALCAM) and dilute unknown samples (e.g., human serum) in an appropriate buffer. Add these solutions to the washed plate and incubate for a defined period (e.g., 2 hours) to allow the antigen to bind to the capture antibody.
- Detection Antibody Binding: Wash the plate to remove unbound sample. Add the biotinylated detection polyclonal antibody and incubate (e.g., for 2 hours).
- Enzyme Conjugate Binding: Wash the plate and add streptavidin conjugated to Horseradish Peroxidase (HRP). Incubate (e.g., for 20 minutes in the dark).
- Signal Development and Readout: Perform a final wash and add the enzyme substrate (e.g., a solution containing H₂O₂ and tetramethylbenzidine, TMB). Incubate until color develops and then stop the reaction with an acid (e.g., 2 N H₂SO₄). Measure the absorbance of the solution with a microplate reader.
SPR Protocol for Binding Kinetics
This protocol summarizes the SPR methodology used in comparative studies with ELISA [93] [90].
- Surface Preparation: Immobilize the ligand (e.g., an antibody or antigen) onto the sensor chip. This can be achieved through various chemistries. The comparative study with ELISA used physical adsorption onto an amine-terminated alkanethiolate surface to mimic the ELISA plate surface [93].
- Running Buffer Establishment: Continuously flow a suitable running buffer (e.g., HBS-EP: 10 mM HEPES, 150 mM NaCl, 3 mM EDTA, 0.005% surfactant P20, pH 7.4) over the sensor surface to establish a stable baseline.
- Association Phase: Inject a series of concentrations of the analyte over the sensor surface for a fixed period. Binding is monitored in real-time as an increase in the response signal (Resonance Units, RU).
- Dissociation Phase: Replace the analyte solution with running buffer. The decrease in the signal is monitored as bound complexes dissociate.
- Surface Regeneration: Inject a regeneration solution (e.g., a low pH buffer or detergent) to remove all bound analyte from the immobilized ligand, returning the signal to baseline and preparing the surface for the next sample.
- Data Analysis: The resulting sensorgrams (response vs. time) for different analyte concentrations are fitted to a binding model (e.g., 1:1 Langmuir) to calculate the kinetic rate constants (association rate, kₐ, and dissociation rate, kd) and the equilibrium dissociation constant (KD = k_d/kₐ).
LC-MS/MS Protocol for Targeted Quantification
This protocol outlines the general workflow for bioanalysis using LC-MS/MS [92].
- Sample Preparation: Precipitate proteins from the biological matrix (e.g., plasma, serum) using an organic solvent like acetonitrile or methanol. This step removes proteins and many potential interferents. The sample may also be spiked with an internal standard (a stable isotope-labeled analog of the analyte) to correct for variability.
- Liquid Chromatography (LC): Inject the processed sample onto a chromatographic column. Using high-pressure pumps, a mobile phase is passed through the column, separating the analyte from other components in the sample based on chemical properties like hydrophobicity.
- Ionization: The eluent from the LC column is directed into an ionization source (e.g., Electrospray Ionization, ESI), where the analyte molecules are converted into gas-phase ions.
- Mass Spectrometry (MS1): The ions are introduced into the first mass analyzer, which filters them based on their mass-to-charge ratio (m/z), selecting the precursor ion of the target analyte.
- Fragmentation (MS2): The selected precursor ions are fragmented in a collision cell (using an inert gas like argon) to produce product ions.
- Tandem Mass Spectrometry (MS/MS): The product ions are analyzed in the second mass analyzer. The unique pattern of product ions serves as a highly specific fingerprint for the analyte.
- Detection and Quantification: The detector measures the abundance of a specific product ion (or multiple ions). The peak area for the analyte, relative to the internal standard, is used for highly precise and specific quantification.
Experimental Workflow and Technology Relationships
The following diagrams illustrate the core experimental workflows for ELISA and SPR, and situate all discussed technologies within the broader analytical landscape.
Diagram 1: ELISA Stepwise Workflow
Diagram 2: SPR Cyclic Measurement
Diagram 3: Analytical Technique Relationships
The Scientist's Toolkit: Essential Research Reagents and Materials
Successful execution of these benchmark assays requires specific reagents and materials. The following table details key components used in the featured experiments.
Table 3: Key Research Reagent Solutions
| Item | Function / Description | Example in Context |
|---|---|---|
| Capture Antibody | The primary antibody immobilized to the solid surface to specifically capture the target analyte. | Human ALCAM monoclonal antibody (clone 105901) [93]. |
| Detection Antibody | A second, labeled antibody that binds to the captured analyte for signal generation. | Human ALCAM biotinylated polyclonal antibody [93]. |
| ELISA Substrate | A chromogenic solution that reacts with the enzyme conjugate to produce a measurable color change. | TMB (Tetramethylbenzidine) with H₂O₂ [93]. |
| Sensor Chip | The functionalized surface for SPR analysis on which the ligand is immobilized. | Gold sensor chip with amine-terminated alkanethiolates [93]. |
| Running Buffer (SPR) | A consistent buffer solution used to maintain baseline stability and carry analyte over the sensor surface. | HBS-EP buffer [90] or PBS with BSA [93]. |
| Internal Standard (LC-MS/MS) | A stable isotope-labeled analog of the analyte added to samples to correct for loss and instrument variability. | Critical for precise quantification in bioanalysis [92]. |
| Regeneration Solution | A solution that disrupts the binding interaction, removing bound analyte from the immobilized ligand in SPR. | Low pH buffer (e.g., Glycine-HCl) or detergent solution [90]. |
ELISA, LC-MS/MS, and SPR each serve as powerful gold standards for distinct analytical purposes. ELISA remains a cost-effective, high-throughput workhorse for concentration measurement. LC-MS/MS offers unparalleled specificity and multiplexing capability for absolute quantification. SPR uniquely provides real-time kinetic profiling of biomolecular interactions. For researchers benchmarking QCM and SAW biosensors, the choice of which standard to use depends heavily on the research question: SPR is the natural reference for kinetic and affinity studies, while ELISA and LC-MS/MS are benchmarks for quantifying analytical sensitivity and specificity in complex matrices. A comprehensive validation strategy often involves correlating data from one or more of these established techniques to fully characterize the performance and potential of novel piezoelectric sensors.
The commercial landscape for piezoelectric biosensors is shaped by the distinct performance characteristics of Quartz Crystal Microbalance (QCM) and Surface Acoustic Wave (SAW) technologies. While QCM is valued for its simplicity and established protocols, SAW sensors are increasingly adopted for applications demanding higher sensitivity and miniaturization. This guide objectively compares the performance of these technologies, supported by experimental data, to inform selection for research and development. The analysis is framed within a broader thesis on piezoelectric biosensor performance, focusing on quantifiable metrics and practical implementation.
Piezoelectric acoustic biosensors operate by translating a mass change on their surface into a measurable signal, typically a frequency shift. Quartz Crystal Microbalance (QCM) devices are Thickness Shear Mode (TSM) resonators where acoustic waves propagate through the bulk of the piezoelectric material [95]. In contrast, Surface Acoustic Wave (SAW) sensors guide waves along the surface of the device, concentrating energy and leading to higher sensitivity to surface perturbations [17] [95]. SAW sensors can be further configured into different modes, such as Shear Horizontal (SH-SAW) and Love-wave devices, to optimize performance for specific environments, particularly liquids [56] [96].
The core performance differentiators are summarized in the table below.
Table 1: Fundamental performance comparison between QCM and SAW biosensors.
| Parameter | QCM | SAW | Experimental & Commercial Implication |
|---|---|---|---|
| Acoustic Wave Type | Bulk Wave | Surface Wave | SAW energy is concentrated at the surface, enhancing surface mass sensitivity [95]. |
| Typical Frequency Range | 5–30 MHz [95] | 10 MHz to 3 GHz [95] | Higher SAW operating frequencies directly enable higher mass sensitivity. |
| Mass Sensitivity | Lower (~10⁻⁹ g) [95] | Higher (~10⁻¹² g) [95] | SAW is superior for detecting low-abundance biomarkers or small molecules [96]. |
| Liquid Operation | Well-established | Requires SH or Love modes | SH-SAW and Love-wave devices minimize energy loss in liquids, making them suitable for biosensing in bodily fluids [56] [96]. |
| Temperature Stability | Good (AT-cut quartz) | Varies with material and cut | SAW sensors can be susceptible to temperature fluctuations, requiring stable instrumentation or reference channels. |
| Miniaturization & Integration | Moderate | High | SAW's planar structure is more compatible with CMOS and microfluidic integration, favoring portable instrumentation [57] [95]. |
| Cost & Complexity | Generally lower | Can be higher | QCM offers a cost-effective solution; advanced SAW sensors may involve more complex fabrication. |
Key Differentiators in Commercial Instrumentation
Commercial systems are engineered to leverage these core technological strengths. QCM instruments are often positioned as robust, user-friendly workhorses for label-free interaction analysis in life science research. Their larger active area and lower cost make them suitable for characterizing surface modification chemistry and studying cell adhesion.
SAW-based instrumentation, particularly Love-mode devices, targets applications where ultimate sensitivity is required [96]. The commercial trend involves integrating SAW sensors with microfluidic cartridges for automated sample handling and miniaturized point-of-care (POC) devices [56] [57]. The ability to operate at very high frequencies allows SAW systems to detect smaller particles and lower analyte concentrations, a critical advantage for early disease diagnosis through cancer biomarker or virus detection [22] [96].
Experimental Data and Performance Benchmarks
The following tables consolidate experimental data from recent studies, providing a direct, quantitative comparison of QCM and SAW sensor performance in specific applications.
Table 2: Performance comparison in pathogen detection.
| Analyte | Sensor Technology | Experimental Protocol | Performance Outcome | Reference |
|---|---|---|---|---|
| E. coli | SAW Immunosensor | Love-wave device; antibody immobilization on sensing layer. | High sensitivity in liquid medium; capable of detecting dangerous levels (<20 CFU g⁻¹) [95]. | [95] |
| E. coli | QCM | Antibody-functionalized crystal surface. | Effective detection, but with lower inherent sensitivity compared to SAW [95]. | [95] |
| Lactobacillus (Analog) | SAW with Microfluidics | Love-wave device with PDMS microfluidic channel; detection of 10 μm polystyrene particles via insertion loss. | Achieved a low limit of detection (LoD) and high sensitivity in liquid flow-through configuration [57]. | [57] |
Table 3: Performance comparison in medical diagnostics and gas sensing.
| Analyte | Sensor Technology | Experimental Protocol | Performance Outcome | Reference |
|---|---|---|---|---|
| SARS-CoV-2 Nucleocapsid Protein | QCM | PEG-based surface functionalization on gold crystal; frequency shift measurement. | Detection limit: 53.3 TCID₅₀/mL; results in ~15 min; high specificity vs. Influenza A [22]. | [22] |
| Lipoprotein Subtypes | SH-SAW Biosensor | 250 MHz sensor on quartz; antibody immobilization; layer-parameter (velocity/attenuation) analysis. | Distinguished ApoA1, ApoB48, ApoB100, and Lp(a) by size; strong correlation (R=0.9987) for point-of-care testing [56]. | [56] |
| Hydrogen (H₂) Gas | SAW with Graphene | Reduced graphene oxide sensitive layer on lithium niobate; frequency shift measurement. | High sensitivity (0.276 kHz/ppm) and low detection limit (2 ppm) at room temperature [60]. | [60] |
| Hydrogen (H₂) Gas | Piezoelectric Micro Diaphragm (PMD) | Novel stress-based Pd sensing layer integrated with a PMD resonator. | Unprecedented Figure of Merit (FOM > 10⁴); high sensitivity (18.5 kHz/% H₂) at low frequency (150 kHz) [61]. | [61] |
Experimental Protocols for Key Applications
Protocol for SARS-CoV-2 Detection Using QCM
This protocol is adapted from a study demonstrating a rapid and ultrasensitive QCM biosensor [22].
- Sensor Functionalization: A gold-coated QCM crystal is functionalized with a polyethylene glycol (PEG)-based layer. This layer is designed to immobilize specific antibodies or recognition elements that target the SARS-CoV-2 nucleocapsid protein.
- Sample Introduction: A liquid sample (e.g., nasopharyngeal swab extract) is introduced to the sensor surface in a flow cell.
- Binding Measurement: The specific binding of the target viral proteins to the immobilized receptors causes a mass increase on the crystal surface.
- Signal Transduction: This mass change is transduced into a resonant frequency shift (Δf) of the quartz crystal, which is monitored in real-time.
- Data Analysis: The frequency shift is quantified. The platform has been calibrated to achieve a detection limit of 53.3 TCID₅₀/mL, with results available in approximately 15 minutes. Cross-reactivity tests, for example with Influenza A proteins, are conducted to confirm specificity.
Protocol for Lipoprotein Sizing Using SH-SAW Biosensor
This protocol is based on a reflective-type SH-SAW biosensor used for distinguishing lipoprotein particles by size [56].
- Sensor Preparation: A 250 MHz Shear Horizontal SAW biosensor is fabricated on 36° rotated Y-cut 90° X-propagating quartz substrates.
- Surface Bio-functionalization: Specific antibodies (e.g., for ApoA1, ApoB48, ApoB100, Lp(a)) are immobilized on the gold sensing surface within a 3 × 5 mm chip area.
- Sample Exposure: Diluted human plasma is introduced, allowing lipoproteins to be captured by their cognate antibodies.
- Multi-Parameter Measurement: The biosensor simultaneously monitors changes in wave velocity and attenuation caused by the captured particles. The critical measured value is the layer-parameter, defined as the ratio of these two changes.
- Size Correlation: The layer-parameter value is directly correlated with the hydrodynamic size of the captured lipoprotein particles, enabling size estimation without traditional, bulky methods like NMR.
Diagram 1: SH-SAW lipoprotein sizing workflow.
The Scientist's Toolkit: Key Research Reagents and Materials
The performance of piezoelectric biosensors is critically dependent on the materials used in their construction and functionalization. The table below lists essential components and their functions in typical experimental setups.
Table 4: Essential research reagents and materials for QCM and SAW biosensor development.
| Category | Item | Function in Experiment | Example Use Case |
|---|---|---|---|
| Piezoelectric Substrates | AT-cut Quartz | Provides stable, temperature-compensated resonance for QCM. | Standard QCM crystal disks [95]. |
| Lithium Niobate (LiNbO₃) / Quartz (ST-cut) | High electromechanical coupling substrate for SAW generation. | SAW sensor substrate for gas or biosensing [60] [57]. | |
| Sensing Layer Materials | Palladium (Pd) and its Alloys | Catalytic H₂ absorption, inducing stress or mass loading. | Hydrogen gas sensing [61]. |
| Graphene/Reduced Graphene Oxide | High surface-area sensitive layer for gas adsorption. | High-performance H₂ sensing at room temperature [60]. | |
| Zinc Oxide (ZnO) Nanostructures | Sensitive coating for various gases; can be used in nanocomposites. | SAW gas sensor material [17]. | |
| Bio-Functionalization | Polyethylene Glycol (PEG) Linkers | Anti-fouling surface coating; provides matrix for biomolecule immobilization. | Enhancing sensitivity and specificity for SARS-CoV-2 detection on QCM [22]. |
| Specific Antibodies | Capture probe for selective target antigen binding. | Detection of lipoproteins [56], viruses [22], or pathogens [95]. | |
| Device Fabrication | Interdigitated Transducers (IDTs) | Generate and receive acoustic waves on piezoelectric substrate. | Core component of all SAW sensors [96] [57]. |
| Polydimethylsiloxane (PDMS) Microfluidics | Liquid guiding channel; can act as a waveguide for Love waves. | Integrated microfluidic channels for sample handling and wave guiding [57]. |
The commercial and research adoption of QCM and SAW biosensors is driven by a clear performance-specification trade-off. QCM remains a robust, cost-effective technology for a wide range of gravimetric assays where ultra-high sensitivity is not the primary driver. In contrast, SAW technology, particularly in its Love-mode and SH-SAW configurations, offers superior sensitivity and miniaturization, paving the way for next-generation diagnostic instruments and environmental monitors. The choice between them hinges on the specific application requirements for sensitivity, sample matrix, miniaturization, and cost. Future instrumentation will likely see further integration of both technologies with microfluidics and advanced nanomaterials to create highly automated, multi-parameter analytical systems.
Piezoelectric biosensors represent a major class of label-free detection devices that transform a biological binding event into a measurable electrical signal. Among these, quartz crystal microbalance (QCM) and surface acoustic wave (SAW) sensors have emerged as leading technologies due to their high sensitivity, real-time detection capabilities, and non-invasive features [58]. These acoustic sensors use mechanical waves that propagate through or on the surface of a piezoelectric material; any external disturbances such as mass changes or viscoelastic alterations at the sensor surface affect these waves, enabling highly sensitive monitoring of chemical and biological processes [58].
The global acoustic wave biosensors market, valued at approximately $1,200 million in 2025, reflects the growing adoption of these technologies across healthcare, environmental monitoring, and industrial applications [77]. This guide provides an objective comparison of QCM and SAW biosensor performance through structured experimental data and detailed methodologies, equipping researchers and drug development professionals with the necessary framework to select the optimal biosensing platform for their specific applications.
Fundamental Operating Principles and Theoretical Background
Quartz Crystal Microbalance (QCM) Technology
QCM devices are thickness shear mode (TSM) resonators belonging to the bulk acoustic wave (BAW) family [3]. A standard QCM comprises a thin AT-cut quartz crystal wafer sandwiched between two metallic electrodes [1]. When an alternating voltage is applied across these electrodes, it induces a shear deformation in the quartz crystal, causing it to oscillate at its fundamental resonant frequency [3]. This frequency is primarily determined by the physical thickness of the quartz plate—thinner crystals yield higher resonance frequencies [1].
The fundamental relationship governing QCM operation is the Sauerbrey equation, which establishes a linear relationship between mass deposited on the sensor surface and the observed frequency shift [1]:
Δf = -2f₀²Δm / [A√(ρᵩμᵩ)]
Where Δf is the measured frequency shift, f₀ is the fundamental resonant frequency of the unloaded crystal, Δm is the mass change, A is the active sensor area, and ρᵩ and μᵩ are the density and shear modulus of quartz, respectively [1]. This equation strictly applies to rigid, evenly distributed mass layers in air or vacuum, while more complex models account for operation in liquid environments where viscoelastic effects become significant [1].
Surface Acoustic Wave (SAW) Technology
SAW sensors operate through Rayleigh waves that travel parallel to the sensor surface, typically generated and detected by interdigital transducers (IDTs) patterned on a piezoelectric substrate [3]. These waves have both longitudinal and shear vertical components that confine acoustic energy near the surface, making SAW devices exceptionally sensitive to surface perturbations [3].
Unlike QCM, SAW sensors primarily monitor changes in acoustic wave velocity and amplitude attenuation caused by mass loading, viscoelastic changes, or electrical conductivity variations at the device interface [3]. However, a significant limitation of conventional SAW devices is their excessive damping in liquid media, which restricts their utility for many biological applications requiring aqueous environments [3].
Figure 1: Fundamental working principles of QCM and SAW piezoelectric biosensors
Comparative Performance Analysis: QCM vs. SAW Biosensors
Technical Specifications and Performance Metrics
Table 1: Fundamental characteristics of QCM and SAW biosensors
| Parameter | QCM Sensors | SAW Sensors |
|---|---|---|
| Wave Type | Bulk Acoustic Wave (BAW) | Surface Acoustic Wave (SAW) |
| Propagation Mode | Thickness shear mode through bulk material | Rayleigh waves along surface |
| Typical Frequency Range | 5-35 MHz (fundamental); Overtone operation possible [3] [9] | MHz to GHz range (typically higher than QCM) [3] |
| Liquid Phase Operation | Excellent (shear waves don't radiate considerable energy) [3] | Limited (excessive damping in liquids) [3] |
| Mass Sensitivity | ~4.4 ng/cm² for 10 MHz crystal [1] | Higher sensitivity due to higher operational frequencies [3] |
| Primary Detection Parameters | Resonance frequency shift (Δf), Dissipation (D) | Wave velocity, Amplitude attenuation |
| Temperature Sensitivity | Moderate (AT-cut crystals minimize temperature dependence) | High (requires compensation) |
| Manufacturing Complexity | Low to moderate | Moderate to high (lithography for IDTs) |
| Cost Considerations | Cost-effective, established manufacturing [77] | Higher cost, specialized fabrication |
Quantitative Performance Comparison
Table 2: Experimental performance data for QCM and SAW biosensors
| Application | Sensor Type | Detection Limit | Linear Range | Response Time | Reference |
|---|---|---|---|---|---|
| General Biosensing | QCM | ~0.01-1 ng/cm² mass sensitivity [1] | Varies with application | Real-time (seconds to minutes) | [1] |
| General Biosensing | SAW | pg-level mass detection [3] | Varies with application | Real-time (seconds to minutes) | [3] |
| Bilirubin Detection | QCM Piezoelectric | 0.01 μM [84] | 0.05-80 μM [84] | 37 min [84] | [84] |
| Bilirubin Detection | QCM with molecularly imprinted film | 0.05 μM [84] | 0.1-50 μM [84] | 30 min [84] | [84] |
| Glucose Detection | QCM with MXene composite | Not specified | Not specified | Not specified | [58] |
| Microfluidic QCM | µ-QCM (7th overtone) | ~10x improvement in dissipation [9] | Not specified | Not specified | [9] |
| Pesticide Detection | QCM Immunosensor | 0.14 ng/mL (100 MHz resonator) [1] | Not specified | Not specified | [1] |
Experimental Protocols and Methodologies
Standard QCM Biosensing Protocol
Objective: To detect and quantify target biomolecules using a QCM biosensor through frequency shift measurements.
Materials and Equipment:
- QCM crystal (typically AT-cut, 5-20 MHz fundamental frequency)
- Gold-coated electrodes with chromium adhesion layer
- Oscillator circuit (e.g., based on 74LS320 integrated circuit)
- Frequency counter with RS-232C connection for data acquisition
- Flow cell or stationary measurement chamber
- Temperature control system
- Buffer solutions and cleaning reagents
Procedure:
Sensor Preparation:
- Clean QCM crystals with piranha solution (3:1 H₂SO₄:H₂O₂) or oxygen plasma treatment
- Rinse thoroughly with deionized water and dry under nitrogen stream
- Functionalize gold electrode surface with appropriate biorecognition elements (antibodies, aptamers, DNA probes)
Baseline Establishment:
- Mount crystal in measurement chamber
- Introduce running buffer (e.g., PBS, pH 7.4)
- Monitor resonant frequency until stable baseline established (±1 Hz over 5 minutes)
Sample Measurement:
- Introduce analyte solution to measurement chamber
- Monitor frequency shift in real-time (typically 5-60 minutes)
- Record frequency data at 1-second intervals
Regeneration and Reuse:
- Remove bound analyte using regeneration solution (e.g., low pH buffer, detergent)
- Re-equilibrate with running buffer until frequency returns to initial baseline
- Verify sensor functionality with control measurement
Data Analysis:
- Calculate mass uptake using Sauerbrey equation for rigid films
- For viscoelastic layers, use QCM-D (dissipation monitoring) for more accurate modeling
- Determine binding kinetics from time-dependent frequency response
Advanced Microfluidic QCM (µ-QCM) Protocol
Objective: To significantly reduce dissipation and improve Q-factor in liquid phase measurements through microfluidic confinement.
Innovation Rationale: Conventional QCM suffers from energy dissipation in liquids due to friction within the shear evanescent boundary layer. Microfluidic confinement addresses this limitation by controlling the ratio between channel width and pressure wavelength [9].
Materials and Special Equipment:
- Conventional QCM crystal (5 MHz fundamental frequency)
- Aluminum microfluidic channel structure (2 μm height × 10 μm width)
- Conformal gold coating (~40 nm) for biocompatibility
- Capillary-driven filling system with diverging approach channels
- Micro-pillars for bubble-free liquid merging
Key Design Parameters:
- Channel width (W) < ¼ pressure wavelength (λₚ)
- For 35 MHz operation: W = 10 μm, λₚ ≈ 42 μm in water [9]
- Channel height (H) = 2 μm (much larger than evanescent shear wavelength λₛ ≈ 250 nm)
- Approximately 100 parallel microfluidic channels
Procedure:
- Fabricate microfluidic channels using photolithography and etching
- Bond microfluidic structure to QCM surface
- Introduce liquid sample via capillary action
- Measure resonance frequency shift and dissipation across multiple overtones
- Compare performance with conventional QCM under identical conditions
Performance Outcomes:
- 10-fold improvement in dissipation compared to conventional QCM [9]
- 5× larger normalized resonance frequency shift at 7th overtone [9]
- Inversed normalized frequency trend (increases with overtone number) [9]
Figure 2: Experimental workflow for microfluidic QCM implementation and performance outcomes
Decision Matrix: Application-Based Sensor Selection
Application-Specific Recommendations
Table 3: Decision matrix for biosensor selection based on application requirements
| Application Domain | Recommended Technology | Rationale | Key Considerations |
|---|---|---|---|
| Liquid-Phase Biological Sensing (immunosensing, DNA hybridization) | QCM | Superior liquid stability; Well-established surface chemistry [3] [97] | Higher baseline drift than SPR; Non-specific binding issues [97] |
| Gas/Vapor Phase Sensing (environmental monitoring, volatiles) | SAW | Higher sensitivity to mass changes; Faster response [3] [77] | Temperature compensation critical; Humidity interference |
| Point-of-Care Diagnostics | QCM (especially emerging µ-QCM) | Cost-effectiveness; Portable designs; Microfluidic integration [98] [9] | Requires simplified fluidics; Reduced sample volume |
| Cellular & Viscoelastic Studies | QCM with Dissipation Monitoring (QCM-D) | Simultaneous Δf and ΔD provides structural information [1] | Complex data interpretation; Specialized instrumentation |
| High-Frequency Applications (ultra-sensitive detection) | SAW or FBAR | GHz operation possible; Superior mass sensitivity [3] | Fabrication complexity; Limited commercial availability |
| Multiplexed Detection | SAW | Easier array implementation; Smaller footprint [77] | Cross-talk between channels; Complex fluidics |
Selection Algorithm for Researchers
When selecting between QCM and SAW technologies, consider the following decision pathway:
Define Primary Operating Environment:
- For liquid phase applications → Prioritize QCM
- For gas/vapor phase applications → Consider SAW
- For mixed phase applications → QCM with appropriate interface
Establish Sensitivity Requirements:
- ng-pg level detection → Standard QCM (5-35 MHz)
- Sub-pg level detection → High-frequency QCM overtone or SAW
Evaluate Sample Volume Constraints:
- Microliter volumes → Microfluidic QCM (µ-QCM)
- Milliliter volumes → Conventional QCM or SAW with flow cell
Consider Throughput Needs:
- Single analyte measurements → Standard QCM
- Multiplexed detection → SAW array or multi-channel QCM
Assess Infrastructure Limitations:
- Limited budget → Standard QCM (lower cost)
- Advanced capabilities → QCM-D or high-frequency SAW
Essential Research Reagent Solutions
Table 4: Key research reagents and materials for piezoelectric biosensing applications
| Reagent/Material | Function | Application Examples | Considerations |
|---|---|---|---|
| AT-cut Quartz Crystals | Piezoelectric substrate | Fundamental sensing element for QCM | Thickness determines fundamental frequency |
| Gold Electrodes with Chromium Adhesion Layer | Biocompatible sensing surface | General biosensing; thiol-based chemistry | Chromium provides adhesion but may leach |
| Specific Biorecognition Elements (antibodies, aptamers, DNA probes) | Target capture | pathogen detection, DNA hybridization, protein sensing [97] | Orientation and density critical for sensitivity |
| Self-Assembled Monolayers (SAMs) | Surface functionalization | Linker layer for biomolecule immobilization | Packing density affects non-specific binding |
| Molecularly Imprinted Polymers | Synthetic recognition sites | Bilirubin detection, small molecule sensing [84] | Alternative to biological recognition elements |
| MXene-Composite Coatings | Enhanced sensitivity | Glucose detection, improved signal response [58] | Emerging nanomaterial with tunable properties |
| Microfluidic Materials (PDMS, aluminum) | Sample confinement | µ-QCM implementation [9] | Rigidity critical for energy conservation |
Future Perspectives and Emerging Trends
The field of piezoelectric biosensing continues to evolve with several promising directions:
Hybrid Sensor Platforms: Integration of QCM/SAW with complementary transduction methods (optical, electrochemical) provides multimodal characterization capabilities [1]. These hybrid systems enable cross-validation and more comprehensive sample analysis, particularly for complex biological interactions.
Artificial Intelligence Integration: Machine learning algorithms are increasingly applied to analyze complex sensor data, improving pattern recognition for specific biomarkers and enhancing predictive capabilities [77]. This approach shows particular promise for distinguishing specific from non-specific binding events.
Advanced Nanocomposite Materials: MXenes, graphene oxide, and gold nanoparticles are being incorporated into sensor designs to enhance sensitivity and specificity [58]. These nanomaterials facilitate greater biomolecule loading and can introduce additional signal transduction mechanisms.
Miniaturization and Array Development: Both QCM and SAW technologies are progressing toward higher-density arrays for parallel screening applications [77]. Microfluidic innovations continue to reduce sample volume requirements while improving measurement stability.
Wireless and Portable Systems: Significant efforts are focused on developing compact, battery-operated systems for point-of-care applications [98]. These platforms leverage the fundamental advantages of acoustic biosensors while addressing practical deployment requirements.
As these advancements mature, researchers can expect increasingly sophisticated tools that further blur the distinction between laboratory-grade instrumentation and field-deployable biosensing platforms.
Biosensors have emerged as indispensable tools in modern diagnostics, environmental monitoring, and food safety, with the global market for acoustic wave biosensors projected to grow significantly from 2025 to 2031 [99]. The ongoing demand for rapid, accurate, and accessible diagnostics has accelerated the development of sophisticated sensing platforms, particularly for point-of-care (POC) applications in resource-limited settings [72]. Within this dynamic landscape, piezoelectric biosensors, especially Quartz Crystal Microbalance (QCM) and Surface Acoustic Wave (SAW) devices, have gained prominence due to their label-free detection mechanism, real-time analysis capabilities, high sensitivity, and ruggedness [3] [58]. These devices transform the biorecognition event between a sensor surface and target analyte into a measurable electrical signal, with mass being the fundamental property monitored by these acoustic transducers [3]. As research intensifies, understanding the comparative performance, technological capabilities, and emerging technological convergences between QCM and SAW biosensors becomes crucial for researchers, scientists, and drug development professionals seeking to implement these platforms in advanced diagnostic and research applications. This guide provides an objective comparison of their performance, supported by experimental data and detailed methodologies, to inform strategic decisions in sensor selection and development.
Fundamental Principles and Comparative Analysis of QCM and SAW Biosensors
Core Operating Mechanisms
QCM and SAW biosensors, while both based on the piezoelectric effect, operate on fundamentally distinct acoustic wave propagation principles. QCM is a bulk acoustic wave (BAW) device where the acoustic wave propagates through the thickness of the piezoelectric crystal, typically AT-cut quartz [3] [100]. The application of an alternating current across the electrodes induces a shear deformation, creating a standing shear wave with anti-nodes at the crystal surface. The fundamental resonance frequency of this oscillation (typically in the 5-20 MHz range for conventional devices) is highly sensitive to mass changes on the sensor surface [3] [100]. The relationship between the mass change ((\Delta m)) and the observed frequency shift ((\Delta f)) is quantitatively described by the Sauerbrey equation [37] [100]: [\Delta f = -\frac{2f0^2}{A\sqrt{\muq \rhoq}} \Delta m] where (f0) is the fundamental resonant frequency, (A) is the active electrode surface area, (\muq) is the shear modulus of quartz, and (\rhoq) is the density of quartz [37].
In contrast, SAW devices are surface acoustic wave sensors where the acoustic wave travels parallel to the surface of the piezoelectric substrate, confined to a depth of about one wavelength [3] [101]. Interdigital transducers (IDTs) fabricated on the piezoelectric material generate and receive the acoustic waves. The propagation characteristics of these Rayleigh waves (which have both longitudinal and shear vertical components) are influenced by mass loading, viscosity, and electrical conductivity changes at the device surface [3] [101]. LOVE-SAW sensors, a common variant, incorporate a waveguide layer that confines the acoustic energy closer to the surface, enhancing mass sensitivity and protecting the IDTs from the liquid environment [101].
Performance Comparison Table
The table below summarizes the key characteristics and performance metrics of QCM and SAW biosensors based on current research and commercial applications.
Table 1: Performance Comparison of QCM and SAW Biosensors
| Parameter | Quartz Crystal Microbalance (QCM) | Surface Acoustic Wave (SAW) Sensor |
|---|---|---|
| Wave Type | Bulk Acoustic Wave (BAW) [3] | Surface Acoustic Wave [3] |
| Typical Frequency Range | 5–20 MHz (Conventional); Up to ~200 MHz (HFF-QCM) [3] [101] | Tens of MHz to several GHz [3] |
| Liquid Phase Operation | Excellent; low damping due to shear wave [3] [100] | Challenging; excessive damping for conventional SAW, but possible with special designs (e.g., SH-SAW, LOVE-SAW) [3] [101] |
| Mass Sensitivity | High (HFF-QCM offers ~2 orders of magnitude higher sensitivity) [101] | Very High (increases with frequency) [3] |
| Key Strengths | Ruggedness, cost-effectiveness, simple design, proven reliability in liquids [3] | Higher fundamental sensitivity, miniaturization potential [3] |
| Primary Limitations | Lower fundamental frequency vs. SAW [3] | Excessive damping in liquids, more complex fabrication [3] |
| Common Applications | Protein adsorption, biomolecular interactions, viral detection (e.g., SARS-CoV-2) [22] [97] | Gas sensing, vapor detection, biosensing in specialized configurations [3] [58] |
Principle of Operation Workflow
The following diagram illustrates the core operational workflows and fundamental differences between QCM and SAW biosensors.
Experimental Protocols and Performance Validation
Protocol 1: QCM-based Detection of SARS-CoV-2 Nucleocapsid Protein
This protocol summarizes a recent study developing a rapid and ultrasensitive QCM biosensor for SARS-CoV-2 detection, demonstrating the platform's potential for point-of-care diagnostics [22].
- Objective: To develop a QCM biosensor for rapid detection of SARS-CoV-2 nucleocapsid proteins with high sensitivity and specificity, suitable for resource-limited settings [22].
- Sensor Functionalization:
- The gold electrode surface of a QCM sensor was functionalized with a polyethylene glycol (PEG)-based layer to improve sensitivity and specificity.
- Specific biorecognition elements (e.g., antibodies or aptamers) against the SARS-CoV-2 nucleocapsid protein were immobilized onto this functionalized surface [22].
- Measurement & Data Acquisition:
- The functionalized sensor was exposed to processed sample solutions containing the target viral protein.
- The resonance frequency shift ((\Delta f)) was monitored in real-time using a QCM measurement system.
- All measurements were conducted at room temperature [22].
- Results & Performance:
- Limit of Detection (LOD): 53.3 TCID({50})/mL.
- Sensitivity: 0.263 Hz/TCID({50})/mL.
- Assay Time: Approximately 15 minutes.
- Specificity: High specificity for SARS-CoV-2 was confirmed through cross-reactivity tests with Influenza A virus, showing minimal interference [22].
- Validation: Comprehensive surface characterization using Scanning Electron Microscopy (SEM), Digital Holographic Microscopy, and Raman Spectroscopy confirmed the stability and integrity of the functionalized sensor surface [22].
Protocol 2: SAW Sensor for Gas and Respiratory Monitoring
This protocol outlines the application of SAW sensors for gas detection and respiratory monitoring, an area where SAW technology excels due to its high sensitivity in the gas phase [58].
- Objective: To develop a SAW-based sensor for gas leak detection and/or respiratory monitoring, leveraging the high vapor sensitivity of SAW devices [58].
- Sensor Fabrication & Functionalization:
- A SAW device was fabricated on a piezoelectric substrate (e.g., ST-cut quartz) with interdigital transducers (IDTs).
- The delay line or resonator surface between the IDTs was coated with a chemoselective material. Examples from recent research include:
- Measurement & Data Acquisition:
- The sensor was placed in the gas stream or near the respiratory source.
- The interaction between the target gas molecules and the chemoselective layer induces changes in the mass and viscoelastic properties on the sensor surface.
- This interaction alters the velocity and amplitude of the surface acoustic wave, which is measured as a shift in the oscillator's frequency or phase [58].
- Results & Performance: While specific metrics vary by analyte and coating, SAW sensors generally demonstrate:
Experimental Data Comparison Table
The following table consolidates key performance data from recent experimental studies on QCM and SAW biosensors, highlighting their capabilities in detecting various analytes.
Table 2: Experimental Performance Data from Recent Biosensing Studies
| Sensor Type | Target Analyte | Functionalization/Surface Modification | Limit of Detection (LOD) | Response Time / Assay Time | Reference |
|---|---|---|---|---|---|
| QCM | SARS-CoV-2 Nucleocapsid Protein | PEG-based functionalization | 53.3 TCID(_{50})/mL | ~15 minutes | [22] |
| QCM | Prostate Cancer Antigen 3 (PCA3) | Graphene Oxide (GO) with L-cysteine and capture probe | 0.268 nM | 20 minutes | [37] |
| QCM | Various Biomolecules | MXene-Cu/Cu(_2)O/C nanocomposites (for glucose detection) | (Varies by analyte) | (Varies by analyte) | [58] |
| SAW | NO(_2) Gas | MXene-activated Graphene Oxide | (Specific LOD not stated, high sensitivity reported) | Real-time monitoring | [58] |
| SAW | Humidity / Respiration | Chitosan/porous cyclodextrin–TiO(_2) composites | (Specific LOD not stated, high sensitivity reported) | Real-time monitoring | [58] |
| SAW | Ammonia Gas | Silver Nanoparticles–Graphene–Polypyrrole hybrid nanocomposite | Low-concentration detection (Specific LOD not stated) | Real-time monitoring | [58] |
The Scientist's Toolkit: Essential Research Reagents and Materials
Successful development and implementation of QCM and SAW biosensors require a suite of specialized materials and reagents. The following table details key components used in the featured experiments and the broader field.
Table 3: Essential Research Reagents and Materials for Piezoelectric Biosensing
| Reagent/Material | Function/Application | Example Use Case |
|---|---|---|
| AT-cut Quartz Crystal | The piezoelectric substrate that generates the acoustic wave in QCM sensors. Its temperature-stable cut is ideal for resonant devices [3] [100]. | Standard substrate for most QCM sensors [3]. |
| Gold Electrodes | Serve as the conductive surfaces on the quartz crystal to apply the oscillating electric field and for the immobilization of biorecognition elements via gold-thiol chemistry [37]. | Electrode material in QCM chips; surface for functionalization in various biosensors [37]. |
| Polyethylene Glycol (PEG) | A polymer used for surface functionalization to reduce non-specific binding and improve biocompatibility and stability of the sensor interface [22]. | Used to functionalize QCM sensor surface for SARS-CoV-2 detection to enhance sensitivity and specificity [22]. |
| Graphene Oxide (GO) | A nanomaterial with a large surface area and abundant functional groups (-COOH, -OH) that enhance biomolecule loading and improve sensor sensitivity [37]. | Used in a QCM biosensor for prostate cancer marker (PCA3) detection to increase surface area and binding capacity [37]. |
| EDC/NHS Chemistry | (1-Ethyl-3-(3-dimethylaminopropyl)carbodiimide / N-Hydroxysuccinimide) A cross-linking system for activating carboxyl groups to form stable amide bonds with amine-containing biomolecules (e.g., antibodies, DNA probes) [37]. | Standard protocol for covalent immobilization of capture probes on sensor surfaces [37]. |
| Specific Biorecognition Elements | Molecules that provide selective binding to the target analyte. Includes antibodies, aptamers, oligonucleotide probes, and molecularly imprinted polymers (MIPs) [3] [72]. | Antibodies vs. SARS-CoV-2 nucleocapsid protein [22]; DNA probe for PCA3 [37]. |
| L-Cysteine | A thiol-containing amino acid used as a linker molecule. The thiol group binds to gold electrodes, while the amine and carboxyl groups allow further functionalization [37]. | Used as an initial layer to create a stable, functionalizable surface on a gold QCM electrode prior to GO deposition [37]. |
Emerging Trends and Future Outlook
The convergence of QCM and SAW technologies with advancements in nanotechnology, material science, and artificial intelligence is shaping the future of biosensing. Key emerging trends include:
- Nanomaterial Integration: The incorporation of advanced nanomaterials like MXenes, graphene oxide, and metallic nanoparticles is a powerful strategy for signal amplification and enhancing sensitivity [58] [37]. These materials provide high surface-to-volume ratios and unique physicochemical properties that significantly improve biorecognition element loading and signal transduction [37].
- High-Frequency Devices: The development of High Fundamental Frequency QCMs (HFF-QCMs) and high-frequency SAW sensors is a direct response to the demand for greater sensitivity. The sensitivity of acoustic sensors is proportional to the square of the fundamental frequency, driving research into devices operating at hundreds of MHz to several GHz [3] [101].
- Point-of-Care (POC) and Miniaturization: The drive toward decentralized diagnostics is fueling the development of portable, user-friendly, and affordable biosensing systems. The "REASSURED" criteria (Real-time connectivity, Ease of sample collection, Affordable, Sensitive, Specific, User-friendly, Rapid and robust, Equipment-free, and Deliverable to end-users) define the ideal characteristics for these next-generation POC devices [72]. Acoustic biosensors are well-positioned to meet these criteria with further engineering.
- Multiplexing and Multi-Parameter Sensing: There is growing emphasis on developing sensor arrays that can detect multiple analytes simultaneously from a single sample. This is particularly valuable for complex disease diagnosis and environmental monitoring. The ability to functionalize different sensor spots with different receptors enables comprehensive profiling [102].
- Integration with Digital Health Technologies: The fusion of biosensor data with wireless communication, cloud computing, and machine learning (ML) algorithms creates powerful digital health ecosystems. ML can enhance data analysis by managing noise, detecting anomalies, and improving sensor performance amidst interfering signals, leading to more reliable and predictive diagnostics [72].
- Expansion of Biomarker Applications: The application spectrum of QCM and SAW biosensors is rapidly expanding beyond traditional domains. Recent research demonstrates their use in detecting specific cancer biomarkers like PCA3 for prostate cancer [37], characterizing extracellular vesicles, and monitoring whole-cell responses [3] [102], opening new avenues in clinical diagnostics and drug discovery.
QCM and SAW biosensors represent two powerful, yet distinct, technological pathways within the evolving biosensing landscape. QCM offers robustness, operational simplicity, and proven reliability in liquid environments, making it a versatile workhorse for a wide range of applications, from the detection of viruses like SARS-CoV-2 to the study of protein interactions [22] [97]. In contrast, SAW sensors, with their inherently higher operating frequencies, offer superior mass sensitivity and are exceptionally well-suited for gas-phase sensing and specialized biosensing configurations, though they face challenges with liquid damping [3] [58].
The future outlook for both platforms is intrinsically linked to technological convergence. The integration of novel nanomaterials, the push for higher frequency devices, and the seamless connection with digital health and AI analytics are erasing the traditional boundaries between these technologies and other sensing modalities. For researchers and drug development professionals, the choice between QCM and SAW is not a matter of which is universally superior, but which is optimally suited to the specific analytical challenge—be it a liquid-phase bioassay or a vapor-phase detection—and how it can be enhanced through hybridization with emerging technologies. The ongoing innovation in this field promises a new generation of intelligent, highly sensitive, and accessible biosensing tools that will profoundly impact healthcare, environmental science, and fundamental research.
Conclusion
QCM and SAW biosensors are powerful, complementary technologies in the label-free detection landscape. QCM excels in liquid-phase applications, offering robustness and ease of use for biomolecular interaction studies in drug development. In contrast, SAW sensors provide superior sensitivity, especially in gas sensing and high-frequency applications, and are increasingly adapted for portable diagnostics. The choice between them hinges on the specific application requirements: QCM for versatile liquid-phase analysis and SAW for ultra-sensitive detection where its operational constraints can be managed. Future advancements will be driven by the integration of novel low-dimensional nanomaterials, improved liquid-phase stability for SAW devices, and the continued miniaturization and integration of these platforms into multiplexed, point-of-care diagnostic systems, ultimately accelerating discoveries in biomedical research and clinical practice.
References
- 1. Piezoelectric biosensors: shedding light on principles and ... [https://pmc.ncbi.nlm.nih.gov/articles/PMC10920441/]
- 2. Quartz crystal microbalance-based biosensors as rapid ... [https://pmc.ncbi.nlm.nih.gov/articles/PMC7443316/]
- 3. An Overview of High Frequency Acoustic Sensors—QCMs, SAWs and FBARs—Chemical and Biochemical Applications - PMC [https://pmc.ncbi.nlm.nih.gov/articles/PMC6833005/]
- 4. Quartz crystal microbalance sensor design: I. Experimental ... [https://www.sciencedirect.com/science/article/abs/pii/S0925400506005065]
- 5. The Recent Development of Acoustic Sensors as Effective ... [https://www.mdpi.com/1420-3049/28/12/4855]
- 6. QCM Technology in Biosensors | IntechOpen [https://www.intechopen.com/chapters/16426]
- 7. Evaluation of Shear Horizontal Surface Acoustic Wave ... [https://pmc.ncbi.nlm.nih.gov/articles/PMC8309872/]
- 8. Quartz Crystal Microbalance with Impedance Analysis ... [https://www.mdpi.com/1424-8220/22/4/1506]
- 9. Microfluidic QCM enables ultrahigh Q-factor: a new ... [https://www.nature.com/articles/s41378-024-00732-2]
- 10. QCM: When is the Sauerbrey equation valid? [https://www.biologic.net/topics/bluqcm-when-is-the-sauerbrey-equation-valid/]
- 11. Surface acoustic wave biosensor as a functional quality ... [https://www.sciencedirect.com/science/article/abs/pii/S0925400514016384]
- 12. QCM data analysis - When should the Sauerbrey equation ... [https://www.biolinscientific.com/blog/qcm-data-analysis-when-should-the-sauerbrey-equation-be-used?update_2025=1]
- 13. A Practical Model of Quartz Crystal Microbalance in Actual ... [https://pmc.ncbi.nlm.nih.gov/articles/PMC5579555/]
- 14. Performance evaluation of QCM dew point sensors with ... [https://www.sciencedirect.com/science/article/abs/pii/S0925400524007639]
- 15. Surface Acoustic Wave (SAW) Biosensors 2025-2033 ... [https://www.datainsightsmarket.com/reports/surface-acoustic-wave-saw-biosensors-1673616]
- 16. Foodborne pathogen detection using surface acoustic wave ... [https://pubs.rsc.org/en/content/articlehtml/2024/ra/d4ra06697a]
- 17. Surface acoustic wave gas Sensors: Recent developments ... [https://www.sciencedirect.com/science/article/pii/S0921510725001801]
- 18. Experimental and Theoretical Analysis of Rayleigh ... [https://www.mdpi.com/2072-666X/15/8/974]
- 19. Surface Acoustic Wave Sensors Market Size and Share [https://www.mordorintelligence.com/industry-reports/surface-acoustic-wave-sensors-market]
- 20. Design and Investigation of a High-Performance Quartz ... [https://pmc.ncbi.nlm.nih.gov/articles/PMC11596028/]
- 21. Analyzing Surface Acoustic Wave Sensor [https://www.datainsightsmarket.com/reports/surface-acoustic-wave-sensor-1685210]
- 22. Quartz crystal microbalance-based biosensor for rapid and ... [https://www.sciencedirect.com/science/article/pii/S2949771X25000222]
- 23. vs SAW Filters: Understanding the Key... | RF Wireless World BAW [https://www.rfwireless-world.com/terminology/saw-vs-baw-filters]
- 24. Research Assistant - Bohrium | AI for Science with Global Scientists [https://www.bohrium.com/paper-details/bulk-acoustic-wave-rf-technology/811900717341081602-2628]
- 25. Performance analysis of shear horizontal one port surface ... [https://www.sciencedirect.com/science/article/pii/S2772671124003796]
- 26. Putting piezoelectric sensors into Fano resonances [https://www.nature.com/articles/s41378-024-00847-6]
- 27. SAW & BAW 2025 Trends and Forecasts 2033 [https://www.datainsightsmarket.com/reports/saw-baw-1629114]
- 28. SAW & BAW Filters Market Report [https://dataintelo.com/report/saw-baw-filters-market]
- 29. Gradient piezoelectric composites for ultrasonic transducer ... [https://www.sciencedirect.com/science/article/pii/S2352847825000395]
- 30. Surface Generated Acoustic Wave Biosensors for the ... [https://www.mdpi.com/1424-8220/9/7/5740]
- 31. The QCM fundamental frequency : Why it matters in measurements [https://www.biolinscientific.com/blog/does-the-qcm-fundamental-frequency-matter]
- 32. #147;Unexpected” frequency behavior in QCM -D: When... | NIST [https://www.nist.gov/publications/147unexpected148-frequency-behavior-qcm-d-when-can-frequency-increase-increased-adhered]
- 33. Advances in quartz crystal microbalance relative humidity ... [https://www.sciencedirect.com/science/article/abs/pii/S0263224124023005]
- 34. Fast spectral solver for viscoelastic structures under oscillatory flow in... [https://arxiv.org/html/2511.19440v1]
- 35. Low-Cost Open-Source Biosensing System Prototype ... [https://www.mdpi.com/2813-6640/3/3/9]
- 36. Acoustic sensors as a biophysical tool for probing cell ... [https://pmc.ncbi.nlm.nih.gov/articles/PMC11114954/]
- 37. A Portable QCM-Based Biosensor-Incorporated Graphene ... [https://www.mdpi.com/2227-7080/13/12/544]
- 38. Quartz Crystal Microbalance Technology Coupled with ... [https://pmc.ncbi.nlm.nih.gov/articles/PMC9953959/]
- 39. Real-world evaluation of a QCM-based biosensor for ... [https://link.springer.com/article/10.1007/s00216-024-05407-5]
- 40. Acoustic wave biosensors: physical models and biological ... [https://www.sciencedirect.com/science/article/abs/pii/S0167779909001772]
- 41. Analysis of the acoustoelectric response of SAW gas ... [https://www.nature.com/articles/s41378-024-00673-w]
- 42. Quartz Crystal Microbalance Market Size, Growth Report ... [https://www.researchnester.com/reports/quartz-crystal-microbalance-market/7860]
- 43. A comparison of surface acoustic wave (SAW) and quartz crystal ... [https://research-repository.rmit.edu.au/articles/conference_contribution/A_comparison_of_surface_acoustic_wave_SAW_and_quartz_crystal_microbalance_QCM_based_sensors_for_portable_online_mercury_vapour_sensing/27391119]
- 44. Comparison between High Fundamental Frequency Quartz ... [https://awsensors.com/qcm-saw-in-detection-of-carbaryl-pesticide/]
- 45. Highly Sensitive Surface Acoustic Wave Sensors for ... [https://pmc.ncbi.nlm.nih.gov/articles/PMC12030490/]
- 46. A review on 2D materials for surface acoustic wave gas ... [https://pubs.rsc.org/en/content/articlehtml/2025/ta/d4ta07342h]
- 47. Quartz Crystal Microbalance-Based Aptasensors for ... [https://pmc.ncbi.nlm.nih.gov/articles/PMC9503788/]
- 48. Effective antibodies immobilization and functionalized ... [https://pmc.ncbi.nlm.nih.gov/articles/PMC5300251/]
- 49. Orientational Aspects of Antibody Immobilization and ... [https://www.sciencedirect.com/science/article/abs/pii/S0021979796900983]
- 50. Recent Progress in Surface Acoustic Wave Sensors Based ... [https://www.mdpi.com/2227-9040/12/12/255]
- 51. Low-dimensionality carbon-based biosensors: the new era of ... [https://pmc.ncbi.nlm.nih.gov/articles/PMC9909134/]
- 52. New immobilization method for SAW-biosensors: covalent ... [https://www.sciencedirect.com/science/article/abs/pii/S0956566398000876]
- 53. A Surface Acoustic Wave (SAW) biosensor method for ... [https://pubmed.ncbi.nlm.nih.gov/31202354/]
- 54. Development of an Aptamer-Based QCM-D Biosensor for ... [https://pubmed.ncbi.nlm.nih.gov/38920574/]
- 55. A Review of Quartz Crystal Microbalance-Based Mercury ... [https://pmc.ncbi.nlm.nih.gov/articles/PMC12390107/]
- 56. Utilizing layer-parameter of shear horizontal surface ... [https://pubs.rsc.org/en/content/articlelanding/2025/lc/d5lc00444f]
- 57. Design and characterization of surface acoustic wave ( ... [https://pubmed.ncbi.nlm.nih.gov/41006787/]
- 58. Editorial: Recent trends in acoustic sensor applications [https://ojs.acad-pub.com/index.php/SV/article/view/3188]
- 59. Recent Advances in Micro- and Nano-Enhanced Intravascular ... [https://pmc.ncbi.nlm.nih.gov/articles/PMC12349352/]
- 60. An advanced performance preservation method for surface ... [https://www.sciencedirect.com/science/article/pii/S1110016825009482]
- 61. High-Performance Piezoelectric Micro Diaphragm ... [https://pmc.ncbi.nlm.nih.gov/articles/PMC11959592/]
- 62. Machine learning approach to optimization of parameters ... [https://www.sciencedirect.com/science/article/pii/S2590137022000139]
- 63. Point-of-Care Testing - StatPearls - NCBI Bookshelf [https://www.ncbi.nlm.nih.gov/books/NBK592387/]
- 64. Comparison of the QCM and the SPR method for surface ... [https://www.sciencedirect.com/science/article/pii/0925400595850236]
- 65. Machine learning in point-of-care testing: innovations, ... [https://www.nature.com/articles/s41467-025-58527-6]
- 66. Surface acoustic wave based microfluidic devices for ... [https://pubs.rsc.org/en/content/articlehtml/2023/sd/d2sd00203e]
- 67. Surface Acoustic Waves (SAW)-Based Biosensing for ... [https://pmc.ncbi.nlm.nih.gov/articles/PMC4721826/]
- 68. Quartz Crystal Microbalance (QCM) [https://www.nanoscience.com/techniques/quartz-crystal-microbalance/]
- 69. The utilization and advancement of quartz crystal ... [https://www.sciencedirect.com/science/article/abs/pii/S0026265X24000791]
- 70. Recent advances of surface acoustic wave-based sensors ... [https://www.sciencedirect.com/science/article/abs/pii/S0958166922002130]
- 71. Recent Advances in SAW Sensors for Detection of Cancer ... [https://pmc.ncbi.nlm.nih.gov/articles/PMC11852368/]
- 72. Point-of-care biosensors for infectious disease diagnosis [https://pubs.rsc.org/en/content/articlehtml/2025/ra/d5ra03897a?page=search]
- 73. Fabrication of Surface Acoustic Wave Biosensors Using ... [https://www.mdpi.com/2673-687X/4/3/11]
- 74. Piezoelectric Chemosensors and Biosensors in Medical ... [https://pmc.ncbi.nlm.nih.gov/articles/PMC11940703/]
- 75. Metal organic and covalent organic framework-based QCM ... [https://www.sciencedirect.com/science/article/abs/pii/S0010854524005095]
- 76. New opportunities and challenges in ultra-sensitive gas ... [https://www.sciencedirect.com/science/article/abs/pii/S0010854524000377]
- 77. Opportunities in Acoustic Wave Biosensors Market 2025- ... [https://www.datainsightsmarket.com/reports/acoustic-wave-biosensors-921905]
- 78. A reusable QCM biosensor with stable antifouling nano- ... [https://www.sciencedirect.com/science/article/pii/S0956713524004122]
- 79. Development and Assessment of Regeneration Methods ... [https://pmc.ncbi.nlm.nih.gov/articles/PMC9138522/]
- 80. Surface Acoustic Wave (SAW) for Chemical Sensing ... [https://www.mdpi.com/1424-8220/17/12/2716]
- 81. Long-Term Stability of Polymer-Coated Surface Transverse ... [https://pmc.ncbi.nlm.nih.gov/articles/PMC5713134/]
- 82. Palm-size wireless piezoelectric immune-biosensing ... [https://www.sciencedirect.com/science/article/pii/S2666351125000166]
- 83. Surface Acoustic Wave (SAW) Biosensors Market ... [https://www.linkedin.com/pulse/surface-acoustic-wave-saw-biosensors-market-advanced-insights-qghbc/]
- 84. Piezoelectric Biosensors - an overview | ScienceDirect Topics [https://www.sciencedirect.com/topics/engineering/piezoelectric-biosensors]
- 85. Overview of Piezoelectric Biosensors, Immunosensors and DNA Sensors and Their Applications - PMC [https://pmc.ncbi.nlm.nih.gov/articles/PMC5873027/]
- 86. Bio-energy-powered microfluidic devices - PMC [https://pmc.ncbi.nlm.nih.gov/articles/PMC11672206/]
- 87. A Review of Piezoelectric and Magnetostrictive Biosensor Materials for Detection of COVID‐19 and Other Viruses - PMC [https://pmc.ncbi.nlm.nih.gov/articles/PMC7744850/]
- 88. An experimental study on the detection mechanism of 2 ... [https://www.nature.com/articles/s41598-025-12329-4]
- 89. Comparative Analysis of QCM and Electrochemical ... [https://www.mdpi.com/2079-6374/14/9/431]
- 90. SPR vs ELISA | Comparing techniques for biomolecular ... [https://nicoyalife.com/blog/spr-vs-elisa-comparing-techniques-for-biomolecular-detection/]
- 91. SPR vs. ELISA: SPR Guides Accurate ELISA Results [https://www.rapidnovor.com/spr-vs-elisa/]
- 92. The advantages and the limitations of LC-MS/MS and Elisa ... [https://www.biotrial.com/bioanalysis-lc-ms-ms-vs-elisa/]
- 93. Comparative study of SPR and ELISA methods based on ... [https://www.sciencedirect.com/science/article/abs/pii/S0956566308006143]
- 94. Comparison of Enzyme-Linked Immunosorbent Assay ... [https://pmc.ncbi.nlm.nih.gov/articles/PMC4848629/]
- 95. Foodborne pathogen detection using surface acoustic ... [https://pmc.ncbi.nlm.nih.gov/articles/PMC11577347/]
- 96. Recent Advances in SAW Sensors for Detection of Cancer ... [https://www.mdpi.com/2079-6374/15/2/88]
- 97. Effective utilization of quartz crystal microbalance as a tool ... [https://www.sciencedirect.com/science/article/abs/pii/S0924424721004854]
- 98. Nanoparticle-enabled portable biosensors for early ... [https://www.sciencedirect.com/science/article/pii/S2590137025001025]
- 99. Global Acoustic Wave Biosensors Market Growth 2025-2031 [https://infinitymarketresearch.com/report/acoustic-wave-biosensors-market/4758]
- 100. Quartz crystal microbalance [https://en.wikipedia.org/wiki/Quartz_crystal_microbalance]
- 101. Technology QCMD - QCM - SAW [https://awsensors.com/technology/]
- 102. Quartz Crystal Microbalance: Next-generation biosensor? [https://www.ptglab.com/news/blog/quartz-crystal-microbalance-next-generation-biosensor/?srsltid=AfmBOopH3yChOVbxr-ZIMdYcKGJzbJFw-mhnSr_tZabsnPrJAumArZPu]