Quartz Crystal Microbalance (QCM) Explained: Principles, Applications, and Advancements for Biomedical Research
This article provides a comprehensive exploration of Quartz Crystal Microbalance (QCM) technology, a highly sensitive, label-free analytical technique for real-time surface interaction analysis.
Quartz Crystal Microbalance (QCM) Explained: Principles, Applications, and Advancements for Biomedical Research
Abstract
This article provides a comprehensive exploration of Quartz Crystal Microbalance (QCM) technology, a highly sensitive, label-free analytical technique for real-time surface interaction analysis. Tailored for researchers, scientists, and drug development professionals, it covers the foundational physics of piezoelectricity and the Sauerbrey equation, details practical methodologies and diverse biomedical applications from biosensing to drug discovery, offers expert troubleshooting and optimization strategies for high-quality data, and presents a comparative analysis with other techniques. The content synthesizes current research and real-world case studies to serve as an essential guide for leveraging QCM in scientific and clinical innovation.
The Physics Behind QCM: From Piezoelectricity to Mass Sensing
The quartz crystal microbalance (QCM) represents a surface-sensitive analytical technique that exploits the piezoelectric properties of quartz crystals to detect minute mass changes with nanogram-level sensitivity. As a highly sensitive, online interface process analysis tool, QCM provides real-time, in-situ monitoring capabilities that have become indispensable across chemical, physical, and biological research domains. This technical guide examines the fundamental principles of QCM technology, its operational mechanisms, and its diverse applications in scientific research and drug development, providing researchers with a comprehensive framework for implementing QCM methodologies in their investigative workflows.
Fundamental Principles of QCM Operation
The Piezoelectric Effect in Quartz Crystals
The operational foundation of QCM technology rests upon the piezoelectric effect exhibited by α-quartz crystals. When mechanical stress is applied to a quartz crystal, it generates an electrical charge, and conversely, when an electrical field is applied, the crystal undergoes mechanical deformation. This reversible energy conversion between mechanical and electrical forms enables quartz crystals to function as highly stable resonant elements in microbalance systems [1].
Quartz crystals used in QCM systems are typically cut along specific crystallographic orientations, with the AT-cut being most common due to its excellent temperature stability in the operating range around room temperature. These crystal wafers are coated with electrodes on both sides and incorporated into an oscillatory circuit where they can be made to vibrate at their characteristic resonant frequency when an alternating current is applied [1]. The remarkable stability and precision of this vibration form the basis for the extraordinary mass sensitivity that defines QCM technology.
Mass Sensitivity and the Sauerbrey Equation
The core measuring principle of QCM relies on the relationship between mass deposited on the crystal surface and the resulting change in resonant frequency. As mass accumulates on the electrode surface, it increases the crystal's effective thickness, thereby decreasing its resonant frequency in a predictable manner. This relationship was first quantified by Sauerbrey, who established the fundamental equation that bears his name [1]:
Δf = -C_f × Δm
Where:
- Δf = Frequency change (Hz)
- C_f = Sensitivity constant of the crystal (Hz·cm²/ng)
- Δm = Mass change per unit area (ng/cm²)
For a 5 MHz crystal, typical sensitivity is approximately 17.7 ng/cm² per 1 Hz frequency change, enabling QCM to detect monomolecular layers and even sub-monolayer coverage with exceptional precision. The Sauerbrey equation applies rigorously under specific conditions: when the deposited mass is rigid, uniformly distributed, and sufficiently thin that it moves synchronously with the crystal oscillation. This makes it particularly valuable for characterizing thin, rigid films in vacuum or gas environments [1].
Extended Applications in Liquid Environments
When QCM operates in liquid environments, the interaction between the oscillating crystal and the adjacent liquid introduces additional complexities. The oscillation induces movement in the viscously coupled liquid layer immediately adjacent to the crystal surface, resulting in energy dissipation that provides valuable information about the viscoelastic properties of surface-adhered layers [1].
This discovery, pioneered by Kanazawa and Gordon, expanded QCM applications to biological systems, soft matter characterization, and interfacial phenomena in solution. In these liquid-phase applications, researchers monitor not only frequency shifts (Δf) but also energy dissipation changes (ΔD), which offer insights into the structural and mechanical properties of the adsorbed layers beyond simple mass measurements. This QCM with dissipation monitoring (QCM-D) has proven particularly valuable for studying biological systems where molecular layers may exhibit significant viscoelastic behavior rather than rigid characteristics [1].
Quantitative Analysis of QCM Performance Parameters
Table 1: QCM Frequency Ranges and Their Applications
| Frequency Range | Mass Sensitivity | Typical Applications | Key Considerations |
|---|---|---|---|
| <10 MHz | Lower sensitivity | Thicker film deposition, educational demonstrations | Robust measurements, less susceptible to environmental noise |
| 10-25 MHz | Moderate sensitivity | Routine laboratory analysis, environmental monitoring | Balance between sensitivity and operational stability |
| >25 MHz | Highest sensitivity | Monolayer detection, biological interactions, nanoscale phenomena | Increased noise susceptibility, requires stringent environmental control |
Table 2: QCM Detection Capabilities Across Application Domains
| Application Domain | Detection Limit | Measured Parameters | Complementary Data |
|---|---|---|---|
| Bio-sensing | 50 ng/mL (IgG antibodies) | Antigen-antibody binding kinetics, concentration | Affinity constants, dissociation rates |
| Environmental Monitoring | ppb levels (volatile compounds) | Gas concentration, adsorption/desorption rates | Selectivity patterns, sensor response times |
| Cell Adhesion Studies | Single-cell attachment | Attachment strength, spreading kinetics, viscoelastic properties | Cytoskeletal organization, receptor involvement |
Experimental Methodologies and Protocols
Standard QCM Experimental Setup
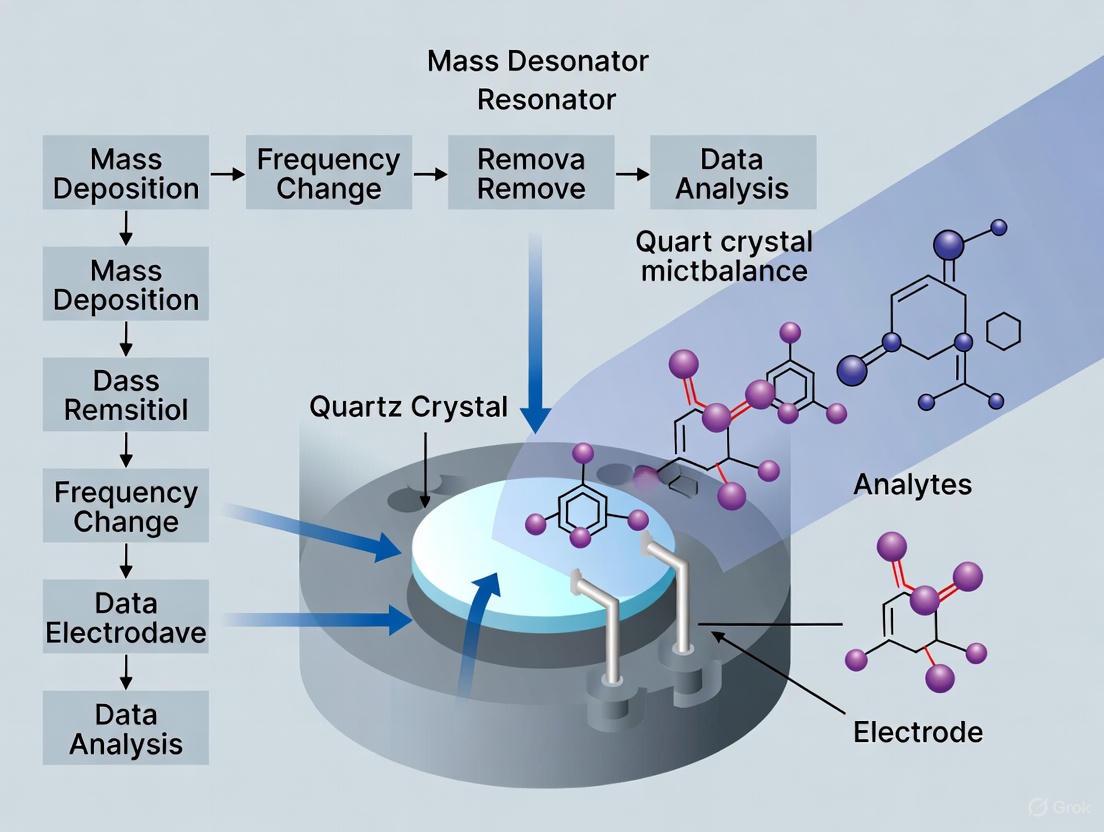
The fundamental QCM experimental apparatus consists of several key components: the quartz crystal sensor with metal electrodes, a crystal holder that maintains electrical contact while allowing controlled environment exposure, an oscillation circuit that drives the crystal at its resonant frequency, a frequency counter that precisely measures resonance parameters, and a computer interface for data acquisition and analysis. For advanced applications, especially in liquid environments, a dissipation monitoring module is incorporated to measure energy loss characteristics [1].
Experimental protocols begin with meticulous crystal preparation, including cleaning procedures to remove organic contaminants, followed by surface functionalization tailored to the specific application. For biological studies, this typically involves creating self-assembled monolayers with appropriate terminal functional groups that enable covalent attachment of recognition elements such as antibodies, enzymes, or DNA probes. Proper surface preparation is critical for ensuring reproducible results and minimizing non-specific binding that could compromise data interpretation [1].
Biomolecular Interaction Analysis Protocol
For investigating molecular interactions, such as antigen-antibody binding, a standardized protocol involves first establishing a stable baseline frequency in an appropriate buffer solution. The functionalized crystal surface is then exposed to a solution containing one interaction partner (e.g., the immobilized antibody's cognate antigen), during which real-time frequency and dissipation shifts are continuously recorded [2] [1].
Following the association phase, the system is rinsed with buffer to remove unbound molecules, enabling researchers to distinguish between specific binding and transient interactions. The resulting data provides quantitative information about binding kinetics (association and dissociation rates) and affinity constants, all without requiring fluorescent or radioactive labeling that might alter the natural behavior of the interacting molecules [2].
QCM Cell Adhesion Assay Protocol
In cell biological applications, QCM enables real-time monitoring of cell attachment and spreading on biomaterial surfaces. The protocol involves sterilizing the functionalized crystal, establishing a baseline in cell culture medium, and then introducing a cell suspension of defined density while continuously monitoring frequency and dissipation parameters [1].
As cells contact and adhere to the functionalized surface, the frequency decreases in response to the mass loading, while changes in dissipation reflect the development of focal adhesions and cytoskeletal organization. This approach provides unique insights into the dynamics of cell-surface interactions, which are crucial for understanding biocompatibility, tissue engineering scaffolds, and bacterial biofilm formation [1].
Research Reagent Solutions for QCM Applications
Table 3: Essential Research Reagents and Materials for QCM Experiments
| Reagent/Material | Function/Purpose | Application Examples |
|---|---|---|
| Functionalized Gold Chips | Provides surface for biomolecule immobilization | Antibody attachment, DNA probe immobilization |
| Self-Assembled Monolayer (SAM) Kits | Creates controlled surface chemistry | Thiol-based SAMs on gold surfaces for specific functional groups |
| Cross-linking Reagents | Covalently attaches biomolecules to surface | EDC-NHS chemistry for carboxyl-amine coupling |
| Blocking Buffers | Minimizes non-specific binding | BSA, casein, or specialty commercial blocking formulations |
| Regeneration Solutions | Removes bound analytes without damaging surface | Low pH buffers, high salt solutions, or mild detergents |
Advanced Applications in Research and Development
Pharmaceutical and Biomedical Applications
QCM technology has revolutionized several aspects of pharmaceutical research and biomedical diagnostics through its label-free detection capabilities. In drug development, QCM systems enable real-time monitoring of protein-drug interactions, antibody-antigen binding events, and the formation of ant-drug antibodies (ADAs) that can compromise therapeutic efficacy [2].
The technology's exceptional sensitivity allows detection of antibody concentrations as low as 50 ng/mL, making it valuable for immunogenicity assessment of biologic therapeutics. Furthermore, QCM serves as a vital tool in biosensor development for pathogen detection, with systems capable of identifying specific bacterial and viral targets through functionalization with appropriate recognition elements [2] [1].
Environmental Monitoring and Chemical Sensing
In environmental applications, QCM sensors functionalized with selective coatings serve as highly sensitive detectors for gases, volatile organic compounds, and airborne particulate matter. Researchers have developed polymer-modified QCM sensors that exhibit selective responses to specific analytes such as formaldehyde, mercury vapor, and various hydrocarbons through carefully engineered molecular recognition mechanisms [1].
The real-time monitoring capability of QCM makes it particularly valuable for tracking dynamic processes such as pollutant adsorption/desorption, degradation kinetics, and the efficiency of filtration systems. These applications leverage the technology's ability to operate continuously under diverse environmental conditions while providing quantitative data on concentration changes and reaction rates [1].
Materials Science and Nanotechnology
In materials research, QCM provides unprecedented insights into thin film formation processes, polymer swelling behavior, nanoparticle deposition, and the structural evolution of advanced materials. The technique has proven particularly valuable for characterizing the enzymatic hydrolysis of cellulose, providing real-time data on cellulose-cellulase interactions that inform biofuel production optimization [1].
The capacity to monitor these processes in various environments (air, liquid, vacuum) while simultaneously tracking multiple parameters (mass, viscoelastic properties, structural rearrangements) makes QCM an indispensable tool for understanding fundamental materials behavior and guiding the development of next-generation nanomaterials with tailored properties [1].
Technological Variations and Methodological Advances
QCM with Dissipation Monitoring (QCM-D)
The integration of dissipation monitoring represents a significant advancement in QCM technology, providing crucial information about the viscoelastic characteristics of surface-adhered layers beyond simple mass measurements. In QCM-D systems, the oscillation circuit is periodically interrupted, and the exponential decay of the crystal's vibration is analyzed to determine the energy dissipation factor [1].
This approach enables researchers to distinguish between rigid masses that obey the Sauerbrey relationship and soft, hydrated films that exhibit significant internal energy loss. This capability has proven particularly valuable for studying biological systems including protein conformational changes, cell adhesion mechanics, and the formation of extracellular matrices, where the structural properties are as important as the total mass deposited [1].
Advanced QCM Systems and Comparative Analysis
Table 4: QCM Technology Variations and Their Characteristics
| Technology Type | Key Differentiating Features | Optimal Application Scenarios |
|---|---|---|
| Traditional QCM | Mass sensitivity based on frequency shift only | Gas-phase measurements, rigid thin films |
| QCM-D | Additional dissipation monitoring for viscoelasticity | Soft matter, biological layers, hydrated systems |
| Electrochemical QCM (EQCM) | Combined with electrochemical working electrode | Electropolymerization, corrosion studies, battery research |
| High-Temperature QCM | Specialized designs for elevated temperatures | Catalysis studies, thermal stability assessments |
Visualization of QCM Operational Principles
Future Perspectives and Research Directions
The future development of QCM technology focuses on enhancing sensitivity and specificity while expanding application domains. Key research directions include the development of novel sensor coatings with improved molecular recognition capabilities, miniaturization for portable monitoring applications, and integration with complementary analytical techniques such as surface plasmon resonance (SPR) and electrochemical methods [3] [1].
Advancements in data analysis algorithms and the incorporation of artificial intelligence for pattern recognition promise to extract more sophisticated information from QCM responses, particularly in complex biological systems where multiple simultaneous interactions occur. Additionally, the push toward standardization and validation of QCM methodologies will facilitate their broader adoption in regulated environments such as pharmaceutical quality control and clinical diagnostics [2] [4].
The growing emphasis on personalized medicine and point-of-care diagnostics positions QCM technology as a valuable platform for rapid, label-free biomarker detection that could transform disease diagnosis and therapeutic monitoring. As these trends converge with ongoing technical improvements in sensitivity, throughput, and usability, QCM is poised to expand its impact across the scientific and clinical landscape [2].
The quartz crystal microbalance (QCM) is a highly sensitive analytical tool that measures minute mass changes on a sensor surface, with applications spanning from drug development to environmental monitoring. Its operational core is the thickness-shear mode (TSM) oscillation, a resonant vibration enabled by the piezoelectric properties of quartz crystal. This whitepaper provides an in-depth technical examination of TSM oscillation, detailing the fundamental principles that govern its function, the critical relationship between resonant frequency and mass loading, and its practical implementation in both research and industry. By exploring the underlying physics, quantitative models, and experimental methodologies, this guide serves as a comprehensive resource for researchers and scientists seeking to understand and utilize QCM technology effectively.
The Quartz Crystal Microbalance (QCM) is a mass-sensing platform renowned for its exceptional sensitivity, capable of detecting mass changes at the nanogram level [5] [6]. Originally developed for vacuum deposition monitoring, its applications have expanded dramatically to include the study of protein adsorption, polymer cross-linking, cellular adhesion, and biosensing in liquid environments [6] [7] [8]. The technology's versatility, real-time monitoring capability, and label-free nature make it indispensable in modern laboratories.
At the heart of every QCM measurement is a disc-shaped sensor made from AT-cut quartz crystal, a specific crystallographic orientation known for its stability and pure shear motion [9] [10]. This sensor is sandwiched between two metal electrodes that apply an alternating electric field. Due to the direct piezoelectric effect, inherent to quartz, this electrical input causes a mechanical deformation of the crystal lattice [9] [5]. When the applied alternating current (AC) voltage matches the crystal's innate resonant frequency, the quartz disk enters a state of sustained, efficient oscillation known as thickness-shear mode (TSM) [5]. In this mode, the two faces of the crystal disk move in an anti-parallel, sliding motion parallel to the crystal's surface, generating a transverse shear wave that propagates through its thickness [9] [10]. This precise mechanical oscillation is the "engine" of the QCM, translating minute interactions at the sensor surface into quantifiable electronic signals.
Fundamental Principles of Thickness-Shear Mode Oscillation
Piezoelectricity and the AT-Cut Quartz Crystal
The foundation of TSM oscillation is the piezoelectric property of quartz. Piezoelectric materials generate an electrical charge in response to applied mechanical stress and, conversely, undergo mechanical deformation when subjected to an electric field [9] [5]. This reversible energy conversion is possible because quartz's crystal lattice lacks a center of symmetry, allowing charge separation under strain [9].
Not all quartz cuts produce a usable TSM oscillation. The AT-cut quartz crystal is the industry standard, produced by wafering the bulk crystal at an angle of approximately 35° relative to the z-axis [9]. This specific cut is critical because it:
- Produces a pure thickness-shear mode upon electrical excitation, meaning the crystal faces slide in-plane relative to each other [9] [10].
- Exhibits excellent temperature stability around room temperature, with a minimal frequency drift of approximately 1-3 Hz/°C [9]. This stability is crucial for obtaining reliable data, especially in sensitive measurements.
Resonance and the Generation of Shear Waves
When an alternating voltage is applied across the metal electrodes, the quartz crystal disk rhythmically deforms and relaxes. The resonant frequency (f₀) is the specific frequency at which the crystal oscillates with maximum amplitude and efficiency, and it is fundamentally determined by the crystal's physical properties [9] [5]. The relationship is given by:
f₀ = n · υ_q / (2h) [5]
Where:
υ_qis the speed of sound in quartzhis the thickness of the crystal disknis the harmonic number (1, 3, 5, ...)
This equation reveals a key design constraint: the higher the desired fundamental resonant frequency, the thinner the quartz crystal must be [5] [10]. For instance, a standard 5 MHz QCM sensor has a thickness of approximately 330 μm [9]. This relationship between thickness and frequency is the origin of the "thickness-shear" nomenclature.
The resulting wave is a transverse shear wave, where particle displacement is perpendicular to the direction of wave propagation. In a liquid environment, this shear wave penetrates the adjacent liquid but is severely damped, typically decaying within a few hundred nanometers (e.g., ~178 nm for a 10 MHz crystal in water) [6]. This shallow penetration makes the QCM predominantly sensitive to interactions occurring very close to the sensor surface.
Harmonics and Energy Trapping
QCM sensors do not oscillate at a single frequency but support a series of resonant harmonics. These are odd integer multiples of the fundamental frequency (e.g., 3rd, 5th, 7th) [9]. The geometry of the AT-cut crystal specifically supports these odd-numbered harmonics. Each harmonic has a distinct penetration depth into the sample; higher harmonics probe progressively shallower depths and have narrower distributions of oscillation amplitude across the sensor surface [9]. Comparing the frequency responses across multiple harmonics is a powerful diagnostic tool, enabling researchers to determine if an adsorbed layer behaves as a simple, rigid mass or possesses complex, soft, and viscoelastic properties [9].
A critical design feature for stable operation, particularly in liquids, is energy trapping. This is achieved by making the electrode area on the quartz disk thinner and heavier than the surrounding, unplated region. This creates a lower cutoff frequency in the plated, active region compared to the surrounding area [10]. Consequently, the acoustic shear wave is trapped and confined beneath the electrodes, preventing energy from leaking laterally and ensuring a strong, stable resonance [10]. Proper energy trapping is essential for maximizing the quality factor (Q-factor) of the resonance, which directly determines the sensor's resolution and its ability to detect minute frequency shifts.
The Gravimetric Principle: From Oscillation to Mass Sensing
The Sauerbrey Equation
The fundamental principle of QCM gravimetry is that any mass rigidly coupled to the sensor surface will increase the effective oscillating mass, thereby lowering the system's resonant frequency. In 1959, Günter Sauerbrey quantified this relationship, formulating the seminal Sauerbrey equation [9] [5] [11]. For a thin, rigid, and uniformly adsorbed film, the areal mass density (Δm) is directly proportional to the observed frequency shift (Δf):
Δm = - (C · Δf) / n or, in its common form, Δf = - (2 f₀² Δm) / (A √(ρ_q μ_q)) [9] [6] [11]
Where:
Δfis the measured frequency shift (Hz)Δmis the change in mass per unit area (ng/cm²)Cis the mass sensitivity constant specific to the crystalnis the overtone numberf₀is the fundamental resonant frequency of the unloaded crystal (Hz)Ais the piezoelectrically active area (cm²)ρ_qis the density of quartz (2.648 g/cm³)μ_qis the shear modulus of quartz (2.947×10¹¹ g·cm⁻¹·s⁻²) [6]
The equation demonstrates that the mass sensitivity of a QCM scales with the square of the resonant frequency. Therefore, a 25 MHz sensor is significantly more sensitive than a 5 MHz sensor [10]. For a standard 5 MHz sensor, the mass sensitivity is approximately ~4.4 ng·cm⁻² per 1 Hz frequency change [6]. The Sauerbrey equation is the cornerstone of QCM operation in gas phases and for rigid, thin films in liquid.
Beyond Rigid Mass: The Role of Viscoelasticity and Liquid Damping
The Sauerbrey model assumes a rigid, non-slipping mass. However, many real-world samples, such as proteins, polymers, and cells, form soft, viscoelastic layers that dissipate vibrational energy [9] [6]. When such a material is deposited on the sensor, it does not oscillate perfectly in sync with the crystal. Internal friction and flow within the soft layer cause energy loss, which the basic Sauerbrey equation cannot account for, leading to inaccurate mass calculations [9].
Furthermore, when a QCM is operated in a liquid, the viscosity of the liquid itself damps the oscillation. The frequency shift (Δf) in a liquid is also influenced by the liquid's density (ρ_L) and viscosity (η_L), as described by the Kanazawa-Gordon equation:
Δf ≈ - f₀^(3/2) √(ρ_L η_L / (π ρ_q μ_q)) [6]
This viscous damping effect must be considered for any measurement performed in a liquid environment.
To address these complexities, the QCM with Dissipation Monitoring (QCM-D) technique was developed. This advanced method not only tracks the resonant frequency (f) but also measures the energy dissipation (D) [9]. The dissipation factor quantifies how quickly the oscillation decays once the driving power is switched off—a process known as ring-down [9]. A soft, dissipative layer will cause a rapid decay (high ΔD), while a rigid layer will result in a slow decay (low ΔD). By simultaneously monitoring Δf and ΔD across multiple harmonics, QCM-D provides a powerful means to distinguish between rigid and viscoelastic films and to extract accurate quantitative data, including the hydrated mass, thickness, and viscoelastic modulus of the adsorbed layer [9] [6].
Table 1: Key Quantitative Relationships in QCM Operation
| Equation Name | Formula | Key Parameters | Application Context |
|---|---|---|---|
| Resonant Frequency | f₀ = n · υ_q / (2h) [5] |
h = crystal thickness, n = harmonic |
Determines the base operating frequency of the sensor. |
| Sauerbrey (Mass Load) | Δf = - (2 f₀² Δm) / (A √(ρ_q μ_q)) [9] [6] |
Δm = areal mass density, ρ_q = 2.648 g/cm³, μ_q = 2.947×10¹¹ g·cm⁻¹·s⁻² [6] |
Thin, rigid, and uniformly adsorbed films in air or vacuum. |
| Kanazawa-Gordon (Liquid Load) | Δf ≈ - f₀^(3/2) √(ρ_L η_L / (π ρ_q μ_q)) [6] |
ρ_L = liquid density, η_L = liquid viscosity |
Describes frequency shift due to contact with a Newtonian fluid. |
Experimental Implementation and Protocols
A Standard QCM Experimental Workflow
Implementing QCM technology requires careful attention to experimental design. The following workflow outlines a typical experiment for studying molecular adsorption, such as protein binding, using a QCM-D instrument.
Step 1: Sensor Preparation and Functionalization The gold electrodes of a standard QCM sensor are often modified to create a specific binding surface. This can involve cleaning with a UV-ozone cleaner or plasma, followed by functionalization with self-assembled monolayers (SAMs) of alkanethiols, or coating with specific polymer layers or biorecognition elements (e.g., antibodies) [6]. The sensor is then mounted in the flow module of the QCM-D instrument.
Step 2: Baseline Acquisition
A stable baseline for both frequency (f) and dissipation (D) is established by flowing a pure buffer solution through the module at a constant temperature and flow rate. Strict temperature control (≤ 0.1 °C) is critical, as temperature fluctuations can cause significant frequency drift [9].
Step 3: Sample Introduction and Association
The sample solution (e.g., protein, polymer) is introduced into the flow system. The real-time changes in Δf and ΔD are monitored as molecules adsorb to the sensor surface. The flow is stopped if the adsorption kinetics themselves are being studied.
Step 4: Rinsing The system is rinsed with buffer to remove loosely bound or non-specifically adsorbed molecules. The remaining frequency shift corresponds to the stably adsorbed mass.
Step 5: Data Analysis
The raw Δf and ΔD data from multiple overtones is fitted to an appropriate physical model (e.g., a viscoelastic film model) using the instrument's software to extract physical parameters like adsorbed mass, film thickness, and shear modulus [9] [8].
Case Study: Monitoring Polymer Cross-Linking
A study by Monta et al. (2018) effectively demonstrates the use of QCM to characterize the viscoelastic properties of polydimethylsiloxane (PDMS) during cross-linking from a liquid to a solid state [8].
- Sensor: A standard 5 MHz AT-cut quartz crystal with gold electrodes was used [8].
- Methodology: The uncross-linked liquid PDMS precursor was deposited directly onto the sensor. The QCM's electrical impedance was analyzed using a network analyzer to track the resonance throughout the cross-linking process at various temperatures (25°C, 50°C, 80°C) [8].
- Key Findings: The technique successfully monitored the evolution of the complex shear modulus of PDMS. It revealed that the cross-linking kinetics and the final viscoelastic properties of the polymer were highly dependent on the curing temperature [8]. This showcases the QCM's unique capability for non-destructive, in-situ characterization of material transitions.
Case Study: Sensing Neuronal Adhesion
Research has been conducted to develop microscale TSM resonators for monitoring the adhesion of small populations of neurons, which is vital for understanding neural interfaces and neurophysiology [10].
- Sensor Design Challenge: Conventional TSM sensors have large sensing areas (5-7 mm electrodes) suitable for hundreds of thousands of cells. To study hundreds of neurons, the active electrode area was miniaturized to diameters of 150-400 μm, which required resonant frequencies of 42-90 MHz [10].
- Protocol: The sensitivity was enhanced by modifying the microelectrode surface with single-walled carbon nanotubes (SWCNTs) to promote neuronal adhesion. The sensors were then characterized in liquid to optimize the Q-factor and eliminate unwanted inharmonic modes before being used to monitor neuronal adhesion in real-time [10].
Table 2: The Scientist's Toolkit - Essential Materials and Reagents for QCM Research
| Item / Reagent | Function / Application | Technical Notes |
|---|---|---|
| AT-cut QCM Sensors | Core piezoelectric transducer. | Typically with gold electrodes; available in various fundamental frequencies (5-25+ MHz) and diameters [9] [10]. |
| Self-Assembled Monolayer (SAM) Kits | Functionalize gold surface for specific biomolecular interactions. | Often alkanethiols with terminal groups like -COOH, -OH, or -EG for creating a bio-inert or reactive surface [6]. |
| Single-Walled Carbon Nanotubes (SWCNTs) | Nano-coating to enhance cell adhesion and sensor sensitivity. | Used in specialized applications like neuronal adhesion studies to modify the electrode surface [10]. |
| Buffer Solutions (e.g., PBS) | Provide a stable, physiologically relevant liquid environment. | Must be particle-free to avoid clogging the flow system; temperature control is critical [9]. |
| QCM-D Instrumentation | Core hardware and software for driving the sensor and collecting frequency/dissipation data. | Enables real-time, label-free monitoring of interactions at the sensor surface [9]. |
Advanced Applications in Research and Industry
The unique capabilities of TSM-based sensors have led to their adoption in a wide array of advanced applications.
- Protein and Peptide-Based Drug Development: QCM is extensively used to study protein aggregation, a major concern in biopharmaceuticals that can impact drug efficacy and safety [6]. It is also employed to analyze the stability of protein formulations, interactions with primary packaging materials, and the binding kinetics of therapeutic proteins to their targets [6].
- Environmental Monitoring: QCM sensors have been engineered as highly sensitive mercury detectors (QCM-Hg). These devices utilize the direct amalgamation reaction between mercury vapor and the gold electrode, with mass uptake causing a measurable frequency drop. This system can achieve a detection limit of approximately 1 µg/m³ in air and 0.05 µg/L in water after a reduction-vaporization step, making it suitable for on-site environmental and occupational monitoring [11].
- High-Frequency Rheology: The QCM operates in the MHz frequency range, allowing researchers to perform viscoelastic spectroscopy on extremely thin polymer films, even down to monolayers. This provides insights into material properties at high frequencies that are inaccessible to conventional low-frequency rheometers [7] [8].
- Cellular Studies: The QCM-D response can provide information on cell adhesion, morphology, and the dynamics of biofilm formation. The technique is sensitive to the structural changes and adhesion strength of cells attached to the functionalized sensor surface [7] [10].
The thickness-shear mode oscillation is the fundamental physical principle that enables the remarkable sensitivity and versatility of the quartz crystal microbalance. From its basis in the piezoelectric effect of AT-cut quartz to the confinement of acoustic energy through energy trapping, TSM oscillation provides a robust platform for translating nanoscale interfacial events into measurable electronic signals. While the Sauerbrey equation provides a straightforward relationship for rigid mass uptake, the development of QCM-D has unlocked the ability to study complex, soft, and viscoelastic materials by simultaneously measuring frequency and energy dissipation.
The technology's power is evidenced by its wide-ranging impact, from ensuring the safety and efficacy of biologic drugs by monitoring protein aggregation to enabling the detection of toxic environmental contaminants like mercury. As sensor design advances, pushing towards higher frequencies and smaller active areas, the spatial resolution and sensitivity of QCM will only increase, opening new frontiers in the study of smaller cell populations and single-molecule interactions. For researchers and drug development professionals, a deep understanding of TSM oscillation is not merely academic—it is essential for harnessing the full potential of the QCM as a powerful tool for interfacial analysis.
The Quartz Crystal Microbalance (QCM) is a highly sensitive piezoelectric mass-sensing technology capable of measuring nanogram-level mass changes on a surface. A fundamental component of QCM data analysis is the Sauerbrey equation, which establishes a direct correlation between the resonant frequency shift of an oscillating quartz crystal and the mass deposited on its surface [12] [13]. This linear relationship, formulated by Günter Sauerbrey in 1959 during his doctoral studies, enables QCMs to function as ultrasensitive balances in various research and application fields [12] [13]. This technical guide explores the Sauerbrey equation's principles, applicability, and implementation, framed within broader QCM research, particularly for drug development professionals and scientists.
Theoretical Foundation of the Sauerbrey Equation
Fundamental Principle and Derivation
The core operating principle of a QCM is the inverse piezoelectric effect. An AT-cut quartz crystal, when subjected to an alternating voltage, undergoes mechanical shear deformation at its resonant frequency [14]. The Sauerbrey equation treats any thin, rigid mass attached to the crystal surface as an extension of the oscillating quartz crystal itself [12] [13]. The fundamental equation is expressed as:
Where:
- Δm is the change in mass per unit area (e.g., in ng/cm²).
- Δf is the observed change in the resonant frequency (in Hz).
- C is the mass sensitivity constant specific to the quartz crystal.
- n is the harmonic number (1, 3, 5, ...) of the resonant frequency [12].
An alternative, physically detailed form of the equation is:
Δf = – [2 f₀² / (A √(ρᵩ μᵩ))] Δm [16] [13]
Where:
- f₀ is the fundamental resonant frequency of the crystal.
- A is the piezoelectrically active area of the crystal.
- ρᵩ is the density of quartz (approximately 2.648 g/cm³).
- μᵩ is the shear modulus of quartz (approximately 2.947 × 10¹¹ g/(cm s²)) [13].
The negative sign in both forms indicates that an increase in mass (Δm) on the crystal surface results in a decrease of the resonant frequency (Δf).
The Mass Sensitivity Constant (C)
The mass sensitivity constant C is a critical parameter that depends on the physical and piezoelectric properties of the quartz crystal [12]. For a standard 5 MHz AT-cut quartz crystal, the Sauerbrey constant C is 17.7 ng/(cm²•Hz) [12] [15]. This value implies that a frequency shift of 1 Hz corresponds to a mass change of 17.7 ng per square centimeter on the crystal surface. This constant forms the basis for highly sensitive, calibration-free mass measurements under appropriate conditions.
Key Parameters and Their Quantitative Values
Table 1: Key Parameters in the Sauerbrey Equation
| Parameter | Symbol | Typical Value/Example | Role in the Equation |
|---|---|---|---|
| Fundamental Frequency | f₀ | 5 MHz, 10 MHz [12] [16] | Determines the baseline sensitivity of the crystal. |
| Frequency Shift | Δf | Measured in Hz | The primary measured variable indicating mass change. |
| Mass Change | Δm | Calculated in ng/cm² | The target output variable for mass quantification. |
| Mass Sensitivity Constant | C | 17.7 ng/(cm²•Hz) for a 5 MHz crystal [12] | Converts the frequency shift into a mass change. |
| Harmonic Number | n | Odd integers (1, 3, 5...) [12] | Accounts for the overtone being measured. |
| Quartz Density | ρᵩ | ≈ 2.648 g/cm³ [13] | A physical property of quartz used in the fundamental derivation. |
| Quartz Shear Modulus | μᵩ | ≈ 2.947 × 10¹¹ g/(cm s²) [13] | A physical property of quartz used in the fundamental derivation. |
Applicability and Limitations of the Sauerbrey Equation
Ideal Conditions for Application
The Sauerbrey equation is not universally applicable to all QCM measurements. Its validity is strictly confined to specific conditions where the deposited film closely mimics the behavior of the quartz crystal itself. The model assumes the added layer is a rigid, thin, and firmly attached extension of the crystal [12] [15]. The following conditions must be met:
- Thin and Rigid Films: The adsorbed layer must be sufficiently thin and rigid so it does not undergo internal deformation or viscous flow. The layer must oscillate synchronously with the crystal surface without energy dissipation [12].
- Firmly Attached: The film must be tightly coupled to the electrode surface to ensure no slip occurs during oscillation [12].
- Small Mass Load: The frequency shift Δf should be much less than the fundamental frequency f₀. The equation becomes invalid for frequency changes greater than 5% of f₀ [13].
In practice, these conditions are often met by thin, rigid metal films deposited in vacuum or by certain firmly adsorbed biomolecular layers in air [17].
Limitations and When to Seek Alternative Models
Deviating from the ideal conditions leads to inaccuracies if the Sauerbrey equation is applied. It is crucial to recognize these scenarios:
- Soft or Viscoelastic Films: If the adsorbed layer is soft, viscous, or viscoelastic (e.g., polymer hydrogels, lipid bilayers, or thick protein layers), it will dissipate vibrational energy. This leads to a frequency shift that does not solely correlate with mass, causing the Sauerbrey equation to underestimate the true mass [12] [17].
- Thick Films: As the film thickness increases, the shear wave propagating from the crystal surface may not fully penetrate the layer. The film can no longer be treated as a rigid extension of the crystal [17].
- Operation in Liquid Environments: When a QCM is immersed in a liquid, the viscosity and density of the liquid itself cause a significant frequency shift, as described by the Kanazawa-Gordon equation [13]. While the Sauerbrey equation can sometimes be applied to films adsorbed from a liquid, the non-rigid nature of the hydration shell often requires more complex modeling [14] [17].
Assessing Applicability in QCM Experiments
Modern QCM systems, especially QCM with Dissipation (QCM-D), provide the necessary data to assess whether the Sauerbrey equation is applicable. The assessment is based on the energy loss or dissipation (D) of the oscillator [12] [17].
- Low Dissipation: If the frequency shift is accompanied by a very small change in dissipation, it indicates a rigid film with minimal energy loss. This is a strong indicator that the Sauerbrey equation is valid [17].
- Overlapping Overtones: For a rigid, Sauerbrey-like film, the normalized frequency shifts (Δf/n) measured at different overtones (n = 3, 5, 7...) will overlap closely. If the normalized shifts diverge, it suggests viscoelastic behavior, and a viscoelastic model must be used for accurate characterization [12].
The following decision flowchart guides researchers in determining the appropriate data analysis model based on their experimental data.
Advanced Considerations in Practical Applications
The Impact of Electrode Materials
The standard Sauerbrey equation assumes mass sensitivity is independent of electrode geometry and material [13]. However, recent research demonstrates that the electrode material significantly influences mass sensitivity due to its effect on the Gaussian distribution of the acoustic wave energy across the electrode surface [16].
Theoretical and experimental studies comparing 10 MHz QCMs with gold (Au) and silver (Ag) electrodes show that:
- The absolute mass sensitivity at the center of a gold-electrode QCM (Au-QCM) is 3.84 Hz/ng, while for a silver-electrode QCM (Ag-QCM) it is 3.11 Hz/ng [16].
- Therefore, Au-QCMs exhibit higher mass sensitivity than Ag-QCMs [16].
- This difference in sensitivity is not proportional to the density of the electrode material. This indicates that for highly accurate quantitative analysis, the influence of the electrode material must be considered, especially as manufacturers may use different materials to control costs [16].
Equivalent Mass Sensitivity for Non-Uniform Layers
For mass loads that are not perfectly uniform, the Equivalent Mass Sensitivity Model provides a more accurate calculation. This model integrates the Gaussian sensitivity distribution S_f(r) across the specific area where the mass is attached [16]:
Δf = – C_QCM* × Δm
Where the equivalent mass sensitivity constant C_QCM* is defined as:
CQCM* = (1 / (π rd²)) ∫₀^{rd} 2πr Sf(r) dr
Here, r_d is the radius of the circular mass load [16]. This approach is crucial for applications where the adsorption is confined to a specific region smaller than the electrode itself.
Experimental Protocols and Data Interpretation
A Generalized Workflow for QCM Mass Adsorption Studies
The following diagram outlines a standard experimental workflow for a QCM mass adsorption study, from sensor preparation to data modeling.
Detailed Experimental Protocol: Protein Adsorption Study
The following protocol, adapted from a JoVE journal article, details the steps for studying protein adsorption using QCM-D [17].
- Objective: To quantify the mass of collagen protein adsorbed onto a gold-coated QCM sensor and characterize the rigidity of the formed layer.
Materials:
- QCM-D instrument with flow modules.
- AT-cut quartz crystals (e.g., 5 MHz) with gold electrodes.
- Rat tail collagen Type I solution.
- Acetic acid buffer (0.1 M, pH 5.6).
- Cleaning solutions: Ammonia, hydrogen peroxide, deionized water.
Procedure:
- Sensor Cleaning:
- Place the gold sensor active-side-up in a UV/ozone chamber for 10 minutes.
- Prepare a hot (75°C) mixture of deionized water, ammonia (25%), and hydrogen peroxide (30%) in a 5:1:1 ratio. Immerse the sensor for 5 minutes [17].
- Rinse thoroughly with deionized water and dry with a nitrogen stream.
- Repeat the UV/ozone treatment for another 10 minutes [17].
- Solution Preparation:
- Dilute the rat tail collagen stock solution in the 0.1 M acetic acid buffer to a final concentration of 10 µg/mL [17].
- QCM-D Measurement:
- Mount the cleaned sensor in the QCM-D chamber.
- Introduce the pure acetic acid buffer at a constant flow rate to establish a stable frequency and dissipation baseline.
- Switch the flow to the 10 µg/mL collagen solution for a sufficient time to allow for adsorption and saturation.
- Finally, switch the flow back to the pure buffer to rinse away any loosely bound molecules.
- Data Analysis:
- Monitor the frequency (Δf) and dissipation (ΔD) shifts at multiple overtones (e.g., 3rd, 5th, 7th).
- If the ΔD is small and the normalized Δf/n values overlap across overtones, the Sauerbrey equation is applicable.
- Use the Sauerbrey equation with the appropriate constant (C) to calculate the adsorbed mass density.
- Sensor Cleaning:
The Scientist's Toolkit: Essential Research Reagents and Materials
Table 2: Key Research Reagents and Materials for QCM Experiments
| Item | Function/Description | Example in Protocol |
|---|---|---|
| AT-cut Quartz Crystals | The piezoelectric sensor. Often pre-coated with electrodes (Gold is common). | Gold-coated 5 MHz QCM sensors [17]. |
| QCM Instrument | The electronic system that drives the crystal oscillation and measures f and D. | QCM-D system with a flow chamber [17]. |
| Buffer Solutions | Provide a stable ionic and pH environment; used for dilution and baseline. | 0.1 M Acetic Acid Buffer, pH 5.6 [17]. |
| Analytes/Adsorbates | The molecules of interest whose interaction with the surface is being studied. | Rat tail collagen Type I solution [17]. |
| Cleaning Reagents | Critical for removing contaminants to ensure a reproducible surface. | UV/Ozone, "Piranha" solution (NH₄OH/H₂O₂/H₂O) [17]. |
| Functionalization Chemistries | Used to modify the sensor surface with specific binding sites (e.g., antibodies). | Not used in the simple adsorption example, but essential for biosensing. |
The Sauerbrey equation remains the cornerstone of quantitative mass analysis in QCM technology. Its elegant simplicity provides a powerful, calibration-free method for determining mass changes of thin, rigid films. However, a deep understanding of its stringent applicability conditions is paramount for accurate data interpretation. Researchers must be vigilant in assessing film properties through dissipation and overtone analysis to decide between the Sauerbrey equation and more complex viscoelastic models. As QCM technology continues to evolve, particularly in biological and soft matter applications like drug development, the principles governing the Sauerbrey equation serve as the essential foundation upon which sophisticated, multi-parameter surface interaction analysis is built.
The Quartz Crystal Microbalance (QCM) has long served as a powerful tool for label-free, real-time monitoring of mass adsorption at surfaces. Traditional QCM interpretation relied heavily on the Sauerbrey equation, which establishes a direct, linear relationship between the change in the sensor's resonant frequency (Δf) and the mass of an adsorbed layer. However, this model operates on a critical assumption: that the adsorbed layer is infinitely thin, rigid, and uniformly distributed, experiencing no energy loss during oscillation [18]. While effective for stiff, thin films in gas phases, this "rigid mass" paradigm proves insufficient for characterizing the soft, hydrated, and viscoelastic materials frequently encountered in biological and polymer sciences, such as protein aggregates, living cells, and hydrogels [6] [19].
Quartz Crystal Microbalance with Dissipation Monitoring (QCM-D) shatters this limitation by introducing energy dissipation as a second, equally critical measured parameter. Dissipation (D) quantifies the damping, or energy loss, in the oscillating system, which occurs when an adsorbed material is soft and viscoelastic [20]. The simultaneous, real-time measurement of both frequency (Δf) and dissipation (ΔD) shifts provides a rich dataset that moves analysis beyond simple mass quantification toward a comprehensive assessment of the structural and mechanical properties of the adsorbed layer [21] [22]. This technical guide explores the core principles, experimental protocols, and data analysis strategies for leveraging QCM-D to unlock these advanced insights, with a particular emphasis on applications in drug development and biomaterial research.
Theoretical Foundations: From Mass Sensing to Viscoelastic Profiling
The Core Principle of QCM-D
The active component of a QCM-D is an AT-cut quartz crystal disk sandwiched between two electrodes. Applying an alternating voltage induces a shear oscillation at the crystal's resonant frequency. In the QCM-D method, this driving voltage is periodically switched off, and the exponential decay of the oscillation—the "ring-down"—is recorded [20]. The resonant frequency (f) and the dissipation factor (D) are extracted from this decay. The dissipation factor is defined as the ratio of energy dissipated per oscillation cycle to the total energy stored in the system [20]. When a material adsorbs to the sensor surface, it alters both the frequency and the dissipation of the crystal. A decrease in frequency typically indicates mass uptake, while an increase in dissipation signals the adsorption of a soft, viscoelastic layer that dampens the oscillation [19].
Key Signatures of a Viscoelastic Layer in Raw Data
Interpreting QCM-D data begins with a careful observation of the raw Δf and ΔD signals. Specific signatures in this data immediately indicate whether the Sauerbrey equation is applicable or if viscoelastic modeling is required.
- Dissipation Shift (ΔD) > 0: A measurable, positive ΔD is the primary indicator that the adsorbed layer is inducing energy losses, a hallmark of soft materials [18].
- Spreading Harmonics: A QCM-D sensor oscillates at multiple frequencies, or overtones (e.g., the 3rd, 5th, 7th, etc., harmonic). For a rigid, Sauerbrey-like film, the normalized frequency shift (Δf/n) is identical for all overtones. In contrast, a soft, viscoelastic film causes the Δf/n and ΔD values to "spread," meaning they differ significantly between overtones [18]. This spreading occurs because higher overtones have shorter penetration depths for the acoustic wave, making them more sensitive to the rheological properties of the film.
The following table summarizes the key differences in the response of a rigid versus a viscoelastic film.
Table 1: Characteristic QCM-D Responses for Different Film Types
| Parameter | Rigid, Thin Film (Sauerbrey) | Soft, Viscoelastic Film |
|---|---|---|
| Dissipation Shift (ΔD) | ≈ 0 | > 0 |
| Normalized Frequency Shifts (Δf/n) | Overlap for all overtones | Spread for different overtones |
| Primary Data Model | Sauerbrey Equation | Viscoelastic Model (e.g., Voigt) |
| Measured Mass | "Dry Mass" | "Hydrodynamic Mass" (includes trapped solvent) |
The Voigt Viscoelastic Model
To quantitatively extract material properties from the Δf and ΔD data, a physical model must be applied. The most common is the Voigt model, which represents the adsorbed film as a layer of thickness, d, with a defined complex shear modulus, G = μ + iωη, where μ is the shear elasticity (storage modulus) and η is the shear viscosity (loss modulus) [22] [19]. This model treats the film as a spring-dashpot system in parallel, capturing its solid-like and liquid-like mechanical responses.
The model is fitted to the experimental Δf and ΔD data obtained from multiple overtones. A frequency-independent model, which assumes μ and η are constant across the measured frequency range, has three unknown parameters: adsorbed mass (or thickness), shear elasticity, and shear viscosity. To reliably fit these, data from at least two harmonics is theoretically required, as each harmonic provides two measured variables (Δf and ΔD). However, due to experimental noise and model imperfections, it is considered best practice to use as many overtones as possible (e.g., 3rd to 13th) as input for the fitting algorithm to ensure robust and reliable results [18].
Experimental Protocols for Viscoelastic Analysis
QCM-D Setup and Sensor Preparation
A robust experimental protocol is foundational for generating high-quality data suitable for viscoelastic modeling.
- Sensor Selection and Coating: Choose a sensor (typically gold-coated) with a surface chemistry relevant to your study. For biological applications, sensors may be pre-coated with specific polymers (e.g., carboxymethyl dextran), metals, or lipid bilayers [6] [19]. The surface must be meticulously cleaned prior to use.
- Baseline Establishment: Place the sensor in the flow module and introduce the pure buffer or solvent. Allow the frequency and dissipation signals to stabilize to establish a stable baseline under flow conditions.
- Sample Introduction and Adsorption: Introduce the sample solution (e.g., protein, polymer) at a constant flow rate. Monitor the real-time changes in Δf and ΔD as molecules adsorb to the sensor surface until a steady state is reached.
- Rinsing Phase: Revert to the pure buffer flow to rinse away loosely bound, non-adsorbed material. The final Δf and ΔD values after rinsing represent the stably adsorbed layer.
- Data Collection: Ensure the instrument is configured to record frequency and dissipation data at a minimum of three overtones, though more is highly recommended [18].
Key Experimental Parameters
Precise control over experimental conditions is critical for reproducibility, especially in pharmaceutical applications [23].
Table 2: Key Experimental Parameters for QCM-D Studies
| Parameter | Considerations | Impact on Data |
|---|---|---|
| Flow Rate | Must be low enough to avoid shear forces that disrupt soft layers, but high enough for uniform delivery. | Affects kinetics of adsorption and layer structure. |
| Temperature | Must be tightly controlled due to its influence on viscosity and molecular interactions. | Critical for biomolecular studies and aggregation assays. |
| Solution pH & Ionic Strength | Influences the charge and conformation of adsorbing molecules (proteins, polyelectrolytes). | Directly affects adsorbed mass, layer thickness, and viscoelasticity. |
| Sample Concentration | A range of concentrations should be tested to understand adsorption kinetics and saturation. | Enables calculation of binding affinity and kinetics. |
| Sensor Surface Chemistry | Defines the physicochemical interface for adsorption (hydrophobic, hydrophilic, charged, specific ligands). | Drastically alters the amount, orientation, and rigidity of the adsorbed layer. |
The following diagram illustrates the core workflow of a QCM-D experiment and the subsequent data interpretation path.
Data Interpretation and Advanced Analysis
Combining QCM-D with Complementary Techniques
A powerful approach to validate and deepen the insights from QCM-D is to combine it with other label-free analytical techniques. Since QCM-D measures the hydrodynamic mass (including water coupled to the film), comparing its results with an optical technique like Optical Waveguide Lightmode Spectroscopy (OWLS) or Surface Plasmon Resonance (SPR), which measures the "dry mass" of the adsorbate, allows for the direct calculation of the layer's hydration [19] [20]. For instance, a study on carboxymethyl dextran (CMD) layers used combined OWLS and QCM-D data to determine that the film was heavily hydrated, with water constituting a significant portion of the hydrodynamic mass [19].
Practical Application: Case Study in Drug Development
QCM-D has proven invaluable in the development of protein and peptide-based biopharmaceuticals, where aggregation and surface adsorption are critical quality attributes [6] [23].
Objective: To predict the adsorption behavior and dose loss of an IgG antibody drug during intravenous administration, where it contacts polymeric surfaces like polyvinyl chloride (PVC) and polypropylene (PP) in syringes and infusion lines [23].
Protocol:
- Polymer surfaces of interest (PVC, PP) were coated onto QCM-D sensors.
- The IgG drug product, diluted in normal saline to concentrations ranging from 0.0001 to 0.1 mg/mL, was flowed over the polymer-coated sensors.
- Frequency and dissipation shifts were recorded to monitor the adsorption kinetics of the protein and the surfactant excipient.
- Over 60 sensorgram data sets were correlated with assayed protein concentrations from mock infusions.
Findings: The QCM-D data enabled the construction of a predictive model for estimating the fraction of drug and surfactant adsorbed and lost on the hydrophobic polymer surfaces. This model provides a reliable method for screening formulation conditions and primary packaging materials to minimize therapeutic dose loss, a crucial factor in ensuring drug efficacy and patient safety [23].
The Scientist's Toolkit: Essential Reagents and Materials
Successful QCM-D experiments rely on a suite of specialized materials and reagents. The following table details key components for a typical biomolecular study.
Table 3: Essential Research Reagent Solutions for QCM-D Experiments
| Item | Function & Application |
|---|---|
| AT-cut Quartz Crystal Sensors | The piezoelectric transducer at the heart of the system. Often pre-coated with gold or other materials. |
| Functionalized Sensors (e.g., CMD-coated) | Surfaces modified with specific chemistries to promote or study specific interactions (e.g., covalent binding of ligands, resistance to non-specific fouling) [19]. |
| Polymer-coated Sensors (e.g., PVC, PP) | Used to mimic the surfaces of drug product containers and administration sets, allowing study of drug-material interactions [23]. |
| Buffer Solutions (PBS, etc.) | Provide a stable ionic and pH environment. Used for baseline establishment, sample dilution, and rinsing. |
| Proteins/Peptides (e.g., IgG Antibodies) | Target analytes in biopharmaceutical development. Studies focus on their adsorption, aggregation, and interaction with surfaces and excipients [6] [23]. |
| Surfactants (e.g., Polysorbates) | Common excipients in protein formulations that compete with the protein for hydrophobic surfaces, thereby minimizing aggregation and dose loss [23]. |
| Polyelectrolytes (e.g., Poly(acrylic acid)) | Model polymers for studying the build-up of multilayers and the growth of grafted polymer brushes, key for understanding viscoelastic responses [22]. |
The advent of QCM-D has fundamentally transformed the quartz crystal microbalance from a simple mass balance into a sophisticated platform for interfacial rheology. By embracing the information contained within the energy dissipation signal, researchers can move beyond the rigid mass paradigm to characterize the viscoelastic properties, hydration state, and structural dynamics of soft materials at the nanoscale. The rigorous experimental protocols and robust viscoelastic modeling detailed in this guide provide a framework for deploying QCM-D in cutting-edge research, with particular impact in the field of drug development. From ensuring the stability and efficacy of next-generation biologics to designing advanced biomaterials, the ability to probe the "soft" interface is indispensable, solidifying QCM-D's role as a cornerstone analytical technique.
The Quartz Crystal Microbalance (QCM) is a highly sensitive instrument that measures minute mass changes on a quartz crystal resonator, with the capability to detect mass variations down to the nanogram per square centimeter level [24]. The core principle of QCM technology relies on the piezoelectric effect, where an alternating voltage applied across a quartz crystal induces a mechanical oscillation [5]. First established for vacuum and gas-phase measurements, QCM technology became applicable in liquid environments following breakthroughs in the 1980s, significantly expanding its utility in biological and chemical sensing [25] [24]. The technology's evolution has led to advanced versions like QCM-D (Dissipation monitoring), which provides additional insights into the viscoelastic properties of materials beyond simple mass measurement [26] [5].
This technical guide examines the three fundamental components that define QCM operation and performance: AT-cut quartz crystals, electrode design, and the utilization of harmonic overtones. Understanding these core elements is essential for researchers, scientists, and drug development professionals seeking to leverage QCM's capabilities for applications ranging from real-time biomolecular interaction analysis to thin-film characterization and biosensing [27] [28].
AT-Cut Quartz Crystals: The Sensing Element
Fundamental Properties and the Piezoelectric Effect
AT-cut quartz crystals are the cornerstone of QCM technology, specifically engineered to exhibit thickness-shear mode (TSM) oscillation when an alternating electric field is applied via attached electrodes [25]. This specialized cut refers to a specific orientation of the quartz crystal wafer that ensures minimal temperature dependence and highly stable resonant frequencies near room temperature [24]. The term "AT" derives from the crystal's specific cutting angle relative to the quartz's crystalline axes, a critical parameter that determines its operational characteristics.
The fundamental operating principle stems from the direct piezoelectric effect, where quartz generates an electric charge in response to mechanical stress, and the converse piezoelectric effect, where mechanical deformation occurs in response to an applied electric field [5] [24]. When an alternating current is applied between the electrodes of a properly cut AT-cut crystal, it induces a standing shear wave where the crystal surfaces move in an anti-parallel, sliding motion parallel to the crystal faces [24]. This specific deformation mode is essential for operation in liquid environments, as shear waves decay rapidly in liquids and gases, preventing significant energy radiation into the medium [24].
Resonance Frequency and Mass Sensing
The resonance frequency of an AT-cut crystal is inversely proportional to its thickness, as described by Equation 1 [5]:
f = n·υq/(2h)
Where:
- f = resonance frequency
- n = overtone number (1, 3, 5,...)
- υq = speed of sound in quartz
- h = thickness of the crystal disk
This relationship forms the basis for mass sensing. When mass is deposited on the crystal surface, the effective thickness increases, resulting in a decrease in resonance frequency [24]. In 1959, Günter Sauerbrey established a linear relationship between mass deposition and frequency shift, formalized in the Sauerbrey equation, which enables quantitative mass measurements [5] [24]. For thin, rigid films, the frequency shift (Δf) is directly proportional to the mass change per unit area (Δm), allowing the QCM to function as a highly sensitive microbalance [26] [24].
Table 1: Key Parameters of AT-Cut Quartz Crystals in QCM Applications
| Parameter | Typical Values/Range | Description | Significance |
|---|---|---|---|
| Fundamental Frequency | 1-30 MHz [25] | Lowest resonant frequency (n=1) | Determines base sensitivity and application scope |
| Temperature Coefficient | Minimal near room temperature | Frequency variation with temperature | Provides operational stability without complex temperature control |
| Q Factor | Up to 10⁶ [24] | Ratio of stored to dissipated energy | Determines frequency stability and measurement precision |
| Crystal Cut | AT or SC cut [24] | Orientation relative to crystal axes | Defines temperature stability and oscillation mode |
| Overtone Sequence | Odd integers only (1,3,5,...) [26] [29] | multiples of fundamental frequency | Enables viscoelastic characterization and advanced modeling |
Energy Trapping and Vibration Confinement
To minimize energy dissipation and maximize measurement sensitivity, AT-cut crystals employ energy trapping techniques that confine the shear vibration to the center of the crystal [24]. For high-frequency crystals (≥10 MHz), this is typically achieved through keyhole-shaped electrodes that create a thicker region in the crystal center. For lower frequency crystals (5-6 MHz), a planoconvex shape is used where the crystal is thinner at the rim, preventing standing wave formation in these regions [24]. This confinement ensures that the mass-sensitivity is peaked at the center of the crystal and declines smoothly toward the rim, optimizing the active sensing area while reducing damping from the crystal holder [24].
Electrode Systems: Transduction and Interface
Electrode Design and Configuration
The electrode system in QCM serves as the critical transducer that converts electrical energy to mechanical oscillation and vice versa. A typical QCM sensor consists of a thin quartz crystal disk sandwiched between two metal electrodes [5]. These electrodes are typically patterned using photolithography and deposition techniques, often beginning with a chromium adhesion layer (≈30 nm) followed by a gold layer (≈100 nm) [28].
Electrode design significantly impacts energy trapping and vibration stability. The electrode geometry and mass distribution create a thickness profile that confines the acoustic energy to the central region of the sensor [24]. This confinement is crucial because it minimizes energy loss to the mounting supports and increases the quality factor (Q-factor) of the resonance. The most common electrode materials include gold, silver, and platinum, selected for their conductivity, stability, and functionalization properties in biological applications [28].
Electrical Equivalent Circuit Models
The electromechanical behavior of a loaded QCM sensor can be accurately described using equivalent circuit models, which allow researchers to analyze sensor performance and design appropriate electronic interfaces. The two primary models are:
- Lumped Element Model (LEM) represents the quartz resonator as a network of discrete electrical components [25].
- Extended Butterworth-Van Dyke (BVD) model provides a more comprehensive representation that includes the loading effects of the surrounding medium [25].
Table 2: Components of the BVD Equivalent Circuit Model
| Component | Symbol | Physical Significance | Typical Value Range |
|---|---|---|---|
| Motional Resistance | Rₘₑ | Mechanical energy dissipation | Varies with loading |
| Motional Inductance | Lₘₑ | Mechanical inertia | Varies with crystal parameters |
| Motional Capacitance | Cₘₑ | Mechanical elasticity | Varies with crystal parameters |
| Static Capacitance | C₀ | Electrical capacitance between electrodes | 5-50 pF |
| Loading Impedance | ZₘL | Response to surface load | Complex value for viscoelastic media |
These models are particularly valuable for understanding sensor behavior in liquid environments, where damping increases significantly and the sensor's electrical response becomes more complex [25]. The BVD model enables researchers to correlate changes in electrical parameters with physical properties of the material interacting with the sensor surface.
Electronic Interface Systems
Various electronic interface systems have been developed for QCM applications, each with distinct advantages for specific measurement scenarios:
- Impedance/Network Analyzers: Provide complete characterization of the sensor's electrical response by measuring across a frequency spectrum, enabling extraction of all equivalent circuit parameters [25].
- Oscillator Circuits: Economic and widely used interfaces that maintain continuous oscillation of the crystal, with frequency counters monitoring resonance shifts [25] [24]. Common configurations include Pierce, Colpitts, and Miller oscillators.
- Phase-Locked Loop and Lock-in Techniques: Offer improved stability and tracking of resonance frequency changes, particularly in rapidly changing environments [25].
- Ring-Down Methods (QCM-D): Measure the decay of oscillation after the driving voltage is suddenly turned off, providing simultaneous information on both frequency and energy dissipation [26] [24].
For liquid-phase applications, the choice of interface is critical as the severe damping of the crystal oscillation requires specialized approaches to maintain stable operation and accurate measurement [25]. Systems with the sensing electrode grounded are often preferred to minimize parasitic capacitances and electrical cross-talk in multi-sensor configurations [25].
Diagram 1: QCM Operational Principle (Width: 760px)
Harmonic Overtones: Enhanced Sensing Capabilities
QCM crystals can be excited to resonate at multiple frequencies known as harmonic overtones [29]. Like a guitar string, the fundamental resonance (n=1) represents the lowest frequency mode, while overtones (n>1) resonate at higher frequencies [29]. For AT-cut crystals operating in thickness-shear mode, only odd harmonics (n=1, 3, 5, 7...) can be electrically excited due to the requirement for an antisymmetric deformation pattern [26]. If the overtone order is even (2, 4, 6...), the deformation is symmetric and no current flows between the electrodes [26].
The overtone frequencies approximate odd multiples of the fundamental frequency. For example, a crystal with a 5 MHz fundamental frequency will have overtones at approximately 15 MHz (n=3), 25 MHz (n=5), 35 MHz (n=7), and so forth [29]. The precise relationship is defined by the crystal properties and cut, but all overtones follow the same basic physical principles as the fundamental mode.
Information Content from Multiple Overtones
Measuring multiple overtones provides significantly enhanced information about the system under study. Each overtone probes how the sample responds to being "shaken" at its particular frequency [29]. This multi-frequency response enables researchers to distinguish between different material behaviors:
- Rigid (Sauerbrey) Films: For thin, rigid films, the normalized frequency shift (Δfₙ/n) remains constant across all overtones [26]. This consistent response validates the application of the Sauerbrey equation and confirms rigid layer behavior.
- Viscoelastic Films: Soft, viscoelastic materials display different responses at different overtones due to the frequency-dependent nature of their mechanical properties [26] [30]. The separation of overtone responses indicates viscoelastic behavior and provides the necessary data for quantitative modeling.
The acoustic penetration depth (δ) of the shear wave into the adjacent medium decreases with increasing frequency according to Equation 2 [30]:
δ = √(2η/ωρ)
Where:
- η = viscosity of the medium
- ρ = density of the medium
- ω = angular frequency (2πf)
This frequency-dependent penetration means different overtones effectively probe different depths into the material, providing a depth-dependent characterization of the sample [30].
Viscoelastic Characterization Using Overtones
The primary advantage of multi-overtone measurements is the ability to characterize viscoelastic materials. For a soft, viscoelastic film, the shear modulus (G(ω)) is a frequency-dependent complex function [26]:
G(ω) = G'(ω) + jG''(ω)
Where:
- G' = storage modulus (elastic component)
- G'' = loss modulus (viscous component)
- ω = angular frequency
To determine these unknown parameters (thickness, viscosity, shear modulus, and their frequency dependence), researchers need at least as many measured variables as unknowns [29]. Measuring frequency (f) and dissipation (D) at multiple overtones provides this necessary information. While theoretically possible to fit a model with f and D from two overtones, practical considerations of measurement noise and model imperfections make data from more overtones highly desirable for robust analysis [29].
Table 3: Overtone Responses for Different Material Types
| Material Property | Δfₙ/n Relationship | Dissipation Response | Interpretation |
|---|---|---|---|
| Rigid Thin Film | Constant across overtones [26] | Low dissipation, minimal overtone dependence | Sauerbrey regime valid, elastic dominance |
| Viscoelastic Film | Varies with overtone [30] | Higher dissipation, overtone-dependent | Viscoelastic response requiring advanced modeling |
| Viscoelastic Thick Film | Complex, non-monotonic [30] | Peaks at certain thicknesses | Shear wave reflection and superposition effects |
Diagram 2: Overtone Response Patterns (Width: 760px)
Experimental Protocols and Methodologies
QCM Biosensor Binding Efficiency Protocol
Objective: To enhance the binding efficiency of target biomolecules (analytes) to ligands immobilized on the QCM sensor surface, particularly for diffusion-limited reactions [28].
Materials and Equipment:
- QCM instrument with frequency measurement capability
- Custom reaction chamber with integrated microelectrodes
- Function generator for AC voltage application
- Microfluidic system with syringe pump and injection valve
- Phosphate Buffered Saline (PBS) or other appropriate buffer
- Target analytes and immobilization ligands
- Surface chemistry reagents for sensor functionalization
Procedure:
- Sensor Preparation: Functionalize the QCM sensor surface with appropriate ligands using standard immobilization chemistry (e.g., thiol-gold bonding for antibodies) [28].
- Chamber Assembly: Construct the ETE-QCM chip by aligning the top microelectrodes with the bottom QCM sensor, separated by a 150μm thick optical clear adhesive spacer to form a reaction chamber of approximately 6μL volume [28].
- Baseline Establishment: Flow buffer solution through the chamber at a constant rate using the syringe pump until a stable frequency baseline is established.
- Sample Introduction with ETE: Introduce the analyte solution while applying an AC voltage (10 MHz frequency) to the microelectrodes to generate electrothermal vortex flow [28].
- Control Experiment: Repeat the measurement without applying AC voltage to the microelectrodes.
- Data Collection: Record frequency shifts every second with 0.1 Hz resolution throughout the binding process [28].
- Analysis: Compare the binding kinetics and equilibrium frequency shifts between ETE-activated and control experiments.
Validation: Post-experiment analysis using Scanning Electron Microscopy (SEM) can visually confirm enhanced surface coverage with ETE application [28].
Multi-Overtone Viscoelastic Characterization Protocol
Objective: To determine the viscoelastic properties of a soft polymer film using multi-overtone QCM measurements [30].
Materials and Equipment:
- Multi-harmonic QCM instrument (capable of measuring n=1,3,5,7,9,11,13) [29]
- Appropriate solvent-resistant sensors
- Polymer solution of known concentration
- Reference solvent for baseline measurements
- Temperature control system
Procedure:
- System Calibration: Measure fundamental and overtone frequencies in reference solvent to establish baseline.
- Film Deposition: Introduce polymer solution to form a thin film on the sensor surface through adsorption or spin-coating.
- Multi-Overtone Monitoring: Simultaneously track frequency (Δf) and dissipation (ΔD) shifts for all available overtones throughout film formation and stabilization.
- Data Validation: Check that Δf/n is constant across overtones for rigid films, or varies systematically for viscoelastic films [26].
- Model Fitting: Input the Δf and ΔD values for multiple overtones into an appropriate viscoelastic model to extract thickness, shear modulus, and viscosity parameters [29].
- Penetration Depth Analysis: Calculate the acoustic penetration depth for each overtone using Equation 2 to determine the sampling depth of the measurement [30].
Interpretation Guidelines:
- Overlapping Δf/n values indicate rigid film behavior suitable for Sauerbrey analysis [26].
- Separated Δf/n responses with significant dissipation indicate viscoelasticity requiring advanced modeling [30].
- Spiral patterns in ΔD vs. Δf plots suggest shear wave reflection effects in thicker films [30].
The Scientist's Toolkit: Essential Research Reagents and Materials
Table 4: Essential Research Reagents and Materials for QCM Experiments
| Item | Function/Application | Technical Considerations |
|---|---|---|
| AT-Cut Quartz Crystals | Piezoelectric sensing element | Available in various fundamental frequencies (typically 5-10 MHz); quality affects Q-factor and sensitivity [25] |
| Gold Electrode Sensors | Transduction surface | Often with chromium adhesion layer; enable thiol-based functionalization chemistry [28] |
| Functionalization Reagents | Surface modification for specific binding | e.g., thiolated antibodies, silane chemistry; determines assay specificity [28] |
| Buffer Solutions | Maintain biomolecular activity and stability | PBS common for biological applications; conductivity affects electrothermal applications [28] |
| Microfluidic Components | Sample delivery and flow control | Syringe pumps, tubing, chambers; precise flow control essential for kinetic studies [28] |
| Reference Analytes | System calibration and validation | e.g., IgG/anti-IgG for antibody assays; provide validation of sensor response [28] |
| Electrode Fabrication Materials | Custom electrode development | Photoresist, chrome etchant, gold etchant; enable custom sensor design [28] |
The sophisticated operation of Quartz Crystal Microbalance technology relies fundamentally on the precise interplay between three core components: AT-cut quartz crystals that provide stable, temperature-compensated resonance; electrode systems that enable efficient electromechanical transduction; and harmonic overtones that expand analytical capabilities beyond simple mass measurement. For researchers in pharmaceutical development and biological sciences, understanding these components enables proper experimental design, appropriate data interpretation, and maximum utilization of QCM's capabilities.
The multi-overtone measurement approach represents a particular advancement, transforming QCM from a simple mass balance into a powerful tool for characterizing viscoelastic properties and complex biological interactions. As QCM technology continues to evolve with improvements in digital sensing, automation, and AI-driven data analytics, these core components will remain foundational to its application across drug discovery, diagnostic development, and biomaterials research [27] [31]. By mastering the principles outlined in this technical guide, scientists can leverage the full potential of QCM technology in their research endeavors.
QCM in Action: Methodologies and Cutting-Edge Biomedical Applications
Real-Time, Label-Free Biomolecular Interaction Analysis
The Quartz Crystal Microbalance (QCM) is a highly sensitive surface analysis technique that measures minute mass changes on a quartz crystal sensor, enabling real-time, label-free monitoring of biomolecular interactions at the nanogram level [5]. The core principle relies on the piezoelectric effect, where an applied alternating voltage causes a specially cut quartz crystal to mechanically oscillate at its resonant frequency [5] [32]. When mass adsorbs to the sensor surface, it changes the crystal's oscillation frequency, providing a direct relationship between frequency shift and mass uptake. This allows researchers to quantitatively monitor binding kinetics, conformational changes, and layer properties without the need for fluorescent or radioactive labels.
The technique's evolution has led to advanced systems like Quartz Crystal Microbalance with Dissipation Monitoring (QCM-D), which provides additional insights into the structural and viscoelastic properties of adsorbed layers by measuring energy dissipation [33] [6]. This is crucial for studying soft, hydrated biological films common in protein and polymer research. QCM finds extensive application in drug development, from characterizing protein-drug candidate interactions and screening targets to studying protein aggregation, stability, and adsorption behavior on various material surfaces [6] [23].
Core Principles and Technical Foundations
The Piezoelectric Effect and Thickness-Shear Mode Oscillation
At the heart of QCM technology is the piezoelectric quartz crystal sensor, typically an AT-cut crystal disk sandwiched between two electrodes [5] [32]. This specific cut ensures stability and a thickness-shear mode of oscillation, where the two crystal surfaces move in anti-parallel directions when an alternating voltage is applied [32]. This shear motion is ideal for operation in liquid environments, as it minimizes energy loss into the surrounding medium compared to other oscillation modes.
The crystal has a fundamental resonant frequency at which it oscillates most efficiently. This frequency is inversely proportional to the crystal's thickness [5]. A key breakthrough came in 1959 when Günter Sauerbrey established a linear relationship between the added mass on the crystal and the observed change in its resonant frequency, formalized in the Sauerbrey equation [5].
Key Quantitative Relationships
The following equations form the quantitative foundation for interpreting QCM data.
Table 1: Fundamental QCM Equations
| Equation Name | Formula | Parameters and Applications |
|---|---|---|
| Sauerbrey Equation [6] | Δf = - (2 * f₀² * Δm) / (A * √(ρᵩ * μᵩ)) |
Relates frequency shift (Δf) to adsorbed mass (Δm) for thin, rigid, and evenly distributed films. f₀= fundamental resonance frequency, A= piezoelectrically active area, ρᵩ= density of quartz (2.648 g·cm⁻³), μᵩ= shear modulus of quartz (2.947×10¹¹ g·cm⁻¹·s⁻²) [6]. |
| Kanazawa-Gordon Equation [6] | Δf = - f₀^(3/2) * √(ρₗ * ηₗ / (π * ρᵩ * μᵩ)) |
Describes the frequency shift when the sensor is immersed in a liquid. ρₗ= liquid density, ηₗ= liquid viscosity. Essential for establishing a stable baseline in liquid-phase experiments. |
| Dissipation Factor (D) [6] | D = E_loss / (2π * E_stored) |
Measures the energy loss per oscillation cycle. E_loss= energy dissipated (lost), E_stored= total energy stored in the oscillation. A high D value indicates a soft, viscoelastic film. |
QCM-D vs. QCM-I: Technical Comparisons
While all QCMs measure mass, different technical approaches exist for measuring energy dissipation, a critical parameter for studying viscoelastic materials. The two primary methods are Dissipation Monitoring (QCM-D) and Impedance Spectroscopy (QCM-I) [33].
Table 2: Comparison of QCM-D and QCM-I Techniques
| Feature | QCM-D (Decay-Based) | QCM-I (Impedance-Based) |
|---|---|---|
| Core Principle | The crystal is "pinged" into oscillation, and the exponential decay of the oscillation is recorded after the drive is switched off [33]. | A frequency sweep is performed across the resonance peak, and the current/phase are measured to determine the system's impedance [33]. |
| Measured Parameters | Frequency (f) and Dissipation (D) are extracted directly from the decay curve [33]. | Full impedance spectrum is used to fit the equivalent circuit parameters (L1, C1, R1, C0), from which f and D are calculated [33]. |
| Speed & Time Resolution | Very fast; high acquisition rate suitable for high-resolution kinetic studies [33]. | Slower due to the need for sequential frequency sweeps; limited time resolution [33]. |
| Key Advantage | Insensitive to variations in stray capacitance; stable and excellent for kinetics [33]. | Full characterization of the electrical equivalent circuit [33]. |
| Typical Applications | High-resolution studies of rapid biomolecular interactions and film swelling/softening. | Detailed analysis of the oscillator's electrical behavior, often in gas sensing. |
Experimental Methodology and Workflows
Generalized QCM-D Experimental Workflow
The diagram below outlines a standard workflow for a QCM-D experiment, from sensor preparation to data analysis.
The Scientist's Toolkit: Essential Research Reagents and Materials
Successful QCM experiments require careful selection and preparation of materials. The following table details key components and their functions.
Table 3: Essential Materials and Reagents for QCM Experiments
| Item | Function and Importance | Considerations |
|---|---|---|
| QCM Sensor | The core piezoelectric element that transdues mass changes into frequency signals [5]. | Choice of surface coating (gold, silica, polymer, etc.) dictates the immobilization chemistry and must be compatible with the biomolecules under study [6] [23]. |
| Buffer Solutions | Provide a stable chemical environment (pH, ionic strength) and maintain biomolecule activity [34]. | Must be particle-free to prevent clogging the flow system. Degassing is critical to avoid bubble formation on the sensor surface, which causes signal noise [34]. |
| Proteins/Peptides | The analytes of interest in drug development, whose interactions and stability are being probed [6]. | Purity and stability are paramount. Proteins must be "well-behaved"; QCM is often used as a quality control tool to check for aggregation or denaturation before experiments [34] [6]. |
| Surfactants (e.g., Polysorbate) | Common excipients in protein formulations that minimize non-specific adsorption to surfaces [23]. | Concentration is critical; studied in QCM to optimize formulations and prevent loss of active drug to container walls (e.g., syringes, IV bags) [23]. |
| Positive/Negative Controls | Reference samples with known behavior used to validate the experimental setup and data interpretation [34]. | Prof. Richter emphasizes that controls help "discard one of the interpretation analysis scenarios," ensuring robust conclusions [34]. |
Detailed Protocol: Studying Protein-Surface Adsorption
This protocol exemplifies a QCM-D application in biopharmaceutical development, investigating the unwanted adsorption of a therapeutic protein to polymer surfaces used in intravenous administration [23].
- Sensor Preparation: Use polymer-coated sensors (e.g., Polyvinyl Chloride (PVC) or Polypropylene (PP)) to mimic the surfaces of IV bags, tubing, or syringes [23].
- System Equilibration: Place the sensor in the QCM-D chamber and start a continuous flow of buffer (e.g., Normal Saline) at a constant temperature (e.g., 37°C) until a stable frequency (f) and dissipation (D) baseline is achieved.
- Sample Injection and Association Phase: Switch the flow to the protein drug product solution (e.g., an IgG antibody) diluted in the buffer at a specific concentration (e.g., 0.0001–0.1 mg/mL). Monitor the frequency decrease (Δf) and dissipation increase (ΔD) in real-time as proteins adsorb to the polymer surface [23].
- Dissociation Phase and Rinse: Switch the flow back to the pure buffer solution. This step monitors the reversibility of the interaction. A stable signal indicates irreversible adsorption and permanent drug loss onto the surface.
- Data Correlation: Correlate the QCM-D sensorgram data (extent of Δf) with the assayed protein concentration in the effluent to build a predictive model for the fraction of drug adsorbed and lost at different concentrations [23].
- Data Analysis:
- For a rigid, tightly adsorbed protein layer, use the Sauerbrey equation to calculate the adsorbed mass.
- If the adsorption causes a significant dissipation shift (indicating a soft, viscoelastic layer), use viscoelastic modeling software provided with the instrument to extract more accurate mass, thickness, and structural properties.
Data Interpretation and Analysis Strategies
Interpreting QCM-D data goes beyond simply calculating mass. The combined information from frequency (Δf) and dissipation (ΔD) shifts provides a rich picture of the structural evolution of the adsorbed layer.
Interpreting Δf and ΔD Shifts
The relationship between changes in frequency and dissipation can reveal the nature of the forming adlayer.
Table 4: Interpreting QCM-D Data from Biomolecular Interactions
| Frequency (Δf) | Dissipation (ΔD) | Probable Interpretation |
|---|---|---|
| Large Decrease | Small Increase | Formation of a thin, rigid, and compact monolayer. The Sauerbrey equation is typically valid here. Example: formation of a self-assembled monolayer (SAM). |
| Moderate Decrease | Large Increase | Formation of a thick, soft, and highly hydrated (viscoelastic) film. The adlayer contains a significant amount of trapped water that couples to the oscillation. Example: adsorption of a large, unstructured protein or a polymer gel. |
| Small Decrease | Large Increase | Could indicate weak, non-specific binding or the formation of a loosely attached layer that does not efficiently couple mass to the sensor. |
| Rapid, Large Decrease | Rapid, Large Increase | Often indicative of a bulk change or an artifact, such as the formation of an air bubble on the sensor surface. |
Expert Strategies for Effective Analysis
Experienced QCM-D users recommend several key strategies to expedite the learning curve and ensure robust data [34]:
- Focus on Primary Signals and Reproducibility: Dr. Kellermeier advises new users to "not look at too many things at the same time." Start by focusing on one frequency and one dissipation overtone to understand the basic behavior of your system before moving to complex modeling. Ensure your measurements are reproducible [34].
- Utilize Controls for Robust Interpretation: Prof. Richter emphasizes that "controls are important... think of controls that enable you to discard one of the interpretation analysis scenarios." Including positive and negative controls builds confidence in your conclusions [34].
- Align Analysis with the Intended Audience: Prof. Jackman highlights that the same QCM-D dataset can be presented differently depending on the audience. For an industry partner, a simple metric like "% surface coverage" or "% drug loss" may be most effective. For a fundamental research paper, a detailed viscoelastic analysis of structural transformations is more appropriate [34].
Quartz Crystal Microbalance with Dissipation Monitoring stands as a powerful and versatile analytical technique in the toolkit of modern researchers and drug development professionals. Its ability to provide real-time, label-free insights into mass uptake and the viscoelastic properties of surface adlays enables a deeper understanding of critical processes, from biomolecular binding kinetics and conformational stability to the optimization of biopharmaceutical formulations and materials. By adhering to rigorous experimental methodologies, such as proper sensor preparation, the use of controls, and strategic data interpretation, scientists can fully leverage QCM-D's capabilities to drive innovation in biomedical research and therapeutic development.
The Quartz Crystal Microbalance (QCM) is a highly sensitive, mass-based sensing platform that operates on the principle of the piezoelectric effect [5] [24]. At its core, a QCM sensor utilizes a thin disk of quartz crystal sandwiched between two electrodes. When an alternating voltage is applied, the quartz crystal oscillates at a specific resonance frequency [5]. This frequency is exquisitely sensitive to mass changes on the crystal surface; the binding of even minute amounts of a target analyte causes a measurable decrease in the resonance frequency, enabling real-time, label-free detection of biomolecular interactions [5] [24]. Advanced versions like QCM with Dissipation Monitoring (QCM-D) provide further insights into the viscoelastic properties of the adsorbed layer by measuring the energy dissipation during oscillation [35] [36].
This technical guide details the development of a QCM biosensor, focusing on the use of DNA aptamers as recognition elements for the specific detection of antibodies. Aptamers are short, single-stranded DNA or RNA oligonucleotides selected for high affinity and specificity to a target molecule [37] [36]. Their superior stability, ease of modification, and reusability make them ideal alternatives to traditional antibodies in biosensor design [37]. We will explore the integration of these elements into a functional QCM biosensor, from fundamental principles and sensor design to experimental protocols and data analysis, providing a comprehensive framework for researchers and scientists in drug development.
QCM Operational Principles
The Piezoelectric Effect and Mass Sensing
The operational foundation of a QCM biosensor is the piezoelectric effect exhibited by quartz crystals. A mechanically stressed piezoelectric material generates an electrical potential, and conversely, applies an electrical field causes a mechanical deformation [5] [24]. In a QCM sensor, an alternating current applied to the electrodes induces a standing shear wave oscillation throughout the crystal thickness [5]. The frequency at which this oscillation is most efficient is known as the fundamental resonance frequency.
The critical relationship between mass deposition on the sensor surface and the resulting frequency shift was formalized by Günter Sauerbrey in 1959. The Sauerbrey equation establishes a linear relationship between the change in resonance frequency (Δf) and the mass change per unit area (Δm) for thin, rigid, and uniformly adsorbed films [5] [24] [38]:
Δf = -Cf * Δm
In this equation, Cf is the mass sensitivity constant of the crystal, which is dependent on the fundamental properties of the quartz, such as its density and shear modulus [24]. This relationship allows for the quantitative determination of adsorbed mass with nanogram sensitivity, forming the basis for QCM's application in gravimetric sensing.
QCM-D: Beyond Mass Measurement
When studying soft, viscoelastic layers like biomolecular films or cells, measuring frequency alone is insufficient, as the trapped solvent and the non-rigid nature of the layer also affect the oscillation. QCM-D technology addresses this by simultaneously measuring changes in both resonance frequency (Δf) and energy dissipation (ΔD) [35] [36].
Dissipation quantifies the damping of the crystal's oscillation, which is related to the viscoelasticity of the adlayer. A high dissipation change indicates a soft, liquid-like layer, while a small dissipation change suggests a rigid, tightly coupled film [37] [35]. The most common method for determining dissipation is the ring-down technique, where the driving voltage is switched off and the exponential decay of the oscillation is recorded [35] [24]. The simultaneous analysis of Δf and ΔD provides a more comprehensive picture of the structural properties of the surface-bound layer, which is crucial for characterizing the success of aptamer immobilization and subsequent target binding in a biosensor.
Table 1: Key Parameters in QCM and QCM-D Measurements
| Parameter | Symbol | Definition | Significance in Biosensing |
|---|---|---|---|
| Frequency Shift | Δf | Change in the crystal's resonant frequency | Primary indicator of mass change on the sensor surface. A decrease signifies mass uptake. |
| Dissipation Factor | ΔD | Measure of energy loss per oscillation cycle | Reveals viscoelastic properties of the adlayer; indicates structural rigidity or softness. |
| Sauerbrey Constant | C_f | Instrument-specific mass sensitivity constant | Used in the Sauerbrey equation to convert frequency shift to adsorbed mass. |
| Overtone Number | n | Harmonic of the fundamental resonance frequency | Higher overtones provide information about the penetration depth of the shear wave. |
Biosensor Design and Development
DNA Aptamers as Biorecognition Elements
DNA aptamers are synthetic, single-stranded DNA molecules that fold into defined three-dimensional structures, allowing them to bind to specific targets with high affinity [37] [36]. They are selected through an iterative combinatorial chemistry process known as SELEX (Systematic Evolution of Ligands by EXponential enrichment) [36]. Compared to antibodies, aptamers offer significant advantages for biosensing, including superior chemical stability, ease of chemical synthesis and modification, and the ability to be selected against a wide range of targets, including toxins and non-immunogenic molecules [37].
A critical step in aptasensor development is the immobilization of the aptamer onto the QCM sensor surface. This must be done in a way that preserves its functionality and binding capability. Common strategies involve the chemisorption of thiol-modified aptamers onto gold-coated sensor chips, forming a stable Au-S bond [37]. To minimize non-specific adsorption and ensure proper orientation, the surface is often back-filled with short-chain alkanethiols like 6-mercapto-1-hexanol (MCH) [37].
Surface Functionalization Strategies
The functionalization of the QCM sensor surface is paramount for creating a robust and sensitive biosensor. The chosen strategy must facilitate efficient aptamer immobilization while creating a bio-inert background to minimize non-specific binding.
- PEG-Based Functionalization: Polyethylene glycol (PEG) is widely used to create antifouling surfaces. In a SARS-CoV-2 QCM biosensor, a PEG-based surface significantly improved sensitivity and specificity by providing a hydrophilic layer that repels non-target proteins [39].
- Supported Lipid Bilayer (SLB): This strategy mimics an artificial cell membrane on the sensor surface, creating a physiologically relevant environment for biomolecular interactions. A QCM-D-based aptasensor for β-lactoglobulin successfully utilized an SLB functionalized with biotinylated lipids to capture streptavidin-linked aptamers [36].
- Nanomaterial-Enhanced Surfaces: Incorporating nanomaterials can dramatically increase the surface area and loading capacity for aptamers. A Pb²⁺ biosensor used a composite of Mxene and gold nanoparticles (AuNPs) to modify the chip surface, which significantly increased the number of DNA binding sites and enhanced detection sensitivity by 20-fold [38].
The Scientist's Toolkit: Essential Research Reagents
Table 2: Key Reagent Solutions for QCM Aptasensor Development
| Reagent / Material | Function / Role in Experiment | Example from Literature |
|---|---|---|
| Thiolated DNA Aptamer | The biorecognition element; binds specifically to the target antibody. Chemisorbed onto gold sensor via thiol group. | Thiolated aptamer for penicillin G detection [37]. |
| 6-Mercapto-1-hexanol (MCH) | A backfilling molecule; creates a well-oriented aptamer layer and minimizes non-specific binding on the gold surface. | Used to passivate the surface after aptamer immobilization [37]. |
| Supported Lipid Bilayer (SLB) | A surface functionalization strategy that mimics a cell membrane, providing a physiologically relevant sensing interface. | Used as a platform to immobilize aptamers for β-lactoglobulin detection [36]. |
| Gold Nanoparticles (AuNPs) | Nanomaterial used for signal amplification; increases surface area and mass loading on the sensor chip. | Incorporated in a Mxene-AuNP composite to enhance sensitivity for Pb²⁺ detection [38]. |
| Streptavidin-Biotin System | A high-affinity coupling system for oriented immobilization of biotinylated biomolecules on the sensor surface. | Used to anchor biotinylated aptamers to a biotin-functionalized SLB [36]. |
| Phosphate Buffered Saline (PBS) | A standard buffer solution used to maintain a stable pH and ionic strength during biomolecular interactions. | Universal buffer for preparing aptamer and target solutions [37] [36]. |
Experimental Protocol: A Step-by-Step Guide
This protocol outlines the development of a QCM-D-based aptasensor for antibody detection, using a thiol-gold immobilization strategy.
Sensor Surface Preparation and Aptamer Immobilization
- Sensor Cleaning: Begin with a clean gold-coated QCM sensor chip. Clean the sensor surface rigorously using an oxygen plasma cleaner or by immersion in a piranha solution (a 3:1 mixture of concentrated sulfuric acid and 30% hydrogen peroxide Caution: Piranha solution is extremely corrosive and must be handled with extreme care), followed by rinsing with copious amounts of ethanol and deionized water. Dry under a stream of nitrogen gas.
- Aptamer Solution Preparation: Prepare a working solution of the thiol-modified DNA aptamer (e.g., 1 µM) in a suitable buffer, typically deoxygenated phosphate-buffered saline (PBS, pH 7.4). Heat the aptamer solution to 95°C for 5 minutes and allow it to cool slowly to room temperature to ensure proper folding.
- Aptamer Immobilization: Mount the clean sensor in the QCM-D chamber and establish a stable baseline with PBS buffer flowing at a constant rate (e.g., 100 µL/min). Inject the prepared aptamer solution and allow it to contact the sensor surface for a sufficient time (e.g., 1 hour) to form a self-assembled monolayer via gold-thiol bonds. Observe a stable decrease in frequency (Δf) and a small increase in dissipation (ΔD).
Surface Blocking and Specificity Control
- Surface Passivation: Following aptamer immobilization, rinse the cell with PBS to remove loosely bound aptamers. To passivate any remaining bare gold sites and create a non-fouling background, inject a solution of 1 mM 6-mercapto-1-hexanol (MCH) in PBS for 20-30 minutes. This step often causes a further frequency shift as MCH displaces non-specifically adsorbed aptamers and forms a dense monolayer [37].
- Specificity and Cross-Reactivity Tests: To validate the specificity of the biosensor, perform control experiments. After establishing a new baseline, inject solutions containing non-target proteins or antibodies (e.g., Bovine Serum Albumin, Influenza A protein, or an irrelevant antibody) at a concentration similar to or higher than the target. A specific aptasensor will show negligible frequency and dissipation responses to these non-target analytes [39] [37].
Target Detection and Binding Kinetics
- Target Introduction and Real-Time Detection: With a stable baseline in PBS, introduce the target antibody solution at a known concentration. Monitor the frequency (Δf) and dissipation (ΔD) shifts in real-time across multiple overtones until the signal stabilizes, indicating binding saturation.
- Binding Kinetics and Affinity Analysis: Repeat the detection step with a series of different antibody concentrations. The resulting sensorgrams (plots of Δf and ΔD over time) can be fitted to appropriate kinetic models (e.g., Langmuir adsorption model) to determine the association (kon) and dissociation (koff) rate constants. The equilibrium dissociation constant (KD) can be calculated from the ratio koff/kon.
Sensor Regeneration and Reusability
- Regeneration Strategy: To regenerate the sensor surface for repeated use, inject a regeneration solution that disrupts the antibody-aptamer interaction without denaturing the immobilized aptamer. Common regeneration agents include mild acids (e.g., 10 mM glycine-HCl, pH 2.5), sodium dodecyl sulfate (SDS, 0.1-1%), or urea (4-8 M). Inject until the frequency and dissipation signals return close to their pre-binding baseline levels.
- Reusability Assessment: A well-designed aptasensor can typically be regenerated multiple times. The reusability should be assessed by performing several cycles of target binding and regeneration while monitoring the retention of the sensor's response. A high-performance sensor for Pb²⁺ demonstrated the ability to be regenerated and reused up to five times [38].
Data Analysis and Performance Metrics
Interpreting QCM-D Data
The raw data from a QCM-D experiment consists of simultaneous changes in frequency (Δf) and dissipation (ΔD) for the fundamental frequency and several overtones. A plot of ΔD versus Δf is often informative; a steep slope suggests the formation of a soft, dissipative layer, while a shallow slope indicates the formation of a thin, rigid film.
For a first approximation of adsorbed mass, the Sauerbrey equation can be applied if the adlayer is rigid (i.e., ΔD is very small). For viscoelastic layers, more sophisticated modeling software is required to extract mass and thickness values by simultaneously fitting the Δf and ΔD data from multiple overtones.
Quantifying Biosensor Performance
The performance of a biosensor is evaluated using several key metrics, which should be summarized from experimental data across a range of target concentrations.
Table 3: Key Performance Metrics for a QCM Aptasensor
| Performance Metric | Description | How it is Determined |
|---|---|---|
| Limit of Detection (LOD) | The lowest concentration of the target that can be reliably distinguished from background noise. | Typically calculated as 3 times the standard deviation of the blank signal divided by the slope of the calibration curve. |
| Sensitivity | The change in sensor signal per unit change in target concentration. | The slope of the linear range of the calibration curve (e.g., Hz/nM or Hz/(ng/mL)). |
| Dynamic Range | The range of target concentrations over which the sensor provides a quantifiable response. | From the LOD to the concentration where signal saturation begins. |
| Specificity / Selectivity | The sensor's ability to respond only to the target analyte and not to interferents. | Demonstrated through control experiments with non-target molecules. |
| Response Time | The time required for the sensor to reach a defined percentage (e.g., 90%) of its equilibrium signal after target injection. | Measured directly from the sensorgram (real-time response curve). |
Advanced Applications and Future Perspectives
QCM aptasensors have demonstrated exceptional capability across diverse fields. In medical diagnostics, an open-source QCM platform was developed for rapid (15 min) and ultrasensitive detection of the SARS-CoV-2 nucleocapsid protein, achieving a low detection limit suitable for point-of-care testing [39]. In food safety, a QCM-D aptasensor enabled the real-time detection of the milk allergen β-lactoglobulin, while another study detected the antibiotic Penicillin G in milk at concentrations below the EU regulatory limit [37] [36]. In environmental monitoring, a novel biosensor using allosteric transcription factors achieved an ultra-low LOD of 0.05 pM for Pb²⁺, showcasing a 20-fold sensitivity enhancement through a quantum dot-based mass amplification strategy [38].
The future of QCM biosensing is being shaped by several key trends. The miniaturization of devices using MEMS technology and their integration with other sensing techniques, such as Localized Surface Plasmon Resonance (LSPR), creates powerful complementary tools that provide richer data from a single experiment [37] [40]. Furthermore, the push towards point-of-care applications is driving innovation in creating portable, user-friendly, and cost-effective QCM instruments that can be deployed in resource-limited settings, ultimately translating sophisticated biosensing from the central lab to the front lines of healthcare and environmental monitoring [39] [40].
The COVID-19 pandemic underscored an urgent need for diagnostic tools that are not only accurate but also rapid and sensitive enough to identify asymptomatic carriers and curb viral transmission. Biosensor technology emerged as a critical platform in this endeavor, with Quartz Crystal Microbalance (QCM) aptasensors representing a particularly powerful label-free approach for detecting SARS-CoV-2 antigens [41]. This case study delves into the development and optimization of a QCM-based aptasensor for the ultrasensitive detection of the SARS-CoV-2 spike receptor-binding domain (S-RBD), demonstrating a detection limit of 0.07 pg/mL [41]. The content is framed within broader research on how QCM works, illustrating the translation of its fundamental physical principles into a cutting-edge diagnostic application. We will explore the core operational principles of QCM technology, detail the experimental protocols for fabricating the aptasensor, present a comprehensive analysis of its performance, and discuss its potential for real-world application.
Quartz Crystal Microbalance: Fundamental Principles
The Quartz Crystal Microbalance is a mass-sensitive sensing device that operates based on the piezoelectric effect discovered by Pierre and Jacques Curie in 1880 [42]. The core component is a thin disk of AT-cut quartz crystal, a piezoelectric material that mechanically deforms when an electrical voltage is applied across it, and vice versa [5] [32].
Transduction Mechanism: From Mass to Frequency
In a QCM sensor, an alternating current (AC) voltage is applied to electrodes on either side of the quartz crystal, inducing a thickness-shear mode (TSM) oscillation [5] [32]. The crystal oscillates at a specific resonance frequency, which is inversely dependent on the thickness of the crystal itself [5]. When a target analyte binds to a recognition layer on the sensor surface, it increases the effective mass load on the oscillating crystal. According to the principle established by Günter Sauerbrey in 1959, this added mass results in a measurable decrease in the crystal's resonance frequency [5] [42] [43]. The quantitative relationship is described by the Sauerbrey equation:
$$\Delta f = - \frac{2f0^2}{A\sqrt{\muq \rho_q}} \Delta m$$
Where:
Δfis the measured frequency shiftf₀is the fundamental resonant frequency of the crystalΔmis the mass changeAis the active area of the sensorμqis the shear modulus of quartzρqis the density of quartz [5] [11] [24]
For a typical 5 MHz AT-cut quartz crystal, the mass sensitivity is approximately 17.7 ng cm⁻² Hz⁻¹, enabling the detection of sub-monolayer mass changes at the nanogram level [32]. This exquisite mass sensitivity is the foundational principle that makes QCM a powerful tool for detecting viral proteins.
Figure 1: QCM Operational Principle. An AC voltage induces shear oscillation in a piezoelectric quartz crystal; mass adsorption causes a measurable frequency shift.
Experimental Protocol: QCM Aptasensor for SARS-CoV-2 S-RBD
Research Reagent Solutions
The following table details the essential materials and reagents used in the featured study for the development of the QCM aptasensor [41].
Table 1: Key Research Reagents and Materials for QCM Aptasensor Development
| Item | Function/Description | Source |
|---|---|---|
| AT-cut Quartz Crystal | Piezoelectric sensor substrate with 10 MHz fundamental frequency, gold electrodes. | QuartzPro |
| Thiol-modified DNA Aptamers (1C, 4C) | Biorecognition elements that specifically bind to SARS-CoV-2 S-RBD. | MicroSynth |
| Recombinant S-RBD Protein | Target analyte for detection. | Sigma-Aldrich |
| Tris(2-carboxyethyl)phosphine (TCEP) | Reducing agent for cleaving disulfide bonds to activate thiolated aptamers. | Thermo Fischer Scientific |
| 6-Mercapto-1-hexanol (MCH) | Backfiller molecule to create a well-oriented, dense aptamer monolayer. | Sigma-Aldrich |
| NeutrAvidin (NA) | Used in some sensor architectures as a bridging layer for biotinylated molecules. | Thermo Fischer Scientific |
| Phosphate Buffered Saline (PBS) | Binding buffer, providing a stable physiological pH and ionic strength. | Not Specified |
Detailed Methodological Workflow
The fabrication of the QCM aptasensor and its use for detection involves a multi-step process that must be meticulously optimized.
Step 1: Sensor Surface Cleaning The gold electrode of the QCM crystal is rigorously cleaned to remove any organic contaminants. This is achieved by immersion in a hot basic Piranha solution (a mixture of ammonium hydroxide, water, and hydrogen peroxide in a 1:5:1 volume ratio at 70°C) for 25 minutes, repeated three times. The crystal is then rinsed with copious water and ethanol before being dried under a stream of nitrogen gas [41].
Step 2: Aptamer Preparation Thiol-modified DNA aptamers are reconstituted in TE buffer. To ensure proper folding, the aptamer solution is heated to 95°C for 3 minutes to denature any secondary structures, then cooled on ice for 10 minutes, and finally allowed to warm gradually to room temperature. This process facilitates the formation of the three-dimensional structure required for specific target binding [41].
Step 3: Aptasensor Fabrication (Direct Immobilization) The cleaned gold sensor is mounted in a flow cell. The prepared thiolated aptamer solution is then introduced over the gold surface. The thiol groups (-SH) form covalent bonds with the gold, creating a self-assembled monolayer. This is followed by treatment with 6-Mercapto-1-hexanol (MCH), which serves as a backfiller. The MCH occupies any vacant sites on the gold, displaces non-specifically adsorbed aptamers, and helps to orient the aptamers upright, making their binding sites more accessible to the target protein [41].
Step 4: QCM Measurement and Target Detection The functionalized sensor is equilibrated with a running buffer (PBS with MgCl₂). The sample containing the target S-RBD protein is then injected over the sensor surface with a constant flow rate (e.g., 50 μL/min). The binding event between the aptamer and S-RBD increases the mass on the sensor, leading to a real-time decrease in the resonant frequency, which is monitored by the QCM electronics [41].
Figure 2: QCM Aptasensor Fabrication and Detection Workflow. The process involves immobilizing thiolated aptamers on a gold sensor, backfilling with MCH, and detecting S-RBD binding via frequency decrease.
Results and Performance Analysis
Quantitative Sensor Performance
The optimized QCM aptasensor demonstrated exceptional performance in the detection of SARS-CoV-2 S-RBD. The key quantitative data from the study are summarized in the table below [41].
Table 2: Performance Metrics of the QCM Aptasensor for SARS-CoV-2 S-RBD Detection
| Performance Parameter | Result | Experimental Conditions |
|---|---|---|
| Limit of Detection (LOD) | 0.07 pg/mL | In buffer (PBS) |
| Linear Dynamic Range | 1 pg/mL to 0.1 µg/mL | Covers over 5 orders of magnitude |
| Specificity | High (Negligible response to N-protein and competing proteins) | Tested against Nucleocapsid (N) protein and other non-target proteins |
| Functionality in Complex Media | Verified | Successful detection in 10-fold diluted human plasma and saliva |
The sensor's sensitivity is paramount, with an LOD of 0.07 pg/mL significantly surpassing that of many conventional diagnostic assays. The wide linear range allows for quantitative analysis across a vast concentration span, which is crucial for monitoring viral load variations. The high specificity confirms that the frequency shift is due to the specific interaction between the aptamer and S-RBD, minimizing false-positive signals from other components in complex samples like plasma or saliva [41].
Comparative Sensor Analysis
The same study developed an electrochemical aptasensor for comparison. While the electrochemical sensor offered a faster one-step modification process (2 hours preparation time), its limit of detection was 132 ng/mL, which is significantly less sensitive than the QCM aptasensor [41]. This comparison highlights the trade-off between preparation speed and ultimate sensitivity, positioning the QCM as the superior platform when the highest sensitivity is required.
Advanced Application: Detection in Complex Media
For a biosensor to have real-world clinical utility, it must function accurately in biologically relevant matrices. The QCM aptasensor's performance was validated in 10-fold diluted human plasma and saliva [41]. This is a critical step, as these fluids contain a high concentration of other proteins and biomolecules that could potentially foul the sensor surface or bind non-specifically. The successful detection in these media, with filtered samples to remove particulates, indicates the robustness of the aptamer-based recognition layer and the MCH backfilling procedure in preventing non-specific adsorption. This demonstrates the strong potential of this QCM aptasensor for use in point-of-care testing and clinical diagnostics.
Advanced QCM-D Protocol for Viscoelastic Characterization
While the standard QCM protocol is sufficient for rigid, tightly bound layers, advanced techniques like QCM with Dissipation monitoring (QCM-D) provide additional insights. QCM-D measures not only the frequency shift (Δf) but also the energy dissipation (ΔD), which informs on the viscoelastic properties (softness/rigidity) of the adsorbed layer [44] [24].
Protocol for QCM-D Analysis:
- Baseline Establishment: A stable baseline for both frequency and dissipation is established in a pure buffer solution.
- Sample Introduction: The protein or particle sample is injected over the sensor surface.
- Real-time Monitoring: The frequency decrease (Δf, related to mass) and dissipation increase (ΔD, related to structural softness and viscous coupling) are monitored simultaneously.
- Data Modeling: The Δf and ΔD data collected at multiple overtones (e.g., 3rd, 5th, 7th) are fitted to viscoelastic models. This allows researchers to distinguish between a compact, rigid layer (small ΔD, valid Sauerbrey mass) and a soft, hydrated layer (large ΔD, requiring more complex modeling for mass interpretation) [44] [24].
This technique would be highly valuable for studying the interaction of whole SARS-CoV-2 virions with surfaces, as the virus particle itself represents a complex, viscoelastic entity.
This technical guide explores the application of Quartz Crystal Microbalance with Dissipation monitoring (QCM-D) technology for the sensitive detection of antibiotic residues in food products. Framed within broader QCM research, this case study focuses on the detection of Penicillin G (PEN) using a combined QCM-D and localized surface plasmon resonance (LSPR) aptasensor, demonstrating limits of detection below the European Union's maximum residue limit of 4 ng/mL [45]. The content provides in-depth technical protocols, data analysis procedures, and implementation frameworks to support researchers and drug development professionals in advancing food safety surveillance.
The Quartz Crystal Microbalance (QCM) is a highly sensitive mass sensing technology that measures minute mass changes on a quartz crystal sensor surface. The fundamental principle relies on the piezoelectric effect discovered in the late 19th century, wherein quartz crystals generate an electric charge in response to mechanical stress and vice versa [5]. The technology matured in 1959 when Günter Sauerbrey formulated the linear relationship between resonance frequency shifts and mass accumulation, establishing the foundational Sauerbrey equation for gravimetric sensing [7] [5].
Modern QCM with Dissipation monitoring (QCM-D) extends this capability by measuring both frequency shifts (Δf) and energy dissipation (ΔD), providing insights into viscoelastic properties of surface-bound layers beyond mere mass uptake [7] [45]. This dual-parameter detection is particularly valuable for analyzing complex biological interactions in food safety applications, where target analytes often interact with recognition elements through processes that involve both mass change and structural reorganization.
In food safety surveillance, QCM-D technology addresses critical gaps in conventional antibiotic detection methods. Traditional techniques including high-performance liquid chromatography (HPLC), mass spectroscopy (MS), and microbial inhibition assays present limitations in rapid on-site deployment, require sophisticated laboratory infrastructure, and often exhibit insufficient sensitivity for regulatory compliance [45] [46]. QCM-D biosensors offer operational simplicity, real-time monitoring capabilities, and label-free detection, making them increasingly viable for rapid screening of food contaminants including antibiotic residues.
QCM-D Operational Principles and Theoretical Framework
Fundamental Mechanism
The core QCM-D sensor consists of a thin quartz crystal disk sandwiched between two electrodes. When an alternating voltage is applied, the crystal undergoes thickness-shear mode oscillation at a specific resonance frequency determined by the crystal's physical properties [5]. The resonance condition follows the equation:
f = n·υ₉/(2h) [5]
Where f represents resonance frequency, n is the overtone number, υ₉ is the speed of sound in quartz, and h is the crystal thickness. This relationship demonstrates that thicker crystals exhibit lower resonance frequencies, establishing the basis for mass sensitivity.
When mass accumulates on the sensor surface, the oscillation frequency decreases proportionally. For thin, rigid films, the Sauerbrey equation quantifies this relationship:
Δf = -C·Δm [7]
Where Δf is the frequency shift, Δm is the mass change per unit area, and C is a constant dependent on the crystal properties. For a 5 MHz crystal, the mass sensitivity is approximately 17.7 ng·cm⁻²·Hz⁻¹, enabling detection of sub-monolayer molecular coverage [7].
Advanced QCM-D Measurement Capabilities
QCM-D advances beyond basic QCM by simultaneously monitoring the dissipation factor (D), which quantifies energy losses during oscillation. The dissipation factor is calculated from the bandwidth of the resonance curve and provides critical information about the viscoelastic character of surface-bound layers [7]. Rigid, tightly coupled films exhibit minimal dissipation changes, while soft, hydrated layers show significant dissipation increases due to greater energy damping.
This dual-parameter measurement allows researchers to distinguish between mass loading and viscoelastic effects, which is particularly important when studying molecular interactions in liquid environments or with flexible biological structures like aptamer-antibiotic complexes [7] [45]. Modern QCM-D instruments measure multiple overtones (harmonics) simultaneously, providing frequency and dissipation data across different penetration depths and timescales for more comprehensive interfacial characterization.
Experimental Case Study: QCM-D Aptasensor for Penicillin G Detection
Research Objective and Significance
Penicillin G (PEN) is a widely used β-lactam antibiotic in veterinary medicine whose uncontrolled application can lead to residue accumulation in animal-derived food products. This case study details the development and implementation of a combined QCM-D/LSPR aptasensor for detecting PEN at concentrations relevant to regulatory limits, specifically targeting levels below the EU-established maximum residue limit (MRL) of 4 ng/mL [45].
Materials and Reagents
Table 1: Key Research Reagents and Materials for QCM-D PEN Aptasensor
| Item | Specification | Function | Source/Reference |
|---|---|---|---|
| DNA Aptamer | 5′-HS-(CH₂)₆-CTG AAT TGG ATC TCT CTT CTT GAG CGA TCT CCA CA-3′ | Biorecognition element for PEN | [45] |
| QCM-D Sensor | AT-cut quartz crystal with gold electrodes (fundamental frequency 8 MHz) | Signal transduction platform | [45] |
| Gold Nanoparticles (AuNPs) | 80 nm diameter, citrate-stabilized | LSPR transduction element; aptamer immobilization surface | [45] |
| Penicillin G | Sodium salt, analytical standard | Target analyte | Sigma-Aldrich, Cat. No. 13752 [45] |
| 6-mercapto-1-hexanol (MCH) | ≥97% purity | Backfilling agent to minimize non-specific adsorption | Sigma-Aldrich [45] |
| Phosphate Buffered Saline (PBS) | 10 mM Na₂HPO₄, 1.8 mM KH₂PO₄, 137 mM NaCl, 2.7 mM KCl, pH 7.4 | Measurement buffer | [45] |
Experimental Protocol
Sensor Surface Preparation
The experimental workflow begins with functionalization of the QCM-D sensor surface. Gold-coated quartz crystals undergo thorough cleaning in a UV-ozone cleaner or piranha solution (3:1 H₂SO₄:H₂O₂) to remove organic contaminants, followed by rinsing with deionized water and ethanol. The cleaned sensors are dried under nitrogen stream before aptamer immobilization [45].
Aptamer Immobilization
Thiolated PEN-specific DNA aptamers are chemisorbed onto the gold sensor surface through gold-thiol self-assembly. A 1μM aptamer solution in PBS buffer is incubated on the sensor surface for 1 hour at room temperature, facilitating covalent bond formation between thiol groups and gold atoms. The surface is then rinsed with PBS to remove unbound aptamers [45].
To minimize non-specific binding and optimize aptamer orientation, the functionalized surface is treated with 1mM 6-mercapto-1-hexanol (MCH) for 30 minutes. This backfilling step displaces weakly adsorbed aptamers and creates a hydrophilic monolayer that resists non-specific protein adsorption [45].
Gold Nanoparticle Functionalization
In parallel, 80nm gold nanoparticles (AuNPs) are functionalized with the same thiolated aptamer sequence using identical immobilization chemistry. The AuNP-aptamer conjugates are purified by centrifugation to remove excess reagents and resuspended in PBS buffer. These functionalized nanoparticles serve dual purposes: as LSPR transducers and as secondary mass labels for QCM-D signal enhancement [45].
QCM-D Measurement Procedure
The aptamer-functionalized QCM-D sensor is mounted in the flow chamber, and baseline measurements are established under continuous PBS buffer flow at 100μL/min. Once stable frequency (f) and dissipation (D) baselines are achieved, PEN solutions at varying concentrations (0.1nM to 100nM) are introduced to the flow system using a precision syringe pump [45].
Frequency and dissipation shifts are monitored simultaneously across multiple overtones (typically 3rd, 5th, and 7th) in real-time using a QSense Analyzer (Biolin Scientific) or equivalent instrument. Following each PEN injection, the surface is regenerated using a brief pulse of 10mM sodium dodecyl sulfate (SDS) to dissociate the PEN-aptamer complexes without damaging the immobilized aptamer layer, enabling repeated measurements with the same sensor [45].
Data Analysis and Interpretation
QCM-D data analysis follows a systematic approach to extract quantitative information about PEN binding. The QSense Dfind software (Biolin Scientific) provides graphical interfaces for visualizing Δf and ΔD shifts across multiple overtones, enabling rapid assessment of binding events [47].
For thin, rigid films, the Sauerbrey equation directly converts frequency shifts to mass uptake. However, the significant dissipation increases observed during PEN binding indicate viscoelastic contributions, necessitating more advanced modeling using the Voigt viscoelastic model implemented in Dfind's automated fitting routines [47]. This modeling accounts for the hydrodynamic coupling of solvent trapped within the aptamer-PEN complex, providing accurate mass calculations despite the viscoelastic character of the layer.
The limit of detection (LOD) for PEN is determined from the concentration dependence of the frequency shift using the 3σ method, where σ represents the standard deviation of the baseline noise. The QCM-D approach achieves an LOD of 3.0nM (1.05ng/mL), significantly below the EU MRL of 4ng/mL [45].
Results and Data Analysis
QCM-D Response to PEN Binding
The QCM-D aptasensor demonstrates concentration-dependent responses to PEN across the tested range of 0.1-100nM. Representative sensorgrams show rapid frequency decreases upon PEN introduction, reaching equilibrium within 5-10 minutes depending on concentration. The steady-state frequency shift (Δf) shows a sigmoidal dependence on PEN concentration, enabling quantitative determination of the dissociation constant (Kd) through nonlinear regression fitting to the Langmuir adsorption model [45].
Simultaneous dissipation increases indicate structural reorganization within the aptamer layer upon PEN binding, consistent with conformational transitions from unstructured to target-bound states. The magnitude of dissipation shift relative to frequency change (ΔD/Δf ratio) provides insights into the viscoelastic properties of the formed complex, with higher ratios indicating more flexible, hydrated structures [45].
Table 2: Quantitative QCM-D Performance Metrics for PEN Detection
| Parameter | QCM-D Performance | Experimental Conditions | Comparative Method (LSPR) |
|---|---|---|---|
| Limit of Detection (LOD) | 3.0 nM (1.05 ng/mL) | PBS buffer, 25°C | 3.1 nM (1.09 ng/mL) [45] |
| Dynamic Range | 1-100 nM | Fundamental frequency 8 MHz | 1-100 nM [45] |
| Response Time | <10 min (equilibrium) | Flow rate: 100 μL/min | <5 min [45] |
| Regeneration Cycles | >5 cycles | 10 mM SDS regeneration | Not applicable |
| Selectivity | >90% against OTC | 100 nM interferent concentration | >85% against OTC [45] |
Comparative Analysis with LSPR Detection
The combined QCM-D/LSPR approach enables complementary analysis of the PEN-aptamer interaction. While QCM-D measures combined mass of the analyte and hydrodynamically coupled solvent, LSPR responds primarily to the dry mass of the bound analyte through local refractive index changes. The similar LOD values (3.0nM for QCM-D vs. 3.1nM for LSPR) confirm that the observed QCM-D signals originate primarily from specific PEN binding rather than non-specific adsorption or bulk effects [45].
The QCM-D platform demonstrates slightly superior selectivity compared to LSPR, with >90% signal retention in the presence of oxytetracycline (OTC) as a non-target antibiotic. This enhanced selectivity derives from QCM-D's ability to distinguish specific binding events through both kinetic profiles and viscoelastic signatures, providing an additional dimension for discrimination beyond mere mass accumulation [45].
Technical Considerations for Food Safety Applications
Sample Preparation and Matrix Effects
For real-world food safety applications, sample preparation represents a critical consideration. Complex food matrices including milk, meat extracts, and honey contain proteins, lipids, and carbohydrates that can foul sensor surfaces and interfere with detection. Effective strategies include simple dilution in PBS buffer, protein precipitation using organic solvents, or filtration through 0.22μm membranes to remove particulate matter [45] [46].
The PEN aptasensor demonstrates robustness to moderate matrix effects, with LOD increases of less than 20% in diluted milk samples compared to buffer measurements. This performance stability derives from the MCH backfilling step, which creates an effective antifouling monolayer that resists non-specific adsorption of matrix components [45].
Sensor Regeneration and Reusability
The developed protocol supports multiple regeneration cycles without significant degradation in sensor response. The SDS regeneration protocol maintains >80% of initial signal response after five complete measurement-regeneration cycles, demonstrating excellent reusability for cost-effective screening applications. For continuous monitoring scenarios, the sensor surface remains stable for at least 48 hours under continuous buffer flow, enabling extended operational timelines [45].
Validation Against Reference Methods
QCM-D results for PEN detection show excellent correlation with established reference methods including HPLC-MS (R²>0.95), confirming measurement accuracy. The slightly higher variability in food matrices (R²=0.89-0.92) reflects the challenges of complex sample backgrounds rather than limitations of the detection principle itself [45].
This case study demonstrates that QCM-D technology provides a robust, sensitive platform for monitoring antibiotic residues in food safety applications. The detection of Penicillin G at 1.05ng/mL significantly surpasses regulatory requirements and offers a rapid, cost-effective alternative to conventional laboratory methods. The dual-parameter measurement of frequency and dissipation shifts enables differentiation between specific binding and non-specific adsorption, a critical advantage for complex food matrices.
Future developments in QCM-D biosensing for food safety will likely focus on multiplexed detection platforms for simultaneous screening of multiple antibiotic classes, integration with microfluidic systems for automated sample processing, and implementation of machine learning algorithms for enhanced data interpretation. Additionally, the combination of QCM-D with complementary techniques such as electrochemical sensing and surface-enhanced Raman spectroscopy could provide comprehensive molecular characterization beyond mass-based detection [46].
The translation of QCM-D technology from research laboratories to routine food safety monitoring will require further validation across diverse food commodities and simplification of operational protocols. However, the compelling performance metrics demonstrated in this case study position QCM-D as a promising tool for advancing surveillance capabilities and protecting consumers from antibiotic residues in the food supply.
Quartz Crystal Microbalance (QCM) is a highly sensitive mass sensing technique that has become a cornerstone in surface science since the 1960s [5]. This precise characterization method operates on the principle of the piezoelectric effect, where an alternating voltage applied to a quartz crystal sensor induces a mechanical oscillation at a specific resonant frequency [5] [32]. The fundamental relationship between mass change and frequency shift was established in 1959 by Günter Sauerbrey, whose celebrated equation enables QCM to detect mass deposition at the nanogram scale [5]. This exceptional sensitivity makes QCM technology particularly valuable for applications requiring precise monitoring of thin films, surface interactions, and molecular adsorption events in both gas and liquid phases [5] [48].
When deployed for polymer screening in vapor pre-concentration applications, QCM provides researchers with a real-time analytical platform for evaluating the adsorption characteristics of various polymer coatings toward target analyte vapors [49]. This capability is crucial for developing advanced sensor systems where selective vapor capture and release significantly enhance detection sensitivity for low-volatility compounds. The technique's ability to provide quantitative binding data under controlled environmental conditions allows for systematic ranking of polymer performance, guiding the selection of optimal materials for specific vapor pre-concentration challenges [49].
QCM Fundamentals and Working Principles
Piezoelectric Effect and Sensor Operation
The core of QCM technology centers on the piezoelectric quartz crystal, typically configured as a thin disk cut at a specific crystallographic orientation (AT-cut) and sandwiched between two metal electrodes [5] [32]. When an alternating voltage is applied across these electrodes, the piezoelectric nature of quartz generates a mechanical deformation—a phenomenon known as the inverse piezoelectric effect [32]. AT-cut quartz crystals are specifically engineered to undergo thickness-shear mode oscillation when excited by an electrical field, meaning the two crystal surfaces move in anti-parallel directions relative to the central plane [5] [32].
This mechanical oscillation achieves maximum efficiency at a specific resonance frequency that is intrinsically determined by the physical properties of the quartz crystal itself. The fundamental relationship is described by the equation:
f = n·υₙ/(2h) [5]
Where:
- f = resonance frequency
- n = overtone number (n = 1, 3, 5, ...)
- υₙ = speed of sound in quartz
- h = thickness of the quartz crystal
This equation reveals that the resonance frequency is inversely proportional to the crystal thickness, with thinner crystals exhibiting higher fundamental frequencies [5]. For conventional AT-cut QCM sensors operating in the fundamental mode, resonance frequencies typically range between 5 and 30 MHz [32].
Mass Detection via the Sauerbrey Equation
The exceptional mass sensitivity of QCM emerges from the direct relationship between the resonant frequency of the oscillating crystal and any mass added to its surface. When a rigid, uniformly distributed mass adheres to the electrode surface, it effectively increases the crystal's thickness, consequently decreasing its resonance frequency [5]. This relationship was quantified by Günter Sauerbrey in 1959 through the equation that bears his name:
Where:
- Δf = measured frequency change (Hz)
- Δm = mass change per unit area (ng/cm²)
- Cₓ = mass sensitivity constant
The mass sensitivity constant Cₓ is determined by the fundamental properties of the piezoelectric quartz material. For a standard 5 MHz AT-cut quartz crystal at room temperature, this constant is approximately 17.7 ng·cm⁻²·Hz⁻¹, enabling the detection of sub-monolayer mass changes at the electrode surface [32]. The negative sign indicates that mass accumulation decreases the resonance frequency, providing a direct quantitative relationship between frequency shift and adsorbed mass.
Figure 1: QCM operates on the piezoelectric effect, where an applied AC voltage induces crystal oscillation at a specific resonance frequency (f₀). Mass adsorption on the sensor surface causes a measurable frequency shift (Δf), which is quantified using the Sauerbrey equation to determine mass uptake.
QCM Experimental Workflow for Polymer Screening
The systematic evaluation of polymers for vapor pre-concentration involves a multi-stage process that progresses from sensor preparation through quantitative analysis of adsorption performance. The workflow below outlines the key experimental stages for screening polymer libraries using QCM technology.
Figure 2: The comprehensive workflow for screening polymers via QCM involves systematic progression from sensor preparation to polymer selection, with key technical considerations at each stage to ensure reliable results.
Sensor Preparation and Polymer Deposition
The initial phase involves preparing the QCM sensors and applying polymer coatings in a controlled, reproducible manner:
- QCM Sensor Selection: Standard QCM sensors typically feature AT-cut quartz crystals with gold electrodes, though specialized configurations may employ other electrode materials such as platinum for specific chemical compatibility requirements [32].
- Polymer Deposition via iCVD: The initiated chemical vapor deposition (iCVD) technique provides an exceptional method for applying uniform, thin polymer films to QCM sensor surfaces [49]. This vapor-phase deposition method enables precise control over film thickness and preserves functional group integrity, making it particularly suitable for creating the consistent polymer coatings required for comparative screening studies.
- Thickness Optimization: Polymer film thickness must be carefully optimized to balance mass uptake capacity against the linear response range of the QCM. Excessively thick films may introduce viscoelastic effects that deviate from the Sauerbrey relationship, complicating mass quantification [48].
QCM Parameter Optimization
Before initiating polymer screening, critical experimental parameters must be established to ensure reliable and reproducible results:
- Vapor Concentration Optimization: Determining the appropriate analyte mass is essential for generating measurable signals while avoiding saturation effects. Recent research with N-phenylpropanamide (NPPA) demonstrated that 0.08 g in a 0.5 L chamber provided optimal vapor concentration, surpassing saturation levels observed at 0.06 g [49].
- Flow Rate Calibration: The carrier gas flow rate significantly influences vapor delivery and adsorption kinetics. A flow rate of 100 mL/min has been successfully employed for vapor pre-concentration studies, providing adequate analyte delivery while maintaining stable QCM operation [49].
- Environmental Control: Maintaining stable temperature and humidity conditions throughout the experiment is crucial, as these factors directly impact quartz crystal resonance frequency and vapor-phase behavior.
Vapor Exposure and Data Acquisition
During the experimental phase, polymer-coated QCM sensors are exposed to target vapor streams while continuously monitoring the sensor response:
- Real-time Frequency Monitoring: As vapor molecules adsorb onto the polymer coating, the increased mass loading causes a progressive decrease in the resonant frequency, with the rate and magnitude of frequency shift reflecting the adsorption kinetics and capacity of each polymer [5] [49].
- Multi-Harmonic Tracking: Advanced QCM systems monitor multiple resonance frequencies (overtones) simultaneously, providing insights into the viscoelastic properties of the polymer films and validating the assumption of rigid mass loading required for Sauerbrey analysis [48].
- Reference Measurements: Simultaneous analysis of an uncoated QCM sensor or one coated with a reference polymer provides a baseline for distinguishing specific adsorption from non-specific binding or environmental artifacts.
Case Study: QCM Screening for Fentanyl Surrogate Pre-concentration
Experimental Context and Objectives
A compelling example of QCM-enabled polymer screening comes from recent research addressing the critical need for enhanced fentanyl detection [49]. With the ongoing opioid crisis posing significant public health challenges, first responders and law enforcement personnel require sensitive, non-contact detection methods for identifying potentially hazardous substances in field settings [49]. The experimental approach targeted N-phenylpropanamide (NPPA) as a vapor-phase surrogate marker for fentanyl, addressing the challenge presented by fentanyl's extremely low volatility, which complicates direct vapor detection, particularly in diluted street samples [49].
The research objective centered on identifying an optimal acrylate-based polymer coating for silicon nanowire (SiNW) pre-concentrators that could efficiently adsorb NPPA vapor from sampled air, subsequently releasing it as a concentrated bolus to enhance detection signal in ion mobility spectrometry (IMS) systems [49]. This pre-concentration strategy specifically addressed the limitation of low analyte vapor availability in the headspace of diluted fentanyl samples, where conventional vapor detection methods often fail [49].
Polymer Library and Experimental Methodology
The investigation systematically evaluated five distinct acrylate-based polymers using QCM as the primary screening platform:
Table 1: Acrylate Polymers Screened for NPPA Pre-concentration
| Polymer Name | Abbreviation | Key Characteristics | Deposition Method |
|---|---|---|---|
| Ethylene Glycol Methyl Ether Acrylate | EGMEA | Hydrophilic, ether functionality | iCVD |
| 2-Hydroxyethyl Methacrylate | HEMA | Hydrophilic, hydroxyl groups | iCVD |
| Butyl Methacrylate | BMA | Hydrophobic, alkyl chain | iCVD |
| Glycidyl Methacrylate | GMA | Reactive epoxide functionality | iCVD |
| Pentabromobenzyl Acrylate | PBBrA | Brominated aromatic rings | iCVD |
The experimental methodology followed a rigorous approach:
- QCM Preparation: Gold-coated QCM crystals were functionalized with each candidate polymer using initiated chemical vapor deposition (iCVD) to ensure uniform, controlled film thickness [49].
- Vapor Exposure: Coated sensors were exposed to NPPA vapor generated from 0.08 g samples in 0.5 L Teflon jars with a carrier gas flow rate maintained at 100 mL/min [49].
- Real-time Monitoring: Frequency shifts were continuously recorded during both adsorption and desorption phases to quantify total mass uptake and binding reversibility [49].
- Data Analysis: The Sauerbrey equation was applied to convert frequency shifts to mass deposition values, enabling direct comparison of polymer performance [49].
Quantitative Results and Performance Ranking
The QCM screening produced clear quantitative differentiation between the candidate polymers, with EGMEA demonstrating superior NPPA adsorption capacity:
Table 2: QCM Screening Results for NPPA Adsorption
| Polymer | Frequency Shift (Hz) | Mass Adsorption (ng/cm²) | Relative Performance |
|---|---|---|---|
| EGMEA | -215.4 ± 12.7 | 381.3 ± 22.5 | Best |
| HEMA | -183.9 ± 15.2 | 325.5 ± 26.9 | Good |
| BMA | -142.6 ± 11.8 | 252.4 ± 20.9 | Moderate |
| GMA | -98.3 ± 9.4 | 174.0 ± 16.6 | Low |
| PBBrA | -67.2 ± 8.1 | 118.9 ± 14.3 | Lowest |
The significant frequency shift observed for EGMEA-coated sensors (-215.4 Hz) corresponded to a mass adsorption of 381.3 ng/cm², representing approximately 80% greater NPPA uptake compared to the lowest-performing polymer (PBBrA) [49]. This substantial performance differential highlights the critical importance of polymer functional groups in determining vapor adsorption efficiency, with the ether functionality of EGMEA appearing particularly favorable for NPPA interaction.
Validation and Technology Transfer
Following the QCM screening phase, the top-performing polymer (EGMEA) was transferred to a functional pre-concentrator platform to validate its practical efficacy:
- Silicon Nanowire Integration: EGMEA was deposited onto high-surface-area silicon nanowire (SiNW) arrays using the same iCVD process employed for QCM sensor coating [49].
- Performance Verification: The EGMEA-coated SiNW devices exhibited significantly enhanced NPPA vapor adsorption compared to uncoated SiNWs, confirming the transferability of the QCM screening results to operational hardware [49].
- Analytical Confirmation: Gas chromatography-mass spectrometry (GC-MS) analysis provided independent validation of the pre-concentrator's efficacy, quantifying the increased NPPA capture enabled by the optimal polymer coating [49].
This successful technology transfer from analytical screening platform to functional device underscores the utility of QCM as a predictive tool for materials development in vapor pre-concentration applications.
Advanced QCM Methodologies and Technical Considerations
QCM with Dissipation Monitoring (QCM-D)
For polymer screening applications, traditional QCM approaches based solely on frequency measurements may provide incomplete characterization, particularly when studying thick or viscoelastic polymer films. QCM-D (Quartz Crystal Microbalance with Dissipation Monitoring) addresses this limitation by simultaneously measuring both frequency shifts (Δf) and energy dissipation (ΔD) [48]. This advanced capability provides crucial insights into the viscoelastic properties of adsorbed layers, enabling researchers to:
- Differentiate between rigid and soft films: The Sauerbrey equation remains quantitatively valid only for rigid, thin films where energy dissipation is minimal. QCM-D identifies conditions where this assumption holds [48].
- Characterize hydration states: Polymer swelling in response to vapor exposure can significantly influence adsorption behavior, an effect detectable through dissipation monitoring [48].
- Study kinetic processes: The temporal evolution of both frequency and dissipation signals reveals details about adsorption mechanisms and polymer rearrangement during vapor uptake [48].
Technical Considerations for Reliable QCM Analysis
Several technical factors must be addressed to ensure robust, interpretable QCM data in polymer screening applications:
- Mass Loading Limitations: The linear relationship between frequency shift and mass accumulation predicted by the Sauerbrey equation eventually breaks down with increasing film thickness. As a general guideline, frequency shifts exceeding 2% of the fundamental resonance frequency may indicate departure from Sauerbrey conditions [48].
- Viscoelastic Effects: Soft, hydrated, or highly viscoelastic polymer films may dissipate significant vibrational energy, complicating mass quantification. QCM-D measurements provide the additional parameters needed to model such systems using appropriate viscoelastic models [48].
- Environmental Stability: Temperature fluctuations as small as 0.1°C can cause measurable frequency drifts, necessitating careful environmental control throughout experiments [32].
- Non-Mass Effects: Frequency shifts can occasionally arise from factors other than mass loading, including surface stress, interfacial slip, or changes in interfacial viscosity. Appropriate control experiments help distinguish these effects from genuine mass uptake [32].
The Scientist's Toolkit: Essential Research Reagents and Materials
Successful execution of QCM-based polymer screening requires careful selection of materials and reagents across multiple experimental domains:
Table 3: Essential Research Materials for QCM Polymer Screening
| Category | Specific Materials | Function and Application |
|---|---|---|
| QCM Sensors | AT-cut quartz crystals with gold electrodes (5-10 MHz) | Piezoelectric transduction platform for mass detection [5] [32] |
| Electrode Materials | Chromium/Titanium adhesion layers, Gold/Platinum electrodes | Provide electrical contact and surface for functionalization [32] |
| Polymer Deposition | Acrylate monomers (EGMEA, HEMA, BMA, GMA, PBBrA), Initiators for iCVD | Form selective thin films for vapor capture [49] |
| Vapor Generation | Target analytes (e.g., NPPA for fentanyl detection), Inert carrier gases | Create controlled vapor streams for adsorption studies [49] |
| Reference Materials | Uncoated QCM sensors, Standard polymers with known adsorption properties | Establish baseline responses and validate measurement accuracy [49] |
| Calibration Standards | Mass calibration kits, Temperature standards | Ensure quantitative accuracy and system performance validation |
Quartz Crystal Microbalance technology represents a powerful analytical platform for the systematic screening and evaluation of polymer materials for vapor pre-concentration applications. The technique's exceptional mass sensitivity, real-time monitoring capability, and quantitative output enable researchers to efficiently rank polymer performance based on adsorption capacity and kinetics. The case study involving NPPA pre-concentration for fentanyl detection exemplifies the practical utility of this approach, where QCM screening identified ethylene glycol methyl ether acrylate (EGMEA) as the optimal polymer from a candidate library of five acrylates, with subsequent validation confirming enhanced performance in functional silicon nanowire pre-concentrators [49].
As QCM technology continues to evolve, advanced configurations including QCM-D provide increasingly sophisticated characterization capabilities, particularly for complex viscoelastic polymer systems [48]. When integrated with complementary analytical techniques and implemented with appropriate experimental controls, QCM-based polymer screening offers a robust methodology for accelerating the development of advanced vapor pre-concentration materials, with significant implications for sensing applications across environmental monitoring, pharmaceutical development, and security fields. The ongoing innovation in QCM instrumentation, including higher frequency operation, multi-channel arrays, and enhanced data analytics, promises to further expand the utility of this technique for future materials characterization challenges [31] [32].
Mastering QCM-D: Essential Tips for Troubleshooting and Data Quality Optimization
In Quartz Crystal Microbalance (QCM) and QCM with Dissipation (QCM-D) research, a stable baseline is not merely a preliminary step but a fundamental prerequisite for generating reliable, interpretable data. The baseline represents the steady-state resonant frequency (f) and dissipation (D) signals of a clean sensor in a reference fluid (e.g., air or buffer) before the introduction of the analyte of interest [50]. All subsequent measured frequency and dissipation data are analyzed relative to these initial reference values [50]. When no surface reaction is occurring, these reference values are expected to remain constant over time. A drifting baseline—where these values shift uncontrollably—introduces significant ambiguity, making it difficult or impossible to determine which reference points should be used for quantifying the changes caused by the process under investigation [50]. Achieving a stable baseline is therefore the critical first step that underpins the entire experimental workflow, from initial setup to data interpretation.
The Critical Factors Influencing Baseline Stability
All baseline drift is attributable to physical processes that affect the resonant frequency and energy dissipation of the quartz crystal [50]. The measured f and D values are exquisitely sensitive to a multitude of experimental factors. The path to an optimized baseline involves the systematic elimination of variables that induce unwanted and uncontrolled changes, ensuring that the final signals reflect only the processes intended for measurement [50]. A robust instrument setup with precise temperature control provides a strong foundation, but numerous experimental variables must also be managed.
The following table summarizes the primary factors that can destabilize a QCM baseline and suggests mitigation strategies.
Table 1: Factors Affecting QCM Baseline Stability and Corrective Actions
| Factor | Impact on Baseline | Corrective Actions |
|---|---|---|
| Temperature Fluctuations [50] | Alters liquid density/viscosity, causing f and D drift. | Use instruments with active temperature control; allow sufficient warm-up time; equilibrate all solutions to measurement temperature. |
| Air Bubbles [50] | Introduce sharp, unpredictable frequency and dissipation spikes. | Carefully degas buffers and samples; ensure proper priming of flow system; inspect sensor surface visually before measurement. |
| Sensor Mounting Stresses [50] | Uneven pressure on the crystal causes long-term f and D drift. | Follow manufacturer's torque specifications for the flow chamber; ensure O-rings are clean and properly seated. |
| Unanticipated Surface Reactions [50] | Interactions between sensor coating and solvent (e.g., swelling, dissolution) manifest as drift. | Verify chemical compatibility of sensor coating with solvent; test for coating stability in the reference fluid. |
| O-ring Swelling [50] | Changes pressure on crystal, leading to drift, particularly in liquid. | Select O-ring material (e.g., perfluoroelastomer) chemically resistant to the solvents used. |
| Solvent Leaks [50] | Cause slow, continuous drift as the liquid environment changes. | Perform a dry assembly check; verify all fittings are secure and sealed. |
| Pressure Changes [50] | Affect crystal oscillation, resulting in f and D shifts. | Stabilize fluid flow rates (e.g., using pulse-dampeners for peristaltic pumps). |
| Bad Electrical Contact [50] | Generates signal noise and instability. | Ensure sensor and chamber contacts are clean and secure. |
| Contaminated Sensor Surface | Adsorption of contaminants from the environment or impure solutions causes mass increase. | Employ rigorous sensor cleaning protocols before mounting; use high-purity solvents and buffers. |
Quantitative Benchmarks and Measurement Protocols
Expected Baseline Performance
Under well-controlled conditions, the stability of a QCM system can be quantified. For a typical clean 5 MHz sensor with a non-reactive coating, operated at 25°C and measured at the 3rd overtone, the following drift rates can be expected as a reference [50]:
Table 2: Typical Baseline Stability Benchmarks for a 5 MHz Sensor
| Medium | Frequency Drift (Δf/h) | Dissipation Drift (ΔD/h) |
|---|---|---|
| In Air | < 0.5 Hz | < 2 x 10⁻⁸ |
| In Water | < 1.5 Hz | < 2 x 10⁻⁷ |
A Standard Protocol for Sensor Preparation and Baseline Acquisition
A reproducible protocol is essential for achieving a stable baseline. The following detailed methodology, adapted from established procedures, ensures a clean starting surface [51].
Objective: To clean, mount, and equilibrate a QCM sensor to obtain a stable baseline in the chosen reference fluid.
Materials:
- Research Reagent Solutions & Materials:
- QCM Sensor Chips (e.g., Borosilicate-coated quartz sensor crystals): The piezoelectric transducer at the heart of the measurement [51].
- Surfactant Solution (e.g., 2% w/v Sodium Dodecyl Sulfate, SDS): To remove organic contaminants and grease from the sensor surface [51].
- Ultrapure Water: For rinsing away surfactants and salts without leaving residues.
- UV/Ozone Cleaner: For oxidative removal of trace organic contaminants following chemical cleaning [51].
- Reference Fluid (e.g., buffer, ultrapure water): The solvent in which the baseline and subsequent experiment will be performed.
- Stream of Inert Gas (e.g., Nitrogen, N₂): For drying the sensor without introducing fibers or contaminants.
Procedure:
- Chemical Cleaning: Immerse the sensor crystal in a 2% w/v SDS solution for 30 minutes [51].
- Rinsing: Thoroughly rinse the sensor with copious amounts of ultrapure water to completely remove all traces of the surfactant.
- Drying: Gently dry the sensor surface using a stream of clean, dry inert gas.
- UV/Ozone Treatment: Subject the sensor to a final UV/ozone treatment for 10 minutes to oxidize any remaining organic residues [51].
- Sensor Mounting: Carefully mount the cleaned sensor into the QCM flow chamber. Adhere strictly to the manufacturer's specified torque settings to avoid mounting stresses that induce baseline drift [50].
- System Priming: Prime the entire fluidic path of the instrument with the degassed reference fluid, meticulously checking for and eliminating any air bubbles within the system [50].
- Baseline Acquisition: Initiate the measurement and monitor the frequency (f) and dissipation (D) signals at multiple overtones in real-time. The baseline is considered stable when the drift rates for all relevant overtones fall below the acceptable thresholds (e.g., those in Table 2) for a continuous period of 10-15 minutes.
A Systematic Workflow for Baseline Troubleshooting
When faced with an unstable baseline, a logical, step-by-step diagnostic approach is required. The following diagram maps the troubleshooting pathway to identify and rectify the most common issues.
Diagram 1: A logical workflow for diagnosing and resolving common QCM baseline instability issues.
A stable baseline is the non-negotiable foundation of any rigorous QCM or QCM-D study. It transforms the instrument from a simple recorder of physical changes into a precise tool for quantitative scientific discovery. By understanding the underlying factors that cause drift, adhering to standardized preparation and acquisition protocols, and employing a systematic troubleshooting methodology, researchers can ensure that their data truly reflects the biomolecular interactions, material properties, or sensing events they intend to study. Mastering this critical first step paves the way for reliable data, valid conclusions, and ultimately, successful research outcomes.
Interpreting Multi-Harmonic Data for Rigid vs. Viscoelastic Layers
Quartz Crystal Microbalance with Dissipation monitoring (QCM-D) is a surface-sensitive, real-time technology that detects mass changes at the sensor surface with nanoscale resolution by monitoring changes in the resonance frequency (Δf) of a quartz crystal [52]. In addition to mass changes, QCM-D captures energy loss (dissipation, ΔD), providing crucial insight into the viscoelastic properties of the molecular layer at the sensor surface [52]. The multi-harmonic capability of advanced QCM-D instruments represents a significant technological evolution, enabling researchers to excite the quartz crystal at multiple frequencies (fundamental frequency and overtones) rather than just a single frequency [53]. This multi-frequency measurement provides a powerful analytical toolkit for distinguishing between rigid and viscoelastic layers, which is essential for accurate interpretation of biomolecular interactions in applications ranging from fundamental biointerface research to pharmaceutical development [54] [55].
The core principle underlying multi-harmonic analysis is that each harmonic probes the system under study at a different frequency and penetration depth [29]. When a quartz crystal is excited, it can resonate at several harmonics labeled with a number 'n' (n=1, 3, 5, 7...), where n=1 represents the fundamental frequency and n>1 represents the overtones [29]. For example, a crystal with a 5 MHz fundamental frequency will have overtones at 15, 25, 35, 45, 55, and 65 MHz [29]. Each harmonic provides unique information about the system, and comparing the response across multiple harmonics enables researchers to characterize material properties with much greater confidence than single-frequency measurements allow [29].
Theoretical Basis for Harmonic Analysis
QCM-D Physical Principles
The QCM-D technique relies on the piezoelectric properties of quartz crystals, which enable conversion between electrical and mechanical energy [52] [24]. When an alternating voltage is applied to the crystal via surface electrodes, it induces mechanical oscillations in the form of standing shear waves [52] [24]. The resonance frequency of these oscillations is highly sensitive to mass changes at the crystal surface, while the dissipation factor (D) quantifies the energy losses in the system [52]. The dissipation parameter is defined as the inverse quality factor of the resonance (D = w/fr) and quantifies the damping in the system [24]. For AT-cut quartz crystals, which oscillate in thickness shear mode, only odd harmonics (n=1, 3, 5, 7...) can be electrically excited due to the antisymmetric pattern of motion required to generate current between the electrodes [29] [26].
The relationship between frequency change and mass was first established by Günther Sauerbrey in 1959 through the Sauerbrey equation, which states:
Δm = -C · (Δf/n)
Where Δm is the mass change per unit area, C is the mass sensitivity constant, Δf is the frequency shift, and n is the overtone number [52]. The mass sensitivity constant C is determined by the properties of quartz and the fundamental resonant frequency [52]. However, this equation relies on critical assumptions: the adsorbed layer must be thin, rigid, and firmly attached to the surface [52]. When these conditions are not met, as is often the case with soft, hydrated biological layers, the Sauerbrey relation typically underestimates the true mass, necessitating more sophisticated analysis approaches [52].
Information Content in Multiple Harmonics
Multi-harmonic measurements provide a powerful advantage because each frequency probes the system under study with different sensitivity profiles [29]. The higher overtones have shallower penetration depths into the adjacent medium and are more sensitive to regions closer to the sensor surface [29]. When measuring a rigid, Sauerbrey-compliant film, the mechanical response does not depend on the frequency, and all harmonics will provide consistent mass information [26]. In contrast, viscoelastic materials exhibit frequency-dependent mechanical responses, causing different harmonics to yield different apparent mass and dissipation values [26].
Table 1: Information Content in Different Harmonics
| Harmonic Order | Frequency (MHz) for 5 MHz crystal | Probing Characteristics | Primary Applications |
|---|---|---|---|
| Fundamental (n=1) | 5 MHz | Deeper penetration, more sensitive to bulk properties | Initial adsorption kinetics, baseline establishment |
| Low overtones (n=3, 5) | 15, 25 MHz | Balanced sensitivity to viscoelastic properties | Standard viscoelastic characterization |
| High overtones (n=7, 9, 11) | 35, 45, 55 MHz | Shallow penetration, surface-sensitive | Detailed analysis of layer architecture near interface |
The qualitative comparison between single-harmonic and multi-harmonic measurements has been likened to the difference between black-and-white and color photography [29]. A black-and-white photograph (single harmonic) may reveal the basic shape of an object, but only a color photograph (multiple harmonics) can confirm whether the object truly lacks color or simply appears that way in monochrome [29]. Similarly, multi-harmonic QCM-D provides the necessary information to confidently distinguish between rigid and viscoelastic layers and to extract accurate quantitative parameters through viscoelastic modeling [29].
Discriminating Between Rigid and Viscoelastic Layers
Characteristic Signatures in Raw Data
The distinction between rigid and viscoelastic layers is immediately apparent in multi-harmonic QCM-D raw data through two key signatures: the magnitude of the dissipation shift and the behavior of the frequency shifts across different harmonics [18].
For rigid layers, the defining characteristics include:
- Minimal dissipation shift: ΔD is close to zero, indicating negligible energy loss and purely elastic behavior [18].
- Overlapping normalized frequency shifts: When frequency changes (Δf) are normalized by harmonic order (Δf/n), the values for different harmonics fall on the same line, indicating frequency-independent behavior [53] [26].
- Sauerbrey validity: The constant Δf/n relationship across harmonics validates the use of the Sauerbrey equation for mass quantification [26].
For viscoelastic layers, the distinguishing features include:
- Significant dissipation shift: ΔD > 0, indicating substantial energy loss due to the viscous component of the film [18].
- Spreading harmonics: The normalized frequency shifts (Δf/n) differ across harmonics, creating a characteristic spread in the data [18]. This frequency-dependent response is the hallmark of viscoelastic behavior.
- Invalid Sauerbrey application: The varying Δf/n relationship across harmonics indicates that the Sauerbrey equation would yield inaccurate mass calculations [18].
Table 2: Characteristic Signatures of Rigid vs. Viscoelastic Layers
| Parameter | Rigid Layer | Viscoelastic Layer |
|---|---|---|
| Dissipation Shift (ΔD) | Near zero (ΔD ≈ 0) | Significant (ΔD > 0) |
| Normalized Frequency (Δf/n) | Constant across harmonics | Spreads across harmonics |
| Sauerbrey Applicability | Valid | Invalid |
| Molecular Examples | Thin metallic films, self-assembled monolayers | Polymer hydrogels, protein layers, lipid bilayers |
| Quantitative Approach | Sauerbrey equation | Viscoelastic modeling |
Diagnostic Diagram: Layer Classification
The following workflow diagram illustrates the decision process for classifying layer properties based on multi-harmonic QCM-D data:
This decision process enables researchers to systematically evaluate their QCM-D data and select the appropriate quantitative analysis method, thereby avoiding the common pitfall of misapplying the Sauerbrey equation to soft, viscoelastic layers [18].
Quantitative Analysis Methods
Sauerbrey Equation for Rigid Films
The Sauerbrey equation remains the standard method for mass quantification of rigid, thin films that meet the necessary criteria [52]. The equation provides a direct proportionality between the frequency shift and mass change:
Δm = -C · (Δf/n)
Where C is the mass sensitivity constant specific to the crystal properties [52]. For a 5 MHz crystal, the theoretical mass sensitivity is 17.7 ng/(cm²·Hz), while a 10 MHz crystal offers higher sensitivity at 4.4 ng/(cm²·Hz) due to its higher fundamental resonant frequency [52]. The Sauerbrey relationship is particularly valuable for its simplicity and straightforward interpretation, but its application must be restricted to systems that genuinely satisfy the underlying assumptions of thin, rigid, and firmly attached layers [52].
Viscoelastic Modeling for Soft Films
For viscoelastic layers that exhibit significant dissipation shifts and spreading harmonics, viscoelastic modeling provides the necessary framework for quantitative analysis [18]. The most common approach utilizes the Voigt model, which represents the viscoelastic film as a spring (elastic component) and dashpot (viscous component) in parallel [18]. This model contains several unknown parameters that must be fitted to the experimental data, including thickness, viscosity, shear modulus, and potentially the frequency dependence of these properties [18].
The mathematical requirement for viscoelastic modeling drives the necessity for multi-harmonic measurements [29]. A frequency-independent viscoelastic model typically has three unknown parameters, while a frequency-dependent model has five unknowns [18]. Since each harmonic provides two measured variables (Δf and ΔD), a minimum of two harmonics is required for the simpler model and three for the frequency-dependent model [18]. In practice, however, using as many harmonics as possible (typically 5-7) significantly improves the reliability of the fitting procedure by providing more data points to constrain the model parameters and compensate for experimental noise [29] [18].
Table 3: Quantitative Analysis Methods for QCM-D Data
| Analysis Method | Applicable Systems | Input Requirements | Output Parameters | Limitations |
|---|---|---|---|---|
| Sauerbrey Equation | Rigid, thin films (ΔD ≈ 0, Δf/n constant) | Δf from one harmonic | Areal mass (ng/cm²) | Underestimates mass for soft, hydrated films |
| Viscoelastic Modeling (Voigt) | Soft, viscoelastic layers (ΔD > 0, spreading harmonics) | Δf and ΔD from multiple harmonics (≥3 recommended) | Thickness, viscosity, shear modulus, hydrated mass | Requires multiple harmonics; Model-dependent results |
Experimental Protocols for Multi-Harmonic Analysis
Standard Measurement Workflow
The following diagram outlines the comprehensive experimental workflow for multi-harmonic QCM-D analysis, from sensor preparation to data interpretation:
The Scientist's Toolkit: Essential Research Reagents and Materials
Successful multi-harmonic QCM-D analysis requires careful selection of instrumentation, sensors, and auxiliary materials. The following table details key components of the experimental toolkit:
Table 4: Essential Research Reagents and Solutions for Multi-Harmonic QCM-D
| Item | Function/Purpose | Technical Specifications | Selection Criteria |
|---|---|---|---|
| QCM-D Instrument | Multi-harmonic frequency and dissipation monitoring | 7 harmonics (n=1-13), 5 MHz fundamental frequency; Frequency noise: <0.03 Hz; Dissipation noise: <12×10⁻⁹ [56] | Harmonic capacity, detection limits, temperature control, automation capabilities |
| Sensor Chips | Measurement substrate with specific surface chemistry | 5 MHz AT-cut quartz; 50+ available coatings (metals, oxides, polymers, functionalized surfaces) [54] [56] | Surface energy, functional groups, biocompatibility, reproducibility |
| Reference Buffer | Baseline establishment and control measurements | Matches sample pH, ionic strength, and chemical composition | Purity, compatibility with sample and sensor, stable baseline performance |
| Peristaltic Pump | Controlled fluid delivery for reproducible hydrodynamics | Flow rate range: 1-100 μL/min depending on configuration [54] [56] | Precision, pulsation minimization, chemical compatibility with solutions |
| Temperature Control | Maintain constant experimental conditions | Range: 4-70°C (extendable to 4-150°C with accessory chamber) [54] | Stability (±0.02°C/h), range, compatibility with flow system |
| Analysis Software | Viscoelastic modeling and data interpretation | Multi-harmonic fitting algorithms (e.g., Dfind software) [54] [56] | Modeling capabilities, user interface, data export functions |
Practical Implementation Considerations
Implementing multi-harmonic QCM-D analysis requires attention to several practical aspects. Sensor selection is critical, as the surface chemistry must appropriately represent the system under study while ensuring robust attachment of the adsorbed layer [54] [56]. Flow rate optimization balances mass transport to the surface with minimal hydrodynamic disturbance, with typical flow rates ranging from 20-100 μL/min depending on the chamber configuration [54]. Temperature stability must be maintained within ±0.02°C/h to prevent thermal drift from obscuring small frequency shifts [56]. Harmonic selection should include as many harmonics as possible (typically 5-7) to provide sufficient constraints for viscoelastic modeling [29] [18]. Finally, time resolution can be optimized based on experimental needs, with faster acquisition rates available at the cost of increased noise [56].
Applications in Biomolecular Research
Case Study: Antibody Adsorption and Stability
A compelling example of multi-harmonic analysis in pharmaceutical research comes from a study investigating the surface-induced stability changes of bioengineered antibodies [55]. Researchers examined the adsorption behavior of two monoclonal antibodies (COE-3 and COE-7) on different material substrates relevant to biopharmaceutical production and storage [55]. Multi-harmonic QCM-D revealed strikingly different behaviors: COE-3 formed stable, rigid layers on all surfaces with minimal structural changes, while COE-7 formed viscoelastic layers on silicon dioxide (SiO₂) and titanium dioxide (TiO₂) that underwent gradual compaction over time [55]. The characteristic signatures of viscoelasticity—significant dissipation shifts and spreading harmonics—enabled researchers to identify this compaction phenomenon and correlate it with conformational changes in the antibody structure [55]. This application demonstrates how multi-harmonic QCM-D provides critical insights for biopharmaceutical development, where protein stability at interfaces directly impacts drug efficacy and safety [55].
Application Across Biomolecular Systems
The discrimination between rigid and viscoelastic layers using multi-harmonic QCM-D has enabled advances across diverse biomolecular systems:
- Protein adsorption: Distinguishing between rigid monolayer adsorption versus formation of soft, multilayered protein films [52].
- Lipid bilayer formation: Characterizing the transition from adsorbed vesicles to supported lipid bilayers, where the dissipation decreases dramatically as the system evolves from a soft, viscoelastic state to a more rigid, fluid bilayer [52].
- Polymer brush behavior: Monitoring swelling and collapse transitions in responsive polymer systems, where large changes in dissipation and harmonic spreading indicate substantial changes in hydration and chain mobility [52] [56].
- Cellular interactions: Detecting the initial attachment and subsequent strengthening of cell-surface contacts, manifested as evolving viscoelastic signatures [52].
In each application, the multi-harmonic capability provides the essential data needed to distinguish between these different interaction modes and quantitatively characterize the resulting interfacial architectures.
Multi-harmonic QCM-D analysis represents a powerful advancement in interfacial characterization technology, providing researchers with the necessary tools to confidently distinguish between rigid and viscoelastic layers. The key to this discrimination lies in two fundamental signatures in the raw data: the magnitude of the dissipation shift and the behavior of normalized frequency changes across multiple harmonics [18]. For rigid layers, minimal dissipation and consistent Δf/n values across harmonics validate the use of the Sauerbrey equation for straightforward mass quantification [53] [26]. For viscoelastic layers, significant dissipation shifts and spreading harmonics indicate frequency-dependent material properties that require viscoelastic modeling for accurate quantification [18].
The experimental workflow for multi-harmonic analysis involves careful sensor preparation, baseline establishment, controlled sample introduction, and comprehensive data collection across multiple harmonics [54] [56]. The resulting data enables researchers to select the appropriate analysis method—either the simplified Sauerbrey approach for rigid films or more sophisticated viscoelastic modeling for soft layers—ensuring accurate quantification of material properties including hydrated mass, thickness, viscosity, and elastic modulus [18]. As demonstrated in pharmaceutical antibody research [55] and numerous other biomolecular applications, this analytical capability provides critical insights into interfacial processes that directly impact material performance, biological function, and product development across diverse scientific and technological domains.
The Quartz Crystal Microbalance (QCM) and its dissipation monitoring variant (QCM-D) are powerful tools for studying interfacial processes in diverse fields, from polymer science to drug development. The core operating principle relies on monitoring changes in a quartz crystal's resonance frequency (Δf) and energy dissipation (ΔD) [57]. When mass adsorbs or binds to the sensor surface, it decreases the resonance frequency, while changes in the viscoelastic properties of the adsorbed layer affect how vibrational energy dissipates [57]. The optimal timing for starting and stopping measurements is not arbitrary; it is fundamentally tied to the kinetic and thermodynamic properties of the system under investigation and determines the quality, reliability, and interpretability of the acquired data.
Proper experiment duration ensures that the system reaches meaningful endpoints—whether equilibrium, steady-state, or a specific kinetic milestone—while avoiding artifacts from instrument drift or environmental fluctuations. For researchers in drug development, this timing is particularly critical when studying binding events, conformational changes, or hydration dynamics of biomolecular layers, as these processes occur over distinct and varying timescales [58].
Foundational Principles of QCM Operation
The Gravimetric and Viscoelastic Response
The QCM functions based on the inverse piezoelectric effect, where an oscillating electric field induces a shear deformation in the quartz crystal. The initial Sauerbrey equation established the relationship between mass accumulation and frequency shift: Δf = -C·Δm, where C is the mass sensitivity constant [57]. This relationship holds for thin, rigid, and uniformly adsorbed films in air or vacuum. However, most biological and soft matter systems in liquid environments deviate from these ideal conditions, necessitating more advanced interpretation that includes the dissipation factor.
The dissipation factor (D) describes the damping of the crystal's oscillation after the driving power is switched off and provides crucial information about the viscoelasticity of the adsorbed layer [57]. The simultaneous measurement of both frequency and dissipation shifts (QCM-D) enables researchers to distinguish between rigid mass binding (Δf decreases, ΔD shows minimal change) and soft, viscoelastic film formation (Δf decreases, ΔD increases significantly) [58].
The Small-Load Approximation and Acoustic Modeling
For quantitative analysis beyond the Sauerbrey regime, the acoustic multilayer formalism provides a comprehensive modeling framework [57]. This approach treats the sensor with its accumulated layers as a stack of viscoelastic media, each characterized by thickness, density, and shear modulus. The governing "small-load approximation" relates complex frequency shifts (Δf + iΔD) to the mechanical impedance of the adsorbed layers [57].
The practical implication for experiment duration is that sufficient data points must be collected across the kinetic trajectory to reliably fit these physical models, especially when studying time-dependent phenomena like polymer swelling, protein conformational changes, or cellular adhesion processes.
Determining Measurement Start Points
Establishing a Stable Baseline
The pre-measurement baseline serves as the critical reference point against which all changes are measured. Insufficient baseline stabilization represents a common pitfall that compromises data integrity.
- Duration: A stable baseline should be established for a minimum of 5-10 minutes, or until the frequency drift falls below 1-2 Hz/minute for liquid measurements [59].
- Criteria: Stability is achieved when both frequency and dissipation values show random fluctuations around a steady mean without systematic drift.
- Liquid Environment: For measurements in liquid, the baseline should be established with the exact solvent or buffer to be used in the experiment, as viscosity and density differences affect the fundamental resonance [57].
The following workflow outlines the recommended procedure for establishing this critical baseline and determining the optimal start point for introducing samples:
Initiating the Experimental Timeline
The precise start point varies by experimental design:
- Adsorption Kinetics: Begin measurement immediately before introducing the analyte to capture the entire adsorption trajectory from initial binding to equilibrium.
- Stimulus-Response Studies: Start measurements during the baseline period before applying the stimulus (e.g., temperature change, chemical additive) to establish a proper internal control.
- Long-Term Stability: For degradation or transformation studies, begin measurements after system assembly but before expected changes commence.
Determining Measurement End Points
Kinetic and Equilibrium End Points
Determining when to stop measurements depends on the experimental objectives and the observed system behavior. The appropriate endpoint differs fundamentally based on whether the system demonstrates equilibrium kinetics, steady-state behavior, or complex multiphase binding.
Quantitative Criteria for Ending Measurements
The following table summarizes quantitative criteria for determining appropriate end points across different experimental scenarios:
Table 1: Decision Criteria for Ending QCM Measurements
| Experiment Type | Primary End Point Criteria | Secondary Criteria | Typical Duration Range |
|---|---|---|---|
| Adsorption Kinetics | Rate of change < 1 Hz/15 minutes for 3 consecutive readings | Dissipation stabilization (< 0.1×10⁻⁶/15 minutes) | 30 minutes to 4 hours |
| Binding Saturation | Successive Δf measurements differ by < 2% | Scatchard or Langmuir plot shows plateau | 1-3 hours |
| Structural Transitions | Clear inflection point in f/D response completed | Additional overtones show consistent pattern | Varies widely (minutes to days) |
| Hydration/Dehydration | Mass stabilization after humidity change | Return to baseline upon reversal | 1-6 hours |
| Polymer Swelling | Equilibrium swelling ratio achieved | Model-fitting parameters stabilize | 2-8 hours |
For binding studies in drug development, continue measurements until clear saturation is observed, indicated when successive Δf measurements differ by less than 2%. In polymer hydration research, such as studies of PLL-g-PEG and PLL-g-dextran copolymers, equilibrium is typically reached within 1-2 hours, after which the hydration capacity (quantified as areal solvation Ψ) can be accurately calculated from the QCM-D and OWLS data [58].
Experimental Protocols for Different Systems
Protocol for Protein Adsorption Studies
Protein adsorption represents a common application where timing critically affects data interpretation.
- Pre-adsorption Phase: Establish baseline in appropriate buffer (e.g., PBS) for minimum 10 minutes until frequency stability ≤ 1 Hz/minute.
- Adsorption Phase: Introduce protein solution at time t=0. Continue measurement until frequency stabilizes (Δf < 1 Hz/15 minutes) for at least 30 minutes.
- Rinsing Phase: Replace protein solution with clean buffer. Continue monitoring until stable signal confirms irreversibly bound fraction.
- Total Duration: Typically 2-3 hours sufficient for most monolayer protein adsorption studies.
Protocol for Polymer Hydration Measurements
The combination of QCM-D with optical techniques like OWLS enables quantification of hydration capacity, as demonstrated in studies comparing PLL-g-PEG and PLL-g-dextran copolymers [58].
- Dry Mass Determination: First, measure polymer "dry mass" using OWLS after adsorption equilibrium is reached.
- QCM-D Hydration Measurement: Monitor frequency and dissipation shifts throughout polymer adsorption and subsequent buffer rinsing.
- Solvation Calculation: Calculate areal solvation Ψ by subtracting OWLS dry mass from QCM-D hydrated mass.
- Critical Timing: Continue QCM-D measurements until both frequency and dissipation stabilize after rinsing, indicating equilibrium hydration state (typically 60-90 minutes post-rinsing).
Extended-Duration Experiments
Some systems require significantly longer measurement periods:
- Cell Adhesion and Spreading: Continue for 4-24 hours to capture initial attachment, spreading, and maturation of focal adhesions.
- Degradation Studies: Duration depends on degradation kinetics—from hours for enzyme-mediated degradation to days for hydrolytic degradation.
- Environmental Exposure: For corrosion, fouling, or environmental aging studies, continue for days to weeks with periodic monitoring.
For extended measurements, implement temperature control within ±0.1°C and consider periodic baseline checks with reference solutions to distinguish instrument drift from sample effects.
The Scientist's Toolkit: Essential Materials and Reagents
Table 2: Essential Research Reagents and Materials for QCM-D Experiments
| Item | Function/Application | Technical Considerations |
|---|---|---|
| Gold-coated QCM Sensors | Standard substrate for biomolecular adsorption | Clean with UV-ozone or piranha solution before use [59] |
| PLL-g-PEG Copolymers | Model polymer brushes for hydration studies | Fixed PLL MW (20 kDa) with varying PEG chain length and grafting density [58] |
| PLL-g-dextran Copolymers | Glycan-based brush layers for comparison studies | Vary dextran MW (5-20 kDa) and grafting ratio [58] |
| Phosphate Buffered Saline (PBS) | Standard physiological buffer for biological studies | Filter through 0.22 μm membrane to remove particulates |
| Sodium Dodecyl Sulfate (SDS) | Cleaning solution for post-measurement instrument care | Use 2% solution for removing proteinaceous deposits [59] |
| Hellmanex II | Specialty detergent for thorough flow path cleaning | Follow manufacturer recommendations for concentration and exposure time [59] |
| O-rings and Gaskets | Flow system seals and consumables | Visual inspection before each use; replace at least annually [59] |
| Dedicated Cleaning Sensor | Instrument maintenance without wasting functional sensors | Use retired sensor with intact electrode for cleaning protocols [59] |
Data Interpretation in Relation to Measurement Duration
The duration of measurement directly impacts the quality and interpretability of QCM-D data. For quantitative modeling, ensure the measurement captures the entire process from initial perturbation to complete system response. The acoustic multilayer formalism and small-load approximation require sufficient data points across the entire kinetic trajectory to reliably fit physical parameters [57].
When comparing systems with different kinetics, such as PLL-g-PEG versus PLL-g-dextran hydration, consistent measurement durations are critical for meaningful comparison. In such studies, the higher hydration capacity of PEG chains (2-3 water molecules per ethylene oxide unit) compared to dextran (approximately 0.5-0.9 water molecules per OH group) emerges only after reaching equilibrium hydration states [58].
For complex processes with multiple stages, such as initial binding followed by conformational changes, ensure the measurement duration is sufficient to capture all relevant phases. Incomplete measurements may miss critical late-stage transitions that fundamentally alter data interpretation.
Optimal QCM experiment duration balances the need for complete system characterization with practical experimental constraints. By establishing clear start points based on stable baselines and determining end points through objective kinetic criteria, researchers ensure data quality and reliability. The specific timing varies with experimental system—from brief adsorption measurements requiring less than an hour to long-term stability studies spanning days. Regardless of duration, systematic approach to timing, combined with proper instrument maintenance and appropriate data interpretation frameworks, enables researchers to extract maximum insight from QCM-D investigations across diverse applications in materials science and drug development.
The Quartz Crystal Microbalance (QCM) and its advanced counterpart, QCM with Dissipation monitoring (QCM-D), are powerful gravimetric sensing techniques renowned for their nanogram-level mass sensitivity. These instruments are indispensable in research and drug development for studying a wide array of interfacial processes, from protein adsorption and polymer film characterization to the mechanics of cytoskeletal assemblies [60] [7]. The core principle relies on the piezoelectric effect of a quartz crystal, whose resonant frequency shifts in response to mass changes on its surface. Simultaneously, the dissipation factor provides critical insights into the viscoelastic properties of the adsorbed material [60].
However, the extreme sensitivity of QCM is a double-edged sword. While it enables the detection of minute mass changes, it also makes the measurements highly susceptible to experimental artifacts. Among the most prevalent and disruptive sources of these artifacts are temperature fluctuations and the presence of air bubbles [61]. Temperature changes induce drift in the resonant frequency, while air bubbles cause large, unpredictable shifts in both frequency (f) and dissipation (D) signals. For researchers aiming to collect high-quality, reproducible data, understanding, identifying, and mitigating these pitfalls is not merely beneficial—it is essential. This guide provides an in-depth technical examination of these challenges and outlines robust protocols to ensure data integrity within the broader context of QCM-based research.
The Critical Impact of Temperature on QCM Measurements
Temperature is one of the most significant factors influencing QCM baseline stability. The quartz crystal's resonant frequency is intrinsically temperature-dependent. Even minor, uncontrolled temperature variations can cause signal drift that obscures or mimics the subtle physicochemical processes under investigation.
Underlying Mechanisms
The primary mechanism behind temperature-induced drift is the temperature coefficient of the quartz crystal itself. The AT-cut crystal, most commonly used in QCM, is designed to have a minimal temperature coefficient around room temperature. However, this effect is not zero. Any deviation from the crystal's designed temperature point will result in a frequency shift. Furthermore, temperature changes affect the physical properties of the liquid in contact with the sensor, such as its density and viscosity, which in turn alter the coupling between the crystal oscillation and the liquid medium [7] [61]. This can lead to complex, time-dependent drift in both the frequency and dissipation signals.
Quantitative Stability Goals and Consequences
For reliable data, particularly in experiments expecting small frequency and dissipation shifts, the baseline must exhibit exceptional stability. A widely accepted benchmark for a stable baseline, when measuring an inert surface in water at room temperature, is a frequency drift of less than 1 Hz per hour and a dissipation drift of less than 0.15 x 10⁻⁶ per hour [61].
Table 1: Impact of Temperature Instability on QCM-D Parameters
| QCM Parameter | Direct Effect of Temperature Increase | Consequence for Data Interpretation |
|---|---|---|
| Resonant Frequency (f) | Decrease (typical) | Falsely interpreted as mass uptake or deposition. |
| Energy Dissipation (D) | Increase or Decrease | Falsely interpreted as changes in film softness or rigidity. |
| Baseline Stability | Uncontrolled drift | Compromised reference point, invalidating quantitative analysis of subsequent signal shifts. |
The Disruptive Role of Air Bubbles in QCM Systems
Air bubbles represent an acute and severe pitfall in QCM experiments, particularly in flow-based systems. Their presence introduces massive, non-reproducible artifacts that can instantly ruin a measurement.
Origins and Artifact Mechanisms
Bubbles can be introduced during the initial priming of the fluidic system or can form in-situ if the liquid is not properly degassed before use [61]. When a bubble is trapped on the active sensor surface, it introduces a significant and sudden artifact in the data. The bubble's high compliance (softness) and the drastic change in the acoustic impedance at the liquid-gas interface cause large, simultaneous shifts in both frequency and dissipation. The exact nature of the shift depends on the bubble's size and position. A bubble oscillating at the edge of the sensor can create a distinctive "saw-tooth" pattern in the fundamental frequency (f1) and dissipation (D1) signals [62]. If this bubble moves onto the active sensing area mid-experiment, it can destroy the data quality for all higher harmonics as well.
Experimental Protocols for Mitigation
A rigorous, proactive approach is required to prevent temperature and bubble-related artifacts. The following protocols should be standard practice.
Protocol for Temperature Stabilization
- Instrument Pre-equilibration: Allow the entire QCM instrument and all sample liquids to thermally equilibrate in the measurement room for at least several hours, or preferably overnight, before starting an experiment.
- Active Temperature Control: Utilize the instrument's built-in temperature control system. Set a stable temperature and ensure that the heating/cooling system has sufficient time to stabilize the measurement chamber before sensor mounting.
- Baseline Validation: After mounting the sensor and priming the system with solvent, initiate data collection and monitor the baseline. A stable baseline is achieved when the frequency drift is less than 1 Hz/h for at least five consecutive minutes [62] [61]. Do not inject any samples until this stability criterion is met.
Protocol for Air Bubble Prevention and Removal
- Liquid Degassing: Always degass all buffers and sample solutions prior to introduction into the QCM system. This can be done using a vacuum degassing system, sonication, or by purging with an inert gas like helium or argon.
- Priming and Purge Protocol: When priming the fluidic system, do so slowly and carefully. Use a syringe or pump to push liquid through the system, ensuring that the inlet tubing is free of bubbles. If a bubble is suspected in the tubing, perform a purge cycle if the instrument allows it.
- System Inspection: Visually inspect the sensor surface and the flow cell through the viewing port (if available) after mounting and priming to check for large, visible bubbles.
- Data Inspection for Micro-bubbles: Monitor the fundamental frequency (f1) and dissipation (D1) during the baseline stabilization. A saw-tooth pattern is a key indicator of a small, oscillating bubble at the sensor's edge [62]. If this pattern is observed, it is best to stop the measurement, dismount the sensor, and re-prime the system.
Post-Measurement System Care
Maintaining a clean and well-functioning instrument is a foundational aspect of preventing future pitfalls.
- Regular Cleaning: After measurements, run a dedicated cleaning protocol using recommended solutions (e.g., Hellmanex, SDS, NaOH) to prevent sample deposits that could nucleate bubbles [59].
- Consumables Check: Regularly inspect and annually replace O-rings and gaskets. Worn or cracked O-rings can lead to leaks, which are a common source of bubble formation and pressure instability [59].
The following workflow diagram summarizes the key steps for a successful QCM-D experiment, integrating the mitigation strategies for temperature and bubbles.
Diagram 1: A workflow for a robust QCM-D experiment, highlighting critical steps (green) for mitigating temperature and bubble pitfalls and key decision points (red).
The Scientist's Toolkit: Essential Reagents and Materials
Table 2: Key Research Reagent Solutions for QCM Experimentation
| Item | Function / Purpose | Technical Notes |
|---|---|---|
| Dedicated Cleaning Sensor | Used for running post-measurement cleaning protocols without damaging functionalized sensors [59]. | Typically a retired sensor; harsh cleaning solutions can etch active coatings. |
| Cleaning Solutions (e.g., Hellmanex, SDS) | Remove residual biomolecular or polymeric deposits from the fluidic path and sensor surface [59]. | Prevents contamination and bubble nucleation sites; protocols found in instrument user manuals. |
| Replacement O-rings & Gaskets | Maintain a leak-proof seal in the measurement chamber [59]. | Consumables that should be visually inspected for cracks and replaced at least annually to prevent leaks and bubbles. |
| Degassed Solvents & Buffers | The liquid phase for baseline stabilization and sample delivery [61]. | Degassing is critical to prevent in-situ bubble formation during measurement. |
| Surface Modification Kits | Functionalize the sensor surface for specific binding studies (e.g., protein immobilization) [63]. | Protocols are available for various modifications, such as using oligo(ethylene glycol) disulfides. |
Temperature fluctuations and air bubbles are two of the most common technical challenges in QCM research, with the potential to compromise data quality and derail experimental timelines. By understanding their physical origins and implementing the systematic mitigation strategies outlined in this guide—including rigorous temperature control, liquid degassing, careful baseline monitoring, and disciplined instrument maintenance—researchers and drug development professionals can significantly enhance the reliability and interpretability of their QCM data. Mastering these fundamental aspects of the technique ensures that the extraordinary sensitivity of the QCM is directed toward revealing meaningful scientific insights, rather than amplifying experimental artifacts.
Quartz Crystal Microbalance (QCM) technology has evolved from a simple mass sensor into a sophisticated tool for analyzing interfacial interactions across diverse scientific fields. This technical guide details advanced methodologies for interpreting the combined shifts in resonance frequency (Δf) and energy dissipation (ΔD), which provide complementary information about viscoelastic properties and structural changes of surface-bound layers. By examining recent technological innovations and their applications in pharmaceutical research and environmental science, this whitepaper establishes a framework for maximizing the analytical potential of QCM-D data within broader QCM research initiatives, emphasizing how simultaneous monitoring of these parameters enables deeper understanding of complex molecular interactions.
Quartz Crystal Microbalance with Dissipation monitoring (QCM-D) represents a significant advancement over traditional QCM by simultaneously measuring two fundamental parameters: the resonance frequency shift (Δf) and the energy dissipation shift (ΔD). This powerful combination transforms the instrument from a mere mass sensor into a sophisticated tool for characterizing the viscoelastic properties of surface-bound layers [64]. The global QCM market, valued at approximately $200 million in 2023 and projected to reach $400 million by 2032, reflects the growing adoption of this technology across biotechnology, pharmaceuticals, and environmental monitoring [65].
The fundamental operating principle relies on the piezoelectric effect of AT-cut quartz crystals, which oscillate at a characteristic resonance frequency when an alternating current is applied. As mass accumulates on the sensor surface, the oscillation frequency decreases proportionally, as described by the Sauerbrey equation for rigid, thin films. However, many biological and synthetic materials do not behave as rigid layers, necessitating additional measurement parameters [64]. The dissipation factor (D) quantifies the energy loss during oscillation, which occurs when soft, viscous layers dampen the crystal's vibration. By monitoring both Δf and ΔD simultaneously, researchers can distinguish between rigid mass adsorption and the formation of viscoelastic layers, enabling characterization of structural rearrangements, hydration states, and mechanical properties in real-time [66].
Recent innovations continue to enhance QCM-D capabilities. The development of microfluidic QCM (µ-QCM) demonstrates a remarkable 10-fold improvement in dissipation by confining sample liquids within parallel rigid microfluidic channels, significantly boosting the quality factor (Q-factor) in liquid environments [66]. Additionally, new computational tools like pyQCM-BraTaDio facilitate advanced visualization, data mining, and modeling of QCM-D datasets, making sophisticated analysis more accessible to researchers [67]. These technological advancements expand the application scope of QCM-D while improving data quality and interpretation capabilities.
Theoretical Foundations of Δf and ΔD
Fundamental Relationships and Equations
The quantitative interpretation of QCM-D data begins with understanding the fundamental relationships governing crystal oscillation. The Sauerbrey equation establishes the primary relationship between frequency shift and mass deposition for thin, rigid, and uniformly distributed films:
Δf = -2f₀²Δm / (A√(ρᵩμᵩ)) [66]
Where Δf represents the frequency shift, f₀ is the fundamental resonance frequency of the crystal, Δm is the mass change, A is the active sensor area, and ρᵩ and μᵩ are the density and shear modulus of quartz, respectively. This linear relationship remains reliable when the dissipation shift is negligible (ΔD < 1×10⁻⁶) and the adsorbed layer is sufficiently thin and rigid [64].
For viscoelastic layers that dissipate significant energy, the Sauerbrey relationship becomes inadequate, necessitating more complex models. The dissipation factor (D) is defined as the ratio of energy dissipated per oscillation cycle (Eloss) to the total energy stored in the system (Estored):
D = Eloss / (2πEstored) [66]
The simultaneous measurement of Δf and ΔD enables researchers to differentiate between mass adsorption (which primarily affects Δf) and changes in viscoelastic properties (which affect both Δf and ΔD). A low ΔD relative to Δf suggests the formation of a rigid, compact layer, while a high ΔD indicates a soft, hydrated, and dissipative structure. This distinction is particularly valuable when studying biological systems where hydration, conformational changes, and molecular flexibility significantly influence molecular behavior [64].
Advanced Modeling Approaches
Beyond the Sauerbrey approximation, several modeling frameworks accommodate the viscoelastic nature of surface layers. The Voigt model, which represents the mechanical behavior of viscoelastic materials using springs (elastic element) and dashpots (viscous element) in parallel, is widely employed to extract quantitative parameters such as shear modulus, viscosity, and thickness from combined Δf and ΔD measurements [64]. Recent research emphasizes the importance of considering the "mechanical compliance of the particle-surface contact" for proper interpretation of frequency and dissipation shifts, particularly when studying plastic particles and other complex analytes [64].
Finite element analysis (FEA) has emerged as a powerful tool for modeling QCM-D responses in complex scenarios. Recent µ-QCM research utilized FEA and dimensional studies to identify two key ratios governing device performance: the channel width to pressure wavelength ratio (W/λp) and the channel height to shear evanescent wavelength ratio (H/λs) [66]. Such theoretical advancements enable more sophisticated interpretation of QCM-D data beyond simple qualitative assessments, supporting the extraction of precise physical parameters from complex experimental systems.
Table 1: Key Parameters in QCM-D Data Interpretation
| Parameter | Symbol | Interpretation | Typical Range |
|---|---|---|---|
| Frequency Shift | Δf | Mass loading & viscoelasticity | 0 to -500 Hz for thin films |
| Dissipation Shift | ΔD | Energy dissipation & softness | 0 to 50×10⁻⁶ |
| Sauerbrey Mass | Δm | Areal mass (rigid films) | ng/cm² range |
| Voigt Thickness | d | Viscoelastic layer thickness | nm to μm range |
| Shear Modulus | G | Layer stiffness (G': storage, G": loss) | 10³-10⁶ Pa for biopolymers |
| Quality Factor | Q | Measurement precision (Q = 1/D) | 10³-10⁶ in air |
Experimental Protocols and Methodologies
Standard QCM-D Experimental Workflow
A rigorous experimental methodology is essential for generating reliable QCM-D data. The following protocol outlines the key steps for a typical adsorption experiment:
Sensor Preparation: Begin with meticulous sensor cleaning using established protocols (e.g., UV-ozone treatment, plasma cleaning, or chemical cleaning sequences). Confirm surface purity through contact angle measurements and baseline stability testing. For specific applications, functionalize the sensor surface with appropriate capture chemistries (e.g., self-assembled monolayers, polymer coatings, or biological recognition elements) [64].
Baseline Establishment: Introduce the pure solvent or buffer to the measurement chamber and monitor until stable Δf and ΔD baselines are achieved. For liquid measurements, temperature control is critical—maintain ±0.02°C stability to minimize drift caused by viscosity and density fluctuations [66]. The baseline stability criterion is typically <±1 Hz/hour for Δf and <±0.1×10⁻⁶/hour for ΔD.
Sample Introduction and Measurement: Switch the fluid flow to the sample solution while maintaining identical flow conditions to prevent pressure fluctuations. Monitor multiple overtones (typically 3rd, 5th, and 7th) simultaneously to enable viscoelastic modeling. The measurement should continue until apparent saturation occurs or until a predetermined time point is reached [64].
Rinsing and Regeneration: After adsorption, switch back to pure buffer to remove loosely bound material. For reversible systems, regeneration steps may be incorporated using appropriate elution conditions. Monitor desorption kinetics through changes in both Δf and ΔD [64].
Data Normalization and Analysis: Normalize frequency shifts by overtone number (Δf/n) to account for harmonic dependencies. Compare dissipation shifts across overtones to identify viscoelastic behavior patterns. Apply appropriate models (Sauerbrey, Voigt, or custom models) based on the observed Δf/ΔD relationships [67].
Advanced µ-QCM Methodology
The emerging µ-QCM technology introduces specific methodological considerations. The fabrication process involves creating parallel rigid microfluidic channels (e.g., 2 μm × 10 μm cross-section) on conventional QCM crystals, optimally oriented perpendicular to the shearing direction [66]. To ensure proper liquid filling through capillary action, the design should incorporate a "diverging approach flow channel system" at the inlet and "micro-pillows" at the outlet to facilitate bubble-free merging of liquid fronts from multiple channels [66].
For µ-QCM operation, the critical parameters include maintaining channel width (W) less than one-quarter of the pressure wavelength (λp) in the sample liquid and ensuring sufficient channel stiffness to minimize energy loss. The unique signature of µ-QCM operation is an increase in normalized frequency shift with increasing overtone number—inverse to the trend observed in conventional QCM [66]. This phenomenon can be harnessed to increase measurement sensitivity but requires specialized interpretation models.
Diagram 1: QCM-D Experimental Workflow
Data Interpretation Strategies
Qualitative Analysis of Δf-ΔD Patterns
The relationship between frequency and dissipation shifts provides immediate qualitative insights into the nature of surface interactions. Specific patterns in Δf versus ΔD plots correspond to distinct molecular processes:
Rigid Layer Formation: Characterized by a significant negative Δf with minimal ΔD change. This pattern indicates the formation of compact, well-coupled masses on the sensor surface and validates the use of the Sauerbrey equation for mass calculations. Examples include the adsorption of small molecules or dense proteins forming crystalline structures [64].
Soft Layer Formation: Exhibits substantial negative Δf accompanied by significant positive ΔD increases. This signature indicates the development of a viscoelastic, hydrated layer that dissipates energy through internal mobility. Biological systems frequently display this pattern during polymer adsorption, cell attachment, or the formation of hydrated biopolymer networks [64].
Structural Rearrangements: Manifest as divergent Δf and ΔD trajectories over time, where the two parameters may move in opposite directions. For instance, an increasing ΔD coupled with a decreasingly negative Δf suggests swelling or loosening of a surface layer, while a decreasing ΔD with increasingly negative Δf indicates compaction or dehydration [64].
Adsorption-Desorption Dynamics: Complex interactions often show looping behavior in Δf-ΔD space, where the pathway during adsorption differs from that during desorption. Such hysteresis indicates irreversible changes in the adsorbed layer or multiple binding states with different kinetic profiles [64].
Quantitative Modeling Approaches
Beyond qualitative assessment, several quantitative models enable extraction of physical parameters from QCM-D data:
Sauerbrey Model: Applicable when ΔD < 1×10⁻⁶ and Δf/n is consistent across overtones. The mass sensitivity is approximately 17.7 ng/cm²/Hz for a 5 MHz fundamental crystal [66]. While simple to apply, this model significantly underestimates mass for hydrated, dissipative layers.
Voigt Viscoelastic Model: This more sophisticated model represents the viscoelastic layer as a spring and dashpot in parallel, characterized by four parameters: thickness (d), density (ρ), shear storage modulus (μ), and shear viscosity (η). Implementing the Voigt model requires Δf and ΔD data from at least two overtones to solve the system of equations [64]. Recent software tools like pyQCM-BraTaDio facilitate Voigt modeling through user-friendly interfaces [67].
Coupled-Water Model: Particularly relevant for biological systems, this approach differentiates between coupled water (which oscillates with the film) and bulk water. The model explains why QCM-D often measures 3-5 times more "mass" than optical techniques for hydrated systems, as the technique detects hydrodynamically coupled water molecules in addition to the dry mass [64].
Table 2: QCM-D Interpretation Models and Applications
| Model | Required Data | Output Parameters | Best For | Limitations |
|---|---|---|---|---|
| Sauerbrey | Single Δf value | Areal mass (ng/cm²) | Rigid, thin films | Underestimates hydrated mass |
| Voigt | Δf & ΔD for ≥2 overtones | Thickness, μ, η | Viscoelastic layers | Multiple solutions possible |
| Thin Film | Δf/n consistency | Hydrated thickness | Films < 100 nm | Assumes constant density |
| Composite | Δf, ΔD, & optical data | Dry mass, water content | Biological layers | Requires complementary data |
The Scientist's Toolkit: Essential Research Reagents and Materials
Successful QCM-D experimentation requires careful selection of sensors, surface chemistries, and calibration standards. The following table details essential components for designing QCM-D studies:
Table 3: Essential QCM-D Research Materials and Reagents
| Component | Function | Examples & Specifications | Application Notes |
|---|---|---|---|
| QCM Sensors | Signal transduction | AT-cut quartz, 5-15 MHz fundamental | Gold electrodes standard; SiO₂ for hydrophilic surfaces |
| Surface Chemistry | Molecular capture | SAMs, polymers, biorecognition elements | Thiol-gold chemistry most common; silane for oxide surfaces |
| Calibration Standards | System verification | Glycerol solutions, thin polymer films | Known viscosity-density products validate liquid measurements |
| Microfluidic Components | Sample delivery | Flow cells, pumps, tubing | Pulsation-free flow critical; µ-QCM requires specialized channels [66] |
| Data Analysis Software | Information extraction | pyQCM-BraTaDio, commercial suites | Enable modeling, visualization, and data mining [67] |
Sensor selection constitutes the foundation of experimental design. Standard gold-coated sensors provide versatility for thiol-based functionalization, while specialized surfaces (silicon oxide, titanium, polystyrene) mimic specific material interfaces. For µ-QCM applications, aluminum microfluidic channels with thin gold coatings (~40 nm) offer an optimal balance of stiffness and functionalization capability [66].
Surface chemistry strategies must align with research objectives. Self-assembled monolayers (SAMs) of alkanethiols provide well-defined interfaces for studying fundamental interactions. For biological recognition, immobilization strategies should preserve functionality while minimizing non-specific binding. Recent methodological reviews emphasize that "proper interpretation of frequency and dissipation shifts should consider the size and type of contact between the plastic and the surface"—a principle that extends to various analyte types [64].
Application Case Studies
Biopharmaceutical Characterization
QCM-D provides critical insights throughout the drug development pipeline, from target validation to formulation optimization. In protein-drug interaction studies, the technique reveals not only binding kinetics but also conformational changes induced by molecular recognition. For monoclonal antibody characterization, QCM-D has elucidated the structural basis of viscosity challenges in high-concentration formulations by correlating ΔD shifts with protein-protein interaction networks [65].
Biosensor applications leverage QCM-D's ability to monitor biomolecular interactions without labeling. The technology detects binding events between immobilized receptors and soluble ligands while simultaneously reporting structural changes in the formed complex. For vaccine development, QCM-D has characterized antigen-adjuvant interactions and particle formation, enabling rational design of delivery systems [64]. The pharmaceutical industry's emphasis on quality control and process monitoring further drives QCM adoption for real-time assessment of production intermediates [68].
Environmental Microplastic Research
QCM-D advances environmental risk assessment by elucidating microplastic interactions with biological systems and co-pollutants. Recent research has investigated the attachment of plastic particles to model biological membranes, with Δf-ΔD correlation patterns revealing the role of particle size, surface chemistry, and aging in cellular association mechanisms [64].
The fate and transport of environmental plastics represents another application frontier. QCM-D studies examining plastic aging and chemical release contribute to comprehensive life cycle assessments [64]. Experimental protocols typically employ standardized polystyrene beads as model systems, though current research is expanding to include environmentally relevant plastic types and conditions. These investigations benefit from complementary theoretical modeling to extract maximum information from Δf-ΔD datasets [64].
Diagram 2: Microplastic-Membrane Interaction Study
Advanced Technological Innovations
Microfluidic QCM (µ-QCM)
The integration of microfluidics with QCM-D represents a significant technological advancement addressing the fundamental challenge of energy dissipation in liquid measurements. Conventional QCM experiences substantial damping when immersed in liquids due to acoustic radiation energy loss and friction within the shear evanescent boundary layer [66]. The µ-QCM design incorporates rigid microfluidic channels on conventional QCM crystals, creating confined liquid domains that dramatically reduce dissipation.
The physics underlying µ-QCM performance enhancement involves two critical dimensional ratios: the channel width to pressure wavelength ratio (W/λp) and the channel height to shear evanescent wavelength ratio (H/λs). Optimal performance occurs when W < λp/4, confining the acoustic energy within the channel structure [66]. Experimental demonstrations show a 10-fold improvement in dissipation compared to conventional QCM, along with a 5-times larger normalized resonance frequency shift indicating greater liquid mass coupling [66].
Beyond improved Q-factors, µ-QCM offers practical advantages including significantly reduced sample volume requirements, simplified temperature control, and direct data interpretation. These benefits position µ-QCM as particularly valuable for point-of-care applications and precious sample analysis [66]. The technology's unique signature—increasing normalized frequency shift with increasing overtone number, inverse to conventional QCM—enables enhanced sensitivity but requires specialized interpretation frameworks.
Computational and Analytical Advancements
Data interpretation capabilities have advanced significantly through new software tools and modeling approaches. The recently developed pyQCM-BraTaDio provides an open-source platform for visualization, data mining, and modeling of QCM-D data [67]. This Python-based tool facilitates the application of complex models to experimental datasets, making advanced analysis accessible to non-specialists.
Theoretical modeling continues to evolve toward more sophisticated representations of interfacial interactions. Recent reviews emphasize that "intensive theoretical modeling can provide more sophisticated and targeted information regarding plastic interactions"—a principle that extends to other application domains [64]. Combined experimental-computational approaches now enable researchers to extract detailed information about molecular orientation, hydration dynamics, and mechanical properties from QCM-D data.
Future directions include the integration of QCM-D with complementary techniques such as surface plasmon resonance (SPR), electrochemical impedance spectroscopy, and optical microscopy. These multimodal approaches provide correlated datasets that overcome the limitations of individual techniques, offering more comprehensive characterization of complex interfacial processes [64] [65].
The combined interpretation of frequency and dissipation shifts transforms QCM from a simple mass sensor into a powerful tool for characterizing viscoelastic properties and structural changes at interfaces. This advanced capability positions QCM-D as an invaluable methodology across diverse fields including pharmaceutical development, environmental science, and materials engineering. The ongoing technological innovations in microfluidic integration, computational analysis, and multimodal correlation continue to expand the applications and interpretive power of QCM-D. As these advancements mature, researchers must maintain rigorous experimental methodologies and appropriate modeling approaches to fully exploit the rich information content embedded in simultaneous Δf and ΔD measurements. The continued refinement of QCM-D data interpretation frameworks will further solidify the technique's role in addressing complex scientific challenges at the interface of physics, chemistry, and biology.
QCM in the Analytical Landscape: Validation, Comparative Advantages, and Hybrid Techniques
The quartz crystal microbalance (QCM) is a highly sensitive, mass-based biosensor that measures minute mass changes on its surface, often at the nanogram level, by detecting shifts in the resonant frequency of a quartz crystal oscillator [69]. Its principle of operation relies on the inverse relationship between the mass adsorbed on the crystal surface and its resonance frequency; as mass increases, the frequency decreases [24] [69]. This functionality enables real-time, label-free monitoring of biomolecular interactions, such as antigen-antibody binding, making it highly applicable in drug development and diagnostic research [69]. However, to establish QCM as a credible analytical technique in clinical and pharmaceutical settings, its performance must be rigorously validated against established gold-standard methods. This guide details the protocols and metrics for benchmarking QCM against Enzyme-Linked Immunosorbent Assay (ELISA), a workhorse serological test, and quantitative Polymerase Chain Reaction (qPCR), the cornerstone of molecular diagnostics [70] [71].
Technical Principles of Quartz Crystal Microbalance (QCM)
Fundamental Operating Principle
At its core, a QCM sensor utilizes a thin disk of crystalline quartz, a piezoelectric material, sandwiched between two electrodes [24]. Applying an alternating voltage induces a standing shear wave oscillation within the crystal [24]. The resonance frequency of this oscillation is exquisitely sensitive to changes in the total oscillating mass. The deposition of a thin, rigid layer onto the electrode surface causes a measurable decrease in frequency, which is quantitatively described by the Sauerbrey equation [24]: [ \Delta m = - C \times \Delta f ] Here, Δm is the mass change per unit area, Δf is the observed frequency shift, and C is a constant specific to the crystal [24]. This relationship allows researchers to convert frequency shifts directly into mass measurements. Modern QCM systems, especially QCM with Dissipation (QCM-D), go beyond mere mass sensing by also monitoring energy dissipation, providing additional insights into the viscoelastic properties and structural rigidity of the adsorbed molecular layer [69].
QCM Experimental Workflow
The following diagram illustrates the logical flow from sample introduction to data interpretation in a typical QCM experiment:
Benchmarking QCM Against Reference Methods
Validation Against ELISA for Serological Detection
ELISA is widely used for detecting and quantifying proteins, such as antibodies or antigens, and serves as a key benchmark for QCM in serological applications [70]. A typical benchmarking study involves analyzing a panel of well-characterized clinical samples (e.g., patient sera) using both QCM and ELISA platforms.
Key Performance Metrics for Comparison:
- Sensitivity: The ability to correctly identify true positives.
- Specificity: The ability to correctly identify true negatives.
- Dynamic Range: The range of analyte concentration over which the assay provides accurate results.
- Limit of Detection (LOD): The lowest concentration of analyte that can be reliably detected.
Representative Benchmarking Data: ELISA vs. Potential QCM Performance The following table summarizes typical performance data for an ELISA test, which can be used as a target for QCM validation. Note that QCM performance is highly dependent on surface functionalization and assay optimization.
Table 1: Performance Metrics of a Commercial Serological ELISA Test (from [70])
| Assay Name | Sensitivity (%) | Specificity (%) | Time Post-Symptom Onset | Diagnostic Odds Ratio |
|---|---|---|---|---|
| GOLD ELISA COVID-19 IgG + IgM | 57.7 | 98.9 | Various time frames | High |
| Anti-SARS-CoV-2 NCP IgG ELISA | Lower than claimed | 100.0 | > 22 days | Lower |
| Anti-SARS-CoV-2 NCP IgM ELISA | Lower than claimed | Not Specified | First week (struggles) | Low |
Experimental Protocol for QCM-ELISA Benchmarking:
- Surface Functionalization: Immobilize a capture antibody (or antigen) specific to the target analyte onto the QCM gold sensor surface using a chemisorption layer (e.g., Protein A) or a self-assembled monolayer (SAM) with appropriate cross-linkers [69].
- Sample Preparation: Prepare a dilution series of the target antigen (or antibody) in a suitable buffer. Use the same sample set for both QCM and ELISA.
- QCM Measurement:
- Establish a stable baseline with running buffer.
- Introduce samples, allowing for binding in real-time.
- Monitor the frequency shift (Δf) and dissipation (ΔD).
- Rinse with buffer to remove non-specifically bound material.
- ELISA Measurement: Perform a standard colorimetric sandwich or direct ELISA on the same samples according to the manufacturer's protocol, using a microplate reader for quantification [70].
- Data Analysis: Plot calibration curves for both techniques, calculate LOD, sensitivity, and specificity, and perform correlation analysis between the QCM signal (Δf) and ELISA optical density (OD) values.
Validation Against qPCR for Molecular Detection
qPCR is the gold standard for sensitive and specific detection of nucleic acids. Benchmarking against qPCR is crucial when developing QCM-based genosensors for pathogen detection (e.g., SARS-CoV-2) or genetic biomarkers [71].
Key Performance Metrics for Comparison:
- Limit of Detection (LOD) in copies/reaction: The smallest quantity of genetic material reliably detected.
- Amplification Efficiency: For qPCR, the efficiency of the enzymatic reaction.
- Dynamic Range: The range of template concentrations over which the qPCR is quantitative.
- Precision/Repeatability: The consistency of results under unchanged conditions [71].
Representative Benchmarking Data: qPCR Performance The table below shows the high-performance standards of a validated qPCR protocol, which a QCM genosensor would aim to meet.
Table 2: Analytical Performance of a Validated qRT-PCR Protocol (from [71])
| Performance Characteristic | Result | Definition/Context |
|---|---|---|
| Technical LOD (95% CI) | 5.09 copies/reaction | The lowest number of RNA copies detected per reaction with 95% confidence. |
| Dynamic Range | Wide (Not specified) | The concentration range over which the test is accurate and precise [71]. |
| Target Genes | E and RdRP (Charité protocol) | E gene screens for Sarbeco virus subgenus; RdRP is SARS-CoV-2 specific [71]. |
| Key Validation Parameters | Sensitivity, Accuracy, Precision, Trueness, Uncertainty | Metrics evaluated under ISO/IEC 17025:2018 accreditation standards [71]. |
Experimental Protocol for QCM-qPCR Benchmarking:
- QCM Genosensor Preparation: Functionalize the QCM sensor surface with single-stranded DNA (ssDNA) probes complementary to the target nucleic acid sequence (e.g., a segment of the SARS-CoV-2 E gene) [71].
- Sample and Standard Preparation: Use extracted RNA from patient samples or a synthetic standard. For qPCR, prepare a standard curve with known copy numbers (e.g., 10^1 to 10^6 copies/μL).
- qPCR Analysis: Perform one-step qRT-PCR using a validated protocol (e.g., Charité or CDC protocol) on a real-time thermocycler. Record the quantification cycle (Cq) values [71].
- QCM Measurement: Hybridize the target RNA or DNA to the surface-bound probe on the QCM. Monitor the frequency change associated with the mass of the hybridized duplex.
- Data Analysis: Correlate the QCM frequency shift with the qPCR Cq value and the initial template copy number. Determine the LOD for both methods and compare their precision using replicate measurements.
The Scientist's Toolkit: Essential Research Reagents and Materials
Successful experimentation with QCM and its reference methods requires a suite of specialized reagents and materials.
Table 3: Essential Reagents and Materials for QCM, ELISA, and qPCR Experiments
| Item | Function/Description | Primary Application |
|---|---|---|
| Quartz Crystal Sensor | Piezoelectric crystal with metal electrodes; the core transducer element. | QCM |
| Capture Antibody/Probe | Biomolecule (antibody, DNA) immobilized on sensor surface to bind target specifically. | QCM, ELISA |
| Self-Assembled Monolayer (SAM) | Organized layer of molecules (e.g., thiols) on gold to create a functional surface for biomolecule attachment. | QCM |
| qPCR Master Mix | Contains Taq polymerase, dNTPs, buffer, and salts necessary for the PCR reaction. | qPCR |
| Primers & Probes | Sequence-specific oligonucleotides for amplifying and detecting the target gene. | qPCR |
| Enzyme Substrate (TMB/PNPP) | Chromogenic compound that produces a measurable color change when catalyzed by the ELISA enzyme (HRP/AP). | ELISA |
| Certified Reference Material | Substance with one or more specified properties, certified for use in method validation [71]. | Validation (All) |
The rigorous benchmarking of QCM performance against established methods like ELISA and qPCR is not merely a procedural formality but a critical step in translating this sensitive, label-free technology from a research tool to a trusted analytical platform. By systematically comparing key analytical metrics such as sensitivity, specificity, and limit of detection, and by adhering to detailed experimental protocols, researchers can robustly validate their QCM assays. This process, framed within the stringent requirements of standards like ISO/IEC 17025:2018, builds confidence in QCM-generated data [71]. As QCM technology continues to advance, its integration with portable systems and its ability to provide real-time kinetic information position it to complement, and in specific applications potentially surpass, the capabilities of traditional gold-standard methods, thereby driving innovation in biosensing and drug development.
The rapid and accurate detection of viral pathogens has become a critical challenge in global public health, as emphatically demonstrated by recent pandemics. Biosensors have emerged as powerful analytical tools that meet the demand for rapid, sensitive, and specific diagnostics. Among the most prominent biosensing platforms are the Quartz Crystal Microbalance (QCM) and Electrochemical biosensors, both of which offer distinct advantages for viral detection. QCM is a mass-sensitive, label-free technique that operates on the principle of piezoelectricity, detecting mass changes on a sensor surface with remarkable sensitivity [5] [32]. Electrochemical biosensors, in contrast, transduce biological recognition events into measurable electrical signals such as current or impedance, offering rapid response and exceptional suitability for miniaturization and point-of-care applications [72].
This technical guide provides a direct comparative analysis of QCM and electrochemical biosensors for virus detection, framed within broader research on how QCM technology operates. The performance of these sensors is critically evaluated through a detailed examination of a recent comparative study that developed both QCM and electrochemical aptasensors for detecting the SARS-CoV-2 spike receptor-binding domain (S-RBD) [41] [73]. For researchers, scientists, and drug development professionals, understanding the nuances of each platform is essential for selecting the appropriate technology for specific diagnostic applications, whether for laboratory-based confirmatory testing or rapid clinical screening.
Fundamental Operating Principles
Quartz Crystal Microbalance (QCM) Technology
The core of QCM technology is a piezoelectric quartz crystal disk, typically AT-cut, which is sandwiched between two metal electrodes [5] [32]. When an alternating voltage is applied across these electrodes, it generates an electric field that induces a mechanical deformation in the quartz crystal due to the piezoelectric effect. For AT-cut crystals, this deformation results in a thickness-shear mode oscillation at a specific resonance frequency, which is inversely proportional to the thickness of the crystal disk [5] [32].
The fundamental relationship governing QCM operation was established by Günter Sauerbrey in 1959. The Sauerbrey equation (Eq. 1) describes the linear relationship between the change in resonance frequency (Δf) and the mass change (Δm) added to the crystal surface [5]:
Δf = -C_f · Δm [32]
where C_f is the mass sensitivity constant determined by the fundamental properties of the quartz crystal [32]. For a 5 MHz AT-cut quartz crystal, this constant is typically 17.7 ng·cm⁻²·Hz⁻¹, meaning a frequency shift of 1 Hz corresponds to a mass change of 17.7 ng per cm² of the sensor surface [32]. When a target analyte such as a virus binds to a recognition layer on the QCM sensor surface, the resulting mass increase causes a decrease in the resonance frequency, enabling quantitative detection [5]. Modern QCM systems can measure frequency changes with high resolution, though the practical sensitivity is ultimately determined by the noise level rather than the display resolution [74].
Electrochemical Biosensor Technology
Electrochemical biosensors function by converting a biological recognition event into a quantifiable electrical signal [72]. These sensors typically consist of three main components: a bioreceptor element (such as an antibody, aptamer, or nucleic acid) that specifically recognizes the target analyte, a transducer electrode that converts the biological interaction into an electrical signal, and a signal processor that outputs the measurable reading [72].
The operational principle involves the detection of changes in electrical properties at the electrode-solution interface when the target analyte binds to the bioreceptor. These changes can be monitored through various electrochemical techniques, including:
- Electrochemical Impedance Spectroscopy (EIS): Measures impedance or changes in component resistance and capacitance [72].
- Amperometry: Measures current generated from redox reactions at a constant applied potential [72].
- Potentiometry: Measures potential or charge accumulation at zero current [72].
- Voltammetry (including cyclic voltammetry, differential pulse voltammetry): Measures current while varying the applied potential [72].
For virus detection, EIS has proven particularly valuable as it can detect binding events without requiring labels or additional reagents. When target viruses bind to the recognition layer on the electrode surface, they alter the interfacial electron transfer resistance, which is measured as a change in impedance [41] [72]. The integration of nanomaterials such as nanoparticles, graphene, and carbon nanotubes has significantly enhanced electrochemical biosensor performance by improving adsorption capacity, sensitivity, and providing greater surface area for bioreceptor immobilization [72] [75].
Direct Comparative Analysis: QCM vs. Electrochemical Aptasensors for SARS-CoV-2 Detection
A recent comprehensive study directly compared the performance of QCM and electrochemical aptasensors specifically developed for detecting the SARS-CoV-2 spike receptor-binding domain (S-RBD) using identical thiol-modified DNA aptamers as recognition elements [41] [73]. This side-by-side evaluation provides invaluable empirical data for understanding the relative strengths and limitations of each platform.
Performance Comparison Table
Table 1: Direct performance comparison of QCM and electrochemical aptasensors for SARS-CoV-2 S-RBD detection
| Parameter | QCM Aptasensor | Electrochemical Aptasensor |
|---|---|---|
| Detection Principle | Mass sensitivity (Frequency change) | Electrochemical impedance |
| Limit of Detection (LOD) | 0.07 pg/mL | 132 ng/mL |
| Linear Range | 1 pg/mL to 0.1 µg/mL | Not specified in detail |
| Sensor Preparation Time | Several hours | 2 hours |
| Key Optimization Parameters | Aptamer concentration, buffer composition, pre-treatment conditions | One-step modification process |
| Specificity | High (negligible non-specific interactions with competing proteins) | High (negligible non-specific interactions with competing proteins) |
| Function in Biological Fluids | Verified in plasma and saliva | Not explicitly mentioned |
| Real-time Monitoring | Yes | Yes |
| Instrumentation Complexity | Moderate | Low to Moderate |
Comparative Strengths and Limitations
The comparative data reveal a striking difference in sensitivity between the two platforms. The QCM aptasensor demonstrated approximately 9 orders of magnitude better sensitivity (0.07 pg/mL) compared to the electrochemical sensor (132 ng/mL) for detecting the same SARS-CoV-2 S-RBD protein [41] [73]. This exceptional sensitivity positions QCM as the superior technology for applications requiring detection of ultralow analyte concentrations, such as early-stage infection diagnosis or monitoring of low-abundance biomarkers.
In contrast, the electrochemical aptasensor offered significant advantages in terms of preparation time, with a streamlined one-step modification process that reduced sensor preparation to just 2 hours, compared to several hours for the QCM aptasensor [41]. This rapid preparation, combined with generally simpler instrumentation and greater potential for miniaturization, makes electrochemical platforms particularly suitable for point-of-care testing and resource-limited settings.
Both platforms exhibited excellent specificity with minimal non-specific interactions observed in the presence of competing proteins, confirming that the aptamer recognition elements function effectively in both sensing formats [41]. The QCM aptasensor additionally demonstrated functionality and stability in complex biological fluids including plasma and saliva, which is a critical requirement for clinical diagnostic applications [41].
Experimental Protocols for Biosensor Development
QCM Aptasensor Fabrication and Measurement Protocol
Sensor Preparation and Surface Functionalization
- Crystal Cleaning: Begin with AT-cut quartz crystals (fundamental frequency 10 MHz) with polished gold electrodes. Clean crystals using basic Piranha solution (ammonium hydroxide, hydrogen peroxide, water in 1:5:1 ratio at 70°C for 25 minutes). Repeat this cleaning cycle three times, followed by rinsing with copious distilled water, 90% ethanol, and drying under nitrogen stream [41].
- Aptamer Preparation: Reconstitute thiol-modified DNA aptamers in TE buffer (1 mM EDTA, 10 mM Tris, pH 8). Dilute in binding buffer (PBS with 0.55 mM MgCl₂) to desired concentration. Thermally condition aptamer by heating at 95°C for 3 minutes, cooling on ice for 10 minutes, then gradually warming to room temperature to ensure proper folding [41].
- Surface Modification: Immobilize thiolated aptamers onto gold electrode surface via gold-thiol self-assembled monolayer chemistry. Optimize aptamer concentration and buffer composition to achieve dense, oriented aptamer coverage. Use 6-mercapto-1-hexanol (MCH) as a passivating agent to minimize non-specific adsorption [41].
Measurement Procedure
- Instrument Setup: Mount functionalized crystal in flow cell with syringe pump system set to constant flow rate of 50 μL/min [41].
- Baseline Establishment: Flow binding buffer until stable frequency baseline is established (typically 10-15 minutes) [41].
- Sample Measurement: Introduce sample containing target virus or viral antigen. Monitor frequency change in real-time throughout association phase [41].
- Regeneration: After measurement, regenerate sensor surface by washing with appropriate regeneration buffer to dissociate bound target without damaging aptamer functionality [41].
- Data Analysis: Calculate mass change from frequency shift using Sauerbrey equation. For a 5 MHz crystal, use sensitivity constant of 17.7 ng·cm⁻²·Hz⁻¹ [32].
Electrochemical Aptasensor Fabrication and Measurement Protocol
Electrode Preparation and Modification
- Electrode Pretreatment: Clean gold or carbon electrode surfaces through electrochemical cycling or polishing to ensure reproducible surface properties [72].
- One-step Modification: Implement simplified preparation by simultaneously depositing thiolated aptamers and other monolayer components onto electrode surface. This single-step process significantly reduces preparation time to approximately 2 hours [41] [73].
- Nanomaterial Enhancement (Optional): For enhanced sensitivity, modify electrode surface with nanomaterials such as graphene, carbon nanotubes, or metal nanoparticles to increase surface area and improve electron transfer kinetics [72].
Measurement Procedure Using EIS
- Instrument Setup: Configure potentiostat with three-electrode system (working, counter, and reference electrodes) in Faraday cage if possible to minimize external interference [72].
- Initial Impedance Measurement: Measure baseline impedance in appropriate redox probe solution such as [Fe(CN)₆]³⁻/⁴⁻. Apply small amplitude AC voltage (typically 5-10 mV) over frequency range from 0.1 Hz to 100 kHz [41].
- Target Incubation: Incubate functionalized electrode with sample containing target virus for predetermined optimal time [41].
- Post-binding Impedance Measurement: Re-measure electrochemical impedance under identical conditions after target binding [41].
- Data Analysis: Analyze impedance spectra using Nyquist or Bode plots. Quantify charge transfer resistance (Rₛᵢ) changes before and after target binding. Use equivalent circuit modeling for precise parameter extraction [41].
The Scientist's Toolkit: Essential Research Reagents and Materials
Table 2: Key research reagents and materials for QCM and electrochemical biosensor development
| Reagent/Material | Function/Purpose | Example Specifications |
|---|---|---|
| AT-cut Quartz Crystals | Piezoelectric substrate for QCM | 5-30 MHz fundamental frequency, polished gold electrodes [41] [32] |
| Thiol-modified DNA Aptamers | Biorecognition element for specific target binding | Designed for SARS-CoV-2 S-RBD, 5' thiol modification for surface immobilization [41] |
| Tris(2-carboxyethyl)phosphine (TCEP) | Reducing agent for cleaving aptamer disulfide bonds | Thermo Fischer Scientific GmbH [41] |
| 6-Mercapto-1-hexanol (MCH) | Passivating agent to minimize non-specific binding | Sigma-Aldrich [41] |
| Electrochemical Electrodes | Transducer platform for electrochemical detection | Gold, carbon, or screen-printed electrodes; may include nanomaterials [72] |
| Phosphate Buffered Saline (PBS) | Binding buffer and dilution medium | 10 mM phosphate buffer, 137 mM NaCl, 2.7 mM KCl, pH 7.4, with 0.55 mM MgCl₂ [41] |
| Nanomaterials | Signal enhancement and increased surface area | Graphene, carbon nanotubes, metal nanoparticles [72] |
| Redox Probes | Electron transfer mediators for EIS | [Fe(CN)₆]³⁻/⁴⁻, commonly used for impedance measurements [72] |
Advanced Technological Considerations and Implementation Challenges
QCM Technological Advancements
Traditional QCM systems face challenges including temperature sensitivity, limited throughput, and spatial non-uniformity of mass sensitivity across the sensor surface [74] [76]. Recent advancements have addressed these limitations through several innovative approaches:
- Monolithic Multi-channel QCM (MQCM): Integration of multiple QCM arrays on a single quartz substrate enables higher throughput and multi-analyte detection while reducing production costs [32].
- Advanced Electrode Designs: Modified electrode configurations such as ring electrodes, dot-ring designs, and MESA structures (including inverted-MESA and bi-convex MESA) help minimize the Gaussian distribution of mass sensitivity and reduce acoustic interference between adjacent sensing elements [76] [32].
- Overtone Operation: Operating QCM at higher overtone modes (3rd, 5th, 7th harmonics) enables higher effective frequencies and improved mass resolution, though this may come at the expense of decreased absolute sensitivity in some configurations [32].
- Dual QCM Setup: Incorporation of a reference QCM helps compensate for environmental effects such as temperature fluctuations, improving measurement stability and reliability [32].
Critical performance parameters for QCM systems include frequency resolution (the smallest detectable frequency change), noise level (determining significant signal variations), and long-term stability (minimizing signal drift over extended measurements) [74]. While instruments may display frequency resolution down to 0.001 Hz, the practical useful frequency sensitivity is ultimately determined by the noise level, typically requiring a signal-to-noise ratio of at least 2 for reliable detection [74].
Electrochemical Biosensor Advancements
Electrochemical biosensors have benefited significantly from developments in nanomaterial integration and surface engineering strategies [72] [75]. Key advancements include:
- Nanocomposite Electrodes: Incorporation of graphene, carbon nanotubes, metal nanoparticles, and conducting polymers enhances electron transfer kinetics, increases active surface area, and improves biosensor sensitivity [72] [75].
- Lab-on-a-Chip Integration: Miniaturization of electrochemical systems into microfluidic platforms enables automated sample processing, reduced reagent consumption, and development of portable point-of-care devices [75].
- Smartphone Integration: Emerging platforms connect electrochemical sensors to smartphone interfaces for data acquisition, processing, and transmission, facilitating remote monitoring and telemedicine applications [75].
- Multiplexed Detection Arrays: Development of electrode arrays with different recognition elements enables simultaneous detection of multiple viral targets in a single sample, improving diagnostic efficiency [72].
Implementation Challenges in Viral Detection
Both QCM and electrochemical biosensors face practical challenges when deployed for viral detection in real-world scenarios:
- Matrix Effects: Complex biological samples (serum, saliva, nasopharyngeal secretions) can cause non-specific binding and interference. Effective surface passivation and sample preparation protocols are essential to mitigate these effects [41] [72].
- Regeneration and Reusability: Repeated use of biosensors requires regeneration protocols that efficiently remove bound targets without damaging the immobilized recognition elements or sensor surface [41].
- Manufacturing Reproducibility: Consistent sensor-to-sensor performance is critical for commercial viability, requiring strict quality control during manufacturing, particularly for surface functionalization steps [75].
- Stability and Shelf Life: Maintaining bioreceptor activity (antibodies, aptamers) during storage and shipping necessitates optimized stabilization formulations and packaging [75].
The direct comparison between QCM and electrochemical biosensors reveals complementary strengths that position each technology for different diagnostic applications. QCM technology excels in scenarios demanding exceptional sensitivity and the ability to monitor binding events in real-time without labels, making it particularly valuable for laboratory-based confirmation testing, fundamental binding interaction studies, and situations where ultralow detection limits are paramount [41] [73]. The verification of QCM functionality in complex biological fluids further supports its translation to clinical settings [41].
Electrochemical biosensors offer compelling advantages in applications requiring rapid results, portability, and point-of-care testing capabilities [72]. Their significantly shorter preparation time, compatibility with miniaturization, and lower instrumentation costs make them ideally suited for widespread screening programs, resource-limited settings, and home testing applications [41] [72].
Future developments in both technologies will likely focus on multiplexing capabilities for simultaneous detection of multiple pathogens, enhanced portability and connectivity for telemedicine applications, and improved automation for simplified operation by non-specialists [75]. The ongoing integration of advanced nanomaterials and machine learning algorithms for data analysis will further enhance sensitivity, specificity, and reliability [72] [75]. As these technologies continue to evolve, they will play increasingly important roles in global health security by enabling rapid, accurate, and accessible viral detection for pandemic preparedness and response.
Surface-sensitive analytical techniques are indispensable in modern research and development, enabling the real-time, label-free investigation of molecular interactions at interfaces. For scientists working in fields ranging from drug discovery to materials science, selecting the appropriate analytical tool is paramount. Among the most prominent techniques are Quartz Crystal Microbalance (QCM), Surface Plasmon Resonance (SPR), and Spectroscopic Ellipsometry (SE). While each of these methods can monitor adsorption and binding events, their underlying physical principles differ significantly, leading to unique strengths, limitations, and complementary information outputs. QCM is an acoustic technique sensitive to mass and viscoelastic properties, including hydrodynamically coupled solvent. In contrast, SPR is an optical method that detects changes in refractive index, and Ellipsometry measures changes in the polarization state of reflected light. This whitepaper provides an in-depth technical comparison of these three techniques, detailing their working principles, the complementary nature of the data they provide, and experimental protocols for their application. The objective is to equip researchers with the knowledge to select the optimal technique or combination of techniques for their specific investigative needs, thereby enriching the context of broader research utilizing Quartz Crystal Microbalance.
Fundamental Principles and Measurement Outputs
Quartz Crystal Microbalance (QCM)
QCM is an acoustic technique based on the piezoelectric properties of an AT-cut quartz crystal. When an alternating voltage is applied to the electrodes on either side of the crystal, it induces a shear oscillation at a characteristic resonant frequency [77]. The core measurement principle is that any mass adsorbed or bound to the sensor surface will alter this oscillation frequency. In its advanced form, QCM with Dissipation monitoring (QCM-D) measures two parameters simultaneously: the change in resonance frequency (Δf) and the change in energy dissipation (ΔD) [77]. The frequency shift (Δf) is related to the mass change at the surface (including both the analyte and any coupled solvent), while the dissipation shift (ΔD) quantifies the energy loss per oscillation cycle, providing information about the viscoelasticity or softness of the adsorbed layer [77] [78]. A decrease in frequency indicates mass uptake, while an increase in dissipation suggests the formation of a soft, dissipative layer.
Surface Plasmon Resonance (SPR)
SPR is an optical technique that relies on the excitation of surface plasmons—collective oscillations of electrons at a metal-dielectric interface, typically a gold film. At a specific angle and wavelength of incident polarized light, a resonance condition is met, resulting in a transfer of energy and a sharp dip in the intensity of reflected light [79]. This resonance angle (θ) is exquisitely sensitive to changes in the refractive index within a few hundred nanometers of the metal surface. When molecules bind to the sensor surface, they alter the local refractive index, causing a shift in the resonance angle [79] [78]. SPR measures this shift as its primary output, which is proportional to the mass concentration of the bound material. Crucially, SPR is largely insensitive to solvent associated within the layer, and thus is often considered to measure "dry mass" [80].
Spectroscopic Ellipsometry (SE)
Ellipsometry is another optical technique that measures the change in the polarization state of light after it reflects from a sample surface. It does not measure intensity directly, but rather the ratio of the complex reflection coefficients for light polarized parallel (p) and perpendicular (s) to the plane of incidence. This ratio is expressed by the two ellipsometric parameters, Psi (Ψ) and Delta (Δ) [81]. These parameters are influenced by the optical properties (complex refractive index, N = n + ik) and the thickness of thin films on the surface. By modeling the sample as a stack of layers with defined optical constants, one can extract physical properties such as film thickness and refractive index from Ψ and Δ [81] [78]. Like SPR, ellipsometry is an optical method and typically measures the "dry mass" of an adsorbed layer, excluding solvent [80].
Table 1: Core Measurement Principles and Outputs
| Technique | Physical Principle | Primary Measured Parameters | Derived Information |
|---|---|---|---|
| QCM-D | Acoustic (Piezoelectric) | Frequency shift (Δf), Dissipation shift (ΔD) | Hydrated mass, viscoelastic properties, layer rigidity, conformational changes [77] [78] |
| SPR | Optical (Plasmonics) | Shift in resonance angle (Δθ) | Dry mass, binding kinetics (ka, kd), affinity (KD) [79] [78] |
| Ellipsometry | Optical (Polarimetry) | Ellipsometric angles Psi (Ψ) and Delta (Δ) | Dry mass, film thickness, refractive index, optical constants [81] [78] |
Comparative Analysis: Strengths and Limitations
The fundamental differences in how QCM, SPR, and Ellipsometry interact with a sample material lead to a distinct set of strengths and limitations for each technique. Understanding these is key to selecting the right tool for a given application.
Mass Sensitivity: "Wet" vs. "Dry" Mass
The most critical distinction lies in the type of mass detected. QCM, as an acoustic method, measures the mass of the analyte plus any solvent that is coupled to and moves with it. This is referred to as the "wet mass" [80]. This makes QCM exceptionally useful for studying hydrated soft materials, such as polymer films, lipid bilayers, and biomolecular layers, where water is an integral part of the structure. For instance, the same number of molecules in a swollen, solvent-trapping configuration will register a larger QCM mass than in a collapsed configuration [80]. In contrast, optical techniques like SPR and Ellipsometry are sensitive to changes in the refractive index, which is a function of the mass of the adsorbate itself, excluding the solvent. They therefore measure the "dry mass" [80]. The difference between the QCM (wet) mass and the optical (dry) mass can be used to quantify the water content and swelling ratio of a soft layer.
Viscoelastic and Structural Sensitivity
A key strength of QCM-D is its unique ability to probe the viscoelastic properties of a surface layer through the dissipation factor (D). A rigid, tightly coupled film results in minimal energy dissipation, whereas a soft, viscous film causes significant damping of the crystal oscillation [77] [78]. This allows researchers to distinguish between rigid and soft layers and monitor structural transformations in real time, such as protein conformational changes or the swelling of a polymer brush. Neither SPR nor standard Ellipsometry provides direct information about the viscoelastic properties of the adlayer [78]. They are sensitive to the optical density of the layer but cannot natively differentiate between a rigid and a soft layer of the same dry mass.
Suitability for Different Sample Types
- Small Molecule Detection: SPR generally holds an advantage in detecting the binding of very small molecules due to its high sensitivity to refractive index changes and is often the preferred method for studying small-molecule drug interactions with immobilized protein targets [78]. While QCM is inherently less sensitive to small mass changes, its sensitivity can be amplified using nanomaterials, and it can detect small molecules that induce significant conformational changes in a larger receptor protein, an effect that might be invisible to SPR [82].
- Thick and Viscoelastic Films: QCM-D excels in characterizing soft, thick, and highly hydrated films, as the dissipation factor provides crucial information about the film's mechanical properties [77]. However, data interpretation for very thick and highly viscous layers can become complex and require modeling [78]. SPR's sensing depth is limited by the evanescent field decay (typically ~200 nm), making it less effective for studying very thick films where the refractive index change may be difficult to detect [78].
- Sample Optical Properties: SPR requires optically clear media, as turbid or opaque samples can interfere with the optical signal [78]. Ellipsometry can be compromised if the material strongly absorbs light in the measured spectral range [78]. QCM, being an acoustic method, is unaffected by the optical properties of the sample solution.
Table 2: Comparative Strengths and Limitations for Application Scenarios
| Application Scenario | QCM-D | SPR | Ellipsometry |
|---|---|---|---|
| Binding Kinetics (Affinity) | Good for larger analytes | Excellent (industry standard) | Less common, possible |
| Small Molecule Binding | Limited unless conformational change occurs [82] | Excellent sensitivity [78] | Possible, depends on size/thickness |
| Layer Viscoelasticity | Excellent (directly via ΔD) [77] | Not measured [78] | Not measured [78] |
| Hydrated/Soft Films | Excellent (measures wet mass) [80] | Limited (measures dry mass) | Limited (measures dry mass) |
| Film Thickness | Can be modeled with viscoelastic analysis | Can be calculated | Excellent (primary output) [81] |
| Optically Opaque Media | Compatible | Not compatible [78] | Challenging |
Experimental Protocols and Workflows
A Representative QCM-D Experiment: Protein Immobilization and Interaction Study
The following protocol, adapted from biotin-streptavidin literature, illustrates a typical QCM-D workflow for studying biomolecular interactions [82].
1. Sensor Surface Preparation:
- Use a gold-coated QCM-D sensor crystal.
- Clean the sensor surface using a standard protocol (e.g., UV-ozone treatment followed by rinsing with ethanol and water).
- Immerse the sensor in a solution containing a mixture of biotinylated and non-biotinylated oligo(ethylene glycol) (OEG) disulfides to form a self-assembled monolayer (SAM). A mixture with 1% biotinylated disulfide is often optimal to maximize specific binding while minimizing non-specific adsorption [82].
- Rinse thoroughly with buffer to remove physically adsorbed thiols.
2. Baseline Establishment:
- Mount the sensor in the QCM-D flow chamber.
- Flow a running buffer (e.g., PBS) at a constant rate until stable frequency (f) and dissipation (D) baselines are achieved for multiple overtones.
3. Streptavidin Immobilization:
- Introduce a solution of streptavidin (e.g., 10 µg/mL in PBS) over the biotinylated surface.
- Monitor the decrease in frequency and increase in dissipation as streptavidin binds to the biotin groups, forming a stable layer.
- Rinse with buffer to remove unbound protein. The stabilized Δf and ΔD values indicate the amount and structural properties of the immobilized streptavidin layer.
4. Ligand Capture:
- Introduce a biotinylated ligand (e.g., a biotinylated antibody or BSA) to bind to the remaining free sites on the streptavidin layer.
- A further decrease in f confirms successful capture. Rinse with buffer.
5. Analytic Interaction:
- Introduce the analyte of interest (e.g., antigen for an antibody ligand).
- Monitor the QCM-D response in real-time. A successful binding event will be indicated by a negative shift in frequency. The magnitude of the dissipation shift can indicate whether the binding results in a rigid (small ΔD) or soft (larger ΔD) complex.
- Rinse with buffer to assess binding stability.
6. Data Analysis:
- Plot Δf and ΔD versus time for different overtones.
- Use the Sauerbrey equation for rigid films to estimate mass, or apply viscoelastic modeling for soft films to quantify hydrated mass, thickness, and viscoelastic properties.
Combined QCM and Ellipsometry Experimental Setup
The complementary "wet" and "dry" mass data from QCM and Ellipsometry can be obtained in a combined setup for a more comprehensive analysis [81] [80]. The workflow is as follows:
Diagram 1: Combined QCM-Ellipsometry experimental workflow for determining layer hydration.
Research Reagent Solutions and Essential Materials
Table 3: Essential Materials for a QCM-D Biosensing Experiment
| Reagent/Material | Function/Description | Application Example |
|---|---|---|
| Gold-coated QCM Sensor Chips | The piezoelectric substrate that transduces mass/viscoelastic changes into frequency/dissipation signals. | Foundation for all QCM-D experiments [82]. |
| Biotinylated OEG Disulfides | Forms a self-assembled monolayer (SAM) on gold; provides biotin groups for specific immobilization and OEG background to resist non-specific binding [82]. | Creating a specific, low-noise sensor surface for streptavidin-based assays [82]. |
| Streptavidin | Tetrameric protein that binds tightly (Kd ≈ 10⁻¹⁴–10⁻¹⁶ M) to biotin; serves as a versatile bridge for immobilizing any biotinylated molecule [82]. | Immobilizing biotinylated ligands like antibodies, DNA, or receptors [82]. |
| MXene-AuNPs Nanocomposite | A nanomaterial used to modify the sensor surface; increases surface area and binding sites, enhancing sensitivity [38]. | Signal amplification in biosensors for detecting small molecules like Pb²⁺ [38]. |
| Quantum Dots (QDs) | Nanoparticles used as mass tags; when bound to the sensor surface, they significantly amplify the QCM frequency shift [38]. | Ultrasensitive detection of small analytes in a QCM biosensor [38]. |
Quartz Crystal Microbalance (QCM), Surface Plasmon Resonance (SPR), and Ellipsometry are powerful, label-free surface analysis techniques that offer complementary insights. QCM's unique strength lies in its ability to provide information on the hydrated mass and viscoelastic properties of an adlayer, making it ideal for studying soft, hydrated materials and conformational changes. SPR is the unmatched leader for the high-sensitivity kinetic analysis of molecular interactions, particularly for small molecules. Ellipsometry excels at providing precise measurements of film thickness and optical constants. The choice between them is not a matter of which is superior, but which is most appropriate for the specific scientific question at hand. For a comprehensive understanding of complex interfacial events, particularly those involving hydrated soft materials, the combined use of QCM with an optical technique like SPR or Ellipsometry provides a powerful synergistic approach, revealing both the structural and quantitative details of the system under study.
The analysis of molecular interactions represents a cornerstone of modern biomedical research and drug development. Among the most powerful tools for such investigations are Quartz Crystal Microbalance with Dissipation monitoring (QCM-D) and Localized Surface Plasmon Resonance (LSPR), two label-free techniques that provide complementary information about binding events and structural changes. QCM-D operates on the principle of the piezoelectric effect, where a quartz crystal is excited to oscillate at its resonant frequency. LSPR leverages the unique optical properties of metallic nanoparticles, which exhibit a strong absorption of electromagnetic radiation when incident light matches the collective oscillation frequency of their conduction electrons. When deployed individually, each technique offers valuable insights; however, their integration creates a synergistic analytical platform that provides a more comprehensive understanding of complex bio-interfacial phenomena than either could achieve alone.
The fundamental synergy arises from their distinct but complementary measurement sensitivities. QCM-D excels at detecting mass changes, including hydrodynamically coupled water, and provides unique information about the viscoelastic properties of the adsorbed layer [83] [84] [85]. In contrast, LSPR is exquisitely sensitive to changes in the local refractive index immediately adjacent to the nanoparticle surface, effectively reporting on the dry mass of an adsorbate [86]. The combination allows researchers to deconvolute mass contributions and gain insights into molecular orientation, conformation, and hydration states in real-time. This technical guide explores the principles, methodologies, and applications of this powerful hybrid approach, framed within broader quartz crystal microbalance research.
Fundamental Principles and Technical Foundations
Quartz Crystal Microbalance with Dissipation (QCM-D)
Core Operating Principle
QCM-D's operation is rooted in the piezoelectric effect exhibited by quartz crystals. When an alternating voltage is applied to electrodes on either side of a quartz crystal disc, it induces a precise mechanical oscillation at a characteristic resonant frequency [84]. The instrument meticulously tracks changes in this resonant frequency (Δf) and the energy dissipation (ΔD), which occurs when the applied voltage is stopped and the oscillation amplitude decays. The dissipation factor quantifies the energy loss during oscillation, providing critical information about the viscoelasticity of the material adsorbed on the crystal surface [85]. In liquid environments, these parameters are influenced by the bound mass, including any coupled water, and the structural properties of the adlayer.
Data Interpretation and Modeling
The most fundamental relationship in QCM-D analysis is the Sauerbrey equation, which directly relates the frequency shift to mass deposition under specific conditions:
Δm = - (C · Δf)/n
- Δm: Mass change per unit area (ng/cm²)
- C: Sauerbrey constant (17.7 ng·cm⁻²·Hz⁻¹ for a 5 MHz crystal)
- Δf: Frequency change (Hz)
- n: Overtone number (1, 3, 5, ...) [85]
The Sauerbrey equation applies strictly to thin, rigid, and uniformly adsorbed films. For softer, more viscoelastic layers that do not fully couple to the crystal's oscillation, the energy dissipation factor becomes crucial. The ΔD/Δf ratio serves as an empirical indicator of film softness; a higher ratio indicates a more dissipative, soft layer [84]. For detailed characterization of soft films, data from multiple overtones can be fitted to viscoelastic models (e.g., the Voigt model) to extract quantitative parameters such as shear viscosity, shear elasticity, and the precise hydrodynamic thickness of the adlayer [85].
Localized Surface Plasmon Resonance (LSPR)
Physical Phenomenon and Sensing Mechanism
LSPR is a nanoscale optical phenomenon occurring in noble metal nanoparticles (e.g., gold, silver). When the frequency of incident light matches the natural frequency of the collective oscillation of conduction electrons in the nanoparticle, a strong resonance absorption band appears in the extinction spectrum [86]. The precise spectral position of this LSPR peak is highly sensitive to changes in the local refractive index within the nanoparticle's immediate vicinity, typically within a few tens to hundreds of nanometers. When molecules adsorb onto the functionalized surface of the nanoparticles, they displace the medium and alter the local refractive index, resulting in a measurable shift of the LSPR peak wavelength (see Figure 1) [87] [86].
Key Performance Parameters
The sensitivity of an LSPR sensor is often quantified by its refractive index sensitivity (RIS), expressed in nanometers per refractive index unit (nm/RIU). For instance, one study reported an RIS of 33 ± 5 nm/RIU for Au-TiO₂ films [86]. Any binding event on the nanoparticle surface, such as the specific interaction between a immobilized streptavidin layer and a biotinylated molecule, will induce a small but detectable redshift (increase in wavelength) of the LSPR peak, typically on the order of 0.1 to several nanometers, proportional to the adsorbed "dry mass" [86].
Synergistic Information from Combined Data
The powerful synergy of combining QCM-D and LSPR stems from their complementary measurement principles and sensing volumes. The following table summarizes their core characteristics and highlights their complementary nature.
Table 1: Complementary Characteristics of QCM-D and LSPR Technologies
| Feature | QCM-D | LSPR |
|---|---|---|
| Primary Measured Parameter | Frequency (Δf) & Energy Dissipation (ΔD) | LSPR Peak Wavelength Shift (Δλ) |
| Primary Sensitivity | Hydrated mass (including coupled water), viscoelasticity | Local refractive index change ("dry mass") |
| Sensing Volume / Penetration Depth | ~250 nm, entire adlayer and beyond [84] | ~30-100 nm, decays exponentially from surface [87] |
| Mass Sensitivity | ~0.5 ng/cm² (liquid) [83] | Varies with nanoparticle design |
| Information Obtained | Total adsorbed mass, layer thickness, viscosity, elasticity | Bound biomolecular dry mass, conformation close to surface |
| Key Complement | Reports on hydrodynamic volume and softness | Reports on internal density and packing |
The combination allows researchers to distinguish between mass contributions. For example, a large Δf in QCM-D with a small Δλ in LSPR suggests the adsorption of a highly hydrated, fluffy layer. Conversely, a proportional response suggests the formation of a dense, rigid film. This enables the investigation of molecular orientation, conformational changes, and hydration states in complex biomolecular layers.
Integrated QCM-D/LSPR System Design
The design of a hybrid QCM-D/LSPR instrument requires careful integration of optical components for LSPR detection with the acoustic measurement system of QCM-D. A successful implementation, as demonstrated in a university project, involves a specialized measurement cell that hosts a custom-designed sensor chip accessible to both technologies [88].
The Sensor Chip and Measurement Cell
The core of the hybrid system is a specially engineered sensor chip. The QCM-D component typically uses an AT-cut quartz crystal with a fundamental frequency of 5 MHz, coated with gold electrodes [83]. To enable LSPR measurements concurrently, the top gold electrode is designed as a ring electrode, creating a central transparent window. This allows light to pass through and interact with LSPR-active nanostructures deposited in the center [88]. The measurement cell is a temperature-controlled flow cell constructed with materials like anodized aluminum for heat distribution and incorporates transparent quartz windows aligned with the sensor chip's optical path. This design facilitates the transmission of light for LSPR excitation and signal collection while maintaining a stable environment for QCM-D measurements [88].
Electronic and Optical Subsystems
The system requires sophisticated electronics for precise control and data acquisition:
- Frequency Acquisition Module: Based on principles of driving the crystal and monitoring its resonant frequency and dissipation with high precision (e.g., using FPGA and DSP systems). The mass resolution can reach the nanogram level [88].
- Temperature Control System: A high-precision system is vital, as both techniques are temperature-sensitive. Using an optimized PID controller, stability within ±0.1°C can be achieved [88].
- Optical Setup for LSPR: This includes a broadband light source (e.g., a halogen lamp), lenses for collimation and focusing, and a mini-spectrometer to capture the transmission spectrum through the sensor chip in real-time [88] [86].
The following diagram illustrates the logical integration and workflow of a combined QCM-D/LSPR system:
Figure 1: Workflow of a combined QCM-D/LSPR experiment, showing the parallel data acquisition and integrated analysis.
Experimental Protocols and Methodologies
Sensor Chip Functionalization
A critical step for any bio-sensing experiment is the functionalization of the sensor surface with a specific capture molecule. A typical protocol for creating a biosensor for virus detection might proceed as follows:
- Surface Cleaning: The gold sensor chip (ring electrode design) is cleaned in a piranha solution (3:1 mixture of concentrated H₂SO₄ and 30% H₂O₂) for 1-2 minutes, followed by thorough rinsing with ultrapure water and drying under a stream of nitrogen. Caution: Piranha solution is extremely corrosive and must be handled with care.
- Self-Assembled Monolayer (SAM) Formation: The chip is immersed in a 1 mM solution of a thiolated alkane molecule (e.g., a mixture of 90% hexa(ethylene glycol) undecane thiol and 10% biotin-terminated undecane thiol) in ethanol for at least 12 hours. This forms a stable, protein-resistant monolayer that presents biotin groups for subsequent binding.
- Streptavidin Immobilization: The chip is rinsed with ethanol and buffer, then placed in the measurement cell. A solution of streptavidin (e.g., 4.5 μg/mL in a suitable buffer like PBS) is injected and allowed to bind to the surface biotin for 30-60 minutes [86].
- Biotinylated Capture Probe Immobilization: After washing away unbound streptavidin, a solution of the biotinylated capture molecule (e.g., a biotinylated antibody or DNA probe specific to the target analyte) is injected and incubated. The strong biotin-streptavidin interaction immobilizes the probe on the surface.
- Surface Blocking: Any remaining unreacted biotin sites on the surface are blocked by injecting a solution of free biotin or bovine serum albumin (BSA) to minimize non-specific adsorption in subsequent steps.
Concurrent QCM-D/LSPR Binding Assay
This protocol details the process for running a binding experiment on the functionalized chip.
- Baseline Establishment: With the functionalized chip in the temperature-stabilized measurement cell, a running buffer is flowed through the system at a constant rate (e.g., 50 μL/min). The baseline for both QCM-D frequency/dissipation and LSPR peak wavelength is stabilized [83] [88].
- Sample Injection: The analyte solution (e.g., a viral protein or DNA at a specific concentration) is injected into the flow stream for a defined period (e.g., 10-20 minutes).
- Real-Time Monitoring: Both QCM-D (Δf, ΔD at multiple overtones) and LSPR (Δλ) signals are recorded simultaneously throughout the injection phase.
- Washing: The running buffer is reintroduced to wash away unbound and weakly associated molecules. The change in signals during this phase indicates the stability and strength of the formed complex.
- Regeneration (Optional): For reusable chips, a regeneration solution (e.g., low pH glycine buffer) can be injected to break the binding between the capture probe and analyte, returning the signals close to baseline.
Data Analysis Workflow
- Data Normalization: Normalize both QCM-D and LSPR data to the start of the sample injection.
- Sauerbrey Mass Calculation: For rigid adlayers, calculate the QCM-D areal mass using the Sauerbrey equation on the frequency shift from a stable overtone.
- LSPR Mass Correlation: Correlate the LSPR wavelength shift with surface coverage. This can be calibrated using known standards.
- Comparative Analysis: Plot the QCM-D mass (hydrated) against the LSPR mass (dry). The difference represents the coupled water mass.
- Structural Assessment: Use the dissipation factor (ΔD) from QCM-D to assess structural changes. A high dissipation value coupled with a large mass discrepancy suggests the formation of a soft, highly hydrated layer.
Table 2: Key Reagent Solutions for a QCM-D/LSPR Biosensing Experiment
| Reagent / Material | Function / Purpose | Example / Specification |
|---|---|---|
| AT-cut Quartz Chip with Ring Electrode | Piezoelectric substrate and LSPR platform | 5 MHz fundamental frequency, 14 mm diameter, Au electrode [88] |
| Thiolated Alkanes (e.g., EG6-Biotin) | Form a self-assembled monolayer (SAM) for probe immobilization | ~90% EG6-OH, ~10% EG6-Biotin in ethanol |
| Streptavidin | Bridge molecule for immobilizing biotinylated probes | >95% purity, dissolved in PBS buffer, ~4.5 μg/mL [86] |
| Biotinylated Capture Probes | Recognize and bind the target analyte | Antibody, DNA, or RNA with biotin tag |
| Running Buffer (e.g., PBS) | Maintain a stable physiological environment during analysis | Phosphate Buffered Saline, pH 7.4, 0.22 μm filtered |
| Analyte Solution | The molecule of interest being studied | Serial dilutions in running buffer to determine kinetics |
| Regeneration Buffer | Cleaves specific bonds to regenerate the sensor surface | 10 mM Glycine-HCl, pH 2.0-2.5 |
Applications in Bio-Interface Research and Drug Development
The hybrid QCM-D/LSPR platform finds powerful applications in areas where understanding the intricate details of molecular interactions and layer structure is paramount.
Virus Detection and Characterization
As highlighted in one project, a primary application is the rapid and sensitive detection of viruses like SARS-CoV-2. The combination of technologies addresses limitations of single-method approaches. While PCR remains the gold standard, it is time-consuming and requires complex sample preparation [88]. The QCM-D/LSPR platform can detect viral particles or proteins directly from a sample in a label-free manner. QCM-D provides a highly sensitive response to the binding of the entire virion, while LSPR offers orthogonal validation and can help differentiate between specific binding and non-specific adsorption, potentially reducing false-positive results [88]. The portability of such an integrated system also opens avenues for point-of-care diagnostics.
Protein Adsorption and Conformational Studies
The combination is exceptionally well-suited for studying the formation and properties of protein layers on surfaces, which is critical for understanding bio-fouling, developing implantable materials, and creating biosensors.
- Hydration and Viscoelasticity: When a protein adsorbs to a surface, QCM-D responds to the total mass of the protein and any water trapped within its structure. LSPR responds primarily to the protein's dry mass. A large frequency shift (QCM-D) with a small wavelength shift (LSPR) indicates the formation of a soft, highly hydrated protein layer, whereas proportional shifts suggest a dense, rigid film.
- Orientation and Denaturation: Changes in the dissipation factor can indicate structural rearrangements. For instance, an increase in dissipation during an adsorption event might suggest that proteins are undergoing unfolding or reorientation on the surface, creating a more dissipative, viscoelastic layer. The combined data can help researchers optimize surface chemistries to promote desired protein orientations or prevent denaturation.
Biomembrane Interactions and Drug Delivery
The formation of supported lipid bilayers (SLBs) and their interaction with drug molecules, peptides, or nanoparticles is another key application area. QCM-D can monitor the entire process of vesicle adsorption, rupture, and bilayer formation in real-time, providing information on the kinetics and final quality of the bilayer based on the frequency and dissipation signals [84] [85]. LSPR can simultaneously probe the more localized changes in the bilayer's structure and thickness. When an antimicrobial peptide or a drug-loaded nanoparticle interacts with the membrane, QCM-D can reveal whether the interaction leads to pore formation, membrane disruption, or rigidification, while LSPR provides complementary data on the amount of material inserted into the membrane, aiding in the mechanistic understanding of drug-membrane interactions.
The integration of QCM-D and LSPR technologies represents a significant advancement in the toolkit for interfacial analysis in life sciences. By concurrently measuring the acoustic (QCM-D) and optical (LSPR) responses of a sensing surface, this hybrid platform delivers a multidimensional perspective on molecular binding events, layer formation, and structural dynamics. It uniquely allows researchers to deconvolute the contributions of hydrated mass, viscoelasticity, and dry mass, providing insights that are simply inaccessible to either technique in isolation. As the demand for sophisticated, label-free analytical methods grows in drug discovery, diagnostic development, and biomaterials research, the synergistic power of combined QCM-D and LSPR is poised to play an increasingly vital role in driving scientific and technological innovation.
This whitepaper provides an in-depth technical examination of the core performance metrics—sensitivity, specificity, and limit of detection (LOD)—for Quartz Crystal Microbalance (QCM) technology within biomedical and pharmaceutical research contexts. QCM is a highly sensitive, mass-based sensing technique that operates on the principle of the piezoelectric effect, where a quartz crystal resonator oscillates at a characteristic frequency when an alternating voltage is applied. The adsorption of mass onto the sensor surface causes a decrease in this resonant frequency, enabling real-time, label-free monitoring of molecular interactions. While intrinsic mass sensitivity often receives primary focus, this guide emphasizes that the practical utility of a QCM biosensor is ultimately determined by the nuanced interplay between its sensitivity, specificity, and LOD. Understanding these metrics is paramount for researchers in deploying QCM effectively for applications ranging from protein-protein interaction studies to the development of biosensors for viral detection.
Quartz Crystal Microbalance (QCM) has emerged as a powerful, label-free analytical technique for real-time monitoring of molecular interactions at surfaces. The fundamental design is based on a thin, AT-cut quartz crystal disk placed between two electrodes [6]. The AT-cut ensures temperature-stable shear-mode oscillations when an alternating electric field is applied via the electrodes, exploiting the piezoelectric effect [6].
The core operational principle is that the resonance frequency of the crystal is exquisitely sensitive to mass changes on its surface. The deposition of a rigid, thin film causes a decrease in the resonant frequency, and this change (Δf) is proportional to the mass change (Δm) per unit area, as described by the Sauerbrey equation [6]:
Δf = - (2 * f₀² * Δm) / (A * √(ρᵩ * μᵩ))
where:
f₀is the fundamental resonant frequency of the crystalAis the piezoelectrically active areaρᵩis the density of quartz (2.648 g·cm⁻³)μᵩis the shear modulus of quartz (2.947 × 10¹¹ g·cm⁻¹·s²) [6]
For a typical 5 MHz QCM sensor, the mass sensitivity is approximately 20 ng·cm⁻² per Hz [89]. This sensitivity increases with the square of the fundamental frequency, leading to the development of high-frequency sensors like the 170-MHz electrodeless QCM, which boasts a mass sensitivity of 15 pg/(cm²·Hz), an improvement of three orders of magnitude over a standard 5 MHz QCM [90].
When operating in a liquid environment, the oscillation of the crystal is damped due to the liquid's viscosity and density. This frequency shift in a liquid is described by the Kanazawa-Gordon equation: Δf = -f₀^(3/2) * √(ρₗ * ηₗ / (π * ρᵩ * μᵩ)), where ρₗ and ηₗ are the density and viscosity of the liquid, respectively [6]. For viscoelastic adsorbed layers, the Sauerbrey equation may not be strictly applicable, and techniques like QCM with Dissipation Monitoring (QCM-D) are employed to account for the energy dissipation in the soft film, providing insights into its structural properties [6].
Core Analytical Metrics
Sensitivity
In the context of QCM, sensitivity is a precise technical parameter. It is defined as the conversion factor between a measured frequency shift and the corresponding mass change per unit area [91]. It is not the smallest detectable amount of an analyte, a common misconception.
The sensitivity of a QCM instrument is governed by the physical properties of the quartz crystal and its fundamental resonance frequency. As shown in the Sauerbrey equation, the frequency shift (Δf) for a given mass change (Δm) is proportional to the square of the fundamental frequency (f₀²). Therefore, increasing the resonant frequency of the crystal directly increases its mass sensitivity [90] [89]. For instance, a 170 MHz QCM sensor demonstrated a mass sensitivity of 15 pg/(cm²·Hz), which is about 1000 times more sensitive than a conventional 5 MHz QCM [90].
Table 1: Mass Sensitivity of QCM Systems at Different Frequencies
| Fundamental Frequency (MHz) | Mass Sensitivity | Application Example |
|---|---|---|
| 5 MHz [89] | ~20 ng·cm⁻² per Hz | Standard baseline for comparison |
| 10 MHz [6] | ~4.4 ng·cm⁻² per Hz | Protein adsorption studies |
| 170 MHz [90] | 15 pg·cm⁻² per Hz | Detection of human IgG at sub-pM concentrations |
Limit of Detection (LOD)
The Limit of Detection (LOD) is the minimum concentration or mass of an analyte that can be reliably distinguished from zero (a blank sample). It is a critical metric for evaluating the practical performance of a biosensor.
Unlike sensitivity, the LOD is determined by the signal-to-noise ratio (SNR). The smallest detectable signal must be significantly larger than the background noise level of the measurement system. A SNR of 2 or 3 is typically considered acceptable for confident detection [91]. Therefore:
LOD ∝ (Noise Level / Sensitivity)
A key consideration is that frequency noise often scales with the fundamental frequency of the QCM sensor. While a higher-frequency sensor has greater mass sensitivity, it may also exhibit higher noise, which can offset the sensitivity advantage and result in an LOD similar to a lower-frequency system [91]. For a typical QCM with a frequency resolution of 0.1 Hz, the LOD is about 2 ng/cm² [89]. In a specific biosensing application for detecting maize chlorotic mottle virus, a QCM biosensor achieved an LOD of approximately 250 ng/mL [92].
Table 2: Factors Influencing QCM Sensitivity and Limit of Detection
| Parameter | Impact on Sensitivity | Impact on LOD | Notes |
|---|---|---|---|
| Higher Fundamental Frequency (f₀) | Increases (proportional to f₀²) | May increase or stay the same | Higher f₀ requires thinner, more fragile crystals [90] |
| Viscoelasticity of Adsorbed Layer | Can lead to overestimation of mass | Can increase noise and worsen LOD | QCM-D is used to correct for this [6] |
| Noise Level (Electrical, Mechanical) | No direct impact | Directly determines LOD | Stability of 0.1 Hz is challenging to maintain [89] |
Specificity
Specificity refers to the ability of a QCM biosensor to respond only to the target analyte and not to other, non-target components in a sample. The intrinsic QCM measurement is non-specific, as any mass adsorption or change in viscoelastic properties at the sensor surface will cause a frequency shift.
Specificity is conferred through surface functionalization. The gold electrode surface is chemically modified and immobilized with a capture agent (e.g., an antibody, aptamer, or protein) that has high and exclusive affinity for the target analyte. For example:
- An anti-MCMV antibody was crosslinked on a gold surface to specifically detect the maize chlorotic mottle virus (MCMV) [92].
- Staphylococcus protein A was immobilized to specifically capture human immunoglobulin G (hIgG) [90].
To minimize false-positive signals, the sensor surface is often further treated with inert proteins (e.g., bovine serum albumin) or blocking agents to passivate any remaining surface and prevent non-specific adsorption of interfering molecules from the sample matrix.
Experimental Protocols for Metric Assessment
Protocol for Determining Mass Sensitivity
Objective: To empirically determine the mass sensitivity of a QCM system. Principle: The sensitivity is derived from the slope of the frequency shift (Δf) versus the areal mass density (Δm/A) of a deposited film.
- Sensor Preparation: Clean the gold sensor surface using a standard piranha solution (3:1 mixture of concentrated sulfuric acid and 30% hydrogen peroxide) CAUTION: Highly corrosive. Rinse thoroughly with pure ethanol and deionized water, and dry under a stream of nitrogen gas.
- Baseline Establishment: Place the sensor in the QCM flow cell or holder and initiate oscillation in air or an inert gas. Record a stable baseline frequency (f₀) for at least 5-10 minutes.
- Calibrated Mass Deposition: a. Vapor Deposition: Use a physical vapor deposition system to deposit a thin, rigid metal film (e.g., gold or chromium) onto the sensor surface. Use a calibrated quartz crystal microbalance within the deposition chamber to measure the areal mass density (Δm/A) of the deposited film in real-time. b. Alternatively, Langmuir-Blodgett Transfer: Transfer a known number of Langmuir-Blodgett monolayers of a fatty acid (e.g., arachidic acid), which have a well-defined molecular area and mass.
- Frequency Measurement: After deposition, measure the new resonant frequency (f) of the sensor.
- Calculation: The mass sensitivity (s) is calculated from the slope of the plot of Δf ( = f - f₀ ) versus the deposited areal mass density (Δm/A), according to the linear relationship:
Δf = -s * Δm.
Protocol for Determining Limit of Detection (LOD) for a Biosensor
Objective: To establish the lowest concentration of a target analyte that can be reliably detected by a functionalized QCM biosensor. Principle: The LOD is calculated from the dose-response curve of the sensor, considering the noise of the measurement.
- Biosensor Functionalization: a. Form a Self-Assembled Monolayer (SAM): Incubate the gold sensor with a solution of 10:1 3-mercaptopropanoic acid and 11-mercaptoundecanoic acid for 12-24 hours to form a carboxyl-terminated SAM [92]. b. Activate Carboxyl Groups: Flush the cell with a solution of a crosslinker like a mixture of N-Hydroxysuccinimide (NHS) and N-(3-Dimethylaminopropyl)-N'-ethylcarbodiimide hydrochloride (EDC) for 10-15 minutes. c. Immobilize Capture Probe: Introduce a solution of the specific antibody (e.g., anti-MCMV, ~100 µg/mL) to the surface, allowing it to covalently bind to the activated carboxyl groups for one hour [92]. d. Blocking: Passivate the remaining activated groups by flowing a 1 M ethanolamine solution. Finally, flush with a solution of bovine serum albumin (BSA, 1% w/v) to block non-specific binding sites.
- Noise Level Determination: With the functionalized sensor in a running buffer (e.g., PBS), record the frequency output for at least 30 minutes. The standard deviation of this baseline signal is the noise (σ).
- Dose-Response Measurement: a. Introduce a series of standard solutions of the target analyte (e.g., MCMV) at known, increasing concentrations (e.g., from 0, 250 ng/mL, 500 ng/mL up to 10 µg/mL) [92]. b. For each concentration, monitor the frequency shift until a stable signal is reached. Rinse with buffer between concentrations to measure the specific, irreversible binding signal. c. Plot the steady-state frequency shift (Δf) against the analyte concentration.
- LOD Calculation: Calculate the LOD using the formula:
LOD = 3.3 * (Standard Error of the Regression) / Slope, where the slope is derived from the linear portion of the dose-response curve. Alternatively, if the blank response is known,LOD = (Mean of Blank) + 3 * (Standard Deviation of Blank).
Protocol for Assessing Specificity
Objective: To confirm that the observed frequency response is due to specific interaction with the target analyte. Principle: Compare the sensor's response to the target analyte against its response to similar, non-target interferents.
- Control Sensor Preparation: Functionalize one QCM sensor with the specific capture probe (e.g., anti-MCMV antibody) as described in Section 3.2.
- Negative Control Preparation: Prepare a second, control sensor by following the same functionalization steps but immobilizing a non-specific antibody or just BSA.
- Challenge with Interferents: Expose both sensors to a solution containing a high concentration of a potential interferent (e.g., a different virus, serum proteins, or cell lysate).
- Challenge with Target: Subsequently, expose both sensors to the target analyte at a concentration near the determined LOD.
- Data Analysis: A specific biosensor will show a significant frequency shift only upon injection of the target analyte on the probe-functionalized sensor, with minimal response to interferents or on the control sensor.
Essential Research Reagent Solutions
The following table details key materials and reagents required for developing and running QCM biosensor experiments, particularly for protein-based detection.
Table 3: Essential Research Reagents for QCM Biosensing
| Reagent / Material | Function / Explanation | Example Usage |
|---|---|---|
| AT-cut Quartz Crystals | The piezoelectric sensor substrate. The AT-cut provides temperature stability for the shear-mode oscillation essential for liquid-phase measurements [6]. | Core component of every QCM sensor. |
| Gold Electrodes | Provide the electrical contact to drive the crystal and serve as the primary surface for chemical functionalization due to gold's inertness and well-established thiol chemistry [92]. | Standard sensor surface. |
| Thiol-based SAM Reagents | Form a molecularly defined interface on the gold surface. Provide functional groups (e.g., -COOH) for subsequent immobilization of biomolecules [92]. | 3-mercaptopropanoic acid, 11-mercaptoundecanoic acid. |
| Crosslinking Agents | Activate surface functional groups to create reactive esters for covalent coupling to primary amines in proteins [92]. | EDC and NHS. |
| Capture Probes | Biological recognition elements that confer specificity to the biosensor (e.g., antibodies, aptamers, recombinant proteins). | Anti-MCMV antibody [92], Staphylococcus protein A [90]. |
| Blocking Agents | Proteins or chemicals used to passivate unreacted sites on the sensor surface, minimizing non-specific adsorption [92]. | Bovine Serum Albumin (BSA), ethanolamine. |
Visualization of QCM Principles and Workflows
QCM Biosensing Workflow
Relationship Between Core QCM Metrics
Conclusion
Quartz Crystal Microbalance stands as a pivotal technology in the analytical toolkit for biomedical research, offering unparalleled capabilities for real-time, label-free investigation of surface interactions at the nanoscale. Its evolution into QCM-D, with the ability to probe viscoelastic properties, has expanded its relevance to complex biological systems. The convergence of QCM with other transduction methods, such as LSPR, heralds a new era of multi-parametric analysis, enhancing detection reliability and information depth. Future directions point toward the development of increasingly portable devices for point-of-care diagnostics, high-throughput screening platforms for drug discovery, and sophisticated hybrid instruments that will further bridge the gap between fundamental research and clinical application, solidifying QCM's role in advancing personalized medicine and diagnostic technologies.
References
- 1. 石英晶体微天平(QCM)应用的研究进展 [https://zlxb.zafu.edu.cn/article/doi/10.11833/j.issn.2095-0756.20190570]
- 2. 抗药物抗体检测技术的进步:微型化生物传感器技术及其他创新 [https://www.ebiotrade.com/newsf/2025-10/20251008003048563.htm]
- 3. 無標籤篩檢技術成為生物醫學研究新方向 [https://geneonline.news/%E7%84%A1%E6%A8%99%E7%B1%A4%E7%AF%A9%E6%AA%A2%E6%8A%80%E8%A1%93%E6%88%90%E7%82%BA%E7%94%9F%E7%89%A9%E9%86%AB%E5%AD%B8%E7%A0%94%E7%A9%B6%E6%96%B0%E6%96%B9%E5%90%91/]
- 4. 标签免费检测市场规模,份额和增长,2032年 [https://www.kingsresearch.com/zh/label-free-detection-market-2742]
- 5. Exploring QCM Technology: How Quartz Crystal ... [https://www.biolinscientific.com/blog/how-does-qcm-technology-work]
- 6. Application of QCM in Peptide and Protein-Based Drug ... [https://pmc.ncbi.nlm.nih.gov/articles/PMC7504752/]
- 7. Studying Soft Interfaces with Shear Waves: Principles and ... [https://pmc.ncbi.nlm.nih.gov/articles/PMC8157064/]
- 8. Using thickness-shear mode quartz resonator for ... [https://www.sciencedirect.com/science/article/abs/pii/S0924424718304394]
- 9. Quartz Crystal Microbalance (QCM) [https://www.nanoscience.com/techniques/quartz-crystal-microbalance/]
- 10. Design and Development of Microscale Thickness Shear ... [https://pmc.ncbi.nlm.nih.gov/articles/PMC6558164/]
- 11. A Review of Quartz Crystal Microbalance-Based Mercury ... [https://pmc.ncbi.nlm.nih.gov/articles/PMC12390107/]
- 12. What is the Sauerbrey equation? [https://www.biolinscientific.com/blog/what-is-the-sauerbrey-equation]
- 13. Sauerbrey equation [https://en.wikipedia.org/wiki/Sauerbrey_equation]
- 14. QCM-石英晶体微天平理论与校准 [https://www.teo.com.cn/index.php/show/23/51.html]
- 15. 什么是Sauerbrey方程? - 百欧林 [https://www.biolinchina.com/1140.html]
- 16. Assessing the Mass Sensitivity for Different Electrode ... [https://pmc.ncbi.nlm.nih.gov/articles/PMC6767270/]
- 17. 石英晶体微平衡测量中的蛋白质吸附和聚合物力学的样品制备 [https://www.jove.com/cn/t/60584/sample-preparation-quartz-crystal-microbalance-measurements-protein]
- 18. QCM data analysis - When to use Viscoelastic modelling [https://www.biolinscientific.com/blog/qcm-data-analysis-when-to-use-viscoelastic-modelling]
- 19. In situ viscoelastic properties and chain conformations of ... [https://www.nature.com/articles/s41598-018-30201-6]
- 20. with Quartz monitoring - Wikipedia crystal microbalance dissipation [https://en.wikipedia.org/wiki/Quartz_crystal_microbalance_with_dissipation_monitoring]
- 21. Quantification of the viscoelasticity of the bond of biotic and abiotic... [https://pubmed.ncbi.nlm.nih.gov/27616066/]
- 22. with Quartz ( Crystal -D) studies of... Microbalance Dissipation QCM [https://orbit.dtu.dk/en/publications/quartz-crystal-microbalance-with-dissipation-qcm-d-studies-of-the]
- 23. Quartz Crystal Microbalance as a Predictive Tool for Drug- ... [https://www.sciencedirect.com/science/article/pii/S0022354923002952]
- 24. Quartz crystal microbalance [https://en.wikipedia.org/wiki/Quartz_crystal_microbalance]
- 25. A Review of Interface Electronic Systems for AT-cut Quartz ... [https://www.mdpi.com/1424-8220/8/1/370]
- 26. QCM: Why measure at overtones matters [https://www.biologic.net/topics/quartz-crystal-microbalance-why-measure-at-overtones/]
- 27. Singapore Quartz Crystal Microbalance (qcm) Market ... [https://www.linkedin.com/pulse/singapore-quartz-crystal-microbalance-qcm-market-ke3ke/]
- 28. Improving the binding efficiency of quartz crystal ... [https://pmc.ncbi.nlm.nih.gov/articles/PMC4241767/]
- 29. Why multiple harmonics are important in QCM measurements [https://www.biolinscientific.com/blog/why-are-overtones-important-in-qcm]
- 30. Why it is useful to use multiple overtones in QCM ... [https://www.biolinscientific.com/blog/why-it-is-useful-to-use-multiple-overtones-in-qcm-measurements]
- 31. U.S. Quartz Crystal Microbalance Market Forecast to Exhibit [https://www.openpr.com/news/4245210/u-s-quartz-crystal-microbalance-market-forecast-to-exhibit]
- 32. Quartz Crystal Microbalance - an overview [https://www.sciencedirect.com/topics/medicine-and-dentistry/quartz-crystal-microbalance]
- 33. QCM-D vs QCM-I – what is the difference? [https://www.biolinscientific.com/blog/qcm-d-vs-qcm-i-what-is-the-difference]
- 34. Strategies to approach QCM-D data analysis and ... [https://www.biolinscientific.com/blog/strategies-to-approach-qcm-d-data-analysis-and-interpretation-advice-from-experienced-users?update_2025=1]
- 35. QCM-D vs QCM-R - what is the difference? [https://www.biolinscientific.com/blog/qcm-d-vs-qcm-r-what-is-the-difference?update_2025=1]
- 36. Development of a QCM-D-Based Aptasensor for the Real- ... [https://www.mdpi.com/2079-6374/15/9/563]
- 37. Application of the Combined QCM-D/LSPR Aptasensor for ... [https://pmc.ncbi.nlm.nih.gov/articles/PMC12564596/]
- 38. Development of the QCM biosensor based on allosteric ... [https://www.sciencedirect.com/science/article/abs/pii/S0026265X25031200]
- 39. Quartz crystal microbalance-based biosensor for rapid and ... [https://www.sciencedirect.com/science/article/pii/S2949771X25000222]
- 40. United States Quartz Crystal Microbalance (QCM) ... [https://www.linkedin.com/pulse/united-states-quartz-crystal-microbalance-wnjwc]
- 41. Comparative Analysis of QCM and Electrochemical ... [https://pmc.ncbi.nlm.nih.gov/articles/PMC11429642/]
- 42. QCM: History and principles [https://www.biologic.net/topics/quartz-crystal-microbalance-history-and-principles/]
- 43. QCM: How Does Quartz Crystal Sensor Work? 2 Applications [https://vaccoat.com/blog/how-does-quartz-crystal-sensor-qcm-work/]
- 44. A fast electrochemical quartz crystal microbalance (EQCM) ... [https://pubs.rsc.org/en/content/articlehtml/2025/cp/d5cp02691a]
- 45. Application of the Combined QCM-D/LSPR Aptasensor for ... [https://www.mdpi.com/2079-6374/15/10/652]
- 46. Advancing Food Safety Surveillance: Rapid and Sensitive ... [https://www.mdpi.com/2304-8158/14/15/2654]
- 47. QCM-D data analysis in practice [https://www.biolinscientific.com/blog/qcm-d-data-analysis-in-practice?update_2025=1]
- 48. How does QCM-D compare to other QCM:s? [https://www.biolinscientific.com/blog/how-does-qcm-d-compare-to-other-qcms]
- 49. QCM-based screening of acrylate polymers for NPPA pre- ... [https://www.sciencedirect.com/science/article/pii/S000326702501027X]
- 50. How to optimize the QCM baseline stability [https://www.biolinscientific.com/blog/how-to-optimize-the-qcm-baseline-stability?update_2025=1]
- 51. Quartz crystal microbalance (QCM) [https://bio-protocol.org/exchange/minidetail?id=1786828&type=30]
- 52. QCM-D | Measurements [https://www.biolinscientific.com/measurements/qcm-d]
- 53. Single-harmonic vs multi-harmonic QCM-D – what is the ... [https://www.biolinscientific.com/blog/single-harmonic-vs-multi-harmonic-qcm-d-what-is-the-difference]
- 54. QSense Pro | QSense | QCM-D [https://www.biolinscientific.com/qsense/instruments/qsense-pro]
- 55. Insights from QCM-D and neutron reflection [https://www.sciencedirect.com/science/article/pii/S0021979725024026]
- 56. QSense Analyzer - QCM-D [https://www.biolinscientific.com/qsense/instruments/qsense-analyzer]
- 57. Studying Soft Interfaces with Shear Waves: Principles and ... [https://www.mdpi.com/1424-8220/21/10/3490]
- 58. Quantitative Comparison of the Hydration Capacity ... [https://pmc.ncbi.nlm.nih.gov/articles/PMC11238585/]
- 59. QCM-D measurement best practice – After measurement [https://www.biolinscientific.com/blog/qcm-d-measursement-best-practice-after-measurement?update_2025=1]
- 60. Measuring emergent mechanical changes in cytoskeletal ... [https://pmc.ncbi.nlm.nih.gov/articles/PMC12368615/]
- 61. Factors that impact the QCM baseline stability and how to ... [https://www.biolinscientific.com/blog/factors-that-impact-the-qcm-baseline-stability-and-how-to-address-them]
- 62. QCM-D tips and tricks – three steps to optimize the data ... [https://www.biolinscientific.com/blog/qcm-d-measurement-tips-and-tricks-how-to-optimize-the-data-quality]
- 63. Protocol for washing and modifying QCM-D sensors [https://www.protocols.io/view/Protocol-for-washing-and-modifying-QCM-D-sensors-efybbpw]
- 64. Using quartz crystal microbalance with dissipation ... [https://www.sciencedirect.com/science/article/pii/S2772416625000725]
- 65. Quartz Crystal Microbalance (QCM) Market Report [https://dataintelo.com/report/global-quartz-crystal-microbalance-qcm-market]
- 66. Microfluidic QCM enables ultrahigh Q-factor: a new paradigm ... [https://pmc.ncbi.nlm.nih.gov/articles/PMC11347674/]
- 67. pyQCM-BraTaDio: A tool for visualization, data mining, and ... [https://joss.theoj.org/papers/10.21105/joss.06831]
- 68. United States Quartz Crystal Microbalance (QCM) Market ... [https://www.linkedin.com/pulse/united-states-quartz-crystal-microbalance-qcm-l1rme]
- 69. The utilization and advancement of quartz crystal ... [https://www.sciencedirect.com/science/article/abs/pii/S0026265X24000791]
- 70. Assessing the performance of commercial serological tests ... [https://www.sciencedirect.com/science/article/pii/S2772707624000547]
- 71. An integrated methodological framework for the validation ... [https://pmc.ncbi.nlm.nih.gov/articles/PMC11721250/]
- 72. Electrochemical biosensor detection on respiratory and ... [https://pmc.ncbi.nlm.nih.gov/articles/PMC9887245/]
- 73. Comparative Analysis of QCM and Electrochemical ... [https://pubmed.ncbi.nlm.nih.gov/39329806/?utm_source=Other&utm_medium=rss&utm_campaign=pubmed-2&utm_content=1zkXoYKOt-8s57j6yXOe9B3ZR7YavXz2zcmVqrJ3fYE3WJWgyD&fc=20200522043624&ff=20240927202326&v=2.18.0.post9+e462414]
- 74. QCM parameters – this is what they mean [https://www.biolinscientific.com/blog/the-qcm-parameters-this-is-what-they-mean]
- 75. Biosensor nanoengineering: Design, operation, and ... [https://www.sciencedirect.com/science/article/pii/S2666351120300401]
- 76. Biosensor Design for the Detection of Circulating Tumor Cells ... [https://pmc.ncbi.nlm.nih.gov/articles/PMC10136100/]
- 77. QCM-D - how does it work? [https://www.biolinscientific.com/blog/qcm-d-how-does-it-work]
- 78. Evaluating Alternative Techniques for Real-Time ... [https://www.nanoscience.com/blogs/evaluating-alternative-techniques-for-real-time-monitoring-of-molecular-interactions-at-surfaces/]
- 79. QCM-D vs SPR - what is the difference? [https://www.biolinscientific.com/blog/should-i-use-spr-or-qcm-d]
- 80. QCM mass and Ellipsometry mass - What is the difference? [https://www.biolinscientific.com/blog/what-is-the-difference-between-qcm-mass-and-ellipsometry-mass]
- 81. Spectroscopic Ellipsometry and Quartz Crystal ... [https://pmc.ncbi.nlm.nih.gov/articles/PMC8915094/]
- 82. Characterization and application of a surface modification ... [https://www.sciencedirect.com/science/article/abs/pii/S0956566311005082]
- 83. 石英晶体分子相互作用测量仪(QCM-D) [http://www.nanoctr.cas.cn/geguanglu/yiqishebei/201708/t20170817_4849655.html]
- 84. 石英晶体微天平传感器及其在生物检测中应用的研究进展 [http://www.ccspublishing.org.cn/article/0441-3776/2018/2/129]
- 85. 耗散型石英晶体微天平 - 百欧林 [https://www.biolinchina.com/measurements/qcm-d]
- 86. 物理邂逅生物:基于LSPR的生物传感器 [https://www.sohu.com/a/570216497_120737363]
- 87. CN102449462B - 利用局部表面胞质团共振lspr的传感器 [https://patents.google.com/patent/CN102449462B/zh]
- 88. “芯查查杯”电子竞赛【往届优秀作品系列-NO.2】 [https://www.xcc.com/news/detail/5261158]
- 89. Technical Note 103: Surface Plasmon Resonance v. Quartz ... Crystal [https://biosensingusa.com/technical-notes/technical-note-103-surface-plasmon-resonance-v-quartz-crystal-microbalance/]
- 90. 170-MHz electrodeless quartz biosensor... crystal microbalance [https://pubmed.ncbi.nlm.nih.gov/19728731/]
- 91. matters. Detection not really limit Sensitivity [https://www.biolinscientific.com/blog/qcm-sensitivity-vs-limit-of-detection-lod]
- 92. based biosensor for rapid and Quartz ... crystal microbalance sensitive [https://pubs.rsc.org/en/content/articlelanding/2014/ay/c4ay00292j]