Rapid On-Site Detection of Johne's Disease: Advances in Conductometric Biosensor Technology
Johne's disease, caused by Mycobacterium avium subspecies paratuberculosis (MAP), inflicts significant economic losses on the global dairy industry, estimated at over $1.5 billion annually in the U.S.
Rapid On-Site Detection of Johne's Disease: Advances in Conductometric Biosensor Technology
Abstract
Johne's disease, caused by Mycobacterium avium subspecies paratuberculosis (MAP), inflicts significant economic losses on the global dairy industry, estimated at over $1.5 billion annually in the U.S. alone. Current diagnostic methods, including ELISA and bacterial culture, are laboratory-bound, time-consuming, and lack the rapidity required for effective point-of-care management. This article explores the development and application of conductometric biosensors as a transformative solution for on-site Johne's disease testing. We detail the foundational principles of this technology, which leverages conductive polymers like polyaniline to transduce specific antigen-antibody binding into a measurable electrical signal within minutes. The discussion covers biosensor fabrication, methodological workflows for detecting MAP antibodies in serum, and key optimization strategies to enhance sensitivity and specificity. A comparative analysis validates biosensor performance against traditional ELISA, demonstrating its potential for rapid, cost-effective, and decentralized diagnosis. This review synthesizes the current state of the art, addressing critical challenges and future directions for integrating this promising technology into veterinary practice and herd health surveillance programs.
Johne's Disease and the Imperative for Rapid On-Site Diagnostics
The Economic and Animal Health Burden of Johne's Disease
Johne's disease (JD), or Paratuberculosis, is a chronic, granulomatous enteritis primarily affecting ruminants, caused by Mycobacterium avium subspecies paratuberculosis (MAP). The disease leads to substantial economic losses in the global dairy and beef industries due to reduced milk yield, premature culling, and decreased carcass value [1] [2] [3]. Furthermore, MAP infection raises public health concerns due to its suspected association with Crohn's disease in humans [1] [2] [4]. Current diagnostic methods, such as enzyme-linked immunosorbent assay (ELISA), bacterial culture, and polymerase chain reaction (PCR), are often laboratory-bound, time-consuming, and unsuitable for rapid, on-site detection [1] [2] [5]. This creates a critical need for point-of-care (POC) diagnostic tools that can deliver rapid, accurate results to facilitate timely management decisions. This Application Note details the economic impact of JD and provides a detailed protocol for using a novel conductometric biosensor, a promising technology for on-site JD diagnosis.
Economic Impact Assessment
The economic burden of Johne's disease stems from direct production losses and the costs associated with control efforts. The following table summarizes key economic impact estimates from various studies.
Table 1: Documented Economic Impacts of Johne's Disease on the Cattle Industry
| Region/Scope | Estimated Annual Economic Loss | Primary Causes of Loss | Citation |
|---|---|---|---|
| U.S. Dairy Industry | $1.5 Billion | Reduced milk production, premature culling, reduced carcass weight, and animal death. [2] | |
| U.S. Dairy Industry | $200 - $250 Million | Reduced productivity associated with JD. [4] | |
| Canadian Dairy Industry | $250 Million | Emaciation and necessary culling of infected cattle. [1] | |
| Swiss Dairy Herds (per cow in a positive herd) | ~36 Swiss Francs (CHF) | Minor reductions in milk yield and higher somatic cell count (SCC). [3] | |
| United Kingdom | €200 per cow / €10 million to national economy | Reduced milk production, late pregnancy failure, and early culling. [6] |
Conventional versus Novel Diagnostic Methods
A comparison of existing diagnostic techniques highlights the advantages of novel biosensor approaches.
Table 2: Comparison of Diagnostic Methods for Johne's Disease
| Method | Principle | Time to Result | Key Advantages | Key Limitations |
|---|---|---|---|---|
| Bacterial Culture | Growth of MAP on specialized media. | 7 - 12 weeks [2] | Gold standard for viability. [5] | Impractically slow, requires specialized lab. [2] |
| Serum ELISA | Detection of anti-MAP antibodies in serum. | 2-7 days [7] | High throughput, automated. | Lower sensitivity in early infection, lab-based. [7] |
| Fecal PCR | Detection of MAP DNA in feces. | 1-3 days | High specificity, faster than culture. [7] | Does not differentiate viable from dead bacteria, lab-based. [5] |
| Conductometric Biosensor | Immunomigration & conductance change from polyaniline-antibody binding. [2] | 2-6 minutes [2] | Rapid, suitable for point-of-care use. | Early stage of development and commercialization. |
| Electrochemical DNA Nanobiosensor | DNA hybridization on a graphene oxide-chitosan modified electrode. [1] | Hours (specific duration not provided) | Ultra-sensitive (detection limit of 1.53 × 10⁻¹³ mol L⁻¹). [1] | Requires multiple modification steps. |
| NIR Aquaphotomics | Analysis of water spectral patterns in milk using near-infrared spectroscopy. [8] | Minutes (specific duration not provided) | Non-invasive, uses milk samples, high reported accuracy. [8] | Emerging technology, requires sophisticated spectral analysis. |
| Bacteriophage-Based Assay | Detection of progeny phages or host DNA after infection of viable MAP. [5] | 1-2 days [5] | Specifically detects viable MAP, faster than culture. [5] | Requires multiple processing steps and PCR confirmation. |
Protocol: On-Site Detection Using a Conductometric Biosensor
This protocol describes the procedure for detecting MAP-specific antibodies in bovine serum using a conductometric biosensor, based on the research of Okafor et al. [4].
Principle
The biosensor operates on an immunomigration principle. MAP antigens immobilized on a capture membrane bind MAP-specific IgG from the sample. This binding is detected using a polyaniline (Pani)-conjugated anti-bovine secondary antibody, which completes an electrical circuit, resulting in a measurable drop in electrical resistance [2] [4].
Experimental Workflow
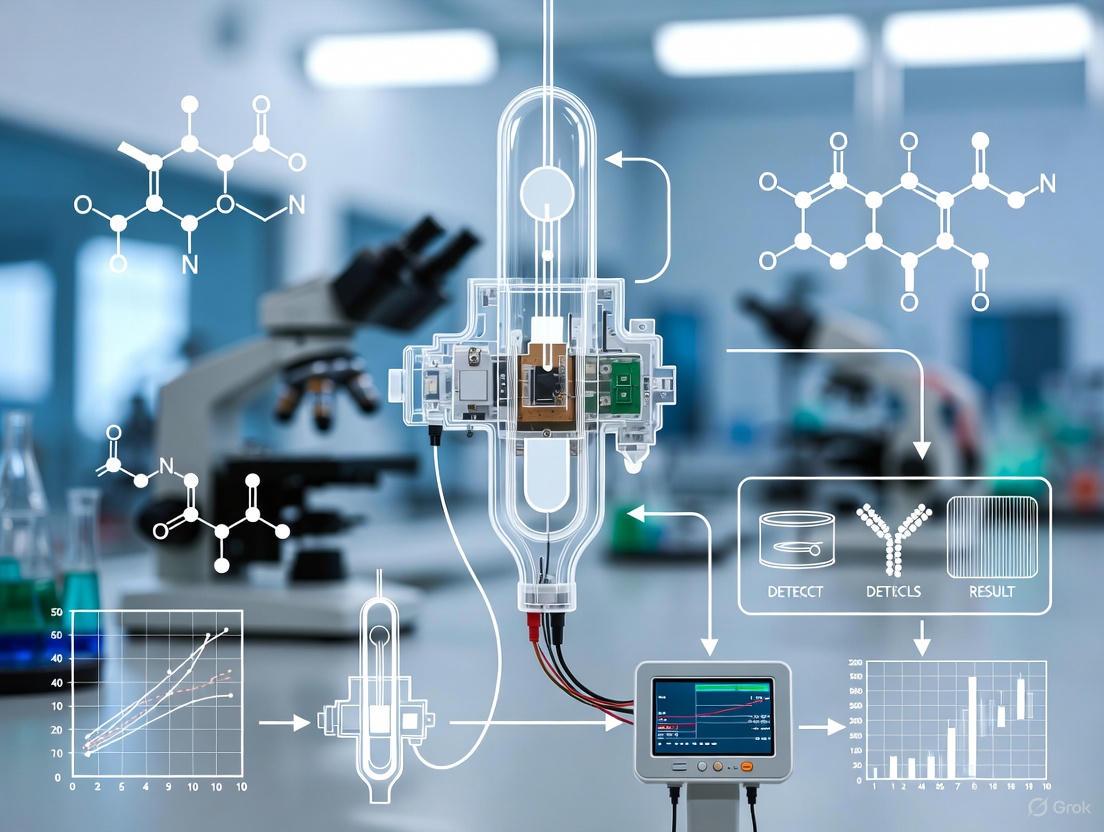
The following diagram illustrates the key steps in the biosensor assay, from sample application to result interpretation.
Materials and Equipment
Research Reagent Solutions
Table 3: Essential Reagents and Materials for Conductometric Biosensor Assay
| Item | Function / Description | Specification / Example |
|---|---|---|
| Polyaniline (Pani) | Conductive polymer; transduces biological binding into an electrical signal. [2] | AquaPass polyaniline, diluted to 0.001% with PBS. [4] |
| Anti-Bovine IgG Antibody | Secondary antibody; binds to bovine IgG in the sample. | Purified mouse monoclonal anti-bovine IgG (e.g., clone BG-18). [4] |
| Pani-AB/IgG* Conjugate | Detection conjugate; links target antibody to the signal transducer. | Formed by incubating anti-bovine IgG with 0.001% Pani solution. [4] |
| MAP Antigen (MAPPD) | Capture antigen; binds specifically to MAP-specific antibodies in the sample. | Immobilized Mycobacterium avium purified proteins on the capture membrane. [2] |
| Immunosensor Strip | Platform for the assay; contains all necessary membranes. | Assembled from sample application, conjugate, capture, and absorption membranes (e.g., Hi-Flow Plus Kit). [4] |
| Phosphate Buffered Saline (PBS) | Buffer; used for sample dilution and reagent preparation. | 0.1 M, pH 7.4. [4] |
| Ohmmeter / Multimeter | Detector instrument; measures electrical resistance across the electrodes. | e.g., BK Precision 2880A multimeter. [4] |
Biosensor Assembly and Preparation
- Prepare Capture Membrane: Screen-print silver electrodes onto the capture membrane to create a uniform 1 mm-wide channel [4]. Immobilize the MAP antigen (MAPPD) onto this channel.
- Prepare Conjugate Membrane: Immerse the conjugate membrane in the prepared Pani-anti-bovine IgG conjugate solution until saturated. Air-dry for 45 minutes at 20°C [4].
- Assemble Immunosensor: Layer the sample application, conjugate, capture, and absorption membranes into a single immunosensor strip. Cut the assembled strip into 5 mm-wide disposable strips [4].
- Connect Electronics: Use a conductive silver pen to connect the silver electrodes on the capture membrane to a copper wafer, which is then connected to an ohmmeter [4].
Procedure
- Sample Preparation: Collect bovine serum using standard venipuncture techniques. For the assay, use 100 µL of serum per test [4]. No complex purification is required.
- Sample Application: Pipette 100 µL of the serum sample onto the application membrane of the biosensor strip.
- Immunomigration: The sample migrates via capillary action. As it passes through the conjugate membrane, serum IgG (including MAP-specific IgG, if present) binds to the Pani-anti-bovine IgG conjugate, forming a Pani-AB/IgG*-IgG complex [2] [4].
- Antigen-Antibody Capture: The fluid front pulls the complex onto the capture membrane. If the IgG is specific to MAP, it is captured by the immobilized MAP antigens. Non-specific IgG continues to the absorption membrane [2] [4].
- Signal Measurement and Interpretation:
- At 2 minutes after sample application, record the electrical resistance (in kiloohms, kΩ) displayed on the ohmmeter [4].
- A significant drop in resistance compared to a negative control indicates the presence of MAP-specific antibodies. The conductive polyaniline in the captured complexes bridges the silver electrodes, facilitating current flow and lowering resistance [2].
The Scientist's Toolkit: Key Reagent Solutions
The successful implementation of this and other advanced biosensing protocols relies on specific, high-quality reagents. The following table details critical solutions for researchers in this field.
Table 4: Key Research Reagent Solutions for Advanced JD Biosensor Development
| Reagent / Material | Function in Experiment | Key Characteristic |
|---|---|---|
| Graphene Oxide (GO) & Chitosan Nanocomposite | Platform for electrode modification in electrochemical DNA biosensors; provides a high-surface-area, biocompatible matrix for probe DNA immobilization. [1] | Enhances sensitivity and stability of the biosensor. [1] |
| EDC/NHS Coupling System | Activates carboxyl groups on the sensor surface to covalently immobilize probe DNA or proteins. [1] | Critical for creating a stable and functionalized biosensor surface. |
| Mycobacteriophage D29 | The lytic phage at the core of viability-based assays; infects and lyses viable MAP cells, releasing detectable markers (DNA or progeny phages). [5] | Enables distinction between viable and dead MAP bacteria. [5] |
| Peptide-Mediated Magnetic Separation (PMS) Beads | Used in phage and other assays to selectively capture and concentrate MAP cells from complex samples like milk or feces, improving assay sensitivity and specificity. [5] | Reduces sample matrix interference and concentrates the target. |
| Polyaniline (Pani) | Conductive polymer used in conductometric biosensors; acts as the transducer by creating a measurable change in conductance upon antigen-antibody binding. [2] | Provides the electrical signal for label-free detection. |
| Bovine IgG Isotype Control | Essential for assay validation, serving as positive and negative controls to calibrate the biosensor and ensure antibody specificity. | Verifies assay performance and specificity. |
The economic data unequivocally demonstrates that Johne's disease imposes a severe and ongoing financial burden on the global cattle industry. The development and deployment of rapid, on-site diagnostic tools are therefore not merely academic exercises but are critical for effective disease management and loss prevention.
The conductometric biosensor protocol outlined here represents a significant stride toward point-of-care diagnosis. Its key advantage is speed, providing results in minutes, a dramatic improvement over culture and comparable to some ELISAs [2] [4]. Furthermore, the system's design is inherently adaptable to a portable format, making it suitable for use in field settings such as farms and sale barns. However, this technology is still in the developmental stage. Future work must focus on optimizing the consistency of the immunomigration process, improving the shelf-life of the conjugated membranes, and validating the assay with larger, more diverse sample sets to establish robust diagnostic sensitivity and specificity.
In conclusion, while conventional tests remain the mainstay of JD diagnosis, their limitations hinder proactive control. The integration of novel biosensing technologies like the conductometric biosensor into herd health programs holds the promise of enabling more frequent testing, earlier detection, and more informed management decisions, ultimately reducing the substantial economic and animal health burden of Johne's disease.
The control of Johne’s disease, a chronic granulomatous enteritis in ruminants caused by Mycobacterium avium subspecies paratuberculosis (MAP), is severely hampered by the limitations of conventional diagnostic methods [9]. Diagnosis is complicated by the disease's prolonged incubation period, which can span from 2 to 5 years, during which infected animals progress through four distinct stages of disease: silent infection, subclinical shedding, clinical disease, and advanced clinical disease [10] [11]. The performance of all diagnostic tests is intrinsically linked to the disease stage, with generally poor sensitivity in the early stages when intervention would be most impactful [9] [12]. This application note details the technical limitations of the three primary conventional diagnostic approaches—enzyme-linked immunosorbent assay (ELISA), bacteriological culture, and polymerase chain reaction (PCR)—and frames these shortcomings within the rationale for developing rapid, on-site conductometric biosensors.
Limitations of Enzyme-Linked Immunosorbent Assay (ELISA)
The ELISA detects MAP-specific antibodies in serum or milk, serving as a indirect marker of infection [9] [13]. While widely used for herd screening due to its rapid turnaround and relatively low cost, this method suffers from fundamental constraints related to the host's immune response.
Key Limitations and Performance Data
Table 1: Performance Characteristics of Serum ELISA for Johne's Disease Detection
| Limitation | Underlying Cause | Impact on Performance | Quantitative Data |
|---|---|---|---|
| Delayed Seroconversion | Antibody production occurs months to years after initial infection and fecal shedding [14]. | Very poor sensitivity in subclinically infected animals [15]. | Identifies only 30%-50% of animals that test positive via MAP-detection assays (PCR/culture) [14]. |
| Stage-Dependent Sensitivity | Humoral immunity is correlated with advanced disease and heavy bacterial shedding [16]. | Fails to identify early shedders, missing critical opportunities for control. | Animal-level sensitivity: 36% (95% CrI: 22–52%) [10]. Herd-level sensitivity (20 samples): 79% [10]. |
| Sample Medium Variability | Antibody levels and detectability differ between serum and milk [13]. | Reduces test consistency and reliability depending on the sample type used. | Kappa agreement between serum ELISAs (0.84–0.94) is higher than between milk ELISAs (0.59–0.82) [13]. |
| Imperfect Specificity | Cross-reactivity with other pathogens or non-specific immune responses [10]. | Can lead to false positives, though specificity is generally high. | Specificity: 98% (95% CrI: 96–99%) [10]. |
Detailed ELISA Protocol
Protocol: Detection of MAP-specific antibodies by indirect ELISA from bovine serum
Purpose: To identify MAP-infected cattle by detecting serum antibodies against MAP antigens, primarily for herd-level screening.
Materials and Reagents:
- USDA-licensed Johne's disease antibody ELISA kit (e.g., IDEXX Paratuberculosis Screening Ab ELISA).
- Bovine serum samples.
- Micropipettes and disposable tips.
- Microplate washer and reader (optical density at 450 nm).
- Washing buffer (commercial PBS-Tween or similar).
- Positive and negative control sera provided in the kit.
Procedure:
- Sample Preparation: Allow all samples and reagents to reach room temperature (20–25°C) before use. Do not heat-inactivate sera.
- Plate Setup: Dispense 100 µL of negative control, positive control, and undiluted test serum samples into assigned wells of the antigen-coated microplate.
- Incubation: Cover the plate and incubate for 30 minutes at room temperature.
- Washing: Aspirate the liquid from all wells and wash the plate 5 times with 300 µL of washing buffer per well. Blot the plate dry on absorbent paper.
- Conjugate Addition: Add 100 µL of anti-bovine IgG horseradish peroxidase (HRP) conjugate to each well.
- Incubation: Cover the plate and incubate for 30 minutes at room temperature.
- Washing: Repeat the washing procedure as in step 4.
- Substrate Addition: Add 100 µL of tetramethylbenzidine (TBM) substrate solution to each well.
- Incubation: Incubate the plate for 15 minutes at room temperature, protected from light.
- Stop Reaction: Add 100 µL of stop solution (e.g., 1M sulfuric acid) to each well.
- Measurement: Read the optical density (OD) at 450 nm within 15 minutes of adding the stop solution.
Data Analysis: Calculate the Sample-to-Positive (S/P) ratio for each test sample: [ S/P \% = \frac{(OD{\text{sample}} - OD{\text{negative control}})}{(OD{\text{positive control}} - OD{\text{negative control}})} \times 100 ]
Interpret results based on kit specifications; typically, samples with S/P% ≥ 55% are positive, 45–55% are suspect, and <45% are negative [15].
Limitations of Bacteriological Culture
Fecal culture is historically considered the "gold standard" for MAP detection, as it confirms the presence of viable organisms [9]. However, this status is challenged by numerous practical and technical drawbacks.
Key Limitations and Procedural Challenges
Table 2: Limitations of Bacteriological Culture for MAP Detection
| Limitation | Underlying Cause | Impact on Diagnostic Utility |
|---|---|---|
| Prolonged Incubation Time | Extremely slow growth of MAP, an obligate pathogen requiring mycobactin J [9]. | Results take 5–16 weeks, preventing timely management decisions and allowing ongoing transmission [1]. |
| Low Sensitivity in Early Infection | Intermittent or low-level shedding in subclinical stages; organism loss during decontamination [9] [11]. | Misses a high proportion of infected animals; estimated herd-level sensitivity is ~40% [11]. |
| Technical Complexity and Cost | Requires specialized media, decontamination procedures, and concentration steps to avoid overgrowth of contaminants [9]. | High labor and material costs, limiting its use for large-scale screening. |
| Risk of False Positives | Detection of "pass-through" MAP ingested from the environment by uninfected animals [9] [14]. | Can lead to unnecessary culling of valuable animals. |
Detailed Culture Protocol
Protocol: Conventional Fecal Culture on Herrold's Egg Yolk Medium (HEYM)
Purpose: To isolate and identify viable MAP from bovine feces.
Materials and Reagents:
- Herrold's Egg Yolk Medium (HEYM) slants supplemented with mycobactin J and antibiotics (e.g., amphotericin B, vancomycin, nalidixic acid).
- Decontamination solution: 0.75%–1.0% Hexadecylpyridinium chloride (HPC).
- Brain-Heart Infusion (BHI) broth.
- Centrifuge and appropriate tubes.
- Biological safety cabinet.
Procedure:
- Sample Decontamination (Double-Incubation/Cornell Method):
- a. Homogenize 2 g of feces in 35 mL of BHI broth.
- b. Incubate for 72 hours at 37°C to germinate contaminant spores.
- c. Add 30 mL of 1% HPC, mix thoroughly, and let stand for 24 hours at room temperature.
- d. Centrifuge the mixture at 900 × g for 30 minutes. Discard the supernatant.
- Inoculation:
- a. Resuspend the sediment in 1–2 mL of BHI broth.
- b. Inoculate 2–3 drops of the sediment suspension onto each of two HEYM slants.
- Incubation and Reading:
- a. Incubate the slants in a horizontal position for the first 1–2 weeks to allow the inoculum to spread.
- b. Thereafter, incubate slants upright with caps loosened for 12–16 weeks at 37°C.
- c. Examine weekly for visible, rough colonies that are cream-colored. Confirm identity with Ziehl-Neelsen staining for acid-fast bacilli.
Limitations of Polymerase Chain Reaction (PCR)
PCR assays detect MAP-specific DNA sequences (e.g., IS900) directly in feces or tissues, offering a faster alternative to culture [17] [16]. While performance is superior to ELISA and culture in many aspects, significant limitations remain.
Key Limitations and Performance Data
Table 3: Performance and Limitations of Fecal PCR for MAP Detection
| Aspect | Performance / Limitation | Details and Quantitative Data |
|---|---|---|
| Sensitivity vs. Shedding Level | Varies with bacterial load in feces [17] [12]. | Heavy/Moderate shedders: ~95% sensitivity. Light shedders: ~74% sensitivity [17]. |
| Individual Animal PCR | High accuracy but higher cost for herd screening [10]. | Sensitivity: 96% (95% CrI: 80–100%); Specificity: 98% (95% CrI: 96–100%) [10]. |
| Pooled Fecal PCR | Reduced sensitivity but more cost-effective for herd screening [10] [16]. | Sensitivity: 54% (95% CrI: 36–72%); Specificity: >99.9% (95% CrI: 99.8–100%) [10]. |
| Inhibition and False Negatives | Fecal components can inhibit polymerase enzyme [16]. | Requires inclusion of an internal amplification control (IC) to detect inhibition [16]. |
| DNA Pass-Through | Detects MAP DNA from ingested bacteria, not necessarily established infection [14]. | Can lead to false positives in healthy animals from contaminated environments [9] [14]. |
| Quantification | Can provide semi-quantitative estimate of shedding level [17]. | Reported as "Light," "Moderate," or "Heavy" based on cycle threshold (Ct) values [17]. |
Detailed PCR Protocol
Protocol: Direct Fecal DNA Extraction and Real-Time PCR for MAP Detection
Purpose: To rapidly detect MAP DNA in bovine fecal samples using real-time PCR.
Materials and Reagents:
- Fecal samples (≥ 2 g).
- Commercial DNA extraction kit validated for feces (e.g., Johne-PureSpin kit, FASMAC).
- Real-time PCR master mix containing ResoLight or SYBR Green dye, primers targeting IS900, and an Internal Amplification Control (IAC).
- Real-time PCR thermocycler.
Procedure:
- DNA Extraction:
- a. Prepare a 1:10 fecal suspension in sterile PBS or kit-specific lysis buffer and vortex thoroughly.
- b. Transfer 1 mL of suspension to a tube containing zirconia beads for mechanical lysis.
- c. Homogenize using a bead beater at 4,600 rpm for 3 minutes.
- d. Centrifuge and transfer supernatant to a new tube. Follow kit instructions for DNA binding, washing, and elution.
- PCR Setup:
- a. Prepare a reaction mix for each sample and control. A typical 20 µL reaction contains: 10 µL of 2x Master Mix, 1 µL of IS900 primer mix, 1 µL of IAC, 3 µL of nuclease-free water, and 5 µL of template DNA.
- b. Include no-template controls (NTC) and positive controls (MAP DNA) in each run.
- Real-Time PCR Amplification:
- a. Run the PCR with cycling conditions similar to: Initial denaturation: 95°C for 2 min; 45 cycles of: 95°C for 15 sec, 60°C for 60 sec (with fluorescence acquisition).
- b. Perform a melting curve analysis after amplification: 95°C for 15 sec, 60°C for 15 sec, then gradual increase to 95°C with continuous fluorescence measurement.
- Result Interpretation:
- a. Analyze amplification curves and melting peaks. The IS900 target and IAC are differentiated by their distinct melting temperatures (Tm).
- b. A sample is positive if it produces an amplification curve with the specific Tm for IS900. The IAC must amplify in all samples to rule out PCR inhibition.
The Scientist's Toolkit: Key Research Reagent Solutions
Table 4: Essential Reagents and Materials for Johne's Disease Diagnostic Research
| Reagent/Material | Function | Example & Notes |
|---|---|---|
| Mycobactin J | Iron-chelating growth factor essential for in vitro MAP cultivation [9]. | Supplement for Herrold's Egg Yolk Medium (HEYM). |
| Decontaminants (e.g., HPC) | Selective inhibition of fast-growing contaminating microbes in fecal samples [9]. | Hexadecylpyridinium Chloride (HPC); less toxic to MAP than NaOH. |
| IS900 Primer/Probe Set | Targets the multi-copy insertion element IS900 for specific MAP DNA detection by PCR [17] [16]. | Critical for specificity in PCR and biosensor development. |
| Internal Amplification Control (IAC) | Non-target DNA sequence co-amplified with the sample to detect PCR inhibition [16]. | Essential for validating negative PCR results, especially in pooled fecal tests. |
| MAP-Specific Monoclonal Antibodies | Capture and detect MAP cells or antigens in immunoassays and isolation techniques [15]. | Used in ELISA, immunomagnetic separation. |
| Chitosan & Graphene Oxide | Biopolymer and nanomaterial for electrode functionalization in electrochemical biosensors [1]. | Enhances sensor surface area and biocompatibility for probe immobilization. |
| EDC/NHS Coupling System | Cross-linking agents for covalent immobilization of biomolecules (e.g., DNA probes) onto sensor surfaces [1]. | 1-ethyl-3-(3-dimethylaminopropyl) carbodiimide hydrochloride (EDC) and N-Hydroxysuccinimide (NHS). |
Experimental Workflow and Rationale for Biosensor Development
The following diagram illustrates the convoluted workflow and decision tree required for accurate diagnosis using conventional methods, highlighting the need for an integrated, rapid solution.
Conventional JD Diagnosis Workflow
The inherent complexities and shortcomings of this multi-step process underscore the necessity for a paradigm shift in diagnostic technology. Conductometric biosensors represent a promising alternative by potentially integrating the key advantages of existing methods—direct pathogen detection (like PCR), operational simplicity (like ELISA), and viability assessment (like culture)—into a single, rapid device.
The operational principle of a conductometric biosensor for MAP detection, leveraging the change in electrical conductivity upon specific DNA hybridization, is illustrated below.
Conductometric Biosensor Principle
The limitations of conventional diagnostic methods for Johne's disease are significant and multifaceted. ELISA's poor early sensitivity, culture's protracted timeline, and PCR's cost and technical requirements create a diagnostic gap that impedes effective disease control and eradication [9] [10] [14]. These shortcomings are the primary drivers for research into novel diagnostic platforms. The development of portable, rapid, and sensitive conductometric biosensors, which can detect viable MAP directly from clinical samples within hours, holds the potential to revolutionize Johne's disease management by enabling on-site testing and timely intervention [1]. Future research must focus on validating these biosensors against complex clinical samples and integrating them into streamlined, point-of-care workflows to realize their full potential in disease control programs.
Fundamental Principles of Conductometric Biosensing
Conductometric biosensors represent a prominent class of electrochemical biosensors that measure changes in electrical conductivity within a solution resulting from specific biological recognition events. These devices function by detecting the variation in electrical conductance between two electrodes, which occurs when ionic species are generated or consumed during biochemical reactions. The fundamental principle relies on the relationship between electrical conductivity and ionic concentration, where even minor changes in ion composition can produce measurable signals. This detection mechanism offers significant advantages for biosensing applications, including high sensitivity, compatibility with miniaturized systems, and the ability to operate in complex biological matrices.
The core architecture of a conductometric biosensor integrates a biological recognition element immobilized on a transducer surface. When the target analyte binds to this recognition layer, it triggers biochemical reactions that alter the ionic composition of the surrounding medium. For instance, enzymatic reactions may produce or consume ions, thereby modifying the local electrical conductivity. This change is subsequently detected by the transducer and converted into a quantifiable electrical signal. The simplicity of this measurement principle, combined with the absence of reference electrodes, facilitates the development of compact, cost-effective sensing platforms suitable for point-of-care diagnostics and field-deployable applications [2] [18].
Conductometric Biosensing for Johne's Disease
Johne's disease, caused by Mycobacterium avium subspecies paratuberculosis (MAP), inflicts substantial economic losses on the global cattle industry, estimated to exceed $1.5 billion annually in the United States alone due to reduced milk production, premature culling, and decreased slaughter value. Effective disease management requires diagnostic tools capable of rapid, on-site detection to enable timely intervention strategies. Conductometric biosensing has emerged as a promising solution to address the limitations of conventional diagnostic methods, which often require specialized laboratory equipment, extended processing times, and technical expertise [2] [19].
In the context of Johne's disease, conductometric biosensors have been engineered to detect MAP-specific immunoglobulin G (IgG) antibodies present in serum samples. The operational principle involves immobilizing MAP-specific purified proteins within a capture membrane region. When a serum sample containing MAP IgG is applied, the antibodies first bind to a polyaniline/anti-bovine IgG conjugate in the conjugate membrane. This complex then migrates to the capture membrane, where the MAP IgG binds to the immobilized MAP antigens, forming a sandwich complex. The incorporated polyaniline, known for its excellent conductivity and environmental stability, subsequently bridges an electrical circuit between flanking silver electrodes, resulting in a measurable change in electrical resistance [2].
This approach demonstrated significant practical utility in proof-of-concept studies, where testing with known JD-positive and JD-negative serum samples revealed statistically significant differences in mean resistance values between the groups. Remarkably, the biosensor achieved detection within just 2 minutes, highlighting its potential for rapid on-site diagnosis. The integration of conductive polymers like polyaniline as signal transducers enhances detection sensitivity while maintaining the operational simplicity required for field applications [2].
Table 1: Performance Metrics of Conductometric Biosensor for Johne's Disease Detection
| Parameter | Value/Outcome | Measurement Conditions |
|---|---|---|
| Detection Time | 2 minutes | Room temperature, serum samples |
| Target Analyte | MAP-specific IgG | Serum from infected cattle |
| Signal Output | Electrical resistance | Measured in kilo-ohms |
| Significant Difference | P < 0.05 | Between JD-positive and JD-negative groups |
| Intra-assay Variation | 14.48% | Coefficient of variation at 2 minutes |
Experimental Protocol: Fabrication and Operation
Biosensor Fabrication Protocol
The fabrication of a conductometric biosensor for Johne's disease detection requires meticulous attention to material selection and assembly processes. The following protocol outlines the key manufacturing steps:
Electrode Patterning: Deposit silver electrodes onto an inert substrate (e.g., polyester or glass) using screen-printing, thermal evaporation, or sputtering techniques. Pattern the electrodes to create a two-electrode system with a defined inter-electrode gap (typically 0.5-2 mm) to optimize signal detection.
Membrane Assembly: Construct a multi-lateral flow system comprising conjugate, capture, and absorption membranes. The conjugate membrane should be pre-loaded with a polyaniline/anti-bovine IgG conjugate, while the capture membrane requires immobilization of MAP-specific purified proteins using appropriate cross-linking chemistry.
Biorecognition Element Immobilization: Prepare the MAP antigen solution (10-100 µg/mL in phosphate buffer saline, pH 7.4) and apply to the capture membrane using precision dispensing equipment. Incubate at 4°C for 12-16 hours to ensure complete immobilization, followed by blocking with 1% bovine serum albumin to prevent non-specific binding.
Sensor Integration: Assemble the layered membrane system in sequential order, ensuring proper overlap between consecutive layers to facilitate capillary flow. Secure the assembled biosensor in a cartridge housing that provides defined sample and buffer application ports [2].
Biosensor Operation Protocol
The standardized procedure for operating the conductometric biosensor ensures reproducible and reliable detection performance:
Sample Preparation: Collect bovine serum samples using standard venipuncture techniques. Centrifuge at 3000 × g for 10 minutes to separate serum from cellular components. For optimal results, use fresh or properly stored (-20°C) serum samples without repeated freeze-thaw cycles.
Sample Application: Apply 50-100 µL of prepared serum sample to the designated sample application zone. Allow the sample to migrate through the conjugate membrane where complex formation occurs between MAP IgG (if present) and the polyaniline/anti-bovine IgG conjugate.
Buffer Addition: After complete sample migration, add 100 µL of running buffer (e.g., PBS with 0.1% Tween-20) to facilitate the lateral flow of the formed complexes toward the capture membrane.
Incubation and Complex Formation: Incubate the biosensor for precisely 2 minutes to allow sufficient time for the formation of sandwich immunocomplexes at the capture membrane. During this period, the polyaniline-labeled complexes bridge the electrode circuit.
Signal Measurement: Connect the electrode contacts to a portable multimeter or custom-designed resistance measurement system. Record the electrical resistance across the electrodes at the 2-minute time point. Lower resistance values indicate the presence of MAP IgG, as the conductive polyaniline facilitates current flow [2].
Table 2: Key Reagent Solutions for Conductometric JD Biosensor
| Research Reagent | Function in Biosensing System | Specifications/Preparation |
|---|---|---|
| MAP Purified Proteins | Capture antigen for specific IgG detection | 10-100 µg/mL in PBS, pH 7.4 |
| Polyaniline/Anti-Bovine IgG Conjugate | Signal generator and detection probe | Conjugated via glutaraldehyde chemistry |
| Anti-Bovine IgG Antibody | Secondary recognition element | Monoclonal, high specificity |
| Bovine Serum Albumin | Blocking agent for non-specific binding | 1% solution in PBS |
| Phosphate Buffer Saline | Washing and dilution buffer | 0.01M, pH 7.4 |
| Silver Electrodes | Conductance measurement | Screen-printed, 0.5-2 mm gap |
Signaling Pathways and Experimental Workflow
The detection mechanism of the conductometric biosensor for Johne's disease involves a coordinated sequence of molecular recognition events and signal transduction processes. The following diagram illustrates the complete experimental workflow from sample application to signal detection:
Biosensor Workflow for Johne's Disease Detection
The molecular signaling pathway initiates when MAP-specific IgG antibodies present in the serum sample bind to the anti-bovine IgG antibodies conjugated to polyaniline in the conjugate membrane. This binding event forms a mobile complex that migrates laterally toward the capture membrane. At the capture zone, the MAP IgG component of the complex specifically interacts with immobilized MAP antigens, resulting in the formation of a stable sandwich immunocomplex. The strategic positioning of this complex between the two electrodes allows the conductive polyaniline to bridge the electrical circuit, enabling electron transfer and consequently reducing the measured electrical resistance. This resistance change serves as the quantitative signal correlating with MAP IgG concentration in the sample [2].
The signaling efficiency depends critically on several factors, including the density of immobilized antigens in the capture zone, the conductivity of the polyaniline label, and the stability of the electrode interface. Optimization of these parameters enhances detection sensitivity and specificity, enabling discrimination between JD-positive and JD-negative samples. The significant difference in mean resistance values observed between these sample groups (p < 0.05) validates the efficacy of this signaling pathway for diagnostic applications [2].
Performance Data and Analysis
Rigorous evaluation of the conductometric biosensor for Johne's disease detection has generated comprehensive performance data. The following table summarizes key experimental findings from testing with characterized serum samples:
Table 3: Experimental Resistance Values for JD-Positive and JD-Negative Samples
| Sample ID | ELISA OD Values | Mean Resistance at 2 min (kΩ ± SD) | JD Status |
|---|---|---|---|
| A | 1.683 | 43.47 ± 4.76 | Positive |
| B | 1.380 | 70.33 ± 3.95 | Positive |
| C | 0.978 | 95.43 ± 12.58 | Positive |
| D | 0.014 | 437.00 ± 33.29 | Negative |
| E | -0.020 | 448.37 ± 99.41 | Negative |
| F | -0.048 | 672.33 ± 101.93 | Negative |
Statistical analysis of these results revealed a significant difference in mean resistance values between JD-positive and JD-negative samples at the 2-minute measurement point (p < 0.05). The inverse relationship between ELISA optical density values and biosensor resistance indicates that higher antibody concentrations correspond to lower electrical resistance, consistent with the increased presence of conductive polyaniline bridges between electrodes. The intra-assay coefficient of variation at this critical time point was calculated at 14.48%, demonstrating acceptable reproducibility for a prototype biosensor system [2].
Notably, the differentiation capability was most pronounced at the 2-minute measurement, with statistical significance diminishing at later time points (4 and 6 minutes). This temporal pattern underscores the importance of optimized readout timing and suggests potential limitations in the absorption membrane's capacity to effectively remove unbound complexes from the capture zone over extended durations. These findings highlight critical parameters for further biosensor refinement, including membrane composition and flow dynamics optimization [2].
Future Perspectives in Conductometric Biosensing
The integration of conductometric biosensors with emerging technologies presents promising avenues for enhancing Johne's disease diagnostics. Innovations in materials science, particularly the development of novel conductive polymers with superior electron transfer capabilities, could significantly improve detection sensitivity. Furthermore, the incorporation of microfluidic architectures may enable precise fluid control and reduce analysis time while minimizing sample volume requirements [20].
The convergence of conductometric biosensing with artificial intelligence and machine learning algorithms represents another frontier for advancement. These computational approaches could facilitate signal pattern recognition, enabling more accurate discrimination between disease stages and reducing false-positive results. Additionally, the development of multiplexed conductometric platforms capable of simultaneous detection of multiple pathogens would greatly enhance diagnostic efficiency in veterinary settings [20] [21].
Recent progress in aptamer technology offers complementary recognition elements that could be integrated into conductometric biosensors for Johne's disease. Aptamers, with their high stability and modifiability, may provide alternative binding motifs for MAP-specific biomarkers. Computational approaches for aptamer selection and optimization, including machine learning algorithms and structure-based modeling, are accelerating the development of these recognition elements with refined binding characteristics for enhanced biosensor performance [20].
As these technological innovations mature, conductometric biosensors are poised to transition from laboratory prototypes to field-deployable tools that empower farmers and veterinarians with rapid, reliable diagnostic capabilities. This evolution will significantly contribute to global Johne's disease control efforts, ultimately reducing economic losses and improving animal health management worldwide.
Conductive polymers represent a class of organic materials that combine the electrical properties of metals with the mechanical flexibility and processing advantages of conventional polymers. Among these, polyaniline (PANI) has emerged as one of the most extensively studied conductive polymers due to its excellent environmental stability, good conductivity, and strong bio-molecular interactions [2] [22]. The fundamental structure of PANI consists of a conjugated carbon backbone with alternating single (σ) and double (π) bonds, where the highly delocalized, polarized, and electron-dense π-bonds are responsible for its remarkable electrical behavior [22]. A critical factor in enhancing PANI's conductivity is doping, which introduces additional charge carriers (electrons or holes) into the polymer matrix, dramatically increasing electrical conductivity and modifying its electronic structure [22].
In conductometric biosensors for Johne's disease detection, PANI serves as a transducer, relaying specific biological recognition events (antigen-antibody binding) as measurable electrical signals [2] [4]. When integrated with immunomigration technology, PANI-based biosensors can detect Mycobacterium avium subspecies paratuberculosis (MAP) antibodies in approximately 2 minutes, demonstrating significant potential for on-site diagnosis compared to traditional laboratory-based tests [2] [23].
Performance Data and Comparative Analysis
Quantitative Performance of PANI-Based Biosensors
Table 1: Performance metrics of a PANI-based conductometric biosensor for Johne's disease detection
| Parameter | Value | Experimental Conditions |
|---|---|---|
| Detection Time | 2 minutes | Serum sample application to resistance measurement [2] |
| Linear Range | Not specified | JD positive and negative serum samples [2] |
| Resistance Difference | Statistically significant (p < 0.05) | Between JD positive and negative groups at 2 minutes [2] |
| Intra-assay CV | 14.48% | At 2-minute reading time [2] |
| Comparison with ELISA | Kappa = 0.41 (moderate agreement) | Compared with commercial MAP antibody ELISA [4] |
Table 2: Advanced biosensing platforms for Johne's disease detection
| Biosensor Type | Detection Principle | Linear Range | Limit of Detection | Reference |
|---|---|---|---|---|
| PANI-Conductometric | Antibody detection via immunomigration | Not specified | Not specified | [2] |
| Graphene Oxide-Chitosan Electrochemical | DNA hybridization | 1.0 × 10⁻¹⁵–1.0 × 10⁻¹² mol L−1 | 1.53 × 10⁻¹³ mol L−1 | [1] |
| NIR Aquaphotomics | Water spectral pattern analysis | Not applicable | 100% sensitivity in validation | [8] |
Experimental Protocols
Protocol 1: Fabrication of PANI-Based Conductometric Biosensor
Principle: This protocol describes the assembly of an immunomigration-style conductometric biosensor utilizing polyaniline as the transducer element for detecting MAP-specific antibodies in bovine serum [2] [4].
Materials:
- Hi-Flow Plus Assembly Kit (Millipore, Bedford MA, USA) or equivalent
- AquaPass polyaniline (Mitsubishi Rayon Co, Tokyo, Japan) or equivalent
- Purified mouse monoclonal anti-bovine IgG (clone BG-18) (Sigma-Aldrich)
- Mycobacterium avium purified proteins (MAPPD)
- Silver ink for screen-printing
- 0.1 M phosphate buffer saline (PBS), pH 7.4
- 0.1 M Tris buffer containing 0.1% casein, pH 9.0
- Ohmmeter
Procedure:
Capture Membrane Preparation
- Screen-print silver electrodes onto the capture membrane to create 1 mm-wide channels.
- Immobilize MAP purified proteins (MAPPD) on the capture membrane between the silver electrodes.
PANI-Antibody Conjugate Synthesis
- Dilute Pani to 0.001% with 0.1 M PBS.
- Add purified anti-bovine IgG to the Pani solution to achieve a final concentration of 0.0115 mg/mL.
- Incubate the mixture at 27°C for 1 hour to form Pani-AB/IgG* conjugate.
- Add blocking solution (0.1 M Tris buffer with 0.1% casein) and incubate for an additional 30 minutes at 27°C.
Conjugate Membrane Preparation
- Immerse the conjugate membrane in the Pani-AB/IgG* conjugate and blocking solution until fully saturated.
- Air-dry the membrane at 20°C under a clean biosafety cabinet for 45 minutes.
Biosensor Assembly
- Assemble the four membrane components in sequence: sample application membrane, conjugate membrane, capture membrane, and absorption membrane.
- Cut the assembled immunosensor into 5 mm-wide disposable strips.
- Use a silver-microtip conductive pen to create a connection between the silver electrodes and a copper wafer.
Signal Measurement
- Apply 100 μL of sample to the application membrane.
- Allow capillary action to pull the sample through the immunomigration strip.
- Measure and record resistance values (in kiloohms) at 2 minutes post-application using an ohmmeter connected to the copper wafer.
Troubleshooting Tips:
- Ensure consistent silver electrode printing to minimize variability in resistance measurements.
- Optimize anti-bovine antibody concentration if non-specific binding is observed.
- The difference in resistance values between positive and negative samples is most statistically significant at the 2-minute time point [2].
Protocol 2: Electrochemical DNA Nanobiosensor for MAP Detection
Principle: This protocol details the development of an ultra-selective electrochemical DNA nanobiosensor using graphene oxide and chitosan biopolymer for MAP detection, provided as an advanced comparative methodology [1].
Materials:
- Glassy carbon electrode
- Graphene oxide nanoparticles
- Chitosan biopolymer
- 1-ethyl-3-(3-dimethylaminopropyl) carbodiimide hydrochloride (EDC)
- N-hydroxy succinimide (NHS)
- Commercial probe DNA specific to MAP
- Phosphate buffer saline
Procedure:
Electrode Modification
- Immobilize graphene oxide and chitosan biopolymer on the surface of a glassy carbon electrode.
- Activate the biopolymer using EDC/NHS coupling system.
Probe DNA Immobilization
- Stabilize commercial probe DNA on the activated electrode surface to create an ssDNA-stabilized nanobiosensor.
Electrochemical Detection
- Employ cyclic voltammetry and differential pulse voltammetry to confirm DNA hybridization between the nanobiosensor and target MAP DNA.
- Perform measurements at optimal experimental conditions.
Validation:
- Characterize the bioelectrode using SEM, FT-IR, and EDX.
- Determine linear range, limit of detection, repeatability, and reproducibility.
- Validate with real samples for clinical diagnosis of MAP [1].
Biosensor Architecture and Detection Workflow
Diagram 1: Immunomigration and detection workflow of the PANI-based conductometric biosensor. The sample migrates through consecutive membranes, with the specific formation of a PANI-antibody complex at the capture membrane completing an electrical circuit between silver electrodes [2] [4].
Research Reagent Solutions
Table 3: Essential materials for PANI-based biosensor fabrication
| Research Reagent | Function/Application | Specifications/Alternatives |
|---|---|---|
| Polyaniline (PANI) | Conductive polymer transducer | AquaPass Pani; 0.001% dilution in PBS [2] |
| Anti-Bovine IgG | Detection antibody conjugation | Mouse monoclonal (clone BG-18); 0.0115 mg/mL optimal concentration [4] |
| MAP Purified Proteins | Capture antigen | Immobilized on capture membrane between electrodes [2] |
| Silver Electrodes | Electrical signal conduction | Screen-printed flanking capture membrane [4] |
| Hi-Flow Plus Membranes | Immunomigration platform | Sample application, conjugate, capture, and absorption membranes [2] |
| EDC/NHS Chemistry | Biopolymer activation | Carbodiimide crosslinking for electrode functionalization [1] |
Polyaniline serves as a highly effective transducer in conductometric biosensors for Johne's disease detection, enabling rapid, on-site diagnosis through its unique electrical properties and compatibility with biological elements. The protocols and performance data presented establish PANI-based biosensors as promising alternatives to traditional diagnostic methods, with ongoing optimization efforts focused on improving precision and accuracy for field deployment. Continued research into nanostructured PANI composites and hybridization with novel materials like graphene oxide promises to further enhance sensitivity and selectivity, ultimately supporting more effective Johne's disease management and control programs.
Defining the Requirements for Point-of-Care Testing in Veterinary Medicine
Point-of-care testing (POCT) represents a paradigm shift in veterinary diagnostics, enabling rapid, on-site detection of pathogens without the need for centralized laboratory facilities. In veterinary medicine, POCT is particularly crucial as animals cannot verbally communicate symptoms, often leading to delayed intervention and disease progression [24]. The World Health Organization's ASSURED criteria—Affordable, Sensitive, Specific, User-friendly, Rapid and robust, Equipment-free, and Deliverable—provide a framework for ideal POCT applications [25]. While human medicine has witnessed remarkable progress in POC development, veterinary POCT has not yet unfolded its full potential, particularly for economically significant diseases like Johne's disease (JD) in ruminants [25] [24].
Johne's disease, caused by Mycobacterium avium subspecies paratuberculosis (MAP), exemplifies the critical need for advanced POCT in veterinary practice. This chronic gastrointestinal disease causes substantial economic losses exceeding $1.5 billion annually in the U.S. dairy industry alone, primarily through reduced milk production, premature culling, and decreased carcass weight [26] [1]. Current diagnostic methods for MAP, including bacterial culture, enzyme-linked immunosorbent assay (ELISA), and polymerase chain reaction (PCR), require specialized equipment and trained personnel, with turn-around times ranging from days (ELISA, PCR) to weeks (culture) [26] [1]. The development of conductometric biosensors for on-site JD testing addresses these limitations by providing rapid, cost-effective, and accurate detection capabilities that can be deployed directly in field settings [26] [27].
Technical Requirements for Veterinary POCT Applications
ASSURED Criteria Adaptation for Veterinary Settings
The implementation of POCT in veterinary medicine requires specific adaptations of the ASSURED criteria to address unique challenges in animal disease management. Affordability must consider the cost-benefit ratio for livestock producers, where testing expenses should be offset by preventing production losses. Sensitivity requirements for JD diagnostics are particularly stringent due to the prolonged subclinical phase of infection, during which animals can shed MAP while appearing healthy [28]. Specificity must be sufficient to minimize false positives that could lead to unnecessary culling of valuable animals. The User-friendly criterion is essential for on-farm use where trained laboratory personnel are unavailable, requiring intuitive operation with minimal steps. Rapid and robust performance enables same-day management decisions, with robustness against environmental variations common in field settings. Equipment-free operation or minimal equipment needs enhance portability, while Deliverable aspects ensure accessibility to remote farming operations [25].
For JD diagnostics specifically, the prolonged subclinical shedding period necessitates highly sensitive tests capable of detecting early infections. Current antibody detection assays often fail to identify animals during this critical period, allowing continued disease transmission within herds [28]. The ideal POCT for JD must overcome this limitation through enhanced analytical sensitivity, potentially through signal amplification strategies or alternative biomarker detection.
Performance Benchmarking for JD Diagnostics
Table 1: Comparative Analysis of Diagnostic Methods for Johne's Disease
| Method | Detection Target | Time to Result | Analytical Sensitivity | Infrastructure Requirements | Cost |
|---|---|---|---|---|---|
| Bacterial Culture | Viable MAP organisms | 7-12 weeks [1] | High | BSL-2 laboratory, specialized equipment [26] | High |
| ELISA | MAP antibodies | 2-4 hours [28] | Moderate (70-90% accuracy) [1] | Laboratory, plate reader [26] | Moderate |
| PCR | MAP DNA | 4-6 hours [1] | High | Molecular biology laboratory, thermal cycler [1] | Moderate to High |
| Conductometric Biosensor | MAP antibodies | 2 minutes [26] | Moderate (improving) [27] | Minimal, portable reader [26] | Low |
Conductometric Biosensor Technology for JD Detection
Fundamental Operating Principles
Conductometric biosensors represent a promising technological approach for JD POCT, combining immunomigration technology with electronic signal detection. These analytical devices contain a transducer integrated with a biological sensing element that interprets specific biological recognition reactions as electrical conductance changes [26] [27]. The biosensor architecture typically employs polyaniline (Pani) as a conductive polymer transducer, which relays antigen-antibody binding events as measurable electrical quantities [26]. When MAP-specific antibodies in a sample form complexes with the biological recognition elements, the polyaniline bridges an electrical circuit between electrodes, resulting in measurable conductance changes proportional to the target analyte concentration [26].
The fundamental advantage of conductometric biosensors lies in their direct translation of biological binding events into electronic signals without requiring multiple washing steps, incubation periods, or complex sample processing. This direct detection mechanism significantly reduces analysis time compared to conventional immunoassays like ELISA, while maintaining reasonable sensitivity and specificity for field applications [27].
Biosensor Architecture and Detection Mechanism
The conductometric biosensor for JD detection employs a lateral flow architecture with integrated electrical detection components. The immunosensing platform comprises four key membranes: (1) sample application pad, which receives the liquid sample; (2) conjugate pad, containing polyaniline-anti-bovine IgG conjugates; (3) capture membrane, with immobilized MAP-specific antigens; and (4) absorption pad, which generates capillary flow [26] [27]. Silver electrodes flank the capture membrane, connected to a resistance measurement device.
During operation, the liquid sample (serum) migrates from the application pad through the conjugate pad, where serum immunoglobulins bind with the Pani-anti-bovine IgG conjugates, forming Pani-AB/IgG*-IgG complexes. These complexes continue migration to the capture membrane, where MAP-specific antibodies are captured by immobilized MAP antigens. The captured polyaniline-labeled complexes form conductive bridges between the silver electrodes, enabling current flow that is measured as reduced electrical resistance [26]. The magnitude of resistance decrease correlates with the concentration of MAP-specific antibodies in the sample.
Experimental Protocol: Conductometric Biosensor for JD Detection
Biosensor Fabrication and Preparation
Materials Required: Table 2: Research Reagent Solutions for Conductometric Biosensor Fabrication
| Component | Specification | Function | Supplier Example |
|---|---|---|---|
| Polyaniline (Pani) | AquaPass, 0.001% in PBS [27] | Conductive polymer transducer | Mitsubishi Rayon Co. |
| Anti-Bovine IgG | Monoclonal anti-bovine IgG (clone BG-18) [27] | Detection antibody | Sigma-Aldrich |
| Membrane Assembly | Hi-Flow Plus Assembly Kit [27] | Lateral flow platform | Millipore |
| MAP Antigen | Mycobacterium avium purified proteins [26] | Capture antigen | Commercial JD ELISA kits |
| Silver Electrodes | Screen-printed or microtip conductive pen [27] | Electrical signal transduction | MG Chemicals |
| Blocking Buffer | 0.1 M Tris buffer with 0.1% casein (pH 9.0) [27] | Reduce non-specific binding | Various |
| Detection Instrument | Ohmmeter (e.g., BK Precision 2880A) [27] | Resistance measurement | Various |
Step-by-Step Fabrication Protocol:
Capture Membrane Preparation:
Polyaniline-Antibody Conjugate Preparation:
- Dilute polyaniline to 0.001% concentration with 0.1 M phosphate buffer saline (PBS) [27].
- Add purified mouse monoclonal anti-bovine IgG to the Pani solution to achieve a final concentration of 0.0115 mg/mL [27].
- Incubate the mixture at 27°C for 1 hour to form Pani-AB/IgG* conjugate.
- Add blocking solution (0.1 M Tris buffer with 0.1% casein, pH 9.0) and incubate at 27°C for 30 minutes.
Conjugate Membrane Immobilization:
- Immerse the conjugate membrane in the Pani-AB/IgG* conjugate and blocking solution until saturated.
- Air-dry the membrane at 20°C under a clean biosafety cabinet for 45 minutes.
Biosensor Assembly:
- Assemble the four membranes (sample application, conjugate, capture, and absorption) into the complete immunosensor cassette.
- Cut the assembled immunosensor into 5 mm-wide disposable strips.
- Use a silver-microtip conductive pen to hand-print connections between the silver electrodes flanking the capture membrane and copper wafers.
- Connect each end of the copper wafer to an ohmmeter for signal detection.
Sample Analysis Protocol
Sample Collection and Preparation:
- Collect bovine serum samples using standard venipuncture techniques.
- For initial testing, include known JD-positive and JD-negative control sera validated by reference methods (e.g., commercial ELISA) [27].
- Store samples at -20°C if not testing immediately; avoid repeated freeze-thaw cycles.
Testing Procedure:
- Apply 100 μL of serum sample to the application membrane.
- Initiate timer immediately upon sample application.
- Allow capillary action to pull the sample through the conjugate and capture membranes.
- Record resistance values (in kiloohms) at precisely 2 minutes post-application using the connected ohmmeter [27].
- Perform triplicate measurements for each sample to assess precision.
Data Interpretation:
- Lower electrical resistance values indicate higher concentrations of MAP-specific antibodies.
- Establish a cut-off resistance value based on receiver operating characteristic (ROC) analysis comparing known positive and negative samples [27].
- Calculate intra-assay coefficient of variation (%CV) using triplicate measurements; target ≤15% for acceptable precision [26].
Performance Evaluation and Validation
Analytical Performance Metrics
Table 3: Performance Characteristics of JD Diagnostic Platforms
| Performance Parameter | Conductometric Biosensor | Commercial ELISA | Bacterial Culture |
|---|---|---|---|
| Detection Time | 2 minutes [26] | 2-4 hours [1] | 7-12 weeks [1] |
| Analytical Sensitivity | 89% (relative to ELISA) [27] | 70-90% [1] | High (reference method) |
| Analytical Specificity | 85% (relative to ELISA) [27] | >95% [28] | 100% |
| Inter-assay CV | 14.48% [26] | 10-15% [26] | Not applicable |
| Sample Throughput | Moderate (single samples) | High (batch processing) | Low |
| Equipment Requirements | Portable ohmmeter | Laboratory plate reader | BSL-2 facility |
Validation studies comparing the conductometric biosensor with commercial ELISA tests demonstrate moderate strength of agreement (kappa = 0.41), indicating acceptable correlation with standard serological methods [27]. The biosensor shows statistically significant differentiation between JD-positive and JD-negative samples at the 2-minute reading interval, with JD-positive samples exhibiting numerically lower resistance values [26]. This differential signal intensity potentially enables semi-quantitative assessment of antibody levels, correlating with ELISA optical density values [26].
Optimization Strategies for Enhanced Performance
Several optimization approaches can improve biosensor performance:
Antibody Concentration Tuning: Systematic evaluation of anti-bovine antibody concentrations in the polyaniline conjugate (e.g., 0.046 mg/mL, 0.0115 mg/mL, and 0.0046 mg/mL) identifies optimal ratios for signal intensity and specificity [27].
Capture Membrane Engineering: Implementing uniformly screen-printed electrodes with consistent immunomigration channels reduces variability and improves precision [27].
Signal Amplification: Incorporating nanomaterials like graphene oxide and chitosan biopolymer in electrochemical biosensors significantly enhances sensitivity, with demonstrated detection limits as low as 1.53 × 10⁻¹³ mol L−1 for MAP DNA detection [1].
Flow Control Mechanisms: Optimizing membrane porosity and absorption capacity ensures complete fluid migration while preventing premature signal loss.
Conductometric biosensors represent a promising POCT platform for JD diagnosis, offering rapid detection (2 minutes), minimal equipment requirements, and reasonable correlation with established laboratory methods. The technology addresses critical gaps in current JD control programs by enabling on-site testing at points of concentration such as sale barns, facilitating immediate management decisions [27]. Future development should focus on enhancing analytical sensitivity to detect early-stage infections, improving reproducibility through automated manufacturing, and expanding multiplexing capabilities for simultaneous detection of multiple pathogens.
The integration of advanced nanomaterials like graphene oxide and chitosan composites shows particular promise for signal enhancement, potentially bridging the sensitivity gap between current biosensors and laboratory-based methods [1]. As these technologies mature, conductometric biosensors are poised to become indispensable tools in veterinary medicine, supporting the One Health approach through improved animal disease monitoring and control.
Biosensor Fabrication and Assay Workflow for MAP Detection
Johne's disease, a chronic granulomatous enteritis in ruminants caused by Mycobacterium avium subspecies paratuberculosis (MAP), inflicts substantial economic losses on the cattle industry, estimated to exceed $1.5 billion annually in the U.S. alone due to reduced milk production and premature culling [2] [26]. Effective disease control is hampered by limitations in current diagnostic methods. Bacterial culture, considered a benchmark, requires 7–12 weeks for completion, while polymerase chain reaction (PCR) and enzyme-linked immunosorbent assay (ELISA) demand specialized laboratory equipment and training, rendering them unsuitable for on-site application [2] [26] [1].
The development of rapid, inexpensive, and accurate point-of-care diagnostic assays is therefore crucial for effective disease management. This application note details the assembly and protocol for an immunomigration-based conductometric biosensor, a novel platform designed for the rapid detection of MAP-specific antibodies in serum. This biosensor format integrates the specificity of immunological recognition with the measurable physical transduction of electrical conductance, enabling a detection time of approximately two minutes, thus supporting frequent and widespread field testing [2] [26].
Principles of the Conductometric Immunomigration Biosensor
The conductometric biosensor operates on the principle of translating a specific antigen-antibody binding event into a quantifiable change in electrical resistance. The core of the detection system is a conductive polymer, polyaniline (Pani), known for its strong bio-molecular interactions, excellent environmental stability, and good conductivity [2] [26].
The assay is configured in an immunomigration (lateral flow) format, comprising three key functional zones:
- Conjugate Pad: Contains a conjugate of Pani and anti-bovine IgG (Pani-AB/IgG*).
- Capture Membrane: Immobilized with purified MAP proteins (MAPPD).
- Absorption Membrane: Acts as a fluid sink.
When a serum sample is applied, it rehydrates the conjugate, forming a complex between the Pani-AB/IgG* and the host IgG antibodies. This complex migrates along the strip via capillary action. If the sample contains MAP-specific IgG, these antibodies will be captured by the immobilized MAP antigens on the capture membrane. The captured complex, which includes the conductive Pani, subsequently bridges a pair of silver electrodes flanking the capture membrane. The presence of Pani completes an electrical circuit, resulting in a measurable drop in electrical resistance. In negative samples, where no MAP-specific antibodies are present, the Pani-containing complexes are not captured and continue to the absorption membrane, resulting in a significantly higher electrical resistance [2] [26].
The following workflow diagram illustrates the assembly and detection process:
Research Reagent Solutions
The table below catalogues the essential materials and reagents required for the fabrication and operation of the conductometric immunomigration biosensor.
Table 1: Key Research Reagents and Materials for Biosensor Fabrication
| Item | Function / Description | Reference / Source |
|---|---|---|
| Screen-Printed Carbon Electrodes (SPCEs) | Disposable platform for the biosensor assembly; provides the base and electrical contacts. | [29] |
| Polyaniline (Pani) | Conductive polymer transducer; its presence in the captured complex causes a measurable drop in electrical resistance. | [2] [26] |
| Anti-Bovine IgG Antibody | Used to create the Pani-AB/IgG* conjugate; binds to bovine IgG in the serum sample. | [2] [26] |
| Purified MAP Proteins (MAPPD) | Capture antigen immobilized on the membrane; specifically binds MAP-specific IgG from the sample. | [2] [26] |
| Rabbit Anti-Sheep IgG (rIgG) | Used in some sensor architectures to capture and orientate primary antibodies on the electrode surface. | [29] |
| Silver Electrodes | Integrated into the biosensor flanking the capture membrane; used to measure electrical resistance. | [2] [26] |
Detailed Experimental Protocol
Fabrication of the Immunomigration Strip
Materials: Screen-printed carbon electrodes (SPCEs), purified MAP proteins (MAPPD), polyaniline/anti-bovine IgG conjugate (Pani-AB/IgG*), nitrocellulose membrane (capture and conjugate zones), absorption membrane, cassette housing.
Procedure:
- Capture Membrane Preparation: Spot 1 µL of the purified MAP protein (MAPPD) solution onto the designated area of the nitrocellulose membrane to form the capture line. Allow it to dry completely at room temperature.
- Conjugate Pad Preparation: Impregnate the conjugate pad material with the pre-formed Pani-AB/IgG* conjugate and allow it to dry.
- Strip Assembly: Layer the following components in sequence onto a backing card:
- Sample application pad.
- Dried conjugate pad.
- Prepared capture membrane with the immobilized MAP antigens.
- Absorption membrane (waste pad).
- Ensure that each component overlaps slightly (≈2 mm) to facilitate continuous capillary flow.
- Electrode Integration: Position the assembled strip into a custom cassette that aligns a pair of silver electrodes on either side of the capture membrane zone.
- Store the fabricated biosensors in a desiccated environment at 4°C until use.
Biosensor Operation and Data Acquisition
Materials: Fabricated biosensor, serum samples, precision pipette, conductometric reading device.
Procedure:
- Apply 100 µL of the test serum sample to the sample application pad.
- Initiate a timer simultaneously with sample application.
- Allow the immunomigration and binding reaction to proceed for exactly 2 minutes.
- At the 2-minute mark, measure the electrical resistance (in kilo-ohms, kΩ) across the silver electrodes using the conductometric reader.
- Record the resistance value for data analysis. The intra-assay coefficient of variation for this method at 2 minutes is approximately 14.5% [2] [26].
Table 2: Performance Data of Conductometric Biosensor vs. Reference ELISA
| Sample ID | ELISA Status (OD Value) | Biosensor Mean Resistance (kΩ) at 2 min (Mean ± SD) |
|---|---|---|
| A | Positive (1.683) | 43.47 ± 4.76 |
| B | Positive (1.380) | 70.33 ± 3.95 |
| C | Positive (0.978) | 95.43 ± 12.58 |
| D | Negative (0.014) | 437.00 ± 33.29 |
| E | Negative (-0.020) | 448.37 ± 99.41 |
| F | Negative (-0.048) | 672.33 ± 101.93 |
Data adapted from Okafor et al., 2008 [2] [26]. SD: Standard Deviation.
Performance Analysis and Validation
Validation of the biosensor against a standard ELISA demonstrated a clear and statistically significant difference (p < 0.05) in the mean resistance values between JD-positive and JD-negative serum samples at the 2-minute detection time [2] [26]. As illustrated in Table 2, the mean resistance for positive samples is markedly lower than that for negative samples, a result of the Pani-mediated conduction pathway formed upon specific antigen-antibody capture.
The relationship between the biosensor's resistance output and the ELISA optical density (OD) value suggests that this platform can provide semi-quantitative data on the relative concentration of MAP antibodies in a sample [2] [26]. It is critical to adhere to the 2-minute reading interval, as the difference in resistance between positive and negative samples becomes less statistically significant at later time points (4 and 6 minutes), likely due to non-specific binding or flow dynamics [2] [26].
Troubleshooting and Technical Notes
- Critical Timing: The 2-minute measurement window is essential for optimal performance. Delayed readings can lead to loss of significance between groups.
- Sample Volume: Consistent application of 100 µL of serum is required for reproducible capillary flow and assay completion.
- Storage: To maintain stability, store unused biosensor strips in a sealed desiccant pouch at 4°C.
- Interpretation: A "positive" result is indicated by a significant drop in electrical resistance relative to a known negative control. The results from the biosensor should be interpreted in conjunction with clinical signs and other herd-level diagnostic information.
Within the broader scope of developing a rapid, on-site conductometric biosensor for Johne's disease (JD), the preparation of a highly responsive conjugate membrane is a critical step. This component of the biosensor is responsible for the specific capture of Mycobacterium avium subspecies paratuberculosis (MAP) antibodies from bovine serum. The protocol detailed herein describes the immobilization of anti-bovine IgG onto a polyaniline (PANI)-coated membrane, creating the conductive conjugate essential for signal transduction [2] [4]. The optimization of this conjugate membrane directly impacts the sensitivity, speed, and overall diagnostic accuracy of the biosensor, which is capable of detecting MAP IgG in as little as two minutes, thereby supporting point-of-care management decisions for JD [2].
Research Reagent Solutions
The following table catalogues the essential materials and reagents required for the preparation of the PANI-based conjugate membrane.
Table 1: Key Research Reagents and Their Functions
| Reagent / Material | Function / Explanation |
|---|---|
| Polyaniline (Pani) | A conductive polymer that acts as the transducer. It bridges the electrical circuit upon antigen-antibody complex formation, causing a measurable change in conductance [2] [30]. |
| Mouse Monoclonal Anti-Bovine IgG | The capture antibody that is conjugated with PANI. It specifically binds to bovine IgG present in the serum sample, forming a Pani-AB/IgG*-IgG complex [4]. |
| Hi-Flow Plus Membrane Kit | Provides the nitrocellulose-based substrate for the conjugate pad, which serves as the porous support for the PANI-antibody conjugate [2] [4]. |
| Phosphate Buffered Saline (PBS) | A buffer solution used to maintain a stable pH and osmotic balance during the conjugation and blocking steps [4]. |
| Tris Buffer with Casein | A blocking solution that saturates non-specific binding sites on the conjugate membrane to minimize background noise and improve signal-to-noise ratio [4]. |
| Glutaraldehyde | A crosslinking agent used to covalently immobilize biorecognition elements (e.g., antibodies or antigens) onto the PANI film, ensuring stable attachment [31] [32]. |
Protocol: Conjugate Membrane Fabrication
Materials Preparation
- Polyaniline Solution: Prepare a 0.001% (w/v) solution of AquaPass PANI in 0.1 M Phosphate Buffered Saline (PBS) [4].
- Antibody Solution: Dilute purified mouse monoclonal anti-bovine IgG (clone BG-18) in PBS to the desired working concentration [4].
- Conjugate Membrane: Use the conjugate pad from a commercial membrane kit (e.g., Millipore Hi-Flow Plus) [4].
- Blocking Solution: Prepare a 0.1 M Tris buffer (pH 9.0) containing 0.1% casein [4].
Step-by-Step Procedure
Conjugate Formation: Add the monoclonal anti-bovine IgG to the 0.001% PANI solution to achieve a final antibody concentration of 0.0115 mg/mL (optimized value) [4]. Incubate the mixture at 27°C for 1.0 hour to allow the formation of the Pani-AB/IgG* conjugate.
Blocking: Add 0.5 mL of the Tris-casein blocking solution to every 4 mL of the Pani-AB/IgG* conjugate solution. Incubate the resulting mixture at 27°C for an additional 30 minutes. This step passivates the conjugate to prevent non-specific binding [4].
Immobilization: Immerse the conjugate membrane into the prepared Pani-AB/IgG* conjugate and blocking solution mixture. Ensure the membrane is fully saturated.
Drying: Carefully remove the saturated membrane and allow it to air-dry completely for approximately 45 minutes under a clean biosafety cabinet at 20°C [4].
Storage: The dried conjugate membrane can be stored in a desiccated environment at room temperature until assembly into the biosensor strip.
Optimization and Key Parameters
The concentration of the anti-bovine IgG used in the conjugate is critical for assay performance. A comparative study tested three different antibody concentrations. The results, summarized in the table below, indicate that a concentration of 0.0115 mg/mL provided an optimal balance, yielding a functional biosensor for subsequent diagnostic use [4].
Table 2: Optimization of Anti-Bovine IgG Concentration in Conjugate
| Anti-Bovine IgG Concentration (mg/mL) | Outcome and Performance Assessment |
|---|---|
| 0.046 mg/mL | Not specified in results; presumed supra-optimal. |
| 0.0115 mg/mL | Optimal concentration selected for diagnostic testing based on performance [4]. |
| 0.0046 mg/mL | Not specified in results; presumed sub-optimal. |
Biosensor Assembly and Detection Workflow
The complete conductometric biosensor integrates the prepared conjugate membrane with other components into a functional device. The diagram below illustrates the assembly and the subsequent immunomigration and detection process.
Diagram Title: Biosensor immunomigration and detection process
Workflow Description:
- Sample Application: A 100 μL bovine serum sample is applied to the sample membrane [4].
- Conjugate Formation: The sample migrates to the conjugate membrane, where bovine IgG (both MAP-specific and non-specific) binds to the PANI-anti-bovine IgG conjugate, forming a Pani-AB/IgG*-IgG complex [2] [4].
- Specific Capture: The fluid continues to the capture membrane, which is pre-coated with MAP-specific antigens (MAPPD). If MAP-specific IgG is present in the complex, it is captured on this membrane. Non-specific IgG complexes continue to migrate [2] [4].
- Signal Generation: The captured PANI, due to its conductive properties, bridges the two silver electrodes that flank the capture membrane. This completes an electrical circuit, resulting in a measurable drop in electrical resistance [2].
- Waste Absorption: The remaining liquid and unbound complexes are finally drawn into the absorption membrane [2].
Performance Characterization
The functionality of the fabricated biosensor, employing the optimized conjugate membrane, was validated using serum samples of known JD status. The primary metric for detection was the electrical resistance measured across the capture membrane at two minutes post-sample application [2] [4].
Table 3: Performance Data of the Conductometric Biosensor at 2 Minutes
| Sample Category | ELISA OD Value | Mean Resistance (kΩ) ± SD | Statistical Significance |
|---|---|---|---|
| JD Positive (Sample A) | 1.683 | 43.47 ± 4.76 | Significant difference (P < 0.05) between JD positive and negative samples [2]. |
| JD Positive (Sample B) | 1.380 | 70.33 ± 3.95 | |
| JD Positive (Sample C) | 0.978 | 95.43 ± 12.58 | |
| JD Negative (Sample D) | 0.014 | 437.00 ± 33.29 | |
| JD Negative (Sample E) | -0.020 | 448.37 ± 99.41 | |
| JD Negative (Sample F) | -0.048 | 672.33 ± 101.93 |
The data demonstrates a clear and statistically significant difference in the mean resistance values between JD-positive and JD-negative samples at the 2-minute read time, confirming the efficacy of the biosensor for rapid detection [2].
This application note provides a detailed protocol for fabricating the core conjugate membrane of a conductometric biosensor for Johne's disease. The critical step involves the optimized immobilization of anti-bovine IgG with polyaniline at a concentration of 0.0115 mg/mL. When integrated into the biosensor strip, this membrane enables a rapid, specific, and measurable electrochemical response upon detection of MAP-specific antibodies in bovine serum. The entire process, from sample application to result, is completed within two minutes, making this technology a strong candidate for on-site JD screening and supporting broader disease control efforts.
Capture Membrane Functionalization with MAP-Specific Antigens
The development of rapid, on-site diagnostic tests for Johne's disease (JD), caused by Mycobacterium avium subspecies paratuberculosis (MAP), represents a critical need in veterinary medicine. Conventional diagnostic methods, including enzyme-linked immunosorbent assay (ELISA) and bacterial culture, are constrained by requirements for specialized equipment, trained personnel, and prolonged processing times (up to 7-12 weeks for culture) [2] [1]. Conductometric biosensors have emerged as promising alternatives, offering potential for portable, rapid, and cost-effective point-of-care detection. The functionalization of the capture membrane with specific antigens is a pivotal determinant of biosensor performance, dictating both the specificity and sensitivity of the assay. This application note details optimized protocols for fabricating and functionalizing capture membranes for the detection of MAP-specific antibodies using conductometric biosensors, framed within broader research objectives for on-site JD testing.
Experimental Protocols
Fabrication of the Biosensor Strip and Capture Membrane
The conductometric biosensor is configured in an immunomigration (lateral flow) format, comprising four key membranes: sample application, conjugate, capture, and absorption membranes [2] [4].
Materials:
- Hi-Flow Plus Assembly Kit (Millipore)
- Silver ink (e.g., for screen-printing)
- Silver-microtip conductive pen (MG Chemicals)
- Copper wafers
- Ohmmeter (e.g., BK Precision multimeter)
Procedure:
- Screen-Printing of Electrodes: Silver electrodes are screen-printed onto the nitrocellulose capture membrane to create parallel channels, typically 1 mm wide, flanking the area where the antigen will be immobilized [4].
- Biosensor Assembly: The individual membranes (sample, conjugate, capture, and absorption) are assembled in sequence onto a backing card, as per the manufacturer's instructions for the assembly kit [4].
- Electrical Connection: After assembly, a silver-microtip conductive pen is used to hand-print a connection between each screen-printed silver electrode on the capture membrane and a copper wafer. The copper wafer is then connected to the ohmmeter, which serves as the signal detector [4].
Functionalization of the Capture Membrane with MAP Antigens
The core of the biosensor's specificity lies in the immobilization of MAP antigens on the capture membrane.
Materials:
- MAP Purified Protein Derivative (MAPPD) OR specific recombinant cell envelope proteins (e.g., SdhA, FadE25_2, DesA2) [2] [33]
- Phosphate Buffered Saline (PBS), 0.1 M, pH 7.2-7.4
- Purified protoplasmic antigen from MAP (for an alternative protocol) [34]
Procedure A: Using MAP Purified Protein Derivative (MAPPD)
- Antigen Preparation: Dilute MAPPD in 0.1 M PBS to a concentration of 1.0 mg/mL [2].
- Membrane Coating: Immobilize the antigen solution onto the pre-defined 1 mm channel of the capture membrane between the silver electrodes.
- Drying: Air-dry the functionalized capture membrane at 20°C for 30 minutes under a clean biosafety cabinet to ensure complete drying and stable immobilization [2] [4].
Procedure B: Using Recombinant MAP Cell Envelope Proteins
- Antigen Selection: Select MAP-specific recombinant proteins (e.g., SdhA, FadE25_2) that demonstrate high antigenicity and minimal cross-reactivity with other mycobacterial species [33].
- Antigen Preparation and Coating: Dilute the recombinant protein in a suitable buffer (e.g., PBS or carbonate-bicarbonate buffer) and immobilize it onto the capture membrane as described in Procedure A.
Preparation of the Polyaniline-Antibody Conjugate
The conjugate membrane is functionalized with a detection probe composed of a conductive polymer and a secondary antibody.
Materials:
- AquaPass polyaniline (Pani) (Mitsubishi Rayon Co.)
- Purified mouse monoclonal anti-bovine IgG (clone BG-18, Sigma-Aldrich)
- Phosphate Buffered Saline (PBS), 0.1 M
- Tris buffer (0.1 M, pH 9.0) containing 0.1% casein
Procedure:
- Polyaniline Dilution: Dilute the AquaPass polyaniline to a 0.001% solution with 0.1 M PBS [4].
- Conjugate Formation: Add monoclonal anti-bovine IgG to the Pani solution to achieve a final optimized concentration of 0.0115 mg/mL. Incubate the mixture at 27°C for 1 hour to form the Pani-anti-bovine IgG (Pani-AB/IgG*) conjugate [4].
- Blocking: Add a blocking solution of 0.1 M Tris buffer with 0.1% casein (pH 9.0) to the conjugate solution. Incubate at 27°C for an additional 30 minutes to block non-specific sites [4].
- Conjugate Membrane Immobilization: Saturate the conjugate membrane with the Pani-AB/IgG* conjugate and blocking solution mixture. Air-dry the membrane at 20°C for 45 minutes before assembling it into the biosensor strip [2] [4].
Biosensor Operation and Signal Measurement
Procedure:
- Sample Application: Apply 100 µL of bovine serum sample to the sample application membrane [4].
- Immunomigration and Complex Formation: The sample migrates via capillary action. Serum IgG binds to the Pani-AB/IgG* conjugate on the conjugate membrane, forming a Pani-AB/IgG*-IgG complex. This complex migrates to the capture membrane, where MAP-specific IgG is captured by the immobilized MAP antigens.
- Signal Detection: The captured polyaniline bridges the silver electrodes, completing an electrical circuit. This causes a measurable drop in electrical resistance.
- Data Recording: Record the resistance value (in kiloohms) using the ohmmeter at 2 minutes post-sample application. A significant decrease in resistance compared to a negative control indicates a positive result [2] [4].
Table 1: Key Performance Metrics of Conductometric Biosensors for JD Detection
| Parameter | Reported Value | Experimental Context |
|---|---|---|
| Detection Time | 2 - 8 minutes | Varies with specific biosensor design and sample type [2] [34] |
| Detection Limit | Not explicitly quantified | Demonstrated significant difference between JD+ and JD- sera [2] |
| Intra-Assay CV | 14.48% (at 2 minutes) | Coefficient of variation for repeated measurements [2] |
| Comparative Sensitivity | 19.14% (vs. 19.25% for ELISA) | Study on 265 goat sera; biosensor vs. absorbed ELISA [34] |
| Diagnostic Agreement | Kappa = 0.41 (Moderate) | Strength of agreement with commercial ELISA in cattle [4] |
The Scientist's Toolkit: Research Reagent Solutions
Table 2: Essential Research Reagents for Biosensor Functionalization
| Reagent / Material | Function / Role | Specific Example / Note |
|---|---|---|
| MAP Antigens | Capture analyte (MAP-specific IgG) on the capture membrane | MAP Purified Protein Derivative (MAPPD); Recombinant proteins (SdhA, FadE25_2) [2] [33] |
| Anti-Bovine IgG | Detection antibody; binds to target IgG in sample | Monoclonal anti-bovine IgG (clone BG-18); conjugated to polyaniline [4] |
| Conductive Polymer | Signal transducer; enables conductance measurement | Polyaniline (Pani); provides excellent environmental stability and conductivity [2] [34] |
| Immunosensor Membrane Kit | Platform for immunomigration and reaction | Hi-Flow Plus Assembly Kit (Millipore) [4] |
| Screen-Printed Electrodes | Measure electrical conductance change | Silver electrodes printed on the capture membrane [2] [4] |
Results and Data Analysis
The performance of the antigen-functionalized capture membrane is validated through electrical resistance measurements and comparison to reference standards.
Table 3: Representative Biosensor Resistance Data for JD-Positive and JD-Negative Sera
| Sample Status | ELISA OD Value | Mean Resistance (kΩ) at 2 min ± SD | Statistical Significance |
|---|---|---|---|
| JD Positive | 1.683 | 43.47 ± 4.76 | Significant difference (p < 0.05) between JD+ and JD- groups at 2 minutes [2] |
| JD Positive | 1.380 | 70.33 ± 3.95 | |
| JD Positive | 0.978 | 95.43 ± 12.58 | |
| JD Negative | 0.014 | 437.00 ± 33.29 | |
| JD Negative | -0.020 | 448.37 ± 99.41 | |
| JD Negative | -0.048 | 672.33 ± 101.93 |
Key findings from the evaluation of functionalized biosensors include:
- Rapid Detection: A significant differential in electrical resistance between JD-positive and JD-negative serum samples can be consistently measured within 2 minutes of sample application [2] [4].
- Correlation with Antibody Titer: Lower resistance values correlate with higher ELISA optical density (OD) values, indicating that the biosensor response is proportional to the concentration of MAP-specific antibodies in the serum [2].
- Point-of-Care Potential: The simplicity of the electrical readout, combined with the rapid result, supports the application of this technology for on-site JD testing at points-of-concentration such as sale barns [4].
The functionalization of the capture membrane with MAP-specific antigens is a critical and optimized step in fabricating a conductometric biosensor for Johne's disease. The protocols described herein—covering electrode fabrication, antigen immobilization, and conjugate preparation—enable the creation of a robust diagnostic tool.
The presented data confirm that this biosensor platform can distinguish between infected and non-infected animals rapidly. The use of MAP-specific recombinant cell envelope proteins presents a promising avenue for further enhancing test specificity by reducing cross-reactivity with antibodies generated against other environmental mycobacteria [33].
Future work should focus on the refinement of antigen cocktails to improve sensitivity, particularly for early-stage infections, and on the transition from laboratory prototypes to commercially viable, mass-producible devices. The integration of these functionalized biosensors into herd management practices has the potential to significantly improve JD control programs through frequent and accessible testing.
The following diagram illustrates the experimental workflow for the functionalization of the capture membrane and the operational mechanism of the conductometric biosensor.
Diagram 1: Biosensor Fabrication and Conductometric Detection Workflow. This diagram outlines the key steps involved in functionalizing the biosensor's capture and conjugate membranes, followed by the process of sample application, immunomigration, and electrical signal generation upon target antibody capture.
This application note details the working principle and experimental protocol for a conductometric biosensor designed for the on-site detection of Johne's disease (JD). The biosensor specifically detects serum antibodies (IgG) against Mycobacterium avium subspecies paratuberculosis (MAP), the causative agent of JD, which is estimated to cost the U.S. dairy industry over $1.5 billion annually in lost productivity [2]. The document provides a comprehensive guide to the detection mechanism, from the initial antibody-antigen binding event to the final measurable change in electrical conductance, and includes a detailed, actionable protocol for fabricating and operating the biosensor.
Detection Principle and Mechanism
The conductometric biosensor operates on the principle of translating a specific biological recognition event into a quantifiable electrical signal. The core mechanism involves an immunomigration format where a conductive polymer, polyaniline (Pani), acts as the transducer [2].
Biosensor Architecture and Workflow
The biosensor strip consists of several sequential zones:
- Conjugate Membrane: Contains a pre-dispersed conjugate of Pani linked to anti-bovine IgG.
- Capture Membrane: Features immobilized MAP-specific purified proteins (antigen).
- Absorption Membrane: Drives the capillary flow of the sample.
- Electrodes: Silver electrodes flank the capture membrane to measure electrical resistance [2].
The following diagram illustrates the sequential mechanism of detection, from sample application to the final conductance measurement.
The Role of Polyaniline in Signal Transduction
Polyaniline is a conductive polymer that serves as the core transducer in this system. Its integration with the biological recognition element is crucial. In the absence of MAP-specific IgG, the Pani-conjugate flows past the capture membrane and into the absorption pad, leaving the electrical circuit between the silver electrodes open. When MAP-specific IgG is present, it forms a "sandwiched" complex: the IgG binds simultaneously to the Pani-anti-bovine IgG conjugate and to the immobilized MAP antigen on the capture membrane. The captured Pani then bridges the gap between the electrodes, completing an electrical circuit. The conductance, measured as a drop in electrical resistance, is directly caused by the conductive Pani in the complex [2]. The change in surface charge upon binding events modulates the carrier density within the Pani, leading to this measurable change in conductance [35].
Quantitative Biosensor Performance Data
Testing of the biosensor with known JD-positive and JD-negative serum samples demonstrates a significant difference in the mean electrical resistance observed between the two groups. The following table summarizes key performance metrics and quantitative results from the evaluation of the conductometric biosensor.
Table 1: Performance Data of the Conductometric Biosensor for JD Detection
| Performance Metric | Result / Value | Experimental Conditions |
|---|---|---|
| Detection Time | 2 minutes | Optimal readout time [2] |
| Mean Resistance (2 min) | JD Positive: 43.47 - 95.43 kΩJD Negative: 437.00 - 672.33 kΩ | Significant difference (p < 0.05) between groups [2] |
| Statistical Significance | Significant at 2 minutesNot significant at 4 and 6 minutes | 2-minute reading is critical [2] |
| Intra-assay Variability | Coefficient of Variation: 14.48% | At 2-minute reading [2] |
Experimental Protocol
This section provides a step-by-step protocol for fabricating and operating the conductometric biosensor for JD detection.
Biosensor Fabrication and Preparation
Materials and Reagents
- Purified MAP Proteins: Used to functionalize the capture membrane as the specific antigen [2].
- Polyaniline (Pani): Conductive polymer, synthesized and used as the transducer material [2] [35].
- Anti-Bovine IgG Antibody: For creating the Pani-antibody conjugate in the conjugate pad [2].
- Ethyl(dimethylaminopropyl) Carbodiimide (EDC) and N-Hydroxysuccinimide (NHS): Crosslinking agents for covalent immobilization of biomolecules (e.g., 0.2 M concentrations) [35].
- Bovine Serum Albumin (BSA): Used as a blocking agent to passivate non-specific binding sites (e.g., 1 ng/mL–2 mg/mL) [35].
- Phosphate Buffered Saline (PBS): Washing and working buffer (e.g., 10 mM, pH 7.4) [35].
- Sensor Strip Components: Nitrocellulose membrane (capture), glass fiber membrane (conjugate pad), absorption membrane, silver electrodes, and plastic backing [2].
Fabrication Steps
- Functionalize Capture Membrane: Immobilize purified MAP proteins onto the nitrocellulose capture membrane in a defined test line. The proteins can be deposited using a precision dispensing system.
- Prepare Conjugate Pad: Conjugate the anti-bovine IgG antibody to the Pani polymer using EDC/NHS chemistry [35]. Disperse and dry the Pani-anti-IgG conjugate onto the glass fiber membrane.
- Assemble Biosensor Strip: Laminate the conjugate pad, capture membrane, and absorption membrane onto a plastic backing card in sequential order. Ensure overlaps between pads for proper capillary flow. Position silver electrodes to flank the capture membrane.
- Block and Dry: Treat the assembled strip with a BSA solution to block non-specific sites. Dry the strips thoroughly and store them in a desiccated pouch until use.
Biosensor Operation and Measurement
- Sample Preparation: Collect serum from the animal of interest. For preliminary testing, samples may be purified, but the biosensor can also function with unpurified serum [2].
- Sample Application: Apply a fixed volume (e.g., 100 µL) of the serum sample to the conjugate pad of the biosensor strip.
- Immunomigration: Allow the sample to migrate via capillary action across the conjugate pad, through the capture membrane, and toward the absorption pad. This process takes approximately 2 minutes.
- Signal Measurement: After 2 minutes, measure the electrical resistance across the silver electrodes flanking the capture membrane using a handheld multimeter or a custom-designed reader.
- Data Interpretation: A significantly lower electrical resistance (in the range of tens to under one hundred kΩ) indicates a positive result, corresponding to the presence of MAP-specific IgG and the formation of a conductive Pani complex. A high resistance (hundreds of kΩ or more) indicates a negative result.
The Scientist's Toolkit: Essential Research Reagents
Table 2: Key Research Reagent Solutions for Conductometric Biosensor Development
| Reagent / Material | Function in the Biosensor | Specific Example / Note |
|---|---|---|
| Polyaniline (Pani) | Conductive polymer transducer; bridges electrical circuit upon capture. | Can be electrochemically synthesized; offers good conductivity and environmental stability [2] [35]. |
| MAP Antigens | Biological recognition element; captures specific MAP IgG from sample. | Purified proteins immobilized on the capture membrane [2]. |
| EDC / NHS Crosslinkers | Activates carboxyl groups for covalent antibody immobilization. | Used for stable conjugation of antibodies to Pani or the membrane surface [35]. |
| *Anti-Bovine IgG | Detection conjugate; binds to Fc region of target bovine IgG. | Conjugated to Pani to form the signal-generating complex [2]. |
| Blocking Agent (BSA) | Reduces non-specific binding, improving signal-to-noise ratio. | Used to passivate the membrane after antigen immobilization [35]. |
Troubleshooting and Optimization Notes
- Critical Reading Time: The maximum differentiation between positive and negative samples is achieved at a 2-minute reading time. Resistance values can converge at later time points (e.g., 4-6 minutes), likely due to non-specific flow, making timing critical [2].
- Conjugate Optimization: The concentration of the Pani-antibody conjugate should be optimized. Using too little can lead to a weak signal, while an excess may increase background noise.
- Flow Control: Consistent sample volume and membrane quality are vital for reproducible capillary flow and assay performance.
Step-by-Step Protocol for Testing Serum Samples
Johne's disease (JD), caused by Mycobacterium avium subspecies paratuberculosis (MAP), is a chronic gastrointestinal infection in ruminants with significant economic impact, estimated at $200-$250 million annually in the U.S. dairy industry alone [4]. Effective JD management relies on accurate diagnostics, yet traditional laboratory-based tests like enzyme-linked immunosorbent assay (ELISA) and polymerase chain reaction (PCR) require specialized equipment and training, limiting their use for on-site applications [2] [4]. Conductometric biosensors represent an emerging technology that combines immunomigration with electronic signal detection, offering rapid, portable analysis with minimal sample preparation [2] [34]. This protocol provides detailed methodologies for testing serum samples using both conductometric biosensors and traditional ELISA, enabling researchers to evaluate JD diagnostic performance within point-of-care testing frameworks.
Materials and Reagents
Research Reagent Solutions
Table 1: Essential Research Reagents for Conductometric Biosensor and ELISA Testing
| Reagent/Material | Function/Application | Specifications/Notes |
|---|---|---|
| Polyclonal or Monoclonal Anti-Bovine IgG | Detection antibody in biosensor conjugate | Mouse monoclonal anti-bovine IgG (clone BG-18); optimal concentration: 0.0046-0.046 mg/mL [4] |
| MAP Protoplasmic Antigens (MAPPD) | Capture antigen on biosensor membrane | Detects MAP-specific antibodies in serum samples [4] |
| Polyaniline (Pani) | Conductive polymer transducer in biosensor | AquaPass Pani diluted to 0.001% with 0.1 M PBS [4] |
| Phosphate Buffered Saline (PBS) | Diluent and washing buffer | 0.1 M, pH 7.4 [4] |
| Tris Buffer with Casein | Blocking solution for biosensor | 0.1 M Tris buffer containing 0.1% casein, pH 9.0 [4] |
| Commercial MAP Antibody ELISA Kit | Reference serological testing | Follow manufacturer's instructions for specific kit [4] [12] |
| Bovine Serum Samples | Test specimens for JD evaluation | 2-3 mL serum from blood collected in red-top or serum separator tubes [12] |
Equipment and Apparatus
- Conductometric biosensor strip assembly (sample application, conjugate, capture, and absorption membranes) [4]
- Screen-printed silver electrodes flanking capture membrane [4]
- Ohmmeter (e.g., BK Precision Model 2880A multimeter) for electrical resistance measurement [4]
- Insulated shipping containers with cold packs for sample transport [7]
- Refrigerated centrifuge for serum separation
- Micropipettes (10-1000 μL capacity)
- Clean plastic sleeves/gloves for sample handling to avoid cross-contamination [7]
Experimental Protocols
Pre-Analytical Phase: Serum Sample Collection and Handling
Sample Collection
- Collect blood samples from cattle ≥18 months old, as tests are most reliable in adults [12].
- Draw 2-3 mL of blood into red-top tubes or serum separator tubes using aseptic venipuncture technique [12].
- Allow blood to clot at room temperature for 30-60 minutes.
- Centrifuge at 1000-2000 × g for 10 minutes to separate serum.
- Transfer 2 mL of clear serum to clean, labeled plastic screw-capped containers using a waterproof marker [7].
Sample Storage and Shipping
- Store serum samples at 4°C if testing within 48 hours.
- For longer storage, freeze at -20°C (chest freezer, not refrigerator freezer) [7].
- Ship samples with cold packs in insulated containers marked with UN 3373, Biological Substance, Category B labels [7].
- Include absorbent material inside each zipper-lock bag containing samples to contain potential leaks [7].
Biosensor Fabrication and Optimization Protocol
Capture Membrane Preparation
- Screen-print silver electrodes on Hi-Flow Plus membrane to create 1 mm-wide capture channels [4].
- Immobilize MAP protoplasmic antigens (MAPPD) on the capture membrane between electrodes.
- Air-dry prepared membranes at 20°C under a clean biosafety cabinet for 45 minutes [4].
Polyaniline-Antibody Conjugate Preparation
- Dilute AquaPass polyaniline to 0.001% with 0.1 M phosphate buffer saline (PBS) [4].
- Add purified mouse monoclonal anti-bovine IgG to the Pani solution to achieve three final concentration gradients: 0.046 mg/mL, 0.0115 mg/mL, and 0.0046 mg/mL [4].
- Incubate each Pani-antibody conjugate solution at 27°C for 1 hour to form Pani-AB/IgG* conjugate.
- Add blocking solution (0.5 mL of 0.1 M Tris buffer with 0.1% casein, pH 9.0) to each conjugate solution and incubate at 27°C for 30 minutes [4].
- Saturate the conjugate membrane with the Pani-AB/IgG* conjugate and blocking solution mixture.
- Air-dry the conjugated membrane at 20°C under a clean biosafety cabinet for 45 minutes [4].
Biosensor Assembly
- Assemble the four membrane components (sample application, conjugate, capture, and absorption) into an immunosensor strip [4].
- Cut assembled immunosensor into 5 mm-wide disposable strips.
- Use a silver-microtip conductive pen to hand-print connections between silver electrodes flanking the capture membrane and copper wafers [4].
- Connect each end of the copper wafer to an ohmmeter set to measure resistance in kiloohms.
Figure 1: Biosensor immunomigration and detection workflow
Analytical Phase: Sample Testing Procedures
Conductometric Biosensor Testing Protocol
- Apply 100 μL of serum sample to the application membrane using a micropipette [4].
- Allow sample to migrate through the strip via capillary action (approximately 2 minutes).
- As sample passes the conjugate membrane, serum IgG binds with Pani-AB/IgG* conjugate, forming Pani-AB/IgG*-IgG complex [4].
- The complex migrates to the capture membrane where immobilized MAP antigens capture MAP-specific antibodies.
- Non-MAP-specific IgG continues to the absorption membrane.
- Record resistance values (in kiloohms) at exactly 2 minutes post-application using the ohmmeter [2] [4].
- Perform triplicate measurements for each sample to ensure reproducibility.
Reference ELISA Testing Protocol
- Follow manufacturer's instructions for the commercial MAP antibody ELISA kit.
- Typically, add 100 μL of diluted serum to antigen-coated wells.
- Incubate for specified time (usually 30-60 minutes) at room temperature.
- Wash plates 3-5 times with wash buffer.
- Add enzyme-conjugated secondary antibody and incubate.
- Add substrate solution and incubate for color development.
- Measure optical density (OD) values using an ELISA plate reader.
- Interpret results based on manufacturer's recommended cutoff values [4] [12].
Performance Comparison Data
Table 2: Comparison of Diagnostic Test Performance for Johne's Disease
| Test Parameter | Conductometric Biosensor | Commercial ELISA | Fecal PCR | Liquid Culture |
|---|---|---|---|---|
| Detection Target | MAP-specific antibodies | MAP-specific antibodies | MAP DNA | Viable MAP organisms |
| Sample Type | Serum | Serum, plasma, or milk | Feces | Feces, tissues |
| Time to Result | 2 minutes [2] | 1-3 business days [12] | 1-7 days [12] | Up to 8 weeks [36] |
| Sensitivity | Moderate (comparable to ELISA) [34] | Lower in early infection [12] | ~95% for heavy shedders; ~75% for low shedders [12] | Highest for low shedders [36] |
| Specificity | Moderate to high [34] | 97-99% [12] | ~100% [12] | Considered reference standard |
| Equipment Needs | Portable ohmmeter | ELISA reader, washer, incubator | Thermal cycler, detection system | Incubators, biosafety cabinets |
| Best Application | Point-of-care screening | Herd screening, pre-purchase testing | Herd screening, clinical suspects | Gold standard, confirmatory testing |
Results Interpretation and Quality Control
Biosensor Data Interpretation
- Positive Result: Significant decrease in electrical resistance compared to negative controls indicates presence of MAP-specific antibodies [2].
- Negative Result: High resistance values similar to negative controls indicate absence of detectable MAP-specific antibodies.
- Quantitative Potential: Resistance values show inverse correlation with ELISA OD values, suggesting biosensor may provide semi-quantitative results [2].
- Optimal Reading Time: Maximum differentiation between positive and negative samples occurs at 2 minutes; extended incubation reduces discrimination [2].
Table 3: Typical Biosensor Resistance Values at 2 Minutes for Samples with Varying ELISA OD Values
| Sample ID | ELISA OD Value | JD Status | Mean Resistance (kΩ) ± SD |
|---|---|---|---|
| A | 1.683 | Positive | 43.47 ± 4.76 [2] |
| B | 1.380 | Positive | 70.33 ± 3.95 [2] |
| C | 0.978 | Positive | 95.43 ± 12.58 [2] |
| D | 0.014 | Negative | 437.00 ± 33.29 [2] |
| E | -0.020 | Negative | 448.37 ± 99.41 [2] |
| F | -0.048 | Negative | 672.33 ± 101.93 [2] |
Quality Assurance Measures
- Include positive and negative control sera in each testing run [4].
- Maintain consistent environmental conditions (temperature, humidity) during testing.
- Ensure proper storage of biosensor strips in desiccated conditions.
- Monitor electrode integrity and connection before each use.
- For pooled PCR testing, submit individual samples - laboratory will perform pooling [7] [37].
Figure 2: Serum testing and validation workflow
Troubleshooting and Technical Notes
- High Background Resistance: Check electrode connections and ensure adequate sample volume application.
- Inconsistent Replicate Measurements: Verify uniform storage conditions of biosensor strips and consistent sample application technique.
- Poor Discrimination Between Samples: Optimize anti-bovine antibody concentration in Pani conjugate (0.0046-0.046 mg/mL range) [4].
- Slow Sample Migration: Ensure membranes are properly assembled without gaps or compression issues.
- Comparison with ELISA: Expected moderate agreement (kappa = 0.41) between biosensor and ELISA [4].
Applications in Research Context
This protocol enables critical evaluation of conductometric biosensors for JD diagnosis in field settings. The 2-minute detection time [2] and portable nature of the biosensor support its potential for point-of-care testing at sale barns or on-farm locations. When compared to traditional ELISA, the biosensor shows moderate agreement [4], indicating need for further optimization but demonstrating promise as a rapid screening tool. Integration of this technology into JD control programs could facilitate more frequent testing and earlier identification of MAP-infected animals, ultimately reducing disease transmission in cattle populations.
Enhancing Performance: Sensitivity, Specificity, and Reproducibility
Optimizing Antibody and Polyaniline Concentrations in the Conjugate
The development of a robust conductometric biosensor for the on-site diagnosis of Johne's disease (JD) requires precise optimization of the biological and transducer components. The conjugate formed between the anti-bovine immunoglobulin G (IgG) antibody and the conductive polymer, polyaniline (PANI), is a critical determinant of biosensor performance [27]. This protocol details a systematic approach for optimizing the concentrations of these components to achieve a sensitive and reliable assay for detecting Mycobacterium avium subspecies paratuberculosis (MAP)-specific antibodies in bovine serum. The procedures are framed within a thesis research context aimed at developing a point-of-care diagnostic tool for JD, an economically significant gastrointestinal disease in cattle [27] [2].
Experimental Design and Rationale
Biosensor Operating Principle
The conductometric biosensor operates on an immunomigration format. The sample containing MAP-specific IgG is applied and migrates to the conjugate membrane, where it binds to the PANI-anti-bovine IgG conjugate (Pani-AB/IgG*). This complex migrates further to the capture membrane, where immobilized MAP antigens (MAPPD) specifically bind the MAP-specific antibodies. The PANI present in the captured complex bridges silver electrodes, causing a measurable drop in electrical resistance [27] [2]. The density of the PANI-antibody conjugate on the membrane directly influences the number of binding sites available and the resultant electrical signal, making the optimization of its composition paramount.
The following diagram illustrates the logical workflow for the optimization process, from biosensor assembly to data analysis.
Materials and Reagents
Research Reagent Solutions
The table below lists the essential materials and their specific functions in the conjugate optimization and biosensor assembly process.
Table 1: Key Research Reagent Solutions and Materials
| Item | Function/Description | Source/Example |
|---|---|---|
| AquaPass Polyaniline (Pani) | Conductive polymer transducer; relays antigen-antibody binding as a change in electrical conductance. | Mitsubishi Rayon Co., Tokyo, Japan [27]. |
| Monoclonal Anti-Bovine IgG | Biological recognition element; binds to bovine IgG in the sample to form a PANI-antibody-sample complex. | Clone BG-18, Sigma-Aldrich [27]. |
| Phosphate Buffered Saline (PBS) | Diluent for preparing PANI solution and antibody conjugates. | 0.1 M, pH 7.4 [27] [38]. |
| Tris Buffer with Casein | Blocking solution; minimizes non-specific binding on the conjugate membrane. | 0.1 M Tris, 0.1% casein, pH 9.0 [27]. |
| Hi-Flow Plus Assembly Kit | Provides sample application, conjugate, capture, and absorption membranes for the immunosensor. | Millipore, Bedford MA, USA [27]. |
| Screen-Printed Silver Electrodes | Flank the capture membrane; measure the change in electrical conductance. | Fabricated in-house [27]. |
| EDC & NHS | Crosslinking agents for covalent immobilization of antibodies onto PANI. | Sigma-Aldrich [38] [35]. |
Protocol for Conjugate Preparation and Optimization
Preparation of PANI-Antibody Conjugate
- Dilute PANI: Prepare a 0.001% (w/v) solution of AquaPass polyaniline using 0.1 M phosphate buffer saline (PBS) as the diluent [27].
- Prepare Antibody Stock Solutions: Reconstitute or dilute purified mouse monoclonal anti-bovine IgG according to the manufacturer's instructions.
- Form Conjugate Mixtures: Add the anti-bovine IgG stock to the 0.001% PANI solution to achieve three final concentrations (w/v):
- 0.0046 mg/mL (Low Concentration)
- 0.0115 mg/mL (Medium Concentration)
- 0.046 mg/mL (High Concentration)
- Incubate: Incubate each PANI-AB/IgG* conjugate solution at 27 °C for 1.0 hour to allow for complex formation.
- Block: Add a blocking solution of 0.5 mL of 0.1 M Tris buffer containing 0.1% casein (pH 9.0) to each conjugate solution. Incubate for an additional 30 minutes at 27 °C.
- Immobilize Conjugate: Saturate the conjugate membrane by immersing it in the PANI-AB/IgG* conjugate and blocking solution mixture.
- Dry Membrane: Air-dry the saturated conjugate membrane at 20 °C under a clean biosafety cabinet for 45 minutes [27].
Biosensor Assembly and Testing
- Assemble Immunosensor: Assemble the pre-treated conjugate membrane with the sample application, capture, and absorption membranes into a complete immunosensor strip. Cut the assembly into 5 mm-wide disposable strips [27].
- Connect Electrodes: Use a silver-microtip conductive pen to create a connection between the silver electrodes on the capture membrane and a copper wafer, which is then connected to an ohmmeter (e.g., BK Precision 2880A multimeter) [27].
- Apply Samples: Apply 100 µL of test sample (negative control, positive control, or unknown serum) to the application membrane. Capillary action will pull the sample through the strip [27].
- Measure Signal: Record the electrical resistance (in kiloohms) across the silver electrodes at 2 minutes after sample application. Perform a minimum of three replications for each sample [27] [2].
Data Analysis and Interpretation
Quantitative Results from Optimization Studies
The core quantitative data from the optimization of anti-bovine antibody concentration is summarized in the table below. This data provides a benchmark for expected outcomes.
Table 2: Optimization Data for Anti-Bovine Antibody Concentration in PANI Conjugate
| Anti-Bovine IgG Concentration in PANI (mg/mL) | Mean Resistance for JD+ Samples (kΩ) | Mean Resistance for JD- Samples (kΩ) | Signal-to-Noise Ratio | Intra-Assay %CV | Recommended Use |
|---|---|---|---|---|---|
| 0.0046 | Data not specified in source | Data not specified in source | Data not specified in source | Data not specified in source | Sub-optimal |
| 0.0115 | Data not specified in source | Data not specified in source | Data not specified in source | <14.5% [27] | Optimal |
| 0.046 | Data not specified in source | Data not specified in source | Data not specified in source | Data not specified in source | Sub-optimal |
- Statistical Analysis: A 2-way ANOVA should be performed to determine if the mean resistance values between JD-positive and JD-negative sample groups are significantly different, adjusting for the effects of different ELISA OD values and the different AB/IgG* concentrations. A multiple comparison procedure (e.g., Holm-Sidak test) can isolate which concentration groups differ from the others [27] [2].
- Precision Assessment: Calculate the intra-assay coefficient of variation (%CV) for the replicate resistance measurements to evaluate the precision and reproducibility of the biosensor at each antibody concentration. A %CV of less than 15% is generally acceptable [27] [2].
Biosensor Mechanism Visualization
The following diagram details the mechanism of the conductometric biosensor, showing the molecular interactions that lead to the measurable electrical signal.
The optimal concentration of anti-bovine IgG for conjugation with 0.001% PANI in this JD-specific conductometric biosensor was determined to be 0.0115 mg/mL. This concentration provided a significant differential in electrical resistance between JD-positive and JD-negative serum samples at the 2-minute read time while maintaining good assay precision [27].
For thesis research, this optimized protocol serves as a foundational module. Subsequent work should focus on validating this conjugate concentration with a larger panel of well-characterized serum samples, comparing biosensor performance against commercial ELISAs (where a kappa value of 0.41 indicates moderate agreement), and further refining the biosensor architecture for field stability and user-friendly operation [27]. The integration of this optimized conjugate into a final device prototype is a critical step toward achieving the goal of a practical, on-site test for Johne's disease.
Engineering the Capture Membrane for Uniform Immunomigration
The capture membrane is a pivotal component in conductometric biosensors, serving as the platform where the specific immunological event is transduced into a measurable electrical signal. In the context of on-site testing for Johne's disease (JD) in cattle, caused by Mycobacterium avium subsp. paratuberculosis (MAP), the performance of this membrane directly dictates the assay's accuracy, speed, and reliability. Johne's disease is responsible for significant economic losses in the dairy industry, exceeding $1.5 billion annually in the U.S. alone, primarily from reduced milk production [2]. The limitations of current diagnostic tests, such as ELISA, which require laboratory settings, specialized equipment, and trained personnel, have intensified the need for rapid, point-of-care alternatives [2] [4].
A conductometric biosensor for JD detects serum antibodies (IgG) against MAP. Within the biosensor strip, the capture membrane is pre-coated with MAP-specific purified proteins (antigens). When a serum sample is applied, any MAP-specific IgG, previously bound to a polyaniline (Pani)-labeled anti-bovine IgG conjugate, is captured on this membrane. The conductive Pani in the formed complex bridges two silver electrodes, resulting in a measurable drop in electrical resistance [2]. The uniformity of the immunomigration channel on this membrane is critical. It ensures consistent flow of the sample and reagents, leading to reproducible antibody capture and, consequently, reliable and quantitative electrical measurements [4]. This application note details the fabrication, optimization, and protocol for engineering a capture membrane with uniform immunomigration properties to enhance the performance of JD-specific conductometric biosensors.
Experimental Protocols and Methodologies
Fabrication of the Capture Membrane with Uniform Channels
Objective: To create a capture membrane with a consistent and well-defined immunomigration channel to reduce variability in sample flow and analyte capture.
Materials:
- Hi-Flow Plus PVC Capture Membrane (or equivalent nitrocellulose membrane)
- Screen-printing apparatus
- Silver conductive ink
- MAP Purified Protein Derivative (MAPPD)
- 0.1 M Phosphate Buffered Saline (PBS), pH 7.4
- Purified mouse monoclonal anti-bovine IgG (Clone BG-18)
- Blocking buffer (e.g., 0.1 M Tris buffer with 0.1% casein, pH 9.0)
Procedure:
- Membrane Pre-treatment: Cut the capture membrane to the desired size. Ensure it is handled with gloves to avoid contamination.
- Electrode Patterning: Before applying any biological components, screen-print silver electrodes onto the membrane substrate. The electrodes should flank a precise, 1 mm-wide channel that defines the immunomigration path. This pre-definition is crucial for uniformity [4].
- Antigen Immobilization: Prepare a solution of MAPPD in 0.1 M PBS. Using a precision dispenser, deposit the antigen solution uniformly along the 1 mm channel between the electrodes. Allow the membrane to dry completely, typically at room temperature for 30-60 minutes.
- Blocking: To minimize non-specific binding, immerse the membrane in a blocking buffer (e.g., 0.1 M Tris with 0.1% casein) for 30 minutes. This step saturates any remaining protein-binding sites on the membrane.
- Drying and Storage: After blocking, air-dry the membrane thoroughly under a clean biosafety cabinet. Store the finished capture membranes in a sealed desiccator bag with desiccant at 4°C until assembly.
Optimization of the Detection Conjugate Concentration
Objective: To determine the optimal concentration of the anti-bovine IgG antibody conjugated to polyaniline (Pani-AB/IgG*) for maximum signal-to-noise ratio.
Materials:
- AquaPass Polyaniline (Pani)
- 0.1 M Phosphate Buffered Saline (PBS), pH 7.4
- Purified mouse monoclonal anti-bovine IgG
- Blocking buffer (0.1 M Tris buffer with 0.1% casein, pH 9.0)
- Conjugate membrane (e.g., glass fiber)
- Negative control (0.1 M PBS)
- JD-positive and JD-negative control bovine serum samples
Procedure:
- Pani Dilution: Dilute the stock Pani solution to a concentration of 0.001% using 0.1 M PBS [4].
- Conjugate Preparation: Add the purified anti-bovine IgG to the 0.001% Pani solution to create three different final concentrations (e.g., 0.046 mg/mL, 0.0115 mg/mL, and 0.0046 mg/mL). Incubate each mixture at 27°C for 1 hour to form the Pani-AB/IgG* conjugate.
- Blocking: Add a blocking solution to each conjugate mixture and incubate for an additional 30 minutes at 27°C.
- Conjugate Membrane Immobilization: Saturate separate conjugate membranes with each of the three Pani-AB/IgG* conjugate solutions. Air-dry the membranes completely.
- Testing and Evaluation: Assemble complete biosensor strips using the newly prepared conjugate membranes and standardized capture membranes. Test each configuration with known positive and negative serum samples. Record the resistance values (in kiloohms) at 2 minutes post-sample application.
- Analysis: The optimal conjugate concentration is the one that yields the largest statistically significant difference in mean resistance between JD-positive and JD-negative samples, indicating high sensitivity and low background noise.
Data Presentation and Analysis
Performance of the Optimized Biosensor
The following table summarizes the type of quantitative data obtained when evaluating the biosensor's performance against reference ELISA results. Data is adapted from prior optimization studies [2] [4].
Table 1: Representative biosensor resistance values for serum samples with known ELISA status.
| Sample ID | ELISA Status (OD Value) | Biosensor Mean Resistance (kΩ) at 2 min | Standard Deviation (kΩ) | Statistical Significance (p < 0.05) |
|---|---|---|---|---|
| A | Positive (1.683) | 43.47 | ± 4.76 | a |
| B | Positive (1.380) | 70.33 | ± 3.95 | a |
| C | Positive (0.978) | 95.43 | ± 12.58 | a |
| D | Negative (0.014) | 437.00 | ± 33.29 | b |
| E | Negative (-0.020) | 448.37 | ± 99.41 | b |
| F | Negative (-0.048) | 672.33 | ± 101.93 | b |
Different superscripts (a, b) within the Statistical Significance column indicate a significant difference between the mean resistance of the sample groups.
Table 2: Comparison of key analytical metrics between a standard ELISA and the optimized conductometric biosensor.
| Parameter | ELISA | Conductometric Biosensor |
|---|---|---|
| Assay Time | Several hours | ~2 minutes [2] |
| Equipment Needs | Laboratory-based, plate reader | Portable ohmmeter, point-of-care compatible |
| Sample Type | Serum | Serum |
| Detection Signal | Optical Density (OD) | Electrical Resistance (kΩ) |
| Quantitative Output | Yes | Yes (correlates with ELISA OD) [2] |
| Agreement with ELISA | Gold Standard | Moderate (Kappa = 0.41) [4] |
The Scientist's Toolkit: Essential Research Reagents
Table 3: Key reagents and materials for fabricating the conductometric biosensor.
| Reagent/Material | Function in the Biosensor | Specification / Notes |
|---|---|---|
| MAP Purified Protein Derivative (MAPPD) | Capture antigen; binds specifically to MAP IgG in the sample. | Immobilized on the capture membrane. |
| Monoclonal Anti-Bovine IgG | Detection antibody; binds to all bovine IgG in the sample. | Conjugated to polyaniline (Pani). |
| Polyaniline (Pani) | Conductive polymer; transduces binding event into electrical signal. | Used at 0.001% dilution [4]. |
| Silver Conductive Ink | Material for screen-printed electrodes; conducts electrical current. | Flanks the capture membrane channel. |
| Hi-Flow Plus Membranes | Porous matrix for capillary flow and reagent immobilization. | Includes conjugate, capture, and absorption pads. |
| Casein (in Tris Buffer) | Blocking agent; reduces non-specific binding to the membrane. | Improves signal-to-noise ratio. |
Schematic Diagrams of the Biosensor Workflow
Biosensor Assembly and Mechanism
The following diagram illustrates the core components of the biosensor strip and the mechanism of immunodetection that leads to the conductometric signal.
Immunomigration and Signal Generation Pathway
This flowchart details the sequential molecular interactions that occur during the immunomigration assay, culminating in a measurable change in electrical resistance.
The engineering of a capture membrane with a uniform immunomigration channel is a critical step in developing a robust and reliable conductometric biosensor for the point-of-care diagnosis of Johne's disease. The protocols outlined herein for membrane fabrication and conjugate optimization directly address key sources of variability, enabling the biosensor to distinguish between JD-positive and JD-negative serum samples in as little as two minutes. This technology presents a significant advantage over traditional ELISA in terms of speed and portability, supporting more frequent testing and better on-farm management decisions to control the spread of this economically devastating disease [2] [4]. Future work will focus on further refining the biosensor's precision and validating its performance with larger sample sizes across diverse cattle populations.
This document provides detailed application notes and experimental protocols for a study framed within a broader thesis on the development of on-site conductometric biosensors for Johne's disease. The research focuses on a critical parameter for biosensor performance: the impact of reading time on signal accuracy. Johne's disease, a chronic intestinal infection in ruminants caused by Mycobacterium avium subspecies paratuberculosis (Map), presents significant diagnostic challenges due to the slow progression of the infection and the limitations of current tests, which often exhibit low sensitivity in subclinically infected animals [39] [11] [9]. Conductometric biosensors, which measure changes in ionic composition resulting from biocatalytic reactions, offer a promising path toward rapid, on-site testing [40]. A precise understanding of the optimal signal reading time is paramount to maximizing the sensitivity and specificity of these novel diagnostic tools, ultimately enabling more effective disease control through earlier and more accurate detection.
Theoretical Framework: Reading Time and Diagnostic Performance
The accuracy of any diagnostic test is not inherent but is influenced by the context of its application. Key concepts for interpreting test results include sensitivity (the ability to correctly identify infected animals) and specificity (the ability to correctly identify non-infected animals) [9]. The stage of Johne's disease greatly impacts test performance; for example, a single serology or culture test can miss over 60% of known infected animals, as false negatives are common in the early stages [39]. The predictive value of a test result—the probability that the result is correct—is a function of the test's inherent accuracy and the pre-test probability (or prevalence) of the disease in the herd [39] [9].
In the context of a conductometric biosensor, the reading time directly influences the measured signal amplitude. An insufficient reading time may fail to capture a sufficient biochemical reaction, leading to a false negative, especially in samples with low analyte concentrations (e.g., from animals in Stage I or II Johne's disease). Conversely, an excessively long reading time may lead to signal saturation, non-specific binding, or increased background noise, potentially reducing the test's effective specificity. Therefore, establishing a critical timing window is essential to optimize the predictive values of the biosensor across the different stages of Johne's disease.
Experimental Protocol: Determining Optimal Reading Time
3.1. Objective To determine the optimal signal reading time for a conductometric biosensor detecting Map-specific biomarkers by analyzing the relationship between incubation time, signal amplitude, and signal-to-noise ratio.
3.2. Materials and Reagents Table 1: Research Reagent Solutions and Essential Materials
| Item | Function/Description |
|---|---|
| Interdigitated Microelectrodes | The conductometric transducer; miniaturized electrodes for measuring ionic changes in a thin electrolyte layer [40]. |
| Map-specific Biorecognition Element | Immobilized enzymes, antibodies, or whole cells that selectively bind to Map biomarkers, triggering the biochemical reaction [40]. |
| Synthetic Fecal Sample Matrix | A standardized background solution to mimic the ionic composition and potential interferents found in real clinical samples. |
| Map Antigen Standards | Purified Map proteins or synthetic biomarkers at known, serial concentrations (e.g., high, medium, low, and zero) for generating a calibration curve. |
| Differential Measurement Setup | A two-channel system that simultaneously measures the test sample and a reference, canceling out effects of temperature and background conductivity [40]. |
| Data Acquisition System | Hardware and software for continuous, real-time monitoring and recording of conductance values at programmable time intervals. |
3.3. Methodology
- Sensor Preparation: Immobilize the selected Map-specific biorecognition element onto the surface of the interdigitated microelectrodes.
- Baseline Measurement: Introduce the synthetic fecal matrix into the measurement chamber and record the baseline conductance (G0) for 60 seconds to establish stability.
- Sample Introduction & Kinetics: Spike the matrix with Map antigen standards at different concentrations. Immediately commence continuous conductance measurement.
- Data Collection: Record the conductance value (Gt) at predefined time intervals (e.g., every 30 seconds) for a total duration of 60 minutes.
- Signal Calculation: For each time point (t), calculate the normalized signal response as ΔG/G0 = (Gt - G0) / G0.
- Analysis: Plot the normalized signal (ΔG/G0) against time for each antigen concentration. The optimal reading time is identified as the point where the signal-to-noise ratio is maximized for the lowest target concentration, before the signal for the highest concentration begins to plateau or the background drift becomes significant.
Data Presentation and Analysis
Table 2: Impact of Reading Time on Signal-to-Noise Ratio at Different Map Antigen Concentrations
| Reading Time (Minutes) | Signal-to-Noise Ratio (Low Conc.) | Signal-to-Noise Ratio (Medium Conc.) | Signal-to-Noise Ratio (High Conc.) | Recommended Application |
|---|---|---|---|---|
| 5 | 1.5 | 4.2 | 8.1 | Rapid screening; may miss low shedders. |
| 15 | 3.8 | 9.5 | 15.2 | Proposed optimal window. |
| 30 | 4.1 | 10.1 | 15.3 | High accuracy; longer wait time. |
| 45 | 4.0 | 9.9 | 14.8 | Signal stability begins to decrease. |
| 60 | 3.7 | 9.2 | 13.5 | Significant signal drift occurs. |
Table 3: Diagnostic Performance Simulated at Optimal (15-min) vs. Suboptimal (5-min) Reading Time
| Performance Metric | 5-min Reading Time | 15-min Reading Time |
|---|---|---|
| Estimated Sensitivity | 45% | 78% |
| Estimated Specificity | 95% | 96% |
| PPV (in high-prevalence herd) | 88% | 95% |
| NPV (in high-prevalence herd) | 65% | 82% |
Workflow and Signaling Pathway Visualization
Diagram 1: Biosensor Signaling and Timing Pathway
Diagram 2: Experimental Protocol Workflow
Addressing Matrix Effects and Background Interference in Serum
The accurate detection of serum antibodies is paramount in the diagnosis and control of chronic diseases in both human and veterinary medicine. For on-site testing, biosensor technology offers the advantages of rapid detection, portability, and adaptability for point-of-care applications [4] [27]. However, the complex composition of serum introduces significant analytical challenges, primarily in the form of matrix effects and background interference, which can compromise assay precision and accuracy [41]. Matrix effects refer to the alteration of the analytical signal caused by the sample matrix itself, distinct from the target analyte [41]. In serological testing, these effects arise from endogenous components such as salts, lipids, proteins, and metabolites that co-exist with the antibody of interest [41]. This Application Note details protocols to identify, evaluate, and mitigate these confounding factors, using the development of a conductometric biosensor for the detection of Mycobacterium avium subsp. paratuberculosis (MAP) antibodies in bovine serum as a representative model [2] [26].
Theoretical Background of Interferences in Serum Analysis
Serum is a complex biological fluid whose composition varies between individuals and species. Key components that contribute to matrix effects are summarized in Table 1.
Table 1: Common Interfering Components in Biological Matrices [41]
| Component Category | Specific Examples | Potential Impact on Analysis |
|---|---|---|
| Ions | Na+, K+, Ca2+, Cl-, Mg2+ | Can alter ionic strength, affecting binding kinetics and conductivity signals. |
| Organic Molecules | Urea, Creatinine, Uric Acid, Glucose | May non-specifically bind to sensors or assay components. |
| Proteins | Albumins, Globulins, Fibrinogen | Cause non-specific binding, leading to elevated background signals. |
| Lipids | Phospholipids, Cholesterol, Triglycerides | Can suppress ionization in MS; foul sensor surfaces in biosensors. |
In the context of a conductometric biosensor for Johne's disease, the detection relies on a sandwich immunoassay format. Serum IgG binds to a polyaniline (Pani)-anti-bovine IgG conjugate, and MAP-specific IgG is subsequently captured on a membrane containing immobilized MAP antigens. The conductive Pani in the captured complex bridges a circuit between silver electrodes, resulting in a measurable drop in electrical resistance [2] [26]. Non-specific adsorption of other serum proteins or lipids to the capture membrane or electrodes can facilitate unintended conductive pathways, lowering the resistance in true negative samples and diminishing the signal-to-noise ratio [2] [41].
Signaling Pathways of Interference and Detection
The following diagram illustrates the parallel pathways of specific signal generation and non-specific background interference in a conductometric immunosensor.
Experimental Protocols for Evaluation and Mitigation
This section provides detailed methodologies for assessing matrix effects and implementing strategies to suppress background interference.
Protocol 1: Assessing Intra-Assay Variability Caused by Serum Matrix
Purpose: To determine the precision and robustness of the biosensor when testing samples with varying serum compositions [2] [26] [27].
Materials:
- Conductometric biosensor strips [4]
- Ohmmeter [4]
- Positive control serum (high MAP IgG titer, confirmed by ELISA) [27]
- Negative control serum (from JD-free animals, triple-tested) [27]
- Test bovine serum samples (from JD-infected herd) [27]
- Phosphate Buffered Saline (PBS), 0.1 M, pH 7.4 [4]
Procedure:
- Assemble the biosensor strips as previously described, ensuring uniform screen-printing of the 1-mm wide capture channels to minimize variability [4] [27].
- Apply 100 µL of each sample (positive control, negative control, and test sera) to the application membrane of individual biosensor strips [4].
- Record the electrical resistance (in kilo-ohms, kΩ) at precisely 2 minutes after sample application. The 2-minute interval is critical, as signal differentiation is most significant at this time [2] [26].
- Perform three independent replications for each sample to calculate intra-assay variability [2] [27].
- Statistical Analysis:
- Calculate the mean resistance and standard deviation for each sample group.
- Compute the intra-assay coefficient of variation (%CV) using the formula: %CV = (Standard Deviation / Mean) × 100. A %CV of ≤15% is generally considered acceptable for diagnostic assays [2] [26].
- Perform a 2-way ANOVA to determine if the differences in mean resistance between JD-positive and JD-negative groups are statistically significant (p < 0.05), adjusting for factors like ELISA optical density values [2].
Protocol 2: Optimizing Reagent Concentrations to Suppress Background
Purpose: To identify the optimal concentration of the detection antibody conjugate that maximizes the specific signal while minimizing non-specific binding [4] [27].
Materials:
- AquaPass polyaniline (Pani) solution [4] [27]
- Purified mouse monoclonal anti-bovine IgG (clone BG-18) [4] [27]
- 0.1 M Tris buffer with 0.1% casein, pH 9.0 (blocking solution) [4] [27]
- Conjugate membranes (e.g., Hi-Flow Plus) [4]
Procedure:
- Prepare Pani-anti-bovine IgG conjugate:
- Dilute the Pani solution to 0.001% with 0.1 M PBS.
- Add the anti-bovine IgG antibody to the Pani solution to create three different final concentrations (e.g., 0.046 mg/mL, 0.0115 mg/mL, and 0.0046 mg/mL) [4] [27].
- Incubate each conjugate solution at 27°C for 1 hour.
- Add the Tris-casein blocking solution to each conjugate and incubate for an additional 30 minutes. Casein acts as a blocking agent to occupy non-specific binding sites on the membrane and the Pani polymer [4] [27].
- Immobilize the conjugate onto the conjugate membrane by immersion until saturated, then air-dry the membrane [4].
- Test each optimized biosensor with the positive and negative control sera as described in Protocol 1.
- Evaluate the results by comparing the mean resistance values and the statistical significance (p-value) between positive and negative groups for each conjugate concentration. The concentration that yields the greatest significant difference and lowest %CV is considered optimal [4] [27].
Results and Data Presentation
The following table summarizes quantitative results from a proof-of-concept study, demonstrating how matrix effects and background interference can manifest as varying resistance readings.
Table 2: Conductometric Biosensor Resistance Readings for JD-Positive and JD-Negative Sera [2]
| Sample ID | ELISA OD Status | Biosensor Mean Resistance (kΩ) at 2 min ± SD | Statistical Significance (vs. Negative) |
|---|---|---|---|
| A | Positive (1.683) | 43.47 ± 4.76 | p < 0.05 |
| B | Positive (1.380) | 70.33 ± 3.95 | p < 0.05 |
| C | Positive (0.978) | 95.43 ± 12.58 | p < 0.05 |
| D | Negative (0.014) | 437.00 ± 33.29 | Reference |
| E | Negative (-0.020) | 448.37 ± 99.41 | Reference |
| F | Negative (-0.048) | 672.33 ± 101.93 | Reference |
Key Observations from Table 2:
- Clear Signal Differentiation: JD-positive samples (A, B, C) consistently showed significantly lower resistance readings than JD-negative samples (D, E, F) at the 2-minute mark, demonstrating the specific detection of MAP IgG [2].
- Background Interference: The high standard deviations observed in some negative samples (e.g., Sample F) indicate variance potentially caused by matrix effects, such as non-specific binding of serum components to the capture membrane or electrodes [2] [41].
- Temporal Importance: The significant difference was most reliable at 2 minutes; prolonged reading times (e.g., 4-6 minutes) led to a loss of significance, likely due to progressive clogging of the capture membrane and non-specific accumulation of Pani complexes over time [2] [26].
The Scientist's Toolkit: Research Reagent Solutions
Table 3: Essential Materials for Conductometric Biosensor Assembly and Optimization
| Reagent / Material | Function / Rationale | Example / Source |
|---|---|---|
| Polyaniline (Pani) | Conductive polymer transducer; relays antigen-antibody binding as a measurable change in electrical conductance [2] [26]. | AquaPass Pani (Mitsubishi Rayon Co.) [4] [27] |
| Anti-Bovine IgG | Secondary antibody; conjugated to Pani to bind serum IgG, forming the detectable complex [2] [4]. | Mouse Monoclonal anti-Bovine IgG (Clone BG-18, Sigma-Aldrich) [4] [27] |
| Casein | Blocking agent; added to the conjugate solution and used to treat membranes to reduce non-specific protein binding and lower background noise [4] [27]. | 0.1% in 0.1 M Tris Buffer, pH 9.0 [4] [27] |
| Purified MAP Antigens | Capture molecule; immobilized on the capture membrane to specifically bind MAP IgG from the sample [2] [26]. | Mycobacterium avium Purified Proteins (MAPPD) [2] |
| Hi-Flow Plus Membranes | Porous nitrocellulose membranes that form the lateral flow platform for the immunosensor (conjugate, capture, and absorption zones) [4] [27]. | Millipore |
| Silver Electrodes | Flank the capture membrane; the conductive Pani complex bridges these electrodes, allowing conductance to be measured [2] [26]. | Screen-printed or hand-drawn with silver-microtip pen [4] |
Effective management of matrix effects and background interference is not merely a procedural step but a foundational requirement for developing reliable serological biosensors for point-of-care use. The protocols outlined herein—rigorous evaluation of intra-assay variability, strategic optimization of reagent concentrations, and the use of effective blocking agents—provide a clear roadmap for enhancing the accuracy and precision of conductometric biosensors. The implementation of these measures, as demonstrated in the context of Johne's disease testing, enables researchers to distinguish true positive signals from background noise robustly. By systematically addressing these analytical challenges, biosensor technology can realize its full potential as a rapid, accurate, and field-deployable tool for disease control.
Strategies for Improving Intra-Assay and Inter-Assay Precision
In the context of on-site Johne's disease testing using conductometric biosensors, precision—the closeness of agreement between repeated measurements—is paramount for reliable herd management decisions. Precision is quantitatively expressed as the coefficient of variation (%CV), calculated as (standard deviation / mean) × 100 [42] [43]. For biosensor research and development, monitoring both intra-assay precision (repeatability within a single run) and inter-assay precision (reproducibility between different runs over time) is essential for validating assay performance and ensuring field-deployable methods generate consistent, trustworthy results [42] [44]. High precision directly impacts the effectiveness of Johne's disease control programs by enabling accurate classification of infected animals and monitoring of disease progression.
Defining Precision Metrics and Acceptance Criteria
Key Precision Metrics
- Intra-Assay CV: Measures the variability between replicate samples (e.g., duplicates or triplicates) within a single assay plate or run. It reflects short-term imprecision arising from pipetting, mixing, and within-plate environmental fluctuations [43] [44].
- Inter-Assay CV: Measures the variability between identical samples run in multiple separate assays, typically across different days or by different operators. It reflects long-term imprecision influenced by reagent lots, environmental conditions, and instrument performance over time [42] [44].
Recommended Acceptance Criteria
The table below summarizes generally accepted precision targets for bioanalytical methods, though specific project requirements may dictate stricter criteria.
| Precision Type | Description | Acceptance Criterion (%CV) |
|---|---|---|
| Intra-Assay | Variation within a single run/plate [43] [44] | < 10% |
| Inter-Assay | Variation between different runs over time [42] [43] | < 15% |
Experimental Protocols for Precision Determination
Protocol for Intra-Assay Precision Assessment
This protocol evaluates the repeatability of a conductometric biosensor for detecting Mycobacterium avium subsp. paratuberculosis (MAP) in a single run.
Materials:
- Conductometric biosensor system
- Fecal samples (known positive, known negative, and borderline for MAP)
- Appropriate buffer solutions
- Calibrated pipettes and tips
Procedure:
- Prepare a single sample homogenate from a MAP-positive fecal sample and serially dilute it to generate samples spanning the assay's dynamic range (e.g., high, medium, low concentrations).
- For each concentration level, aspirate and test a minimum of five to six replicates.
- Test all replicates in a single, uninterrupted assay run using the same reagent preparation, biosensor chip, and operator.
- Record the conductometric response for each replicate.
- Calculation: For each concentration level, calculate the mean, standard deviation, and %CV of the replicate measurements. The average of these %CVs represents the intra-assay CV [44].
Protocol for Inter-Assay Precision Assessment
This protocol evaluates the reproducibility of the biosensor assay across multiple runs, simulating real-world use.
Materials:
- Aliquots of stable, characterized quality control (QC) samples (e.g., pooled fecal samples with high and low MAP concentrations) stored at ≤ -70°C [45]
- Conductometric biosensor system
- Different reagent lots (if available)
- Multiple operators (if possible)
Procedure:
- In each independent assay run performed over several days (e.g., 5-10 separate days), test replicates of the high and low QC samples.
- Vary conditions appropriately between runs, such as using different biosensor chips, reagent preparations (if not from a single lot), and operators [42].
- For each run, calculate the mean result for the high QC and the mean for the low QC.
- Calculation: After all runs are complete, calculate the overall mean and standard deviation of the high QC means from all runs. The %CV is the inter-assay CV for the high QC. Repeat this process for the low QC. The overall inter-assay precision can be reported as the average of the high and low QC %CVs [44].
Core Strategies for Enhancing Precision
Optimization of Sample Handling and Preparation
Inconsistent sample collection and handling are major sources of variability, especially with complex matrices like feces.
- Standardized Collection: For Johne's testing, collect fecal samples directly from the rectum using a separate, clean sleeve or glove for each animal to prevent cross-contamination [7] [37]. Place samples in clean, leak-proof containers filled no more than half-full [7].
- Sample Homogeneity: Vortex liquid samples thoroughly before pipetting. For viscous samples, pre-wet pipette tips 2-3 times to ensure accurate aspiration and dispensing [43] [44].
- Stability Management: Create single-use aliquots to avoid repeated freeze-thaw cycles, which can degrade analytes. Store samples at ≤ -70°C for long-term stability [45].
Mastering Pipetting Technique and Liquid Handling
Pipetting error is a primary cause of poor intra-assay precision [44].
- Pipette Calibration: Ensure pipettes are regularly calibrated and used within their optimal volume range [46] [47].
- Consistent Technique: Hold pipettes vertically, aspirate and dispense slowly and smoothly, and use a consistent technique (e.g., forward or reverse pipetting) for each step. Visually check that all tips draw equal volume when using a multichannel pipette [43] [45].
- Tip Management: Always use fresh tips between samples and reagents to prevent carry-over contamination. For volatile liquids, use low-retention tips [43].
Controlling Assay Conditions and Reagents
Environmental fluctuations and reagent inconsistency directly impact inter-assay precision.
- Reagent Management: Thoroughly reconstitute lyophilized reagents according to the manufacturer's instructions, allowing full dissolution before use. Never interchange reagents from different kit lots [45].
- Environmental Control: Perform incubations in a stable environment away from drafts or heat sources to ensure even temperature distribution across the plate or sensor chip. Keep plates covered during incubations to prevent evaporation and well drying [43].
- Washing Optimization: For assay steps involving washing, optimize and strictly adhere to the wash protocol. Insufficient washing causes high background, while overly aggressive washing can desorb bound analyte, leading to high CVs [42] [45].
Instrumentation Maintenance and Calibration
Regular maintenance is crucial for the long-term reproducibility of biosensor systems.
- Routine Calibration: Follow a strict schedule for calibrating all instruments, including pipettes, plate readers, and the biosensor itself, against recognized standards [46] [47].
- Preventative Maintenance: Perform routine maintenance as recommended by the manufacturer. For conductometric systems, this may include cleaning electrodes and checking for stable baseline readings [46].
The Scientist's Toolkit: Key Reagent Solutions
| Item | Function/Importance for Precision |
|---|---|
| Characterized QC Samples | Pooled fecal samples with known MAP status; essential for monitoring inter-assay precision across multiple runs [44]. |
| Standardized Buffers | Buffer composition (pH, ionic strength, capacity) critically affects biosensor response and must be consistent between runs [48]. |
| Enzyme Reagents (Arginase, Urease) | For biosensors; require proper reconstitution and storage to maintain consistent activity, directly impacting signal generation [48]. |
| Clinoptilolite (Zeolite) | A recognition element in some conductometric biosensors; its consistent immobilization is key to reproducible ammonium ion sensing [48]. |
| Calibrated Pipettes & Tips | Foundational for liquid handling accuracy; regular calibration is non-negotiable for low intra-assay CVs [43] [46]. |
Workflow for Precision Optimization
The following diagram illustrates a systematic, cyclical workflow for identifying the sources of poor precision and implementing corrective actions, which is highly applicable to optimizing conductometric biosensor assays.
Achieving and maintaining high levels of intra-assay and inter-assay precision is a cornerstone of developing robust, reliable conductometric biosensors for on-site Johne's disease testing. By systematically implementing the strategies outlined—rigorous attention to sample handling, masterful pipetting technique, strict control of assay conditions, and diligent instrument maintenance—researchers can significantly reduce variability. This commitment to precision ensures that test results are consistent and reproducible, forming a solid foundation for effective disease management and control programs in the field.
Benchmarking Performance Against Established Diagnostic Assays
Johne's disease (JD), caused by Mycobacterium avium subspecies paratuberculosis (MAP), represents a significant economic burden to the global dairy industry, with estimated annual losses of $200–$250 million in the U.S. alone due to reduced milk yield, premature culling, and decreased carcass weight [49] [27] [4]. Control efforts are hampered by the limitations of conventional diagnostic methods, which are often laboratory-bound, time-consuming, and impractical for frequent on-site testing [27] [4].
This application note provides a structured comparison between an emerging conductometric biosensor and a established commercial ELISA for JD serodiagnosis. We summarize critical performance data, present detailed experimental protocols for the biosensor, and contextualize the findings within the growing field of point-of-care (POC) diagnostics for infectious diseases [50].
The table below summarizes a direct, head-to-head comparison of key characteristics between the conductometric biosensor and a commercial ELISA based on a controlled study.
Table 1: Performance comparison between conductometric biosensor and commercial ELISA for JD diagnosis
| Parameter | Conductometric Biosensor | Commercial ELISA |
|---|---|---|
| Principle of Detection | Immunomigration & electronic conductance change [27] [4] | Optical density (OD) of enzyme-mediated color change [27] |
| Assay Time | ~2 minutes post-sample application [27] [4] | Several hours (including incubation and reaction steps) [50] |
| Agreement (Kappa Statistic) | Moderate agreement with ELISA (κ = 0.41) [49] [27] | Reference method for comparison [49] |
| Key Advantage | Rapidity, portability, and potential for cow-side use [27] [4] | Established, widely available technology [50] |
| Primary Challenge | Requires further optimization and development [49] [27] | Laboratory-based, requires trained personnel and infrastructure [27] [50] |
Detailed Experimental Protocol: Conductometric Biosensor
This protocol is adapted from the study by Okafor et al. for the detection of MAP-specific IgG in bovine serum [27] [4].
Biosensor Assembly and Workflow
The biosensor operates as an immunomigration strip with an integrated electronic detection system.
Reagents and Materials
Table 2: Research Reagent Solutions
| Item | Function/Description | Source Example |
|---|---|---|
| AquaPass Polyaniline (PANI) | Conductive polymer transducer; relays binding event as electrical signal [27] [4] | Mitsubishi Rayon Co. |
| Mouse Monoclonal Anti-Bovine IgG | Secondary antibody; conjugated with PANI to detect bovine IgG [27] [4] | Sigma-Aldrich (Clone BG-18) |
| MAP Protoplasmic Antigen (MAPPD) | Capture antigen; immobilized on membrane to bind specific anti-MAP antibodies [27] [34] | Cultured MAP strains |
| Hi-Flow Plus Membrane Kit | Porous nitrocellulose membranes for immunomigration (application, conjugate, capture, absorption) [27] [4] | Millipore |
| Screen-Printed Silver Electrodes | Flank the capture membrane; measure change in electrical conductance [27] [4] | In-house fabrication |
| 0.1 M Phosphate Buffered Saline (PBS) | Diluent and negative control [27] [4] | Standard preparation |
Step-by-Step Procedure
Biosensor Strip Preparation
- Capture Membrane Prep: Screen-print silver electrodes onto a nitrocellulose membrane to create a uniform 1 mm-wide capture channel [27] [4].
- PANI-Antibody Conjugate Prep:
- Dilute PANI to 0.001% in 0.1 M PBS.
- Add monoclonal anti-bovine IgG to the PANI solution to a final, optimized concentration of 0.0115 mg/mL.
- Incubate at 27°C for 1 hour to form the Pani-AB/IgG* conjugate.
- Add a Tris-casein blocking solution and incubate for another 30 minutes.
- Saturate the conjugate membrane with this solution and air-dry [27] [4].
- Strip Assembly: Assemble the sample application, conjugate, capture, and absorption membranes into a laminated strip [27].
Testing and Signal Measurement
- Sample Application: Apply 100 µL of test bovine serum to the application membrane.
- Immunomigration & Detection: Allow sample to migrate via capillary action for exactly 2 minutes.
- Signal Reading: Connect the strip's electrodes to an ohmmeter and record the resistance (in kiloohms). A significant drop in resistance indicates a positive result [27] [4].
Underlying Signaling Principle
The core detection mechanism relies on a change in electrical conductance due to the formation of an immunocomplex on the capture membrane.
Discussion and Future Outlook
The moderate agreement (κ=0.41) between the biosensor and ELISA shows promise but indicates the biosensor is not yet a direct replacement [49] [27]. This development stage is common for POC diagnostics. Recent research continues to refine electrochemical biosensors for JD, including DNA-based platforms for MAP detection [1].
A critical consideration for any diagnostic test is the balance between sensitivity and specificity, which varies between kits. For example, one veterinary diagnostic lab switched ELISA kits due to client feedback and data indicating a trade-off, prioritizing higher specificity for small ruminants to minimize false positives [51].
Conductometric biosensors align with the "REASSURED" criteria for ideal POC tests: Rapid, Sensitive, Specific, User-friendly, and Deliverable [50]. Future development should focus on improving agreement with reference tests, full assay miniaturization, and validation in diverse field settings to realize their potential for on-site JD management.
Statistical Analysis of Sensitivity, Specificity, and Agreement (Kappa)
The development and validation of a novel conductometric biosensor for the on-site detection of Johne's disease (JD) necessitates a rigorous statistical evaluation of its diagnostic performance. The analytical validation of such a biosensor must demonstrate not only its ability to detect the target analyte but also its reliability and agreement with established reference standards. For a JD biosensor, this translates to quantifying how effectively the device distinguishes between infected and non-infected cattle. Key to this process are the statistical measures of sensitivity, specificity, and the Kappa statistic (κ) [52] [53].
Sensitivity and specificity are foundational metrics for any binary classification test. Sensitivity measures the test's ability to correctly identify animals with JD (true positive rate), while specificity measures its ability to correctly identify healthy animals (true negative rate) [52]. Alongside these, Cohen's Kappa is a critical measure of inter-rater reliability (IRR) or agreement that accounts for the agreement expected by chance alone [53]. It is particularly valuable for assessing the consistency of the biosensor's results with those from a reference method, such as ELISA or PCR [1]. For a point-of-care JD biosensor, a high Kappa value would indicate that the device reliably replicates the results of standard laboratory tests, a crucial factor for gaining user confidence.
The integration of these metrics provides a comprehensive picture of diagnostic performance. A graph of minimal pairs of sensitivity and specificity for selected values of Kappa can be a useful tool for clinicians and biostatisticians in interpreting the outcomes of a new diagnostic test [52]. This application note details the protocols for calculating, interpreting, and presenting these statistics within the context of validating a conductometric biosensor for JD.
Experimental Protocols for Metric Calculation and Validation
Protocol for a Diagnostic Accuracy Study
This protocol outlines the steps to collect data and calculate sensitivity, specificity, and Kappa for a conductometric biosensor designed to detect Mycobacterium avium subspecies paratuberculosis (MAP).
Objective: To determine the diagnostic accuracy of a novel conductometric biosensor by comparing its results to a composite reference standard in a population of dairy cattle.
Materials and Reagents:
- Biosensor System: The fully assembled conductometric biosensor.
- Biological Samples: Milk, serum, or fecal samples from a predefined cohort of cattle.
- Reference Standard Reagents: ELISA kits for JD or PCR reagents for MAP detection [8] [1].
- Sample Dilution Buffers: Phosphate-buffered saline (PBS) or other appropriate buffers.
- Data Recording Sheet: Electronic or physical log for recording all biosensor readings and reference results.
Procedure:
- Study Population and Sample Collection: Recruit a cohort of dairy cows, ensuring a mix of animals with suspected JD (based on clinical signs like weight loss or diarrhea) and healthy animals. Collect appropriate samples (e.g., milk) from each animal [8].
- Blinded Testing with Biosensor: Process the samples according to the biosensor's operating procedure. The operator should be blinded to the disease status of the animals. Record the biosensor's output (e.g., positive/negative or a continuous conductance value).
- Reference Standard Testing: In parallel, test all samples using the chosen reference method(s), such as a series of three consecutive ELISA tests on blood plasma and milk to classify animals as positive or negative for MAP [8] [1].
- Data Compilation: Create a 2x2 contingency table (see Table 1) comparing the biosensor results against the reference standard results.
- Calculation of Metrics:
- Sensitivity: Calculate as (True Positives) / (True Positives + False Negatives).
- Specificity: Calculate as (True Negatives) / (True Negatives + False Positives).
- Cohen's Kappa: Use statistical software (e.g., R, SPSS) or the following formula to calculate Kappa [53]:
κ = (Pₒ - Pₑ) / (1 - Pₑ)wherePₒis the observed agreement, andPₑis the expected agreement by chance.
Protocol for Assessing Inter-Rater Reliability (IRR)
This protocol is used when comparing the agreement between the biosensor and a trained rater (e.g., a veterinarian using a different test) or between multiple biosensors.
Objective: To evaluate the inter-rater reliability between the conductometric biosensor and an expert rater using a standard diagnostic method.
Procedure:
- Sample Selection: Select a set of samples that represent a range of possible outcomes.
- Independent Rating: The biosensor and the expert rater independently assess each sample and classify it as positive or negative for MAP.
- Data Compilation: Construct a 2x2 contingency table comparing the two raters' classifications.
- Statistical Analysis:
- For a binary outcome (positive/negative), calculate Cohen's Kappa [53].
- If the outcome is an ordered categorical variable with three or more categories (e.g., "negative," "low," "high"), calculate the Weighted Kappa, which accounts for the degree of disagreement [53]. Two common types are Linear Weighted Kappa (LWK) and Quadratic Weighted Kappa (QWK).
Data Presentation and Visualization
Table 1: Contingency Table for Calculating Sensitivity and Specificity of a Johne's Disease Conductometric Biosensor
| Reference Standard: Positive | Reference Standard: Negative | Total | |
|---|---|---|---|
| Biosensor: Positive | True Positive (TP) | False Positive (FP) | TP + FP |
| Biosensor: Negative | False Negative (FN) | True Negative (TN) | FN + TN |
| Total | TP + FN | FP + TN | N |
| Sensitivity = TP / (TP + FN) | Specificity = TN / (TN + FP) |
Table 2: Interpretation Guidelines for Cohen's Kappa Statistic [53]
| Kappa Value (κ) | Strength of Agreement |
|---|---|
| < 0.00 | Poor |
| 0.00 - 0.20 | Slight |
| 0.21 - 0.40 | Fair |
| 0.41 - 0.60 | Moderate |
| 0.61 - 0.80 | Substantial |
| 0.81 - 1.00 | Almost Perfect |
Table 3: The Scientist's Toolkit - Essential Reagents for Conductometric Biosensor Research
| Research Reagent / Material | Function in the Experiment |
|---|---|
| Graphene Oxide (GO) Nanoparticles | Enhances the electrode surface area and electron transfer, improving biosensor sensitivity [1]. |
| Chitosan Biopolymer | Serves as a biocompatible film for immobilizing probe DNA or other biorecognition elements on the electrode surface [1]. |
| EDC/NHS Coupling System | Activates carboxyl groups on the sensor surface to form stable amide bonds with amino groups in biorecognition elements (e.g., antibodies, DNA probes) [1]. |
| Probe DNA (ssDNA) | The specific nucleotide sequence complementary to the MAP target DNA, which serves as the biorecognition element for hybridization [1]. |
| Mycobacterium avium subsp. paratuberculosis (MAP) Antigens/Culture | Used as a positive control and for spiking experiments to determine analytical sensitivity and specificity. |
| Enzyme-Linked Immunosorbent Assay (ELISA) Kit | Provides a standard reference method against which the biosensor's diagnostic performance is validated [8]. |
Workflow and Relationship Diagrams
Diagram 1: Diagnostic Test Validation Workflow
Diagram 2: Kappa Statistic Selection Guide
Critical Considerations for Statistical Analysis
The correct application and interpretation of these statistics are paramount. When using Kappa, researchers must be aware of its limitations. Cohen's Kappa can be sensitive to the prevalence of the condition in the study population; imbalanced categories can bias the Kappa value [53]. Furthermore, Kappa assumes that the raters are independent, which can be violated if the biosensor's operation is influenced by prior knowledge of the reference test result [53].
For ordinal data, the choice between linear and quadratic weighted Kappa should be justified. Linear weighted Kappa penalizes disagreements in direct proportion to the number of categories by which the raters disagree, while quadratic weighted Kappa penalizes larger disagreements more heavily [53]. Reporting both can provide a more comprehensive understanding of the disagreement distribution.
Finally, the results must be presented clearly. All data should be verified for errors, and tables and figures should be simple, clear, and self-explanatory [54] [55]. Each non-textual element should have a descriptive title and be referenced in the text at the appropriate point to guide the reader through the statistical evidence [55]. By adhering to these protocols and considerations, researchers can robustly validate the performance of a novel JD biosensor and communicate its capabilities effectively to the scientific community.
Johne's disease (JD), caused by Mycobacterium avium subspecies paratuberculosis (MAP), represents a significant economic burden to the global cattle industry, with estimated annual losses exceeding $1.5 billion in the United States alone due to reduced milk production, premature culling, and reduced carcass weight [2]. Current diagnostic methods, including bacterial culture and enzyme-linked immunosorbent assay (ELISA), present limitations for on-site use due to their time requirements, specialized equipment, and laboratory dependency [2] [4]. Conductometric biosensor technology has emerged as a promising solution, enabling rapid detection of MAP-specific antibodies (IgG) directly in field settings. This application note details a novel conductometric biosensor capable of detecting MAP IgG in just two minutes, providing researchers and veterinarians with a powerful tool for point-of-care JD diagnosis [2].
Biosensor Architecture and Detection Principle
The conductometric biosensor employs a lateral flow immunomigration format integrated with an electronic transduction system to convert specific biological recognition events into measurable electrical signals [2] [4].
Biosensor Assembly and Components
The biosensor assembly consists of four membrane components assembled in sequence [4]:
- Sample Application Membrane: Receives the liquid serum sample.
- Conjugate Membrane: Pre-immobilized with a polyaniline (Pani)/anti-bovine IgG conjugate (Pani-AB/IgG*).
- Capture Membrane: Features screen-printed silver electrodes and immobilized MAP purified proteins (MAPPD).
- Absorption Membrane: Acts as a fluid sink to draw the liquid sample through the device.
The architecture leverages polyaniline, a conductive polymer, prized for its strong bio-molecular interactions, excellent environmental stability, and good conductivity, which serves as the primary transducer [2].
Mechanism of Detection
The detection mechanism is a sophisticated yet rapid process, as shown in Figure 1, enabling completion within two minutes [2].
Figure 1. Workflow of the conductometric biosensor for MAP IgG detection.
- Complex Formation: Upon application of the serum sample (100 µL), capillary action draws it through the conjugate membrane. If MAP-specific IgG is present, it binds to the Pani-anti-bovine IgG conjugate, forming a Pani-AB/IgG*-IgG complex [4].
- Target Capture: The fluid front carries this complex to the capture membrane. The immobilized MAP antigens specifically capture the MAP IgG within the Pani-AB/IgG*-IgG complex [2].
- Signal Transduction: The captured polyaniline, due to its conductive properties, bridges the two silver electrodes flanking the capture membrane. This establishes an electrical circuit, resulting in a measurable change—specifically, a drop in electrical resistance across the electrodes [2] [4].
- Signal Measurement: An ohmmeter connected to the silver electrodes records the resistance value in kilo-ohms (kΩ) at the 2-minute time point. A significant drop in resistance indicates a positive result, correlating with the presence of MAP IgG [2].
Experimental Protocol
Materials and Reagent Preparation
Table 1: Key Research Reagent Solutions
| Component | Function/Description | Source/Reference |
|---|---|---|
| AquaPass Polyaniline (Pani) | Conductive polymer for signal transduction; diluted to 0.001% with PBS. | Mitsubishi Rayon Co. [4] |
| Mouse Monoclonal Anti-Bovine IgG | Detection antibody; conjugated with Pani to form the Pani-AB/IgG* conjugate. | Sigma-Aldrich [4] |
| MAP Purified Proteins (MAPPD) | Capture antigen; immobilized on the capture membrane to specifically bind MAP IgG. | [2] |
| Hi-Flow Plus Membranes | Assembly kit comprising sample, conjugate, capture, and absorption membranes. | Millipore [4] |
| Phosphate Buffered Saline (PBS) | Diluent and washing buffer (0.1 M, pH 7.4). | [4] |
| Blocking Solution | 0.1 M Tris buffer containing 0.1% casein (pH 9.0) to reduce non-specific binding. | [4] |
Step-by-Step Procedure
1. Conjugate Preparation: - Dilute AquaPass polyaniline to a concentration of 0.001% using 0.1 M PBS. - Add purified mouse monoclonal anti-bovine IgG to the Pani solution to achieve a final optimized concentration (e.g., 0.0115 mg/mL) [4]. - Incubate the mixture at 27°C for 1 hour to form the Pani-AB/IgG* conjugate. - Add a blocking solution (0.1 M Tris with 0.1% casein, pH 9.0) and incubate for an additional 30 minutes at 27°C. - Saturate the conjugate membrane with this final solution and air-dry for 45 minutes at 20°C [4].
2. Biosensor Assembly: - Assemble the pre-treated membranes (sample, conjugate, capture, absorption) into the immunosensor strip. - Screen-print silver electrodes onto the capture membrane, flanking a defined 1 mm-wide immunomigration channel to ensure uniformity and reduce variability [4]. - Use a conductive silver-microtip pen to create a connection between the silver electrodes and a copper wafer, which is then connected to an ohmmeter.
3. Sample Application and Measurement: - Apply 100 µL of the test serum sample to the application membrane. - Start the timer immediately upon sample application. - Record the electrical resistance value (in kΩ) from the ohmmeter at exactly 2 minutes post-application [2] [4].
4. Data Interpretation: - A significant decrease in electrical resistance compared to a known negative control is indicative of a positive result for MAP IgG.
Performance and Validation Data
Quantitative Results from Feasibility Studies
The biosensor's performance was validated using serum samples with known JD status determined by a reference ELISA.
Table 2: Biosensor Resistance Values for JD Positive and Negative Sera
| Sample ID | ELISA OD Value (Status) | Mean Biosensor Resistance (kΩ) at 2 min ± SD |
|---|---|---|
| A | 1.683 (Positive) | 43.47 ± 4.76 |
| B | 1.380 (Positive) | 70.33 ± 3.95 |
| C | 0.978 (Positive) | 95.43 ± 12.58 |
| D | 0.014 (Negative) | 437.00 ± 33.29 |
| E | -0.020 (Negative) | 448.37 ± 99.41 |
| F | -0.048 (Negative) | 672.33 ± 101.93 |
Data adapted from Okafor et al., 2008 [2].
Statistical analysis revealed a significant difference (p < 0.05) in the mean resistance values between the JD-positive and JD-negative groups at the 2-minute time point, demonstrating the assay's excellent diagnostic potential [2]. The intra-assay coefficient of variation was reported at 14.48%, indicating acceptable precision for a prototype device [2].
Comparison with Established Diagnostic Methods
Table 3: Comparison of Biosensor Performance with Other JD Diagnostic Tests
| Diagnostic Method | Principle | Time to Result | Key Advantages | Key Limitations |
|---|---|---|---|---|
| Conductometric Biosensor | Immuno-migration & conductance measurement | 2 minutes [2] | Extreme speed, portability, potential for on-site use | Lower sensitivity in pre-clinical stages [34] |
| ELISA (e.g., PrioCHECK) | Colorimetric immunoassay | ~45 min - 20 hrs [56] | High throughput, established reliability, quantitative | Laboratory-based, requires skilled personnel [2] |
| Fecal PCR (e.g., VetMAX) | DNA amplification | 2-7 days [57] | High specificity, detects active infection | Requires specialized lab equipment, higher cost [56] |
| Bacterial Culture | Microbial growth | 7 weeks [57] | Gold standard for viability | Prohibitively long incubation time [2] |
A subsequent study comparing the optimized biosensor with a commercial ELISA for testing unknown cattle sera showed a moderate strength of agreement (kappa = 0.41), supporting its continued development as a field-deployable diagnostic tool [4]. Furthermore, an evaluation in goats demonstrated that the biosensor performed comparably to absorbed ELISA and fecal nested PCR, detecting MAP antibodies in 19.14% and 40% of animals in two different trials, respectively [34].
Discussion and Application in On-Site JD Testing
The 2-minute detection capability of this conductometric biosensor represents a transformative advancement for JD management. Its speed, simplicity, and minimal equipment requirements (an ohmmeter) make it uniquely suited for point-of-care opportunities, such as testing at sale barns or directly on farms [2] [4]. This facilitates more frequent and widespread testing, enabling earlier identification of infected animals and more informed, timely management decisions to control disease spread [2].
A critical consideration for researchers is that, like most antibody-detection assays, this biosensor is most effective in animals with a developed humoral immune response, typically in the subclinical and clinical stages of JD. It may not reliably detect early-stage infections where the cell-mediated immune response dominates [34]. Future work aims to enhance sensitivity for early detection by exploring novel secreted proteins and antigens [34].
This case study validates a novel conductometric biosensor as a rapid and effective tool for the detection of MAP IgG. Its ability to deliver results in two minutes, combined with a straightforward protocol and portable design, positions it as a paradigm-shifting technology for on-site Johne's disease control programs. Continued optimization and scaling of this biosensor technology hold the promise of significantly reducing the substantial economic impact of JD on the livestock industry worldwide.
Evaluating Cost, Speed, and Suitability for Field Deployment
Johne's disease (JD), caused by Mycobacterium avium subspecies paratuberculosis (MAP), presents significant economic challenges for the dairy industry, with annual losses estimated in the hundreds of millions of dollars in the United States and Canada alone [49] [1]. Controlling this chronic intestinal infection requires accurate and timely detection to facilitate early intervention and management strategies. Traditional diagnostic methods, including enzyme-linked immunosorbent assay (ELISA), polymerase chain reaction (PCR), and bacterial culture, often require centralized laboratory facilities, specialized equipment, and trained personnel, creating limitations for on-site herd management [7] [1]. Bacterial culture, while definitive, is particularly time-consuming, requiring 7–12 weeks for completion [1].
Biosensor technology offers a promising alternative for rapid, on-site pathogen detection. These devices integrate a biological recognition element with a physicochemical transducer to produce a measurable signal proportional to the target analyte [58]. Recent research has focused on adapting these platforms for JD diagnostics, with particular interest in electrochemical and conductometric biosensors that demonstrate potential for point-of-care (POC) deployment [49] [1]. This application note provides a comparative evaluation of these emerging biosensing platforms against traditional methods, focusing on cost, speed, and suitability for field deployment within a broader thesis research context on conductometric biosensors for on-site JD testing.
Performance Metrics of Diagnostic Platforms for Johne's Disease
The evaluation of diagnostic technologies for JD involves multiple performance parameters critical for field deployment. The table below summarizes key metrics for established and emerging platforms.
Table 1: Comparative analysis of Johne's disease diagnostic platforms
| Platform | Detection Mechanism | Analytical Time | Estimated Cost | Sensitivity & Specificity | Suitability for Field Use |
|---|---|---|---|---|---|
| Bacterial Culture [7] [1] | Growth of MAP in culture medium | 7–12 weeks | High (specialized media, prolonged incubation) | High specificity | Low (requires lab infrastructure) |
| ELISA [7] [49] | Detection of anti-MAP antibodies in serum/milk | 2–7 days | Moderate | Variable sensitivity; moderate specificity [8] | Low to Moderate (requires lab processing) |
| Fecal PCR [7] | Detection of MAP DNA in feces | 1–3 days | Moderate to High | High sensitivity and specificity | Low (requires thermal cycling, lab infrastructure) |
| Conductometric Biosensor [49] | Immunomigration with electronic signal detection (antibody detection) | Minutes to Hours (Rapid) | Low (potential for low-cost manufacturing) | Moderate agreement (κ=0.41) with ELISA [49] | High (portable, non-laboratory-based) |
| Electrochemical DNA Biosensor [1] | DNA hybridization on GO-CH modified electrode | Minutes to Hours (Rapid) | Low (low-cost, miniaturized equipment) | LOD: 1.53 × 10⁻¹³ mol L⁻¹; high selectivity [1] | High (portable, for on-site point-of-care) |
| NIR-Aquaphotomics [8] | NIRS analysis of water spectral patterns in milk | Minutes (Rapid, non-invasive) | Not specified | 100% accuracy in validation study [8] | High (non-invasive, uses milk samples) |
Experimental Protocols for Biosensor Evaluation
Protocol A: Fabrication of an Electrochemical DNA Nanobiosensor for MAP Detection
This protocol details the construction of a highly sensitive and selective DNA-based biosensor, adapted from a recent study that reported a low-cost platform for MAP detection [1].
Research Reagent Solutions
Table 2: Essential materials for electrochemical DNA nanobiosensor fabrication
| Research Reagent | Function/Description |
|---|---|
| Graphene Oxide (GO) Nanoparticles | Nanomaterial that enhances the electrode's surface area and electron transfer capabilities [1]. |
| Chitosan Biopolymer | A natural biopolymer used to form a stable composite film with GO on the electrode surface [1]. |
| EDC/NHS Coupling System | Cross-linking agents (1-ethyl-3-(3-dimethylaminopropyl) carbodiimide hydrochloride/N-hydroxy succinimide) that activate functional groups for probe DNA immobilization [1]. |
| Probe DNA (ssDNA) | Single-stranded DNA sequence complementary to the target MAP DNA, serving as the biorecognition element [1]. |
| Glassy Carbon Electrode (GCE) | The base transducer platform for electrode modification and electrochemical measurements [1]. |
Step-by-Step Methodology
- Electrode Pre-treatment: Clean and polish the Glassy Carbon Electrode (GCE) according to standard electrochemical procedures to ensure a fresh, reproducible surface.
- Nanocomposite Modification: Immobilize a mixture of Graphene Oxide (GO) and Chitosan (CH) onto the surface of the GCE via electrochemical deposition, forming a GO-CH-modified electrode [1].
- Surface Activation: Activate the carboxylic acid moieties on the modified electrode surface using the EDC/NHS coupling system to form amine-reactive esters [1].
- Probe Immobilization: Stabilize the commercial single-stranded probe DNA (ssDNA) onto the activated electrode surface. This creates the final "ssDNA-stabilized GO-CH-EDC/NHS-modified" bioelectrode, which is the functional nanobiosensor [1].
- Characterization: Validate successful fabrication at each step using characterization techniques such as Scanning Electron Microscopy (SEM), Fourier-Transform Infrared (FT-IR) spectroscopy, and Energy-Dispersive X-ray (EDX) analysis [1].
- Target Detection & Quantification:
- Hybridization: Incubate the biosensor with the sample solution containing the target MAP DNA.
- Signal Measurement: Employ Cyclic Voltammetry (CV) and Differential Pulse Voltammetry (DPV) to confirm DNA hybridization and quantify the target. The signal decrease (e.g., in current) due to the hindered electron transfer upon hybridization is measured against a redox marker [1].
- Calibration: Generate a calibration curve by plotting the signal response against the logarithm of target DNA concentration to determine the unknown sample concentration [1].
Protocol B: Evaluation of a Conductometric Biosensor for JD Serology
This protocol outlines the procedure for assessing the performance of a conductometric biosensor designed for JD evaluation, which can be directly compared to commercial ELISAs [49].
Research Reagent Solutions
Table 3: Essential materials for conductometric biosensor evaluation
| Research Reagent | Function/Description |
|---|---|
| Conductometric Biosensor Strip | Immunomigration strip integrated with electrodes for electronic signal detection, pre-coated with MAP antigens [49]. |
| Anti-Bovine IgG Antibody | Secondary antibody, optimized for concentration, used in the biosensor to capture bovine IgG [49]. |
| Bovine Serum Samples | Test samples from cattle with known or unknown JD status, used for validation and comparison studies [49]. |
| Reference ELISA Kit | A commercially available ELISA for JD, used as a reference method for comparative analysis [49]. |
| Portable Conductance Meter | Electronic reader device that measures the change in conductance across the biosensor strip [49]. |
Step-by-Step Methodology
- Biosensor Preparation: Use a conductometric biosensor strip that combines immunomigration technology with electronic signal detection. The strip should have a capture membrane with low variability in the immunomigration channel [49].
- Sample Application: Apply the bovine serum sample to the sample pad of the biosensor strip.
- Immunomigration and Reaction: Allow the sample to migrate via capillary action. Any anti-MAP antibodies present in the serum will bind to MAP antigens on the strip and are subsequently captured by the secondary anti-bovine antibody, forming an immunocomplex [49].
- Signal Detection and Reading: Place the strip in the portable conductance meter. The formation of the immunocomplex on the electrode surface alters the local conductance. Measure this change electronically [49].
- Data Analysis and Comparison:
- Record the signal output from the biosensor.
- Test the same panel of serum samples (from cattle with unknown JD status) using the reference commercial ELISA kit, following the manufacturer's protocol [49].
- Perform a statistical agreement analysis (e.g., using Cohen's Kappa coefficient) to evaluate the strength of agreement between the conductometric biosensor and the ELISA test [49].
Discussion and Field Deployment Considerations
The data presented in Table 1 highlights the distinct advantages of biosensor platforms, particularly their rapid analysis time and high suitability for field use, addressing critical limitations of traditional methods. The electrochemical DNA biosensor demonstrates exceptional analytical sensitivity, while the conductometric biosensor offers a platform for rapid serology that aligns well with POC requirements [49] [1].
For field deployment, several practical aspects must be considered. Sample handling is simplified with biosensors; for instance, the electrochemical DNA sensor can analyze processed samples in a portable format, and the conductometric biosensor uses a simple immunomigration strip [49] [1]. The infrastructure requirement is minimal, needing only portable, potentially handheld readers, unlike the lab-bound equipment for ELISA, PCR, or culture [49] [1]. Furthermore, the potential for cost-effectiveness is significant due to the use of low-cost materials like graphene oxide and chitosan, miniaturized equipment, and reduced reliance on specialized personnel [1].
Emerging biosensing platforms for Johne's disease, particularly conductometric and electrochemical DNA biosensors, present a compelling alternative to traditional diagnostic methods. Their primary advantages of rapid analysis, potential for low-cost manufacturing, and high portability make them exceptionally suitable for on-site, point-of-care deployment. This capability enables more frequent testing and timely herd management decisions directly in the field. While the presented electrochemical DNA biosensor shows superior analytical sensitivity, the conductometric format demonstrates the practical viability of a simple, electronic readout system for serological testing. Future research should focus on the clinical validation of these biosensors with larger sample sizes, further simplification of sample preparation protocols, and the development of robust, user-friendly portable readers to fully realize their potential for on-site JD control programs.
Johne's disease (JD), caused by Mycobacterium avium subspecies paratuberculosis (MAP), presents a formidable challenge to global dairy industries, with annual economic losses in the United States alone estimated at $200-250 million [4]. Traditional diagnostic methods, including enzyme-linked immunosorbent assay (ELISA), polymerase chain reaction (PCR), and bacterial culture, present significant limitations for on-site application due to their requirements for specialized equipment, trained personnel, and extended processing times [1] [2]. The development of rapid, accurate, and field-deployable diagnostic technologies is therefore paramount for effective JD management and control.
This application note positions two emerging diagnostic technologies—NIR-Aquaphotomics and Electrochemical Biosensors—within the evolving landscape of on-site JD testing. We provide a detailed comparative analysis, structured experimental protocols, and implementation frameworks to guide researchers and development professionals in selecting appropriate technological pathways for point-of-care diagnostic applications.
Technology Comparisons and Performance Metrics
Quantitative Technology Assessment
Table 1: Comparative Analysis of Emerging JD Diagnostic Technologies
| Technology | Detection Principle | Sample Matrix | Analysis Time | Sensitivity/Accuracy | Key Advantages |
|---|---|---|---|---|---|
| NIR-Aquaphotomics | Water molecular structure changes in NIR spectrum (1300-1600 nm) | Milk, Saliva | Minutes | 100% sensitivity (milk, plasma ELISA reference); 99% accuracy (saliva) [59] [8] [60] | Non-invasive, no sample preparation, monitors physiological status |
| Electrochemical DNA Nanobiosensor | DNA hybridization on GO-CH-EDC/NHS modified GCE | Tissue, feces | <30 minutes | LOD: 1.53 × 10⁻¹³ mol L⁻¹; Linear range: 1.0 × 10⁻¹⁵–1.0 × 10⁻¹² mol L⁻¹ [1] | Ultra-sensitive, specific DNA detection, portable equipment |
| Conductometric Biosensor | Polyaniline conductance change with antigen-antibody binding | Serum | 2 minutes | Moderate agreement with ELISA (kappa = 0.41) [4] | Rapid, inexpensive, suitable for point-of-care |
| Traditional ELISA (Reference) | Antibody-antigen colorimetric detection | Serum, Milk | Hours | Sensitivity: 21-94% (varies by sample type) [59] [7] | Established methodology, cost-effective for large batches |
Technology Selection Framework
The choice between these technologies depends on application-specific requirements:
- NIR-Aquaphotomics excels for non-invasive herd screening and continuous monitoring through milk or saliva analysis
- Electrochemical Biosensors provide superior sensitivity for confirmatory testing when MAP DNA detection is critical
- Conductometric Biosensors offer the most economical solution for rapid, point-of-care screening
Experimental Protocols
NIR-Aquaphotomics for Milk Analysis
Table 2: Research Reagent Solutions for NIR-Aquaphotomics
| Item | Specification | Function |
|---|---|---|
| NIR Spectrometer | Wavelength range: 1300-1600 nm | Spectral acquisition of milk samples |
| Temperature Control Unit | ±0.1°C stability | Standardize sample temperature during measurement |
| Quartz Cuvettes | 1-2 mm pathlength | Hold liquid samples for transmission measurements |
| Chemometrics Software | MATLAB, R, or Python with PLS_Toolbox | Multivariate data analysis and model development |
| Reference Standards | Deionized water, white reference tiles | Instrument calibration and validation |
Protocol: Milk Sample Analysis for JD Detection
Sample Collection and Preparation
Spectral Acquisition
- Configure NIR spectrometer to scan 1300-1600 nm range
- Use 1 mm pathlength quartz cuvette
- Collect triplicate spectra per sample, averaging 32 scans per spectrum
- Include background scans of empty cuvette and reference water sample
Data Preprocessing
Aquaphotomic Analysis
- Extract absorbance values at 12 predefined water matrix coordinates (WAMACs): 1340-1600 nm
- Construct aquagrams using radial plots of normalized absorbance at WAMACs
- Develop classification models using Support Vector Machine (SVM) or Quadratic Discriminant Analysis (QDA)
- Validate models through cross-validation and external validation sets [59] [61]
Electrochemical DNA Nanobiosensor Fabrication
Table 3: Research Reagent Solutions for Electrochemical Biosensor
| Item | Specification | Function |
|---|---|---|
| Glassy Carbon Electrode | 3 mm diameter | Biosensor platform |
| Graphene Oxide | 80-215 nm particle size | Enhanced surface area and electron transfer |
| Chitosan Biopolymer | High molecular weight | Biocompatible immobilization matrix |
| EDC/NHS Coupling System | 0.4 M EDC, 0.1 M NHS | Carboxyl group activation for DNA immobilization |
| Probe DNA | MAP-specific sequence, 5'-NH₂ modification | Target MAP DNA recognition |
Protocol: Biosensor Fabrication and JD Detection
Electrode Modification
- Polish glassy carbon electrode (GCE) with 0.05 μm alumina slurry
- Rinse thoroughly with deionized water and dry under nitrogen stream
- Prepare graphene oxide-chitosan (GO-CH) composite: 2 mg/mL GO in 0.5% chitosan (w/v) in 1% acetic acid
- Deposit 5 μL GO-CH suspension on GCE surface, dry at room temperature [1]
Probe DNA Immobilization
- Activate carboxyl groups on modified electrode using EDC/NHS (0.4 M/0.1 M) for 30 minutes
- Immobilize 20 μM amino-modified MAP-specific ssDNA probe in phosphate buffer (pH 7.4) for 2 hours
- Block nonspecific sites with 1% ethanolamine for 15 minutes
- Rinse with Tris-EDTA buffer to remove unbound probes [1]
Electrochemical Detection
- Incubate biosensor with target DNA sample for 15 minutes
- Perform differential pulse voltammetry (DPV) from -0.2 to +0.6 V
- Use ferricyanide/ferrocyanide redox couple as electrochemical indicator
- Measure current decrease proportional to target DNA concentration [1]
Signal Analysis
- Calculate ΔI = I₀ - I, where I₀ is initial current and I is post-hybridization current
- Generate calibration curve with MAP DNA standards (1.0 × 10⁻¹⁵–1.0 × 10⁻¹² mol L⁻¹)
- Apply to unknown samples using established calibration [1]
Integration Pathways for On-Site JD Testing
Complementary Implementation Strategy
These emerging technologies can be deployed in a complementary framework for comprehensive JD management:
- Primary Screening: NIR-Aquaphotomics for non-invasive herd-level monitoring through routine milk analysis
- Confirmatory Testing: Electrochemical biosensors for individual animal diagnosis in suspected cases
- Point-of-Care Applications: Conductometric biosensors for rapid testing at sale barns or remote locations
Technical Validation Considerations
When implementing these technologies, consider the following validation parameters:
- Reference Standards: Use ELISA or PCR as reference methods during validation phases [4] [7]
- Sample Considerations: Account for animal age (avoid testing cattle <18 months), lactation stage, and sample matrix effects
- Quality Control: Implement internal controls and proficiency testing for consistent performance
NIR-Aquaphotomics and electrochemical biosensors represent complementary technological pathways advancing on-site Johne's disease diagnostics. NIR-Aquaphotomics offers exceptional advantages for non-invasive, continuous monitoring of herd health status through routine milk analysis, while electrochemical biosensors provide molecular-level specificity for confirmatory diagnosis. The integration of these technologies with emerging point-of-care platforms, including conductometric biosensors, creates a powerful toolkit for JD management programs, enabling more frequent testing, rapid decision-making, and ultimately, more effective disease control.
Conclusion
Conductometric biosensors represent a paradigm shift in Johne's disease diagnostics, offering a compelling combination of rapid detection—within 2 minutes—and adaptability for on-site, point-of-care use. This technology successfully addresses the critical limitations of traditional methods, notably their long turnaround times and laboratory dependence. While validation studies show promising, moderate agreement with ELISA, ongoing optimization of components like the capture membrane and antibody-polyaniline conjugate is key to achieving superior diagnostic accuracy. The future of this field lies in further miniaturization and integration with digital platforms for data management. Ultimately, the widespread adoption of robust conductometric biosensors has the potential to revolutionize Johne's disease control programs, enabling frequent testing, informed culling decisions, and significant mitigation of the disease's substantial economic impact on the dairy industry.
References
- 1. Introducing a portable electrochemical biosensor for ... [https://www.nature.com/articles/s41598-023-50706-z]
- 2. Fabrication of a Novel Conductometric Biosensor for ... [https://pmc.ncbi.nlm.nih.gov/articles/PMC3705545/]
- 3. Disease and economic impact estimation of ... [https://www.sciencedirect.com/science/article/pii/S0022030225003303]
- 4. Comparison between a Conductometric Biosensor and ... [https://www.mdpi.com/1424-8220/14/10/19128]
- 5. Bacteriophage-Based Methods for Detection of Viable ... [https://pmc.ncbi.nlm.nih.gov/articles/PMC7991384/]
- 6. New diagnostic approach may help detect Johne disease ... [https://www.dvm360.com/view/new-diagnostic-approach-may-help-detect-johne-s-disease-in-cattle-earlier]
- 7. Johne's Disease Program Sampling and Testing Guidance [https://www.vet.cornell.edu/animal-health-diagnostic-center/veterinary-resources/testing-guidelines/johnes-disease-program-sampling-and-testing-guidance]
- 8. NIR Aquaphotomics Milk Analysis Method Detects Johne's ... [https://www.spectroscopyonline.com/view/nir-aquaphotomics-milk-analysis-method-detects-johne-s-disease-in-dairy-cows]
- 9. Diagnostics - Diagnosis and Control of Johne's Disease - NCBI [https://www.ncbi.nlm.nih.gov/books/NBK207642/]
- 10. Estimating the sensitivity and specificity of serum ELISA ... [https://pmc.ncbi.nlm.nih.gov/articles/PMC9372466/]
- 11. NVAP Reference Guide: Johne's Disease (Control and ... [https://www.aphis.usda.gov/nvap/reference-guide/control-eradication/johnes]
- 12. Navigating Johne's Disease Testing [https://www.uwyo.edu/wyovet/client-services/johnes-navigation.html]
- 13. A comparative study between milk- and serum-based ... [https://www.sciencedirect.com/science/article/pii/S1472979225000745]
- 14. Johne's disease | Veterinary Medicine Extension | Washington ... [https://vetextension.wsu.edu/2023/12/14/johnes-disease/]
- 15. Evaluation of the limitations and methods to improve rapid ... [https://pmc.ncbi.nlm.nih.gov/articles/PMC4910302/]
- 16. A Novel Real-Time PCR-Based Screening Test with Pooled ... [https://pmc.ncbi.nlm.nih.gov/articles/PMC7685889/]
- 17. Johne's Direct Fecal PCR Test [https://www.vet.cornell.edu/animal-health-diagnostic-center/testing/testing-protocols-interpretations/johnes-direct-fecal-pcr-test]
- 18. Emerging Methods in Biosensing of Immunoglobin G—A ... [https://www.mdpi.com/1424-8220/23/2/676]
- 19. MAP, Johne's disease and the microbiome; current knowledge ... [https://animalmicrobiome.biomedcentral.com/articles/10.1186/s42523-021-00089-1]
- 20. Designing the Future of Biosensing: Advances in Aptamer ... [https://www.mdpi.com/2079-6374/15/10/637]
- 21. The 5th International Electronic Conference on Biosensors [https://sciforum.net/event/IECB2025]
- 22. From batteries to biosensors: Conductive polymers make ... [https://www.cas.org/resources/cas-insights/conductive-polymers]
- 23. Fabrication of a Novel Conductometric Biosensor for ... [https://www.sigmaaldrich.com/SE/en/tech-docs/paper/1564434?srsltid=AfmBOopsIumxiYtnNLP4hiFAuoVkLFghOKZ5GOBvTz4iRqpLbD195Rnl]
- 24. Chemical Sensors and Biosensors for Point-of-Care ... [https://pmc.ncbi.nlm.nih.gov/articles/PMC12105083/]
- 25. Point-of-Care Diagnostics for Farm Animal Diseases [https://www.mdpi.com/2079-6374/12/7/455]
- 26. Fabrication of a Novel Conductometric Biosensor for ... [https://www.mdpi.com/1424-8220/8/9/6015]
- 27. Comparison between a Conductometric Biosensor and ... [https://pmc.ncbi.nlm.nih.gov/articles/PMC4239859/]
- 28. Johne's Disease Diagnostic Market Dynamics: Drivers and ... [https://www.datainsightsmarket.com/reports/johnes-disease-diagnostic-1024100]
- 29. Quantitative analysis of the response of an electrochemical ... [https://www.sciencedirect.com/science/article/abs/pii/S095656630400421X]
- 30. Preparations, Properties, and Applications of Polyaniline and ... [https://pmc.ncbi.nlm.nih.gov/articles/PMC8234317/]
- 31. Immobilization of antibodies on polyaniline films and its ... [https://pubmed.ncbi.nlm.nih.gov/17165829/]
- 32. RBD-Modified Polyaniline-Based Label-Free ... [https://www.mdpi.com/2227-9040/11/4/222]
- 33. Detection of Mycobacterium avium Subspecies ... [https://www.frontiersin.org/journals/veterinary-science/articles/10.3389/fvets.2021.615029/full]
- 34. Evaluation of bioelectronics sensor compared to other ... [https://www.sciencedirect.com/science/article/abs/pii/S0921448812002519]
- 35. Detection of Cardiac Biomarkers Using Single Polyaniline ... [https://www.mdpi.com/2079-6374/2/2/205]
- 36. Laboratory Diagnosis of Johne's Disease [https://vet.uga.edu/laboratory-diagnosis-of-johnes-disease/]
- 37. Johne's Disease - College of Veterinary Medicine [https://vetmed.iastate.edu/vdpam/about/focus-areas/beef/bovine-disease-topics/johnes-disease/]
- 38. Highly sensitive single polyaniline nanowire biosensor for ... [https://pmc.ncbi.nlm.nih.gov/articles/PMC3043147/]
- 39. Johne's Testing Strategies [https://www.vet.cornell.edu/animal-health-diagnostic-center/programs/nyschap/modules-documents/johnes-testing-strategies]
- 40. Conductometric Microbiosensors for Environmental ... [https://pmc.ncbi.nlm.nih.gov/articles/PMC3673432/]
- 41. Biological Matrix Effects in Quantitative Tandem Mass ... [https://pmc.ncbi.nlm.nih.gov/articles/PMC4695332/]
- 42. ELISA Assay Qualification: Precision & Reproducibility Tips [https://www.cygnustechnologies.com/evaluating-precision-and-reproducibility-in-your-elisa?srsltid=AfmBOoo75TRy7P4u3TboP1syqjgoAmPBPG0nn2nqiUMNC3itoSgj43Od]
- 43. %CV in ELISA: How to Reduce Them and Why They're ... [https://www.enzo.com/note/cv-in-elisa-how-to-reduce-them-and-why-theyre-important/]
- 44. Calculating Inter- and Intra-Assay Coefficients of Variability [https://salimetrics.com/calculating-inter-and-intra-assay-coefficients-of-variability/]
- 45. 12 ELISA Tips and Tricks: An Expert's Guide to Improve ... [https://www.alpco.com/resources/tips-and-tricks?srsltid=AfmBOoqFDH1FKWIbmWLepsrDnIgmyP9i-eMT13EeSnT94Ohwx0zsGbcf]
- 46. How to Measure and Improve Lab Accuracy and Precision [https://bitesizebio.com/55470/accuracy-and-precision/]
- 47. Improving Accuracy and Precision in Scientific, Technical ... [https://www.protagx.com/en/ddd/improving-accuracy-and-precision-in-scientific-technical-and-data-driven-domains]
- 48. A novel conductometric biosensor based on hybrid organic ... [https://www.sciencedirect.com/science/article/abs/pii/S1567539425000805]
- 49. Comparison between a conductometric biosensor and ... [https://pubmed.ncbi.nlm.nih.gov/25320903/]
- 50. Point-of-care biosensors for infectious disease diagnosis [https://pmc.ncbi.nlm.nih.gov/articles/PMC12377050/]
- 51. Change in Johne's Disease ELISA Test for Small Ruminants [https://waddl.vetmed.wsu.edu/2025/05/27/change-in-johnes-disease-elisa-testfor-small-ruminants/]
- 52. Relationships between statistical measures of agreement [https://pubmed.ncbi.nlm.nih.gov/19018927/]
- 53. Kappa statistic considerations in evaluating inter-rater ... [https://bmccancer.biomedcentral.com/articles/10.1186/s12885-023-11325-z]
- 54. Figures and Charts - UNC Writing Center [https://writingcenter.unc.edu/tips-and-tools/figures-and-charts/]
- 55. Utilizing tables, figures, charts and graphs to enhance the ... [https://pmc.ncbi.nlm.nih.gov/articles/PMC10394528/]
- 56. Johne's Disease Diagnostic Solutions [https://www.thermofisher.com/us/en/home/industrial/animal-health/bovine-cattle-diagnostic-solutions/bovine-diseases/map-paratuberculosis.html]
- 57. Mycobacterium paratuberculosis (Johne's Disease) [https://cvm.msu.edu/vdl/laboratory-sections/bacteriology-mycology/culture-of-mycobacterium-paratuberculosis-johnes]
- 58. Point-of-care biosensors for infectious disease diagnosis: recent... [https://pubs.rsc.org/en/content/articlehtml/2025/ra/d5ra03897a]
- 59. Milk NIR spectroscopy and Aquaphotomics novel ... [https://www.nature.com/articles/s41598-025-99421-x]
- 60. Saliva NIR spectroscopy and Aquaphotomics: a novel ... [https://pmc.ncbi.nlm.nih.gov/articles/PMC11605387/]
- 61. Mini-Tutorial on NIR Aquaphotomics for Rapid, Non- ... [https://www.spectroscopyonline.com/view/mini-tutorial-on-nir-aquaphotomics-for-rapid-non-destructive-biofluid-and-food-analysis]