Specific vs. Selective Sensing: A Strategic Guide for Enhanced Drug Discovery and Development
This article provides a comprehensive comparison of specific and selective sensing approaches, crucial for researchers and professionals in drug development.
Specific vs. Selective Sensing: A Strategic Guide for Enhanced Drug Discovery and Development
Abstract
This article provides a comprehensive comparison of specific and selective sensing approaches, crucial for researchers and professionals in drug development. It explores the foundational definitions, distinguishing the theoretical ideal of specificity from the practical spectrum of selectivity. The content delves into methodological applications across various stages of drug discovery, from target identification to clinical trials, and offers practical guidance for troubleshooting and optimizing sensing protocols. Finally, it examines validation frameworks and comparative analyses, empowering scientists to strategically select and implement the most effective sensing approach for their specific research and development goals.
Core Concepts: Demystifying Specificity and Selectivity in Pharmacological Sensing
In the fields of chemical sensing and pharmaceutical development, the terms "selectivity" and "specificity" are often used interchangeably, yet they represent fundamentally distinct concepts in analytical science. Selectivity refers to a sensor's or method's preferential response to a target analyte among a group of similar interferents, operating on a spectrum of relative discrimination. In contrast, specificity describes an absolute, binary recognition capability where a sensing mechanism responds exclusively to a single target based on unique structural or mechanistic complementarity.
This distinction carries profound implications for diagnostic accuracy, drug discovery, and environmental monitoring. As sensing technologies evolve to address increasingly complex analytical challenges, understanding this spectrum from preferential to absolute recognition becomes crucial for researchers selecting appropriate methodologies for their specific applications. This whitepaper examines the theoretical foundations, experimental manifestations, and practical implications of this critical distinction through contemporary research examples, providing a framework for the strategic implementation of these complementary approaches in scientific research.
Theoretical Foundations and Definitions
The conceptual divide between selectivity and specificity originates from fundamental differences in recognition mechanisms and their practical implementations in sensing systems.
Selectivity emerges from differential affinity, where a recognition element interacts with multiple related compounds but exhibits a measurable preference for the target analyte. This preferential binding is quantifiable through ratios of response factors, binding constants, or inhibition coefficients. Selectivity is inherently relative and context-dependent, influenced by the composition of the sample matrix and the presence of structurally similar compounds. In sensor arrays, selectivity often arises from differential response patterns across multiple sensing elements rather than exclusive recognition at a single site [1].
Specificity implies a lock-and-key mechanism where molecular recognition depends on exact complementarity between the target and recognition element. This absolute recognition typically stems from unique structural features that prevent binding even to closely related analogs. Specificity is often binary—a response either occurs or does not—and is less susceptible to matrix effects when the recognition mechanism is truly specific [2].
The distinction manifests practically in the design and validation of analytical methods. Selective methods require comprehensive interference testing to establish the degree of preference, while specific methods demand demonstration of exclusive recognition under defined conditions.
Experimental Manifestations in Sensing Technologies
Molecular Imprinting: The Selective Approach
Molecularly Imprinted Polymers (MIPs) exemplify the selective approach through synthetic recognition sites complementary to target molecules in shape, size, and functional group orientation. The preparation of MIP-based sensors involves a multi-step process that creates preferential rather than absolute recognition capabilities.
Table 1: Key Stages in MIP Sensor Development [3]
| Stage | Process Description | Function |
|---|---|---|
| Template-Monomer Complexation | Functional monomers (e.g., methacrylic acid) form pre-polymerization complexes with template molecules (e.g., donepezil) via non-covalent interactions | Creates molecular memory through complementary binding sites |
| Cross-linking Polymerization | Ethylene glycol dimethacrylate (EGDMA) forms highly cross-linked polymer matrix around template-monomer complexes | Stabilizes recognition cavities and maintains structural integrity |
| Template Extraction | Template molecules removed from polymer matrix using solvent extraction | Liberates recognition sites for subsequent analyte binding |
| Sensor Integration | MIP particles incorporated into electrode membranes (e.g., PVC-based ion-selective membranes) | Transduces binding events into measurable signals (e.g., potentiometric) |
The experimental protocol for MIP-based sensor development follows a rigorous pathway:
Preparation of MIPs: Dissolve 0.5 mmol template drug (donepezil or memantine) in 40 mL dimethylsulfoxide (DMSO) porogenic solvent. Add 2.0 mmol methacrylic acid functional monomer and sonicate 15 minutes. Introduce 8.0 mmol ethylene glycol dimethacrylate cross-linker and 0.6 mmol azobisisobutyronitrile initiator, followed by nitrogen purging for 15 minutes. Incubate at 60°C for 24 hours for polymerization [3].
Template Removal: Extract template molecules through repeated washing with methanol:acetic acid (9:1 v/v) until no template is detectable in washings by HPLC.
Sensor Fabrication: Incorporate resulting MIP particles into ion-selective membrane composition containing polyvinyl chloride (PVC), plasticizer (e.g., 2-nitrophenyl octyl ether), and ionic additive. Dissolve components in tetrahydrofuran, cast on electrode surfaces (e.g., graphene-modified glassy carbon), and evaporate solvent to form sensing membrane.
The selectivity of MIP sensors is quantitatively demonstrated through potentiometric selectivity coefficients (log Kᵖᵒᵗ) determined via separate solution or mixed solution methods. For donepezil MIP sensors, selectivity coefficients of -3.42 against memantine and -3.75 against acetylcholinesterase demonstrate preferential recognition rather than absolute specificity [3].
Diagram 1: MIP sensor workflow demonstrating selective recognition
Aptamer-Based Recognition: The Specific Approach
Aptamers represent the specific approach through oligonucleotide sequences selected for exclusive binding to particular molecular targets. The GO-SELEX (Graphene Oxide-Systematic Evolution of Ligands by Exponential Enrichment) process exemplifies the development of highly specific recognition elements:
Library Incubation: Incubate initial single-stranded DNA library (∼10¹⁵ random sequences) with target molecule (e.g., azamethiphos) in binding buffer.
Partitioning: Add graphene oxide to mixture; unbound sequences adsorb to GO surface while target-bound aptamers remain in supernatant.
Amplification: Recover target-bound sequences from supernatant and amplify via PCR for next selection round.
Counter-Selection: Introduce non-target structural analogs (e.g., malathion, chlorpyrifos) during intermediate rounds to eliminate cross-reactive sequences [4].
The resulting aptamers achieve specificity through unique three-dimensional structures complementary to their targets. For the azamethiphos-specific aptamer, this approach yielded a dissociation constant (Kd) of 26.27 ± 1.27 nM with minimal cross-reactivity to structurally similar organophosphates [4].
Dual-Recognition Systems: Bridging the Spectrum
Hybrid systems combining MIPs and aptamers leverage both selective and specific mechanisms for enhanced analytical performance. The experimental protocol for such systems involves:
Aptamer Functionalization: Immobilize selected aptamer onto sensor surface (e.g., gold nanoparticle-modified electrode) via thiol or amino linkage.
MIP Formation: Perform electropolymerization of functional monomers (e.g., o-phenylenediamine) around aptamer-target complexes to create complementary recognition sites.
Synergistic Recognition: Employ aptamer for primary specific recognition and MIP for secondary selective enrichment, significantly improving sensitivity and robustness in complex matrices [4].
Table 2: Performance Comparison of Recognition Approaches [3] [4] [2]
| Parameter | MIP-Based Selective Sensors | Aptamer-Based Specific Sensors | Dual-Recognition Systems |
|---|---|---|---|
| Recognition Mechanism | Shape/complementarity-based cavities | 3D structure molecular fit | Combined mechanisms |
| Cross-reactivity Profile | Preferential with measurable interferent response | Minimal to non-detectable cross-reactivity | Enhanced discrimination |
| Development Time | Weeks | Months (including selection) | Several months |
| Stability | High thermal/chemical stability | Moderate (nuclease sensitivity) | High (MIP protects aptamer) |
| Detection Limit | nM to μM range | pM to nM range | pM range |
| Matrix Tolerance | Moderate (improved with design) | High for specific applications | Excellent in complex samples |
Pharmaceutical Case Study: Sodium Channel Inhibition
The distinction between selectivity and specificity is powerfully illustrated by sodium channel inhibitors in pain management, where mechanism of action directly correlates with therapeutic profile.
Non-selective sodium channel blockers (e.g., local anesthetics, anticonvulsants) inhibit multiple NaV subtypes (NaV1.1-NaV1.9) through interaction with conserved channel regions. This lack of discrimination produces dose-limiting side effects including CNS toxicity and cardiovascular impairment [2].
In contrast, suzetrigine exemplifies specific targeting through allosteric inhibition of NaV1.8 channels. The experimental protocol for demonstrating this absolute specificity involves:
Electrophysiology Studies: Express human NaV subtypes (NaV1.1-NaV1.9) in heterologous cell systems (HEK, CHO). Apply voltage clamp protocols to determine IC₅₀ values for suzetrigine across subtypes.
Binding Site Mapping: Construct NaV1.8/1.2 chimeras with exchanged voltage-sensing domains (VSDs). Identify critical VSD2 region as suzetrigine binding site through chimera inhibition profiling.
CNS Expression Analysis: Evaluate SCN10A (NaV1.8) gene expression in human CNS tissues using RNA-seq data from GTEx and Human Protein Atlas databases [2].
This comprehensive approach demonstrated suzetrigine's >31,000-fold selectivity for NaV1.8 over other subtypes and its lack of CNS expression, explaining its analgesic efficacy without addictive potential or CNS side effects [2].
Diagram 2: Specific versus non-specific sodium channel targeting
The Scientist's Toolkit: Essential Research Reagents
Table 3: Key Reagents for Selectivity and Specificity Research [3] [4] [2]
| Reagent/Category | Function in Research | Specific Examples |
|---|---|---|
| Molecular Imprinting Components | Creates selective recognition cavities | Methacrylic acid (functional monomer), EGDMA (cross-linker), AIBN (initiator) |
| Aptamer Development Tools | Generates specific recognition elements | ssDNA library, graphene oxide (partitioning), Taq polymerase (PCR amplification) |
| Sensor Transduction Materials | Converts binding events to measurable signals | Graphene nanoplatelets (ion-to-electron transducer), PVC (membrane matrix), NPOE (plasticizer) |
| Cell-Based Assay Systems | Evaluates specificity in biological contexts | HEK/CHO cells expressing ion channels, primary human DRG neurons |
| Characterization Reagents | Quantifies binding and recognition parameters | Tetrodotoxin (NaV channel reference), radiolabeled ligands (binding assays) |
The distinction between selectivity as a preferential characteristic and specificity as an absolute property represents a fundamental paradigm in sensing science with far-reaching implications for research and development. Selective systems, exemplified by molecularly imprinted polymers, offer practical advantages for applications where preferential recognition among structural analogs suffices, providing robust, cost-effective solutions for many analytical challenges. Specific systems, embodied by high-affinity aptamers and targeted pharmaceuticals, deliver uncompromised recognition essential for applications where cross-reactivity carries significant consequences.
The evolving landscape of sensing technologies demonstrates that both approaches have distinct and complementary roles in advancing analytical science. Rather than representing opposing philosophies, selectivity and specificity define a spectrum of recognition capabilities that researchers can strategically leverage based on their specific analytical requirements, matrix complexities, and performance expectations. The most innovative solutions increasingly integrate both principles, creating hybrid systems that harness the practical advantages of selective materials with the exceptional discrimination of specific recognition elements, pushing the boundaries of what is analytically possible in complex biological and environmental matrices.
The pursuit of compounds that interact with high affinity towards a specific biological target is a cornerstone of drug discovery and molecular sensing. This endeavor is fundamentally governed by two parallel, yet distinct, conceptual frameworks: specificity and selectivity. A specific interaction, often the ideal in sensor design, is characterized by a receptor (like an antibody or aptamer) that binds exclusively to a single target analyte, recognizing no other [5]. In contrast, a selective interaction describes a compound that binds to a primary target with the highest affinity but may also interact with a range of secondary, off-targets to varying degrees [6] [5]. This reality is particularly acute in the field of protein kinase inhibitors, where a highly conserved ATP-binding site across more than 500 family members makes achieving specificity exceptionally difficult [6]. Consequently, the quantitative assessment of selectivity—measuring a compound's ability to discriminate between the primary target and off-targets—becomes paramount for understanding potential efficacy and toxicity liabilities early in the drug discovery process [6]. This guide details the mathematical models and experimental protocols used to quantify binding affinity and selectivity, providing researchers with the tools to navigate this critical landscape.
Mathematical Foundations of Binding Affinity and Selectivity
Core Affinity Metrics: IC₅₀ and Kᵢ
The foundation of quantifying molecular interactions lies in measuring binding affinity. Two of the most critical metrics are:
- IC₅₀ (Half-Maximal Inhibitory Concentration): This is the concentration of an inhibitor required to reduce a specific biological or biochemical activity by half. It is a functional assay metric, determined from dose-response curves. While it directly indicates potency, its value can be influenced by experimental conditions such as substrate concentration and assay duration.
- Kᵢ (Inhibition Constant): This represents the absolute dissociation constant of the enzyme-inhibitor complex. It is a true thermodynamic measurement of the inhibitor's affinity for the enzyme, independent of substrate concentration or incubation time. The Kᵢ is typically derived from IC₅₀ values using established equations like the Cheng-Prusoff equation for competitive inhibitors.
The binding curve, which plots the measured effect (e.g., percentage of inhibition) against the logarithm of the compound concentration, is the primary source for deriving these values. Mathematical models, ranging from simple one-site binding to more complex multiple binding site models, are then applied to this data to mathematically derive the binding affinity [7].
Quantitative Selectivity Metrics
Moving beyond affinity for a single target, selectivity metrics provide a numerical profile of a compound's interaction across multiple targets. The following table summarizes key traditional and novel metrics.
Table 1: Key Metrics for Quantifying Compound Selectivity
| Metric | Formula / Description | Interpretation | Pros & Cons |
|---|---|---|---|
| Standard Selectivity Score (S(x)) | ( S(x) = \frac{\text{number of values} \geq x}{\text{total number of values}} ) [6] | Measures the fraction of a profiling panel inhibited above a threshold x (e.g., pKd6, or 80% inhibition). |
Pro: Simple, quantitative.Con: Highly dependent on arbitrary threshold; loses nuance of affinity distribution [6]. |
| Gini Coefficient | Based on the Lorenz curve of sorted affinities. Calculated as ( G = \frac{A}{A+B} ), where A is the area between the line of equality and the Lorenz curve, and B is the area below the Lorenz curve. | Ranges from 0 (perfect non-selectivity, equal affinity for all) to 1 (absolute selectivity for one target). | Pro: Single, standardized metric; widely used.Con: Can be insensitive to the number of targets inhibited [6]. |
| Selectivity Entropy | Derived from information theory, calculating the entropy of the affinity distribution. | A lower entropy value indicates a more selective profile. | Pro: Accounts for the entire distribution of activities.Con: Less intuitive than other scores [6]. |
| Partition Index (PI) | ( PI = \frac{(n-1) \times K{d,primary}}{\sum K{d,off-targets}} ) [6] | Estimates the theoretical dilution factor required to abolish all off-target binding while maintaining primary target binding. | Pro: Provides a practical, theoretical utility.Con: Requires accurate Kd values for all targets. |
| Window Score (WS) | ( WS = Activity{primary} - \frac{\sum Activities{off-targets}}{n_{off-targets}} ) [6] | The difference between the activity on the primary target and the average activity on all off-targets. | Pro: Intuitive, easy to compute, offers a different viewpoint from S(x).Con: Sensitive to extreme off-target values. |
| Ranking Score (RS) | Based on the difference in rank between the primary target and other targets when activities are sorted. | A higher score indicates a larger activity gap between the primary target and the nearest off-targets. | Pro: Complements WS by focusing on rank-order of potency [6]. |
The Window Score (WS) and Ranking Score (RS) are two novel metrics designed to address the limitations of the standard selectivity score. The WS gives a direct measure of the activity gap, while the RS ensures that a compound with a large drop in activity after the first target is recognized as highly selective, even if its WS is affected by a long tail of very weak off-target interactions [6].
Experimental Protocols for Selectivity Assessment
Experimental Workflow for Kinase Profiling
A standardized workflow is essential for generating robust and comparable selectivity data. The following diagram outlines the key stages in a typical kinase selectivity profiling study.
Detailed Methodologies for Key Experiments
Protocol 1: Competition Binding Assay for Kd Determination (as used by Davis et al. [6])
- Objective: To measure the dissociation constant (Kd) for a compound against a large panel of kinases.
- Materials:
- Kinase panel (e.g., 439 wild-type and mutant protein kinases)
- Test compounds
- Immobilized ligand beads
- Procedure:
- Incubation: Incubate the kinase with the test compound at a single, high concentration (e.g., 10 µM).
- Binding: Add the mixture to immobilized ligand beads that bind the kinase.
- Detection: Detect bound kinase. If the test compound displaces the kinase from the beads, a Kd is measured.
- Kd Measurement: A Kd value is determined only for kinase-compound pairs where significant displacement is detected at the initial screening concentration.
- Data Output: A matrix of Kd values for each compound across the entire kinase panel.
Protocol 2: "HotSpot" Enzymatic Assay for Percentage Inhibition (as used by Anastassiadis et al. [6])
- Objective: To measure the percentage of enzyme activity inhibition by a compound at a fixed concentration.
- Materials:
- Kinase panel (e.g., 300 kinases)
- Test compounds
- ATP, substrate, and detection reagents
- Procedure:
- Reaction Setup: Combine kinase, a fixed concentration of compound (e.g., 0.5 µM), ATP, and substrate.
- Reaction: Allow the enzymatic reaction to proceed.
- Detection: Quantify the reaction product (e.g., using ADP detection reagents).
- Calculation: Calculate the percentage of inhibition relative to a DMSO control.
- Data Output: A matrix of percentage inhibition values for each compound across the kinase panel at the specified concentration.
Protocol 3: Cellular Potency Assay (NCI-60 Screen) [6]
- Objective: To determine the cellular potency (e.g., EC₅₀) of compounds against a panel of human tumor cell lines.
- Materials:
- NCI-60 cell line panel (60 cell lines from 9 different cancer types)
- Test compounds
- Procedure:
- Cell Treatment: Treat cells with the test compound across a range of concentrations.
- Viability Measurement: Measure cell viability or growth inhibition after a set period (e.g., 48 hours).
- Dose-Response Curve: Generate a dose-response curve for each cell line.
- EC₅₀ Calculation: Calculate the EC₅₀ (concentration for 50% of maximal effect) for each compound-cell line pair.
- Data Output: A profile of cellular potency across 60 different cancer cell lines, allowing for assessment of selectivity in a more physiologically relevant context.
The Scientist's Toolkit: Essential Reagents and Materials
Table 2: Key Research Reagent Solutions for Selectivity Screening
| Item | Function in Selectivity Assessment |
|---|---|
| Kinase Profiling Panels | Pre-configured sets of hundreds of purified human kinases (wild-type and mutant) used for high-throughput screening to generate comprehensive interaction data [6]. |
| Immobilized Ligand Beads | Used in competition binding assays (e.g., Ambit) to capture kinases not bound by the test inhibitor, enabling Kd measurement [6]. |
| ATP & Substrate Peptides | Essential components of kinase enzymatic assays. The compound's ability to inhibit the transfer of phosphate from ATP to the substrate is the measured readout [6]. |
| ADP-Glo / HTRF Kinase Kits | Homogeneous, luminescence- or fluorescence-based detection kits that measure ADP production as a direct indicator of kinase activity, suitable for HTS [6]. |
| Cell-Based Assay Panels (e.g., NCI-60) | Panels of diverse human cell lines used to assess compound potency and selectivity in a cellular context, providing data on permeability, toxicity, and pathway engagement [6]. |
Data Visualization and Interpretation
Visualizing Selectivity Data
Effective visualization is key to interpreting complex selectivity data. The following diagram illustrates the logical relationship between raw data, calculated metrics, and the final selectivity assessment, which bridges the concepts of specific and selective sensing.
Selectivity data is often presented as heatmaps, where colors represent affinity or inhibition levels across a kinome tree, or as bar charts comparing the primary target's potency against key off-targets [8]. The choice of metric significantly influences the perceived selectivity profile. For instance, a compound may appear highly selective with a threshold-based metric like S(pKd7) but show a less promising profile with the Gini coefficient, underscoring the need to use multiple metrics for a comprehensive assessment [6].
Case Study: Applying Metrics in Kinase Research
Analysis of large kinase profiling datasets has demonstrated the complementary nature of different selectivity metrics. For example, when applied to the dataset from Davis et al., the novel Window Score (WS) and Ranking Score (RS) provided additional viewpoints for prioritizing compounds that might be overlooked using the standard selectivity score alone [6]. These metrics are particularly useful because they can be applied to diverse data types—including Kd, IC₅₀, and cellular EC₅₀—offering a universal tool for comparing selectivity profiles regardless of the experimental origin [6]. This is crucial, as selectivity profiles determined in enzymatic assays do not always correlate perfectly with those observed in cellular environments [6].
The quantitative assessment of binding selectivity is a critical component of modern drug discovery and sensor development. Moving beyond simple affinity measurements, robust mathematical frameworks comprising multiple metrics—such as the Window Score, Ranking Score, and Gini coefficient—provide a nuanced and multi-faceted profile of compound behavior [6]. This mathematical rigor allows researchers to frame their work within the broader context of specific versus selective sensing, strategically choosing the appropriate approach for their application [5]. By integrating these quantitative selectivity assessments early and throughout the discovery pipeline, and by employing standardized experimental protocols, scientists can make more informed decisions, de-risk the development of therapeutics, and ultimately increase the likelihood of clinical success.
The concept of the "magic bullet" (Zauberkugel), pioneered by German Nobel laureate Paul Ehrlich in the early 20th century, represents one of the most influential paradigms in the history of therapeutics [9]. Ehrlich envisioned a therapeutic agent that could selectively target and destroy disease-causing pathogens without harming the host's body [10]. This seminal idea laid the intellectual foundation for the entire field of chemotherapy and established the core principle of selective molecular targeting that drives modern drug discovery [11] [12].
Ehrlich's concept was inspired by both his immunological research and the observed selectivity of synthetic dyes used in biological staining [10]. His work established the fundamental principle that therapeutic efficacy depends on the precise molecular interaction between a drug and its target, encapsulated in his famous postulate: "wir müssen chemisch zielen lernen" ("we must learn to aim chemically") [9]. A century later, this principle has evolved into the sophisticated landscape of modern drug design, where computational methods and quantitative approaches enable unprecedented precision in developing targeted therapies [11] [13].
Table: Key Historical Milestones from Magic Bullet to Modern Drug Design
| Time Period | Key Development | Primary Approach | Representative Example |
|---|---|---|---|
| 1900-1910 | Concept of Magic Bullet & Chemotherapy | Empirical screening of synthetic compounds | Salvarsan (Compound 606) for syphilis [9] |
| 1910-1950 | Serum Therapy & Early Antibiotics | Biological agents & natural product isolation | Penicillin, Diphtheria antitoxin [10] |
| 1950-1980 | Rational Drug Design & High-Throughput Screening | Structure-activity relationships (SAR) | AZT for HIV [14] |
| 1980-2000 | Computational Drug Design & Combinatorial Chemistry | Ligand-based & structure-based design | Statins, ACE inhibitors [13] |
| 2000-Present | Systems Pharmacology & Polypharmacology | Network analysis & multi-target drug design | Targeted cancer therapies [13] |
Paul Ehrlich's Foundational Work
Theoretical Foundations and Predecessor Concepts
Ehrlich's magic bullet concept emerged from his systematic investigations across multiple scientific domains. His early work with aniline dyes demonstrated that certain chemicals could selectively stain specific tissues, cells, and cellular components, suggesting the possibility of analogous therapeutic selectivity [10]. This was complemented by his research in immunology, where he observed that antibodies produced in response to toxins could specifically target these pathogens without damaging host tissues—an early biological model of targeted therapy [9].
Ehrlich's side-chain theory (later revised as the receptor theory) provided the first theoretical framework explaining this selectivity [9] [10]. He proposed that chemical structures called "side chains" on cells and pathogens could form specific interactions with therapeutic compounds. This theory represented a radical departure from previous empirical approaches and established the fundamental principle that drug action depends on specific molecular complementarity between therapeutic agents and their targets [10].
Salvarsan: The First Magic Bullet
The practical realization of Ehrlich's concept emerged from his systematic search for a syphilis treatment. Together with Sahachiro Hata, Ehrlich tested hundreds of arsenic compounds, ultimately identifying Compound 606 (arsphenamine), which they named Salvarsan [9]. The discovery process exemplified both the potential and challenges of early targeted therapy development:
- Systematic Screening: Ehrlich and his team methodically synthesized and tested over 600 compounds in what was, for its time, an unprecedentedly large-scale drug development program [10].
- Experimental Validation: Hata's critical observation on August 31, 1909, that a single dose of Compound 606 cured syphilis-infected rabbits without adverse effects demonstrated its efficacy and selectivity [9].
- Clinical Translation: When administered to human patients with advanced syphilis, Salvarsan produced remarkable recoveries, particularly when administered during early disease stages [9].
Despite its success, Salvarsan also revealed the limitations of early magic bullets. The compound required difficult intravenous administration and carried significant side effects, including limb loss and multisystem failure in some cases [14]. This highlighted the challenge of achieving perfect selectivity and foreshadowed the ongoing balancing act between efficacy and toxicity in drug development.
Diagram Title: Theoretical and Experimental Path to Salvarsan
Evolution from Empirical to Targeted Approaches
Refinement of the Magic Bullet Concept
Following Ehrlich's initial breakthrough, the magic bullet concept evolved through several distinct phases. The mid-20th century saw the rise of antibiotic therapies, which represented a new class of magic bullets targeting bacterial pathogens [14]. However, subsequent decades revealed the limitations of single-target approaches, particularly for complex diseases like cancer, HIV/AIDS, and chronic conditions [15].
The failure of single-drug "miracle cures" became apparent with several high-profile cases:
- Azidothymidine (AZT) for HIV/AIDS: Initially heralded as a breakthrough treatment, AZT demonstrated severe side effects and limited long-term efficacy, disappointing patients who had hoped for a complete cure [14].
- Hydroxychloroquine for COVID-19: Recently, this antimalarial drug was promoted as a miracle cure despite limited evidence, following a familiar pattern of public desperation for simple solutions to complex diseases [14].
These examples underscore a critical evolution in understanding: true magic bullets remain elusive for many complex diseases, and effective therapy often requires multi-target approaches or combination therapies that address disease complexity [13].
The Rise of Quantitative and Computational Methods
Modern drug discovery has progressively incorporated quantitative approaches that enable more precise targeting. The introduction of randomized clinical trials in the mid-20th century established a rigorous methodology for evaluating therapeutic efficacy and safety [15]. Simultaneously, advances in analytical chemistry and pharmacokinetics provided tools to quantitatively measure drug distribution, metabolism, and target engagement [16].
The late 20th century witnessed the emergence of Computer-Aided Drug Discovery (CADD), which applies computational power to systematically explore the relationship between chemical structure and biological activity [12]. Key computational approaches include:
- Quantitative Structure-Activity Relationship (QSAR): Establishes mathematical models between chemical structural features and biological activity [12].
- Molecular Docking: Predicts the binding mode and affinity of ligands to target proteins [12].
- Chemical Similarity Searching: Identifies compounds with structural similarity to known active molecules [13].
These methods have progressively shifted drug discovery from Ehrlich's empirical screening toward prediction-driven design, dramatically improving the efficiency of identifying selective therapeutic agents [13] [12].
Table: Evolution of Quantitative Methods in Drug Development
| Method Category | Era of Prominence | Key Principles | Impact on Selectivity & Specificity |
|---|---|---|---|
| Empirical Compound Screening | 1900-1980 | Test compound libraries in biological assays | Low specificity; dependent on chance discovery |
| Structure-Activity Relationships (SAR) | 1960-1990 | Systematic modification of lead compounds | Medium specificity; incremental optimization |
| Quantitative Structure-Activity Relationship (QSAR) | 1970-Present | Mathematical modeling of chemical-biological activity relationships | High specificity; predictive optimization |
| Molecular Docking & Structure-Based Design | 1980-Present | Computational prediction of ligand-receptor interactions | Very high specificity; rational design |
| Systems Pharmacology & Polypharmacology | 2000-Present | Network analysis of multi-target drug interactions | Ultra-specificity; controlled polypharmacology |
Modern Drug Design: Principles and Methodologies
Ligand-Based Drug Design
Ligand-based drug design (LBDD) represents a direct evolution of Ehrlich's principle that chemical structure determines biological activity [13]. This approach is particularly valuable when the three-dimensional structure of the target is unknown. The fundamental principle underpinning LBDD is the chemical similarity principle, which states that structurally similar molecules tend to have similar biological properties [13].
Key methodologies in modern LBDD include:
- Chemical Fingerprinting: Molecular structures are encoded as binary fingerprints representing the presence or absence of specific structural features. Common implementations include:
- Path-based fingerprints (Daylight, Obabel FP2) that capture bond paths of different lengths
- Substructure-based fingerprints (MACCS keys) that use predefined structural fragments [13]
- Similarity Metrics: The Tanimoto index quantifies chemical similarity by comparing fingerprint bits, with values typically >0.7 indicating significant similarity [13].
- Similarity-Based Screening: Known active compounds are used as queries to search chemical databases for structurally similar candidates with potentially improved properties [13].
LBDD enables researchers to leverage existing chemical and biological knowledge to guide the discovery of new therapeutic agents, efficiently transitioning from initial hits to optimized leads [13].
Structure-Based Drug Design
Structure-based drug design (SBDD) represents the modern realization of Ehrlich's vision of molecular complementarity [13] [12]. This approach directly utilizes the three-dimensional structure of target proteins to design ligands with optimal shape and chemical complementarity. SBDD has been revolutionized by advances in structural biology (particularly X-ray crystallography and cryo-electron microscopy) and computational power [13].
The SBDD workflow typically involves:
- Target Identification and Validation: Selection of biologically relevant proteins with disease-modifying potential [13].
- Structure Determination: Experimental resolution of the target protein's three-dimensional structure [13].
- Binding Site Analysis: Identification and characterization of potential ligand binding pockets [13].
- De Novo Ligand Design or Screening: Computational generation or selection of compounds complementary to the binding site [12].
- Molecular Dynamics and Binding Affinity Optimization: Refinement of lead compounds through simulation and free energy calculations [12].
SBDD has produced numerous successful therapeutics, particularly for well-characterized enzyme targets, demonstrating the power of structure-guided approaches for achieving high selectivity [13].
Systems Pharmacology and Polypharmacology
Contemporary drug discovery has begun to transcend Ehrlich's single-target paradigm through systems pharmacology and polypharmacology [13]. These approaches recognize that many complex diseases involve multiple pathological pathways and that therapeutic efficacy often requires modulation of multiple targets [13].
Key concepts in this evolving paradigm include:
- Network Pharmacology: Analysis of drug-target interactions using bipartite networks that capture the complex relationships between multiple drugs and multiple targets [13].
- Chemical Similarity Networks: Clustering of diverse chemical structures into distinct scaffolds (chemotypes) that can be correlated with specific target profiles [13].
- Selective Polypharmacology: Intentional design of compounds that interact with a specific set of targets to achieve therapeutic efficacy while minimizing adverse effects [13].
This systems-level approach represents a sophisticated evolution beyond the single magic bullet toward targeted multi-specific therapies that address disease complexity while maintaining selectivity against critical off-targets [13].
Diagram Title: Modern Drug Design Approaches Workflow
Advanced Quantitative and Analytical Techniques
Complex Generic Drug Development
Modern drug development increasingly relies on sophisticated quantitative comparative approaches to establish therapeutic equivalence, particularly for complex drug products [17]. These methods address significant challenges in applying conventional statistical bioequivalence methods to complex data sets:
- API Sameness Assessment: Advanced analytical techniques including NMR, AFFF-MALS, and mass spectrometry are employed to establish active pharmaceutical ingredient (API) equivalence for complex generics [17].
- Particle Size Distribution Analysis: Equivalence testing of complex particle size distribution profiles using advanced metrics like Earth Mover's Distance [17].
- Dissolution Profile Similarity: Application of bootstrap bias-corrected similarity factors (f₂) for robust comparison of dissolution profiles [17].
These methodologies represent the cutting edge of quantitative pharmaceutical analysis, enabling precise characterization and comparison of complex drug products while maintaining regulatory standards [17].
Selective Sensing and Molecular Recognition
The principles of molecular recognition central to Ehrlich's magic bullet concept have found direct application in pharmaceutical analysis through molecularly imprinted polymers (MIPs) [3]. MIPs are synthetic polymers with specific recognition sites complementary to target molecules in shape, size, and functional group orientation [3].
Key applications in pharmaceutical analysis include:
- Potentiometric Ion-Selective Electrodes: MIPs enhance selectivity by creating specific recognition cavities that minimize interference from ions with similar charges or lipophilicity [3].
- Solid-Contact Ion-Selective Electrodes (SC-ISEs): Incorporation of graphene nanoplatelets as ion-to-electron transducer layers prevents water layer formation and enhances sensor stability [3].
- Multi-Analyte Determination: Concurrent quantification of drug combinations (e.g., donepezil and memantine for Alzheimer's disease) using MIP-based sensors with minimal cross-reactivity [3].
These sensing technologies directly operationalize the principle of molecular complementarity for analytical purposes, creating tools with antibody-like specificity through synthetic chemistry [3].
Table: Research Reagent Solutions for Selective Drug Development
| Reagent/Chemical | Category | Function in Research & Development |
|---|---|---|
| Molecularly Imprinted Polymers (MIPs) | Synthetic Receptor | Create specific molecular recognition sites for target analytes [3] |
| Graphene Nanoplatelets | Nanomaterial Transducer | Enhance electron transfer and prevent water layer formation in sensors [3] |
| Potassium Tetrakis(p-chlorophenyl) Borate | Ionic Additive | Cation exchanger in ion-selective membranes [3] |
| Ethylene Glycol Dimethacrylate (EGDMA) | Cross-linking Monomer | Creates rigid polymer structure with molecular memory in MIPs [3] |
| Methacrylic Acid (MAA) | Functional Monomer | Provides complementary functional groups for template binding in MIPs [3] |
| Azobisisobutyronitrile (AIBN) | Polymerization Initiator | Generates free radicals to initiate thermal polymerization [3] |
Experimental Protocols and Methodologies
Molecularly Imprinted Polymer Synthesis Protocol
The preparation of MIPs for selective drug sensing follows a well-established precipitation polymerization methodology [3]:
- Template-Monomer Complexation: Dissolve 0.5 mmol of the target drug (template) in 40.0 mL of dimethylsulfoxide (DMSO) as porogenic solvent. Add 2.0 mmol of methacrylic acid (MAA) as functional monomer and sonicate for 15 minutes to allow complex formation through non-covalent interactions [3].
- Polymerization Mixture Preparation: Add 8.0 mmol of ethylene glycol dimethacrylate (EGDMA) as cross-linking monomer and 0.6 mmol of azobisisobutyronitrile (AIBN) as radical initiator to the template-monomer solution. Sonicate the mixture for 1 minute to ensure homogeneity [3].
- Polymerization Process: Purge the mixture with nitrogen gas for 15 minutes to remove oxygen, then incubate in a thermostatic oil bath at 60°C for 24 hours to complete the polymerization reaction [3].
- Template Removal: After polymerization, extract the template molecules using appropriate washing solvents (typically methanol:acetic acid mixtures) to create specific recognition cavities [3].
- Polymer Characterization: Characterize the resulting MIPs using scanning electron microscopy (SEM), Brunauer-Emmett-Teller (BET) surface area analysis, and infrared spectroscopy to confirm structural properties and template removal [3].
Sensor Preparation and Drug Quantification Protocol
The development of MIP-based sensors for pharmaceutical analysis involves the following methodological steps [3]:
- Electrode Modification: Prepare graphene-modified glassy carbon electrodes (GCE) by applying graphene nanoplatelets as a hydrophobic transducer layer to prevent water layer formation and enhance charge transfer [3].
- Membrane Formulation: Incorporate the prepared MIPs into ion-selective membranes along with appropriate plasticizers (e.g., 2-nitrophenyl octyl ether) and polymeric matrices (e.g., polyvinyl chloride) [3].
- Sensor Calibration: Characterize sensor performance by measuring potential response across a concentration range of the target drug (typically 10⁻² to 10⁻⁷ M). Determine slope, detection limit, and working range for each sensor [3].
- Selectivity Assessment: Evaluate sensor specificity by measuring potential response in the presence of structurally similar compounds and co-formulated drugs. Calculate selectivity coefficients to quantify interference levels [3].
- Pharmaceutical Application: Apply the validated sensors to quantify target drugs in pharmaceutical formulations and biological samples (e.g., spiked human plasma) without prior separation, demonstrating practical utility [3].
The evolution from Paul Ehrlich's original magic bullet concept to modern drug design represents a continuous refinement of the fundamental principle of molecular specificity [11] [9]. While Ehrlich's vision of perfectly selective therapies has proven more complex than initially imagined, his core insight—that therapeutic efficacy depends on specific molecular recognition—has been overwhelmingly validated [11] [12].
Contemporary drug discovery has transcended Ehrlich's empirical screening through the development of sophisticated quantitative and computational methods that enable rational design of therapeutic agents [13] [12]. The paradigm has shifted from single-target magic bullets toward selective polypharmacology, where drugs are designed to engage multiple specific targets in a controlled manner to address disease complexity [13].
The most significant advances have emerged at the intersection of multiple disciplines: structural biology provides atomic-resolution targets, computational chemistry enables rational design, analytical technology permits precise quantification, and systems biology contextualizes drug action within complex biological networks [13] [12]. This integrated approach represents the contemporary realization of Ehrlich's vision—not as a simple magic bullet, but as a sophisticated toolkit for molecular targeting that continues to evolve toward greater precision, efficacy, and safety in pharmaceutical interventions [11].
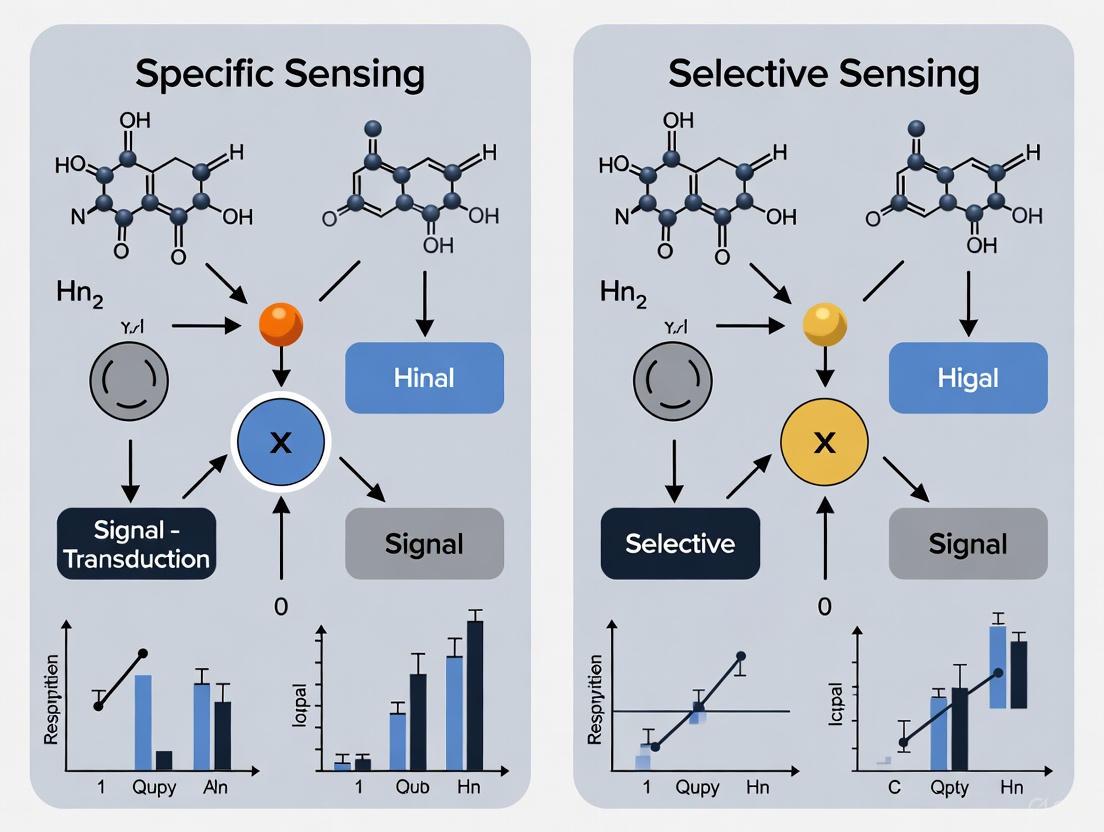
In the realm of biosensing and therapeutic development, the concepts of specificity and selectivity represent two distinct paradigms for molecular recognition. Specificity refers to the ideal scenario where a recognition element interacts exclusively with a single target analyte, employing a classic "lock-and-key" mechanism that recognizes no other molecules [5]. This ideal is approached by certain biological pairs such as antibodies and their antigens, aptamers, and streptavidin/biotin combinations. In contrast, selectivity describes a practical approach where recognition elements demonstrate cross-reactivity with multiple related analytes, creating differential interaction patterns that collectively identify samples through a "fingerprint" rather than isolated target identification [5].
The fundamental thesis of this whitepaper argues that while true biological specificity remains largely theoretical, selectively pragmatic approaches offer more feasible and often more informative pathways for both sensing applications and drug development. The biological reality is that molecular interactions operate along a spectrum of binding affinities rather than exhibiting absolute binary recognition, making perfect specificity an elusive goal while selective recognition provides powerful tools for navigating complex biological systems.
Theoretical Foundations: The Specificity Fallacy in Biological Systems
The Myth of the Perfect Lock and Key
The concept of absolute biological specificity originates from Emil Fischer's 1894 "lock and key" analogy, which suggested precise molecular complementarity between enzymes and substrates. However, modern structural biology has revealed that protein binding sites exhibit considerable flexibility and adaptability, employing induced fit and conformational selection mechanisms that inherently allow for some degree of cross-reactivity [5]. Even highly specific biological recognition pairs such as antibodies demonstrate measurable cross-reactivity with structurally similar molecules, particularly when tested against large panels of potential interactors.
The theoretical ideal of a completely specific sensor—one that binds only its intended target with zero cross-reactivity—remains largely unattainable in practice due to several biological constraints. First, the conserved structural motifs across protein families and metabolite classes create inherent recognition similarities. Second, the dynamic nature of biological structures allows for transient interactions that may not be detected in initial validation studies but emerge in different biological contexts. Third, the limited chemical diversity of biological recognition elements compared to the vast array of potential analytes ensures that some degree of cross-reactivity is inevitable [5].
Selectivity as an Evolutionary Pragmatism
From an evolutionary perspective, selective rather than perfectly specific recognition provides significant advantages. Biological systems have evolved promiscuous interactions that enable functional adaptability, regulatory networks, and metabolic efficiency. This pragmatic approach is evident in immune recognition, where a limited repertoire of antibodies must recognize a virtually infinite array of potential antigens, and in signal transduction, where related kinase families share substrates while maintaining pathway fidelity [5].
The olfactory system provides a compelling biological example of selective sensing par excellence. Rather than employing specific receptors for each possible odorant molecule, the olfactory system uses a combination of broadly tuned receptors that generate unique activation patterns across the receptor array. This "combinatorial coding" strategy enables the recognition of vastly more odorants than the number of receptors available, demonstrating the power and efficiency of selective sensing in biological systems [5].
Quantitative Comparison: Specificity vs. Selectivity in Experimental Systems
Table 1: Performance Comparison of Specific vs. Selective Sensing Approaches
| Parameter | Specific Sensing | Selective Sensing | Measurement Basis |
|---|---|---|---|
| Cross-reactivity | Minimal (theoretical) to Low | Moderate to High | Ratio of signal for target vs. non-target analytes |
| Multiplexing Capability | Low (requires dedicated elements per target) | High (single array for multiple analytes) | Number of distinct analytes detectable simultaneously |
| Development Time | Long (months to years) | Moderate (weeks to months) | Time from concept to validated recognition |
| Tolerance to Environmental Variation | Low | High | Performance maintenance across pH, temperature, matrix changes |
| Unknown Analyte Detection | None | High | Ability to identify unanticipated analytes |
| Data Richness | Individual analyte concentration | Pattern-based sample fingerprint | Information content per experiment |
Table 2: Analytical Performance Metrics of Representative Sensing Platforms
| Platform | Sensitivity | Discriminatory Power | Complex Matrix Performance | Reference |
|---|---|---|---|---|
| Antibody-based (ELISA) | High (pM-nM) | Target-specific | Moderate (subject to interference) | [5] |
| Aptamer-based | High (pM-nM) | Target-specific | Moderate | [5] |
| Lectin Arrays | Moderate (nM-μM) | High for glycan patterns | High (tolerates biological fluids) | [5] |
| Quantum Sensors | Very High (fM-pM) | Pattern-based | Emerging | [18] |
| Sulfur Quantum Dot Probes | Moderate (μM range) | Selective for metal ions | High in complex plant extracts | [19] |
Experimental Paradigms: Methodologies for Selective Sensing
Array-Based Sensing Platforms
Array-based sensing employs multiple cross-reactive recognition elements that collectively generate response patterns for sample identification and classification. The experimental workflow typically involves:
Array Design and Fabrication: Selection and immobilization of multiple cross-reactive receptors (e.g., lectins, synthetic receptors, peptides) in defined spatial patterns [5].
Sample Exposure and Binding: Application of the sample to the array under controlled conditions (buffer composition, temperature, time) to allow differential binding to array elements.
Signal Detection and Acquisition: Measurement of binding events through various transduction mechanisms (fluorescence, colorimetric, electrochemical, magnetic).
Pattern Recognition and Data Analysis: Application of statistical and machine learning algorithms (principal component analysis, linear discriminant analysis, neural networks) to convert response patterns into sample classifications [5].
The critical advantage of this approach is that a relatively small number of sensing elements (n) can theoretically discriminate between a much larger number of analytes (potentially up to 2^n distinct states), making it highly efficient for complex sample analysis [5].
Fluorescence-Enhanced Sensing with Sulfur Quantum Dots
A recent example of selective sensing development demonstrates the detection of lead (II) ions in complex plant extracts using sulfur quantum dots (SQDs) in deep eutectic solvent (DES) micelles [19]. The detailed methodology includes:
Synthesis of Sulfur Quantum Dots:
- Prepare SQDs through sonication-assisted H₂O₂ etching approach
- Characterize SQDs using transmission electron microscopy for size distribution and UV-Vis and fluorescence spectroscopy for optical properties
DES Micelle Formation and SQD Incorporation:
- Form surfactant-like deep eutectic solvents with long alkyl chains
- Incorporate SQDs into DES micelles, noting significant aggregation that enhances luminescent intensity
- Optimize DES composition for maximum fluorescence enhancement
Sensor Calibration and Validation:
- Expose DES-sensitized SQDs to Pb²⁺ standards across concentration range (20-100 μM)
- Measure fluorescence quenching ("turn-off" response) with increasing Pb²⁺ concentration
- Establish calibration curve with limit of detection (1.61 μM) and linear range
- Validate method in Paris polyphylla extracts with recovery studies [19]
This approach demonstrates the selectivity principle through its preferential response to Pb²⁺ over other metal ions, achieved without absolute specificity through pattern-based recognition.
The Researcher's Toolkit: Essential Reagents and Materials
Table 3: Key Research Reagent Solutions for Selective Sensing Development
| Reagent/Material | Function | Example Application | Technical Notes |
|---|---|---|---|
| Lectin Arrays | Selective recognition of carbohydrate motifs | Glycan profiling of cell surfaces and glycoproteins | Multiple lectins with overlapping specificities create discriminatory patterns [5] |
| Aptamer Libraries | Nucleic acid-based recognition elements | Detection of proteins, small molecules, cells | SELEX process generates recognition elements; more stable than antibodies [5] |
| Sulfur Quantum Dots | Fluorescent sensing probes | Heavy metal ion detection in complex samples | DES-sensitized SQDs show enhanced fluorescence and selective quenching [19] |
| Nitrogen-Vacancy (NV) Centers | Quantum sensing of magnetic fields | Nanoscale NMR, single-cell spectroscopy | Unprecedented spatial resolution; works under ambient conditions [18] |
| Deep Eutectic Solvents | Bio-compatible media for enhanced sensing | Improve quantum dot fluorescence and stability | Surfactant-like properties enable micelle formation for analyte concentration [19] |
| Optically Pumped Magnetometers | Ultrasensitive magnetic field detection | Magnetoencephalography, magnetocardiography | Does not require cryogenics; wearable sensor designs possible [18] |
Signaling Pathways and Molecular Interactions in Selective Recognition
Applications in Biomedical Research and Drug Development
Disease Diagnosis Through Pattern Recognition
The selective sensing approach has demonstrated particular utility in diagnostic applications where disease states are characterized by complex biomarker patterns rather than single analyte alterations. For example, diseases such as cancer, neurodegenerative disorders, and autoimmune conditions often involve subtle multiparameter changes in biomarker profiles that may not include pathognomonic single markers [5]. Selective sensor arrays can detect these patterns without requiring prior knowledge of all relevant biomarkers, operating in a "hypothesis-less" discovery mode that can reveal previously unrecognized diagnostic signatures [5].
This approach has been successfully applied to distinguish between disease and healthy states through patterns in:
- Serum glycoprotein profiles using lectin arrays
- Volatile organic compound patterns in breath using chemical sensor arrays
- Metabolomic fingerprints using spectroscopic methods with multivariate analysis
- Protein phosphorylation patterns using peptide substrate arrays [5]
Therapeutic Development and Validation
In drug development, selective sensing approaches provide powerful tools for:
- Mechanism of action studies through multiparameter cellular response profiling
- Toxicity screening using pattern-based responses in cell models
- Target engagement verification through downstream signaling pattern analysis
- Polypharmacology assessment for drugs with multiple targets [5]
The pharmaceutical industry increasingly recognizes that many effective drugs act through selective rather than specific interactions with multiple targets, creating a "therapeutic footprint" that corresponds to efficacy while minimizing side effects. Selective sensing platforms are ideally suited to characterize these complex interaction profiles during drug development.
Emerging Technologies and Future Directions
Quantum Sensing Platforms
Quantum technologies represent a frontier in selective sensing with potential applications across biomedical research. Two promising platforms include:
Optically Pumped Magnetometers (OPMs):
- Detect magnetic fields with sensitivities approaching 10 fT Hz⁻¹/² without cryogenic requirements
- Enable wearable magnetoencephalography with superior spatial resolution and patient comfort
- Allow vector magnetic field detection compared to single-component SQUID sensors [18]
Nitrogen-Vacancy (NV) Centers in Diamond:
- Provide nanoscale spatial resolution for magnetic field detection
- Function across wide temperature, pressure, and magnetic field ranges
- Enable single-molecule NMR and single-cell spectroscopy
- Applicable to local temperature sensing in biological systems [18]
These quantum platforms demonstrate how advances in physics and engineering are creating new opportunities for selective sensing with unprecedented sensitivity and spatial resolution.
Integrated Specific and Selective Sensing
The most promising future direction involves hybrid approaches that combine elements of both specific and selective sensing to create more powerful and informative platforms. Integration strategies include:
- Class-specific selectivity that limits cross-reactivity within biologically relevant analyte groups
- Specific sensor arrays that provide quantitative data on known biomarkers while selective elements discover novel patterns
- Multi-modal platforms that combine specific molecular recognition with selective physical parameter sensing [5]
This integrated approach leverages the complementary strengths of both paradigms: the quantitative precision of specific sensing for validated biomarkers and the discovery power of selective sensing for novel pattern recognition.
The biological reality of molecular recognition firmly establishes selectivity as the pragmatic approach for navigating complex biological systems, while true specificity remains largely theoretical. The experimental evidence from diverse fields including glycan sensing, metal ion detection, and quantum sensing demonstrates that selective approaches provide robust, informative, and practical solutions for biomedical research and therapeutic development.
As sensing technologies continue to advance, the integration of specific and selective elements will create increasingly powerful platforms for understanding biological complexity and developing effective interventions for human disease. By embracing the inherent selectivity of biological systems rather than pursuing the elusive goal of perfect specificity, researchers can develop more effective diagnostic tools and therapeutic strategies that acknowledge and exploit the complexity of living systems.
The development of β-adrenergic receptor antagonists (beta-blockers) represents a pivotal case study in the evolution of targeted therapeutic agents, mirroring the core principles of specific versus selective sensing approaches. Early first-generation beta-blockers were non-selective agents, inhibiting both β1 and β2 adrenergic receptors with similar affinity. This lack of specificity, while therapeutically beneficial for certain cardiac conditions, resulted in off-target effects in organ systems expressing β2 receptors, particularly the pulmonary and vascular systems [20]. The introduction of second-generation beta-blockers, including metoprolol, marked a significant advancement through their cardioselective properties, demonstrating preferential binding to β1 receptors predominantly located in cardiac tissue [21]. This case study examines metoprolol as a paradigm for receptor-selective drug design, analyzing its mechanistic basis, clinical consequences, and the experimental methodologies essential for quantifying its selectivity profile. The transition from non-selective to cardioselective agents exemplifies the broader research thesis that strategic selectivity in biological targeting can optimize therapeutic efficacy while mitigating adverse effect profiles.
Beta-Blocker Generations and Receptor Selectivity
Beta-blockers are classified into three generations based on their receptor affinity and additional pharmacological properties [20]. This evolution reflects the pharmaceutical industry's ongoing pursuit of greater receptor specificity to enhance clinical utility.
First-generation beta-blockers (e.g., propranolol, sotalol) are non-selective, meaning they antagonize both β1 and β2 adrenergic receptors with comparable potency [20]. While effective for many cardiac indications, their β2-blockade in bronchial smooth muscle can induce bronchoconstriction, making them potentially hazardous for patients with asthma or COPD [22] [23].
Second-generation beta-blockers (e.g., metoprolol, atenolol, bisoprolol) were developed to provide cardioselectivity. These agents have a higher affinity for β1-adrenergic receptors, which are predominantly located in the heart, over β2-receptors found in the lungs, blood vessels, and other tissues [21] [20]. Metoprolol, one of the first selective β1-antagonists, was specifically designed to have fewer side effects than its non-selective predecessors, particularly with regard to bronchospasm and peripheral vasoconstriction [21].
Third-generation beta-blockers (e.g., carvedilol, nebivolol) extend the selectivity concept by combining β1-blockade with complementary vasodilatory properties, achieved through additional mechanisms such as α1-adrenoreceptor blockade or nitric oxide-mediated vasodilation [20].
Table 1: Classification of Beta-Blockers by Generation and Selectivity
| Generation | Key Examples | Primary Receptor Target(s) | Distinguishing Pharmacological Properties |
|---|---|---|---|
| First (Non-selective) | Propranolol, Sotalol, Nadolol | β1, β2 (non-selective) | No preferential affinity; foundation class. |
| Second (Cardioselective) | Metoprolol, Atenolol, Bisoprolol | β1 (selective) | Preferentially blocks cardiac β1 receptors; reduced risk of bronchospasm. |
| Third (Vasodilatory) | Carvedilol, Nebivolol, Labetalol | β1, plus α1 (carvedilol) or β3 (nebivolol) | Additional mechanisms cause vasodilation; may have antioxidant/antifibrotic effects. |
The degree of cardioselectivity is dose-dependent. At lower therapeutic doses, metoprolol exhibits strong β1 preference, but this selectivity diminishes at higher doses as β2-receptor blockade becomes more significant [21].
Metoprolol: A Closer Look at a Cardioselective Agent
Mechanism of Action and Pharmacokinetics
Metoprolol is a lipophilic, second-generation beta-blocker that competitively antagonizes catecholamines at β1-adrenergic receptors. Its molecular structure, based on substituted phenylpropanolamine, provides the necessary configuration for selective β1 blockade [21].
Its mechanism of action in cardiomyocytes involves several precise steps [21]:
- Receptor Binding: Metoprolol binds competitively to β1-adrenergic receptors on the surface of cardiac cells, particularly in the sinoatrial (SA) node, atrioventricular (AV) node, and ventricular myocardium.
- Inhibition of Intracellular Signaling: By occupying the receptor, it inhibits catecholamine-driven activation of the intracellular cyclic adenosine monophosphate (cAMP) and protein kinase A (PKA) pathway.
- Modulation of Action Potentials: In the SA and AV nodes, metoprolol reduces the slope of phase 4 depolarization, thereby decreasing the firing rate of pacemaker cells and lowering heart rate (negative chronotropy).
- Reduced Contractility: In the ventricular myocardium, it decreases contractility (negative inotropy) by inhibiting the PKA-mediated calcium influx through L-type calcium channels, which is essential for the force of cardiac muscle contraction.
The net hemodynamic effects are a reduction in heart rate, cardiac output, and blood pressure, which lower myocardial oxygen demand and underlie its efficacy in conditions like hypertension, angina, and heart failure [21].
Metoprolol is primarily formulated as two salts: the immediate-release metoprolol tartrate and the extended-release metoprolol succinate. The succinate formulation is designed for once-daily dosing and provides more stable plasma concentrations, which is particularly advantageous in managing chronic heart failure [21] [24].
Clinical Impact of Selectivity: Efficacy and Safety
The cardioselectivity of metoprolol translates directly into its clinical efficacy and safety profile, particularly when compared to non-selective agents.
Hemodynamic and Symptomatic Efficacy: In hypertrophic obstructive cardiomyopathy (HOCM), a systematic review of 21 studies demonstrated that beta-blockers, including metoprolol, significantly reduce the left ventricular outflow tract (LVOT) gradient (SMD -1.57; 95% CI -2.07 to -1.07) and heart rate (SMD -1.19; 95% CI -2.24 to -0.14) [25]. These hemodynamic improvements were consistently associated with symptomatic benefits, including improved New York Heart Association (NYHA) functional class and exercise tolerance [25]. In heart failure with reduced ejection fraction (HFrEF), metoprolol succinate has proven to be a cornerstone therapy, improving survival and reducing hospitalizations [21] [26]. Furthermore, a recent meta-analysis confirms that beta-blockers significantly improve outcomes in post-myocardial infarction patients with mildly reduced ejection fraction (LVEF 40-49%), reducing a composite endpoint of all-cause death, new MI, or heart failure by 25% (HR 0.75) compared to no beta-blocker therapy [27].
Safety Advantages in Comorbid Conditions: The primary clinical advantage of metoprolol's selectivity becomes evident in patients with comorbid respiratory disease. A 2025 systematic review and meta-analysis specifically investigated the impact of beta-blockers on respiratory function, measured by forced expiratory volume in 1 second (FEV1), in asthma patients [22] [23]. The analysis revealed a statistically significant subgroup effect, demonstrating that cardio-selective beta-blockers are better tolerated than non-selective agents. While non-selective beta-blockers significantly decreased FEV1 compared to placebo (SMD -0.74), the effect of cardio-selective agents was less pronounced [22] [23]. This supports the conclusion that cardio-selective beta-blockers may be cautiously considered in patients with asthma and strong cardiovascular indications, provided appropriate monitoring is in place [23].
Table 2: Quantitative Clinical Outcomes of Beta-Blocker Therapy Across Conditions
| Clinical Condition | Key Efficacy Outcomes | Quantitative Measure of Effect | Context & Comparison |
|---|---|---|---|
| HOCM [25] | Reduction in LVOT Gradient | SMD: -1.57 (95% CI: -2.07 to -1.07) | Robust effect on hemodynamic obstruction. |
| HOCM [25] | Reduction in Heart Rate | SMD: -1.19 (95% CI: -2.24 to -0.14) | Effect remained heterogeneous. |
| Post-MI (LVEF 40-49%) [27] | Composite of Death, New MI, or HF | HR: 0.75 (95% CI: 0.58 to 0.97); Absolute Risk: 10.7% vs 14.4% | 25% relative risk reduction with beta-blockers. |
| Asthma (FEV1) [23] | FEV1 after Non-selective β-blocker | SMD: -0.74 vs. Placebo (95% CI: -1.15 to -0.34) | Significant decrease in lung function. |
| Asthma (FEV1) [23] | FEV1 after Cardio-selective β-blocker | Better than non-selective (P=0.03 for subgroup difference) | I² = 80%, indicating significantly better tolerance. |
Experimental Protocols for Evaluating Receptor Selectivity
Determining the receptor selectivity profile of a compound like metoprolol requires a multi-faceted experimental approach, ranging from isolated receptor assays to whole-organ physiology.
In Vitro Receptor Binding and Functional Assays
Objective: To quantify the binding affinity (Ki) and functional potency (IC50) of metoprolol for β1 and β2-adrenergic receptors and calculate its selectivity ratio.
Methodology:
- Membrane Preparation: Isolate plasma membranes from cell lines stably expressing human β1-adrenergic receptors (e.g., CHO cells) and, separately, β2-adrenergic receptors.
- Radioligand Binding Assay:
- Incubate the membrane preparations with a fixed concentration of a radioactive antagonist (e.g., [³H]-Dihydroalprenolol) and increasing concentrations of unlabeled metoprolol.
- Perform the assay in a binding buffer, incubate to equilibrium, and then separate the bound from free radioligand via rapid filtration.
- Quantify the radioactivity in the filter plates using a scintillation counter.
- Data Analysis: Plot the percentage of radioligand displaced versus the logarithm of metoprolol concentration. Use non-linear regression to determine the IC50 (concentration that inhibits 50% of specific binding). Calculate the inhibition constant (Ki) using the Cheng-Prusoff equation: Ki = IC50 / (1 + [L]/Kd), where [L] is the radioligand concentration and Kd is its dissociation constant. The β1/β2 selectivity ratio is calculated as Ki(β2) / Ki(β1).
- Functional Assay (cAMP Accumulation):
- Use the same transfected cell lines. Stimulate the cells with a non-selective β-agonist like isoprenaline to induce cAMP production.
- Pre-treat cells with increasing concentrations of metoprolol to antagonize the agonist response.
- Measure intracellular cAMP levels using a cAMP immunoassay or a reporter gene assay.
- Data Analysis: Generate concentration-response curves for isoprenaline in the presence and absence of metoprolol. Calculate the apparent pA2 value (the negative logarithm of the antagonist concentration that requires a twofold increase in agonist concentration to produce the same effect) for each receptor subtype. A higher pA2 value at β1 vs. β2 receptors confirms functional selectivity.
Ex Vivo and In Vivo Confirmation of Selectivity
Objective: To confirm the functional cardioselectivity of metoprolol in integrated physiological systems.
Methodology:
- Isolated Tissue Bath:
- Mount an isolated guinea pig or rat right atrial strip (rich in β1 receptors) and an isolated tracheal strip or bronchial ring (relaxation mediated by β2 receptors) in organ baths containing oxygenated physiological solution.
- Pre-contract the trachea with a muscarinic agonist (e.g., carbachol). For both tissues, establish a concentration-response curve to a non-selective β-agonist (isoprenaline) to induce tachycardia in the atria and bronchodilation in the trachea.
- Repeat the concentration-response curves after incubating the tissues with a fixed concentration of metoprolol.
- Data Analysis: Determine the dose-ratio (shift of the agonist curve) caused by metoprolol in each tissue. A significantly greater dose-ratio in the atrial tissue versus the tracheal tissue demonstrates functional cardioselectivity.
- In Vivo Hemodynamic and Pulmonary Model:
- Use anesthetized, instrumented animals (e.g., dogs or pigs). Implant a flow probe on the ascending aorta to measure cardiac output and a pressure transducer in the left ventricle to measure contractility (dP/dt).
- Instrument the airway to measure airway resistance.
- Administer increasing intravenous doses of metoprolol and monitor changes in heart rate, cardiac contractility, and airway resistance in response to subsequent challenge doses of a β2-selective agonist (e.g., salbutamol).
- Data Analysis: Compare the degree to which metoprolol inhibits the cardiac (β1-mediated) versus pulmonary (β2-mediated) responses to agonist challenge. A cardioselective agent will antagonize the cardiac effects at doses that have minimal impact on the agonist-induced bronchodilation.
Visualization of Signaling Pathways and Experimental Workflows
Beta-Blocker Selectivity and Signaling Pathways
Diagram 1: Metoprolol's Selective Antagonism of the β1-Adrenergic Signaling Pathway. This diagram illustrates the canonical cAMP-PKA signaling pathway activated by catecholamines. Metoprolol (red) competitively and preferentially inhibits the β1-receptor in cardiac tissue, thereby blunting the downstream effects on heart rate and contractility. Its relative sparing of the β2-receptor in pulmonary tissue underlies its improved safety profile in patients with reactive airways. AC, adenylate cyclase; PKA, protein kinase A.
Experimental Workflow for Assessing Selectivity
Diagram 2: A Tiered Experimental Workflow for Profiling Beta-Blocker Selectivity. The workflow progresses from molecular-level in vitro assays to confirm direct receptor interaction, through tissue-level ex vivo experiments to measure functional antagonism, and finally to integrated in vivo models that confirm the physiological manifestation of selectivity. This multi-tiered approach is critical for comprehensive drug characterization. HR, heart rate.
The Scientist's Toolkit: Key Research Reagents and Materials
The experimental protocols for evaluating beta-blocker selectivity rely on a standardized set of research tools and reagents.
Table 3: Essential Research Reagent Solutions for Beta-Blocker Selectivity Studies
| Reagent / Material | Function and Application in Research |
|---|---|
| Cloned Cell Lines(e.g., CHO, HEK293) | Engineered to stably express high levels of human β1 or β2 adrenergic receptors. Essential for in vitro binding and functional assays to determine compound affinity and selectivity free from other receptor interference. |
| Radiolabeled Ligands(e.g., [³H]-DHA, [¹²⁵I]-Cyanopindolol) | Allow for direct quantification of receptor binding. The degree to which a test compound (e.g., metoprolol) can displace a known radioligand is used to calculate its binding affinity (Ki). |
| cAMP Detection Kits(e.g., ELISA, FRET, HTRF) | Measure intracellular cAMP accumulation, the primary second messenger in β-receptor signaling. Used in functional assays to determine if receptor blockade by an antagonist effectively inhibits agonist-induced cAMP production. |
| Isolated Tissue Bath/Myograph System | Maintains viable isolated tissue specimens (atria, trachea) in a controlled physiological environment. Allows for direct measurement of tissue contraction and relaxation in response to drugs, providing ex vivo confirmation of functional selectivity. |
| Selective Agonists & Antagonists(e.g., Isoprenaline, ICI 118,551, CGP 20712A) | Pharmacological tools used as positive and negative controls. Isoprenaline (non-selective agonist) stimulates all β-receptors. CGP 20712A (β1-selective antagonist) and ICI 118,551 (β2-selective antagonist) are used to benchmark the selectivity of novel compounds. |
Metoprolol stands as a definitive case study in the successful application of receptor selectivity to advance drug therapy. Its development as a cardioselective β1-antagonist was a direct response to the clinical limitations of non-selective predecessors, embodying the core research thesis that specific targeting yields superior outcomes. The quantitative data from clinical studies and meta-analyses consistently affirm that this pharmacological selectivity translates into preserved hemodynamic efficacy alongside a mitigated risk of bronchoconstriction. For researchers and drug development professionals, the structured experimental frameworks for quantifying selectivity—from molecular assays to integrated physiological models—provide a validated roadmap for the future development of ever-more-precise therapeutic agents. The journey from propranolol to metoprolol illustrates that in the intricate balance of biological systems, strategic selectivity is not merely an advantage but a fundamental principle of effective and safe pharmacologic intervention.
Strategic Implementation: Applying Specific and Selective Sensing in Drug Development Pipelines
The efficacy of diagnostic assays and therapeutic monitoring hinges on the precise molecular recognition offered by specific sensing tools. Antibodies, aptamers, and enzymatic lock-and-key assays represent three cornerstone classes of these tools, each with distinct mechanisms and applications in biomedical research and drug development. Specificity, the ability to bind a single target, and selectivity, the ability to discriminate the target from similar interferents, are paramount for reliable results. This guide provides an in-depth technical comparison of these biorecognition elements, framing them within the critical context of specific versus selective sensing approaches. It is designed to equip researchers and scientists with the knowledge to select and optimize the appropriate tool for their specific application, from basic research to clinical diagnostics.
Comparative Analysis of Biorecognition Elements
The selection of a biorecognition element is a fundamental decision in assay design. Antibodies are proteins produced by the immune system, renowned for their high specificity and affinity for target antigens [28]. Aptamers are short, single-stranded DNA or RNA oligonucleotides that fold into defined three-dimensional structures to bind their targets with affinity and specificity often comparable to antibodies [29] [30]. Enzymes, in the context of sensing, function as biocatalysts whose activity is modulated by the binding of a specific substrate or inhibitor, following the classic lock-and-key model [31].
Table 1: Fundamental Characteristics of Biorecognition Elements
| Feature | Antibodies | Aptamers | Enzymatic Lock-and-Key |
|---|---|---|---|
| Basic Composition | Proteins (Amino Acids) | Nucleic Acids (DNA/RNA) | Proteins (Amino Acids) |
| Molecular Weight | ~150-180 kDa [29] | ~6-30 kDa (20-100 nucleotides) [29] [32] | Varies (often >20 kDa) |
| Binding Mechanism | Structural complementarity to antigen epitopes [29] | 3D structure folding (helices, loops, G-quadruplexes) [29] [30] | Active site complementarity to substrate [31] |
| Primary Function | Target binding | Target binding | Catalytic reaction |
| Typical Targets | Immunogenic molecules (proteins, peptides, etc.) [29] | Broad (ions, small molecules, proteins, cells) [29] [30] | Specific substrates and inhibitors |
Table 2: Performance and Practical Application Metrics
| Criteria | Antibodies | Aptamers | Enzymatic Lock-and-Key |
|---|---|---|---|
| Affinity (Kd) | High (pM-nM) [30] | High (pM-μM) [30] [31] | Defined by Km (Michaels constant) |
| Development Time | Months [32] | Weeks [32] | N/A (naturally occurring) |
| Production Method | In vivo (animals/hybridoma) or cell culture [29] [32] | In vitro chemical synthesis (SELEX) [29] [32] | Recombinant expression / purification |
| Batch-to-Batch Variation | Significant [29] | None or low [29] [32] | Controllable |
| Stability | Sensitive to temperature; irreversible denaturation [29] [32] | High thermal stability; reversible denaturation [29] [30] | Variable; often sensitive to conditions |
| Modification | Restricted and complex [29] | Convenient and controllable [29] [30] | Possible, can affect activity |
| Immunogenicity | High (can trigger immune response) [29] [32] | None or low [29] [32] | Possible |
Experimental Protocols and Workflows
Antibody-Based Detection: Lateral Flow Immunoassay (LFIA)
The Lateral Flow Immunoassay is a quintessential example of antibody application in point-of-care testing, renowned for its rapidity and simplicity [31].
Protocol:
- Sample Pad Preparation: The sample is applied to the sample pad, which may contain buffers to bring the sample to the optimal pH and filter out particulates [31].
- Conjugate Release: The sample migrates to the conjugate pad, dissolving and mobilizing detection antibodies (e.g., gold nanoparticle-conjugated antibodies). The target analyte binds to these antibodies [31].
- Recognition and Capture: The complex flows onto the nitrocellulose membrane. It first encounters the test line, which is immobilized with capture antibodies specific to a different epitope on the target analyte. The formation of an antibody-target-antibody complex results in a visible line [31].
- Control for Validity: The flow continues to the control line, which contains antibodies that bind the Fc region of the detection antibodies. A visible control line confirms proper fluid flow and assay functionality, regardless of the target's presence [31].
- Signal Readout: The appearance of both test and control lines indicates a positive result. The presence of only the control line indicates a negative result [31].
LFIA Strip Workflow and Result Interpretation
Aptamer Development: Systematic Evolution of Ligands by Exponential Enrichment (SELEX)
Aptamers are discovered through the SELEX process, an iterative in vitro selection and amplification technique [29] [33].
Protocol:
- Library Design: Synthesize a single-stranded DNA or RNA library containing a central random region (e.g., 20-80 nucleotides) flanked by constant primer regions for amplification [29] [32]. The theoretical diversity can exceed 10^15 unique sequences.
- Incubation with Target: The library is incubated with the immobilized target (e.g., on beads or a column) or a soluble target in a solution like capillary electrophoresis [32]. Conditions (buffer, ions, temperature) are controlled to favor specific binding.
- Partitioning: Unbound sequences are rigorously removed through washing steps. The method of partitioning (e.g., filtration, affinity chromatography, magnetic separation, CE) is critical for efficiency [32].
- Elution and Amplification: Target-bound aptamers are eluted, typically by denaturation. For DNA aptamers, the eluted pool is amplified directly by PCR. For RNA aptamers, the DNA pool is first transcribed in vitro to RNA [29] [32].
- Stringency Cycling: Steps 2-4 are repeated for multiple rounds (typically 5-20), with increasing stringency (e.g., reduced incubation time, harsher wash conditions, introduction of counter-selection) to enrich the highest-affinity binders [32].
- Cloning and Sequencing: After the final round, the enriched pool is cloned, and individual sequences are identified via Sanger or Next-Generation Sequencing (NGS). Candidate aptamers are synthesized and characterized for affinity (Kd) and specificity [32].
SELEX Process for Aptamer Selection
Advanced SELEX Methodologies
Recent advancements have improved the efficiency and relevance of SELEX:
- Capillary Electrophoresis-SELEX (CE-SELEX): Uses capillary electrophoresis to separate bound and unbound aptamers with high efficiency, often reducing the selection process to just 1-4 rounds [32].
- Cell-SELEX: Uses live cells as complex targets to generate aptamers against native cell surface biomarkers without prior knowledge of the target protein identity [33].
- In vivo SELEX: Conducts the selection process within a living organism, ensuring the identified aptamers are functional in a physiological environment, can cross biological barriers, and exhibit desirable pharmacokinetic properties [33].
The Scientist's Toolkit: Essential Research Reagents
Successful experimentation relies on a suite of high-quality reagents and materials. The table below details key components for working with these sensing tools.
Table 3: Key Research Reagents and Materials
| Reagent / Material | Function / Description | Primary Application |
|---|---|---|
| Oligonucleotide Library | A synthetic pool of ssDNA/RNA with a random region; the starting point for SELEX [29] [32]. | Aptamer Development |
| Nitrocellulose Membrane | A porous matrix used in lateral flow assays for the immobilization of capture molecules (antibodies/aptamers) [31]. | LFIA / LFA |
| Gold Nanoparticles (AuNPs) | Commonly used as colored reporters conjugated to antibodies or aptamers for visual detection in LFAs [31]. | LFIA / LFA |
| Ion Standard Solutions | Precisely formulated solutions for calibrating and validating ion-selective sensors, ensuring measurement accuracy [34]. | Sensor Calibration |
| Polymerase (Taq, RTase) | Enzymes for amplifying DNA (PCR) or reverse transcribing RNA to DNA (RT-PCR) during SELEX rounds [32]. | Aptamer Development |
| Magnetic Beads | Beads functionalized with streptavidin or target molecules for efficient partitioning of bound/unbound sequences in SELEX [32]. | Aptamer Development |
| PEGylated Aptamers | Aptamers conjugated with polyethylene glycol (PEG) to increase their hydrodynamic radius, reducing renal filtration and prolonging serum half-life [29]. | Therapeutic Aptamer Design |
| 2'-Fluoro/2'-O-Methyl Ribose | Common chemical modifications to the sugar-phosphate backbone of RNA aptamers to confer nuclease resistance [29]. | Aptamer Stabilization |
Antibodies, aptamers, and enzymatic assays each occupy a unique and vital niche in the molecular toolkit. Antibodies remain the gold standard for many immunoassays due to their well-established protocols and high specificity, though they face challenges in production consistency and stability. Aptamers offer a compelling synthetic alternative with superior stability, flexible chemical modification, and a broader target range, including non-immunogenic molecules. Their development is being accelerated by advanced SELEX methodologies like in vivo SELEX, which enhances clinical translatability. Enzymatic lock-and-key mechanisms provide the foundation for converting molecular recognition into a catalytic signal, making them powerful in biosensing and biochemical pathway analysis.
The choice between these tools is not a matter of which is universally superior, but which is optimally suited to the specific research question. Factors such as the nature of the target, required assay robustness, timeline, cost, and intended application environment must be carefully weighed. A deep understanding of the principles, protocols, and reagents outlined in this guide empowers scientists to make informed decisions, driving innovation in diagnostic and therapeutic development. Future directions will likely see increased integration of these elements, such as aptamer-antibody hybrids and enzyme-aptamer complexes, to create ever more specific, selective, and powerful sensing platforms.
The fundamental challenge in analytical science is the reliable detection and identification of analytes within complex, real-world mixtures. Traditional specific sensing approaches rely on highly selective, pre-designed molecular recognition elements (e.g., antibodies, enzymes, or locked receptors) that bind exclusively to a single target analyte. While powerful for known substances, this strategy possesses inherent limitations: it is hypothesis-dependent, requiring prior knowledge of the target, and struggles with mixture analysis, unknown compound identification, and detecting subtle, unanticipated changes in complex systems like cells [35].
In contrast, selective sensing arrays, often termed 'chemical noses/tongues,' represent a paradigm shift toward hypothesis-free discovery. These systems employ a collection of semi-selective sensors that generate a composite response pattern or "fingerprint" upon interaction with an analyte or complex sample [35]. Instead of one sensor for one analyte, multiple sensors respond to multiple features, and the unique pattern of these responses is analyzed to identify and classify samples. This approach is particularly powerful for distinguishing subtle differences between complex analytes—such as different cell phenotypes, drug mechanisms, or protein profiles—without requiring prior knowledge of the specific differences [36] [35]. The following diagram illustrates the core logical difference between these two sensing philosophies.
Diagram 1: Specific vs. Selective Sensing Logic
Core Principles and Design of Selective Sensing Arrays
The operational framework of a selective sensing array consists of two interconnected processes: a recognition event and a transduction process that converts molecular interactions into a measurable signal [35]. The design intentionally avoids perfect specificity, instead cultivating cross-reactivity where multiple sensors in the array respond differently to various analytes. This generates a high-dimensional data set that becomes a rich source of information for pattern recognition [35].
The sensing elements themselves can be constructed from a diverse range of materials. Common choices include:
- Nanoparticles: Valued for their ease of functionalization and large surface areas that provide ample sites for biomolecular recognition [35].
- Synthetic Polymers: Offer high stability, scalability, and the ability to integrate both recognition elements and fluorescent transducers into a single molecule, enhancing sensitivity [36] [35].
- Small-Molecule Fluorescent Compounds: Provide high sensitivity due to their small size and responsiveness to environmental changes [35].
The transduction mechanism is critical. A prominent example involves fluorophore-conjugated polymers. These polymers contain a cationic recognition element (e.g., a benzyl group) that electrostatically binds to negatively charged surfaces like bacterial cell envelopes. The polymer is also conjugated with environmentally sensitive solvatochromic dyes (e.g., Pyrene, NBD, REDD) that change their fluorescent properties based on local polarity, pH, electrostatics, and hydrophobicity [36]. Interaction with an analyte alters the local environment of these dyes, producing a measurable change in fluorescence intensity or a wavelength shift across multiple channels, creating a unique fingerprint for each analyte [36].
Experimental Protocol: Profiling Antibiotic Mechanisms
The following detailed protocol, adapted from a study profiling antibiotic mechanisms, exemplifies a typical workflow for a hypothesis-free cell-based screening assay using a polymer-based sensor array [36].
Research Reagent Solutions
Table 1: Key Reagents and Materials for Polymer-Based Sensor Array Experiment
| Item | Function/Description |
|---|---|
| Cationic Benzyl-Functionalized Polymers | Core recognition element; binds to negatively charged cell surfaces via supramolecular interactions (electrostatics, hydrophobic, aromatic) [36]. |
| Solvatochromic Dyes (Pyrene, NBD, REDD) | Fluorescent transducers; generate multi-channel optical output sensitive to local environmental changes [36]. |
| Bacterial Strains (e.g., E. coli, S. aureus) | Model analytes; different species and antibiotic-treated strains present distinct surface signatures [36]. |
| Antibiotics (various classes) | Inducers of phenotypic changes; treatment alters bacterial cell surface structure and composition [36]. |
| 96-Well Black Microplate | Platform for high-throughput fluorescence measurements [36]. |
| Phosphate Buffer Solution (5 mM) | Reaction medium; provides a consistent ionic environment for sensor-analyte interactions [36]. |
Step-by-Step Workflow
Step 1: Sensor Preparation. Prepare the sensor array by dissolving the three fluorophore-conjugated polymers (Py, NBD, REDD) in an appropriate buffer to create stock solutions [36].
Step 2: Sample Treatment and Preparation.
- Culture relevant bacterial strains (e.g., Escherichia coli CD-2, Staphylococcus aureus CD-35) to the mid-logarithmic phase.
- Treat bacterial samples with different antibiotics at relevant concentrations for a predetermined period (e.g., 2 hours). Include an untreated control.
- Harvest the bacteria and wash to remove residual antibiotic and media. Adjust the bacterial concentration to an optimal optical density (e.g., OD₆₀₀ = 0.25) using a phosphate buffer solution [36].
Step 3: Sensor-Analyte Incubation and Data Acquisition.
- In a 96-well black microplate, mix each sensor polymer solution with the prepared bacterial suspensions. Each antibiotic treatment and control should be tested against all sensor polymers, with multiple replicates (e.g., n=8).
- Incubate the plate for a fixed period (e.g., 30 minutes) at room temperature.
- Measure the fluorescence output using a plate reader. For a pyrene-conjugated polymer, record the monomer and excimer emission peaks. For other dyes, record their characteristic emission peaks, generating a multi-channel ratiometric output for each well [36].
The workflow and key chemical interactions involved in this protocol are summarized in the following diagram.
Diagram 2: Sensor Array Experimental Workflow
Data Analysis and Interpretation
The raw fluorescence data from multiple channels constitutes a high-dimensional data set. Multivariate data analysis is required for interpretation.
- Linear Discriminant Analysis (LDA) is a common supervised method used to reduce dimensionality and project the data onto axes that maximize separation between pre-defined groups (e.g., different antibiotic classes). The resulting LDA plot shows clusters, where tight clustering of replicates and distinct separation between different groups indicates successful discrimination [36].
- Principal Component Analysis (PCA) is an unsupervised method used to identify natural clustering and trends in the data without prior classification [35].
In the antibiotic study, the sensor array successfully generated distinct fluorescence patterns for bacteria treated with different classes of antibiotics. LDA analysis showed clear clustering corresponding to different mechanistic pathways (e.g., DNA replication inhibitors vs. cell wall biosynthesis inhibitors), successfully classifying blinded samples with high accuracy [36].
Performance Metrics and Material Innovations
The performance of sensor arrays is quantified using specific metrics. Advances in nanomaterials have been pivotal in pushing the boundaries of these metrics.
Table 2: Key Performance Metrics and Enabling Materials for Sensing Arrays
| Performance Metric | Description | Impact of Advanced Materials |
|---|---|---|
| Sensitivity | Ability to detect low analyte concentrations; measured by the limit of detection (LOD). | Nanomaterials like graphene, CNTs, and MXenes provide high surface-area-to-volume ratios, enabling ultra-low LODs (parts-per-billion/trillion) [37] [38]. |
| Selectivity & Cross-Reactivity | The desired, differential response of sensors across the array to different analytes. | Molecularly Imprinted Polymers (MIPs) create synthetic, tailor-made recognition cavities, dramatically enhancing selectivity for specific targets [3]. |
| Response Time | Time required for the sensor to generate a stable signal upon analyte exposure. | The high electron mobility of materials like graphene and the porous nature of Metal-Organic Frameworks (MOFs) facilitate rapid analyte interaction and signal transduction [37] [38]. |
| Stability & Reproducibility | Consistency of sensor performance over time and across different batches. | Solid-contact electrodes using hydrophobic interlayers like graphene nanoplatelets prevent water layer formation, enhancing potential stability and sensor lifespan [3]. |
Applications in Drug Discovery and Development
The hypothesis-free nature of selective sensing arrays makes them powerful tools across the drug discovery and development pipeline.
- Mechanism of Action (MoA) Profiling: As demonstrated, sensor arrays can rapidly classify the mechanism of novel antibiotic compounds by detecting the unique phenotypic "fingerprint" they impose on bacterial cells, a process that can be completed in as little as 30 minutes [36]. This is crucial for prioritizing lead compounds in antibiotic development.
- Chemical Safety and Risk Assessment: Array-based cell sensing can detect subtle, early phenotypic changes in human cells exposed to low doses of environmental chemicals or drug candidates. One study demonstrated discrimination of macrophage responses to femtomolar (10⁻¹⁴ M) concentrations of pesticides, a level far below the threshold detected by conventional cell viability assays [35]. This provides a highly sensitive tool for identifying off-target or chronic toxic effects.
- Therapeutic Discovery and Efficacy Screening: These platforms can screen for drug efficacy by monitoring phenotypic changes in diseased versus treated cells. The ability to use complex cell models, such as 3D cultures and organoids, and to probe them in a label-free manner using techniques like stimulated Raman scattering (SRS) microscopy, enhances the predictive power of these assays for in vivo outcomes [39].
Future Perspectives and Challenges
The field of selective sensing is converging with several cutting-edge technological trends. The integration of Artificial Intelligence (AI) and Machine Learning (ML) is becoming essential for managing and interpreting the complex, high-dimensional data produced by sensor arrays, improving signal classification, and correcting for sensor drift [37] [38]. Furthermore, the development of flexible and wearable sensor platforms using advanced manufacturing like 3D printing extends the application of these arrays to real-time, in-field health monitoring and diagnostics [40] [38].
Despite the significant progress, challenges remain. Sensor drift over time, reproducibility in large-scale manufacturing, and ensuring long-term stability under real-world conditions are persistent engineering hurdles [41] [37] [38]. Furthermore, as sensors become integrated into the Internet of Things (IoT), issues of data privacy and cybersecurity will require increased attention [38]. Finally, navigating the evolving regulatory frameworks for clinical approval of these complex diagnostic systems presents a significant path to commercialization [37].
The concepts of specificity and selectivity form a critical foundation in pharmacology and sensing. Specificity refers to the ideal scenario where a ligand binds exclusively to a single, intended biological target. Selectivity, in contrast, describes a ligand's preferential binding to a primary target over secondary targets, existing on a continuous spectrum rather than as a binary property [42]. In the context of AI-driven drug discovery, this paradigm is paramount: while the therapeutic goal is often high specificity to minimize off-target effects, the underlying physical reality of molecular interactions means that most drugs are, in fact, selective to varying degrees [42]. This understanding directly shapes how machine learning models are designed and applied. The pursuit of absolute specificity remains largely theoretical in biological systems, whereas selectivity represents a quantifiable and optimizable property that artificial intelligence is uniquely positioned to address [42]. Modern AI approaches now leverage this nuanced understanding to accelerate the discovery and optimization of ligands with tailored selectivity profiles, moving beyond the oversimplified "one drug, one target" model to embrace polypharmacology where strategically beneficial [43].
AI and Machine Learning Approaches in Ligand Discovery
Generative Models for De Novo Molecular Design
Generative AI models represent a paradigm shift from traditional "design first then predict" approaches to an inverse "describe first then design" methodology [44]. These models learn underlying patterns from existing molecular datasets to generate novel chemical entities with tailored properties.
- Variational Autoencoders (VAEs): VAEs consist of an encoder that maps input molecular structures to a lower-dimensional latent space and a decoder that reconstructs molecules from this space. This architecture enables smooth interpolation and controlled generation of novel compounds. A key advantage is their rapid, parallelizable sampling and robust performance even with limited data [44].
- Active Learning Integration: Advanced workflows now embed generative VAEs within nested active learning (AL) cycles. In this framework, the VAE proposes new molecules, which are then evaluated by computational "oracles" for properties like drug-likeness and synthetic accessibility. Promising molecules are used to fine-tune the VAE, creating a self-improving cycle that progressively generates more optimal candidates [44].
The workflow below illustrates this integrated generative and active learning process for de novo molecular design.
Diagram 1: Generative AI with active learning for molecular design.
Target Prediction and Polypharmacology Profiling
Accurately predicting the interaction between a small molecule and its protein targets is crucial for understanding both efficacy and safety. AI-based target prediction methods fall into two main categories, each with distinct strengths for profiling selectivity.
Table 1: Comparison of AI-Based Target Prediction Methods
| Method Type | Key Principle | Example Tools | Best Use Case |
|---|---|---|---|
| Target-Centric | Builds predictive models for specific targets using QSAR or molecular docking. | RF-QSAR, TargetNet, CMTNN [43] | Known targets with sufficient bioactivity data or protein structures. |
| Ligand-Centric | Compares molecular similarity to known active ligands to infer targets. | MolTarPred, PPB2, SuperPred [43] | Novel target identification and drug repurposing; less dependent on protein structure. |
A rigorous 2025 benchmark study evaluated seven target prediction methods on a shared dataset of FDA-approved drugs. The study found that MolTarPred, a ligand-centric method, demonstrated superior performance [43]. The analysis also revealed that using Morgan fingerprints (a specific type of molecular representation) with Tanimoto similarity scores provided better accuracy than other fingerprint and similarity metric combinations [43]. For applications requiring high confidence, employing a high-confidence filter (e.g., a confidence score ≥7 from the ChEMBL database) improves prediction reliability, though it may reduce recall [43].
Physics-Informed and Generalizable AI Models
A significant roadblock for AI in drug discovery has been the "generalizability gap"—where models perform well on their training data but fail unpredictably when faced with novel chemical structures or protein families [45]. To address this, researchers are developing more robust, physics-informed architectures.
A key innovation from Vanderbilt University involves a task-specific model architecture that learns only from the representation of the protein-ligand interaction space, rather than the entire 3D structures [45]. This approach forces the model to learn the transferable principles of molecular binding (e.g., distance-dependent physicochemical interactions) instead of relying on structural shortcuts present in the training data, thereby improving generalization to novel targets [45]. The validation protocol for such models is critical; rigorous benchmarks that simulate real-world scenarios by leaving out entire protein superfamilies during training are necessary to truly assess a model's utility for de novo drug discovery [45].
Experimental Protocols and Workflows
An Integrated Generative AI and Active Learning Protocol
The following detailed protocol, adapted from a 2025 study, outlines the steps for a VAE-based generative model nested with active learning cycles to design ligands for a specific target [44].
Data Preparation and Representation
- Source: Gather a target-specific training set from public databases like ChEMBL (version 34 contains over 2.4 million compounds and 2 million interactions) [43].
- Curate: Filter bioactivity records (IC50, Ki, EC50) below 10,000 nM and remove duplicate compound-target pairs.
- Represent: Convert molecular structures into SMILES strings, which are then tokenized and converted into one-hot encoding vectors for model input [44].
Model Initialization and Training
- Initial Training: Train the VAE on a general molecular dataset to learn fundamental rules of chemical validity.
- Target-Specific Fine-tuning: Further fine-tune the pre-trained VAE on the curated target-specific training set to bias the generator towards relevant chemical space [44].
Nested Active Learning Cycles
- Inner Cycle (Chemical Optimization):
- Generate: Sample the fine-tuned VAE to produce a batch of novel molecules.
- Evaluate: Use chemoinformatic oracles (computational predictors) to assess generated molecules for drug-likeness (e.g., Lipinski's Rule of Five), synthetic accessibility (SA), and dissimilarity from the training set.
- Refine: Molecules passing thresholds are added to a "temporal-specific set" and used to fine-tune the VAE again. This inner loop runs for a predefined number of iterations to enrich for chemically favorable compounds [44].
- Outer Cycle (Affinity Optimization):
- Evaluate: After several inner cycles, molecules accumulated in the temporal-specific set are evaluated by a physics-based affinity oracle, such as molecular docking simulations, to predict binding to the target.
- Select: Molecules with favorable docking scores are promoted to a "permanent-specific set."
- Refine: The VAE is fine-tuned on this permanent set, directly steering generation towards high-affinity candidates. The process then returns to the inner cycle [44].
- Inner Cycle (Chemical Optimization):
Candidate Selection and Validation
- Filtration: After multiple outer AL cycles, apply stringent filters to the permanent set. Use advanced molecular modeling simulations (e.g., Protein Energy Landscape Exploration, PEL) to further refine docking poses and estimate absolute binding free energy (ABFE) [44].
- Synthesis and Assay: Select top-ranking candidates for chemical synthesis and subsequent in vitro bioactivity testing (e.g., IC50 determination) to validate model predictions [44].
Protocol for Target Prediction and Mechanism of Action Analysis
This protocol provides a workflow for using AI-based target prediction tools to generate hypotheses about a query molecule's mechanism of action (MoA) and polypharmacology [43].
Query Molecule Preparation: Obtain or draw the 2D structure of the query small molecule and generate its canonical SMILES representation.
Database Selection and Preparation: For ligand-centric methods, a comprehensive database of known ligand-target interactions is required. ChEMBL is recommended for its extensive, experimentally validated bioactivity data [43]. Host the database locally for programmatic access.
Model Selection and Execution:
- Tool Selection: Choose a prediction method based on need. For high-confidence target identification, MolTarPred is a top-performing option [43].
- Fingerprint and Metric: When using MolTarPred, configure it to use Morgan fingerprints with a Tanimoto similarity score for optimal accuracy [43].
- Execution: Run the prediction pipeline. For web servers, this may involve manual submission; for stand-alone codes like MolTarPred, it can be automated.
Result Analysis and Hypothesis Generation:
- High-Confidence Filtering: Apply a confidence filter (e.g., ChEMBL confidence score ≥7) to prioritize predictions with direct experimental support [43].
- MoA Hypothesis: The top predicted targets form the basis for a testable MoA hypothesis. For example, the protocol successfully predicted the thyroid hormone receptor beta (THRB) as a potential target for fenofibric acid, suggesting its repurposing for thyroid cancer [43].
- Experimental Validation: Prioritize predicted targets for experimental validation using binding affinity assays (e.g., CETSA for cellular target engagement) or functional cellular assays [43].
The Scientist's Toolkit: Essential Research Reagents and Solutions
The implementation of AI-driven discovery workflows relies on a suite of computational tools and experimental reagents for validation.
Table 2: Key Research Reagents and Computational Tools
| Tool/Reagent | Type | Primary Function | Example Use Case |
|---|---|---|---|
| ChEMBL Database | Database | Repository of curated bioactivity data and drug-target interactions. | Training and benchmarking target prediction models; source of initial training data for generative AI [43]. |
| CETSA (Cellular Thermal Shift Assay) | Experimental Assay | Measures drug-target engagement directly in intact cells and tissues. | Experimental validation of AI-predicted ligand-target interactions; confirming cellular activity [46]. |
| MolTarPred | Software Tool | Ligand-centric target prediction based on 2D molecular similarity. | Generating MoA hypotheses for novel compounds or repurposing existing drugs [43]. |
| Variational Autoencoder (VAE) | AI Model | Generative model for creating novel molecular structures from a learned latent space. | De novo design of drug-like molecules tailored to a specific protein target [44]. |
| Morgan Fingerprints | Computational Representation | A type of molecular fingerprint that encodes the neighborhood of each atom. | Representing molecules for similarity searches and as input for machine learning models [43]. |
| AlphaFold | AI Tool | Predicts 3D protein structures from amino acid sequences with high accuracy. | Providing protein structures for target-centric methods (e.g., docking) when experimental structures are unavailable [47]. |
Artificial intelligence is fundamentally reshaping the landscape of ligand discovery and optimization. By moving beyond the rigid ideal of absolute specificity and embracing the nuanced reality of selectivity, AI models offer powerful new strategies for drug design. The integration of generative models with active learning cycles, robust target prediction tools, and generalizable physics-informed architectures creates a cohesive and accelerating feedback loop between in silico design and experimental validation. As these technologies mature, their ability to navigate the complex trade-offs between potency, selectivity, and synthesizability will be crucial for delivering safer and more effective therapeutics to the clinic. The future of ligand discovery lies in the continued refinement of these AI-driven workflows, which promise to compress timelines, reduce costs, and unlock novel therapeutic strategies through a sophisticated understanding of molecular recognition.
Ultra-large virtual screening (ULVS) represents a paradigm shift in computational drug discovery, employing advanced methodologies to systematically rank billions of molecules from virtual compound libraries based on predicted biological activities [48]. This approach has become feasible through the convergence of several technological developments: the expansion of commercially accessible make-on-demand compound libraries, significant advancements in artificial intelligence (AI), and increased computational power including enhanced central processing units (CPUs), graphics processing units (GPUs), and high-performance computing (HPC) infrastructure [48]. The screening of libraries containing over 10^9 molecules was once considered impractical, but ULVS methodologies have now demonstrated not only feasibility but also remarkable potential for identifying hit candidates and increasing the structural diversity of novel bioactive compounds [48].
The context of specific versus selective sensing approaches is particularly relevant to ULVS. Specific screening aims to identify compounds with maximal complementarity to a single, well-defined binding site, often utilizing rigid docking protocols and precise chemical feature matching. In contrast, selective screening strategies prioritize compounds that can discriminate between similar binding sites, such as those in mutant protein variants or related protein family members, frequently requiring flexible docking approaches and ensemble receptor structures. This distinction frames the methodological choices researchers must make when designing ULVS campaigns for different therapeutic contexts.
The Challenge of Scale in Chemical Space
The Expansiveness of Chemical Space
The chemical space of possible drug-like molecules is estimated to contain up to 10^60 compounds, presenting both an opportunity and a formidable challenge for virtual screening [49]. Make-on-demand combinatorial libraries, such as Enamine's REAL space, have practically addressed this challenge by combining simple building blocks through robust reactions to form billions of readily available molecules [49]. These libraries typically contain billions of readily available compounds, with one cited example containing over 20 billion molecules [49]. This represents a golden opportunity for in-silico drug discovery, as these libraries provide synthetically accessible compounds that can be rapidly obtained for experimental validation, often within weeks of computational identification [49].
Computational Bottlenecks in Traditional Approaches
Traditional virtual high-throughput screening (vHTS) faces significant limitations when applied to gigascale chemical spaces. The computational cost of exhaustively screening ultra-large libraries with conventional docking methods is prohibitive, especially when incorporating receptor flexibility [49]. Most historical vHTS campaigns have utilized rigid docking to reduce computational demands, but this introduces potential error sources as rigid docking may not sample favorable protein-ligand structures [49]. The introduction of both protein and ligand flexibility has been shown to increase success rates notably but comes with tremendous computational expense [49]. Furthermore, the majority of computational time in exhaustive screening campaigns is spent on molecules of no interest due to low hit rates, making efficient search algorithms essential for practical ULVS implementations.
Core Methodologies for ULVS
Evolutionary Algorithms: REvoLd
The RosettaEvolutionaryLigand (REvoLd) algorithm represents an innovative approach to searching combinatorial make-on-demand chemical spaces efficiently without enumerating all molecules [49]. REvoLd exploits the fundamental feature of make-on-demand compound libraries—that they are constructed from lists of substrates and chemical reactions—and explores the vast search space of combinatorial libraries for protein-ligand docking with full ligand and receptor flexibility through RosettaLigand [49].
The benchmark performance of REvoLd on five drug targets demonstrated improvements in hit rates by factors between 869 and 1622 compared to random selections [49]. In practical testing, twenty runs of REvoLd against each target docked between 49,000 and 76,000 unique molecules per target, a tiny fraction of the full library size, yet successfully identified molecules with hit-like scores [49]. The algorithm's efficiency stems from its evolutionary approach, which maintains a population of candidate ligands that undergo selection, mutation, and crossover operations across generations, progressively optimizing for better binding affinity while maintaining synthetic accessibility.
Table 1: REvoLd Performance Metrics Across Different Targets
| Target | Molecules Docked | Hit Rate Improvement | Key Findings |
|---|---|---|---|
| Target 1 | 49,000-76,000 | 869-1622x | Successful identification of hit-like molecules |
| Target 2 | 49,000-76,000 | 869-1622x | Strong enrichment independent of space size |
| Target 3 | 49,000-76,000 | 869-1622x | Multiple runs revealed diverse scaffolds |
| Target 4 | 49,000-76,000 | 869-1622x | Minimal overlap between independent runs |
| Target 5 | 49,000-76,000 | 869-1622x | Continued discovery beyond 15 generations |
Machine Learning-Enhanced Docking
Machine learning scoring functions (ML SFs) have emerged as powerful tools for enhancing traditional docking approaches in ULVS. Methods like RF-Score-VS (based on random forest algorithms) and CNN-Score (using convolutional neural networks) have demonstrated significant improvements over classical scoring functions [50]. In benchmark studies, these ML SFs have achieved hit rates more than three times higher than classical scoring functions like DOCK3.7 and Smina/Vina at the top 1% of ranked molecules [50].
The application of ML re-scoring is particularly valuable for complex targets like resistant enzyme variants. In a benchmarking study against both wild-type and quadruple-mutant PfDHFR (a malaria target), re-scoring with CNN-Score consistently augmented SBVS performance and enriched diverse, high-affinity binders for both variants [50]. For the wild-type enzyme, PLANTS demonstrated the best enrichment when combined with CNN re-scoring (EF 1% = 28), while for the quadruple-mutant variant, FRED exhibited the best enrichment with CNN re-scoring (EF 1% = 31) [50].
Reaction-Based Docking Approaches
Reaction-based docking methods, such as V-SYNTHES, represent another strategic approach to navigating gigascale chemical spaces [49]. Instead of docking complete molecules, these methods begin with docking single fragments, select the most promising ones, and iteratively add more fragments to the growing scaffolds until final molecules are built [49]. This hierarchical approach dramatically reduces the search space by leveraging the combinatorial nature of make-on-demand libraries while ensuring synthetic accessibility.
Similar approaches include SpaceDock, which follows the same fragment-based concept but is not limited to commercially available combinatorial libraries, and Chemical Space Docking, which provides general principles for this hierarchical screening methodology [49]. These methods are particularly effective for exploring regions of chemical space with known synthetic pathways and can efficiently prioritize synthetically tractable compounds with favorable binding properties.
Table 2: Comparison of ULVS Methodologies
| Methodology | Key Principle | Advantages | Limitations |
|---|---|---|---|
| Evolutionary Algorithms (REvoLd) | Evolutionary optimization of molecules | High enrichment factors (869-1622x), synthetic accessibility | May converge to local minima, requires parameter tuning |
| ML-Enhanced Docking | Re-scoring with neural networks | 3x higher hit rates, improved enrichment | Dependent on initial docking poses, training data requirements |
| Reaction-Based Docking (V-SYNTHES) | Hierarchical fragment assembly | Exploits synthetic accessibility, reduced search space | Limited to known reaction schemes, fragment bias |
| Active Learning (Deep Docking) | Iterative screening with QSAR | Balanced computational load, improved diversity | Requires initial subset screening, model retraining |
Experimental Protocols and Workflows
REvoLd Implementation Protocol
The REvoLd protocol implements a sophisticated evolutionary algorithm with carefully optimized parameters. The workflow begins with a random population of 200 initially created ligands, providing sufficient variety to initiate the optimization process while managing computational costs [49]. Through iterative testing, researchers determined that allowing 50 individuals to advance to the next generation performed best, balancing population diversity against selection pressure [49]. The algorithm typically runs for 30 generations, striking an effective balance between convergence and exploration, with good solutions usually emerging after 15 generations [49].
Key reproduction mechanics include: (1) increased crossover between fit molecules to enforce variance and recombination; (2) a mutation step that switches single fragments to low-similarity alternatives, preserving well-performing molecular regions while introducing significant changes; and (3) a reaction-changing mutation that searches for similar fragments within new reaction groups, expanding access to diverse combinatorial spaces [49]. Additionally, a second round of crossover and mutation excluding the fittest molecules allows poorer-scoring ligands to improve and contribute their molecular information [49]. For optimal results, researchers recommend multiple independent runs (typically 20) with different random seeds, as each run explores different paths through chemical space and reveals distinct high-scoring motifs [49].
Machine Learning Re-scoring Protocol
The integration of machine learning re-scoring into ULVS workflows follows a systematic protocol. For the PfDHFR case study [50], researchers first prepared protein structures (PDB ID: 6A2M for wild-type and 6KP2 for quadruple-mutant) by removing water molecules, unnecessary ions, and redundant chains, then adding and optimizing hydrogen atoms [50]. They employed the DEKOIS 2.0 benchmark set with 40 bioactive molecules and 1200 challenging decoys (1:30 ratio) for each variant [50].
The docking phase utilized three tools: AutoDock Vina, PLANTS, and FRED, with grid boxes tailored to each protein structure (21.33Å × 25.00Å × 19.00Å for WT; 21.00Å × 21.33Å × 19.00Å for Q variant) [50]. Following initial docking, the generated ligand poses were re-scored using two ML SFs: RF-Score-VS v2 and CNN-Score, resulting in eighteen combined docking and scoring outcomes for both variants [50]. Performance was evaluated using pROC-AUC, pROC-Chemotype plots, and enrichment factors at 1% (EF 1%), with the results demonstrating that re-scoring with CNN-Score consistently improved screening performance and retrieved diverse, high-affinity binders for both PfDHFR variants [50].
Workflow Visualization
Computational Docking Software
Table 3: Essential Software Tools for ULVS Implementation
| Tool Name | Type | Key Features | Best Use Cases |
|---|---|---|---|
| REvoLd | Evolutionary Algorithm | Full ligand/receptor flexibility, synthetic accessibility | Make-on-demand library screening, scaffold hopping |
| RosettaLigand | Flexible Docking Suite | All-atom modeling, high accuracy | Detailed binding pose prediction, flexible targets |
| AutoDock Vina | Molecular Docking | Speed, user-friendly interface | Initial screening, standard docking protocols |
| FRED (OpenEye) | Exhaustive Docking | Systematic pose examination, high speed [51] | Ultra-high-throughput docking, apo-protein structures |
| HYBRID (OpenEye) | Ligand-Guided Docking | Shape/chemical complementarity to known binders [51] | Scaffold optimization, holo-protein structures |
| PLANTS | Molecular Docking | Protein-ligand ant system optimization | Enrichment-focused screening, ensemble docking |
Table 4: ML Scoring and Analysis Tools
| Tool | Function | Performance | Implementation |
|---|---|---|---|
| CNN-Score | Neural Network Scoring | 3x higher hit rates vs traditional SFs [50] | Re-scoring docking poses |
| RF-Score-VS v2 | Random Forest Scoring | Superior enrichment at early recall [50] | Virtual screening prioritization |
| DEKOIS 2.0 | Benchmarking Set | Challenging decoys for performance evaluation [50] | Method validation and comparison |
| SuperPlotsOfData | Data Visualization | Transparent display of replicate data [52] | Results communication and analysis |
Future Directions and Challenges
As ULVS continues to evolve, several emerging trends are shaping its development. The integration of more sophisticated AI models, including generative approaches for library design and optimization, represents a promising frontier [53]. These approaches could enable the design of targeted libraries optimized for specific protein families or resistance profiles. Additionally, the increasing availability of specialized hardware, such as AI accelerators and quantum computing prototypes, may further reduce the computational barriers to screening even larger chemical spaces.
A significant challenge remains the accurate prediction of binding affinities for flexible binding sites and allosteric pockets. Current methods like Induced-Fit Posing and Free Energy - Nonequilibrium Switching (FE-NES) show promise for more accurately predicting ligand-protein binding in flexible systems [51]. As noted by researchers, "the only real validation is if a drug turns out to be safe and efficacious in a patient," highlighting the ultimate challenge of translating computational predictions to clinical success [54]. Improvements in early target validation, open science, and data sharing may help address this translational gap and improve the success rates of ULVS-derived candidates in later development stages.
The integration of sensor-based Digital Health Technologies (DHTs) into clinical trials represents a paradigm shift in therapeutic development, enabling the collection of continuous, objective, and real-world data. A critical challenge in this domain lies in designing sensing systems that achieve both high selectivity (the ability to accurately measure a specific biological signal amidst noise) and high specificity (the ability to correctly identify a particular clinical or behavioral construct of interest). This technical guide examines the development and application of three pioneering digital endpoints—Stride Velocity 95th Centile, Nocturnal Scratch, and accelerometer-based Heart Failure measures—within the context of this specificity-selectivity framework. The validation of these endpoints, as detailed in regulatory qualification documents and clinical studies, demonstrates a maturing pathway for incorporating DHT-derived data into drug development, offering enhanced sensitivity for detecting treatment effects and a more patient-centric approach to clinical evidence generation.
The Specificity and Selectivity Framework in Digital Sensing
In the context of digital endpoints, selectivity refers to a sensor's ability to isolate and accurately quantify a target physical movement or physiological signal from other confounding motions or background noise. For instance, an accelerometer-based algorithm must distinguish a scratching motion from other hand movements like typing or waving.
Specificity, a related but distinct concept, refers to the validity of the measured digital signal as an indicator of the intended clinical or behavioral construct. It answers the question: Does a measured "scratch" truly reflect the patient's experience of itch, and is it specific to the disease pathology in question?
Achieving both properties requires a multi-layered validation approach, which has been codified in frameworks like the V3+ framework by the Digital Medicine Society (DiMe). This process involves verification of the sensors themselves, analytical validation of the algorithms, and clinical validation of the measures for the proposed Context of Use [55].
Table: Core Components of Sensor System Validation
| Component | Definition | Example |
|---|---|---|
| Sensor Verification | Confirming the sensor hardware performs accurately and reliably in a controlled environment. | Ensuring an accelerometer's output in 'g' forces correlates precisely with actual acceleration. |
| Analytical Validation | Assessing the algorithm's performance in converting sensor data into an interpretable measure against a reference. | Validating a scratch detection algorithm against video-annotated ground truth. |
| Clinical Validation | Establishing that the measure meaningfully captures the clinical construct of interest in the target population. | Demonstrating that a digital gait measure correlates with disease progression and patient function. |
Digital Endpoint 1: Stride Velocity 95th Centile (SV95C)
Context and Clinical Specificity
Stride Velocity 95th Centile (SV95C) is the first wearable-derived digital clinical outcome assessment qualified by the European Medicines Agency (EMA) for use as a secondary endpoint in Duchenne Muscular Dystrophy (DMD) trials [56]. It is a measure of peak ambulatory performance, representing the speed of the fastest 5% of strides taken over a recording period, typically 180 hours [56] [57]. Its clinical specificity is rooted in its ability to capture a patient's maximum functional capacity, which is often more sensitive to change in progressive neuromuscular disorders like DMD than average walking speed or episodic clinic-based tests like the 6-minute walk test (6MWT).
Sensing Technology and Selective Data Acquisition
SV95C is measured using wearable inertial sensors, typically worn on both ankles. The selective measurement of stride velocity relies on the precise capture of ambulatory gait cycles amidst other leg and body movements.
- Technology: High-performance, body-worn wearable sensors containing accelerometers and gyroscopes.
- Data Acquisition: Patients wear the devices continuously for extended periods (e.g., several weeks at a time) in their free-living environments, capturing data during various activities [57].
- Selectivity Mechanism: Algorithms process the raw accelerometer/gyroscope data to identify individual strides based on the characteristic periodic motion of walking or running. The velocity of each stride is calculated, and the 95th centile of the resulting velocity distribution is derived.
This method provides a more complete and less intrusive view of a patient's mobility, as the data is not affected by motivation or fatigue during a specific clinic visit [57].
Experimental Protocol and Validation
The regulatory qualification of SV95C provides a template for validating a digitally-derived functional measure.
- Data Collection: Participants wear sensors on both ankles for multiple 180-hour periods at home and in the community. This long recording period ensures a representative sample of their ambulatory behavior [56].
- Algorithm Processing: Sensor data is processed to extract all strides, filter out non-ambulatory periods, and calculate stride velocity.
- Endpoint Calculation: The SV95C value is computed from the aggregated stride velocity data.
- Validation Against Gold Standards: The digital measure was correlated with traditional clinic-based assessments of motor function to establish convergent validity [56].
- Demonstration of Clinical Utility: Studies showed SV95C had greater sensitivity to clinical change over 6 months than other wearable-derived stride variables, such as median stride velocity or length, proving its value for detecting progression or treatment effect [56].
SV95C Data Processing and Validation Workflow
Table: Key Research Reagents and Tools for SV95C
| Item | Function in Protocol |
|---|---|
| Inertial Measurement Unit (IMU) | Contains accelerometers and gyroscopes to capture linear acceleration and angular rotation of the ankles. |
| Ankle-Worn Sensor Platform | A body-worn device (e.g., Velcro straps) housing the IMU, designed for secure placement and patient comfort. |
| Data Transmission/Charging Dock | Hardware for nightly charging and wireless data transfer from the sensor to a central database. |
| Stride Detection Algorithm | Software to identify the start and end of individual gait cycles from raw IMU signals. |
| SV95C Computational Pipeline | The validated set of algorithms for calculating the final endpoint from the aggregated stride data. |
Digital Endpoint 2: Nocturnal Scratch
Context and Clinical Specificity
Nocturnal scratching is a major factor impairing quality of life in patients with Atopic Dermatitis (AD) and other inflammatory skin conditions. An objective, digital measure of scratch addresses the limitations of patient-reported outcomes (PROs), which are subjective and cannot capture the duration, intensity, or unconscious scratching during sleep [58] [59]. The clinical specificity of this measure hinges on a standardized definition of the behavior: "an action of rhythmic and repetitive skin contact movement performed during a delimited time period of intended and actual sleep" [58].
Sensing Technology and Selective Data Acquisition
The dominant approach for measuring nocturnal scratch uses wrist-worn actigraphy devices, which typically contain accelerometers and gyroscopes. The core challenge of selectivity is to distinguish the unique motion signature of scratching from a vast array of other hand and arm movements during sleep.
- Technology: Wrist-worn devices with tri-axial accelerometers and gyroscopes.
- Data Acquisition: Patients wear the device on the dominant wrist during sleep. Data is recorded throughout the "Total Sleep Opportunity" window, a period defined by heuristics applied to the actigraphy signal to indicate when the subject intended to sleep [59].
- Selectivity Mechanism: Advanced machine learning classifiers are trained on video-annotated ground truth data. Key features for selectivity include:
- Time- and Frequency-Domain Features: Characteristics of the motion signal.
- Topological Data Analysis (TDA): Features that capture the intrinsic "shape" of the motion data, proven to be highly predictive and robust to noise [59].
- Gyroscope Data: Including gyroscope signals improves detection of low-amplitude motions like finger scratches by providing precise orientation and angular velocity data [59].
Experimental Protocol and Validation
A typical validation protocol for a nocturnal scratch detection algorithm involves a clinical study with simultaneous sensor data and video recording.
- Participant Setup: AD patients wear a research-grade actigraphy device on their wrist while sleeping in a clinical sleep lab or at home.
- Ground Truth Annotation: Simultaneous video recordings are manually annotated by trained raters to label the start and end times of every scratch event [59]. This serves as the gold standard.
- Preprocessing and Feature Engineering: The raw accelerometer and gyroscope data are processed. A movement detection filter is first applied to exclude periods of no movement, increasing the prevalence of scratch events in the subsequent analysis. Topological and other features are then extracted from the data windows [59].
- Model Training and Ensembling: A machine learning model (e.g., a LightGBM classifier) is trained on the features to predict scratch vs. non-scratch events. Model ensembling is often used to boost performance [59].
- Endpoint Derivation and Validation: The classifier's output is used to derive digital endpoints like total scratch duration and scratch intensity. These are validated against the video ground truth using Bland-Altman plots and correlated with PROs like the SCORAD index to establish clinical validity [59].
Nocturnal Scratch Detection and Validation Workflow
Table: Performance Metrics for a Nocturnal Scratch Detection Model [59]
| Metric | Accelerometer Only Model | Accelerometer + Gyroscope Model |
|---|---|---|
| Average AUC (Area Under the Curve) | 0.77 | 0.80 |
| Average F1 Score | 0.39 | 0.44 |
| Key Advantage | Baseline performance | Improved detection of low-intensity/finger scratches |
Digital Endpoint 3: Physical Activity in Heart Failure
Context and Clinical Specificity
Heart failure symptoms significantly impact a patient's physical activity, mobility, gait, and sleep. Digital endpoints derived from wearable DHTs offer an unprecedented opportunity to remotely and continuously assess how patients function in their daily lives, moving beyond episodic clinic measurements [60]. The clinical specificity of these endpoints lies in their ability to serve as a proxy for overall functional capacity and disease burden, which are central to a patient's quality of life and clinical status.
Sensing Technology and Selective Data Acquisition
The primary technology for this application is the accelerometer, often embedded in easy-to-use wrist-worn devices.
- Technology: Consumer-friendly wrist-worn activity trackers or research-grade devices.
- Data Acquisition: Continuous data collection in the patient's natural environment over weeks or months.
- Selectivity Mechanism: The challenge is to extract clinically meaningful summaries of physical activity (e.g., total activity counts, time spent in moderate-to-vigorous activity, mobility measures) from the raw acceleration signals. This involves:
- Activity Classification: Algorithms classify periods of activity vs. rest and can sometimes distinguish activity types (walking, running, cycling).
- Intensity Measurement: The magnitude and frequency of the acceleration signal are used to estimate the intensity of physical activity.
- Mobility Metrics: Similar to the SV95C approach, gait parameters like walking speed can be extracted from wrist or chest-worn sensors, though this is more challenging than with ankle-worn sensors.
Experimental Protocol and Validation
The validation of accelerometer-based endpoints for heart failure is an active area of research, as highlighted by initiatives like the one mentioned by Ametris, which focuses on "validating the analytical and clinical aspects of an accelerometer-based clinical outcome assessment for measuring physical activity in adults with heart failure" [60].
- Device Selection and Deployment: Selecting a validated, regulatory-compliant wearable device for use in the heart failure population. Devices are distributed to participants for continuous wear.
- Data Collection and Preprocessing: Collecting raw or high-level activity data. Data is cleaned, and non-wear time is identified and excluded.
- Endpoint Calculation: Deriving summary metrics from the processed data. Common endpoints include:
- Total Daily Activity Count: A summary measure of overall movement.
- Time in Activity Intensity Bands: Minutes spent in sedentary, light, moderate, or vigorous activity.
- Mobility Measures: Such as daily step count or walking speed.
- Clinical Validation: Correlating the digital endpoints with established clinical measures of heart failure severity, such as the New York Heart Association (NYHA) class, the 6-minute walk test, or quality of life questionnaires (e.g., KCCQ). Demonstrating that the digital measure can detect clinically meaningful changes over time or in response to treatment is the final step for qualification.
Comparative Analysis of Digital Endpoints
Table: Comparison of Featured Digital Endpoints
| Feature | Stride Velocity 95th Centile (SV95C) | Nocturnal Scratch | Heart Failure Physical Activity |
|---|---|---|---|
| Clinical Construct | Peak ambulatory performance | Compulsive behavior during sleep | Functional capacity & daily activity |
| Primary Sensor Location | Ankle | Wrist | Wrist |
| Key Sensors | Accelerometer, Gyroscope | Accelerometer, Gyroscope | Accelerometer |
| Core Selectivity Challenge | Isolating strides from other leg motions | Distinguishing scratch from other hand motions | Classifying activity type and intensity from wrist motion |
| Primary Reference Measure | Correlated functional tests (e.g., 6MWT) | Video recording with manual annotation | Clinic-based functional tests (e.g., 6MWT), PROs |
| Regulatory Status | EMA Qualified for DMD [56] [57] | In development/validation [58] [59] | In development/validation [60] |
| Key Advantage | Objective measure of peak performance in free-living environment | Objective, continuous measure of a bothersome symptom | Continuous, real-world assessment of functional impact |
The development of digital endpoints for stride velocity, nocturnal scratch, and heart failure physical activity illustrates a cohesive framework for creating clinically meaningful measures from sensor data. The pathway to regulatory acceptance hinges on a rigorous, multi-stage process that addresses both selectivity (through advanced sensor technology and sophisticated algorithms validated against gold-standard references) and specificity (through clinical validation that ties the digital signal to a well-defined and relevant clinical construct). As demonstrated by the qualification of SV95C, the ongoing validation of nocturnal scratch, and the advancing work in heart failure, these endpoints offer a more sensitive, objective, and patient-centric window into disease progression and therapeutic response. Their successful implementation promises to enhance the efficiency of clinical trials and accelerate the delivery of transformative treatments to patients.
Practical Solutions: Overcoming Challenges and Fine-Tuning Sensing Performance
In the domains of pharmacological research and diagnostic sensing, the optimization of detection protocols hinges on a fundamental distinction between two approaches: specific sensing and selective sensing. These strategies represent complementary philosophies in target identification and analysis. Specific sensing aims for a singular, exclusive interaction between a sensor and a single target analyte, operating on a principle akin to a "lock-and-key" mechanism [5]. In an ideal scenario, a specific sensor would be completely specific to a single analyte, recognizing no other. This ideal is approached by antibodies, aptamers, and enzymatic lock-and-key pairs such as streptavidin/biotin [5].
In contrast, selective sensing embraces cross-reactivity. It employs an array of sensor elements, each of which interacts differentially with a range of analytes [5]. The collective response pattern across the array creates a unique "fingerprint" for a given sample, which can be deconvoluted using statistical and pattern recognition techniques. This "chemical nose/tongue" approach does not require each element to be highly specific; instead, it leverages the multivariate output from multiple, partially selective receptors to identify and sometimes quantify components within a complex mixture [5]. The choice between these paradigms dictates the subsequent optimization strategy for a protocol, particularly in balancing the pursuit of ultimate specificity against the pragmatic need for sufficient signal strength.
Theoretical Foundations: Specificity, Selectivity, and Signal
Defining the Core Concepts
- Specificity: In its purest form, specificity refers to the ability of a sensing element (e.g., a drug, an antibody, a receptor) to bind exclusively to a single target. It is a binary ideal—a perfectly specific agent would show zero interaction with any off-target. However, in biological systems, this absolute state is more theoretical than practical. True "zero activity" is rare, as compounds can exert minimal effects even on unintended targets [42].
- Selectivity: Selectivity exists on a continuous spectrum. It describes the preferential binding of an agent to its primary target over other potential targets [42]. This preferential binding is quantifiable, often expressed as a selectivity ratio (e.g., the ratio of the half-maximal inhibitory concentration (IC50) or inhibition constant (Ki) for an off-target to the value for the primary target). A drug with a Ki of 1nM for target A and 100nM for target B has a 100-fold selectivity for target A [42].
- Signal Strength: This pertains to the magnitude of the measurable output resulting from the target-analyte interaction. In sensing, a strong signal is crucial for high sensitivity and a robust signal-to-noise ratio, which directly impacts the limit of detection and the reliability of the measurement.
The Interplay and Trade-offs
The relationship between specificity, selectivity, and signal strength is often characterized by trade-offs. A highly specific sensor, by its nature, may be engineered for a single, strong interaction, potentially yielding a high signal. However, the pursuit of absolute specificity can be resource-intensive and may result in a fragile system that fails in complex, real-world matrices. Furthermore, what appears as a specific interaction in a controlled experiment may reveal itself as merely selective when the context changes, such as in different cellular environments or at higher concentrations [42].
Selective sensor arrays, while individually potentially weaker in signal for any single analyte, generate a multidimensional signal (the fingerprint) that can be more robust to noise and interferents. The signal strength in this case is not just the output of a single sensor but the collective, pattern-based information gain from the entire array. This approach can operate in a "hypothesis-less" fashion, making it powerful for discovering unknown sample components or diagnosing complex disease states where a single biomarker is insufficient [5].
Table 1: Comparative Analysis of Specific vs. Selective Sensing Approaches
| Feature | Specific Sensing | Selective Sensing (Array-Based) |
|---|---|---|
| Core Principle | "Lock-and-key"; single, exclusive interaction | "Chemical nose/tongue"; differential, cross-reactive interactions |
| Target Model | Single analyte | Multiple analytes or complex samples |
| Data Output | Unidimensional (concentration of one analyte) | Multidimensional (pattern or fingerprint) |
| Ideal Application | Well-defined hypothesis; known single biomarker | Hypothesis-free exploration; complex or unknown mixtures |
| Robustness to Noise | Lower (relies on one signal) | Higher (relies on a pattern) |
| Development Goal | Maximize affinity for target; minimize all off-target binding | Engineer a diverse set of cross-reactive interactions |
Quantitative Frameworks for Optimization
The Mathematics of Selectivity and Specificity
Quantifying selectivity is fundamental to protocol optimization. The Selectivity Ratio is a key metric, calculated by dividing the IC50 or Ki value for a secondary target by the value for the primary target [42]. A higher ratio indicates greater selectivity.
Selectivity Ratio (SR) = IC50 (Off-target) / IC50 (Primary Target)
For example, a beta-blocker like metoprolol has a selectivity ratio of approximately 2.3:1 for β1 over β2 adrenergic receptors, making it cardioselective. In contrast, the non-selective agent propranolol has a ratio near 0.8:1 [42]. The required ratio is context-dependent; a value of 10 might suffice for some applications but be inadequate where off-target effects pose serious risks.
Key Experimental Parameters and Their Quantitative Impact
Optimization requires careful measurement of parameters that govern the binding event. The following table summarizes critical quantitative data to collect and compare when evaluating or optimizing a sensing protocol.
Table 2: Key Quantitative Parameters for Protocol Optimization
| Parameter | Definition | Impact on Specificity/Selectivity | Impact on Signal Strength |
|---|---|---|---|
| IC50 / Ki | Concentration/inhibition constant for half-maximal effect; measure of affinity. | Lower value for primary target indicates higher potency and potential selectivity. | Lower IC50/Ki generally allows lower detection limits, potentially increasing signal-to-noise. |
| Selectivity Ratio | Ratio of IC50/Ki (off-target) to IC50/Ki (primary target). | Direct measure of selectivity; a higher ratio is better. | Indirect; high selectivity can reduce background "noise," effectively strengthening the target signal. |
| Signal-to-Noise Ratio (SNR) | Ratio of the power of a meaningful signal to the power of background noise. | A high SNR is critical for reliably distinguishing a specific signal from non-specific background. | Directly defines the clarity and detectability of the signal. Optimization aims to maximize SNR. |
| Z'-Factor | A statistical parameter used in high-throughput screening to assess assay quality. | Values >0.5 indicate a robust assay suitable for distinguishing active from inactive compounds. | Incorporates the dynamic range of the signal and the variability of both sample and background measurements. |
Experimental Protocols for Assay Optimization
This section provides detailed methodologies for key experiments aimed at characterizing and optimizing for specificity and signal.
Protocol 1: Determining Binding Affinity (Ki/IC50) and Selectivity Ratios
Objective: To quantitatively determine the affinity of a compound or sensor for its primary target and relevant off-targets, enabling the calculation of selectivity ratios.
Materials:
- Purified target and off-target proteins (e.g., receptors, enzymes).
- Test compound(s).
- Radiolabeled or fluorescently labeled ligand for competitive binding assays.
- Appropriate binding buffer.
- Microtiter plates and a plate reader/spectrometer (for fluorescence) or a scintillation counter (for radioactivity).
- Data analysis software (e.g., GraphPad Prism).
Methodology:
- Prepare Assay Plates: In a microtiter plate, create a serial dilution of the test compound across a suitable concentration range (e.g., 10 pM to 100 μM).
- Initiate Binding Reaction: To each well, add a fixed, low concentration of the labeled ligand and a fixed concentration of the target protein. Include control wells for total binding (no test compound) and non-specific binding (NSB, with a large excess of unlabeled ligand).
- Incubate: Allow the reaction to reach equilibrium at the appropriate temperature and duration.
- Separate and Quantify: Separate the bound ligand from the free ligand (e.g., via filtration or centrifugation). Quantify the amount of bound labeled ligand.
- Data Analysis: Calculate the percentage of specific binding for each concentration of the test compound:
[(Bound - NSB) / (Total - NSB)] * 100. - Curve Fitting: Fit the log(concentration) vs. response data to a non-linear regression model (e.g., "log(inhibitor) vs. response -- Variable slope" in Prism) to determine the IC50 value.
- Calculate Ki: Use the Cheng-Prusoff equation to convert the IC50 to the inhibition constant Ki:
Ki = IC50 / (1 + [L]/Kd), where[L]is the concentration of the labeled ligand andKdis its dissociation constant. - Repeat for Off-Targets: Repeat steps 1-7 for all relevant off-target proteins.
- Calculate Selectivity Ratios: For each off-target, calculate the selectivity ratio as
SR = Ki (Off-target) / Ki (Primary Target).
Protocol 2: Signal-to-Noise (SNR) and Z'-Factor Assay Validation
Objective: To validate the robustness and statistical quality of a sensing assay, ensuring it is capable of reliably distinguishing a true positive signal from background noise.
Materials:
- Assay components as defined in the primary protocol (e.g., target, sensor, buffer).
- A known positive control (high signal).
- A known negative control (blank or background signal).
- Microtiter plates and appropriate detection instrumentation.
Methodology:
- Plate Design: On a single microtiter plate, allocate a sufficient number of wells (e.g., n=32) for both the positive control and the negative control.
- Run Assay: Execute the standard assay protocol for all control wells simultaneously to minimize procedural variance.
- Data Collection: Record the raw signal measurements for all positive control and negative control wells.
- Calculate SNR:
Signal = Mean(Positive Controls)Noise = Standard Deviation(Negative Controls)SNR = |Signal| / Noise
- Calculate Z'-Factor:
σ_p = Standard Deviation(Positive Controls)σ_n = Standard Deviation(Negative Controls)μ_p = Mean(Positive Controls)μ_n = Mean(Negative Controls)Z' = 1 - [ (3σ_p + 3σ_n) / |μ_p - μ_n| ]
- Interpretation: An assay with a Z'-factor between 0.5 and 1.0 is considered excellent for screening purposes. A high SNR (>10) is generally desirable for a robust assay.
Visualizing Signaling Pathways and Workflows
The following diagrams, generated using Graphviz, illustrate core concepts and experimental workflows in the optimization of sensing protocols.
Specific vs. Selective Sensing Mechanisms
Assay Development and Validation Workflow
The Scientist's Toolkit: Essential Research Reagents and Materials
The following table details key reagents and materials essential for conducting experiments in specificity and selectivity optimization.
Table 3: Research Reagent Solutions for Sensing Optimization
| Reagent / Material | Function / Description | Application in Optimization |
|---|---|---|
| Purified Target Proteins | Isolated and often recombinant forms of the primary target and key off-targets (e.g., receptor subtypes, enzymes). | Serves as the core component for in vitro binding and functional assays to determine affinity and selectivity. |
| Labeled Ligands | A high-affinity ligand for the target that is conjugated to a reporter (e.g., radioactive isotope, fluorophore). | Used as a tracer in competitive binding assays to measure the Ki/IC50 of unlabeled test compounds. |
| Positive & Negative Controls | Compounds known to strongly activate/inhibit the target (positive) and those with no activity (negative/blank). | Critical for calculating assay performance metrics like Z'-factor and signal-to-noise ratio. |
| Selective Pharmacological Agents | Well-characterized compounds with known selectivity profiles (e.g., metoprolol for β1-adrenoceptors). | Used as reference standards and tool compounds to validate assay systems and benchmark new compounds. |
| Multivariate Analysis Software | Software packages (e.g., R, Python with Scikit-learn, SIMCA) capable of pattern recognition and classification. | Essential for analyzing the complex, multidimensional data output from selective sensor arrays. |
In the context of analytical method development, the distinction between specificity and selectivity is fundamental. A specific method is one that can assess the analyte unequivocally in the presence of components that may be expected to be present, such as impurities and matrix components. A selective method, meanwhile, is one that can differentiate the analyte from a limited number of potential interferents. High-Performance Liquid Chromatography (HPLC) and its hyphenation with Mass Spectrometry (LC-MS) are powerful techniques that leverage separation-based selectivity to achieve a high degree of specificity for target analytes in complex matrices like those encountered in drug development [61] [62].
The reliability of these methods hinges on the quality of the chromatographic data. Poor resolution, peak tailing, and baseline noise are not mere inconveniences; they are symptoms of underlying issues that directly degrade analytical performance. Poor resolution compromises selectivity by failing to separate analytes from interferents. Peak tailing harms quantification accuracy and specificity by altering integration boundaries and potentially obscuring minor components. Baseline noise reduces the signal-to-noise ratio, directly impacting the method's sensitivity and limit of detection [63]. This guide provides a systematic approach to diagnosing and resolving these critical issues to ensure data integrity in pharmaceutical research.
Problem 1: Poor Peak Resolution
Poor resolution occurs when two or more analyte peaks are not adequately separated, risking misidentification and inaccurate quantification. This directly challenges the selectivity of an analytical method.
Causes and Solutions for Poor Resolution
| Cause Category | Specific Causes | Recommended Solutions |
|---|---|---|
| Chromatographic Column | - Inappropriate stationary phase selectivity [64]- Column degradation (voids, bed collapse) [64]- Low column efficiency | - Select alternative stationary phase (e.g., C18, phenyl-hexyl, biphenyl) [65]- Use column with smaller particles (e.g., 1.7-2.7 μm) or longer length [66]- Replace aged column and use guard column [67] |
| Mobile Phase & Method | - Incorrect solvent strength [67]- Unsuitable pH affecting ionization [64]- Isocratic elution for complex samples | - Optimize organic solvent percentage or gradient profile [67] [64]- Adjust pH to suppress analyte ionization (e.g., low pH for bases) [66] [63]- Switch to gradient elution for wide polarity range [68] |
| System & Sample | - Overloaded column (mass or volume) [64]- Extra-column volume in system- Sample solvent stronger than mobile phase [64] | - Dilute sample or reduce injection volume [66] [64]- Ensure system tubing and connections are optimal- Inject sample in a solvent weaker than the initial mobile phase [64] |
Experimental Protocol: Rapid Column Selectivity Screening
A systematic approach to optimizing resolution involves screening different stationary phases and mobile phase conditions.
Objective: To identify the chromatographic conditions that provide baseline resolution for all critical analyte pairs in a mixture.
Materials:
- HPLC/LC-MS System: Binary or quaternary pump, autosampler, column oven, and detector (e.g., UV-Vis, MS).
- Columns: A set of at least 3-4 columns with different selectivities (e.g., C18, Polar-embedded C18, Phenyl-Hexyl, Biphenyl, HILIC) [65].
- Mobile Phases: Buffers (e.g., ammonium formate, ammonium acetate) at different pH values (e.g., 3.0, 7.0), and organic modifiers (acetonitrile, methanol).
- Samples: Standard solution of the target analytes and a blank matrix.
Procedure:
- Equilibrate System: Start with a generic gradient (e.g., 5-95% organic modifier over 10-15 minutes) and a moderate temperature (e.g., 30-40°C).
- Initial Screening: Inject the standard mixture on each column type using the same generic gradient. Observe the retention and separation of the critical peak pairs.
- Optimize pH: For the most promising 1-2 columns, prepare mobile phase buffers at different pH values (e.g., 3.0, 7.0) and repeat the analysis. This is critical for ionizable compounds.
- Fine-tune Gradient: Adjust the gradient slope (shallower around the elution time of critical pairs) and the initial/final organic percentage to improve resolution and reduce run time.
- Final Method Validation: Once optimal conditions are found, validate the method for specificity, linearity, accuracy, and precision using the sample in the intended matrix.
Problem 2: Peak Tailing
Peak tailing, where the trailing edge of the peak is elongated, is a common asymmetry issue that severely impacts the specificity and accuracy of quantification, particularly for minor components eluting near a tailing major peak [63].
Causes and Solutions for Peak Tailing
| Cause Category | Specific Causes | Recommended Solutions |
|---|---|---|
| Silanol Interactions | - Secondary interactions with acidic silanol groups on silica surface [66] [63]- Especially problematic for basic compounds at mid-high pH [66] | - Use low-pH mobile phase (pH ≤ 3.0) to suppress silanol ionization [66] [63]- Use highly deactivated (end-capped) columns [66]- Employ "Type B" silica with low metal content [63] |
| Column & Hardware | - Column void formation at inlet [66]- Mass overload (too much sample) [64] [63]- Blocked inlet frit [66] | - Reverse and flush column if permitted; replace if void is large [66] [64]- Dilute sample to reduce mass loading [66] [63]- Replace frit or guard column [66] |
| Chemical & Mobile Phase | - Inappropriate mobile phase pH [66]- Trace metal contamination in column [63]- Sample solvent mismatch [64] | - Adjust pH for analyte charge state (low pH for bases, high pH for acids) [66] [63]- Use columns with inert hardware for metal-sensitive compounds [65]- Ensure sample solvent is compatible with mobile phase [64] |
Experimental Protocol: Diagnosing and Fixing Tailing for a Basic Compound
This protocol is designed to resolve tailing commonly seen with pharmaceutical amines.
Objective: To achieve a peak asymmetry factor (As) of ≤ 1.5 for a basic analyte.
Materials:
- Columns: Standard C18 column, and a modern deactivated column (e.g., ZORBAX Eclipse Plus) or a column with inert hardware [66] [65].
- Mobile Phases: A: Water with 0.1% Formic Acid (pH ~2.7), B: Acetonitrile. A: 10 mM Ammonium Acetate (pH ~6.8), B: Acetonitrile.
- Sample: A solution of a basic drug compound (e.g., methamphetamine) [66].
Procedure:
- Baseline Analysis: Inject the sample using a generic gradient (e.g., 10-90% B in 10 min) on the standard C18 column with the neutral pH (Ammonium Acetate) mobile phase. Record the asymmetry factor (As) for the target peak.
- Apply Low-pH Mobile Phase: Switch to the low-pH (Formic Acid) mobile phase. Re-equilibrate the column and repeat the injection. Observe and record the improvement in peak shape [66].
- Test a Superior Column: Replace the column with the highly deactivated/inert column. Repeat the injection with both the neutral and low-pH mobile phases. Compare the As values.
- Evaluate Sample Load: If tailing persists, perform a sample load study. Inject a series of dilutions (e.g., 1x, 0.5x, 0.1x) to identify if mass overload is the cause [66] [63].
- Implement Solution: Adopt the combination of column and mobile phase pH that yields the best peak symmetry while maintaining adequate retention.
Problem 3: Baseline Noise and Drift
A stable baseline is the foundation for reliable integration and accurate quantification. Noise and drift obscure peaks, increase detection limits, and undermine the sensitivity of an analytical method.
Causes and Solutions for Baseline Noise and Drift
| Cause Category | Specific Causes | Recommended Solutions |
|---|---|---|
| Mobile Phase & Contamination | - Insufficient degassing (bubbles) [68] [67]- UV-absorbing impurities in solvents/additives [68] [69]- Mobile phase mismatch in gradient [68] | - Use inline degasser; sparge with helium [68]- Use high-purity LC-MS grade solvents; make fresh daily [68]- Add same additive to both A and B reservoirs [68] |
| System Hardware | - Leaks (especially before detector) [67]- Dirty or malfunctioning pump check valves [68]- Contaminated flow cell [67] | - Inspect and tighten fittings; replace seals [67]- Clean or replace check valves (ceramic preferred) [68]- Clean detector flow cell according to manual [67] |
| Environmental Factors | - Temperature fluctuations (affects RI detector severely, UV slightly) [68] [69]- Drafts from vents or windows [68] | - Use column oven for stable temperature [67]- Insulate exposed tubing [68]- Stabilize lab temperature; shield from drafts [68] |
Experimental Protocol: Isolating the Source of Baseline Noise
Objective: To methodically identify and eliminate the root cause of baseline noise or drift.
Materials:
- Freshly prepared, high-purity mobile phase.
- A known good column (or a restriction capillary).
- Necessary tools for inspecting and maintaining system components.
Procedure:
- Run a Blank Gradient: Execute a blank injection (pure solvent) using the method's gradient. Observe the baseline. Ghost peaks suggest mobile phase contamination or system carryover [64] [69].
- Bypass the Column: Disconnect the analytical column and connect a zero-dead-volume union or a restriction capillary in its place.
- If the noise persists without the column, the problem is in the system (pump, detector, mobile phase).
- If the noise disappears, the problem is likely the column itself (bleed, contamination) [64].
- Check the Pump: With the column still bypassed, observe the baseline at a constant flow rate. A saw-tooth pattern or regular fluctuations often indicate a faulty check valve or a small air bubble in the pump head [68] [69].
- Inspect for Contamination and Leaks:
- Clean the System: If contamination is suspected, flush the entire system (pump, injector, detector) with strong solvents (e.g., water, then methanol, then acetonitrile) according to the instrument manufacturer's guidelines.
The Scientist's Toolkit: Essential Research Reagents and Materials
The following table lists key consumables and hardware essential for effective HPLC/LC-MS troubleshooting and method development.
| Item | Function & Application | Example Use-Case |
|---|---|---|
| Guard Columns | Protects the analytical column from particulate matter and strongly adsorbed sample components [66] [67]. | Extending column lifetime when analyzing complex biological matrices. |
| In-line Filters | Placed before the column to trap particulates from the mobile phase or sample [66]. | Preventing frit blockage and subsequent pressure spikes. |
| High-Purity Solvents (LC-MS Grade) | Minimizes UV-absorbing impurities and ionic contaminants that cause baseline noise and ion suppression in MS [68] [61]. | Essential for high-sensitivity UV and MS detection, especially at low wavelengths. |
| Inert (Biocompatible) Columns | Hardware with passivated surfaces minimizes metal-analyte interactions, improving peak shape and recovery for metal-sensitive compounds [65]. | Analyzing phosphorylated compounds, chelating agents, or certain pharmaceuticals. |
| Varied Selectivity Columns | A set of columns with different stationary phases (C18, C8, Phenyl, HILIC) to screen for optimal resolution and selectivity [65] [64]. | Initial method development for a new chemical entity. |
| Solid Phase Extraction (SPE) Kits | For sample clean-up to remove interfering matrix components and concentrate analytes [66] [61]. | Preparing plasma samples for bioanalysis, removing proteins and salts. |
Achieving reliable and robust HPLC/LC-MS methods is a systematic process of diagnosing and resolving fundamental chromatographic issues. As detailed in this guide, problems like poor resolution, peak tailing, and baseline noise have distinct causes and solutions that directly impact the selectivity, specificity, and sensitivity of an analysis. By employing a structured troubleshooting workflow—beginning with the simplest and most common fixes, such as mobile phase preparation and column selection, before moving to more complex hardware diagnostics—scientists can efficiently restore instrument performance. The integration of these fundamental chromatography principles with advanced MS detection ensures that methods are not only selective but also highly specific, providing the high-quality data essential for confident decision-making in drug development and other critical research applications.
The conventional "one drug–one target" paradigm, which has dominated drug discovery for decades, is increasingly proving inadequate for addressing complex diseases with multifactorial etiologies [70]. Diseases such as cancer, neurodegenerative disorders, diabetes, and major depressive disorder involve dysregulation across multiple biological pathways, making single-target interventions frequently insufficient [71] [72]. In contrast, multi-target drugs—therapeutic agents designed to modulate multiple biological targets simultaneously—represent a pivotal advancement in pharmacological strategy [71]. These compounds leverage controlled "poor selectivity" to orchestrate broader therapeutic effects across pathological networks, offering enhanced efficacy while potentially reducing side effects and limiting drug resistance [73] [74].
This shift in approach recognizes that biological systems exhibit significant redundancy and compensatory mechanisms, making them resilient to single-point perturbations [70]. The rational design of multi-target drugs, therefore, aims to disrupt disease states more comprehensively by engaging multiple key nodes within pathological networks [72]. This whitepaper examines the therapeutic advantages of this strategy, detailing the underlying principles, experimental methodologies, and computational frameworks driving the development of multi-target therapeutics for complex disorders.
The Biological Rationale for Multi-Target Approaches
Systems Pharmacology of Complex Diseases
Complex disorders arise from concurrent dysfunctions across multiple interconnected biological pathways rather than isolated molecular defects [70]. This systems-level dysregulation necessitates therapeutic interventions that can restore network homeostasis more effectively than single-target agents [72]. Multi-target drugs offer several key advantages rooted in network pharmacology principles:
- Synergistic Efficacy: Simultaneous modulation of multiple targets within a disease network can produce additive or synergistic effects that exceed the simple sum of individual target manipulations [72]. For instance, in cancer treatment, dual-pathway inhibitors targeting PI3K/mTOR and RAF/MEK prevent compensatory pathway reactivation, leading to more sustained therapeutic responses [74].
- Reduced Compensatory Resistance: Biological systems frequently develop resistance through adaptive bypass mechanisms when single pathways are inhibited [70]. Multi-target approaches diminish this adaptability by concurrently affecting multiple nodes, making it more difficult for the system to compensate [72].
- Improved Safety Profiles: Contrary to initial assumptions, strategically designed multi-target drugs can demonstrate enhanced therapeutic windows by modulating disease-relevant targets while minimizing off-target effects on unrelated physiological processes [73].
Applications Across Therapeutic Areas
Table 1: Multi-Target Drug Applications in Complex Diseases
| Disease Area | Multi-Target Approach | Therapeutic Advantages | Example Agents |
|---|---|---|---|
| Neurodegenerative Disorders | Simultaneous targeting of amyloid, tau, oxidative stress, and neuroinflammatory pathways [74] | Enhanced blood-brain barrier penetration, reduced metabolism-related toxicity, limits polypharmacy [74] | Deoxyvasicinone-donepezil hybrids, cannabidiolic acid (CBDA) [74] |
| Major Depressive Disorder | Modulation of serotonin, glutamate, and BDNF-linked neuroplasticity pathways [74] | Rapid onset of action, improved cognitive function, effectiveness in treatment-resistant cases [74] | Vilazodone, vortioxetine, dextromethorphan-bupropion (Auvelity) [74] |
| Oncology | Concurrent inhibition of multiple tyrosine kinases or survival pathways [74] [72] | Prevents resistance through compensatory signaling, enhanced response rates, prolonged survival [74] | Imatinib, sunitinib, pazopanib [74] |
| Antimicrobial Therapy | Targeting multiple bacterial processes simultaneously [75] | Reduced likelihood of resistance development, broader spectrum of action [75] | Sulfamethoxazole-trimethoprim, novel synergies against S. aureus [75] |
Experimental Methodologies for Multi-Target Drug Discovery
High-Throughput Combination Screening
Systematic screening of drug combinations requires sophisticated experimental designs that can efficiently explore vast combinatorial spaces while capturing relevant biological complexity [75] [72]. The following workflow illustrates a representative approach for identifying synergistic drug combinations:
Diagram 1: High-throughput screening workflow for drug combinations.
A comprehensive screening methodology was employed in a systematic analysis of Gram-positive bacteria, profiling approximately 8,000 combinations of 65 antibacterial drugs against Staphylococcus aureus, Streptococcus pneumoniae, and Bacillus subtilis [75]. The experimental protocol encompassed the following key elements:
- Strain Selection and Growth Conditions: Multiple bacterial strains were selected to assess within-species conservation of interactions, with media and shaking conditions optimized for each species [75].
- Compound Library Design: The drug panel included 57 antibiotics representing all main classes targeting different bacterial processes, plus eight other bioactive molecules including antifungals and human-targeted drugs [75].
- Concentration Matrix Design: A 4×4 dose matrix with two-fold dilution gradients was implemented, with the highest concentration typically corresponding to the minimum inhibitory concentration (MIC) determined in preliminary assays [75].
Data Analysis and Interaction Modeling
The quantitative assessment of drug interactions requires robust mathematical models to distinguish synergistic from additive or antagonistic effects:
- Fitness Quantification: Bacterial growth was measured using optical density (OD595) at the entry to stationary phase in untreated controls, capturing drug effects on both growth rate and yield [75]. Fitness values were calculated as the ratio of OD595 in drug-treated conditions to no-drug controls at the same timepoint [75].
- Bliss Independence Model: Interaction scores were calculated using the Bliss independence model, which defines expected additive effects as the product of individual drug effects [75]. The formula is expressed as: Bliss Score = fAB - (fA × fB), where fAB is the observed fitness with the combination, and fA and fB are the fitness values with individual drugs [75].
- Interaction Scoring: A single effect-size value was derived from the distribution of interaction scores for each drug pair, with the first and third quartile values representing synergies and antagonisms, respectively [75].
- Validation Protocols: High-precision validation was performed using extended 8×8 concentration matrices with linearly spaced gradients, enabling confirmation of interactions identified in primary screens [75].
Table 2: Key Research Reagents and Experimental Solutions
| Reagent/Solution | Function in Research | Application Context |
|---|---|---|
| Broth Microdilution System | High-throughput growth assessment in multi-well plates | Antibacterial combination screening [75] |
| 4×4 Dose Matrices | Efficient exploration of concentration-dependent interactions | Primary screening of drug pairs [75] |
| 8×8 Validation Matrices | High-resolution confirmation of putative interactions | Secondary validation of synergistic pairs [75] |
| Bliss Independence Model | Quantitative framework for assessing drug interactions | Calculation of synergy/antagonism scores [75] |
| Automated Liquid Handling | Precision and reproducibility in compound dispensing | Large-scale combination screening [75] |
Computational Frameworks for Rational Design
Artificial Intelligence and Network Pharmacology
The rational design of multi-target drugs has been significantly accelerated by advances in computational approaches, particularly artificial intelligence (AI) and network pharmacology [71] [74]. These methodologies enable the systematic identification of target combinations and the optimization of compound properties:
- AI-Assisted Molecular Docking: Virtual screening predicts how compounds interact with various targets concurrently, enabling prioritization of candidate molecules with desired multi-target profiles [74].
- Network Pharmacology Mapping: This approach maps intricate relationships among drugs, targets, and disease circuits to identify synergistic interactions that can be leveraged for therapeutic benefit [74].
- Multi-Objective Optimization: Advanced algorithms balance potency, selectivity, and pharmacokinetic properties to design compounds with optimized multi-target activity [74].
Selective Targeters of Multiple Proteins (STaMPs)
A emerging framework in multi-target drug design involves the creation of Selective Targeters of Multiple Proteins (STaMPs)—single chemical entities with defined activity against a limited set of biological targets [73]. The STaMP paradigm establishes specific design criteria:
- Molecular Weight: <600 Da to maintain favorable pharmacokinetic properties [73]
- Target Range: 2-10 targets with potencies <50 nM for each [73]
- Off-Target Limitation: <5 off-target interactions with IC50/EC50 <500 nM [73]
- Cellular Targeting: Capacity to address multiple cell types involved in disease processes [73]
The following diagram illustrates the computational workflow for STaMP identification and optimization:
Diagram 2: Computational workflow for STaMP design.
Advanced Predictive Models
Recent advances in deep learning have produced sophisticated models for predicting drug-target interactions with high accuracy. The MvGraphDTA framework exemplifies this progress by employing a multi-view graph deep learning model that extracts both structural features and interaction relationship features from drugs and targets [76]. This approach demonstrated superior performance in drug-target affinity prediction, achieving improvements of 6.4% in MAE and 4.8% in RMSE compared to previous state-of-the-art methods [76].
Challenges and Future Perspectives
Key Limitations in Multi-Target Drug Development
Despite their considerable promise, multi-target therapeutics present significant challenges in design, validation, and clinical development:
- Design Complexity: Creating a single molecule capable of effectively modulating diverse targets requires extensive understanding of disease network biology and inter-target interactions [74].
- Balanced Potency: Achieving approximately equivalent potency against multiple targets while minimizing off-target effects represents a substantial medicinal chemistry challenge [74].
- Pharmacokinetic Optimization: Optimizing absorption, distribution, metabolism, and excretion (ADME) profiles for drugs acting on different target classes increases development complexity, as physicochemical properties suitable for one target may hinder interactions with another [74].
- Preclinical Validation: Multi-target agents require more extensive validation, integrated pharmacokinetic studies, and longer clinical trials to assess safety and systemic interactions [71].
Emerging Solutions and Future Directions
Several innovative approaches are emerging to address these challenges:
- AI-Driven Predictive Modeling: Artificial intelligence can analyze vast biological datasets to identify synergistic targets, optimize lead compounds, and predict clinical efficacy and safety, potentially reducing development timelines and attrition rates [74].
- Chemical Biology Tools: Novel modalities such as proteolysis-targeting chimeras (PROTACs) and molecular glues enable targeted protein degradation, expanding the toolbox for multi-target engagement [73].
- Digital Biomarker Integration: Sensors and wearable devices facilitate continuous, real-world monitoring of treatment responses, supporting personalized therapy strategies for multi-target approaches [74].
The strategic embrace of "poor selectivity" through rationally designed multi-target drugs represents a paradigm shift in pharmacology, moving beyond the constraints of single-target approaches to address the complex network pathophysiology of chronic diseases. By simultaneously engaging multiple key nodes within disease systems, these therapeutics demonstrate enhanced efficacy, reduced vulnerability to resistance, and improved clinical outcomes across multiple therapeutic areas. While significant challenges remain in their design and development, advances in computational modeling, high-throughput screening, and systems biology are progressively enabling the rational design of selective multi-target agents. As these approaches mature, multi-target therapeutics are poised to become increasingly central to the treatment of complex diseases, ultimately fulfilling the promise of network pharmacology to deliver more effective and sustainable therapeutic solutions.
Sensor network optimization represents a critical challenge in the design and implementation of monitoring systems for complex engineering applications. This technical guide provides a comprehensive analysis of the fundamental trade-offs between cost, weight, and information gain within the broader context of specific versus selective sensing paradigms. By synthesizing recent advances in optimization frameworks, including Bayesian optimization and Deep Reinforcement Learning (DRL), this whitepaper establishes a structured methodology for designing sensor networks that balance economic constraints with performance requirements. The integration of reliability considerations throughout the system life cycle further enhances the practical applicability of these optimization strategies for researchers, scientists, and drug development professionals working with complex sensing systems.
Sensor design strategies fundamentally diverge into two distinct paradigms: specific sensing and selective sensing. Understanding this dichotomy provides essential context for optimizing sensor networks in complex systems.
Specific sensing employs receptors designed for exclusive interaction with a single target analyte, ideally recognizing no others. This approach, exemplified by antibodies, aptamers, and enzymatic lock-and-key pairs, has dominated biosensing applications. Its success stories include lateral flow immunochromatographic assays for pregnancy testing and glucose-specific enzymes in blood glucose meters. The primary advantage of specific sensing lies in its direct, unambiguous detection of predetermined biomarkers, making it invaluable when clear hypotheses exist about target analytes [5].
Selective sensing, in contrast, utilizes cross-reactive sensor elements that respond differentially to multiple analytes. Typically deployed in array formats, these systems generate unique response patterns or "fingerprints" for sample classification. This "chemical nose/tongue" approach proves particularly powerful in hypothesis-free scenarios where sample composition may be partially unknown or where detecting complex patterns rather than individual components provides more valuable information [5].
The optimization challenges differ significantly between these approaches. Specific sensor networks often focus on optimal spatial placement and minimal sensor count to detect predetermined targets, while selective sensor arrays emphasize strategic diversity in cross-reactivity to maximize discriminatory power across potential unknown analytes. Both paradigms, however, share the fundamental challenge of balancing information quality against physical and economic constraints [5].
Core Optimization Framework and Trade-off Analysis
Fundamental Trade-offs in Sensor Network Design
The sensor optimization problem in complex systems inherently involves navigating competing objectives across multiple dimensions. Table 1 summarizes the primary trade-offs and their impacts on system performance.
Table 1: Fundamental Trade-offs in Sensor Network Optimization
| Performance Metric | Conflicting Metric | Trade-off Relationship | Impact on System Performance |
|---|---|---|---|
| Information Gain | Cost | Increasing sensor quantity/quality typically improves information gain but raises acquisition, installation, and maintenance costs [77]. | Directly affects monitoring resolution, fault detection capability, and prognostic accuracy [77] [78]. |
| Information Quality | Weight | High-fidelity sensors often have greater mass, particularly in structural health monitoring applications [77]. | Critical for weight-sensitive applications like aircraft, where added mass impacts fuel efficiency and payload capacity [77]. |
| System Reliability | Complexity | Increasing sensor count introduces more potential failure points and computational complexity for data processing [77] [78]. | Affects system availability, maintenance frequency, and decision-making reliability over the life cycle [78]. |
| Monitoring Resolution | Power Consumption | Higher sampling rates and data resolution increase energy demands, particularly for wireless systems [77]. | Influences operational autonomy, battery life, and sustainability of long-term monitoring [77]. |
Multi-Objective Optimization Formulation
Formally, the sensor network optimization problem can be expressed as a multi-objective function:
Maximize: Information Gain(Placement, Type, Quantity) Subject to:
- Total Cost ≤ Budget Constraint
- Total Weight ≤ Mass Constraint
- Power Consumption ≤ Energy Budget
- Reliability ≥ Minimum Threshold
Where Information Gain is quantified using metrics such as risk-weighted f-divergence, Fisher information matrix, or KL-divergence to measure uncertainty reduction about the structural or system state [78]. The constraints collectively define the feasible design space, with the optimal solution typically lying along the Pareto frontier where no single objective can be improved without degrading another [77].
Quantitative Analysis of Optimization Techniques
Performance Comparison of Optimization Algorithms
Table 2 provides a comparative analysis of sensor optimization methodologies, highlighting their respective advantages, limitations, and implementation considerations.
Table 2: Sensor Optimization Techniques and Performance Characteristics
| Optimization Technique | Key Advantages | Limitations | Implementation Complexity | Best-Suited Applications |
|---|---|---|---|---|
| Bayesian Optimization | Efficient for high-dimensional, non-linear problems; handles uncertainty explicitly [78] [77]. | Computationally intensive for very large design spaces; requires careful prior specification [78]. | High | Pre-posterior design stage; systems with expensive objective function evaluations [78]. |
| Deep Reinforcement Learning (DRL) | Adapts to dynamic environments; suitable for real-time resource allocation [79]. | Requires extensive training data; hyperparameter sensitivity [79]. | Very High | Dynamic edge computing; cybertwin-enabled networks; real-time adaptive systems [79]. |
| Genetic Algorithms | Effective global search capability; handles non-convex problems [78]. | Slow convergence; computationally demanding for large populations [78]. | Medium | Component-level optimization; moderate design spaces [78]. |
| Greedy Algorithms | Computationally efficient; provides good approximate solutions [78]. | May converge to local optima; sequential dependency [78]. | Low | Large-scale systems where computational efficiency is critical [78]. |
| Self-Organizing Map (SOM) with DRL | Organizes state space efficiently; improves learning convergence [79]. | Complex implementation; requires parameter tuning at multiple levels [79]. | Very High | Hybrid wired-wireless networks; joint communication-computing-caching resource allocation [79]. |
Information-Based Metrics for Optimization
The selection of appropriate metrics fundamentally guides the optimization process. Key information-based metrics include:
- Fisher Information Matrix: Maximizes parameter estimation accuracy by optimizing the inverse of parameter covariance [78]
- KL-Divergence: Measures information gain through relative entropy between prior and posterior distributions [78]
- Probability of Detection: Minimizes false alarms (Type I error) and false negatives (Type II error) [78]
- Modal Assurance Criterion: Quantifies similarity in mode shapes for structural dynamics applications [78]
Each metric emphasizes different aspects of information quality, with selection dependent on the primary objective of the monitoring system—whether parameter estimation, fault detection, or condition classification [78].
Experimental Protocols and Methodologies
Bayesian Optimization Framework for Sensor Placement
The Bayesian optimization approach provides a powerful methodology for sensor placement accounting for reliability considerations:
- Problem Formulation: Define the design space representing possible sensor locations and types [78]
- Objective Function Specification: Implement Bayes risk calculation incorporating expected sensor bias risk over the system life cycle [78]
- Surrogate Modeling: Employ Gaussian processes to model the expensive objective function [78]
- Acquisition Function Optimization: Use Expected Improvement or Upper Confidence Bound to guide the search process [78]
- Iterative Evaluation and Update: Sequentially evaluate promising sensor configurations and update the surrogate model [78]
This methodology is particularly valuable in the pre-posterior design stage where no prior sensor data exists, requiring physics-based models to simulate sensor data and account for uncertainties in loading, sensor noise, and damage degradation [78].
SOM-DRL Protocol for Joint Resource Allocation
For dynamic resource allocation in networked sensors, the following protocol integrates self-organizing maps with deep reinforcement learning:
- State Space Clustering: Apply Self-Organizing Map (SOM) to organize the high-dimensional state space into topological clusters [79]
- MDP Formulation: Formalize the resource allocation problem as a Markov Decision Process with states, actions, and rewards [79]
- Actor-Critic Training: Implement deep reinforcement learning with separate actor (policy) and critic (value) networks [79]
- Multi-Objective Reward Design: Define reward functions that balance latency, energy consumption, and computational efficiency [79]
- Validation with Separate Test Set: Evaluate performance on unseen data to prevent overfitting and ensure generalizability [79]
This approach has demonstrated significant improvements in cybertwin-enabled 6G networks, achieving up to 3.34% reduction in energy consumption and 3.17% reduction in latency compared to traditional methods [79].
Computational Framework and Signaling Pathways
The sensor optimization workflow integrates multiple computational components into a cohesive framework. The following diagram illustrates the core signaling and data processing pathway:
Sensor Network Optimization Workflow
The workflow initiates with the fundamental choice between specific and selective sensing paradigms, which dictates subsequent objective function formulation. The optimization loop incorporates life cycle feedback, enabling continuous refinement of the sensor network based on operational performance data and changing reliability conditions [78] [5].
The Researcher's Toolkit: Essential Methodologies
Table 3 catalogues essential methodological approaches for sensor network optimization, providing researchers with a practical reference for implementation planning.
Table 3: Essential Methodologies for Sensor Network Optimization
| Methodology Category | Specific Techniques | Primary Function | Implementation Considerations |
|---|---|---|---|
| Information Quantification | Fisher Information Matrix, KL-Divergence, f-Divergence [78] | Measures uncertainty reduction and information gain from sensor data | Selection depends on parameter estimation vs. classification focus |
| Optimization Algorithms | Bayesian Optimization, Genetic Algorithms, DRL, SOM-DRL [79] [78] | Solves sensor placement and resource allocation problems | Computational complexity scales with design space dimensionality |
| Reliability Assessment | Life Cycle Bayes Risk, Probability of Detection, Sensor Bias Risk [78] | Evaluates long-term sensor performance under environmental stress | Requires accurate failure rate models for different environmental zones |
| Data Processing Frameworks | Principal Component Analysis (PCA), Partial Least Squares (PLS), Explainable AI (XAI) [80] | Extracts meaningful information from raw sensor data | XAI methods provide chemical insight for complex spectral data [80] |
| Validation Methods | Separate Training/Test Sets, Cross-Validation, SHAP Analysis [80] [5] | Ensures model generalizability and interpretability | Prevents overfitting in multidimensional sensor array data |
Optimizing sensor networks in complex systems requires methodical navigation of the trade-offs between cost, weight, and information gain within the conceptual framework of specific versus selective sensing paradigms. The integration of Bayesian optimization and deep reinforcement learning approaches provides powerful methodologies for addressing these multi-objective optimization challenges while accounting for real-world constraints.
Future research directions include the development of hybrid specific-selective sensor arrays that leverage the strengths of both approaches, enhanced explainable AI techniques for interpreting complex sensor data patterns, and life cycle optimization frameworks that dynamically adapt sensor networks based on performance degradation and changing operational requirements. For drug development professionals and researchers, these advances promise more efficient, informative, and cost-effective sensing systems capable of supporting increasingly complex diagnostic and monitoring applications.
In pharmacology, the therapeutic ideal of a "magic bullet" that interacts exclusively with a single biological target remains largely theoretical. In practice, drug selectivity—the preferential binding to a primary target over secondary targets—exists on a spectrum and is profoundly influenced by dosing concentrations. This whitepaper examines the fundamental mechanisms through which purportedly selective pharmacological agents lose specificity at elevated concentrations, drawing upon clinical evidence from antidepressant therapies and molecular studies of receptor binding. We demonstrate that dose-dependent selectivity loss is not a clinical anomaly but rather an inherent property of drug-receptor interactions, with significant implications for therapeutic efficacy, adverse effect profiles, and rational drug design.
The terms "selectivity" and "specificity" are frequently employed interchangeably in pharmacological literature, yet they represent distinct concepts with critical implications for dosing strategies. True specificity implies absolute and exclusive binding to a single molecular target, a property rarely achieved in biological systems due to the structural conservation of binding sites across receptor families and the complex nature of molecular interactions [42]. In contrast, drug selectivity refers to a compound's preferential binding to its primary target versus other targets, quantified as a ratio on a continuous spectrum [42].
This distinction becomes clinically paramount when considering dose-response relationships. A selectivity ratio, typically calculated by dividing the IC₅₀ or Kᵢ values for secondary targets by those of the primary target, provides a numerical foundation for predicting therapeutic windows [42]. For instance, a drug with a Kᵢ of 1 nM for its primary target and 100 nM for a secondary target exhibits a 100-fold selectivity ratio. However, this preferential binding is concentration-dependent, meaning that as dosage increases, the probability of interaction with secondary targets rises exponentially, leading to diminished specificity and potentially novel off-target effects [42].
Theoretical Foundations: The Molecular Basis of Selectivity Loss
Target Affinity and Binding Kinetics
The molecular basis for dose-dependent selectivity loss resides in the fundamental principles of receptor affinity and binding kinetics. Most drugs demonstrate a gradient of binding affinities across multiple targets rather than absolute exclusivity for a single site. At therapeutic concentrations, a selectively designed compound will predominantly engage its primary high-affinity target. However, as concentrations increase through dose escalation, the law of mass action dictates that lower-affinity interactions with secondary targets become statistically more probable [42].
The conserved structural motifs across related receptor families further complicate target exclusivity. For example, the substrate binding sites of monoamine transporters share significant homology, making it challenging to develop inhibitors that exclusively target one transporter without affecting others at higher concentrations [81]. This phenomenon is particularly evident in antidepressant therapies where subtle modifications to a shared chemical scaffold can dramatically alter selectivity profiles between serotonin and norepinephrine transporters [81].
The Selectivity Spectrum in Practice
Table 1: Selectivity Spectrum of Pharmacological Agents
| Agent Category | Selectivity Profile | Clinical Implications | Dose-Dependent Effects |
|---|---|---|---|
| Highly Selective | Preferential binding to single receptor subtype at therapeutic doses | Reduced side effect profile, narrower indications | Specificity may diminish with dose escalation |
| Moderately Selective | Binds primary target with moderate preference over secondary targets | Balanced efficacy and side effect profile | Progressive engagement of secondary targets with increasing dose |
| Multi-Target | Designed or incidental engagement of multiple targets | Broader therapeutic potential, complex side effect profile | Maintains multi-target engagement across dose range |
Clinical Evidence: Dose-Dependent Selectivity Loss in Antidepressant Therapies
Selective Serotonin Reuptake Inhibitors (SSRIs)
SSRIs exemplify the clinical implications of dose-dependent selectivity. A comprehensive meta-analysis of 40 studies involving 10,039 participants demonstrated that while higher SSRI doses (up to 250 mg imipramine equivalents) were associated with slightly increased efficacy, this benefit was counterbalanced by decreased tolerability and increased dropout due to side effects [82]. This suggests that beyond a certain concentration threshold, the engagement of secondary targets produces adverse effects that may offset therapeutic gains.
The serotonin transporter occupancy studies provide mechanistic insight into this phenomenon. Molecular imaging research reveals that SERT occupancy follows a hyperbolic relationship with dose, increasing rapidly at lower doses and reaching a plateau at approximately 80% occupancy at the minimum recommended dose [83]. This occupancy curve demonstrates the diminishing returns of dose escalation, as substantial increases in dosage yield progressively smaller gains in primary target engagement while exponentially increasing the probability of off-target interactions.
Serotonin-Norepinephrine Reuptake Inhibitors (SNRIs)
SNRIs provide a compelling case study in intentional multi-target engagement with concentration-dependent effects. Venlafaxine, a prototypical SNRI, exhibits dose-dependent transporter inhibition: at lower doses (<150 mg/day), it predominantly inhibits serotonin reuptake; at moderate doses (>150 mg/day), it engages noradrenergic systems; and at high doses (>300 mg/day), it demonstrates additional effects on dopaminergic neurotransmission [84]. This sequential target engagement illustrates how a single agent can display qualitatively different pharmacological profiles across its dosing range.
The clinical implications of this phenomenon are significant. While the broader receptor profile at higher doses may benefit some patients with treatment-resistant conditions, it simultaneously introduces new potential adverse effects, including increased blood pressure and noradrenergic activation symptoms [84]. This underscores the importance of precision in dosing to achieve the desired balance of target engagements for individual patients.
Table 2: Dose-Dependent Selectivity Profiles of Antidepressants
| Drug Class | Mechanism of Action | Low-Dose Selectivity | High-Dose Selectivity Loss | Clinical Consequences |
|---|---|---|---|---|
| SSRIs | SERT inhibition | Selective SERT blockade | Non-SERT off-target effects | Increased side effects without proportional efficacy gain |
| Venlafaxine | SERT/NET inhibition | Primarily SERT inhibition | Progressive NET then DAT inhibition | Noradrenergic side effects, blood pressure elevation |
| Duloxetine | SERT/NET inhibition | Balanced SERT/NET (10:1) | Weak dopamine effects | Complex side effect profile |
| Vilazodone | SERT allosteric modulation + 5-HT₁₀ partial agonism | Dual-target specificity | Unknown off-target engagement | Possibly reduced sexual dysfunction |
Experimental Methodologies for Investigating Selectivity Loss
Radioligand Binding Assays
Radioligand binding studies provide the foundational methodology for quantifying target affinity and selectivity ratios. The following protocol enables systematic investigation of a compound's binding profile across multiple targets:
Membrane Preparation: Isolate cell membranes expressing human recombinant targets (SERT, NET, DAT, etc.) from transfected cell lines (e.g., HEK-293 or COS-7 cells) [85].
Competition Binding: Incubate membrane preparations with a constant concentration of a selective radioligand (e.g., [³H]imipramine for SERT, [³H]nisoxetine for NET) and varying concentrations of the test compound [85].
Equilibrium Establishment: Maintain binding reactions at optimal conditions (e.g., 2 hours at 25°C) to reach equilibrium [85].
Separation and Quantification: Separate bound from free radioligand by rapid filtration through glass fiber filters. Quantify bound radioactivity by liquid scintillation counting [85].
Data Analysis: Determine inhibition constants (Kᵢ) using nonlinear regression to fit competition curves. Calculate selectivity ratios by comparing Kᵢ values across targets [81].
This methodology enabled the discovery that vilazodone, unlike conventional SSRIs, binds to an allosteric site on SERT rather than the orthosteric central site, potentially explaining its distinct clinical profile [85].
In Vivo Transporter Occupancy Imaging
Positron Emission Tomography (PET) and Single Photon Emission Computed Tomography (SPECT) enable non-invasive measurement of target engagement in living organisms:
Ligand Selection: Employ highly selective radioligands such as [¹¹C]-DASB, [¹²³I]-ADAM, or [¹¹C]-MADAM with >1000:1 affinity for SERT over DAT and NET [83].
Baseline Scanning: Perform initial scanning in drug-naïve state to establish baseline binding potential (BPₙ₀) in target regions of interest [83].
Drug Administration: Administer the test compound at therapeutic doses and scan at predetermined timepoints post-administration [83].
Occupancy Calculation: Calculate transporter occupancy as: Occupancy (%) = [(BPₙ₀ baseline - BPₙ₀ post-drug) / BPₙ₀ baseline] × 100 [83].
Dose-Occupancy Relationship: Model the relationship between dose and occupancy using Michaelis-Menten kinetics: f(x,K,Vₘ) = (Vₘx)/(K+x), where Vₘ represents maximum occupancy and K is the dose producing half-maximal occupancy [83].
This approach has demonstrated that SERT occupancy increases hyperbolically with dose, plateauing at approximately 80% at minimum recommended doses, providing a mechanistic explanation for the limited benefit of dose escalation [83].
Diagram 1: Molecular basis of dose-dependent selectivity loss. At low concentrations, drugs primarily engage high-affinity targets. As concentration increases, engagement with lower-affinity secondary and off-targets rises, increasing side effects without proportional efficacy gains.
The Scientist's Toolkit: Essential Research Reagents and Methodologies
Table 3: Essential Research Reagents for Investigating Pharmacological Selectivity
| Research Tool | Function/Application | Key Characteristics | Representative Examples |
|---|---|---|---|
| Selective Radioligands | Quantifying target binding affinity and occupancy | High selectivity for specific transporters/receptors | [¹¹C]-DASB (SERT), [³H]imipramine (SERT), [³H]nisoxetine (NET) [83] [85] |
| Recombinant Cell Systems | Expressing individual human targets for binding studies | Stable expression of specific transporters/receptors | HEK-293 SERT, COS-7 NET, CHO DAT cells [85] |
| Site-Directed Mutagenesis | Mapping binding sites and selectivity determinants | Identifies key residues governing selective binding | SERT mutants (Y95F, I172M, S438A) [85] |
| Michaelis-Menten Modeling | Quantifying dose-occupancy relationships | Hyperbolic function describing saturable binding | f(x,K,Vₘ) = (Vₘx)/(K+x) [83] |
Implications for Rational Drug Design and Therapeutic Optimization
Understanding dose-dependent selectivity loss has profound implications for rational drug design and clinical development. The ideal therapeutic agent would maintain its selectivity profile across its entire dosing range, but this property is challenging to achieve. Several strategies have emerged to optimize the therapeutic index:
Allosteric Modulation: Targeting allosteric sites, which are typically less conserved than orthosteric sites, may offer improved selectivity. Vilazodone represents an example of this approach, binding to an allosteric site on SERT with a distinct interaction mechanism compared to conventional SSRIs [85].
Metabolic Profiling: Considering the differential metabolism of drug enantiomers can enhance selectivity. Research has revealed that SERT and NET exhibit opposite stereochemical preferences for inhibitor binding, with SERT favoring S-enantiomers and NET favoring R-enantiomers of citalopram/talopram analogs [81]. Leveraging such stereoselectivity can fine-tune therapeutic profiles.
Dose Regimen Optimization: Recognizing the plateau effect in target occupancy should inform dosing strategies. Since SERT occupancy reaches approximately 80% at minimum effective doses, aggressive dose escalation provides diminishing returns while increasing off-target engagement [83].
The tension between selectivity and efficacy presents both challenges and opportunities in drug development. While poor selectivity has traditionally been viewed as a limitation, deliberately engineered multi-target drugs can offer therapeutic advantages in complex diseases where multiple pathways contribute to pathology [42]. The clinical success of certain SNRIs in conditions with dual pathophysiology (e.g., depression with comorbid chronic pain) exemplifies this principle [86].
Diagram 2: Integrated research workflow for evaluating and optimizing dose-selectivity relationships. This comprehensive approach spans from molecular profiling to clinical implementation, enabling rational dosing strategy development.
The phenomenon of dose-dependent selectivity loss represents a fundamental challenge in pharmacology with significant implications for therapeutic efficacy and safety. The evidence from antidepressant therapies demonstrates that selectivity is concentration-dependent, with higher doses engaging secondary targets that may produce both additional therapeutic effects and undesirable side effects. Understanding this relationship through systematic binding studies, occupancy imaging, and careful dose-response characterization enables more rational drug design and optimization of therapeutic regimens. Future research should focus on developing compounds with maintained selectivity across their dosing range and exploring the therapeutic potential of deliberately engineered multi-target agents for complex disease states.
Ensuring Efficacy: Validation Frameworks and Comparative Analysis of Sensing Paradigms
In the realm of clinical laboratory sciences and diagnostic development, particularly within the context of specific versus selective sensing approaches, three distinct processes—validation, verification, and optimization—form the critical foundation for ensuring analytical reliability and regulatory compliance. These processes, while often conflated, represent separate stages in the assay lifecycle, each with defined objectives and regulatory implications. The College of American Pathologists (CAP) and Clinical Laboratory Improvement Amendments (CLIA) provide the framework that governs these activities, ensuring that laboratory testing meets stringent quality standards for patient care [87]. For researchers developing sensing technologies, understanding these distinctions is paramount when transitioning from basic research to clinically applicable diagnostics. This guide delineates the definitions, regulatory requirements, and practical applications of validation, verification, and optimization, with special consideration for the development of specific and selective sensor platforms.
Definitions and Regulatory Framework
Core Definitions and Distinctions
The terms validation, verification, and optimization refer to different levels of assay performance assessment, each triggered by specific circumstances in the laboratory setting.
Optimization represents the initial, investigative phase where protocols are fine-tuned to achieve the best possible staining or signal response. It is a trial-and-error process aimed at tweaking pre-analytical and analytical variables such as fixation times, antibody dilutions, and incubation conditions to enhance specificity and signal strength. This stage is crucial for establishing a robust protocol before any formal performance assessment begins [87].
Validation is the comprehensive process of establishing and documenting that an analytical test procedure, when performed in a specific laboratory, is sufficiently accurate, precise, specific, and reproducible for its intended analytical purpose. It is the "gold standard" test drive that provides confidence in a new test's reliability before it is ever used for patient samples [87]. For laboratory-developed tests (LDTs) or modified FDA-approved tests, a full validation is required [88].
Verification is the process of confirming that a previously validated test performs as expected when specific, limited changes are made to the testing environment or reagents. It is a quality check that ensures adjustments to an established protocol—such as switching manufacturers, changing reagent lots, or moving instrumentation—do not compromise the test's performance characteristics [87]. For commercially available, FDA-cleared or approved tests, laboratories must perform verification, not full validation, before clinical use [88].
Regulatory Standards: CAP and CLIA
Both CAP and CLIA set explicit rules and recommendations governing validation and verification activities. Key regulatory standards include:
- CAP Checklist Requirement ANP.22750 for Antibody Validation/Verification [87]
- CAP Checklist Requirement ANP.22978 for Predictive Marker Testing – Validation/Verification [87]
- CLIA Regulation § 493.1253 regarding the establishment of performance specifications [87]
- CLIA Final Rule (CMS-3326-F) effective December 28, 2024, which includes changes to personnel qualifications affecting who may perform these technical procedures [89]
Table 1: Summary of Core Process Definitions and Triggers
| Process | Primary Objective | Typical Triggers | Regulatory Scope |
|---|---|---|---|
| Optimization | Fine-tuning protocols for best performance | New antibody/clone; New stains; Pathologist-requested changes; Adjusting preanalytical factors | Protocol development phase |
| Validation | Establishing performance specifications for a new test | New test; New antibody/clone; Different fixative; New detection kit; New platform; LDTs | Full performance assessment (Accuracy, Precision, Reportable Range, etc.) |
| Verification | Confirming performance after minor changes | Switching manufacturers; Changing antigen retrieval; Platform moved; Minor protocol changes; Lot-to-lot checks | Limited performance check against established specifications |
Detailed Experimental Protocols and Methodologies
Optimization Methodology
Optimization involves systematic experimentation to establish ideal assay conditions. For immunohistochemical stains or sensor surfaces, this typically includes:
- Antibody Titration: Testing a range of antibody concentrations to identify the dilution that provides optimal signal-to-noise ratio. A common approach is to test dilutions from 1:50 to 1:1000.
- Antigen Retrieval Evaluation: Comparing different retrieval methods (e.g., heat-induced epitope retrieval with citrate or EDTA buffers, enzyme-induced retrieval) and durations to maximize epitope accessibility.
- Incubation Time and Temperature: Assessing variations in primary and secondary antibody incubation times (e.g., 30-120 minutes) and temperatures (room temperature vs. 4°C).
- Detection System Optimization: Evaluating different detection kits or amplification systems to enhance sensitivity while minimizing background.
Documentation should include detailed records of all tested variables and their outcomes, typically through digital images of staining results at different conditions.
Validation Protocol Requirements
For a full validation, CLIA requires laboratories to verify several key performance characteristics through structured experiments [88]:
- Accuracy: How close the test results are to the true value. This is typically assessed by comparing results to a reference method or using materials with known target values.
- Precision: The reproducibility of results across runs, days, and technologists. This includes both within-run and between-run precision studies.
- Reportable Range: The span of values that the test can accurately measure, from the lowest to the highest reportable result.
- Reference Intervals: The normal values for your patient population, which must be established or verified if not adopting the manufacturer's values.
- Analytical Sensitivity and Specificity: Particularly critical for qualitative tests (e.g., PCR, antigen tests), establishing the lowest detection limit and the assay's ability to correctly identify negative samples.
The CAP specifically requires that antibody validation includes documentation of the number of positive and negative tissues used, protocols, and approval records [87].
Verification Protocol Requirements
Verification of a previously validated test or FDA-cleared test requires a streamlined assessment:
- Use a Standardized Verification Protocol: Create a lab-wide template specifying characteristics being verified, sample types and numbers, control materials, and acceptance criteria [88].
- Run Focused Studies: Using known patient samples, split samples, or commercial controls to evaluate key performance parameters, typically focusing on accuracy and precision compared to the existing validated method [88].
- Documentation and Review: All verification data must be signed, dated, and stored in an accessible location, tied to the specific instrument or platform used [88].
Decision Framework and Documentation Requirements
Process Selection Workflow
The following diagram illustrates the decision-making process for determining whether optimization, validation, or verification is required when implementing or modifying an assay:
Documentation and Compliance
Comprehensive documentation is critical for demonstrating compliance during CAP inspections and CLIA audits. Essential documentation elements include [87]:
- Standard Operating Procedures (SOPs): Act as the roadmap for validation, verification, or optimization processes, including the number of positive and negative tissues required.
- Protocol Records: Detailed documentation of methods used, including lot numbers, clones, expiration dates, manufacturers, and any deviations.
- Results and Raw Data: Maintain original slides, printouts, or digital records for a minimum of two years (or per laboratory SOP requirements).
- Approval Records: Signed and dated forms indicating review and acceptance by the laboratory director or designee.
Table 2: Essential Research Reagent Solutions for Assay Development
| Reagent/Category | Function in Assay Development | Specific Examples |
|---|---|---|
| Antibodies (Primary) | Target recognition and binding | Monoclonal vs. polyclonal; Different clones (e.g., Mart 1 Clone A103) |
| Detection Systems | Signal generation and amplification | Enzyme-conjugated secondaries; Polymer-based detection kits |
| Antigen Retrieval Solutions | Epitope unmasking | Citrate buffer (pH 6.0); EDTA buffer (pH 8.0); Enzymatic retrieval |
| Blocking Reagents | Reduction of non-specific binding | Normal serum; BSA; Protein blocks; Commercial blocking solutions |
| Control Materials | Process monitoring and validation | Commercial control cells; Patient-derived control tissues; Cell lines |
| Signal Detection Substrates | Visualizing target presence | Chromogenic (DAB, Fast Red); Fluorescent (FITC, TRITC) |
Special Considerations for Sensor Development Research
Application to Specific vs. Selective Sensing Approaches
In the context of specific versus selective sensing research, the principles of validation, verification, and optimization take on particular importance:
- Specificity Validation: For sensor development, demonstrating specificity involves testing against structurally similar compounds, potential cross-reactants, and relevant biological matrices to confirm the sensor responds only to the intended target [90].
- Selectivity Verification: When modifying selective sensors, verification must confirm that the sensor maintains its ability to detect the target within complex sample mixtures without interference from other components [91].
- Optimization for Real-World Matrices: Sensor optimization frequently involves adjusting materials, surface modifications, and detection parameters to enhance performance in biological samples such as serum, whole blood, or tissue homogenates [91] [90].
Electrochemical aptasensors, for example, require careful optimization of aptamer immobilization, electrode surface modification, and electrochemical detection parameters to achieve the necessary specificity and sensitivity for chemotherapeutic drug monitoring [90].
Emerging Technologies and Regulatory Adaptation
Novel sensing platforms, including those based on MXenes and other two-dimensional materials, present both opportunities and challenges from a regulatory perspective [91]. The high electrical conductivity, large surface area, and chemical tunability of these materials can enhance sensor performance, but also necessitate rigorous validation of lot-to-lot consistency and stability in clinical matrices [91]. As regulatory frameworks evolve to accommodate technological advancements, the fundamental requirements for demonstrating assay reliability through proper validation, verification, and optimization remain constant.
Within the competitive landscape of diagnostic development and the rigorous environment of clinical laboratory science, the precise understanding and application of validation, verification, and optimization processes form the bedrock of analytical reliability and regulatory compliance. These distinct but interconnected activities ensure that laboratory tests—from conventional immunohistochemical stains to innovative specific and selective sensors—perform consistently and deliver clinically actionable results. As CAP and CLIA standards continue to evolve, with recent updates to personnel qualifications and proficiency testing requirements, maintaining rigorous approaches to these fundamental processes becomes increasingly critical [89] [92]. By implementing systematic protocols, maintaining comprehensive documentation, and adhering to regulatory frameworks, laboratories and researchers can ensure the quality of their testing while advancing the field of diagnostic medicine.
The design of effective sensing systems necessitates a fundamental choice between two distinct paradigms: specific sensing and selective array-based sensing. Specific sensors, which rely on highly tailored recognition elements like antibodies or enzymes, are designed for a single target analyte. In contrast, selective sensor arrays use a suite of partially selective sensors to generate a unique fingerprint for sample classification through pattern recognition. This whitepaper provides an in-depth technical comparison of these two approaches, examining their underlying principles, operational mechanisms, and performance characteristics. Framed within a broader thesis on sensing approaches, this analysis aims to equip researchers and drug development professionals with the knowledge to select the optimal strategy for their specific application, with a particular focus on the emerging trend of hybrid systems that combine the strengths of both methodologies.
Sensing approaches can be broadly divided into two complementary strategies: highly specific sensing and array-based selective sensing [5]. The former aims for ideal specificity, where a sensor is exclusively responsive to a single analyte, recognizing no other. This "lock-and-key" model is approximated by biological recognition elements such as antibodies, aptamers, and enzyme-substrate pairs [5]. The latter, often termed "chemical nose/tongue" systems, embraces cross-reactivity by design, employing multiple sensing elements that interact differentially with various analytes to create a unique pattern or fingerprint for each sample [93] [5]. This multidimensional output enables discrimination between complex mixtures without requiring exclusive specificity for any single component.
The evolution of these paradigms reflects their distinct philosophical foundations. Specific sensing has dominated fields like medical diagnostics where particular biomarkers must be quantified with high certainty [5]. Selective sensing has found prominence in applications where specific receptors are unavailable, or where the sensing goal is pattern classification rather than analyte quantification, such as in quality control of complex products like food and beverages [94] [5]. Understanding the technical underpinnings, relative strengths, and inherent limitations of each approach is essential for advancing sensor technology, particularly in drug development where both precise quantification and pattern recognition of complex biological samples are often required.
Fundamental Principles and Operational Mechanisms
Specific Sensing: The "Lock-and-Key" Model
Specific sensors operate on the principle of molecular recognition, where a carefully engineered receptor site binds exclusively to its intended target analyte. The binding event triggers a physicochemical signal change—optical, electrical, or mechanical—that is proportional to the target concentration [5]. The most mature examples include antibodies used in enzyme-linked immunosorbent assays (ELISA) and lateral flow immunochromatographic assays (e.g., pregnancy tests), as well as glucose-specific enzymes in blood glucose meters [5]. These systems fundamentally rely on the complementary geometry and chemical compatibility between the receptor and analyte, minimizing interactions with structurally dissimilar molecules.
The development pipeline for specific sensors involves identifying or engineering recognition elements with high affinity and specificity for the target. For antibodies, this typically requires animal immunization or phage display techniques; for aptamers, systematic evolution of ligands by exponential enrichment (SELEX) is employed [5]. The critical performance metrics are specificity (the ability to distinguish the target from interferents) and sensitivity (the lowest detectable concentration). When successful, this approach provides direct, quantitative information about specific analytes, which is invaluable for diagnostic and therapeutic monitoring applications where threshold concentrations have established clinical significance.
Selective Arrays: The "Pattern Recognition" Model
Selective sensor arrays adopt a fundamentally different approach inspired by biological olfaction [5]. Instead of a single highly specific receptor, these systems employ multiple sensing elements, each possessing broad but differential responsiveness to various analytes. When exposed to a sample, the collective response across all elements generates a unique pattern that serves as a fingerprint for that sample [5] [95]. This pattern is interpreted using statistical and machine learning algorithms rather than simple concentration-response curves.
The operational mechanism relies on controlled cross-reativity rather than exclusion. Each sensor element in the array is designed to interact with a class of analytes through general chemical principles (e.g., polarity, hydrophobicity, acid-base character, or size exclusion) [5]. Common technologies used in such arrays include polymer-coated surface acoustic wave (SAW) sensors, semiconducting metal oxides, conductive polymers, and fluorescent indicator mixtures [95]. The array's discriminatory power emerges from the combined response pattern rather than the performance of any individual element, enabling the system to distinguish a number of analytes that far exceeds the number of sensors in the array [5].
Diagram: Conceptual workflow of a selective sensor array system
Comparative Analysis: Performance and Practical Considerations
The choice between specific sensors and selective arrays involves trade-offs across multiple performance characteristics and practical implementation factors. The table below provides a systematic comparison of the two approaches across key parameters relevant to research and drug development applications.
Table: Comprehensive comparison of specific sensors versus selective sensor arrays
| Parameter | Specific Sensors | Selective Sensor Arrays |
|---|---|---|
| Fundamental Principle | "Lock-and-key" molecular recognition [5] | Cross-reactive pattern recognition [5] |
| Target Specificity | High for single analytes [5] | High for sample classification [5] |
| Multiplexing Capability | Limited; requires multiple specific elements [5] | Inherent; multiple analytes with few sensors [5] |
| Data Output | Quantitative concentration of specific analytes [5] | Qualitative/quantitative sample fingerprint or classification [5] |
| Unknown Analyte Detection | Poor; only detects pre-defined targets [5] | Excellent; can detect novel patterns [5] |
| Development Complexity | High (requires specific receptor development) [5] | Moderate (uses existing cross-reactive materials) [5] |
| Training Requirements | Minimal once developed | Extensive training set required [95] |
| Stability & Robustness | Variable (e.g., antibodies prone to denaturation) [5] | Generally high (synthetic materials often used) [5] |
| Adaptability to New Targets | Poor (requires new receptor development) [5] | High (often requires only retraining with new samples) [5] |
| Implementation in Complex Media | Good (with optimization to minimize interference) | Excellent (inherently handles complex mixtures) [5] |
| Quantitative Accuracy | High for target analytes [5] | Moderate; better for classification than quantification |
| Hypothesis Testing | Confirms presence/absence of specific targets [5] | Hypothesis-free; discovers patterns without pre-defined targets [5] |
Key Strengths and Limitations
Specific Sensors excel in applications requiring precise quantification of known analytes, particularly in regulated environments like diagnostic testing where threshold values determine clinical decisions [5]. Their primary strength lies in providing unambiguous, direct information about specific biomarkers or target compounds. However, this approach faces limitations when specific recognition elements are unavailable, when multiple targets must be detected simultaneously, or when the sample contains unknown relevant components [5]. Additionally, biological recognition elements like antibodies may suffer from stability issues such as denaturation under non-physiological conditions [5].
Selective Arrays offer distinct advantages in situations requiring classification of complex samples, detection of unexpected components, or when comprehensive sample characterization is more valuable than quantification of individual constituents [5]. Their adaptability to new targets without physical reconfiguration is particularly valuable in research settings exploring new disease biomarkers or environmental contaminants. Limitations include the "black box" nature of pattern recognition, where the specific analytes responsible for classification may remain unknown, and the substantial requirement for representative training data to build robust classification models [5] [95].
Experimental Implementation and Methodologies
Sensor Array Pattern Recognition Algorithms
The successful implementation of selective sensor arrays critically depends on the choice of pattern recognition algorithms. These computational methods interpret the multidimensional data generated by the array to produce reliable classifications. A comparative study of chemical sensor array pattern recognition algorithms evaluated seven common approaches against six criteria: classification accuracy, speed, training difficulty, memory requirements, robustness to outliers, and ability to produce a measure of uncertainty [95].
Among the algorithms studied, neural network-based methods—particularly Learning Vector Quantization (LVQ) and Probabilistic Neural Networks (PNN)—demonstrated the highest classification accuracies for chemical sensor array data [95]. The study recommended PNN for applications where a confidence measure and fast training are critical, while suggesting LVQ for other applications due to its favorable balance of performance and practical implementation characteristics [95]. Traditional methods like linear discriminant analysis (LDA) and soft independent modeling of class analogy (SIMCA) are computationally simpler but struggle with multimodal and overlapping class distributions commonly encountered with real-world sensor array data [95].
Table: Comparison of pattern recognition algorithms for sensor arrays
| Algorithm | Classification Accuracy | Training Speed | Implementation Complexity | Confidence Measure | Best Use Case |
|---|---|---|---|---|---|
| LVQ Neural Network | High [95] | Moderate [95] | Moderate [95] | No [95] | General application [95] |
| PNN | High [95] | Fast [95] | Moderate [95] | Yes [95] | When confidence measure is critical [95] |
| Back-Propagation ANN | High [95] | Slow [95] | High [95] | Variable | When ample training data available |
| SIMCA | Moderate [95] | Fast [95] | Low [95] | Yes [95] | Well-separated classes |
| Linear Discriminant Analysis | Moderate [95] | Fast [95] | Low [95] | Yes [95] | Linear separations |
| Nearest Neighbor | Variable [95] | N/A (no training) [95] | Low [95] | No [95] | Small datasets |
Experimental Protocol for Array Validation
A robust validation protocol is essential for characterizing sensor array performance. The following methodology, adapted from best practices in the field, ensures comprehensive evaluation:
Array Fabrication and Characterization: Fabricate sensor array using selected technology (e.g., resistive, capacitive, optical) [94]. Characterize baseline performance including sensitivity, limit of detection, and response time for individual elements using standard analytes.
Training Set Generation: Expose the array to a comprehensive set of known samples (typically 20-50 samples per class) covering the expected range of variation within each class and between classes [95]. Ensure proper randomization of sample presentation to minimize order effects.
Data Preprocessing: Apply normalization techniques to account for sensor drift and environmental variations. Common approaches include:
- Baseline correction (subtracting pre-exposure values)
- Relative response normalization (ΔR/R)
- Standard normal variate (SNV) transformation
- Domain knowledge-based feature selection
Model Training: Divide data into training (typically 70-80%) and validation (20-30%) sets. Train selected pattern recognition algorithm(s) using the training set only [95]. For neural network approaches, use cross-validation to optimize architecture and parameters.
Model Testing and Performance Metrics: Evaluate trained model using the independent validation set. Calculate performance metrics including:
- Classification accuracy (%) = (Correct classifications / Total samples) × 100
- Confusion matrix analysis
- Receiver Operating Characteristic (ROC) curves for multi-class problems
- Precision and recall for each class
Robustness Testing: Challenge the system with interferents, environmental changes (temperature, humidity), and potential outliers to establish operational boundaries and failure modes [95].
Diagram: Experimental workflow for sensor array development and validation
The Researcher's Toolkit: Essential Materials and Reagents
Successful implementation of sensing strategies requires specific materials and analytical tools. The following table outlines key components for both specific sensing and selective array approaches.
Table: Essential research reagents and materials for sensing applications
| Category | Component | Function | Example Applications |
|---|---|---|---|
| Specific Sensing Elements | Monoclonal Antibodies | High-affinity target recognition [5] | ELISA, lateral flow assays, diagnostic tests [5] |
| Aptamers | Nucleic acid-based recognition elements [5] | Protein detection, small molecule sensing [5] | |
| Enzymes | Specific catalytic activity [5] | Glucose monitoring, neurotransmitter detection [5] | |
| Array Sensing Materials | Conductive Polymers | Varying chemical selectivity [95] | Electronic noses, vapor sensing [95] |
| Polymer Composites | Differential swelling/sorption | Carbon-polymer composites for volatile organic compound detection | |
| Metal-Organic Frameworks | Tunable porosity and selectivity | Gas separation and sensing | |
| Fluorescent Dyes | Optical cross-reactivity [5] | Colorimetric sensor arrays [5] | |
| Signal Transduction | Piezoelectric Crystals | Mass-sensitive detection | Surface acoustic wave (SAW) sensors [95] |
| Electrode Arrays | Electrochemical measurements | Multi-parameter bio-sensing | |
| Photodetectors | Optical signal capture | Fluorescence, absorbance-based arrays | |
| Data Analysis Tools | Pattern Recognition Software | Multidimensional data analysis [95] | LVQ, PNN, PCA algorithms [95] |
| Statistical Packages | Classification model development | R, Python with scikit-learn | |
| Validation Frameworks | Performance assessment | Cross-validation, bootstrapping methods |
Emerging Trends and Future Research Directions
The field of sensor technology is evolving toward hybrid approaches that integrate the strengths of both specific and selective sensing paradigms. These integrated systems incorporate specific sensing elements for key known biomarkers alongside cross-reactive sensors to detect unexpected patterns or unknown interferents [5]. This configuration provides both the quantitative precision required for established biomarkers and the discovery capability needed for novel pattern recognition.
Advances in material science are enabling new sensing capabilities through the development of nanomaterials with tailored properties [96]. Engineered nanomaterials including carbon nanotubes, metal-organic frameworks, and functionalized nanoparticles are enhancing sensitivity, response speed, and selectivity for both specific and array-based sensors [96]. Concurrently, artificial intelligence and machine learning are revolutionizing pattern recognition for sensor arrays, with deep learning approaches increasingly able to extract subtle features from complex datasets without manual feature engineering [94] [95].
The application landscape for sensing technologies is expanding rapidly, particularly in biomedical fields. Selective sensor arrays are being extended to infectious disease detection, where they offer advantages in detecting a wide range of pathogens without requiring highly specific recognition elements for each one [93]. In drug development, sensor arrays show promise for high-throughput screening of complex cellular responses to candidate compounds, providing comprehensive response profiles rather than single-parameter readouts [5].
The comparative analysis of specific sensors and selective arrays reveals complementary rather than competing strengths. Specific sensors provide unambiguous, quantitative data on predefined targets—essential for hypothesis-driven research and diagnostic applications with established biomarkers. Selective arrays offer superior capability for hypothesis-free exploration, classification of complex samples, and detection of unanticipated components—invaluable for discovery-phase research and quality assessment of complex mixtures.
The optimal choice between these approaches depends fundamentally on the research question and application requirements. For well-characterized systems with known target analytes, specific sensors typically deliver superior performance. For complex, partially characterized, or highly variable samples, selective arrays generally provide more comprehensive characterization. The most promising future direction lies in integrated systems that combine targeted quantification with pattern-level analysis, leveraging the respective strengths of both paradigms to advance scientific discovery and technological innovation in drug development and beyond.
The integration of digital health technologies (DHTs) into clinical trials represents a paradigm shift in how therapeutic efficacy is measured, moving beyond traditional clinic-based assessments to continuous, real-world data collection. Regulatory agencies worldwide are establishing frameworks to guide the use of sensor-derived data and digital endpoints in drug development. The U.S. Food and Drug Administration (FDA) and European Medicines Agency (EMA) have emerged as leaders in developing pathways for the adoption of these innovative endpoints, creating a complex regulatory landscape that researchers must navigate [97]. This evolution is particularly significant within the context of comparing specific versus selective sensing approaches, as regulatory expectations vary substantially based on whether a digital endpoint replicates a traditional measure or constitutes a novel biomarker.
The FDA's commitment to digital health innovation is demonstrated through its establishment of the Digital Health Center of Excellence and the DHT Steering Committee, which consists of senior staff from CDER, CBER, and CDRH [98] [97]. These organizational structures provide specialized expertise and coordinate regulatory approaches across centers, reflecting the agency's recognition that DHTs offer significant potential benefits in drug development, including the ability to make continuous or frequent measurements, capture novel clinical features, and decentralize clinical trial activities [98]. Simultaneously, the EMA has demonstrated openness to innovative digital endpoints, recently accepting stride velocity 95th centile (SV95C) as a primary endpoint for ambulatory Duchenne muscular dystrophy studies, marking an important regulatory milestone [97].
Regulatory Frameworks and Key Guidance Documents
FDA's Evolving Framework for Digital Health Technologies
The FDA has developed a comprehensive program to support the use of DHTs in clinical drug development, anchored by several key guidance documents and initiatives. The Prescription Drug User Fee Act VII (PDUFA VII) commitments have been instrumental in advancing the regulatory framework for DHTs, outlining specific activities the FDA must undertake to modernize clinical trials through decentralized approaches and digital technologies [98]. These commitments include public meetings, demonstration projects, and guidance development, all coordinated through the DHT Steering Committee.
The FDA's December 2023 guidance, "Digital Health Technologies for Remote Data Acquisition in Clinical Investigations," provides crucial recommendations on using DHTs to acquire data remotely from participants in clinical investigations evaluating medical products [97] [99]. This document emphasizes that DHTs can include both hardware and software components performing one or more functions, and their use may improve clinical trial efficiency while increasing participation opportunities and convenience [99]. The guidance establishes the fundamental principle that sponsors must have a "strong rationale" for selecting and using a DHT, considering the clinical trial population, technical specifications, design and operation, and potential for patient-owned technology use [97].
For artificial intelligence and machine learning technologies, the FDA has published several relevant guidance documents, including the "Artificial Intelligence and Machine Learning Software as a Medical Device Action Plan" (January 2021) and "Marketing Submission Recommendations for a Predetermined Change Control Plan for AI/ML-Enabled Device Software Functions" (final guidance December 2024) [100]. These documents address the unique challenges of adaptive AI/ML technologies and provide a framework for managing modifications throughout the product lifecycle, which is particularly relevant for sensing algorithms that may improve over time.
EMA and Global Regulatory Landscape
While the EMA has not yet published comprehensive DHT-specific guidance equivalent to the FDA's documents, the agency has demonstrated progressive acceptance of digital endpoints through specific qualification opinions. The acceptance of stride velocity 95th centile as a primary endpoint for Duchenne muscular dystrophy studies represents a significant regulatory milestone that signals the EMA's openness to well-validated digital endpoints [97]. This endorsement followed a rigorous qualification process through the EMA's novel methodologies pathway, providing a template for other digital biomarker qualification submissions.
Other regulatory agencies worldwide, including Health Canada, Switzerland's Swissmedic, Japan's Pharmaceuticals and Medical Devices Agency, and Australia's Therapeutic Goods Administration, have also shown interest in digital endpoints, though comprehensive regulatory frameworks are still developing [97]. The global regulatory landscape remains fragmented, creating challenges for multinational clinical trials utilizing digital endpoints. However, convergence is emerging around core principles of validation and verification, particularly for novel digital biomarkers that lack established regulatory precedents.
Table 1: Key Regulatory Guidance Documents for Digital Endpoints
| Agency | Document/Initiative | Issue Date | Key Focus Areas |
|---|---|---|---|
| FDA | Digital Health Technologies for Remote Data Acquisition in Clinical Investigations | December 2023 | Fit-for-purpose validation, verification, usability testing, data integrity [97] [99] |
| FDA | AI/ML SaMD Action Plan | January 2021 | Regulatory approach for adaptive AI/ML technologies, predetermined change control plans [100] |
| FDA | Framework for the Use of DHTs in Drug and Biological Product Development | PDUFA VII Commitment (FY 2023-2027) | Comprehensive framework for DHT evaluation, internal processes, stakeholder engagement [98] |
| EMA | Qualification of Stride Velocity 95th Centile (SV95C) | 2023 | Novel digital endpoint acceptance for Duchenne muscular dystrophy trials [97] |
Practical Implementation of Digital Endpoints
Regulatory Pathways for Novel vs. Established Endpoints
A critical distinction in regulatory strategy lies between digital endpoints that replicate established clinical measurements and those that introduce novel biomarkers. The FDA provides clear direction on this distinction: when a digital endpoint captures a clinical characteristic previously measured in clinical settings (e.g., home blood pressure monitoring instead of in-clinic measurements), extensive justification may not be required [97]. However, the technology must still be "fit-for-purpose," meaning validated for its specific use context and interpretability within the clinical investigation, with accurate and precise measurement of physical parameters [97].
For novel digital endpoints, the regulatory bar is substantially higher. Sponsors must propose both the "concept of interest" (meaningful and core aspect of the disease) and the "context of use" (when and how the digital technology will be deployed) within the overall clinical trial assessment [97]. This requires additional fit-for-purpose validation, including minimum technical and performance specifications, comprehensive validation and verification, and consideration of whether the measure constitutes a clinical outcome assessment or a biomarker. The evidence requirements vary significantly based on this classification, with novel primary endpoints typically requiring the most extensive validation.
Fit-for-Purpose Validation Requirements
The FDA's guidance outlines specific validation requirements that sponsors must address when incorporating DHTs into clinical investigations. These requirements form a multi-layered framework ensuring that digital endpoints generate reliable, clinically meaningful data:
Verification: Confirmation through examination and objective evidence that the parameter measured by the technology (e.g., acceleration, temperature, pressure) is measured accurately and precisely [97]. This involves establishing technical performance characteristics like sensitivity, specificity, and reliability under controlled conditions.
Validation: Confirmation through examination and objective evidence that the selected technology appropriately assesses the clinical event or characteristic in the proposed participant population [97]. For example, validating that accelerometry appropriately measures step count or heart rate in the target patient population, which may have different movement patterns or physiological characteristics than healthy individuals.
Usability Evaluation: Identification and addressing of potential use errors or difficulties that trial participants or other intended users may experience [97]. This is particularly crucial for consumer-grade sensors used in decentralized trials where professional support may be limited.
The evidence required for each of these components depends on the regulatory risk classification of the DHT. When the technology itself is classified as a medical device, it must also satisfy the applicable regulatory requirements for devices, potentially including premarket clearance or approval [97].
Table 2: Adoption of Digital Endpoints in Clinical Development (2008-2022)
| Parameter | Findings | Data Source |
|---|---|---|
| Overall Utilization | >130 pharmaceutical/biotech sponsors used >1,300 AI-powered digital endpoints | HumanFirst Institute [97] |
| Endpoint Classification | 60% secondary endpoints, 25% primary endpoints | HumanFirst Institute [97] |
| Trial Phase Distribution | Nearly two-thirds of trials in Phase 2 or Phase 4 | HumanFirst Institute [97] |
| Top Therapeutic Areas | Endocrinology, neurology, cardiology (82% of all trials) | HumanFirst Institute [97] |
| Common Technologies | Connected sensors (glucose monitors, wearable ECG patches) | HumanFirst Institute [97] |
Experimental Protocols and Validation Methodologies
Technical Validation Protocols
Establishing the technical validity of digital endpoints requires rigorous experimental protocols designed to verify that sensors perform to specification under conditions reflecting intended use. The verification process must demonstrate that the DHT accurately measures the intended physical parameter (e.g., acceleration, temperature, pressure) with appropriate precision across the expected measurement range [97]. This typically involves:
Laboratory Benchmarking: Comparing DHT measurements against gold standard reference devices in controlled settings. For motion sensors, this might involve simultaneous recording with optical motion capture systems; for physiological sensors, comparison with medical-grade hospital equipment.
Environmental Stress Testing: Evaluating performance under diverse environmental conditions expected during real-world use, including temperature variations, humidity levels, and potential electromagnetic interference.
Repeatability and Reproducibility Assessment: Conducting test-retest studies to determine measurement consistency across multiple uses and between different device units.
For example, studies validating wearable electrocardiogram patches typically involve simultaneous recording with standard 12-lead clinical systems during controlled protocols (rest, walking, other activities) to assess agreement in heart rate, arrhythmia detection, and signal quality metrics.
Clinical Validation Frameworks
Clinical validation establishes that the digital endpoint appropriately measures the clinical characteristic of interest in the target population. This requires carefully designed studies that address:
Context of Use: The specific clinical trial population, disease severity, and use environment must be reflected in validation studies. A sensor validated for step counting in healthy adults may not perform accurately in Parkinson's disease patients with gait abnormalities.
Clinical Reference Standards: Where possible, digital endpoints should be compared to clinically accepted reference standards. For novel digital biomarkers where no gold standard exists, validation may require correlation with multiple established clinical assessments or expert adjudication of clinical status.
Population Diversity: Validation studies must include participants representing the full spectrum of the target population, considering age, sex, ethnicity, disease severity, and comorbidities that might affect sensor performance.
The FDA's sensor-based DHT medical device list provides examples of technologies that have successfully navigated the regulatory approval process, offering insights into validation strategies [101]. This list includes non- or minimally invasive, wearable devices designed for continuous or spot-check monitoring in non-clinical settings, with authorized examples including smartwatches, rings, patches, and bands [101].
Visualization of Regulatory Pathways
Diagram 1: Regulatory Pathway for Digital Endpoints - This flowchart illustrates the decision process and key stages in developing digital endpoints for regulatory submission, highlighting divergent paths for established versus novel measurements.
The Scientist's Toolkit: Essential Research Reagent Solutions
Table 3: Essential Research Tools for Digital Endpoint Validation
| Tool Category | Specific Examples | Function in Research | Regulatory Considerations |
|---|---|---|---|
| Sensor Platforms | BioButton System, Zio AT, Apple Watch, Dexcom G7 | Raw data acquisition for digital biomarkers | FDA authorization status review [101] |
| Data Processing Libraries | Python SciKit-Learn, TensorFlow, PyTorch | Signal processing and machine learning algorithm development | Documentation for reproducible analysis [100] |
| Clinical Reference Systems | 12-lead ECG machines, optical motion capture, laboratory analyzers | Gold-standard comparison for validation studies | Established regulatory status as reference [97] |
| Data Anonymization Tools | De-identification algorithms, secure transfer protocols | Privacy protection compliant with GDPR/HIPAA | Address electronic records guidance [97] |
| Validation Frameworks | Good Machine Learning Practice principles | Structured approach to model validation | Alignment with FDA guiding principles [100] |
Implications for Specific vs. Selective Sensing Approaches
The regulatory landscape for digital endpoints has distinct implications for researchers comparing specific versus selective sensing approaches. Specific sensing (targeted measurement of predefined parameters) aligns more closely with established regulatory pathways, particularly when measuring known clinical parameters like heart rate, step count, or glucose levels [97] [101]. The validation requirements for these applications are relatively well-defined, focusing on accuracy and precision compared to existing measurement approaches.
In contrast, selective sensing (broad data capture with feature extraction) often involves novel digital biomarkers and may trigger more substantial regulatory scrutiny. When sensor data is used to derive unexpected patterns or complex composite endpoints, regulators expect comprehensive validation establishing clinical relevance and biological plausibility [97]. The FDA's emerging framework for AI/ML-based software as a medical device is particularly relevant for selective sensing approaches, as these often employ machine learning to identify clinically meaningful patterns in complex datasets [100].
The regulatory strategy should be aligned with the sensing approach early in development. For selective sensing applications, early regulatory engagement becomes crucial to align on validation requirements for novel analytical approaches. The FDA's DHT Steering Committee and Digital Health Center of Excellence offer specialized expertise for these complex applications [98]. Additionally, the predetermined change control plan framework for AI/ML-enabled devices provides a pathway for managing algorithm updates that may be necessary as selective sensing models evolve with additional data [100].
The regulatory landscapes at the FDA and EMA are rapidly evolving to accommodate the increasing use of digital endpoints and sensor data in clinical trials. Both agencies recognize the potential of these technologies to transform drug development while maintaining focus on validation requirements that ensure patient safety and data reliability. The key differentiator in regulatory strategy remains the distinction between endpoints that replicate established measurements and those that introduce novel digital biomarkers, with the latter requiring more extensive validation and regulatory engagement.
For researchers working with specific versus selective sensing approaches, early and frequent regulatory engagement is critical, particularly for novel methodologies. The FDA's structured consultation processes through the DHT Steering Committee and various qualification programs provide pathways to align on validation requirements before undertaking pivotal studies [98] [97]. As regulatory frameworks continue to mature, the successful integration of digital endpoints will depend on rigorous validation, transparent documentation, and strategic regulatory planning that addresses the distinct requirements of specific and selective sensing paradigms.
The integration of sensor-based Digital Health Technologies (sDHTs) into clinical research and care represents a paradigm shift in how health data is captured. These technologies enable the collection of high-resolution, real-world data remotely over extended periods, leading to the development of digital endpoints—metrics derived from raw sensor data via algorithms that serve as outcome measures in clinical trials or clinical care [102]. The fundamental challenge, however, has been establishing trust in these novel endpoints. Without rigorous validation, digital endpoints cannot support safety and efficacy claims for new medical products or inform critical clinical decisions [102].
The validation challenge is analogous to the established concepts of specificity and selectivity in pharmacology and sensing. A specific sensing interaction implies an ideal, exclusive binding to a single target, a scenario that is largely theoretical and rarely achieved in biological systems. In practice, selectivity—a preferential interaction with a primary target over others, measured on a continuous spectrum—is the achievable standard [42]. This conceptual framework directly applies to digital endpoints. A perfectly specific digital measure would unerringly reflect a single, intended biological or functional state. In reality, developers must demonstrate that their measures are sufficiently selective, meaning they reliably detect the target state while minimizing interference from confounding factors (e.g., motion artifacts, environmental variations, or unrelated physiological processes). The V3 Framework, and its extension V3+, provide the structured methodology to build this body of evidence, ensuring that digital endpoints are not just technically proficient but also clinically meaningful and practically usable [103] [104].
The Evolution and Core Components of the V3 Framework
The original V3 Framework, established by the Digital Medicine Society (DiMe), has become the de facto standard for evaluating digital clinical measures, having been accessed over 30,000 times and cited in more than 250 peer-reviewed publications since its dissemination in 2020 [103]. It has been widely adopted by major regulatory bodies, including the U.S. Food and Drug Administration (FDA) and the European Medicines Agency (EMA), as well as over 140 industry and academic teams [103] [104]. This framework lays out a modular evidence-building process with three core components, which have also been adapted for preclinical research [105] [106].
The Foundational V3 Pillars
Verification is the process of confirming that the sensor technology accurately captures and stores raw data without corruption. It ensures the integrity of the data source through a series of quality checks. For example, in a computer vision system, verification would involve assuring proper illumination, correct animal identification in specific cages, and accurate timestamping of events [105] [106]. It answers the question: "Does the sensor work correctly and reliably?"
Analytical Validation assesses the performance of the algorithm that transforms raw sensor data into a quantitative metric. It determines whether the algorithm accurately represents the captured event with appropriate precision and resolution. A significant challenge here is that sDHTs often measure biological events with greater temporal precision than traditional "gold standard" methods, or may measure novel endpoints for which no comparator exists. To address this, a triangulation approach is often used, integrating multiple lines of evidence such as biological plausibility, comparison to reference standards, and direct observation [105] [106]. It answers the question: "Does the algorithm correctly generate the intended measure?"
Clinical Validation evaluates the extent to which the digital endpoint acceptably identifies, measures, or predicts a meaningful clinical, biological, physical, or functional state within a specified Context of Use (which includes the target population) [104] [102] [106]. This step moves beyond technical performance to establish biological and clinical relevance. For instance, it confirms that a digitally measured reduction in locomotor activity is a meaningful biomarker of drug-induced toxicity [105]. It answers the question: "Is the measure clinically or biologically meaningful?"
Table 1: Core Components of the V3 Framework
| Component | Primary Question | Key Activities | Example in Preclinical Research |
|---|---|---|---|
| Verification | Does the sensor work correctly? | Sensor performance checks; data integrity confirmation; timestamp validation [105] [106]. | Ensuring cameras record from correct cages with proper illumination and animal ID [105]. |
| Analytical Validation | Does the algorithm generate the correct measure? | Algorithm performance assessment; comparison to reference standards; triangulation of evidence [105] [106]. | Comparing digital locomotion measures against manual observations or respiratory rates with plethysmography data [105]. |
| Clinical Validation | Is the measure biologically meaningful? | Establishing association with a clinical/biological state; defining interpretability and actionability within a Context of Use [102] [105]. | Confirming locomotor activity is a relevant biomarker for drug-induced CNS effects [105]. |
The V3+ Extension: Integrating Usability Validation
As sDHTs moved toward large-scale implementation, challenges related to user interaction, such as significant data missingness due to poor interface design, highlighted a critical gap in the original framework [104]. In response, DiMe introduced V3+, which adds a fourth, equally critical component: Usability Validation [104] [107].
Usability validation ensures that sDHTs can be used effectively, efficiently, and satisfactorily by the intended users in their real-world environments. Its goal is to achieve user-centricity, which is essential for generating reliable data at scale. Poor usability can lead to use-errors, poor adherence, and extensive missing data, which in turn can cause direct harm (e.g., false-negative diagnoses) or undermine the validity of a clinical trial [104]. The framework outlines four key activities for usability validation, which align with and build upon existing FDA guidance [104] [108].
Table 2: Key Activities for Usability Validation in the V3+ Framework
| Key Activity | Description | Output |
|---|---|---|
| 1. Develop the Use Specification | Creating a comprehensive, living document describing all intended user groups, their motivations, and the contexts, timing, and methods of their interactions with the sDHT [104]. | A detailed use specification document, defined using user personas and use cases. |
| 2. Conduct a Use-Related Risk Analysis | An iterative process to identify foreseeable use-errors (actions that may lead to harm) and use-related hazards, categorizing them by the seriousness of potential harm [104]. | A prioritized list of use-related risks and a mitigation plan focusing on "designing out" errors. |
| 3. Conduct Iterative Formative Evaluations | Research studies conducted with representative users throughout the design process to identify use-errors and inform design improvements [104]. | Continuous feedback for refining the sDHT's hardware, software, and workflows. |
| 4. Conduct a Summative Evaluation | A formal study to demonstrate that the final sDHT design can be used by the intended users to achieve the intended tasks without causing serious harm [104]. | Final evidence that the sDHT is safe and effective for its intended use. |
Experimental Protocols for V3+ Validation
Implementing the V3+ framework requires the application of rigorous, standardized experimental methodologies. The following protocols detail the key experiments and studies necessary to generate evidence for each component.
Protocol for Analytical Validation: Algorithm Performance Testing
This protocol is designed to validate the algorithm that converts raw sensor data into a digital measure, ensuring its accuracy and reliability.
- 1. Objective: To assess the algorithm's performance in terms of its accuracy, precision, and robustness in generating the intended digital measure against a reference standard.
- 2. Materials and Reagents:
- sDHT Device: The sensor-based device (e.g., wearable accelerometer, camera system) in its final or near-final form factor.
- Reference Standard Equipment: The device or method considered the "gold standard" for measuring the target physiological or behavioral construct (e.g., video recording with manual annotation, polysomnography for sleep, plethysmography for respiration) [105].
- Data Acquisition System: Hardware and software for simultaneous data collection from the sDHT and reference standard, ensuring time-synchronization.
- Test Population or Simulator: A cohort of representative subjects (human or animal) or a physical simulator capable of producing a wide range of the target metric.
- 3. Step-by-Step Procedure:
- Study Setup: Recruit a sufficiently large and diverse test population that represents the intended Context of Use. Obtain ethical approval and informed consent.
- Data Collection: Simultaneously collect data from the sDHT and the reference standard equipment under controlled and, if applicable, free-living conditions. Ensure the data captures the full dynamic range of the measure (e.g., from rest to intense activity).
- Data Processing: Run the raw sensor data from the sDHT through the algorithm to generate the digital endpoint values.
- Data Analysis: Perform a statistical comparison between the algorithm-derived values and the reference standard values. Key metrics include:
- Accuracy: Mean absolute error, Bland-Altman analysis for agreement.
- Precision: Intra-class correlation coefficients, coefficient of variation.
- Sensitivity/Specificity: For categorical outcomes, calculate the confusion matrix against the reference.
- 4. Key Outputs: A validation report detailing the algorithm's performance metrics, demonstrating its fitness-for-purpose for the intended Context of Use [105] [106].
Protocol for Usability Validation: Formative Evaluation
Formative evaluations are iterative studies conducted during the design and development phase to identify and mitigate use-related risks.
- 1. Objective: To identify potential use-errors, gather user feedback, and inform design improvements to enhance the safety and usability of the sDHT.
- 2. Materials and Reagents:
- sDHT Prototypes: Functional prototypes of the sDHT, which can range from low-fidelity mock-ups to high-fidelity, fully functional units.
- Test Scenarios: A set of realistic tasks that users are expected to perform (e.g., "charge the device," "attach the sensor to your body," "transfer data to the clinician").
- Data Recording Equipment: Audio/video recording devices, screen capture software, and note-taking tools to capture user interactions and feedback.
- Participant Recruitment Screener: A document to ensure recruitment of participants that represent the full spectrum of intended users, including diverse ages, technical proficiencies, and, if relevant, disease states [104].
- 3. Step-by-Step Procedure:
- Study Planning: Based on the Use Specification and preliminary Use-Related Risk Analysis, define the scope of the evaluation, the specific tasks to be tested, and the participant criteria.
- Participant Recruitment: Recruit a small group (typically 5-8 per user group) of representative users.
- Testing Session: In a controlled environment, ask participants to complete the predefined tasks while thinking aloud. A moderator observes and notes any difficulties, errors, or subjective feedback.
- Data Analysis: Transcribe and analyze the observations and feedback to identify themes, common use-errors, and points of confusion.
- Design Iteration: The development team uses these findings to refine the sDHT's design, user interface, and instructions.
- 4. Key Outputs: A list of identified use-errors and user feedback, which is used to update the Use-Related Risk Analysis and inform design changes. This process is repeated until no new critical issues are found [104].
The Scientist's Toolkit: Essential Reagents and Materials
Successfully executing V3+ validation requires a suite of specialized tools and materials. The following table details key research reagent solutions essential for conducting the necessary experiments.
Table 3: Essential Research Reagents and Materials for V3+ Validation
| Tool/Material | Function in V3+ Validation | Specific Application Example |
|---|---|---|
| Reference Standard Equipment | Serves as the comparator ("gold standard") for Analytical Validation of the digital measure [105]. | Using polysomnography in a sleep lab to validate a wearable-derived sleep staging algorithm. |
| Programmable Motion/Physiological Simulators | Provides a controlled, reproducible source of signals for the Verification and early-stage Analytical Validation of sensors and algorithms. | A robotic arm that simulates human gait patterns to test the accuracy of a step-counting algorithm. |
| Representative Participant Cohorts | Crucial for both Clinical Validation (to establish relevance) and Usability Validation (to identify use-errors). Participants must reflect the intended Context of Use in terms of demographics, health status, and technical literacy [104]. | Including elderly patients with arthritis in a usability study for a device requiring fine motor skills for attachment. |
| Data Anonymization & Management Platform | Ensures data integrity, security, and privacy throughout the validation process, which is critical for regulatory acceptance. | A secure, HIPAA/GDPR-compliant cloud platform for storing and processing sensor data from clinical validation studies. |
| Use-Related Risk Analysis Software | Facilitates the systematic identification, prioritization, and tracking of use-related hazards and mitigations as part of Usability Validation. | Software used to maintain a living risk traceability matrix, linking hazards to specific design mitigations and validation test cases. |
The V3+ framework provides the comprehensive, structured methodology needed to establish confidence in digital endpoints, transforming them from raw sensor data into trustworthy tools for scientific and clinical decision-making. By integrating the foundational technical assessments of Verification, Analytical Validation, and Clinical Validation with the practical, human-centric focus of Usability Validation, V3+ ensures that digital endpoints are not only technically sound and clinically relevant but also scalable and reliable in real-world conditions [104] [107].
This holistic approach directly addresses the core challenge of ensuring that digital sensing is fit-for-purpose. Just as selective binding in pharmacology requires demonstrating a preferential, reliable interaction within a complex system, the V3+ framework demands evidence that a digital endpoint selectively and reliably captures its intended target in the face of real-world variability and noise. The adoption of V3+ is therefore critical for researchers, developers, and clinicians aiming to leverage the full potential of digital medicine to generate robust evidence, accelerate drug development, and improve patient care.
In sensor design, the terms specificity and selectivity represent distinct but complementary concepts crucial for performance optimization. Specificity refers to a sensor's ability to detect a single target analyte exclusively, implying absolute and exclusive binding—an ideal rarely achieved in practical biological systems. In contrast, selectivity describes a sensor's preferential response to a primary target over competing interferents, quantified as a ratio on a continuous spectrum [42]. This distinction forms the foundational thesis of modern sensor development: while inherently different, strategic integration of specific and selective elements creates superior sensing platforms with enhanced performance characteristics.
The molecular basis for target recognition lies in complementary interactions between sensor elements and analytes. These interactions depend on specific molecular arrangements, electrostatic forces, hydrogen bonding, and shape compatibility that facilitate precise binding. Understanding receptor dynamics and binding kinetics is essential, as proteins and other biological receptors are not static structures but flexible entities undergoing conformational changes upon binding [42]. This technical foundation enables the deliberate engineering of sensor platforms with predetermined binding profiles, moving from serendipitous discovery to rational design.
Theoretical Foundation: Molecular Basis of Target Recognition
Quantum Chemical Understanding of Sensor-Target Interactions
The molecular-level understanding of sensor-analyte interactions can be significantly enhanced through quantum chemical modelling. Density Functional Theory (DFT) provides a powerful computational framework for investigating molecular structures, energy levels, and electron transfer sites in sensor design [109].
In electrochemical sensing applications, DFT calculations based on B3LYP/6-31G (d, p) basis sets can predict the reactivity of modifier molecules used in sensor fabrication. These models enable the calculation of key chemical reactivity descriptors through these fundamental equations:
- Electronegativity (χ) = -(I + A)/2
- Hardness (η) = (I - A)/2
- Softness (σ) = 1/η
- Electro-accepting power (ω+) = (I + 3A)²/(16(I - A))
- Electro-donating power (ω-) = (3I + A)²/(16(I - A))
where I = -EHOMO (ionization energy) and A = -ELUMO (electron affinity) according to Koopmans Theorem [109]. These parameters predict electron donating and accepting capabilities of chemical species, enabling rational design of sensor materials with optimized charge transfer properties for enhanced selectivity.
Supramolecular Chemistry in Pathogen Sensing
Supramolecular sensing platforms exploit dynamic association/dissociation of molecules through non-covalent interactions including hydrogen bonding, Coulombic interactions, π–π stacking, ionic–π interactions, hydrophobic effects, and van der Waals forces [110]. These weak chemical forces enable rapid, reversible binding events that produce measurable macroscopic observables when perturbed by target analytes.
The multivalency of supramolecular systems allows for sophisticated pathogen discrimination. For instance, cationic polythiophene derivatives (PT) with cucurbit[7]uril (CB[7]) complexes can differentiate between viruses and microbes through distinct interaction patterns that alter polymer fluorescence intensity [110]. Linear discriminant analysis (LDA) can further enhance discrimination efficiency in such systems.
Table 1: Supramolecular Interactions in Sensor Design
| Interaction Type | Strength Range (kJ/mol) | Role in Sensing | Example Applications |
|---|---|---|---|
| Hydrogen bonding | 4-60 kJ/mol | Directional recognition | DNA hybridization sensors |
| Coulombic/ionic | 50-350 kJ/mol | Electrostatic attraction | Microbial detection via surface charge |
| π–π stacking | 0-50 kJ/mol | Aromatic system interaction | Graphene-based biosensors |
| Hydrophobic effect | <5 kJ/mol | Entropy-driven assembly | Membrane protein sensors |
| Van der Waals | 0.5-5 kJ/mol | Universal attraction | Nanomaterial-based platforms |
Methodological Approaches: Experimental Protocols for Integrated Sensors
Fabrication of Surfactant-Modified Carbon Paste Electrodes
The development of surfactant-modified electrodes represents a robust methodology for enhancing sensor selectivity. The following protocol adapts procedures for fabricating polysorbate-modified carbon paste electrodes (CPE) for electrochemical sensing [109]:
Materials Required:
- Graphite powder (particle size <45 μm)
- Silicone oil binder (medical grade)
- Polysorbate 80 (or other surfactant modifiers)
- Phosphate buffer components (NaH₂PO₄·2H₂O and Na₂HPO₄)
- Target analytes (e.g., hydroquinone, catechol)
- Teflon electrode bodies with copper wire contacts
Step-by-Step Procedure:
- Prepare bare carbon paste by homogeneously mixing graphite powder and silicone oil binder in a 70:30 (w/w) ratio until achieving uniform consistency.
- Pack electrode bodies by firmly filling the Teflon hole with the carbon paste mixture and polishing the surface on smooth weighing paper.
- Establish electrical contact by inserting copper wire into the Teflon tube.
- Modify electrode surface by drop-casting optimal concentration of polysorbate-80 solution (25.0 mM in distilled water) onto the bare carbon paste electrode surface.
- Allow surfactant adsorption by letting the modified electrode stand for five minutes at room temperature.
- Remove excess surfactant by gently rinsing the electrode with distilled water.
- Validate modification through electrochemical characterization using cyclic voltammetry and electrochemical impedance spectroscopy in standard solutions such as potassium ferrocyanide/ferricyanide.
This modification protocol enhances electron transfer kinetics and provides preferential binding sites for target analytes while suppressing interferent responses.
Development of Standalone Stretchable Sensor Platforms
Recent advances in flexible electronics enable novel sensor form factors for specialized applications. The following protocol details the fabrication of a fully integrated stretchable device platform for rehabilitation monitoring [111]:
Materials and Components:
- Modified composite hydrogel (DMAPS monomer, cross-linker, photo-initiator, ionic salt)
- Ag nanowires (AgNWs, 0.7 wt% for conductivity enhancement)
- PDMS skeleton (for mechanical stability)
- Coplanar serpentine Cu network (for interconnections)
- Low-temperature co-fired ceramic (LTCC) antenna
- Low-power Bluetooth module
- Triaxial broadband accelerometer
- Lithium-ion battery
Composite Hydrogel Fabrication:
- Synthesize zwitterionic hydrogel by copolymerizing DMAPS monomer with crossed linker and photo-initiator in the presence of ionic salt.
- Dope with AgNWs at optimized concentration (0.7 wt%) to enhance conductivity while maintaining mechanical properties.
- Incorporate PDMS skeleton with optimized vertical beams to reduce peak strain from 3.13 to 0.86 during 50% uniaxial stretching.
- Validate biocompatibility through cell viability assays (>80% epithelial cell viability required).
System Integration:
- Pattern serpentine Cu interconnections using photolithography and etching processes.
- Mount electronic components (sensors, processing units, communication modules) using anisotropic conductive film.
- Integrate LTCC antenna with Bluetooth module for wireless data transmission.
- Encapsulate entire system with 500 μm-thick Ecoflex layer for environmental protection and skin compatibility.
- Validate electromechanical performance through cyclic stretching tests (up to 30% strain) and electromagnetic simulations.
This integrated platform demonstrates mechanical compliance (Young's modulus of 89.5 kPa) with robust functionality during deformation, enabling high-quality signal acquisition even during patient movement.
Diagram 1: Integrated Sensor Design Strategy
Quantitative Performance Comparison of Sensor Platforms
Rigorous evaluation of sensor performance requires quantitative comparison across multiple parameters. The following tables summarize key performance metrics for various integrated sensor platforms described in the literature.
Table 2: Electrochemical Sensor Performance for Phenolic Compound Detection
| Sensor Platform | Analyte Pair | Linear Range (μM) | Detection Limit (μM) | Selectivity Ratio | Recovery in Real Samples |
|---|---|---|---|---|---|
| Polysorbate/CPE [109] | Catechol (CC) | 1-100 | 0.27 | 98.2 | 97.5-102.4% |
| Polysorbate/CPE [109] | Hydroquinone (HQ) | 1-100 | 0.31 | 96.8 | 98.2-103.1% |
| Poly(rutin) modified electrode [109] | CC/HQ | 5-200 | 1.2 | 94.5 | 95.8-104.2% |
| MOF-rGO composite [109] | CC/HQ | 0.5-120 | 0.08 | 99.1 | 97.1-101.8% |
Table 3: Performance Metrics for Biomedical Monitoring Platforms
| Sensor Platform | Target Application | Key Metrics | Accuracy | Advantages over Conventional Methods |
|---|---|---|---|---|
| Standalone stretchable device [111] | Laryngeal rehabilitation | sEMG signal quality, motion artifact rejection | 98.2% classification accuracy | Wireless operation, real-time monitoring, adaptive machine learning |
| PRISMS monitoring system [112] | Pediatric asthma | Environmental exposure, physiological signals | N/A | Multi-parameter sensing, natural environment operation |
| Supramolecular polymer conjugate [110] | Pathogen discrimination | Fluorescence intensity changes, binding specificity | 90% discrimination efficiency | Rapid detection (<2.5 hours), no biomarkers required |
| Polymer-conjugated sensors [110] | Gram-positive vs. Gram-negative bacteria | Electrochromic response, fluorescence shift | 94% accuracy | Antibiotic resistance assessment capability |
Advanced Integration: Machine Learning-Enhanced Sensor Platforms
The integration of machine learning algorithms with multi-parameter sensor data enables advanced discrimination capabilities not achievable through conventional sensing approaches. A 2D-like sequential feature extractor based on convolutional neural network (CNN) algorithms can classify 13 general features from human subjects with high accuracy (98.2%) [111].
Experimental Protocol for Machine Learning-Enhanced Sensing:
- Data Acquisition: Collect multi-modal sensor data (sEMG, accelerometer, environmental) from the integrated stretchable platform.
- Feature Extraction: Implement a 2D class sequence feature extractor to identify relevant patterns across time-series data.
- Model Training: Train CNN algorithms on data from multiple subjects (14 healthy humans, 2 patients in validation study).
- Adaptation Mechanism: Incorporate fully connected neurons to enable system adaptation to new subjects and noise conditions.
- Validation: Verify performance with prediction accuracy of 92% for new subjects with motion artifacts [111].
This approach demonstrates particular value in clinical applications where individual variations typically challenge conventional sensor systems.
Diagram 2: Machine Learning-Enhanced Sensor Platform
Research Reagent Solutions for Sensor Development
Table 4: Essential Materials for Advanced Sensor Fabrication
| Reagent/Category | Specific Example | Function in Sensor Platform | Key Characteristics |
|---|---|---|---|
| Surfactant Modifiers | Polysorbate 80 | Electrode surface modification | Forms monolayer, enhances charge transfer, reduces fouling [109] |
| Conductive Hydrogels | DMAPS-based zwitterionic hydrogel with AgNWs | Skin-electrode interface | Low contact impedance, high conductivity, biocompatibility [111] |
| Polymer Conjugates | Cationic polythiophene derivatives with cucurbit[7]uril | Supramolecular pathogen sensing | Fluorescence modulation, selective pathogen binding [110] |
| Electrode Materials | Graphite powder-silicone oil composite (70:30) | Carbon paste electrode substrate | Homogeneous paste, stable baseline, easy modification [109] |
| Recognition Elements | Antimicrobial peptides (e.g., leucocin A) | Pathogen-specific detection | Target bacterial membranes, cationic charge, hydrophobic residues [110] |
| Nanomaterials | Silver nanowires (0.7 wt%) | Conductivity enhancement | Percolation network, maintained stretchability, enhanced signal quality [111] |
| Computational Tools | Gaussian 09 with DFT/B3LYP/6-31G (d,p) | Molecular modeling | Predicts electron transfer sites, reactivity descriptors [109] |
The strategic integration of specific and selective elements in sensor platforms represents a paradigm shift in detection technology. By moving beyond the traditional specificity-selectivity dichotomy, researchers can engineer systems that leverage the advantages of both approaches—the unambiguous identification provided by specific elements and the robust performance offered by selective systems. The experimental protocols and performance metrics outlined in this technical guide provide a framework for developing next-generation sensors with enhanced capabilities across healthcare, environmental monitoring, and industrial applications. Future developments will likely focus on increasing integration of machine learning algorithms, improving material biocompatibility for long-term implantation, and enhancing multi-analyte detection capabilities through increasingly sophisticated supramolecular architectures.
Conclusion
The choice between specific and selective sensing is not about finding a universal winner, but about strategically applying the right tool for the research question. Specific sensing provides unparalleled focus for well-defined hypotheses, while selective arrays offer powerful, hypothesis-free exploration in complex biological systems. The future of sensing in drug development lies in hybrid models that integrate the precision of specific elements with the broad discovery power of selective arrays, all accelerated by AI and computational screening. As regulatory frameworks for digital endpoints mature, the continuous, objective data from advanced sensors—whether specific or selective—will fundamentally reshape clinical trials, enabling more personalized, efficient, and impactful drug development.
References
- 1. ZnO Sensor Array and Convolutional Neural Networks [https://www.nature.com/articles/s41598-025-26084-z]
- 2. Pharmacology and Mechanism of Action of Suzetrigine, a ... [https://pmc.ncbi.nlm.nih.gov/articles/PMC11914629/]
- 3. Innovative sensors with selectivity enhancement by ... [https://pubs.rsc.org/en/content/articlehtml/2025/ra/d5ra02850g]
- 4. GO-SELEX-enhanced dual-recognition sensor for highly ... [https://www.sciencedirect.com/science/article/abs/pii/S0304389425011677]
- 5. Selectivity and Specificity: Pros and Cons in Sensing - PMC [https://pmc.ncbi.nlm.nih.gov/articles/PMC6173322/]
- 6. The use of novel selectivity metrics in kinase research - PMC [https://pmc.ncbi.nlm.nih.gov/articles/PMC5217660/]
- 7. Mathematical approaches in estimating aptamer-target ... [https://pubmed.ncbi.nlm.nih.gov/32315616/]
- 8. 7 Best Comparison Charts for Effective Data Visualization [https://ninjatables.com/types-of-comparison-charts/?srsltid=AfmBOopnTAE_WWe78Fh4fpVNUrm_RuWr3o7e4XFJg1tcEFbGzSLikd22]
- 9. Magic bullet (medicine) [https://en.wikipedia.org/wiki/Magic_bullet_(medicine)]
- 10. Paul Ehrlich [https://www.sciencehistory.org/education/scientific-biographies/paul-ehrlich/]
- 11. Paul Ehrlich's magic bullet concept: 100 years of progress [https://pubmed.ncbi.nlm.nih.gov/18469827/]
- 12. Computational transformation in drug discovery: A ... [https://www.sciencedirect.com/science/article/pii/S2949866X24000340]
- 13. Quantitative Methods in System-Based Drug Discovery [https://www.intechopen.com/chapters/53186]
- 14. The History of Magic Bullets: Magical Thinking in Times ... [https://www.hmsreview.org/covid/history-of-magic-bullets]
- 15. Microbe Hunters and Magic Bullets [https://cancerhistoryproject.com/article/microbe-hunters-and-magic-bullets/]
- 16. Quantitative Research Techniques for Drug Development [https://esr-research.com/quantitative-research-techniques-for-drug-development-surveys-and-statistical-analysis/]
- 17. Development of Quantitative Comparative Approaches to ... [https://pubmed.ncbi.nlm.nih.gov/38267593]
- 18. Quantum sensors for biomedical applications - PMC [https://pmc.ncbi.nlm.nih.gov/articles/PMC9896461/]
- 19. Highly sensitive and selective of lead (II) ions in Paris... | CoLab sensing [https://colab.ws/articles/10.1016%2Fj.saa.2025.126868]
- 20. Beta Blockers [https://www.thecardiologyadvisor.com/ddi/beta-blockers/]
- 21. Metoprolol - StatPearls - NCBI Bookshelf [https://www.ncbi.nlm.nih.gov/books/NBK532923/]
- 22. An updated insight into the effect of β-adrenergic receptor ... [https://pmc.ncbi.nlm.nih.gov/articles/PMC12331582/]
- 23. An updated insight into the effect of β-adrenergic receptor ... [https://www.frontiersin.org/journals/physiology/articles/10.3389/fphys.2025.1582740/full]
- 24. Differential Impact of Metoprolol Formulations on Heart ... [https://www.sciencedirect.com/science/article/pii/S3050661125000802]
- 25. Beta blockers and hypertrophic obstructive cardiomyopathy [https://pmc.ncbi.nlm.nih.gov/articles/PMC12557796/]
- 26. Beta-Blockers in Heart Failure With Reduced Ejection ... [https://pmc.ncbi.nlm.nih.gov/articles/PMC12477414/]
- 27. Meta-analysis finds that beta-blockers improve outcomes ... [https://www.escardio.org/The-ESC/Press-Office/Press-releases/Meta-analysis-finds-that-beta-blockers-improve-outcomes-after-a-heart-attack-in-patients-with-mildly-reduced-heart-function]
- 28. Aptamers and antibodies in optical biosensing [https://link.springer.com/article/10.1007/s44371-025-00094-2]
- 29. Aptamers as targeted therapeutics: current potential and ... [https://pmc.ncbi.nlm.nih.gov/articles/PMC5700751/]
- 30. New Insights into Aptamers: An Alternative to Antibodies in ... [https://pmc.ncbi.nlm.nih.gov/articles/PMC11240909/]
- 31. “Lock-and-key” recognizer-encoded lateral flow assays ... [https://www.sciencedirect.com/science/article/abs/pii/S0956566323002592]
- 32. Recent Advances in the Optimization of Nucleic Acid ... [https://pmc.ncbi.nlm.nih.gov/articles/PMC12564743/]
- 33. Advantages, applications, and future directions of in vivo ... [https://pmc.ncbi.nlm.nih.gov/articles/PMC12173102/]
- 34. Ion Selective Sensors Market Report [https://dataintelo.com/report/global-ion-selective-sensors-market]
- 35. Cell-Based Chemical Safety Assessment and Therapeutic ... [https://www.mdpi.com/1422-0067/23/7/3672]
- 36. Polymer-Based Multichannel Sensor for Rapid Cell ... [https://pmc.ncbi.nlm.nih.gov/articles/PMC10587897/]
- 37. Next-Generation Chemical Sensors: The Convergence of ... [https://www.mdpi.com/2227-9040/13/9/345]
- 38. Next-Generation Chemical Sensors: The Convergence of ... [https://www.preprints.org/manuscript/202508.0582/v1]
- 39. Emerging applications of stimulated Raman scattering ... [https://pubs.rsc.org/en/content/articlehtml/2025/cs/d5cs00748h]
- 40. Advances in micro/nano-engineered flexible sensor arrays ... [https://www.oaepublish.com/articles/ss.2025.11]
- 41. Modern designs of electrochemical sensor for accurate ... [https://www.sciencedirect.com/science/article/abs/pii/S0254058425002342]
- 42. Differentiating Selectivity Vs Specificity in Pharmacology [https://altabrisagroup.com/selectivity-vs-specificity/]
- 43. A precise comparison of molecular target prediction methods [https://pubs.rsc.org/en/content/articlehtml/2025/dd/d5dd00199d]
- 44. Optimizing drug design by merging generative AI with a ... [https://www.nature.com/articles/s42004-025-01635-7]
- 45. Vanderbilt scientist tackles key roadblock for AI in drug ... [https://medschool.vanderbilt.edu/basic-sciences/2025/10/16/vanderbilt-scientist-tackles-key-roadblock-for-ai-in-drug-discovery/]
- 46. Top 5 Drug Discovery Trends 2025 Driving Breakthroughs [https://www.pelagobio.com/cetsa-drug-discovery-resources/blog/drug-discovery-trends-2025/]
- 47. Transformative Role of Artificial Intelligence in Drug ... [https://pmc.ncbi.nlm.nih.gov/articles/PMC12406033/]
- 48. Ultra-Large Virtual Screening: Definition, Recent Advances ... [https://pubmed.ncbi.nlm.nih.gov/39635776/]
- 49. Ultra-large library screening with an evolutionary algorithm ... [https://www.nature.com/articles/s42004-025-01758-x]
- 50. Benchmarking the Structure-Based Virtual Screening ... [https://pmc.ncbi.nlm.nih.gov/articles/PMC12363558/]
- 51. Molecular Docking Software for Virtual Screening [https://www.eyesopen.com/oedocking]
- 52. SuperPlotsOfData—a web app for the transparent display ... [https://pmc.ncbi.nlm.nih.gov/articles/PMC8101441/]
- 53. The latest trends in drug | CAS discovery [https://www.cas.org/resources/cas-insights/2025-drug-discovery-trends]
- 54. Target Identification & Validation in Drug Discovery [https://www.technologynetworks.com/drug-discovery/articles/target-identification-validation-in-drug-discovery-312290]
- 55. A Hierarchical Framework for Selecting Reference Measures ... [https://pmc.ncbi.nlm.nih.gov/articles/PMC11845878/]
- 56. Stride Velocity 95th Centile: Insights into Gaining ... [https://pubmed.ncbi.nlm.nih.gov/34958044/]
- 57. Wearable devices and the future of rare disease clinical trials [https://www.sarepta.com/newsroom/wearable-devices-and-future-rare-disease-clinical-trials-landrys-story]
- 58. Defining the Digital Measurement of Scratching During ... [https://pmc.ncbi.nlm.nih.gov/articles/PMC10155092/]
- 59. Assessing nocturnal scratch with actigraphy in atopic ... [https://www.nature.com/articles/s41746-023-00821-y]
- 60. Digital Endpoints Series: Heart Failure Indication Guide [https://ametris.com/digital-endpoints/heart-failure]
- 61. HPLC vs MS: Sensitivity and Selectivity Comparison [https://eureka.patsnap.com/report-hplc-vs-ms-sensitivity-and-selectivity-comparison]
- 62. Recent Advances in Liquid Chromatography–Mass ... [https://pmc.ncbi.nlm.nih.gov/articles/PMC12204688/]
- 63. How to Reduce Peak Tailing in HPLC? [https://www.phenomenex.com/knowledge-center/hplc-knowledge-center/how-to-reduce-peak-tailing-in-hplc?srsltid=AfmBOorf8v30rjZfE5kIFUyCnx73hS8YzcGLD1M9hmbnAeUtfZciZuLy]
- 64. LC Troubleshooting Essentials: A Guide to Common ... [https://www.chromatographyonline.com/view/lc-troubleshooting-essentials-a-guide-to-common-problems-and-solutions-for-peak-tailing-ghost-peaks-and-pressure-spikes]
- 65. Innovations in Liquid Chromatography: 2025 HPLC ... [https://www.chromatographyonline.com/view/innovations-in-liquid-chromatography-2025-hplc-column-and-accessories-review]
- 66. Peak Tailing in HPLC [https://www.elementlabsolutions.com/uk/chromatography-blog/post/peak-tailing-in-hplc]
- 67. Expert Guide to Troubleshooting Common HPLC Issues - AELAB | Laboratory Equipment and Scientific Instrument Supplier [https://aelabgroup.com/expert-guide-to-troubleshooting-common-hplc-issues/]
- 68. Why Your HPLC Baseline Drifts—And How to Stop It [https://www.sepscience.com/why-your-hplc-baseline-drifts-and-how-to-stop-it-11018]
- 69. Essentials of LC Troubleshooting, Part IV: What Is Going ... [https://www.chromatographyonline.com/view/essentials-of-lc-troubleshooting-part-iv-what-is-going-on-with-the-baseline-]
- 70. Multi-target pharmacology: possibilities and limitations of the ... [https://pmc.ncbi.nlm.nih.gov/articles/PMC4585027/]
- 71. Multi-target drug discovery and design for complex health ... [https://pmc.ncbi.nlm.nih.gov/articles/PMC12202662/]
- 72. Multi-target therapeutics: when the whole is greater than ... [https://www.sciencedirect.com/science/article/abs/pii/S1359644606004697]
- 73. The computationally guided design of selective targeters ... [https://pmc.ncbi.nlm.nih.gov/articles/PMC12537719/]
- 74. What Makes a Smart Drug? Inside the Science of Multi- ... [https://www.news-medical.net/health/What-Makes-a-Smart-Drug-Inside-the-Science-of-Multi-Target-Therapeutics.aspx]
- 75. Systematic analysis of drug combinations against Gram- ... [https://pmc.ncbi.nlm.nih.gov/articles/PMC10627819/]
- 76. multi-view-based graph deep model for drug-target affinity ... [https://bmcbiol.biomedcentral.com/articles/10.1186/s12915-024-01981-3]
- 77. Understanding the Role of Sensor Optimisation in Complex ... [https://pmc.ncbi.nlm.nih.gov/articles/PMC10534378/]
- 78. An optimal sensor design framework accounting for ... [https://www.sciencedirect.com/science/article/abs/pii/S0888327023005812]
- 79. Efficient joint resource allocation using self organized map ... [https://www.nature.com/articles/s41598-025-02274-7]
- 80. AI in SERS sensing moving from discriminative to generative [https://www.nature.com/articles/s44328-025-00033-2]
- 81. PMC Search Update - PubMed Central [https://pmc.ncbi.nlm.nih.gov/articles/PMC3141962/]
- 82. Systematic Review and Meta-Analysis: Dose-Response ... [https://pmc.ncbi.nlm.nih.gov/articles/PMC4975858/]
- 83. The relationship between dose and serotonin transporter ... [https://www.nature.com/articles/s41380-021-01285-w]
- 84. Serotonin–norepinephrine reuptake inhibitor [https://en.wikipedia.org/wiki/Serotonin%E2%80%93norepinephrine_reuptake_inhibitor]
- 85. The antidepressant drug vilazodone is an allosteric ... [https://www.nature.com/articles/s41467-021-25363-3]
- 86. Serotonin Norepinephrine Reuptake Inhibitors (SNRIs) [https://elsevier.health/en-US/preview/serotonin-norepinephrine-reuptake-inhibitors-snris]
- 87. Validation, verification, or optimization? Don't guess [https://www.statlab.com/news/validation-verification-or-optimization]
- 88. New Test? Don't Skip Performance Specification Verification [https://staffready.com/2025/08/19/new-test-dont-skip-performance-specification-verification/]
- 89. Regulatory News and Updates for Laboratories [https://www.cap.org/laboratory-improvement/regulatory-news-and-updates-for-laboratories]
- 90. Design of electrochemical aptameric biosensor for the ... [https://www.nature.com/articles/s41598-025-16913-6]
- 91. Recent Advances in Electrochemical Sensors for the ... [https://pmc.ncbi.nlm.nih.gov/articles/PMC12563010/]
- 92. 2025 Changes to Point-of-Care Testing Regulatory ... [https://myadlm.org/education/point-of-care-testing-professional-certification/the-point/articles/2025/may]
- 93. Extending Selective Arrays for Infectious Disease Detection [https://pubmed.ncbi.nlm.nih.gov/40955055/]
- 94. Sensor Arrays: A Comprehensive Systematic Review - PMC [https://pmc.ncbi.nlm.nih.gov/articles/PMC12390142/]
- 95. A comparison study of chemical sensor array pattern ... [https://www.sciencedirect.com/science/article/abs/pii/S0003267098007806]
- 96. Prospects and challenges of sensor materials [https://www.sciencedirect.com/science/article/pii/S2772671124000780]
- 97. Where The FDA And EMA Stand On Digital Endpoints [https://www.clinicalleader.com/doc/where-the-fda-and-ema-stand-on-digital-endpoints-0001]
- 98. Digital Health Technologies (DHTs) for Drug Development [https://www.fda.gov/science-research/science-and-research-special-topics/digital-health-technologies-dhts-drug-development]
- 99. Digital Health Technologies for Remote Data Acquisition in ... [https://www.fda.gov/regulatory-information/search-fda-guidance-documents/digital-health-technologies-remote-data-acquisition-clinical-investigations]
- 100. Artificial Intelligence in Software as a Medical Device [https://www.fda.gov/medical-devices/software-medical-device-samd/artificial-intelligence-software-medical-device]
- 101. Medical Devices that Incorporate Sensor-based Digital ... [https://www.fda.gov/medical-devices/digital-health-center-excellence/medical-devices-incorporate-sensor-based-digital-health-technology]
- 102. Methods for the Clinical Validation of Digital Endpoints [https://pmc.ncbi.nlm.nih.gov/articles/PMC10636620/]
- 103. Verification, Analytical Validation, and Clinical Validation (V3 ... [https://datacc.dimesociety.org/resources/the-v3-framework/]
- 104. V3+ extends the V3 framework to ensure user-centricity ... [https://www.nature.com/articles/s41746-024-01322-2]
- 105. The V3 Framework: Establishing Confidence in Digital ... [https://resources.jax.org/jax-blog/the-v3-framework-establishing-confidence-in-digital-measures]
- 106. Validation framework for in vivo digital measures - PMC [https://pmc.ncbi.nlm.nih.gov/articles/PMC11751004/]
- 107. V3+: An extension to the V3 framework to ensure ... - DATAcc [https://datacc.dimesociety.org/resources/v3-an-extension-to-the-v3-framework-to-ensure-user-centricity-and-scalability-of-sensor-based-digital-health-technologies/]
- 108. Extending the V3 Framework - DATAcc by DiMe [https://datacc.dimesociety.org/v3/extending-v3/]
- 109. An experimental and theoretical approach to ... [https://www.nature.com/articles/s41598-022-06207-6]
- 110. Sensing Microorganisms Using Rapid Detection Methods [https://pmc.ncbi.nlm.nih.gov/articles/PMC11940469/]
- 111. A fully integrated, standalone stretchable device platform ... [https://www.nature.com/articles/s41467-023-43664-7]
- 112. Pediatric Research Using Integrated Sensor Monitoring Systems [https://www.nibib.nih.gov/programs/pediatric-research-using-integrated-sensor-monitoring-systems]