SPR vs ELISA: A Comprehensive Guide to Biomolecular Interaction Analysis
This article provides a detailed comparison of Surface Plasmon Resonance (SPR) and Enzyme-Linked Immunosorbent Assay (ELISA) for researchers, scientists, and drug development professionals.
SPR vs ELISA: A Comprehensive Guide to Biomolecular Interaction Analysis
Abstract
This article provides a detailed comparison of Surface Plasmon Resonance (SPR) and Enzyme-Linked Immunosorbent Assay (ELISA) for researchers, scientists, and drug development professionals. It covers the foundational principles of both label-free, real-time SPR and the established, endpoint ELISA methodology. The content explores their specific applications in biomolecular detection, critical troubleshooting and optimization strategies, and a direct validation of their performance in detecting challenging interactions like low-affinity binders and anti-drug antibodies. By synthesizing current research and comparative studies, this guide aims to support informed method selection for therapeutic development, immunogenicity testing, and clinical analysis.
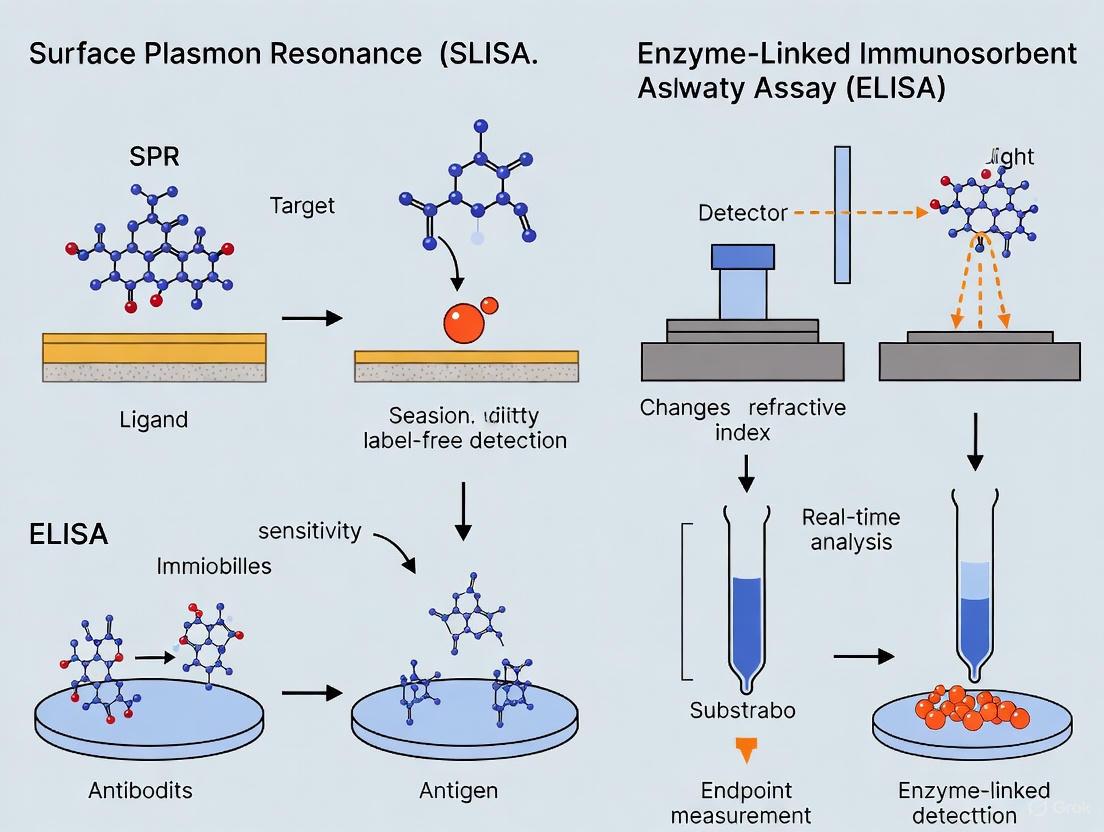
Core Principles: How SPR and ELISA Work
The Enzyme-Linked Immunosorbent Assay (ELISA) stands as one of the most standardized and well-characterized immunoassays performed in laboratories worldwide. Repeatedly recognized as the gold standard for detecting antibodies, proteins, and other biomolecules, ELISA provides a cost-effective approach for obtaining quantitative interaction data across various research and clinical applications [1]. Its enduring popularity stems from high sensitivity, specificity, and accessibility, making it often the method of choice for researchers seeking reliable biomolecular detection. However, the increasing complexity of scientific questions, particularly in drug discovery and development, has revealed limitations in this endpoint detection method, especially when characterizing dynamic molecular interactions.
This technical guide examines the ELISA methodology within the context of modern analytical techniques, with particular emphasis on comparisons with Surface Plasmon Resonance (SPR). While ELISA provides a snapshot of molecular presence at a single endpoint, SPR unveils the dynamic interplay of biomolecules in real time, offering insights that traditional ELISA cannot capture. The following sections provide a comprehensive analysis of both technologies, highlighting their respective strengths, limitations, and optimal applications in contemporary research settings.
Core Principles of ELISA and Surface Plasmon Resonance
The ELISA Technique: A Foundation in Endpoint Analysis
ELISA is a plate-based assay technique designed for detecting and quantifying soluble substances such as peptides, proteins, antibodies, and hormones. The overarching premise involves immobilizing a target biomolecule (antigen) to a solid surface, typically a microplate well, and complexing it with an antigen-specific antibody linked to an enzyme label. Detection is achieved through a secondary reaction catalyzed by the attached enzyme, which produces a measurable colorimetric, chemiluminescent, or fluorescent signal when exposed to an appropriate substrate [1] [2].
The fundamental strength of ELISA lies in its proven reliability and straightforward implementation. Most laboratories are already equipped with the necessary instrumentation—pipettes, microplates, and microplate readers—making ELISA a highly accessible and cost-effective analytical tool. The technique's standardization across decades of use has established robust protocols that deliver consistent results for quantitative analysis of biomolecular presence and concentration [1].
ELISA Formats and Methodologies
ELISA presents in several formats, each with distinct advantages and applications [2]:
- Direct ELISA: The simplest format where a labeled primary antibody directly detects the immobilized antigen. This method is quick with minimal steps but offers limited signal amplification.
- Indirect ELISA: Utilizes an unlabeled primary antibody followed by a labeled secondary antibody that recognizes the primary. This provides signal amplification but introduces potential for cross-reactivity.
- Sandwich ELISA: Employs two antibodies—a capture antibody immobilized on the plate and a detection antibody that binds to a different epitope on the antigen. This format is particularly useful for complex samples and offers high specificity.
- Competitive ELISA: Based on the competition between sample antigen and reference antigen for a limited amount of antibody binding sites. This format is especially sensitive for detecting small antigens or those with limited epitopes.
Surface Plasmon Resonance: Real-Time Interaction Analysis
Surface Plasmon Resonance represents a fundamentally different approach to biomolecular detection. As a label-free technique, SPR leverages optical principles to monitor interactions in real time without requiring enzymatic or fluorescent tags. The technology relies on detecting changes in the refractive index near a sensor surface when binding events occur [1] [3].
In SPR analysis, one binding partner (ligand) is immobilized on the sensor chip, while the other (analyte) flows over the surface in solution. When interactions occur, they alter the refractive index at the sensor surface, producing detectable changes in the resonance angle of polarized light striking the surface. This enables continuous monitoring of both association (binding) and dissociation (unbinding) phases of molecular interactions [3].
The key advantage of SPR lies in its ability to provide kinetic parameters—association rate (kₒₙ), dissociation rate (kₒff), and equilibrium dissociation constant (K_D)—that define the strength and durability of molecular interactions. These real-time insights are particularly valuable for understanding transient interactions, binding mechanisms, and interaction stability under various conditions [3].
Technical Comparison: ELISA versus SPR
Comprehensive Feature Analysis
Table 1: Technical comparison between ELISA and SPR technologies [1]
| Parameter | ELISA | SPR |
|---|---|---|
| Data Measurement | End-point, quantitative presence/amount | Real-time, affinity (K_D) and kinetics (kₒₙ, kₒff) |
| Label Requirement | Requires enzyme-labeled antibodies | Label-free; detects refractive index changes |
| Experiment Length | Typically > 24 hours with significant hands-on time | Significantly reduced time to answer |
| Low-Affinity Interaction Detection | Poor sensitivity; multiple washing steps remove low-affinity binders | Effectively quantifies both low and high-affinity interactions |
| Operating/Maintenance Costs | Highly cost-effective and accessible | Higher upfront costs; lower ongoing costs for benchtop systems |
| Learning Curve | Short; utilizes basic laboratory skills | Steeper; requires specific training (simplified in modern systems) |
| Throughput | High for sample processing | Moderate to high with modern multi-channel systems |
| Information Depth | Presence/quantity of target | Mechanism, kinetics, and affinity of interaction |
Detection Capabilities for Low-Affinity Interactions
A critical distinction between these techniques emerges in detecting low-affinity interactions, which are scientifically and clinically relevant in many applications. ELISA signals depend on protein-target binding affinity, and low-affinity interactions typically produce weak signals that can be lost during multiple washing steps [1]. This makes it difficult to determine whether weak signals stem from low affinity or poor protein expression, potentially leading to false-negative results.
SPR consistently demonstrates higher sensitivity in detecting low-affinity interactions due to its real-time monitoring capability without extensive washing procedures. In studies detecting anti-drug antibodies (ADA), SPR identified a positivity rate of 4%, compared to only 0.3% by ELISA, with consistently higher sensitivity for low-affinity interactions [1]. This performance advantage makes SPR particularly valuable for clinical applications where detecting transient interactions is critical.
Experimental Evidence: Case Studies Revealing Methodological Discrepancies
Anti-Drug Antibody Detection in Clinical Samples
A 2021 study comparing ELISA and SPR for detecting anti-infliximab antibodies in 76 patients with inflammatory bowel disease revealed striking methodological differences [4]. While both methods produced similar serum drug concentrations, they diverged significantly in ADA detection. All 14 samples identified as ADA-positive by ELISA were also positive by SPR, but absolute ADA levels measured by SPR were 7 to 490 times higher, with no correlation between the methods [4].
Furthermore, SPR detected ADA in 8 additional patients considered ADA-negative by ELISA. Kinetic analysis revealed these SPR-exclusive ADA had significantly faster dissociation rate constants than those detectable by both methods [4]. The underestimation or complete lack of ADA detection by ELISA likely reflects long incubation steps that favor dissociation of patients' low-affinity ADA, while commercial, high-affinity anti-infliximab antibodies used for calibration curves remain bound [5].
Binding Affinity Underestimation by ELISA
A comparative analysis of alpaca antibody clones revealed significant discrepancies in binding affinity measurements between ELISA and SPR [5]. For clone R4, ELISA reported K_D values 43.7-fold higher than SPR, while for clone R9, ELISA values were 14.1-fold higher, significantly underestimating binding affinity in both cases [5].
This discrepancy stems from ELISA's inability to confirm equilibrium binding. SPR kinetic analysis calculated time to equilibrium (tₑqᵤᵢₗ) as 5.34 hours for R4 and 2.29 hours for R9—far exceeding typical ELISA incubation periods [5]. This demonstrates that without kinetic guidance from techniques like SPR, ELISA protocols may use insufficient incubation times, leading to substantial underestimation of binding affinity.
Table 2: Comparative binding affinity measurements between SPR and ELISA [5]
| Clone | SPR K_D (M) | ELISA K_D (M) | Fold Difference | Time to Equilibrium |
|---|---|---|---|---|
| R4 | Accurate value | 43.7x higher | 43.7 | 5.34 hours |
| R9 | Accurate value | 14.1x higher | 14.1 | 2.29 hours |
Experimental Protocols and Methodologies
Standard ELISA Protocol
Table 3: General protocols for three common ELISA formats [2]
| Step | Direct ELISA | Indirect ELISA | Sandwich ELISA |
|---|---|---|---|
| 1. Immobilization | Apply antigen to wells (100 μL, 1h incubation) | Apply antigen to wells (100 μL, 1h incubation) | Apply capture antibody to wells (100 μL, 1h incubation) |
| 2. Blocking | Add blocking solution (300 μL, 15min) | Add blocking solution (300 μL, 15min) | Add blocking solution (300 μL, 15min) |
| 3. Primary Antibody | - | Add primary antibody (100 μL, 1h incubation) | Add sample antigen (100 μL, 1h or overnight) |
| 4. Washing | Fill wells with wash solution, repeat 3-5 times | Fill wells with wash solution, repeat 3-5 times | Fill wells with wash solution, repeat 3-5 times |
| 5. Secondary Antibody | Add enzyme-labeled primary antibody (100 μL, 1h) | Add enzyme-labeled secondary antibody (100 μL, 1h) | Add detection antibody (100 μL, 1h) |
| 6. Washing | Repeat washing steps | Repeat washing steps | Repeat washing steps |
| 7. Detection | Add substrate (100 μL), read with plate reader | Add substrate (100 μL), read with plate reader | Add substrate (100 μL), read with plate reader |
SPR Kinetic Analysis Protocol
SPR experiments follow a distinct workflow focused on capturing real-time interaction data [1] [3]:
Sensor Chip Preparation: Select appropriate sensor surface chemistry and immobilize the ligand using covalent coupling, capture, or other suitable methods.
System Equilibration: Establish stable baseline with running buffer flowing continuously over the sensor surface.
Analyte Injection: Introduce analyte over the sensor surface using precise microfluidics, monitoring association phase in real time.
Dissociation Monitoring: Replace analyte solution with running buffer to monitor complex dissociation.
Regeneration: Apply conditions that remove bound analyte without damaging the immobilized ligand.
Data Analysis: Process sensorgram data to determine kinetic parameters using appropriate binding models.
Essential Research Reagents and Materials
The Scientist's Toolkit: Core Reagents for ELISA and SPR
Table 4: Essential research reagents and materials for biomolecular interaction studies
| Reagent/Material | Function in ELISA | Function in SPR |
|---|---|---|
| Microplates | Solid phase for antigen/antibody immobilization | Not applicable |
| Sensor Chips | Not applicable | Solid phase with gold surface for ligand immobilization |
| Capture Antibodies | Immobilized in sandwich ELISA to capture target antigen | Occasionally used to capture protein ligands |
| Detection Antibodies | Enzyme-conjugated for signal generation | Not typically used (label-free) |
| Enzyme Substrates | Generate measurable signal (colorimetric/chemiluminescent) | Not applicable |
| Blocking Buffers | Prevent non-specific binding to solid surface | Prevent non-specific binding to sensor surface |
| Coating Buffers | Optimize immobilization to plastic surface | Not applicable |
| Running Buffers | Diluent for reagents | Maintains constant environment in microfluidics |
| Regeneration Solutions | Not typically used | Removes bound analyte without damaging ligand |
Methodological Workflows: Visualizing Experimental Approaches
ELISA Experimental Workflow
SPR Kinetic Analysis Workflow
ELISA remains a vital tool in biomolecular detection, offering proven reliability, accessibility, and cost-effectiveness for quantitative analysis of molecular presence. Its standardized protocols and widespread adoption ensure its continued relevance in diagnostic and research applications. However, the emergence of SPR has revealed significant limitations in the ELISA paradigm, particularly for characterizing dynamic interactions, detecting low-affinity binders, and obtaining accurate affinity measurements.
The most effective research strategy leverages the complementary strengths of both techniques. SPR provides essential kinetic data to optimize ELISA protocols, guiding appropriate incubation times to reach equilibrium binding conditions [5]. Meanwhile, ELISA offers high-throughput screening capacity for applications where comprehensive kinetic profiling is unnecessary.
For researchers requiring detailed understanding of interaction mechanisms, binding stability, or transient molecular events, SPR delivers indispensable real-time insights that endpoint methods cannot provide. As drug discovery increasingly focuses on nuanced interaction profiles—particularly with emerging modalities like CAR-T, ADCs, and targeted protein degradation—SPR's ability to quantify kinetic parameters becomes increasingly valuable [3] [6].
The future of biomolecular interaction analysis lies not in choosing one technique over the other, but in understanding their complementary applications. By leveraging SPR's kinetic insights to validate and optimize traditional methods like ELISA, researchers can ensure their experimental approaches yield biologically relevant data, advancing both basic research and therapeutic development.
In the fields of molecular biology and drug development, the accurate characterization of biomolecular interactions is fundamental to advancing scientific discovery and therapeutic innovation. For decades, the enzyme-linked immunosorbent assay (ELISA) has served as the gold standard technique for detecting and quantifying proteins, antibodies, and other biomolecules, valued for its high sensitivity, specificity, and accessibility [1]. This plate-based immunoassay relies on immobilized antigens complexing with specific antibodies linked to enzymatic labels, with detection achieved through a secondary colorimetric, fluorescent, or chemiluminescent reaction [1] [7].
Despite its widespread adoption, ELISA presents significant limitations for modern research applications, including its labor-intensive protocols, lengthy experimental timelines, and, most critically, its nature as an endpoint assay that provides only affinity data without kinetic information [1] [5]. These constraints have prompted the emergence of surface plasmon resonance (SPR) as a powerful alternative that enables real-time, label-free biomolecular interaction analysis. SPR technology has demonstrated particular value in drug discovery and development, where understanding both binding affinity and kinetics is essential for characterizing therapeutic candidates and detecting immune responses to biologic therapies [1] [4].
This technical guide examines the fundamental principles of SPR technology, contrasting its capabilities with traditional ELISA methodologies, and provides experimental frameworks for its application in contemporary research settings, with special emphasis on its growing importance in biotherapeutic development.
Technical Principles of Surface Plasmon Resonance
Fundamental Mechanism
Surface plasmon resonance is an optical technique that detects changes in the refractive index at the interface between a metal film (typically gold) and a liquid sample. The core principle involves the excitation of surface plasmons—collective oscillations of free electrons at the metal surface—by incident light under specific conditions [8]. In most commercial SPR instruments, this is achieved using a prism-coupled configuration where polarized light undergoes total internal reflection at the prism-metal interface, generating an evanescent wave that penetrates the metal film [8].
When biomolecular binding occurs on the functionalized metal surface, it alters the local refractive index, which in turn changes the resonance conditions (the "SPR angle") required to excite the surface plasmons [8]. This shift in resonance angle is measured in real-time and is directly proportional to the mass concentration of molecules bound to the sensor surface, enabling quantitative assessment of binding events without the need for fluorescent, radioactive, or enzymatic labels [1] [8] [9].
The Sensorgram: Real-Time Interaction Monitoring
The primary data output of SPR is a sensorgram—a real-time plot of response units (RU) against time that visualizes the complete binding interaction [8]. A typical sensorgram displays several distinct phases:
- Baseline: The initial stable signal representing the running buffer flowing over the sensor chip.
- Association: The analyte injection phase where binding occurs, characterized by an increasing RU signal as complexes form.
- Equilibrium/Plateau: The phase where association and dissociation rates equalize, indicating saturation.
- Dissociation: The return to buffer flow, where a decreasing RU signal reflects complex dissociation.
- Regeneration: Application of conditions that remove bound analyte, returning the surface to its initial state for subsequent analysis [8] [10].
This continuous measurement throughout all interaction phases enables SPR to extract both kinetic parameters (association rate constant, kₐₙ, and dissociation rate constant, kₒff) and the equilibrium dissociation constant (KD) from a single experiment [8] [10].
SPR Experimental Setup and Instrumentation
Modern SPR instrumentation typically consists of several key components: a polarized light source, a high-refractive-index prism, a thin metal film (sensor chip), a microfluidic cartridge for sample delivery, and a photodetector [8]. Various commercial platforms are available, including traditional prism-coupled systems (Biacore, ProteOn) and emerging technologies incorporating localized SPR (LSPR) and digital microfluidics (Nicoya Alto) that offer reduced footprint and simplified operation [1] [11].
Sensor chips are available with diverse surface chemistries to facilitate ligand immobilization through covalent coupling (e.g., amine, thiol) or high-affinity capture (e.g., streptavidin-biotin, Ni-NTA-His-tag) [8] [10]. This flexibility enables the study of various interactions, including protein-protein, protein-DNA, receptor-ligand, and protein-small molecule binding events [8].
SPR vs. ELISA: A Comprehensive Technical Comparison
Methodological Differences and Data Output
While both SPR and ELISA can characterize molecular interactions, they differ fundamentally in approach, experimental requirements, and information content. ELISA is an endpoint assay requiring multiple incubation and washing steps over several hours to days, with detection dependent on enzyme-substrate signal amplification [1] [7]. In contrast, SPR monitors interactions in real-time without labels, completing many experiments within minutes while providing continuous binding data [1].
The most significant distinction lies in the type of binding information obtained. ELISA provides only equilibrium affinity measurements, while SPR yields both kinetic and affinity parameters, offering insights into the mechanism and stability of interactions beyond what is possible with ELISA alone [1] [5]. This kinetic information is particularly valuable for drug development, where residence time (functionally related to dissociation rate) often correlates with therapeutic efficacy [1].
Table 1: Core Methodological Comparison Between SPR and ELISA
| Parameter | SPR | ELISA |
|---|---|---|
| Detection Principle | Refractive index changes [1] | Enzyme-mediated signal generation [1] |
| Measurement Type | Real-time, continuous [1] [8] | Endpoint [1] [5] |
| Label Requirement | Label-free [1] [8] | Requires enzymatic labels [1] [7] |
| Data Output | Affinity (KD) & kinetics (kₐₙ, kₒff) [1] | Affinity only (KD) [1] |
| Assay Duration | Minutes to hours [1] [7] | Hours to days [1] [7] |
| Throughput | Medium to high (multiplexed systems) [1] | High (plate-based) [1] |
Performance in Critical Applications
Detection of Low-Affinity Interactions
SPR demonstrates particular advantage in detecting low-affinity interactions that are often missed by ELISA. The multiple washing steps in ELISA procedures tend to remove transient or weakly-bound complexes, potentially leading to false-negative results [1] [4]. SPR's real-time monitoring captures these interactions before dissociation occurs, making it invaluable for applications where low-affinity binders are biologically relevant [1].
This capability is critically important in immunogenicity assessment for biologic therapies. In a comparative study of infliximab-treated patients, SPR detected anti-drug antibodies (ADA) in 8 additional patients that were classified as ADA-negative by ELISA [4]. Notably, SPR measured ADA concentrations 7-490 times higher than ELISA in samples where both methods detected antibodies, with no correlation between the reported values [4]. These discrepancies were attributed to the faster dissociation rates of patient-derived ADA compared to the high-affinity reference antibodies used in ELISA calibration [4] [5].
Accuracy in Affinity Measurement
Substantial evidence indicates that ELISA frequently underestimates binding affinity compared to SPR. In an antibody discovery study, ELISA-reported KD values were 43.7-fold and 14.1-fold higher for two different clones compared to SPR measurements, significantly underestimating binding strength [5]. This inaccuracy primarily stems from ELISA's inability to confirm equilibrium binding—a critical requirement for valid KD determination [5].
Research analyzing 100 binding studies revealed that 70% failed to confirm equilibrium, with nearly 90% using incubation times of one hour or less despite evidence that protein complex equilibration often requires many hours [5]. SPR circumvents this limitation by continuously monitoring until equilibrium is established, then calculating KD from both kinetic rate constants, providing more reliable affinity measurements [5].
Table 2: Performance Comparison for Key Applications
| Performance Metric | SPR | ELISA |
|---|---|---|
| Low-Affinity Interaction Detection | Excellent [1] [4] | Poor (washes remove complexes) [1] [4] |
| Affinity Measurement Accuracy | High (confirmed equilibrium) [5] | Variable (often underestimates) [5] |
| Drug Tolerance in ADA Detection | High (detects ADA in drug presence) [4] | Low (interference from circulating drug) [4] |
| Kinetic Parameter Determination | Direct measurement [1] [8] | Not possible [1] |
| Active Concentration Analysis | Possible (CFCA) [8] | Not possible |
Practical Implementation Considerations
From an operational perspective, each technique presents distinct advantages and challenges. ELISA benefits from established protocols, widespread familiarity, lower equipment costs, and compatibility with standard laboratory instrumentation [1]. However, it requires extensive optimization of antibody pairs, blocking conditions, and detection parameters, with significant hands-on time throughout multi-step procedures [1] [7].
SPR systems typically involve higher initial investment but offer automated fluidics, reduced reagent consumption, and streamlined protocols with minimal hands-on time [1]. Modern benchtop systems have addressed earlier limitations regarding operational complexity, with intuitive software and disposable fluidics reducing maintenance requirements and learning curves [1]. Additionally, sensor chips can typically be regenerated for multiple analysis cycles, improving cost-efficiency over time [8] [10].
Experimental Protocols and Applications
Standard SPR Experiment Workflow
A typical SPR binding experiment follows a structured workflow that ensures reliable, reproducible data collection:
1. Sensor Chip Selection and Preparation: Choose an appropriate sensor surface based on ligand properties and immobilization strategy. Common options include carboxymethylated dextran (CM5 for amine coupling), streptavidin (for biotinylated ligands), or NTA (for His-tagged proteins) [10].
2. Ligand Immobilization: immobilize the binding partner (ligand) to the sensor surface using appropriate chemistry. For covalent coupling via amine groups, activate the surface with NHS/EDC mixture, inject ligand in low-salt buffer at pH below its isoelectric point, then deactivate excess reactive groups [10]. Target immobilization levels depend on experimental goals but typically range from 50-500 response units (RU) for kinetic analysis of protein-protein interactions [10].
3. Running Buffer Selection: Choose a physiologically relevant buffer (e.g., HEPES, PBS) that maintains protein stability and activity. Include necessary additives cofactors, and match DMSO concentrations when testing small molecules dissolved in organic solvents [10].
4. Equilibrium Baseline Establishment: Flow running buffer over both sample and reference flow cells until a stable baseline is achieved, indicating system equilibration [8] [10].
5. Analyte Injection and Association Phase: Inject analyte samples at multiple concentrations across serial dilutions, typically using a flow rate of 30 μL/min for 2-5 minutes association time. The analyte binds to the immobilized ligand, producing increasing RU signals [8] [10].
6. Dissociation Phase Monitoring: Replace analyte injection with running buffer flow for 5-30 minutes to monitor complex dissociation. This phase provides critical information about interaction stability [8].
7. Surface Regeneration: Apply a brief (30-60 second) pulse of regeneration solution (e.g., glycine pH 2.0-3.0, high salt) to remove bound analyte without damaging the immobilized ligand. Validate that the surface returns to baseline after regeneration [8] [10].
8. Data Processing and Analysis: Subtract reference cell signals and buffer blank injections to correct for bulk refractive index changes and nonspecific binding. Fit processed sensorgrams to appropriate binding models (e.g., 1:1 Langmuir) to calculate kinetic and equilibrium constants [8] [10].
Essential Research Reagents and Materials
Table 3: Key Research Reagent Solutions for SPR Experiments
| Reagent/Material | Function | Examples/Specifications |
|---|---|---|
| Sensor Chips | Platform for ligand immobilization | CM5 (dextran), NTA (His-tag capture), SA (streptavidin), Protein A (antibody capture) [10] |
| Coupling Reagents | Covalent ligand immobilization | NHS/EDC mixture for amine coupling [10] |
| Running Buffers | Maintain physiological conditions during analysis | HEPES, PBS, Tris; pH 7.0-7.4, often with 150 mM NaCl [10] |
| Regeneration Solutions | Remove bound analyte between cycles | Glycine pH 2.0-3.0, 10-100 mM NaOH, high salt (2 M NaCl) [10] |
| Ligand Molecules | Immobilized binding partner | Antibodies, receptors, antigens, DNA - typically >90% pure [8] [10] |
| Analyte Samples | Mobile binding partner | Small molecules, proteins, antibodies - serial dilutions in running buffer [8] |
Applications in Biotherapeutic Development
SPR technology has become indispensable throughout the biotherapeutic development pipeline, with several critical applications:
Antibody Characterization and Engineering: SPR provides comprehensive kinetic profiling of therapeutic candidates, enabling selection based on both affinity and residence time. It facilitates epitope binning and mapping, identifying candidates with distinct binding regions for potential combination therapies [8].
Immunogenicity Assessment: SPR's superior detection of anti-drug antibodies (ADA), particularly low-affinity and drug-tolerant populations, provides enhanced safety monitoring [4]. In a clinical study of infliximab-treated patients, SPR detected ADA in 37% of patients compared to 18% by ELISA, with SPR identifying ADA in patients possessing circulating drug that would typically interfere with ELISA detection [4].
Biosimilarity Assessment: Comprehensive binding characterization against multiple target forms and epitopes provides robust evidence for biosimilarity assessments, surpassing the capabilities of ELISA [1].
Small Molecule Screening: Despite historical challenges with small molecule detection due to minimal mass change, advanced SPR systems now enable fragment-based drug discovery, characterizing compounds with molecular weights <200 Da through careful experimental design [10].
Surface plasmon resonance represents a significant advancement in biomolecular interaction analysis, offering real-time, label-free detection with comprehensive kinetic profiling capabilities that extend beyond the limitations of traditional ELISA. While ELISA remains valuable for high-throughput screening applications where cost-effectiveness and accessibility are priorities, SPR provides superior analytical depth for characterizing interaction mechanisms, detecting low-affinity binders, and obtaining accurate affinity measurements [1] [4] [5].
The complementary use of both technologies—with SPR guiding ELISA protocol optimization and validating critical findings—represents an optimal strategy for modern drug development pipelines [5]. As SPR technology continues to evolve through miniaturization, multiplexing, and enhanced sensitivity, its role in basic research and translational applications will undoubtedly expand, further solidifying its position as an essential tool for researchers and drug development professionals seeking to understand the complexities of molecular interactions [8] [11] [9].
The Enzyme-Linked Immunosorbent Assay (ELISA) represents one of the most widely utilized immunoassay techniques in research and diagnostic laboratories worldwide. First developed in the 1970s, this plate-based assay technique has become indispensable for detecting and quantifying soluble substances such as peptides, proteins, antibodies, and hormones [12]. ELISA operates on the fundamental principle of antigen-antibody recognition, where an enzymatic reaction amplifies the signal to produce a measurable output [13]. The technique's versatility, sensitivity, and specificity have cemented its status as a gold standard in various applications, from clinical diagnostics to drug development.
In the context of modern analytical techniques, ELISA is increasingly compared with advanced label-free methods such as Surface Plasmon Resonance (SPR). While SPR provides real-time kinetic data and eliminates the need for labeling, ELISA remains a fundamental tool in most laboratories due to its accessibility, cost-effectiveness, and well-established protocols [1]. Understanding the various ELISA formats is crucial for researchers and drug development professionals to select the most appropriate method for their specific applications and to contextualize data within the evolving landscape of biomolecular interaction analysis.
Fundamental Principles of ELISA
At its core, ELISA relies on the specific binding between an antigen and its corresponding antibody, with the detection achieved through an enzyme-linked conjugate that produces a measurable signal upon substrate addition [12]. The key components essential for any ELISA include: a solid phase (typically a 96-well microplate), a capture molecule (antigen or antibody), a detection antibody (often enzyme-conjugated), a substrate that produces a colorimetric, chemiluminescent, or fluorescent signal, and buffers for washing and stopping the reaction [12] [13].
The most common enzymes used for labeling are Horseradish Peroxidase (HRP) and Alkaline Phosphatase (AP), which react with specific substrates to produce detectable signals [12] [13]. The intensity of the signal generated is measured spectrophotometrically and is proportional to the amount of analyte present in the sample, allowing for quantification against a standard curve [12].
The Four Main ELISA Formats
Direct ELISA
Direct ELISA is the simplest format, employing a single enzyme-labeled primary antibody that binds directly to the target antigen immobilized on the plate surface [14] [15]. This method involves fewer steps and reagents, making it time-efficient and reducing potential background noise from secondary antibody cross-reactivity [13].
Experimental Protocol:
- Coating: Immobilize the antigen directly onto the microplate wells by incubating with an antigen solution (2-10 μg/mL in carbonate-bicarbonate buffer, pH 9.4) for several hours at 37°C or overnight at 4°C [13].
- Washing: Wash the plate with phosphate-buffered saline containing Tween 20 (PBST) to remove unbound antigens.
- Blocking: Add blocking buffer (typically 1-5% BSA or non-fat dry milk in PBST) to cover any remaining protein-binding sites on the plastic surface [13].
- Detection: Incubate with enzyme-conjugated primary antibody specific to the target antigen.
- Washing: Remove unbound antibodies through repeated washing.
- Signal Development: Add enzyme substrate (e.g., TMB for HRP) to produce a color change.
- Stop Reaction: Add stop solution (e.g., 2N H₂SO₄ for HRP-TMB system) [12].
- Reading: Measure absorbance at appropriate wavelength (e.g., 450 nm for TMB) using a microplate reader [12].
Indirect ELISA
Indirect ELISA utilizes two antibodies: an unlabeled primary antibody that binds the antigen, and an enzyme-labeled secondary antibody that recognizes the primary antibody [14] [15]. This format provides signal amplification since multiple secondary antibodies can bind to a single primary antibody, enhancing sensitivity [13].
Experimental Protocol:
- Coating: Immobilize antigen to the plate as in direct ELISA.
- Blocking: Add blocking buffer to prevent non-specific binding.
- Primary Antibody Incubation: Add specific unlabeled primary antibody.
- Washing: Remove unbound primary antibody.
- Secondary Antibody Incubation: Add enzyme-conjugated secondary antibody specific to the host species of the primary antibody.
- Washing: Remove unbound secondary antibody.
- Signal Detection and Reading: Proceed with substrate addition, stop solution, and reading as in direct ELISA.
The indirect format offers greater flexibility as the same labeled secondary antibody can be used with various primary antibodies from the same species, making it more cost-effective for laboratories screening multiple antigens [15] [13].
Sandwich ELISA
Sandwich ELISA is one of the most sensitive and specific formats, particularly suitable for complex samples [16] [15]. It requires two antibodies that recognize different epitopes on the target antigen: a capture antibody immobilized on the plate and a detection antibody that completes the "sandwich" [16]. This format is especially valuable for detecting antigens in complex biological fluids like serum or plasma where high sensitivity is required [16].
Experimental Protocol:
- Capture Antibody Coating: Immobilize capture antibody specific to the target antigen onto microplate wells.
- Blocking: Add blocking buffer to prevent non-specific binding.
- Sample Incubation: Add sample containing the target antigen.
- Washing: Remove unbound antigens.
- Detection Antibody Incubation: Add specific detection antibody (enzyme-labeled or followed by enzyme-labeled secondary antibody).
- Washing: Remove unbound detection antibodies.
- Signal Detection and Reading: Proceed with substrate addition, stop solution, and reading.
The critical requirement for sandwich ELISA is that the capture and detection antibodies must recognize different, non-overlapping epitopes on the target antigen to avoid competition [16] [15]. This format is particularly suitable for complex samples but requires more optimization than other formats [13].
Competitive ELISA
Competitive ELISA, also known as inhibition ELISA, operates on the principle of competition between sample antigen and a reference antigen for a limited number of antibody binding sites [14] [15]. The signal generated is inversely proportional to the amount of antigen present in the sample [15]. This format is particularly useful for detecting small antigens with single epitopes that cannot accommodate two antibodies simultaneously [16] [15].
Experimental Protocol:
- Antibody Incubation: Incubate primary antibody with sample containing unknown antigen concentration.
- Mixture Transfer: Transfer the antigen-antibody mixture to a microplate well coated with a known amount of reference antigen.
- Incubation: Allow free antibodies from the mixture to bind to the immobilized reference antigen.
- Washing: Remove unbound components, including antigen-antibody complexes formed with sample antigen.
- Detection: Add enzyme-labeled secondary antibody (if primary is unlabeled).
- Washing: Remove unbound secondary antibody.
- Signal Detection and Reading: Proceed with substrate addition, stop solution, and reading.
In this format, higher antigen concentration in the sample results in more antibody being bound in solution and less available to bind the plate, yielding a weaker signal [14]. Competitive ELISA is highly sensitive for small molecules and useful for detecting inhibitors, drugs, hormones, and contaminants [15].
Comparative Analysis of ELISA Formats
Table 1: Advantages and Disadvantages of Different ELISA Formats
| Format | Advantages | Disadvantages | Typical Applications |
|---|---|---|---|
| Direct ELISA | Simple, quick procedure; Fewer steps; No cross-reactivity from secondary antibody [15] [13] | Lower sensitivity; Limited signal amplification; Primary antibody must be labeled [15] [13] | Screening antigens; Rapid diagnostic tests [15] |
| Indirect ELISA | Signal amplification; High sensitivity; Wide variety of labeled secondary antibodies available; Versatile [15] [13] | Cross-reactivity possible; Additional incubation step required [15] [13] | Antibody detection; Serological surveys; Antibody titration [15] |
| Sandwich ELISA | High sensitivity and specificity; Suitable for complex samples; Less non-specific binding [16] [15] [13] | Requires two specific antibodies; Technically demanding; More costly [15] [13] | Biomarker detection; Cytokine quantification; Clinical diagnostics [15] |
| Competitive ELISA | Best for small antigens; High sensitivity; Flexible format [15] | Complex protocol; Requires careful optimization; Lower sensitivity for some applications [15] | Small molecule detection; Drug monitoring; Environmental contaminants [15] |
Table 2: Key Characteristics of ELISA Formats
| Characteristic | Direct ELISA | Indirect ELISA | Sandwich ELISA | Competitive ELISA |
|---|---|---|---|---|
| Time Required | Shortest | Moderate | Longest | Moderate to Long |
| Sensitivity | Low | High | Highest | High (for small molecules) |
| Specificity | Moderate | Moderate | High | High |
| Antibody Requirements | Labeled primary antibody | Unlabeled primary + labeled secondary | Capture + detection antibodies | Primary + reference antigen |
| Cost | Low | Moderate | High | Moderate to High |
| Sample Complexity | Low tolerance | Moderate tolerance | High tolerance | Moderate tolerance |
| Signal Amplification | No | Yes | Yes | Variable |
ELISA in the Context of Surface Plasmon Resonance (SPR) Research
While ELISA remains a cornerstone technique in biomolecular detection, Surface Plasmon Resonance (SPR) has emerged as a powerful alternative that addresses several limitations of traditional immunoassays. SPR is an optical, label-free technique that enables real-time monitoring of biomolecular interactions without the need for enzymatic detection systems [1] [7]. Unlike ELISA, which provides endpoint measurements, SPR delivers comprehensive kinetic data, including association rates (kₒₙ), dissociation rates (kₒff), and equilibrium dissociation constants (K_D) [3].
The most significant advantage of SPR in the context of ELISA formats is its ability to characterize low-affinity interactions that might be lost during ELISA's multiple washing steps [1] [7]. Studies have demonstrated SPR's superior sensitivity in detecting low-affinity anti-drug antibodies, with one study reporting SPR identified 4.1% positive patients compared to only 0.3% by ELISA [7]. This capability is particularly valuable in therapeutic antibody monitoring where low-affinity antibodies may indicate early stages of immune response [7].
However, ELISA maintains advantages in accessibility, cost-effectiveness, and established infrastructure in most laboratories [1]. While SPR systems typically have higher upfront costs and require more specialized training, ELISA remains a highly cost-effective and accessible analytical tool [1]. The choice between these techniques ultimately depends on the research question, required data depth, and available resources.
The Scientist's Toolkit: Essential Reagents and Materials
Table 3: Essential Research Reagent Solutions for ELISA
| Reagent/Material | Function | Examples/Specifications |
|---|---|---|
| Microplates | Solid phase for immobilization | 96-well or 384-well polystyrene plates; protein binding capacity >400 ng/cm²; clear for colorimetric, black/white for fluorescent detection [13] |
| Coating Buffers | Immobilize antigen/antibody | Carbonate-bicarbonate buffer (pH 9.4); Phosphate-buffered saline (PBS, pH 7.4) [13] |
| Blocking Buffers | Prevent non-specific binding | 1-5% BSA; Non-fat dry milk; Casein in PBST [13] |
| Detection Antibodies | Bind target with enzymatic label | HRP or AP-conjugated primary or secondary antibodies; concentration typically 1-10 μg/mL [12] |
| Wash Buffers | Remove unbound components | PBS with 0.05% Tween 20 (PBST) [12] |
| Substrates | Generate detectable signal | TMB (colorimetric for HRP); pNPP (for AP); Chemiluminescent substrates [12] [13] |
| Stop Solutions | Terminate enzymatic reaction | 2N H₂SO₄ (for TMB); 2N NaOH (for some substrates) [12] |
| Microplate Reader | Measure signal output | Spectrophotometer (colorimetric); Fluorometer (fluorescence); Luminometer (chemiluminescence) [12] |
The diverse formats of ELISA—direct, indirect, sandwich, and competitive—provide researchers with a versatile toolkit for biomolecular detection and quantification. Each format offers distinct advantages and limitations, making them suitable for different applications and experimental requirements. While newer technologies like SPR offer compelling advantages for kinetic studies and low-affinity interactions, ELISA remains an indispensable technique in research and diagnostic laboratories worldwide due to its reliability, sensitivity, and accessibility. Understanding the principles, protocols, and comparative strengths of each ELISA format enables scientists to select the most appropriate method for their specific research needs and to contextualize their findings within the broader landscape of biomolecular interaction analysis.
Surface Plasmon Resonance (SPR) is a powerful, label-free optical technique used to study biomolecular interactions in real time. Its fundamental operation relies on detecting changes in the refractive index at the surface of a sensor chip, which occur when molecules bind to or dissociate from this surface [1]. When polarized light strikes a metal film (typically gold) under total internal reflection conditions, it generates surface plasmons—collective oscillations of electrons at the metal-dielectric interface. The angle at which this resonance occurs is extremely sensitive to changes in the mass concentration of molecules on the sensor surface, measured as a change in the local refractive index [1]. This physical principle allows SPR to monitor binding events as they happen, providing detailed information on affinity, kinetics, and concentration of interacting molecules without requiring fluorescent or radioactive labels.
In contrast, Enzyme-Linked Immunosorbent Assay (ELISA) is a traditional endpoint assay that relies on enzyme-linked antibodies to generate a colored signal for detection [1]. As a plate-based technique, ELISA involves multiple incubation and washing steps, making it more labor-intensive and susceptible to missing transient or low-affinity interactions due to the extended time between binding and measurement [4]. The core distinction lies in SPR's ability to provide real-time kinetic data through direct physical measurement, while ELISA offers an indirect, endpoint measurement of concentration.
The Refractive Index in SPR Sensing
The refractive index (RI) is the key optical property measured in SPR biosensing. It determines how light propagates through a medium and is highly sensitive to changes in molecular composition and concentration at the sensor surface. In an SPR experiment, when a biomolecule (the "analyte" in solution) binds to its partner (the "ligand" immobilized on the sensor chip), the local mass on the surface increases, causing a proportional increase in the local refractive index [1]. This shift alters the resonance angle or wavelength required to excite the surface plasmons.
Advanced SPR systems leverage this principle with high precision. For instance, phase-sensitive SPR imaging with polarization modulation and Stokes vector measurement has been shown to achieve a refractive index sensitivity of 1.80 × 10⁻⁷ RIU [17]. This exceptional sensitivity enables the detection of minute interactions, such as those involving small molecules or low-abundance proteins. Furthermore, novel photonic crystal biosensors with coupled resonators are being developed to allow simultaneous measurement of the refractive index and its changes in real-time, enhancing the precision of analyte characterization [18]. The relationship between surface mass and refractive index change is direct, allowing researchers to quantify binding events without labels.
SPR versus ELISA: A Technical Comparison
The choice between SPR and ELISA involves trade-offs between data richness, time, cost, and application needs. The following table summarizes the critical technical differences between these two methodologies.
Table 1: Technical Comparison of SPR and ELISA
| Parameter | Surface Plasmon Resonance (SPR) | Enzyme-Linked Immunosorbent Assay (ELISA) |
|---|---|---|
| Detection Principle | Label-free; measures change in refractive index [1] | Enzyme-based colorimetric (or other) signal; requires labels [1] |
| Data Output | Real-time binding curves; provides affinity (KD), association (kon), and dissociation (koff) rate constants [1] | End-point measurement; provides concentration only [1] |
| Assay Time | Minutes to hours; significantly faster due to real-time measurement and automation [1] | Often more than a day due to multiple incubation and washing steps [1] |
| Label Requirement | None; direct detection [1] | Required (e.g., enzyme-linked antibody); can cause steric hindrance [1] |
| Sensitivity to Low-Affinity Interactions | High; real-time monitoring captures fast-dissociating interactions [1] [4] | Low; multiple wash steps remove low-affinity binders, leading to potential false negatives [1] [4] |
| Kinetic Analysis | Direct measurement of binding kinetics in real-time [1] [6] | Indirect inference; no direct kinetic data [1] |
| Throughput | Moderate to High (modern systems with multiple flow cells or array spots) [6] | High (standard 96 or 384-well plate formats) |
| Cost & Accessibility | Higher initial instrument cost; requires specific training [1] | Lower cost; widely accessible and standardized [1] |
A critical application highlighting these differences is the detection of anti-drug antibodies (ADAs). A 2021 study comparing SPR and ELISA for detecting anti-infliximab antibodies found that ELISA failed to detect ADAs in a significant number of patient samples that were positive by SPR [4]. The ADAs that were detectable only by SPR had significantly faster dissociation rate constants, meaning they dissociated too quickly to survive the multiple washing steps in an ELISA protocol [4]. In some cases, ADA concentrations measured by SPR were 7 to 490 times higher than those obtained by ELISA, demonstrating a substantial underestimation by the endpoint method [4].
Experimental Protocols and Methodologies
General SPR Experimental Workflow
A typical SPR experiment follows a structured workflow to capture quantitative binding data. The following diagram illustrates the key steps, from sensor preparation to data analysis.
Diagram 1: SPR Experimental Workflow
The core steps in the workflow are:
- Sensor Chip Preparation: A gold-coated sensor chip is functionalized to create a chemically active surface. Common strategies include forming a self-assembled monolayer (SAM) of carboxylated alkanethiols (e.g., 11-mercaptoundecanoic acid) [19].
- Ligand Immobilization: The molecule to be studied (the ligand, e.g., an antibody or antigen) is covalently attached to the sensor surface. Different coupling chemistries can be employed (see Section 4.2).
- Baseline Stabilization: A running buffer is passed over the sensor surface to establish a stable baseline signal.
- Analyte Injection (Association Phase): The binding partner (the analyte) is injected over the surface. Binding causes an increase in the SPR signal (Response Units, RU).
- Buffer Flow (Dissociation Phase): The flow is switched back to buffer, allowing the bound complex to dissociate, which causes a decrease in the SPR signal.
- Surface Regeneration: A mild acidic or basic solution is injected to remove all bound analyte without denaturing the immobilized ligand, preparing the surface for a new cycle.
- Data Analysis: The resulting sensorgram (a plot of RU vs. time) is fitted to mathematical models to extract kinetic and affinity constants (kon, koff, and KD).
Key Immobilization Chemistries
The method used to immobilize the ligand is critical for maintaining its activity and enabling efficient analyte binding. A recent study on an electrochemical SPR biosensor for α-fetoprotein (AFP) detection systematically compared three coupling strategies [19]:
- EDC/NHS Chemistry: Activates surface carboxyl groups to form reactive esters for direct coupling to primary amines on the ligand. This method offered the widest linear detection range (5–70 ng/ml) [19].
- EDA/Glutaraldehyde (EDA/GA) Chemistry: First introduces amine groups to the surface using ethylene diamine (EDA), followed by cross-linking with glutaraldehyde. This strategy afforded the highest sensitivity (28°/(ng/ml)) [19].
- PANI/Glutaraldehyde (PANI/GA) Chemistry: Uses an electrochemically deposited layer of polyaniline (PANI) as a base for glutaraldehyde-mediated coupling.
General ELISA Protocol
For comparison, a standard sandwich ELISA protocol involves [1]:
- Coating a microplate with a capture antibody.
- Blocking the plate to prevent non-specific binding.
- Adding the analyte sample and incubating.
- Washing to remove unbound material.
- Adding a detection antibody (enzyme-conjugated) and incubating.
- Washing again to remove unbound detection antibody.
- Adding a substrate solution for the enzyme, leading to a color change.
- Stopping the reaction and measuring the absorbance with a plate reader.
The Scientist's Toolkit: Essential Research Reagents
Successful SPR experiments depend on specialized reagents and materials. The following table details key components of an SPR research toolkit.
Table 2: Essential Reagents and Materials for SPR Research
| Item | Function | Example Application |
|---|---|---|
| Gold Sensor Chip | The core sensing surface that supports the generation of surface plasmons. | The foundational substrate for all SPR measurements [19]. |
| Carboxylated Alkanethiol (e.g., 11-Mercaptoundecanoic acid) | Forms a self-assembled monolayer (SAM) on the gold surface, presenting carboxyl groups for ligand immobilization [19]. | Creating a functionalized surface for EDC/NHS chemistry [19]. |
| Coupling Reagents (EDC, NHS) | Activates carboxyl groups on the SAM for covalent attachment to amine-containing ligands [19]. | Immobilizing antibodies or proteins via primary amines [1] [19]. |
| Cross-linkers (e.g., Glutaraldehyde) | Provides a bridge between surface amines and amine-containing ligands [19]. | Used in EDA/GA and PANI/GA immobilization strategies [19]. |
| Regeneration Solution (e.g., 10-100 mM HCl, Glycine pH 2.0-3.0) | Dissociates bound analyte from the immobilized ligand without permanently damaging the ligand's binding activity. | Prepping the sensor surface for a new analyte injection cycle [19]. |
| HBS-EP Buffer (HEPES Buffered Saline with EDTA and Polysorbate) | A common running buffer that provides a stable ionic strength and pH, while reducing non-specific binding. | Used as the baseline buffer and for diluting analytes in many SPR assays [1]. |
Advanced SPR Technologies and Future Directions
SPR technology continues to evolve, with recent advancements pushing the boundaries of sensitivity and throughput. Phase-sensitive SPR imaging (P-SPR) techniques, which measure the phase shift of reflected light, offer superior sensitivity compared to conventional intensity-based SPR. One such system using polarization modulation and full Stokes vector analysis has achieved a phase sensitivity of 1.80 × 10⁻⁷ RIU, enabling kinetic, label-free detection and quantification of biomolecular interactions with exceptional precision [17].
Another significant innovation is the Sensor-Integrated Proteome on Chip (SPOC) technology. This next-generation platform combines high-density, cell-free protein synthesis directly on the SPR biosensor with real-time detection [6]. SPOC leverages in vitro transcription and translation (IVTT) to produce protein arrays, which are then screened for interactions. This integrated approach allows for highly multiplexed screening—up to 864 protein ligand spots in a single run—dramatically increasing throughput for applications in proteomics and drug discovery [6]. The synergy of these advanced optical techniques with novel surface chemistries and automated fluidics ensures that SPR remains at the forefront of analytical technology for biomolecular interaction analysis.
Methodological & Application
Within the fields of drug development and life science research, the accurate characterization of biomolecular interactions is fundamental. For decades, the enzyme-linked immunosorbent assay (ELISA) has been the gold standard for detecting and quantifying proteins, antibodies, and other biomolecules, prized for its high sensitivity, specificity, and accessibility [1]. However, the increasing complexity of scientific questions necessitates tools that provide more detailed interaction data. Surface plasmon resonance (SPR) has emerged as a powerful, label-free technology that enables real-time observation of binding events [1] [20]. This guide provides an in-depth, technical comparison of the typical workflows for SPR and ELISA, framing them within the broader principle of obtaining reliable and informative biomolecular interaction data.
Core Principles at a Glance
Understanding the fundamental principles of each technique is crucial for appreciating their respective workflows and data outputs.
ELISA (Enzyme-Linked Immunosorbent Assay): An endpoint assay that relies on the specific binding of an antibody to its target antigen, which is immobilized on a plate surface. Detection is achieved through an enzyme-linked antibody that produces a measurable colorimetric, fluorescent, or chemiluminescent signal upon adding a substrate. The signal intensity is proportional to the amount of bound analyte [1] [21].
SPR (Surface Plasmon Resonance): An optical, label-free technique that measures biomolecular interactions in real time. It detects changes in the refractive index on a sensor surface as molecules bind to or dissociate from their immobilized partners. This results in a continuous readout called a sensorgram, which provides detailed information on binding affinity and kinetics [1] [7].
Step-by-Step Workflow Comparison
The following workflows delineate the procedural and temporal distinctions between the two techniques, from experimental setup to data analysis.
ELISA Workflow
The traditional ELISA is a multi-step, heterogeneous process that can take over a day to complete and requires multiple manual handling and washing steps [1] [7].
SPR Workflow
SPR is a streamlined, automated process that can be completed in minutes to hours, providing real-time data throughout the experiment [1] [7].
Comparative Data and Technical Specifications
Workflow and Data Output Comparison
Table 1: A direct comparison of key parameters between ELISA and SPR.
| Parameter | ELISA | SPR |
|---|---|---|
| Assay Type | End-point [1] | Real-time, label-free [1] [7] |
| Data Obtained | Total analyte concentration (Affinity only) [1] | Affinity (KD) & Kinetics (kon, koff) [1] [5] |
| Label Required | Yes (enzyme, fluorophore) [1] | No [1] [7] |
| Typical Experiment Duration | > 8 hours (often 1-2 days) [1] [7] | Minutes to a few hours [1] [7] |
| Hands-On Time | High (multiple manual steps) [1] | Low (highly automated) [1] |
| Detection of Low-Affinity Interactions | Poor (washed away) [1] [7] | Excellent (monitored in real-time) [1] [7] |
| Throughput | High (96-well plate) | Moderate to High (multi-channel systems) [1] |
| Sample Consumption | Moderate to High (microliters) | Low (nanoliters) [1] |
Case Study: Discrepancy in Affinity Measurement
A comparative study of alpaca antibody clones highlights the potential for ELISA to significantly underestimate binding affinity if equilibrium is not reached. SPR-derived kinetics are essential for determining the required incubation time (tequil) for accurate ELISA measurements [5].
Table 2: Measured KD values for two alpaca antibody clones (R4 and R9) via SPR and ELISA, demonstrating the underestimation of affinity by ELISA when equilibrium is not achieved [5].
| Clone | SPR KD (M) | ELISA KD (M) | Fold Difference (ELISA/SPR) | SPR-Derived tequil |
|---|---|---|---|---|
| R4 | 2.32 x 10⁻⁹ | 1.01 x 10⁻⁷ | 43.7 | 5.34 hours |
| R9 | 2.69 x 10⁻⁹ | 3.78 x 10⁻⁸ | 14.1 | 2.29 hours |
The Scientist's Toolkit: Essential Reagents and Materials
Research Reagent Solutions
Table 3: Key reagents and materials required for ELISA and SPR experiments.
| Item | Function in Assay |
|---|---|
| ELISA-Specific Reagents | |
| 96- or 384-well microplate | Solid surface for antigen immobilization and assay execution [1]. |
| Capture Antibody or Antigen | Binds and immobilizes the target molecule to the plate [1] [21]. |
| Detection Antibody (primary) | Binds specifically to the immobilized target; may be conjugated for direct detection. |
| Enzyme-linked Secondary Antibody | Binds to the primary antibody; conjugated enzyme (e.g., HRP) catalyzes signal generation [1]. |
| Enzyme Substrate (e.g., TMB) | Converted by the enzyme to a colored, fluorescent, or luminescent product for detection [1]. |
| Blocking Buffer (e.g., BSA) | Covers unused binding sites on the plate to minimize nonspecific background signal [1]. |
| SPR-Specific Reagents | |
| Sensor Chip | Glass chip with a thin gold film that serves as the biosensing surface [1]. |
| Carboxymethyl dextran (CMD) matrix | A common hydrogel on sensor chips that provides a hydrophilic environment for ligand immobilization [1]. |
| Immobilization Chemicals (e.g., EDC/NHS) | Activate carboxyl groups on the sensor surface for covalent coupling of ligands [1]. |
| Running Buffer | Stable buffer used as the continuous liquid phase during analyte injection [1]. |
| Regeneration Solution (e.g., mild acid/low pH) | Removes bound analyte without damaging the immobilized ligand, allowing chip re-use [1]. |
Detailed Experimental Protocols
Protocol for a Sandwich ELISA
The following protocol for a sandwich ELISA, the most common format, is adapted from standard laboratory practices [1] [21].
- Coating: Dilute the capture antibody in a coating buffer (e.g., carbonate-bicarbonate buffer, pH 9.6). Add the solution to a microplate and incubate for several hours at room temperature or overnight at 4°C.
- Washing and Blocking: Aspirate the coating solution and wash the plate 3-5 times with a wash buffer containing a mild detergent (e.g., PBS with 0.05% Tween 20). Add a blocking buffer (e.g., 1-5% BSA in PBS) to all wells and incubate for 1-2 hours at room temperature to block nonspecific sites.
- Sample and Standard Incubation: Wash the plate as before. Add the sample (e.g., serum, cell supernatant) and a dilution series of the standard of known concentration to the wells. Incubate for 1-2 hours at room temperature to allow the target antigen to bind the capture antibody.
- Detection Antibody Incubation: Wash the plate to remove unbound antigen. Add the detection antibody (biotinylated or directly enzyme-conjugated) and incubate for 1-2 hours.
- Secondary Reporter Incubation (if needed): Wash the plate. If a biotinylated detection antibody is used, add a streptavidin-enzyme conjugate (e.g., Streptavidin-HRP) and incubate for 30-60 minutes.
- Final Wash and Signal Development: Perform a final wash. Add the appropriate enzyme substrate (e.g., TMB for HRP) and incubate in the dark for 5-30 minutes until color develops.
- Signal Detection: Stop the reaction by adding a stop solution (e.g., sulfuric acid for TMB). Immediately read the absorbance of each well using a microplate reader at the appropriate wavelength.
Protocol for a Kinetic SPR Assay
This protocol outlines a standard cycle for characterizing the kinetics of a biomolecular interaction using SPR [1].
- Ligand Immobilization: The ligand (e.g., an antibody or receptor) is covalently immobilized onto the dextran matrix of a sensor chip. This is typically achieved using amine-coupling chemistry: the surface is activated with a mixture of EDC (1-ethyl-3-(3-dimethylaminopropyl)carbodiimide) and NHS (N-hydroxysuccinimide), followed by injection of the ligand and then deactivation of excess reactive groups.
- Establishing a Stable Baseline: The instrument is perfused with a continuous flow of running buffer until a stable baseline is achieved, reflecting the refractive index of the buffer alone.
- Analyte Association: The analyte (e.g., antigen or drug candidate) is injected over the ligand surface for a set period (typically 1-5 minutes). Binding events are recorded in real-time as an increase in Resonance Units (RU), defining the association phase.
- Analyte Dissociation: The flow is switched back to running buffer. The decrease in RU is monitored as the analyte dissociates from the ligand, defining the dissociation phase.
- Surface Regeneration: A brief injection of a regeneration solution (e.g., 10 mM glycine, pH 2.0) is used to break the ligand-analyte bonds without denaturing the immobilized ligand, returning the signal to baseline and preparing the surface for the next analyte injection.
- Data Analysis: A series of sensorgrams at different analyte concentrations are globally fitted to an appropriate interaction model (e.g., 1:1 Langmuir binding) using the instrument's software to calculate the association rate (kon), dissociation rate (koff), and equilibrium dissociation constant (KD = koff/kon).
Both ELISA and SPR are powerful techniques for biomolecular detection, yet they serve distinct purposes. ELISA remains a robust, high-throughput, and cost-effective method for quantifying analyte concentration, making it ideal for diagnostic screening and routine measurements. In contrast, SPR provides a comprehensive kinetic profile of interactions in a label-free, real-time, and automated format, making it indispensable for fundamental research, characterization of therapeutic candidates, and the study of transient or low-affinity interactions. The choice between them should be guided by the specific research question: ELISA answers "how much is there?" while SPR answers "how do they interact?". For the most rigorous work, SPR can also be employed to validate and optimize ELISA protocols, ensuring that incubation times are sufficient to reach equilibrium and yield accurate affinity data [5].
Within the comprehensive landscape of biomolecular interaction analysis, the Enzyme-Linked Immunosorbent Assay (ELISA) remains a cornerstone technique for specific applications despite the emergence of advanced technologies like Surface Plasmon Resonance (SPR). This whitepaper delineates the ideal use cases for ELISA, focusing on its unrivaled capacity for target quantification and high-throughput screening. We provide a detailed technical examination of ELISA methodologies, supported by experimental data and protocols, to guide researchers and drug development professionals in leveraging this robust technology within a modern analytical toolkit that also includes powerful label-free techniques like SPR.
As an established immunological assay, ELISA detects antigen-antibody interactions through enzyme-labelled conjugates and chromogenic substrates, producing a measurable color change [12]. For decades, ELISA has been "repeatedly recognized as the gold standard for detecting antibodies, proteins, and other biomolecules" across research and clinical applications [1]. Its resilience in the modern laboratory stems from an optimal combination of high sensitivity, specificity, and accessibility [1] [13].
In contrast, Surface Plasmon Resonance (SPR) represents a more recent optical detection technology that characterizes biomolecular interactions in real-time without labels by measuring changes in the refractive index at a sensor surface [1] [22]. While SPR provides superior kinetic information and avoids potential pitfalls with low-affinity interactions [4] [5], ELISA maintains distinct advantages for applications requiring quantitative endpoint measurements and parallel processing of vast sample numbers. This guide explores the technical foundation and ideal implementation of ELISA within this complementary framework.
Technical Foundations and Core Principles of ELISA
Fundamental Methodology
The core ELISA workflow involves immobilizing a target biomolecule (antigen) to a solid polystyrene microplate surface, then complexing it with an antigen-specific antibody linked to a reporter enzyme [1] [13]. The key components essential for any ELISA protocol include:
- Solid Phase: Typically 96-well or 384-well microplates that passively bind antibodies and proteins [12] [13].
- Coating/Capture: Direct or indirect immobilization of antigens to the microplate wells [13].
- Blocking: Addition of irrelevant protein to cover all unsaturated surface-binding sites to prevent nonspecific binding [13].
- Probing/Detection: Incubation with enzyme-conjugated antibodies specific to the target [12].
- Signal Measurement: Detection of signal generated via enzyme-substrate reaction, typically using chromogenic substrates like TMB (3,3',5,5'-Tetramethylbenzidine) [12] [23].
Key ELISA Formats and Selection Criteria
The versatility of ELISA is manifested through several standardized formats, each with distinct advantages:
- Direct ELISA: Uses a single, labeled primary antibody for detection. It is rapid but offers minimal signal amplification [13].
- Indirect ELISA: Uses a labeled secondary antibody for detection, providing signal amplification and greater versatility [13].
- Sandwich ELISA: The "most widely used ELISA assay format" [13]. It employs two antibodies binding distinct epitopes of the target antigen, delivering exceptional specificity and sensitivity, making it ideal for complex samples [23] [13].
- Competitive ELISA: Used for detecting small antigens with single epitopes. The sample antigen competes with a labeled reference for antibody binding, with signal interference indicating concentration [13].
The following diagram illustrates the workflows for two common ELISA formats:
Ideal Application 1: Target Quantification in Complex Biological Fluids
ELISA excels in the precise quantification of peptides, proteins, antibodies, and hormones within diverse biological matrices, a capability central to both research and diagnostic contexts.
Technical Capabilities and Performance
The power of ELISA for quantification stems from its robust standard curve-based approach. Following the enzyme-substrate reaction, the intensity of the color produced is measured spectrophotometrically, typically at 450 nm [12]. The relationship between optical density and analyte concentration is direct in formats like sandwich ELISA, allowing for precise quantification against a serial dilution standard curve [12] [13].
ELISA is validated for use with a wide range of biological fluids, including serum, plasma, saliva, urine, milk, cerebrospinal fluid (CSF), and cell culture supernatant [12] [23]. This makes it indispensable for clinical diagnostics and bioanalysis where measuring specific biomarkers in complex samples is required.
Experimental Protocol for Protein Quantification
Protocol: Sandwich ELISA for Quantifying Human IgG in Serum [23]
Materials:
- Pre-coated 96-well microplate with anti-human IgG capture antibody.
- Human serum samples (diluted as optimized).
- Human IgG standards (7-point dilution series).
- Enzyme-conjugated detection antibody (e.g., HRP-anti-human IgG).
- Wash Buffer (e.g., PBS with Tween-20).
- TMB Substrate Solution.
- Stop Solution (e.g., 1M H₂SO₄ or HCl).
- Microplate reader capable of 450 nm absorbance.
Methodology:
- Preparation: Add 100 µL of standards and diluted samples to appropriate wells. Incubate (e.g., 1-2 hours at room temperature).
- Washing: Aspirate and wash wells 3-4 times with Wash Buffer.
- Detection: Add 100 µL of HRP-conjugated detection antibody. Incubate (e.g., 1 hour).
- Washing: Repeat wash step as above.
- Signal Development: Add 100 µL of TMB substrate. Incubate in the dark for precisely 15-30 minutes.
- Stopping: Add 50 µL Stop Solution. The blue color will turn yellow.
- Reading: Measure absorbance at 450 nm within 30 minutes.
- Analysis: Generate a standard curve (log concentration vs. absorbance) and interpolate sample concentrations.
Ideal Application 2: High-Throughput Screening (HTS)
The microplate format intrinsic to ELISA makes it exceptionally amenable to automation and miniaturization, positioning it as a premier technique for HTS campaigns in drug discovery and biomarker validation.
Advancements in Throughput and Efficiency
Traditional ELISA protocols have been streamlined to meet modern throughput demands. A key innovation is the SimpleStep ELISA technology, which reduces a multi-step sandwich ELISA to a 90-minute, single-wash protocol by allowing the simultaneous addition of capture and detection antibodies [23].
Furthermore, miniaturization to the 384-well format allows processing of up to four times more samples using smaller volumes (e.g., 50 µL total volume) in the same timeframe and with equivalent sensitivity [23]. This is critical for applications like pharmacokinetic (PK) studies and large-scale antibody screening [23] [24].
Experimental Protocol for High-Throughput Screening
Protocol: High-Throughput 384-Well SimpleStep ELISA [23]
Materials:
- 384-well SimpleStep ELISA microplate.
- SimpleStep ELISA reagent cocktail (contains capture and detection antibodies).
- Samples and standards prepared in a compatible buffer.
- TMB Substrate.
- Stop Solution.
- High-precision plate reader (e.g., PHERAstar FSX).
Methodology:
- Sample Addition: Add 50 µL of standards or samples to each well of the 384-well plate.
- Antibody Incubation: Add 50 µL of the SimpleStep reagent cocktail to each well. Incubate for 90 minutes with shaking.
- Wash: Perform a single wash step to remove unbound material.
- Signal Development: Add 50 µL of TMB substrate. Incubate for 5-10 minutes.
- Stopping: Add 50 µL Stop Solution.
- Reading: Measure absorbance at 450 nm. A high-precision reader can measure an entire plate in under one second.
- Data Analysis: Use integrated software (e.g., BMG LABTECH's MARS) to automatically generate standard curves and quantify unknown samples.
Comparative Analysis: ELISA vs. SPR in Practice
While this paper focuses on ELISA's strengths, a pragmatic understanding requires a comparative view with SPR. The table below summarizes key distinctions, underscoring the complementary nature of these techniques.
Table 1: Technical Comparison of ELISA and Surface Plasmon Resonance (SPR)
| Parameter | ELISA | SPR |
|---|---|---|
| Data Output | End-point, quantitative concentration [1] | Real-time kinetics (kₐ, kₑ) and affinity (Kᴅ) [1] [22] |
| Label Requirement | Requires enzyme-labeled antibodies and substrates [1] [7] | Label-free; detection via refractive index change [1] [22] |
| Experiment Length | Several hours to a day [1] [7] | Minutes to a few hours [1] [7] |
| Throughput | Very high (96-, 384-well) [23] | Lower throughput, but increasing with multi-channel systems [1] |
| Affinity Range | Best for high-affinity interactions [1] | Effective for both high- and low-affinity interactions [1] [4] |
| Cost & Accessibility | Low operating cost; widely accessible [1] | High initial instrument cost; requires specialized equipment [1] |
The following flowchart provides a decision-making framework for technique selection based on project goals:
A critical example of their complementary use is in immunogenicity testing. A 2021 study comparing ELISA and SPR for detecting anti-drug antibodies (ADA) against infliximab found that while drug concentrations correlated well, SPR detected ADA in 8 additional patients and measured levels 7–490 times higher than ELISA in positive samples [4] [5]. This discrepancy is attributed to ELISA's long incubation and wash steps, which favor the detection of high-affinity antibodies but wash away transient, low-affinity ADA [4] [7]. SPR's real-time monitoring captures these interactions, making it superior for comprehensive immunogenicity assessment, while ELISA remains suitable for high-throughput screening of high-affinity responses.
The Scientist's Toolkit: Essential Reagents and Materials
Successful ELISA development and execution requires careful selection of core components. The following table details key research reagent solutions.
Table 2: Essential Research Reagents and Materials for ELISA
| Item | Function & Importance | Key Considerations |
|---|---|---|
| Microplate | Solid phase for immobilization of capture molecule [13]. | High protein-binding capacity (e.g., >400 ng/cm²); low well-to-well variation (CV <5%); clear for colorimetric, black/white for fluorescent/chemiluminescent detection [13]. |
| Capture & Detection Antibodies | Define the specificity and sensitivity of the sandwich ELISA [13]. | Must be a matched pair recognizing distinct, non-overlapping epitopes; different host species (e.g., mouse IgG capture, rabbit IgG detection) to avoid cross-reactivity [13]. |
| Blocking Buffer | Prevents non-specific binding by saturating unused plastic surface [13]. | Typically 1-5% BSA or casein in a buffered solution; must be optimized for the specific analyte-antibody pair to minimize background [13]. |
| Enzyme Conjugate | Provides the signal-generating capability (e.g., HRP, Alkaline Phosphatase) [12] [13]. | Linked to the detection antibody (direct) or a secondary antibody (indirect); choice affects selection of substrate and assay sensitivity [13]. |
| Chromogenic Substrate | Reacts with the enzyme to produce a measurable color change [12]. | TMB (Tetramethylbenzidine) is common, turning blue upon reaction with HRP and yellow when stopped with acid [12] [23]. |
| Plate Reader | Precisely measures the intensity of the colorimetric signal [12]. | Spectrophotometer capable of reading absorbance at the appropriate wavelength (e.g., 450 nm for TMB) [12] [23]. |
ELISA maintains a vital and distinct role in the contemporary scientific arsenal. Its strengths in robust, quantitative endpoint analysis and scalable, high-throughput screening are unmatched for many applications in diagnostics, drug development, and basic research. Rather than being superseded by label-free technologies like SPR, ELISA exists in a complementary partnership. The informed researcher will leverage SPR for in-depth kinetic profiling and the study of challenging low-affinity interactions, while turning to the power of ELISA for efficiently quantifying target molecules across vast numbers of samples. A thorough understanding of the principles, protocols, and comparative landscape outlined in this guide empowers scientists to deploy ELISA effectively, ensuring the generation of high-quality, reproducible data.
Surface Plasmon Resonance (SPR) has established itself as a preeminent technology for the label-free, real-time analysis of biomolecular interactions. Within the broader context of bioanalytical technique comparisons, SPR's capabilities are often measured against the traditional gold standard, the Enzyme-Linked Immunosorbent Assay (ELISA). While ELISA is a well-characterized, endpoint immunoassay that provides quantitative data on the presence and concentration of biomolecules, SPR transcends these capabilities by offering detailed insights into the dynamics of molecular interactions [1] [25]. This technical guide focuses on two of SPR's most powerful applications: detailed kinetic profiling and high-resolution epitope mapping, underscoring its indispensable role in modern drug development and life sciences research.
Core Technical Advantages of SPR over ELISA
The distinct value proposition of SPR becomes evident when its core operational advantages are compared directly with ELISA. These advantages form the foundation for its superior performance in kinetic and epitopic analyses.
Table 1: Fundamental Operational Differences Between SPR and ELISA
| Feature | Surface Plasmon Resonance (SPR) | Enzyme-Linked Immunosorbent Assay (ELISA) |
|---|---|---|
| Detection Principle | Label-free; measures changes in refractive index [25] [7] | Requires enzyme-labeled antibodies for signal generation [26] [13] |
| Data Type | Real-time monitoring of association and dissociation; provides kinetic and affinity data [1] [7] | End-point measurement; provides concentration/affinity data only [1] [7] |
| Assay Timeline | Minutes to a few hours [27] | Several hours to over a day [1] [7] |
| Hands-On Time | Minimal; automated fluidics and data collection [1] | Extensive; multiple incubation and washing steps [26] |
| Low-Affinity Interaction Detection | Excellent; real-time monitoring avoids loss during washes [1] [7] | Poor; multiple washing steps can remove low-affinity binders [1] [7] |
| Sample Consumption | Small volumes (microliters) [27] | Larger volumes typically required |
| Information Depth | Determines how and why molecules interact via kinetics (kon, koff) and affinity (KD) [1] | Determines if and how much of a molecule is present [1] |
A critical differentiator is SPR's capacity to detect low-affinity interactions, which are often missed by ELISA due to its stringent washing steps [7]. In one comparative study, SPR identified a 4% positivity rate for anti-drug antibodies, while ELISA detected only 0.3%, because SPR's real-time monitoring captures transient binders that are washed away in an ELISA protocol [1] [7]. This sensitivity is crucial for applications like assessing early immunogenic responses to biologic therapeutics.
Ideal Application 1: Detailed Kinetic Profiling
The Value of Kinetic Constants
Kinetic profiling involves determining the rates of association (kon) and dissociation (koff) for a biomolecular interaction, from which the equilibrium affinity constant (KD) is derived. While ELISA provides an affinity measurement, it cannot deconstruct the individual kinetic rates that define the nature of the interaction [1]. Understanding kinetics is vital because two interactions with the same overall affinity can have vastly different kinetic profiles: one might be fast-on/fast-off, and another slow-on/slow-off, with profound implications for in vivo efficacy and dosing regimens for therapeutic candidates [1].
SPR Experimental Protocol for Kinetic Analysis
The following workflow details a standard protocol for determining the binding kinetics of a monoclonal antibody to its immobilized antigen using SPR.
Step 1: Ligand Immobilization. The antigen (ligand) is immobilized onto a dextran-coated gold sensor chip, typically via amine coupling to create a stable surface for analysis [25]. The surface is then blocked with an irrelevant protein to minimize non-specific binding.
Step 2: Association Phase. A series of analyte (e.g., antibody) solutions at different concentrations are injected sequentially over the sensor surface. The binding event causes a change in the refractive index, recorded in real-time as a sensorgram. The initial slope of the binding curve is proportional to the association rate constant (kon) and the analyte concentration [25].
Step 3: Dissociation Phase. The flow is switched to buffer, and the decrease in signal as the analyte dissociates from the ligand is monitored. The decay rate of this curve provides the dissociation rate constant (koff) [25].
Step 4: Surface Regeneration. A low-pH buffer or other regeneration solution is injected to break the antibody-antigen bonds without denaturing the immobilized ligand, preparing the surface for the next sample injection [28]. This reusability is a key economic advantage.
Step 5: Data Analysis. The sensorgram data for all concentrations are globally fitted to a suitable binding model (e.g., 1:1 Langmuir) to extract the kinetic constants kon and koff. The affinity constant KD is then calculated as koff/kon [25].
Table 2: Interpretation of Kinetic and Affinity Parameters from SPR
| Parameter | Description | Biological & Therapeutic Implication |
|---|---|---|
| Association Rate (kon) | Speed at which the complex forms | A high kon can be critical for hitting fast-moving targets. |
| Dissociation Rate (koff) | Speed at which the complex breaks apart | A low koff (slow dissociation) often predicts longer duration of action in vivo. |
| Affinity Constant (KD) | Ratio koff/kon; measure of overall binding strength | While important, two molecules with the same KD can have very different biological effects based on their individual kinetic profiles. |
A powerful example of SPR's kinetic capability is in the serodiagnosis of canine visceral leishmaniasis, where researchers used SPR to analyze the reaction kinetics of a multiepitope protein with polyclonal antibodies, determining precise association and dissociation rates (ka1 = 2.4 × 10⁵ L mol⁻¹ s⁻¹; kd1 = 5.5 × 10⁻⁴ s⁻¹) that informed optimized diagnostic timelines [29].
Ideal Application 2: High-Resolution Epitope Mapping
Defining Epitope Binning
Epitope mapping determines the specific region (epitope) on an antigen to which an antibody binds. Understanding the epitopes for a panel of monoclonal antibodies is essential for identifying unique, therapeutic-grade antibodies, diagnosing epitope-related diseases, and designing next-generation biologics. SPR enables "epitope binning" – classifying antibodies into groups based on whether their binding to the antigen is competitive or non-competitive, indicating identical or distinct epitopes [25].
SPR Experimental Protocol for Epitope Binning
The primary method for epitope binning in SPR is the sequential injection or sandwich assay.
Step 1: Reference Antibody Binding. The antigen is immobilized on the sensor chip. A saturating concentration of the first antibody (Ab₁) is injected and allowed to bind fully.
Step 2: Secondary Antibody Challenge. Without regenerating the surface, a second antibody (Ab₂) is injected. The flow cell now presents the antigen complexed with Ab₁.
Step 3: Signal Interpretation and Classification.
- No Signal Increase: If no binding signal is observed for Ab₂, it indicates that Ab₂ cannot bind because its epitope is already occupied by Ab₁. The antibodies are competitive and are grouped into the same epitope bin.
- Signal Increase: If a binding signal is observed for Ab₂, it indicates that Ab₂ can bind to a different, non-overlapping epitope on the antigen. The antibodies are non-competitive and are placed into different bins.
This process is repeated for all antibody pairs in the panel to build a comprehensive epitope binning map. SPR imaging (SPRI) can accelerate this process by allowing hundreds of interactions to be monitored simultaneously on a single chip [25].
The Scientist's Toolkit: Essential Reagents and Materials
Successful SPR experiments require careful selection of core components.
Table 3: Key Research Reagent Solutions for SPR Experiments
| Item | Function | Key Considerations |
|---|---|---|
| SPR Instrument | Optical system to generate and measure the plasmon resonance. | Choices range from high-end fluidics systems to compact, lower-maintenance benchtop platforms like the Nicoya Alto or Affinité P4SPR [1] [27]. |
| Sensor Chips | Gold-coated glass substrates that form the sensing interface. | Available with various coatings (e.g., carboxymethyl dextran for amine coupling, streptavidin for biotin capture). Chips are often reusable [25] [27]. |
| Coupling Chemistry Kits | Chemical reagents for immobilizing ligands on the sensor surface. | Common methods include amine coupling, thiol coupling, and biotin-streptavidin capture. Kits typically contain activation agents, quenching buffers, and coupling buffers [25]. |
| Running & Dilution Buffer | Buffer used to prepare samples and maintain continuous flow. | Must be optimized to minimize non-specific binding. Often includes a surfactant like Tween-20. |
| Regeneration Solution | A solution that breaks the binding interaction without damaging the immobilized ligand. | Common reagents include Glycine-HCl (low pH) or NaOH (high pH). Condition must be optimized for each specific interaction [28]. |
| Analysis Software | Software for processing sensorgram data and calculating kinetic parameters. | Integrated with the instrument, it performs curve-fitting to binding models for extracting kon, koff, and KD [7]. |
Surface Plasmon Resonance stands apart from traditional techniques like ELISA by providing a dynamic, information-rich view of biomolecular interactions. Its capacity for real-time kinetic profiling and high-resolution epitope mapping makes it an indispensable tool for researchers and drug development professionals. From guiding the selection of lead therapeutic antibodies with optimal binding kinetics to classifying antibodies based on their epitope specificity, SPR delivers critical insights that are simply beyond the reach of endpoint, label-dependent assays. As the technology continues to evolve, integrating with advanced data analysis methods like self-organizing maps [29], its role in accelerating and refining biologic discovery is set to grow even further.
Surface Plasmon Resonance (SPR) has emerged as a powerful label-free biosensing technology that enables real-time monitoring of biomolecular interactions. As an optical technique, SPR detects changes in the refractive index at a sensor surface, allowing researchers to observe binding events as they occur without the need for fluorescent or radioactive labels [9] [30]. This capability has positioned SPR as a transformative methodology in clinical analysis, particularly for detecting protein biomarkers, antibodies, and pathogens. The technique stands in contrast to traditional enzyme-linked immunosorbent assays (ELISAs), which have long served as the gold standard for biomolecular detection but present significant limitations for studying interaction kinetics and low-affinity binders [1] [4].
The fundamental principle of SPR involves immobilizing one binding partner (ligand) on a sensor chip and flowing the other partner (analyte) over the surface in a microfluidic system. When binding occurs, the resulting mass change alters the refractive index at the sensor surface, shifting the SPR angle [1]. This response is measured in resonance units (RU) and plotted in real-time sensorgrams, providing rich data on binding specificity, affinity, and kinetics [6]. For clinical applications, this translates to unprecedented capability in characterizing interactions between therapeutic antibodies and their targets, detecting low-abundance disease biomarkers, and identifying pathogenic agents with high sensitivity.
Technical Comparison: SPR vs. ELISA
Fundamental Methodological Differences
The core distinction between SPR and ELISA lies in their fundamental approach to detection. ELISA is an end-point assay that relies on enzyme-linked labels for signal generation after multiple incubation and washing steps. The final signal intensity, typically measured through colorimetric, chemiluminescent, or fluorescent readouts, corresponds to the amount of bound analyte [1]. In contrast, SPR is a label-free technique that monitors interactions in real-time as they occur on the sensor surface. This eliminates potential artifacts introduced by labeling and provides continuous monitoring of the entire binding event from initial association to final dissociation [6].
The procedural differences are substantial. A typical sandwich ELISA requires multiple steps including coating, blocking, sample incubation, washing, secondary antibody incubation, further washing, substrate addition, and finally signal detection. This process typically takes more than a day to complete with significant hands-on time. SPR protocols, however, are significantly streamlined with washing and sensor preparation steps integrated into the instrument itself, reducing time to answer sometimes to just minutes [1].
Comparative Performance Analysis
Table 1: Comprehensive comparison of SPR and ELISA characteristics
| Parameter | SPR | ELISA |
|---|---|---|
| Data Measurement | Real-time kinetics (ka, kd) and affinity (KD) | End-point, concentration only |
| Label Requirement | Label-free | Requires enzyme-labeled antibodies |
| Experiment Length | Minutes to hours | Typically >24 hours |
| Low-Affinity Interaction Detection | Excellent | Poor (washed away) |
| Throughput | Medium to high (modern systems) | Medium |
| Sample Consumption | Low (microliters) | Moderate to high |
| Cost Factors | Higher initial instrument cost | Lower initial cost, recurring reagent costs |
| Learning Curve | Steeper (simplified in newer systems) | Shallow |
SPR provides significantly more detailed interaction data compared to ELISA. While ELISA only quantifies the amount of bound complex at the end of the assay, SPR characterizes the entire binding event, determining association rates (ka), dissociation rates (kd), and equilibrium dissociation constants (KD) [1]. This kinetic information is particularly valuable in drug development where binding longevity critically impacts therapeutic efficacy.
For low-affinity interactions, SPR demonstrates marked superiority. ELISA often fails to detect low-affinity binders because they dissociate during extensive washing steps. SPR's real-time monitoring captures these transient interactions, making it invaluable for detecting weak but biologically important interactions such as anti-drug antibodies (ADAs) with fast off-rates [1] [4]. Studies comparing ADA detection found SPR identified positivity rates of 4% compared to only 0.3% by ELISA, with SPR consistently showing higher sensitivity for low-affinity interactions [1].
Economic and Practical Considerations
While SPR systems traditionally involved higher upfront costs and maintenance, recent technological advances have produced more accessible benchtop systems. ELISA remains more cost-effective for laboratories with limited budgets, utilizing standard equipment found in most laboratories. However, the comprehensive data provided by SPR and reduced hands-on time can offset its higher initial investment for many applications [1].
Core Principles of SPR Technology
Physical Basis of SPR
Surface Plasmon Resonance occurs when polarized light strikes a metal film (typically gold) at the interface between media with different refractive indices. At a specific angle of incidence (the SPR angle), photons couple with electron oscillations (plasmons) in the metal film, resulting in a reduction in reflected light intensity. This phenomenon is exquisitely sensitive to changes in the refractive index within approximately 300 nanometers of the sensor surface—a distance that corresponds well with the size of biomolecular complexes [30].
When biomolecules bind to the sensor surface, the local refractive index changes proportionally to the bound mass, altering the SPR angle. This change is measured in resonance units (RU), where 1 RU typically corresponds to a shift of 10⁻⁶ refractive index units or approximately 1 pg/mm² of protein binding [31]. Monitoring these changes in real-time produces sensorgrams that reveal rich kinetic information about the interaction.
Experimental Workflow
Table 2: Key steps in SPR experimental protocols
| Step | Description | Purpose |
|---|---|---|
| Surface Preparation | Immobilization of ligand on sensor chip | Creates specific binding surface |
| Baseline Establishment | Flow of running buffer | Stabilizes signal before sample injection |
| Sample Injection (Association) | Flow of analyte over ligand surface | Monitors binding formation |
| Dissociation Phase | Return to buffer flow | Monitors complex stability |
| Surface Regeneration | Injection of regeneration solution | Removes bound analyte for surface reuse |
The basic SPR experiment involves immobilizing one interaction partner (the ligand) to the sensor surface, then injecting the other partner (the analyte) in solution. The sensor continuously monitors binding throughout the association phase (during sample injection) and dissociation phase (when buffer flows across the surface). The surface can typically be regenerated by removing bound analyte using conditions that disrupt the interaction without damaging the immobilized ligand, allowing multiple analyte samples to be tested on the same surface [1] [6].
Diagram 1: Core SPR principle showing the optical configuration and binding detection mechanism.
Clinical Applications
Therapeutic Antibody and Anti-Drug Antibody Detection
The detection and characterization of anti-drug antibodies (ADAs) represents one of the most clinically significant applications of SPR technology. A pivotal 2021 study comparing SPR and ELISA for detecting ADAs in patients receiving infliximab revealed striking differences between the two methods [4]. While both techniques produced similar measurements of serum drug concentrations, SPR detected ADAs in 37% of patients compared to only 18% with ELISA. Furthermore, SPR identified ADAs in eight additional patients considered ADA-negative by ELISA, and in samples positive by both methods, SPR measured ADA concentrations 7-490 times higher than ELISA [4].
The explanation for this discrepancy lies in the kinetic characteristics of patient-generated ADAs. These antibodies typically have faster dissociation rates (lower affinity) than the commercial antibodies used in ELISA calibration curves. During ELISA's lengthy incubation and washing steps, a significant portion of patient ADAs dissociates and is washed away before detection. SPR's real-time monitoring captures these interactions before they dissociate, providing a more accurate representation of ADA levels [4] [5]. This finding has profound clinical implications, as undetected ADAs can significantly impact drug efficacy and patient outcomes.
Cancer Biomarker Detection
SPR biosensors have demonstrated remarkable capability in detecting low-abundance cancer biomarkers, with sensitivity enhancements achieved through various signal amplification strategies. Research has established SPR assays for multiple tumor markers including α-fetoprotein (AFP) for hepatocellular carcinoma, carcinoembryonic antigen (CEA) for colorectal cancer, and cytokeratin fragment 21-1 (CYFRA 21-1) for lung cancer [32].
Innovative approaches have further enhanced detection sensitivity. A dual amplification strategy employing gold nanoparticle-antibody conjugates and antibody-quantum dot conjugates increased SPR signals by 50-fold, achieving detection limits as low as 0.1 ng/mL for AFP, CEA, and CYFRA 21-1 [32]. This sensitivity surpasses conventional detection methods and enables early cancer diagnosis when biomarker concentrations are minimal.
For ovarian cancer detection, recent SPR developments have focused on cancer antigen 125 (CA125) and human epididymis protein 4 (HE4) biomarkers. SPR assays have achieved exceptional sensitivity with limits of detection reaching 0.01 U/mL for CA125 and 1 pM for HE4, demonstrating potential for early epithelial ovarian cancer detection where current methods remain inadequate [33].
Pathogen Detection
SPR-based platforms have emerged as powerful tools for rapid, sensitive pathogen detection, utilizing various nanomaterial enhancements to improve performance. Graphene oxide-based SPR sensors have detected Leptospirosis bacteria in rodent urine with high accuracy, while barium titanate-adsorbed graphene oxide platforms demonstrated sensitivity of 220 deg/RIU for detecting Pseudomonas bacteria [30].
Viral detection platforms have shown particularly impressive results. Gold film-based SPR sensors achieved detection limits of 1.02 pM for SARS-CoV-2, while gold nanospike-enhanced platforms further improved sensitivity to 0.5 pM [30]. Hybrid graphene/gold film sensors detected dengue virus at 28 fM, highlighting the exceptional sensitivity achievable through material optimization. For norovirus detection, sandwich formation approaches with gold nanorods reached astonishing sensitivity of 70 aM [30].
Table 3: SPR detection performance for various pathogens
| Pathogen | SPR Platform | Detection Limit | Reference |
|---|---|---|---|
| SARS-CoV-2 | Gold film | 1.02 pM | [30] |
| SARS-CoV-2 | Gold nanospikes | 0.5 pM | [30] |
| Dengue Virus | Hybrid graphene/gold | 28 fM | [30] |
| Norovirus | Gold nanorods | 70 aM | [30] |
| Hepatitis B | Graphene-encapsulated gold nanoparticles | 0.05 pg/mL | [30] |
| Rotavirus | Gold nanoprisms | 126 ± 3 PFU/mL | [30] |
| E. coli | MoS₂-coated gold optical fiber | 94 CFU/mL | [30] |
Advanced SPR Methodologies and Protocols
Signal Amplification Strategies
The detection of low-abundance analytes in clinical samples often requires signal amplification strategies to achieve clinically relevant sensitivity. Quantum dots (QDs) have emerged as particularly effective amplification tags due to their substantial mass and unique optical properties. Research demonstrates that antibody-QD conjugates can generate 10.2-fold greater signal amplification compared to free antibodies in AFP detection assays [32].
Rolling circle amplification (RCA) combined with nanogold-modified tags provides another powerful amplification approach. This method attaches a DNA primer to the detection antibody, which then undergoes isothermal amplification using a circular DNA template. The resulting long DNA product containing repetitive sequences is detected using nanogold-modified oligonucleotides complementary to these repeats. Research shows this RCA-nanogold approach can amplify original SPR signals by over 60-fold using 5 nm nanogold particles with 30 minutes of RCA development time [31].
Diagram 2: Signal amplification workflow using rolling circle amplification (RCA) with nanogold tags.
Critical Experimental Parameters
Successful SPR assay development requires careful optimization of multiple parameters. Antibody immobilization concentration significantly impacts assay performance, with optimal concentrations typically between 0.5-0.65 mg/mL for cancer biomarker detection [32]. Insufficient immobilization reduces the upper detection limit, while excess antibody increases steric hindrance.
The ratio of detection antibody to quantum dots in signal amplification approaches must be carefully calibrated. Research indicates optimal ratios of approximately 20:1 (Ab2:QDs), beyond which the QD surface becomes saturated without significant signal improvement [32].
Regeneration conditions represent another critical parameter. The regeneration solution must completely remove bound analyte without damaging the immobilized ligand. This typically requires testing different pH conditions, ionic strengths, or additives to identify the optimal regeneration protocol for each specific interaction.
Research Reagent Solutions
Table 4: Essential reagents and materials for SPR experiments
| Reagent/Material | Function | Application Examples |
|---|---|---|
| Sensor Chips | Platform for ligand immobilization | CM5 (carboxymethylated dextran), gold films |
| Amine Coupling Kit | Covalent immobilization of proteins | NHS/EDC chemistry for antibody immobilization |
| Gold Nanoparticles | Signal amplification | Enhanced sensitivity for low-abundance analytes |
| Quantum Dots | Mass-based signal tags | Biomarker detection amplification [32] |
| HaloTag Capture System | Uniform protein orientation | SPOC technology for consistent immobilization [6] |
| Regeneration Solutions | Surface regeneration between cycles | Glycine-HCl (low pH), NaOH for removing bound analytes |
| Carboxymethylated Dextran Matrix | 3D immobilization surface | Increased binding capacity compared to flat surfaces |
SPR technology has fundamentally transformed clinical analysis by providing real-time, label-free detection of biomolecular interactions with unprecedented kinetic insight. Its superiority over ELISA for characterizing low-affinity interactions, detecting transient complexes, and providing comprehensive binding kinetics has established SPR as an indispensable tool in modern clinical research and diagnostic development.
While ELISA remains valuable for high-throughput concentration measurements in resource-limited settings, SPR's ability to detect low-affinity anti-drug antibodies, quantify rare cancer biomarkers, and identify pathogens with exceptional sensitivity positions it as the emerging gold standard for biomolecular interaction analysis. The ongoing development of simplified, more accessible SPR platforms promises to expand its implementation in clinical laboratories, potentially enabling personalized treatment monitoring and early disease diagnosis through sensitive detection of protein markers, antibodies, and pathogens.
As SPR technology continues to evolve with enhanced multiplexing capabilities, improved signal amplification strategies, and simplified operational workflows, its integration into clinical practice is expected to grow, ultimately advancing patient care through more precise molecular characterization of disease states and therapeutic responses.
Troubleshooting & Optimization: Overcoming Assay Limitations
The Low-Affinity Blind Spot of ELISA and How SPR Illuminates It
Enzyme-linked immunosorbent assay (ELISA) has long been recognized as the gold standard for biomolecular detection in research and clinical applications. However, this technique contains a critical limitation—a systematic blind spot for low-affinity molecular interactions. Surface plasmon resonance (SPR) technology emerges as a powerful solution to this problem, providing real-time, label-free detection that captures the full spectrum of binding affinities. This technical review examines the fundamental principles underlying ELISA's limitations and demonstrates how SPR's unique capabilities provide researchers with more comprehensive interaction data, particularly crucial for drug development applications where low-affinity interactions carry significant scientific and clinical relevance.
Biomolecular interaction analysis forms the cornerstone of modern biological research and therapeutic development. For decades, enzyme-linked immunosorbent assay (ELISA) has served as the predominant method for detecting and quantifying antibodies, proteins, and other biomolecules, prized for its high sensitivity, specificity, and accessibility [1]. As a plate-based assay, ELISA operates by immobilizing a target biomolecule to a solid surface and detecting binding events through labeled antibodies that generate measurable signals, typically via colorimetric, fluorescent, or chemiluminescent outputs [1] [7].
In contrast, surface plasmon resonance (SPR) represents a more recent technological advancement that enables label-free, real-time monitoring of molecular interactions. This optical technique detects binding events by measuring changes in the refractive index at a metal surface interface, typically gold, when molecular binding occurs [1] [34]. SPR's unique capability to monitor interactions as they happen provides unprecedented access to both kinetic parameters (association and dissociation rates) and affinity constants, offering a more comprehensive picture of molecular binding behavior [1] [7] [34].
Despite ELISA's established position in laboratories, its fundamental design principles introduce significant limitations, particularly for detecting low-affinity interactions that are increasingly recognized as biologically and clinically important. This review examines the technological basis for ELISA's "low-affinity blind spot" and demonstrates how SPR technology illuminates these previously hidden interactions.
The Technological Basis of ELISA's Low-Affinity Blind Spot
Endpoint Measurement and Washing Artifacts
The core limitation of ELISA in detecting low-affinity interactions stems from its endpoint measurement methodology combined with multiple washing steps. In a typical sandwich ELISA protocol, the assay involves lengthy coating, incubation, washing, blocking, and signal generation steps, with significant hands-on time [1] [7]. These extensive washing procedures preferentially remove complexes with faster dissociation rates, meaning low-affinity interactions that rapidly dissociate are systematically eliminated before detection [1] [7] [4].
The fundamental issue is that ELISA measures only what remains bound after these washing procedures, not what initially bound. Consequently, the assay is biased toward detecting high-affinity interactions while low-affinity binders are often lost during the multiple washing steps [1]. This makes it difficult to determine whether a weak signal results from low binding affinity or poor expression of the target protein, potentially leading to false-negative results [1].
Equilibrium Assumptions and Incubation Time Limitations
ELISA's ability to accurately measure binding affinity depends on the system reaching equilibrium, where the rate of binding equals the rate of dissociation. However, as an endpoint assay, ELISA provides no internal validation that equilibrium has been achieved [5]. A critical analysis of 100 studies reporting binding affinities revealed that 70% of papers failed to confirm equilibrium, a fundamental requirement for accurately determining KD values [5].
The problem is compounded by the fact that nearly 90% of reviewed studies used incubation times of one hour or less, despite evidence that full equilibration for some protein complexes can take many hours [5]. Without sufficient incubation time to reach equilibrium, ELISA results inevitably underestimate the true binding strength, reporting artificially high KD values that misrepresent the interaction's biology [5].
SPR Technology: Principles and Advantages
Surface plasmon resonance operates on fundamentally different principles that overcome ELISA's limitations for low-affinity interaction detection. SPR is an optical phenomenon occurring at a metal surface when plane-polarized light hits the surface under total internal reflection conditions [7] [34]. The SPR response is sensitive to changes in refractive index within approximately 200 nm of the metal surface, enabling detection of molecular binding events without labels [34].
In a typical SPR experiment, one binding partner (the ligand) is immobilized on the sensor surface, while the other (the analyte) is injected over the surface in solution. When binding occurs, the increase in mass at the surface changes the refractive index, producing a measurable signal in real time [1]. This direct detection method provides significant advantages for comprehensive binding characterization.
Real-Time Monitoring and Kinetic Profiling
Unlike ELISA's single endpoint measurement, SPR continuously monitors binding events throughout the association and dissociation phases, generating a sensorgram that depicts the complete binding timeline [27]. This real-time monitoring enables researchers to observe interaction development and directly calculate association rates (kon), dissociation rates (koff), and the equilibrium dissociation constant (KD) from a single experiment [1] [5].
Most importantly, SPR's continuous monitoring means that low-affinity interactions are captured as they occur, without being lost through washing procedures. The technology preserves the entire binding profile, including transient interactions that would be systematically eliminated in ELISA protocols [1] [7] [4].
Label-Free Detection in Native Conditions
SPR's label-free nature represents another significant advantage. ELISA depends on tagged antibodies and substrates to generate a measurable signal, introducing potential artifacts from the labeling process itself [1] [7]. Labels can sterically hinder interactions or alter molecular functionality, particularly problematic for low-affinity interactions where subtle effects disproportionately impact detection.
SPR eliminates these concerns by directly detecting binding through refractive index changes, allowing observation of interactions in their native states [7] [27]. This streamlined approach not only preserves natural binding behavior but also simplifies assay design by removing the optimization steps required for label incorporation and detection in ELISA systems [1].
Comparative Studies: Revealing the Hidden Landscape of Low-Affinity Interactions
Clinical Detection of Anti-Drug Antibodies
Perhaps the most compelling evidence of ELISA's low-affinity blind spot comes from clinical studies comparing ELISA and SPR for detecting anti-drug antibodies (ADA). In a 2021 study by Beeg et al. examining 76 patients receiving infliximab for inflammatory bowel disease, striking differences emerged between the two methods [4].
While both methods produced similar serum drug concentrations, they differed dramatically in ADA detection. All 14 samples identified as ADA-positive by ELISA were also positive by SPR; however, absolute ADA levels measured by SPR were 7 to 490 times higher, with no correlation between the two methods [5] [4]. Furthermore, SPR detected ADA in 8 additional patients considered ADA-negative by ELISA [4].
The explanation lies in the dissociation characteristics of the antibodies. The commercial antibodies used in ELISA calibration have very low dissociation rates, remaining bound throughout the assay. In contrast, patient-generated ADA typically has faster dissociation rates, causing them to dissociate during ELISA's lengthy incubation and washing steps before detection occurs [5] [4]. SPR's real-time monitoring captures these interactions without loss, providing a more accurate representation of the immune response.
Antibody Affinity and Characterization Studies
Comparative studies in antibody development further illustrate ELISA's limitations. In an alpaca antibody discovery project, clones R4 and R9 were analyzed by both ELISA and SPR, revealing significant discrepancies in reported affinity values [5].
Table 1: Discrepancy in KD Measurements Between ELISA and SPR
| Antibody Clone | SPR KD (M) | ELISA KD (M) | Fold Difference |
|---|---|---|---|
| R4 | 5.23 × 10⁻⁹ | 2.29 × 10⁻⁷ | 43.7-fold higher by ELISA |
| R9 | 1.30 × 10⁻⁸ | 1.83 × 10⁻⁷ | 14.1-fold higher by ELISA |
ELISA-reported KD values were 43.7-fold higher for R4 and 14.1-fold higher for R9 compared to SPR measurements, significantly underestimating binding affinity [5]. Kinetic analysis by SPR revealed that equilibrium binding required 5.34 hours for R4 and 2.29 hours for R9—timeframes far exceeding typical ELISA incubation periods [5]. This demonstrates how ELISA's failure to reach equilibrium leads to substantial underestimation of true binding strength.
Implications for Research and Therapeutic Development
Detection of Clinically Significant Low-Affinity Antibodies
The ability to detect low-affinity antibodies carries significant clinical implications, particularly in monitoring immune responses to biologic therapies. Low-affinity antibodies often represent early indicators of immune response that may evolve into higher-affinity antibodies through affinity maturation [7]. For patients receiving therapeutic monoclonal antibodies, detecting these early low-affinity anti-drug antibodies (ADA) enables better monitoring and intervention before clinical symptoms manifest [1] [7].
Studies have demonstrated that SPR identifies substantially more patients with ADA responses compared to ELISA. In research on panitumumab immunogenicity, SPR detection identified 4.1% positive patients versus only 0.3% by ELISA [1] [7]. For therapeutic monitoring, this enhanced detection capability provides clinicians with earlier warning of developing immunogenicity, potentially preventing severe life-threatening conditions associated with adverse immune responses [1].
Comprehensive Kinetic Profiling for Drug Development
In drug discovery and development, understanding the complete kinetic profile of candidate molecules provides critical insights that extend beyond simple affinity measurements. SPR's ability to delineate association and dissociation rates helps researchers understand not just whether molecules interact, but how they interact—information crucial for optimizing therapeutic candidates [1] [5].
Interactions with identical binding affinities can have kinetic constants varying by four orders of magnitude, with significantly different biological implications [1]. For instance, fast association combined with slow dissociation might be ideal for certain therapeutic applications, while moderate association with controlled dissociation might be preferable for others. These subtleties remain completely inaccessible to ELISA-based assessment but are readily captured by SPR analysis [1] [34].
Experimental Considerations and Protocol Implementation
SPR Experimental Design for Comprehensive Detection
Implementing SPR to overcome ELISA's limitations requires careful experimental design. The following protocol outlines key considerations for detecting low-affinity interactions:
Sensor Surface Preparation:
- Ligand Immobilization: The capture molecule (ligand) is immobilized on the sensor chip surface using covalent coupling chemistry, typically through amine, thiol, or carboxyl groups [19]. Common strategies include EDC/NHS, EDA/GA, or PANI/GA coupling methods [19].
- Surface Density Optimization: For kinetic studies, moderate surface densities (typically 50-200 response units for proteins) help minimize mass transport limitations and rebinding artifacts [5].
Binding Experiment Execution:
- Analyte Injection: The binding partner (analyte) is injected over the surface at multiple concentrations, typically using a flow system that ensures laminar flow and consistent contact time [1].
- Regeneration Optimization: After each binding cycle, the surface is regenerated using conditions that remove bound analyte without damaging the immobilized ligand [27].
Data Collection and Analysis:
- Real-Time Monitoring: The SPR instrument continuously records binding responses throughout association, equilibrium, and dissociation phases [1] [7].
- Kinetic Analysis: Binding sensograms are globally fitted to appropriate interaction models to extract kinetic parameters (kon, koff) and calculate the equilibrium dissociation constant (KD) [5].
Essential Research Reagents and Solutions
Table 2: Key Reagents for SPR Experiments
| Reagent/Solution | Function | Application Notes |
|---|---|---|
| Sensor Chips (Gold) | Detection surface | Reusable with proper regeneration [27] |
| EDC/NHS Reagents | Covalent coupling | For carboxyl-based ligand immobilization [19] |
| Ethylenediamine (EDA) | Surface amination | Intermediate for glutaraldehyde coupling [19] |
| Glutaraldehyde (GA) | Crosslinking | Creates reactive aldehyde groups for immobilization [19] |
| Ethanolamine HCl | Blocking agent | Quenches unreacted ester groups [19] |
| Regeneration Buffers | Surface cleaning | Removes bound analyte without damaging ligand [27] |
| HBS-EP Buffer | Running buffer | Provides consistent ionic strength and pH [5] |
ELISA's status as the gold standard for biomolecular detection requires reevaluation in applications where comprehensive interaction profiling is essential. The technique's inherent design—specifically its endpoint measurement, extensive washing requirements, and inability to verify equilibrium—creates a systematic blind spot for low-affinity interactions that carry increasing biological and clinical significance.
SPR technology effectively illuminates this blind spot through real-time, label-free detection that captures the complete spectrum of molecular interactions. The evidence from comparative studies is compelling: SPR detects interactions that ELISA misses, provides more accurate affinity measurements, and delivers essential kinetic parameters that illuminate the true nature of molecular binding behavior.
For researchers and drug development professionals, integrating SPR into characterization workflows represents not merely a methodological enhancement but a fundamental necessity for comprehensive biomolecular interaction analysis. As the field continues to recognize the importance of transient and low-affinity interactions in biological systems, SPR's ability to reveal this hidden dimension of molecular recognition will prove increasingly invaluable for advancing both basic research and therapeutic development.
Therapeutic drug monitoring (TDM) of monoclonal antibodies (mAbs) and the detection of anti-drug antibodies (ADAs) represent critical components in optimizing biologic therapies for inflammatory diseases, cancer, and other conditions. The emergence of immunogenicity—where patients develop an immune response against administered biotherapeutics—can significantly impact drug pharmacokinetics, efficacy, and safety profiles [35]. A substantial proportion of patients treated with mAbs develop these ADAs, which can be categorized as either neutralizing antibodies (NADAs) that bind to the Fab domain and inhibit interaction with the target antigen, or non-neutralizing antibodies (nNADAs) that bind to the Fc region and promote immune complex formation and clearance [35]. The clinical consequences can include reduced drug concentrations, diminished therapeutic response, and potential adverse events, making accurate monitoring essential for personalized treatment adjustments.
Traditional enzyme-linked immunosorbent assays (ELISAs) have served as the workhorse technique for TDM and immunogenicity assessment due to their established workflow, high throughput, and widespread accessibility. However, evidence increasingly demonstrates significant limitations of ELISA in detecting the full spectrum of ADA responses, particularly for low-affinity antibodies that may represent early immunogenicity [4] [5]. This technical guide explores the fundamental principles of surface plasmon resonance (SPR) as an alternative methodology that addresses several key limitations of ELISA, with particular focus on interference factors in TDM and ADA detection.
Fundamental Principles: SPR versus ELISA
ELISA Technology and Limitations
The ELISA platform operates on the principle of immobilizing one binding partner (typically an antigen or antibody) to a solid surface, followed by sequential incubation and washing steps with detection antibodies conjugated to enzymes that generate a measurable colorimetric, fluorescent, or chemiluminescent signal [1] [36]. While this approach provides excellent sensitivity for high-affinity interactions, its format as an endpoint assay introduces several vulnerabilities:
- Label Dependency: ELISA requires multiple labels or enzymes conjugated to detection antibodies, increasing assay complexity and potential for interference [1] [7].
- Washing Artifacts: Extensive washing steps can dissociate low-affinity antibodies, leading to underestimation or false-negative results for clinically relevant ADA populations [1] [4].
- Limited Kinetic Information: As an equilibrium-based method, ELISA provides affinity data but no direct information about association and dissociation rates, which are critical for understanding antibody behavior [1] [5].
- Drug Interference: Most ELISA formats are drug-sensitive, meaning they cannot detect ADAs in the presence of circulating drug, potentially missing ADA-positive patients with ongoing immune responses [4].
These limitations become particularly problematic when analyzing patient-derived ADAs, which often exhibit a broad spectrum of affinities and may differ significantly from the high-affinity commercial antibodies used in calibration curves [4].
SPR Technology and Advantages
Surface plasmon resonance operates on fundamentally different principles, detecting biomolecular interactions in real-time without requiring labels. In SPR instrumentation, plane-polarized light strikes a metal-coated sensor surface under conditions of total internal reflection. When biomolecules bind to the sensor surface, they alter the refractive index at the interface, causing a measurable change in the resonance angle [1] [7]. This physical principle enables several key advantages:
- Label-Free Detection: SPR measures binding directly through refractive index changes, eliminating the need for secondary antibodies, enzymes, or signal amplification steps [1] [7].
- Real-Time Monitoring: SPR sensorgrams provide continuous measurement of association and dissociation phases, enabling calculation of both kinetic parameters (kon, koff) and equilibrium constants (KD) [1] [5].
- Minimal Processing: Automated fluidics systems inject samples directly over the sensor surface, reducing hands-on time and minimizing washing artifacts that disproportionately affect low-affinity interactions [1].
Table 1: Fundamental Technical Comparison Between ELISA and SPR
| Parameter | ELISA | SPR |
|---|---|---|
| Detection Principle | Enzyme-mediated signal amplification | Refractive index change |
| Measurement Type | End-point | Real-time, continuous |
| Label Requirement | Yes | No |
| Kinetic Data | No | Yes (association & dissociation rates) |
| Assay Duration | Hours to days | Minutes to hours |
| Affinity Range | Limited to high-affinity interactions | Broad, including low-affinity interactions |
| Automation Potential | Moderate | High |
Quantitative Performance Comparison
Clinical Evidence of Detection Discrepancies
Recent clinical studies have revealed striking differences in ADA detection capabilities between SPR and ELISA methodologies. A comprehensive 2021 study by Beeg et al. analyzed 76 patients receiving infliximab for inflammatory bowel diseases, comparing a commercial ELISA (LISA-TRACKER Duo Infliximab) with an SPR-based immunoassay [4]. While both methods showed excellent concordance for measuring serum infliximab concentrations, dramatic discrepancies emerged in ADA detection:
- All 14 samples identified as ADA-positive by ELISA were also positive by SPR, but absolute ADA levels were 7 to 490 times higher when measured by SPR, with no correlation between the methods [4].
- SPR detected ADA in 8 additional patients who were considered ADA-negative by ELISA [4].
- Analysis of dissociation rate constants revealed that ADAs detected exclusively by SPR had significantly faster dissociation rates, indicating lower affinity interactions that were likely lost during ELISA washing steps [4].
These findings demonstrate that ELISA systematically underestimates ADA levels, particularly for low-affinity populations that may represent early immunogenicity or clinically relevant antibody subsets.
Implications for Therapeutic Decision-Making
The underestimation or non-detection of ADAs by ELISA has direct implications for clinical management. In the Beeg et al. study, SPR identified ADA-positive patients among those with detectable drug levels, a scenario rarely observed with ELISA due to its drug-sensitive nature [4]. This drug-tolerant detection capability provides a more complete picture of a patient's immune response profile, potentially enabling earlier intervention before complete drug neutralization occurs.
Table 2: Clinical Performance Comparison for ADA Detection
| Performance Metric | ELISA | SPR |
|---|---|---|
| Drug Interference | High (cannot detect ADA with drug present) | Low (acidic pre-treatment enables drug-tolerant detection) |
| Affinity Detection Range | Primarily high-affinity (KD ~10-9-10-11 M) | Broad range (KD ~10-6-10-11 M) |
| Sensitivity for Low-Affinity ADA | Limited | High |
| Absolute ADA Quantification | Underestimates total ADA burden | More comprehensive ADA quantification |
| Time to Results | Typically >24 hours | Potentially minutes to hours |
Methodological Considerations
SPR Experimental Protocol for TDM and ADA Detection
The following protocol outlines a generalized approach for simultaneous drug and ADA monitoring using SPR technology, adapted from validated methodologies [4] [35]:
Sensor Chip Preparation:
- Surface Activation: Use a CM5 sensor chip or equivalent with carboxymethylated dextran matrix. Activate surface with EDC/NHS chemistry for 7 minutes.
- Ligand Immobilization: Immobilize target antigen (e.g., TNFα for infliximab monitoring) in one flow cell at approximately 5,000-10,000 response units (RU). Immobilize the drug itself (e.g., infliximab) in a separate flow cell for ADA capture.
- Blocking: Deactivate remaining active esters with ethanolamine hydrochloride.
- Reference Surface: Prepare a reference flow cell with bovine serum albumin (BSA) or an irrelevant antibody to account for nonspecific binding.
Sample Preparation:
- Serum Pre-treatment: For drug-tolerant ADA detection, acid-treated serum (pH 3.0-3.5) is recommended to dissociate drug-ADA complexes while preserving antibody integrity.
- Dilution Optimization: Dilute samples in HBS-EP+ running buffer (10mM HEPES, 150mM NaCl, 3mM EDTA, 0.05% surfactant P20, pH 7.4) to minimize matrix effects. Typical serum dilutions range from 1:10 to 1:100.
Binding Analysis:
- Regeneration Scouting: Identify optimal regeneration conditions that remove bound analytes without damaging immobilized ligands. For antibody-antigen complexes, glycine-HCl (pH 2.0-2.5) is often effective.
- Kinetic Measurements: Inject diluted serum samples over all flow cells at 30 μL/min for 3-5 minutes association phase, followed by dissociation phase in running buffer.
- Calibration: Include standard curves of purified drug and anti-drug antibodies for quantitative analysis.
Data Analysis:
- Reference Subtraction: Subtract signals from reference flow cell and blank injections to account for bulk refractive index changes and nonspecific binding.
- Kinetic Analysis: Fit sensorgrams to appropriate binding models (e.g., 1:1 Langmuir binding) to determine association (ka) and dissociation (kd) rate constants.
- Affinity Calculation: Calculate equilibrium dissociation constant (KD = kd/ka) for characterizing antibody affinities.
Critical Factors Influencing Assay Performance
Multiple technical factors must be optimized to ensure robust TDM and ADA detection:
Surface Capacity: The density of immobilized ligand significantly impacts assay performance. Too high density can cause mass transport limitations and rebinding artifacts, while too low density may compromise sensitivity. Aim for 5,000-15,000 RU for typical protein ligands.
Matrix Effects: Serum components can cause nonspecific binding and signal suppression. Immobilization of BSA on reference surfaces, appropriate serum dilution, and inclusion of detergent in running buffer help mitigate these effects [37].
Regeneration Stringency: Overly harsh regeneration conditions gradually degrade surface activity, while insufficient regeneration leads to carryover between cycles. Scouting regeneration conditions for each new ligand-analyte pair is essential.
Signaling Pathways and Experimental Workflows
The following diagrams illustrate key experimental workflows and the logical relationship between TDM data and clinical decision-making, created using Graphviz DOT language.
Diagram 1: Standard Sandwich ELISA Workflow. Note the multiple washing steps (red) that can remove low-affinity antibodies.
Diagram 2: SPR Kinetic Analysis Workflow. Real-time monitoring captures both association and dissociation phases without disruptive washing.
Diagram 3: Clinical Decision Pathway Incorporating TDM and ADA Data. Accurate detection of both drug and ADA levels informs personalized treatment decisions.
Research Reagent Solutions
Successful implementation of SPR-based TDM and ADA detection requires specific reagents and materials optimized for label-free biosensing.
Table 3: Essential Research Reagents for SPR-Based Monitoring
| Reagent/Material | Function | Technical Considerations |
|---|---|---|
| CM5 Sensor Chip | Carboxymethylated dextran surface for ligand immobilization | Gold standard for general protein coupling; suitable for amine, thiol, and covalent chemistry |
| EDC/NHS Reagents | Crosslinkers for activating carboxyl groups on sensor surface | Fresh preparation required; typical concentration 0.4M EDC/0.1M NHS |
| HBS-EP+ Buffer | Standard running buffer for biospecific interaction analysis | Contains detergent to minimize nonspecific binding; pH 7.4 for physiological conditions |
| Regeneration Solutions | Remove bound analytes without damaging immobilized ligand | Glycine-HCl (pH 1.5-3.0) common for antibodies; scouting required for each application |
| Anti-Idiotypic Antibodies | Reference standards for ADA quantification | Should represent diverse affinities; crucial for calibration curve generation |
| Purified Therapeutic mAb | Standard for drug level quantification | Pharmaceutical-grade material ensures accurate calibration |
| Bovine Serum Albumin | Blocking agent for reference surfaces and sample dilution | Reduces nonspecific binding; essential for complex matrices like serum |
The comprehensive comparison between SPR and ELISA methodologies reveals significant advantages of SPR technology for addressing interference challenges in therapeutic drug monitoring and anti-drug antibody detection. SPR's label-free nature, real-time monitoring capability, and minimized washing requirements enable detection of low-affinity ADAs that are systematically underestimated or missed entirely by ELISA. Clinical studies demonstrate that these detection differences are not merely analytical curiosities but have meaningful implications for patient management, potentially identifying immunogenicity earlier in its course.
While ELISA remains a valuable tool for high-throughput screening in controlled environments, SPR provides a more comprehensive picture of the dynamic interplay between drug levels and immune responses. The kinetic parameters accessible through SPR analysis offer insights beyond mere concentration measurements, enabling researchers and clinicians to understand not just whether antibodies are present, but how they behave. As personalized medicine approaches continue to evolve, SPR technology stands poised to address critical gaps in our understanding of biotherapeutic immunogenicity and its clinical consequences.
For researchers implementing these methodologies, careful attention to surface chemistry, matrix effects, and regeneration conditions is essential for robust assay performance. The experimental protocols and reagent solutions outlined in this technical guide provide a foundation for developing SPR-based approaches that overcome the interference limitations inherent to ELISA, ultimately supporting more informed therapeutic decision-making.
Using SPR Kinetics to Guide and Optimize Critical ELISA Incubation Times
The Enzyme-Linked Immunosorbent Assay (ELISA) stands as one of the most widely utilized techniques in therapeutic antibody development, from early screening to immunogenicity testing [5]. Despite its prevalence, a fundamental limitation plagues traditional ELISA protocols: the frequent underestimation of binding affinity, particularly for antibodies with slow association or fast dissociation rates [5]. This discrepancy arises because ELISAs are endpoint assays that do not capture the dynamic nature of molecular interactions, and more critically, they provide no intrinsic data to determine the incubation time required for the system to reach binding equilibrium [5] [7].
The core of this challenge lies in the concept of equilibrium. To measure the true affinity constant (KD), the binding reaction must reach a state where the rate of association equals the rate of dissociation [5]. An analysis of 100 studies reporting binding affinities revealed that 70% failed to confirm equilibrium, with nearly 90% using incubation times of one hour or less despite biological likelihood of requiring much longer equilibration [5]. When measurements are taken pre-maturely, before equilibrium is established, the results underestimate the actual binding that would occur, leading to artificially high KD values and a significant underestimation of the true interaction strength [5].
Surface Plasmon Resonance (SPR) emerges as a powerful solution to this fundamental problem. As a label-free, real-time biosensing technique, SPR measures binding as it happens, yielding crucial parameters including association (kon) and dissociation (koff) rates, the equilibrium constant (KD), and most importantly for ELISA optimization, the time to equilibrium (tequil) [5] [1] [7]. This kinetic profile enables researchers to rationally design ELISA protocols with scientifically-grounded incubation times, transforming ELISA from a qualitative tool to a quantitatively reliable method for affinity assessment.
Fundamental Principles: SPR versus ELISA
Technical Mechanisms and Data Output
SPR and ELISA differ fundamentally in their operational principles and data output. ELISA is an endpoint assay that relies on enzyme-linked detection for signal generation. It involves multiple steps including coating, blocking, incubation, and washing, followed by signal development through substrate conversion [1] [38]. The final signal, measured as absorbance, fluorescence, or luminescence, correlates with the amount of analyte bound but provides no direct information about the kinetics of the interaction [1] [7]. The multiple washing steps in ELISA are particularly problematic for characterizing low-affinity interactions, as these weaker binders can dissociate and be washed away before detection, leading to false negatives and significant underestimation of binding levels [1] [7] [4].
In contrast, SPR is an optical technique that detects changes in the refractive index at a sensor surface when biomolecular binding occurs [7] [39]. One binding partner (ligand) is immobilized on a sensor chip, while the other (analyte) flows over the surface in solution. As binding occurs in real-time, SPR monitors the association phase; when buffer alone flows over the surface, it monitors the dissociation phase [7] [39]. This continuous monitoring generates a sensorgram that provides a complete profile of the interaction, enabling calculation of both kinetic rate constants (kon and koff) and the equilibrium dissociation constant (KD) [5] [1].
Table 1: Fundamental Comparison of SPR and ELISA Technologies
| Parameter | Surface Plasmon Resonance (SPR) | Enzyme-Linked Immunosorbent Assay (ELISA) |
|---|---|---|
| Detection Principle | Label-free; measures refractive index changes [7] | Enzyme-based signal generation (colorimetric, fluorescent, chemiluminescent) [1] |
| Data Measurement | Real-time monitoring [1] [7] | Endpoint measurement [5] [1] |
| Primary Data Output | Sensorgram (response vs. time) [39] | Absorbance/Fluorescence/Luminescence [38] |
| Information Obtained | Kinetic constants (kon, koff), affinity (KD), concentration [5] [1] | Affinity (KD) and concentration (requires equilibrium) [5] |
| Typical Assay Duration | Minutes to hours [7] | Hours to over a day [1] [7] |
Detection of Low-Affinity Interactions
The capability to detect low-affinity interactions represents a critical differentiator between SPR and ELISA, with significant implications for clinical applications. This distinction was strikingly demonstrated in a study comparing ELISA and SPR for detecting anti-drug antibodies (ADAs) in patients receiving infliximab for inflammatory bowel disease [4]. While both methods produced similar serum drug concentrations, they differed dramatically in ADA detection. All 14 samples identified as ADA-positive by ELISA were also positive by SPR; however, absolute ADA levels measured by SPR were 7 to 490 times higher, with no correlation between the methods [5] [4]. Furthermore, SPR detected ADAs in 8 additional patients considered ADA-negative by ELISA [4].
This discrepancy is mechanistically explained by differences in antibody affinity and assay design. ELISA typically uses high-affinity commercial antibodies with very low dissociation rates as reference standards. These remain bound throughout the assay, even during extended incubation and wash steps, providing a stable, strong signal [5]. In contrast, patient-generated ADAs often bind more weakly and dissociate faster. During ELISA's lengthy protocol, much of the patient's ADA dissociates and is washed away before detection, resulting in a reduced or absent signal [5] [4]. SPR overcomes this limitation through real-time monitoring that captures both fast and slow dissociation rates, providing more accurate measurement of antibody binding, particularly for low-affinity interactions [5] [1] [7].
The Equilibrium Challenge in Affinity Measurement
The Critical Role of Time to Equilibrium (tequil)
Accurate affinity measurement by ELISA fundamentally depends on reaching binding equilibrium, defined as the state where the rate of complex formation equals the rate of dissociation [5]. The time required to reach this equilibrium (tequil) varies significantly between different molecular interactions and cannot be predicted a priori—it must be determined experimentally through kinetic analysis [5].
The consequences of insufficient incubation time are substantial. When ELISA measurements are taken before equilibrium is established, the amount of bound complex has not reached its maximum stable level, leading to underestimated binding and artificially elevated KD values [5]. This results in systematic underestimation of the true binding strength, potentially causing researchers to discard promising candidates with apparently weak affinity that actually require longer incubation times to manifest their true binding capability.
Case Study: Quantitative Comparison of ELISA and SPR Performance
A compelling demonstration of the equilibrium challenge comes from an alpaca antibody discovery study where clones R4 and R9 were analyzed by both ELISA and SPR [5]. The results revealed significant discrepancies in reported affinity values between the two methods, directly attributable to insufficient incubation time in the ELISA protocol.
Table 2: Discrepancy in KD Measurements Between SPR and ELISA
| Clone | SPR KD | ELISA KD | Fold Difference | SPR-Derived tequil |
|---|---|---|---|---|
| R4 | True affinity | 43.7-fold higher than SPR | 43.7 | 5.34 hours |
| R9 | True affinity | 14.1-fold higher than SPR | 14.1 | 2.29 hours |
The SPR kinetic analysis calculated that the time to equilibrium was 5.34 hours for R4 and 2.29 hours for R9 [5]. If the ELISA for R4 had been incubated for at least 5.34 hours, the measured KD would likely have more accurately reflected the true affinity observed by SPR [5]. This case study underscores how SPR-derived kinetic parameters can diagnose and correct for ELISA's limitations, transforming it from a qualitative tool into a quantitatively reliable method.
Experimental Framework: Using SPR to Guide ELISA Development
SPR Protocol for Kinetic Characterization
To employ SPR for ELISA optimization, researchers must first establish a robust SPR protocol for kinetic characterization. The fundamental SPR workflow begins with sensor chip preparation, typically involving the covalent immobilization of one binding partner (ligand) to a carboxymethyl-dextran chip surface via amine coupling chemistry [39]. The density of immobilized ligand should be optimized to ensure measurable binding signals while avoiding mass transfer limitations, particularly critical when working with larger analytes like nanoparticles or protein complexes [39].
The analytical phase involves sequentially injecting a concentration series of the analyte over the ligand surface, with each injection cycle comprising four phases: baseline (buffer only), association (analyte injection), dissociation (buffer only), and regeneration (brief pulse of regeneration solution to remove bound analyte) [39]. The resulting sensorgrams are then processed to extract kinetic parameters through fitting to appropriate binding models.
Table 3: Key Reagent Solutions for SPR Kinetic Characterization
| Reagent/Equipment | Function/Description | Application Notes |
|---|---|---|
| SPR Instrument | Platforms include Biacore, Nicoya Alto, Affinité P4SPR [1] [7] | Benchtop systems now offer automated fluidics and user-friendly software [1] |
| Sensor Chips (CM5, C1) | Gold surface with carboxymethyl-dextran matrix for ligand immobilization [39] | C1 chips provide flatter surface better suited for large analytes [39] |
| Running Buffer | Provides consistent chemical environment for interactions | Typically HBS-EP (10mM HEPES, 150mM NaCl, 3mM EDTA, 0.05% surfactant P20) |
| Amine Coupling Kit | Contains EDC/NHS for activating carboxyl groups on chip surface | Standard chemistry for immobilizing proteins via primary amines |
| Regeneration Solution | Removes bound analyte without damaging immobilized ligand | Varies by application (often low pH glycine, high salt, or mild detergent) |
Calculating Time to Equilibrium from SPR Data
The time to equilibrium (tequil) represents a critical parameter derived from SPR kinetics that directly informs ELISA incubation time. From SPR data, both the association rate constant (kon) and dissociation rate constant (koff) are obtained through global fitting of the concentration series sensorgrams to an appropriate binding model (typically 1:1 Langmuir binding) [5].
The time to equilibrium can be calculated based on these kinetic constants. For practical purposes, equilibrium is considered established when the system reaches 95% of the final equilibrium response. The approximate time to reach this level can be calculated using the equation: tequil ≈ ln(20)/(kon × [A] + koff), where [A] is the analyte concentration. In practice, using the highest analyte concentration tested provides a conservative estimate that ensures equilibrium across the entire concentration range [5].
Implementing SPR-Guided ELISA Protocols
Once tequil has been determined through SPR analysis, this parameter should directly dictate the minimum incubation time in the corresponding ELISA protocol. For the alpaca antibody case study, this would translate to implementing a minimum 5.34-hour incubation for clone R4 and 2.29-hour incubation for clone R9 [5]. It is prudent to add a safety margin of 10-20% to the calculated tequil to ensure full equilibrium is reached across all assay wells.
Following the establishment of SPR-guided incubation times, traditional ELISA optimization techniques should be employed to validate and refine the overall protocol. Checkerboard titration remains a fundamental approach, systematically testing different concentrations of capture and detection antibodies to identify optimal conditions that maximize signal-to-noise ratio [40] [41]. Similarly, spike-and-recovery experiments assess the impact of the sample matrix on the ELISA readout, while dilutional linearity experiments determine the assay's quantitative range [40] [41].
Advanced Applications and Quality Control
SPR for Clinical Assay Quality Control
The application of SPR extends beyond research settings into clinical assay quality control. A 2022 study demonstrated that kinetic characterization of SPR-based biomarker assays enables extensive quality control opportunities by exploiting quantitative descriptions of various biomolecular interactions [42]. The research showed accurate prediction of SPR measurements at both low and high analyte concentrations with deviations of less than 5% between actual measurements and predicted values [42].
This SPR-based toolbox enables optimal detection of assay confounders including heterophilic antibodies, cross-reactivity, and spotting irregularities [42]. Furthermore, the kinetic data can generate simulated calibration curves, enabling calibration-free measurements with good recovery rates [42]. This approach facilitates easy assay optimization and could help bridge the gap to bring new biomarker assays to clinical practice, addressing a critical need in diagnostic development.
Broader Applications in Biotherapeutic Development
The SPR-guided approach extends beyond traditional ELISA optimization to address challenges across biotherapeutic development. In nanotherapeutic (nanoRx) development, SPR can rapidly quantify specific and non-specific interactions of nanoparticle formulations, enabling screening and design of targeted delivery systems [39]. The technique has been particularly valuable in characterizing the binding affinity of novel small molecule and biomolecule-derived therapeutics for various diseases including lupus medications, thrombin inhibitors, HIV protease inhibitors, and DNA gyrase inhibitors [39].
For immunogenicity assessment, SPR's drug-tolerant nature allows detection of anti-drug antibodies even in the presence of circulating drug, a significant limitation of conventional ELISA [4]. In the infliximab study, SPR detected ADAs in nine patients with detectable drug levels who were ADA-negative by ELISA, providing critical clinical information that would otherwise be missed [4].
The integration of SPR kinetics to guide ELISA incubation times represents a fundamental advancement in biomolecular interaction analysis. By providing direct measurement of the time to equilibrium (tequil), SPR transforms ELISA from a potentially misleading endpoint assay into a quantitatively reliable method for affinity assessment. The striking discrepancies between SPR and ELISA measurements—with ELISA reporting KD values 14.1 to 43.7-fold higher than SPR in controlled studies—underscore the critical importance of establishing equilibrium conditions for accurate affinity measurement [5].
This integrated approach enables researchers to rationally design ELISA protocols with scientifically-grounded incubation parameters, moving beyond the arbitrary and often insufficient timeframes commonly employed. The resulting data quality improvement has far-reaching implications across therapeutic antibody development, immunogenicity assessment, and clinical diagnostics. Furthermore, SPR's capability to detect low-affinity interactions and characterize binding kinetics in real-time addresses fundamental limitations of conventional ELISA, particularly for complex clinical samples where antibody affinities vary widely [5] [4].
As the biotherapeutic landscape continues to evolve toward more complex molecules and targeted delivery systems, the synergy between label-free kinetic analysis by SPR and optimized endpoint detection by ELISA provides a powerful framework for advancing research and development programs. By embracing this integrated methodology, researchers can ensure their affinity measurements reflect true biological interactions rather than methodological artifacts, ultimately accelerating the development of more effective biotherapeutics and diagnostics.
Enzyme-linked immunosorbent assay (ELISA) remains the gold standard for quantitative protein biomarker detection due to its robustness, accessibility, and adaptability [43]. However, a significant sensitivity gap exists between conventional ELISA and nucleic acid-based tests; while nucleic acid tests can achieve detection limits in the atto- to femtomolar range, traditional ELISA is typically limited to the pico- to nanomolar range [43]. This limitation becomes critically important when detecting low-abundance protein biomarkers for early disease diagnosis, therapeutic monitoring, and fundamental research.
The emergence of surface plasmon resonance (SPR) as a label-free biomolecular detection technique has provided both a complementary technology and a valuable analytical tool for understanding ELISA's limitations. SPR measures binding events in real-time, providing detailed kinetic data (association rate k_on, dissociation rate k_off, and equilibrium constant K_D) that endpoint assays like ELISA cannot capture [1] [5]. Comparative studies have revealed that ELISA often underestimates antibody binding affinity—sometimes by more than 40-fold—particularly for low-affinity interactions or rapidly-dissociating binders that are lost during ELISA's extensive washing and incubation steps [5] [4]. This fundamental understanding, enabled by SPR analysis, has driven the development of advanced strategies to enhance ELISA sensitivity, particularly through surface engineering with nanoparticles and improved substrates.
Surface Modification Strategies for Enhanced Biomolecule Immobilization
The initial coating of capture antibodies onto a solid surface significantly influences target immobilization efficiency in sandwich ELISA. Traditional passive adsorption via hydrophobic interactions often results in random antibody orientation and partial denaturation, reducing the number of functionally active capture antibodies [43]. Advanced surface modification strategies address these limitations through several mechanisms.
Nonfouling Surface Modifications
Nonfouling surface modifications using synthetic polymers and polysaccharides prevent non-specific protein adsorption, thereby improving the signal-to-noise ratio. Polyethylene glycol (PEG) grafting creates a hydrophilic barrier that resists non-specific interactions [43]. Recent developments include PEG-grafted copolymer systems that enable multivalent antibody conjugation, simultaneously minimizing nonspecific adsorption and enhancing immunoassay sensitivity by improving antibody accessibility and avidity [43]. Alternative materials such as dextran, chitosan, and hyaluronic acid have also demonstrated successful reductions in non-specific adsorption while enhancing protein immobilization capacity [43].
Antibody Orientation Strategies
Proper orientation of capture antibodies substantially improves antigen accessibility and assay reproducibility. The following table summarizes key antibody orientation strategies:
Table 1: Antibody Orientation Strategies for Enhanced ELISA Sensitivity
| Strategy | Mechanism | Advantages | Limitations |
|---|---|---|---|
| Protein A/G Immobilization | Bacterial proteins binding Fc region of antibodies | Uniform and stable orientation | Costly due to purification requirements |
| Biotin-Streptavidin System | Strong biotin-streptavidin interaction ensures uniform immobilization | Exceptionally strong interaction reduces variability | Requires prior biotinylation of antibody |
| Covalent Crosslinking | Permanent, stable attachment to solid surface | Prevents antibody loss during washes | Can be combined with antifouling polymers |
| Protein G-Expressing Cells | Fixed cells displaying Protein G on surface | Enhanced antibody-capacity through high-surface-area substrate | Eliminates need for purified Protein G [43] |
Nanoparticle-Enhanced Signal Amplification
Nanoparticles represent one of the most promising approaches for enhancing ELISA sensitivity by dramatically increasing the signal-generating capacity per binding event. Their high surface area-to-volume ratio enables conjugation with multiple detection molecules, significantly amplifying the output signal.
Antibody-Nanoparticle Conjugates
Replacing freely delivered primary antibodies with antibody-nanoparticle conjugates provides excess binding sites for detectable secondary antibodies, ultimately leading to increased signal intensity [44]. In a model system using gold nanoshells (NS) decorated with antibodies specific to epidermal growth factor receptor (EGFR), researchers achieved a substantial 13-fold signal enhancement compared to unconjugated antibodies in cell-based ELISA formats [44]. Furthermore, the study demonstrated that approximately 40 times more unconjugated antibodies were required to detect EGFR at comparable levels to those conjugated to nanoparticles, confirming the significant sensitivity improvement [44].
The underlying mechanism involves the large surface area of 150nm diameter nanoshells (composed of 120nm silica cores and 15nm thick gold shells), which enables conjugation of numerous primary antibodies, each capable of binding multiple enzyme-conjugated secondary antibodies [44]. This multi-layer amplification strategy dramatically lowers the detection limit of traditional ELISA.
Alternative Nanoparticle Platforms
Beyond gold nanoshells, several other nanoparticle platforms have shown promise for ELISA enhancement:
- Silica nanoparticles containing fluorescent dyes can overcome autofluorescence in complex matrices like blood when precisely controlled dye loading is implemented [44].
- Surface-enhanced Raman scattering (SERS) nanoparticles provide extremely high sensitivity with minimal background, though they require complex synthesis and specialized detection equipment [44].
- Magnetic nanoparticles improve washing efficiency and facilitate separation processes, thereby reducing background signal [43].
Advanced Substrate Systems and Detection Methodologies
Beyond nanoparticle conjugation, significant advances in substrate chemistry and detection methodologies have contributed to enhanced ELISA sensitivity.
Enzyme Substrate Optimization
The choice of enzyme-substrate systems directly impacts detection sensitivity. Traditional colorimetric substrates for horseradish peroxidase (HRP) and alkaline phosphatase (AP) remain widely used due to their simplicity and cost-effectiveness [26]. However, advanced substrates offering enhanced signal generation have emerged:
- Enhanced chemiluminescent substrates provide superior sensitivity through enzymatic reactions that produce light emission, detectable at much lower concentrations than colorimetric changes.
- Electrochemiluminescent reporters generate signals upon electrical stimulation, offering extremely low background and high dynamic range [26].
- Fluorogenic substrates enable fluorescence-based detection with potentially higher sensitivity than colorimetric methods [26].
Paper-Based ELISA Platforms
Paper-based ELISA (p-ELISA) represents an innovative approach that leverages the unique properties of cellulose paper to enhance sensitivity and reduce costs. The high surface area-to-volume ratio of paper substrates facilitates faster reaction kinetics and enables analysis with significantly smaller reagent volumes (as low as 3μL compared to 50-200μL in conventional ELISA) [45]. The white background of paper also provides high contrast for colorimetric detection, improving signal-to-noise ratios [45].
Fabrication methods for p-ELISA devices include:
- Photolithography for creating precise hydrophobic barriers on paper
- Wax printing for rapid, inexpensive patterning
- Inkjet printing for precise deposition of reagents and creation of hydrophobic barriers [45]
These platforms are particularly valuable for point-of-care applications and resource-limited settings, though they may face challenges with background noise and environmental sensitivity [45].
Synthetic Biology-Driven Signal Amplification
Cell-free synthetic biology represents a revolutionary approach to augmenting ELISA sensitivity by integrating programmable nucleic acid and protein synthesis systems into traditional immunoassay workflows [43].
Emerging Synthetic Biology Platforms
Several innovative platforms combine the specificity of immunoassays with the amplification power of nucleic acid techniques:
- Expression Immunoassays: Utilize cell-free protein synthesis systems to generate detectable proteins in response to antigen-antibody binding.
- CRISPR-Linked Immunoassays (CLISA): Employ CRISPR-Cas systems to amplify signals through nucleic acid detection and cleavage mechanisms.
- T7 RNA Polymerase-Linked Immunosensing Assays (TLISA): Leverage bacteriophage RNA polymerase amplification for ultra-sensitive detection [43].
These approaches demonstrate how synthetic biology components can be integrated to create modular, adaptable diagnostic platforms that surpass the sensitivity limitations of traditional ELISA while maintaining the specificity of antibody-antigen recognition [43].
Experimental Protocols for Implementing Enhanced ELISA
Protocol for Antibody-Nanoparticle Conjugate-Based ELISA
The following protocol details the implementation of antibody-nanoparticle conjugates for enhanced sensitivity, based on methodology validated in published research [44]:
Materials Required:
- Gold nanoshells (150nm diameter with 120nm silica core, 15nm gold shell)
- Primary antibodies specific to target antigen
- Horseradish peroxidase (HRP)-conjugated secondary antibodies
- Colorimetric substrate (e.g., TMB for HRP)
- Standard ELISA microplates
- Blocking buffer (e.g., PBS with 1% BSA)
- Washing buffer (e.g., PBS with 0.05% Tween-20)
Procedure:
- Nanoparticle Functionalization:
- Incubate gold nanoshells with thiolated primary antibodies (10μg antibody per 1mL of nanoshells at 1×10^10 particles/mL) for 16 hours at 4°C with gentle agitation.
- Purify conjugates by centrifugation at 3000g for 10 minutes and resuspend in PBS.
Antigen Capture:
- Coat plates with capture antibody (if using sandwich format) or antigen (if using direct format) overnight at 4°C.
- Block plates with 1% BSA in PBS for 2 hours at room temperature.
- Apply samples containing target antigen and incubate for 2 hours at 37°C.
Detection with Nanoparticle Conjugates:
- Add functionalized antibody-nanoparticle conjugates and incubate for 1-2 hours at 37°C.
- Wash plates 4 times with washing buffer to remove unbound conjugates.
Signal Development:
- Add HRP-conjugated secondary antibodies specific to the primary antibodies on nanoparticles.
- Incubate for 1 hour at room temperature.
- Wash plates 4 times.
- Add colorimetric substrate and incubate for 15-30 minutes.
- Measure absorbance at appropriate wavelength.
Validation: Compare signals against standard ELISA using unconjugated antibodies to confirm enhancement factor.
SPR-Guided ELISA Optimization Protocol
Surface plasmon resonance can be employed to determine optimal incubation times for ELISA, ensuring equilibrium binding conditions [5]:
Materials Required:
- SPR instrument with appropriate sensor chips
- Purified target antigen and antibodies
- Standard ELISA reagents
Procedure:
- Kinetic Characterization by SPR:
- Immobilize antigen on SPR sensor chip using standard amine coupling.
- Inject antibody solutions at multiple concentrations over antigen surface.
- Monitor association and dissociation phases in real-time.
- Determine kinetic parameters (kon, koff) and calculate equilibrium dissociation constant (K_D).
Calculation of Time to Equilibrium (t_equil):
- Use SPR-derived kinetic constants to calculate tequil ≈ 3 / (kon × [Antibody] + k_off) for typical conditions.
- Alternatively, directly observe time required to reach steady-state response in SPR sensograms.
ELISA Protocol Optimization:
- Set ELISA incubation time to exceed calculated t_equil by at least 20%.
- For high-affinity interactions with slow k_off, this may require extended incubation (up to several hours).
Application Example: In a study of alpaca antibodies, SPR revealed tequil values of 5.34 hours for clone R4 and 2.29 hours for clone R9. ELISA using these optimized incubation times provided KD values consistent with SPR measurements, whereas shorter incubations significantly underestimated affinity [5].
Comparative Analysis of Detection Technologies
Quantitative Comparison of Enhancement Strategies
The following table summarizes the performance characteristics of major ELISA enhancement strategies:
Table 2: Performance Comparison of ELISA Enhancement Strategies
| Enhancement Strategy | Sensitivity Improvement | Detection Limit | Implementation Complexity | Cost Impact |
|---|---|---|---|---|
| Traditional ELISA | Baseline | pico- to nanomolar [43] | Low | Low |
| Antibody-Nanoparticle Conjugates | 13-fold signal enhancement [44] | Improved by 40x in required antibody [44] | Moderate | Moderate |
| Nonfouling Surface Modifications | Improved signal-to-noise ratio | Not quantified | Low to Moderate | Low |
| Oriented Antibody Immobilization | 2-5 fold improvement estimated | Not quantified | Moderate | Moderate |
| Paper-Based ELISA | Similar or slightly reduced vs. conventional ELISA [45] | Not quantified | Low | Significant reduction |
| Synthetic Biology Approaches | Potential for attomolar level [43] | Atto- to femtomolar range [43] | High | High |
SPR vs. ELISA: Complementary Techniques
SPR and ELISA should be viewed as complementary rather than competing technologies. The following diagram illustrates their comparative workflows and key differentiators:
Diagram: Comparative Workflows of SPR and ELISA Technologies
Critical differences revealed by comparative studies include:
- Drug-tolerant detection: SPR can detect anti-drug antibodies (ADA) even in the presence of the drug, whereas ELISA typically requires drug-free samples [4]. In one study, SPR detected ADA in 8 additional patients considered ADA-negative by ELISA [4].
- Affinity assessment: ELISA often underestimates binding affinity. One study reported ELISA K_D values 43.7-fold higher (weaker affinity) than SPR measurements for the same antibody [5].
- Low-affinity interaction detection: SPR effectively quantifies both low-affinity and high-affinity interactions, while ELISA struggles with low-affinity binders that dissociate during washing steps [1] [5].
The Scientist's Toolkit: Essential Research Reagents and Materials
Successful implementation of enhanced ELISA requires carefully selected reagents and materials. The following table details key components for nanoparticle-enhanced ELISA:
Table 3: Research Reagent Solutions for Enhanced ELISA
| Reagent/Material | Function | Key Considerations | Example Specifications |
|---|---|---|---|
| Gold Nanoshells | Signal amplification platform | Size, surface chemistry, conjugation efficiency | 150nm diameter (120nm silica core + 15nm gold shell) [44] |
| Functionalized Nanoparticles | Enhanced detection | Stability, antibody loading capacity | Thiolated antibodies for gold conjugation [44] |
| PEG-Based Blocking Reagents | Reduce non-specific binding | Molecular weight, concentration | PEG-grafted copolymers for multivalent conjugation [43] |
| Oriented Coating Systems | Improve antibody functionality | Binding specificity, stability | Protein A/G, biotin-streptavidin, covalent crosslinkers [43] |
| Enhanced Chemiluminescent Substrates | Signal generation | Sensitivity, dynamic range, stability | HRP or AP substrates with low background |
| SPR Instrumentation | Method validation and optimization | Throughput, sensitivity, fluidics | Multi-channel systems for parallel analysis [5] |
The integration of nanoparticle technology, advanced substrates, and surface engineering strategies has significantly advanced ELISA sensitivity, narrowing the gap with nucleic acid-based detection methods. The synergistic application of these approaches—guided by mechanistic insights from SPR analysis—enables detection of low-abundance biomarkers previously beyond the reach of conventional immunoassays.
Future developments will likely focus on several key areas. First, the integration of multiplexed detection capabilities will enable simultaneous measurement of multiple biomarkers from minimal sample volumes. Second, point-of-care adaptation of enhanced ELISA through paper-based platforms and smartphone-based detection will expand accessibility. Finally, the continued convergence of synthetic biology with immunoassay technology promises to create entirely new detection paradigms with potentially revolutionary sensitivity improvements.
As these technologies mature, the distinction between traditional immunoassays and molecular detection methods will continue to blur, ultimately providing researchers and clinicians with an expanding toolkit for understanding disease mechanisms, enabling earlier diagnosis, and monitoring therapeutic interventions with unprecedented precision.
Validation & Comparative Analysis: SPR vs. ELISA Performance
The selection of an appropriate analytical technique is a critical decision in biotherapeutic development and basic research. For decades, the enzyme-linked immunosorbent assay (ELISA) has been regarded as the gold standard for detecting and quantifying biomolecules, from antibodies and proteins to hormones, owing to its high sensitivity, specificity, and accessibility [1]. However, the evolving complexity of scientific questions, particularly in drug discovery, necessitates tools that can provide more detailed interaction data with greater efficiency. Surface Plasmon Resonance (SPR) has emerged as a powerful label-free technology that enables real-time, kinetic analysis of biomolecular interactions [1] [46]. This whitepaper provides an in-depth, technical comparison of SPR and ELISA, framing the discussion within the broader thesis that while ELISA offers accessibility and cost-effectiveness, SPR delivers unparalleled kinetic insights and can guide the optimization of traditional immunoassays.
Surface Plasmon Resonance (SPR)
SPR is an optical sensing technique that detects changes in the refractive index at a metal surface (typically gold) [1]. The fundamental assay involves immobilizing one interaction partner (the ligand) on the sensor chip and flowing the other (the analyte) over the surface [1]. When binding occurs, the resulting mass change alters the refractive index at the sensor surface, shifting the SPR angle, which is monitored in real time [47]. This continuous monitoring allows for the direct determination of binding affinity and kinetics—specifically, the association rate (kon), dissociation rate (koff), and the equilibrium dissociation constant (KD) [1] [5]. SPR is particularly valuable for challenging targets like G protein-coupled receptors (GPCRs), where maintaining stability outside the membrane environment is difficult, and for applications in cancer detection where high sensitivity is required [47] [46].
Enzyme-Linked Immunosorbent Assay (ELISA)
ELISA is a well-established, plate-based immunoassay technique. In a typical sandwich ELISA, a capture antibody is immobilized on a microplate. The sample containing the antigen is added, followed by a detection antibody that is linked to an enzyme, such as horseradish peroxidase. After a series of washing steps to remove unbound material, a substrate is added, and the enzymatic reaction produces a measurable signal, usually a color change, which is quantified using a plate reader [1]. As an end-point assay, ELISA excels at quantifying the amount of a target biomolecule present in a sample but does not provide direct information on the kinetics of the interaction [1]. Its robustness and the widespread availability of required instrumentation have cemented its role in laboratories worldwide.
Comparative Performance Analysis
The following table provides a direct, quantitative comparison of the core characteristics of SPR and ELISA.
Table 1: Head-to-head comparison of SPR and ELISA technologies.
| Parameter | Surface Plasmon Resonance (SPR) | Enzyme-Linked Immunosorbent Assay (ELISA) |
|---|---|---|
| Data Measurement | Real-time, label-free analysis providing kinetic data (kon, koff) and affinity (KD) [1] [5]. | End-point analysis providing quantitative concentration data but no kinetic parameters [1]. |
| Sensitivity (Limit of Detection) | High sensitivity; can detect low-affinity interactions often missed by ELISA. In one study, SPR identified a 4% positivity rate for anti-drug antibodies vs. 0.3% by ELISA [1]. Configurations with 2D materials can achieve sensitivity up to 342 deg/RIU for cancer cell detection [47]. | High sensitivity for high-affinity interactions. May underestimate binding affinity if equilibrium is not reached, leading to potential false negatives for low-affinity binders [1] [5]. |
| Assay Time | Significantly faster; protocols can be completed in hours or less due to simplified, automated workflows and real-time detection [1]. | Labor-intensive and time-consuming; involves long incubation, washing, and blocking steps, often taking more than a day to complete [1]. |
| Label Requirement | Label-free; detection is based on changes in refractive index [1]. | Requires enzyme-labeled antibodies and substrates for signal generation [1]. |
| Low-Affinity Interaction Detection | Effectively quantifies both low- and high-affinity interactions due to real-time monitoring and minimal washing [1]. | Poor for low-affinity interactions; multiple washing steps can remove weakly bound complexes, leading to false negatives [1]. |
| Cost & Accessibility | High upfront instrument cost and potentially high maintenance for fluidics-based systems. Newer digital SPR systems aim to lower these barriers [1]. | Highly cost-effective and accessible; utilizes standard lab equipment (pipettes, plate readers) [1]. |
| Learning Curve | Steeper learning curve for traditional systems, requiring extensive training. Modern benchtop systems are designed for easier use [1]. | Short learning curve; relies on basic, transferable lab skills like pipetting [1]. |
Experimental Protocols for Comparative Analysis
To ensure the reliability of data when comparing these techniques, rigorous and optimized experimental protocols must be followed.
SPR Experimental Protocol for Kinetic Analysis
Objective: To determine the kinetic rate constants and affinity of an antibody-antigen interaction.
- Sensor Chip Preparation: A gold sensor chip is cleaned, often with a piranha solution, to ensure a pristine surface [48].
- Surface Functionalization: The chip is functionalized with a self-assembled monolayer (SAM), typically using 11-mercaptoundecanoic acid (11-MUA), to create a carboxyl-terminated surface [48].
- Ligand Immobilization:
- The carboxyl groups are activated with a mixture of EDC (N-(3-dimethylaminopropyl)-N'-ethylcarbodiimide hydrochloride) and NHS (N-hydroxysuccinimide) [48] [49].
- The ligand (e.g., an antibody or antigen) is covalently coupled to the activated surface. For optimal results, oriented immobilization using Protein G should be employed. Protein G is first immobilized, and then the antibody is captured via its Fc region, maximizing paratope accessibility. This method has been shown to achieve a 2.9-fold lower detection limit and significantly higher binding affinity compared to random, covalent attachment [48].
- Remaining active esters are deactivated with ethanolamine [49].
- Kinetic Data Acquisition:
- The analyte is injected over the ligand surface at a series of concentrations (e.g., two-fold serial dilutions) using a microfluidic system [5] [49].
- The association phase is monitored in real-time during analyte injection.
- The dissociation phase is monitored by switching back to running buffer.
- A regeneration solution (e.g., 15 mM NaOH with 0.2% SDS) may be used to remove bound analyte without damaging the ligand, allowing for multiple analysis cycles on the same surface [48].
- Data Analysis: The resulting sensorgrams (response vs. time) are fitted to a binding model (e.g., 1:1 Langmuir) using the instrument's software to calculate kon, koff, and KD (where KD = koff/kon) [5].
Sandwich ELISA Protocol for Quantification
Objective: To quantify the concentration of a target antigen in a sample.
- Coating: A capture antibody is adsorbed onto a polystyrene microplate by incubating overnight at 2-8°C or for 1-2 hours at 37°C in a carbonate/bicarbonate buffer (pH ~9.6) [50].
- Washing and Blocking: The plate is washed with a buffer containing a detergent (e.g., PBS with 0.05% Tween 20) to remove unbound antibody. Remaining protein-binding sites are blocked with a concentrated protein solution (e.g., 1-5% BSA or non-fat dry milk) for 1-2 hours [50].
- Sample Incubation: The sample or antigen standard is added to the wells and incubated for 1-2 hours to allow binding to the capture antibody. Critical Note: The incubation time must be sufficient for the system to reach equilibrium. SPR-derived kinetic data can be used to calculate the time to equilibrium (tequil), ensuring accurate affinity measurement. For example, an alpaca antibody clone required 5.34 hours to reach equilibrium, which would not be achieved in a standard, shorter ELISA protocol [5].
- Detection Antibody Incubation: After washing, an enzyme-conjugated detection antibody is added and incubated for 1-2 hours.
- Signal Development and Readout: Following a final wash, a colorimetric substrate (e.g., TMB for HRP) is added. The enzyme catalyzes a reaction that produces a colored product. The reaction is stopped with acid, and the absorbance is measured with a microplate reader [50].
Workflow and Data Relationship Visualization
The fundamental difference between SPR and ELISA lies in their workflow and the nature of the data they generate. The following diagram illustrates these distinct processes and outputs.
Diagram: Workflow and data output comparison of SPR and ELISA.
The Scientist's Toolkit: Key Research Reagent Solutions
The following table details essential materials and reagents required for implementing SPR and ELISA methodologies, based on the experimental protocols cited.
Table 2: Essential research reagents and materials for SPR and ELISA.
| Item | Function / Application | Relevant Protocol / Technology |
|---|---|---|
| Sensor Chips (Gold) | The core sensing surface for SPR instruments, functionalized to immobilize ligands [48] [49]. | SPR |
| 11-Mercaptoundecanoic acid (11-MUA) | Forms a self-assembled monolayer (SAM) on gold surfaces, providing carboxyl groups for ligand immobilization [48]. | SPR |
| Protein G | Used for oriented immobilization of antibodies via their Fc region, significantly enhancing sensitivity and binding affinity in SPR [48]. | SPR |
| EDC & NHS | Cross-linking agents for activating carboxyl groups on sensor surfaces or other matrices for covalent coupling of ligands [48] [49]. | SPR, ELISA (coating) |
| Anti-Mouse IgG Capture Kit | Allows for indirect capture of mouse antibodies on the sensor surface, facilitating analysis of low-concentration samples or epitope mapping [49]. | SPR |
| Polystyrene Microplates | Solid surface for adsorption of capture antibodies in ELISA [50]. | ELISA |
| Enzyme-Conjugated Antibodies | Detection antibodies linked to enzymes (e.g., HRP) generate a measurable signal upon substrate addition in ELISA [1] [50]. | ELISA |
| TMB (3,3',5,5'-Tetramethylbenzidine) | A chromogenic substrate for HRP that produces a blue color upon reaction, which turns yellow when stopped with acid. Absorbance is measured at 450 nm [50]. | ELISA |
The choice between SPR and ELISA is not a matter of identifying a universal winner but of selecting the right tool for the specific research question and stage of development. ELISA remains a powerful, cost-effective, and accessible workhorse for high-throughput quantitative analysis, especially when absolute concentration is the primary required data point. In contrast, SPR provides a comprehensive biophysical profile of an interaction, delivering critical kinetic parameters that are indispensable for understanding the mechanism and strength of binding, particularly in antibody characterization and drug discovery [1] [5]. Furthermore, as demonstrated, SPR is not merely a replacement for ELISA but can serve as a powerful orthogonal method to guide and validate ELISA development, ensuring that incubation times are sufficient to achieve equilibrium and that reported affinities are accurate [5]. For the modern researcher, integrating both technologies—using SPR for detailed characterization and assay optimization, and ELISA for subsequent high-throughput screening—represents a powerful synergy that accelerates and de-risks the path from discovery to development.
The detection of anti-drug antibodies (ADAs) is a critical component in the development and therapeutic monitoring of biologic drugs. These antibodies can trigger immune responses that neutralize a drug's efficacy and lead to adverse clinical effects [51]. For years, the enzyme-linked immunosorbent assay (ELISA) has been the established, gold-standard method for immunogenicity testing due to its high sensitivity, specificity, and accessibility [1]. However, a growing body of research indicates that ELISA may have significant limitations, particularly in its ability to detect the full spectrum of ADA responses.
This case study explores these limitations through the lens of a comparative methodological principle: the endpoint, label-dependent nature of ELISA versus the real-time, label-free capability of surface plasmon resonance (SPR). We examine a clinical investigation involving patients treated with infliximab, an anti-TNFα monoclonal antibody, where SPR and ELISA yielded divergent results. The data underscores how the fundamental principles governing each technique directly impact the reliability and clinical utility of immunogenicity data, with major implications for patient management and drug development.
Technical Principles: SPR vs. ELISA
The core differences between SPR and ELISA stem from their underlying mechanisms for detecting molecular interactions.
Enzyme-Linked Immunosorbent Assay (ELISA)
ELISA is an endpoint assay that relies on indirect detection. In a typical sandwich ELISA for ADA detection:
- The drug (e.g., infliximab) is immobilized on a plate.
- Patient serum is added, and any ADAs present bind to the drug.
- After incubation, unbound components are washed away.
- A labeled detection antibody (e.g., enzyme-linked) is added to bind the captured ADAs.
- A final wash is performed before adding a substrate to generate a measurable colorimetric signal [1] [5].
The extensive washing steps and reliance on a secondary label mean that the final signal is only a snapshot after these potentially disruptive processes. The assay does not provide information on the real-time dynamics of the binding event.
Surface Plasmon Resonance (SPR)
SPR is a label-free, real-time biosensing technique. In an SPR immunoassay:
- One interaction partner (the ligand, e.g., the drug) is immobilized on a sensor chip.
- The other partner (the analyte, e.g., patient serum containing ADA) is flowed over the surface in a microfluidic system.
- Binding events between the ligand and analyte cause changes in the refractive index at the sensor surface, which are detected as a shift in the SPR angle [1] [4].
- This interaction is monitored in real time, producing a sensorgram that visually represents the association and dissociation phases of the binding event.
This process allows SPR to determine both the affinity (equilibrium dissociation constant, KD) and kinetics (association rate kon and dissociation rate koff) of an interaction without labels or washing steps during the detection phase [1].
Diagram 1: Fundamental workflow differences between ELISA and Surface Plasmon Resonance (SPR).
Case Study: Detecting Anti-Infliximab Antibodies
A 2021 study by Beeg et al. provides a compelling clinical example of the practical implications of these technical differences. The study compared a commercial ELISA (LISA-TRACKER Duo Infliximab) with an SPR-based immunoassay for measuring infliximab and corresponding ADA levels in 76 patients with inflammatory bowel disease (IBD) [4].
Experimental Protocol
A. Sample Collection and Preparation
- Serum samples were collected from 76 patients on maintenance therapy with infliximab for Crohn's disease or ulcerative colitis.
- For the SPR assay, serum samples were subjected to an acidic pre-treatment step. This dissociates any existing drug-ADA immune complexes, conferring drug tolerance and allowing for the detection of ADA even in the presence of the drug [4].
B. SPR Immunoassay Protocol
- Sensor Chip Functionalization: The sensor chip was prepared with two parallel flow cells:
- One coated with Tumor Necrosis Factor-alpha (TNFα), the target of infliximab, to capture and measure serum infliximab levels.
- One coated with infliximab to capture and measure anti-infliximab ADAs.
- Sample Injection: Diluted and acid-treated patient serum was injected over both sensor surfaces simultaneously.
- Real-Time Monitoring: Binding of serum infliximab to TNFα and/or ADA to immobilized infliximab was monitored in real time.
- Data Analysis: Response units from the sensorgram were converted into concentration values using calibration curves. All samples were analyzed in triplicate for reproducibility [4].
C. ELISA Protocol The study followed the standard protocol for the commercial LISA-TRACKER Duo Infliximab kit, a drug-sensitive assay. This means the presence of the drug in the sample can interfere with ADA detection [4].
Key Findings and Quantitative Results
The two methods showed strong agreement for measuring serum concentrations of the infliximab drug itself [4]. The divergence was striking in the detection of ADAs.
Table 1: Summary of ADA Detection Results in 76 Patient Sera [4]
| Method | Patients ADA-Positive | ADA Detectable in Presence of Drug | Absolute ADA Concentration |
|---|---|---|---|
| ELISA | 14 (18%) | No | 7 to 490 times lower than SPR |
| SPR | 22 (29%) | Yes (9 patients) | Higher, no correlation with ELISA |
Furthermore, in the 14 samples that were ADA-positive by both methods, the absolute concentrations measured by SPR were 7 to 490 times higher than those reported by ELISA, with no correlation between the values [4] [5].
Analysis of Discrepancies: The Kinetic Pitfall of ELISA
The observed discrepancies are not due to random error but are a direct consequence of the technical principles of each method, particularly concerning antibody kinetics and affinity.
The Challenge of Low-Affinity and Transient Antibodies
Patient-generated ADAs are often polyclonal, meaning they are a mixture of antibodies with varying affinities and kinetic properties. Many of these are low-affinity antibodies with fast dissociation rates (koff) [4] [5].
- In an SPR assay, the binding is monitored in real time. Fast-dissociating, low-affinity ADAs bind and dissociate from the sensor surface, but this interaction is still captured within the sensorgram data, allowing for their detection and characterization [6].
- In an ELISA, the multiple and lengthy wash steps are a critical point of failure for these antibodies. Low-affinity ADAs that bind to the immobilized drug during incubation are highly likely to dissociate during the washing steps before detection. This leads to their loss and results in a false negative or a significant underestimation of their concentration [4] [5].
The Calibrator Problem
ELISAs rely on a calibration curve made with a known, high-affinity commercial anti-drug antibody.
- This calibrator antibody is typically selected for its strong binding (slow koff) and remains bound throughout the ELISA washes.
- Patient ADAs with faster dissociation are unfairly compared to this stable calibrator. The signal loss due to their dissociation is misinterpreted as a lower concentration [5].
The Beeg et al. study confirmed this by analyzing the sensorgrams of the 8 patients who were ADA-positive only by SPR. These ADAs exhibited significantly faster dissociation rate constants than those detectable by both methods, explaining why they were lost during the ELISA protocol [4].
Diagram 2: Impact of assay design on the detection of low-affinity antibodies. ELISA washing steps selectively remove fast-dissociating antibodies, while SPR captures the full range of affinities.
Comparative Data and Technical Specifications
The following tables summarize the core technical and performance differences between SPR and ELISA for ADA detection, as evidenced by the case study and broader literature.
Table 2: Technical Comparison of SPR and ELISA for ADA Detection [1] [4] [52]
| Parameter | SPR | ELISA |
|---|---|---|
| Detection Principle | Label-free, refractive index change | Enzyme-labeled, colorimetric/chemiluminescent |
| Data Type | Real-time kinetics (kon, koff) & affinity (KD) | Endpoint, concentration only |
| Assay Time | Minutes to a few hours | Often > 1 day |
| Hands-on Time | Low (automated fluidics) | High (multiple manual steps) |
| Drug Tolerance | High (with sample pre-treatment) | Low |
| Sensitivity to Low-Affinity ADA | High | Low |
| Throughput | Medium (modern systems are increasing) | High |
| Cost Profile | Higher initial instrument cost | Lower initial cost, recurring reagent costs |
Table 3: Key Reagent Solutions for ADA Assays
| Research Reagent | Function in Assay | Context from Case Study |
|---|---|---|
| Sensor Chip | Solid support for immobilizing one interaction partner (ligand). | SPR chip was functionalized with TNFα and infliximab in parallel flow cells [4]. |
| Recombinant Antigen/Protein | The purified target protein used to capture the drug or antibodies. | Recombinant TNFα and the drug infliximab itself were immobilized to capture serum IFX and ADA, respectively [4]. |
| Calibrator Antibodies | Known, high-affinity antibodies used to generate a standard curve for quantification. | High-affinity commercial ADA calibrators used in ELISA can mask the presence of patient low-affinity ADAs [4] [5]. |
| Regeneration Buffer | A solution that dissociates bound analytes without damaging the immobilized ligand, allowing sensor chip re-use. | The SPR sensor chip could be regenerated at least 9 times, enabling multiple analyses with the same surface [53]. |
This case study demonstrates that the choice of analytical technique for immunogenicity assessment is not merely a matter of convenience but has direct clinical relevance. The finding that SPR detected ADA in 8 patients (10.5% of the cohort) who were considered ADA-negative by ELISA is significant [4]. For these patients, the underlying cause of drug failure could be misdiagnosed, potentially leading to ineffective treatment decisions.
The principle revealed is that ELISA, as an endpoint assay, is inherently biased toward detecting high-affinity interactions. Its format, while robust and high-throughput, systematically filters out the kinetically transient but potentially clinically relevant portion of the immune response [5] [6]. In contrast, the real-time, label-free nature of SPR provides a more holistic and unbiased view of the polyclonal ADA response.
For researchers and drug development professionals, these findings indicate that while ELISA remains a powerful tool for high-throughput screening, SPR is a critical technology for:
- Confirmatory Analysis: Orthogonally validating ELISA results, especially in cases of clinical non-response.
- Characterization: Determining the kinetic profile (kon/koff) of an ADA response, which provides deeper insight into its potential clinical impact.
- Assay Optimization: Using SPR-derived kinetic data, such as the time to equilibrium, to rationally design and optimize ELISA incubation times to improve accuracy [5].
In conclusion, within the broader thesis of SPR vs. ELISA research, this case study underscores that SPR is not just an alternative technique but a complementary one that unveils critical pitfalls of traditional immunoassays. Its ability to provide real-time kinetic data offers a more comprehensive framework for immunogenicity assessment, ultimately supporting the development of safer and more effective biologic therapies.
Within the foundational principles of biomolecular interaction analysis, the enzyme-linked immunosorbent assay (ELISA) has long been recognized as a gold-standard technique for detecting and quantifying proteins, antibodies, and other analytes. Its widespread adoption is anchored in its high sensitivity, specificity, and accessibility [1]. However, the emergence of surface plasmon resonance (SPR) as a powerful label-free and real-time methodology has provided researchers with a tool capable of overcoming several inherent limitations of ELISA, particularly for applications requiring detailed kinetic profiling [1] [7]. This technical guide delves into the core principles of both techniques, systematically examining the experimental contexts in which their results converge and, perhaps more importantly, diverge. Such an analysis is critical for researchers and drug development professionals who must select the appropriate assay to ensure data quality and accurate clinical or therapeutic interpretations.
Core Principles and Technical Comparison
The fundamental distinction between these techniques lies in their mechanism of detection. ELISA is an end-point assay that relies on immobilized capture molecules and enzyme-labeled detection antibodies to produce a measurable signal, typically through a colorimetric, fluorometric, or luminescent reaction [1] [54]. This multi-step process involves long incubation and washing stages, which can take hours to days to complete.
In contrast, SPR is an optical technique that measures changes in the refractive index on a sensor chip surface in real-time. When biomolecules bind to immobilized ligands on this surface, the mass change alters the refractive index, producing a direct sensorgram that tracks the entire interaction process [1] [7]. This label-free, real-time capability allows SPR to determine not just the presence and concentration of an analyte, but also the kinetics of the interaction—namely, the association rate constant (kon) and dissociation rate constant (koff)—from which the equilibrium dissociation constant (KD) is derived [1].
Table 1: Fundamental Operational Differences Between SPR and ELISA.
| Parameter | SPR | ELISA |
|---|---|---|
| Detection Principle | Label-free; change in refractive index [1] [7] | Enzyme-based signal generation (colorimetric, fluorescence) [1] [54] |
| Data Type | Real-time kinetics (kon, koff) and affinity (KD) [1] | End-point; affinity only (no kinetic data) [1] |
| Assay Time | Minutes to hours [7] | Hours to days [1] [7] |
| Label Requirement | No label required [1] [7] | Requires enzyme-conjugated antibodies [1] |
| Throughput | Moderate to High (with automation) | High |
| Sample Consumption | Low (microliters) [1] | Moderate to High |
When Results Converge: A Study of Correlation
Despite their different operating principles, SPR and ELISA can yield highly concordant results for specific applications, particularly when measuring the concentration of well-behaved, high-affinity analytes.
A seminal study analyzing levels of CD166/ALCAM, a candidate pancreatic cancer marker, demonstrated excellent correlation between SPR and ELISA results. The researchers immobilized an anti-ALCAM antibody on the SPR sensor surface to mimic the surface chemistry of an ELISA plate. In both buffer and complex human serum samples, the two methods showed strong agreement, with SPR achieving a similar sensitivity (detection limit below ng/mL) to a sandwich ELISA [55]. This convergence validates that, for straightforward antigen quantification, both methods can be relied upon when the assay is optimally configured.
More recently, a 2021 multi-site validation study for detecting anti-SARS-CoV-2 IgG antibodies also found excellent correlation. Measurements performed in human serum, plasma, and dried blood spots using a portable SPR instrument and matching in-house or commercial ELISAs yielded Pearson's correlation coefficients exceeding 0.85 in all cases [56] [57]. This high degree of cross-correlation, achieved across different sample matrices, underscores the reliability of both techniques for quantitative serology when the target antibodies are present at sufficient levels and possess favorable binding kinetics.
When Results Diverge: Uncovering Mechanistic Insights
Divergence between SPR and ELISA data is not a failure of either technique but rather a revelation of their different operational principles, offering critical mechanistic insights. The key areas of divergence are most pronounced in the detection of low-affinity interactions and in the accurate measurement of binding affinity.
The Case of Anti-Drug Antibodies (ADA)
A striking example comes from immunogenicity testing. A 2021 study analyzing sera from 76 patients treated with infliximab found that while both methods gave highly similar results for serum drug concentrations, they diverged dramatically in detecting ADAs [4].
- Sensitivity and Drug Tolerance: All 14 sera that were ADA-positive by ELISA were also positive by SPR. However, SPR detected ADAs in 8 additional patients who were ADA-negative by ELISA. Furthermore, SPR was "drug-tolerant," identifying ADAs in 9 patients with detectable levels of infliximab, whereas the ELISA used was not [4].
- Quantitative Discrepancies: In the samples positive by both methods, the absolute amount of ADA measured by SPR was 7 to 490 times higher than that reported by ELISA, with no correlation between the values [4] [5].
Mechanistic Explanation: This discrepancy is largely kinetic. ELISA's long incubation and washing steps favor the detection of high-affinity antibodies that do not dissociate readily. In contrast, patient-derived ADAs are often low-affinity and can dissociate during these steps, leading to their loss and resulting in false negatives or significant underestimation. SPR's real-time monitoring captures these transient, low-affinity interactions, providing a more accurate picture of the immune response [4] [7]. Analysis confirmed that the ADAs detected solely by SPR had significantly faster dissociation rate constants [4].
Accuracy of Affinity Measurements
Another critical divergence lies in the determination of binding affinity (KD). ELISA, as an end-point assay, requires the system to reach equilibrium to report a true KD value. However, the time to equilibrium (tequil) is often unknown and can be impractically long.
A case study with alpaca antibodies highlights this issue. For two clones, R4 and R9, ELISA-reported KD values were 43.7-fold and 14.1-fold higher (indicating weaker affinity), respectively, than those determined by SPR [5]. This consistent underestimation of affinity by ELISA was attributed to insufficient incubation time. SPR kinetic analysis calculated that reaching equilibrium required 5.34 hours for R4 and 2.29 hours for R9—times far exceeding typical ELISA incubation periods. Without SPR-derived kinetics to guide protocol design, ELISA affinity data can be unreliable [5].
Table 2: Summary of Experimental Evidence for SPR and ELISA Divergence.
| Study Context | Nature of Divergence | Proposed Mechanistic Reason |
|---|---|---|
| Anti-infliximab Antibodies [4] | SPR detected ADA in 8 additional patients; levels 7-490x higher. | SPR's real-time, label-free detection captures low-affinity, fast-dissociating ADAs lost during ELISA wash steps. |
| Alpaca Antibody Affinity [5] | ELISA reported KD values 14-44x weaker than SPR. | ELISA incubation time was insufficient for binding to reach equilibrium, leading to affinity underestimation. |
| General HAHA Response [1] [7] | SPR identified 4.1% positive patients vs. 0.3% by ELISA. | SPR's superior sensitivity for low-affinity antibodies, which are indicators of early immunogenicity. |
Experimental Protocols for Comparative Studies
To ensure robust and interpretable comparative data, meticulous experimental design is paramount. Below are generalized protocols for conducting a correlation study between SPR and ELISA, inspired by the methodologies cited in the literature.
Protocol for SPR Analysis of Antibody Affinity and Kinetics
This protocol outlines the key steps for characterizing molecular interactions on an SPR instrument [1] [58].
- Surface Preparation: A sensor chip (e.g., CM5 for covalent coupling or CAP for capture) is conditioned. The ligand (e.g., an antigen) is immobilized onto the surface using an appropriate chemistry (e.g., amine coupling) to achieve an optimal density [58].
- Binding Assay: The analyte (e.g., an antibody) is diluted in running buffer (e.g., HBS-EP) to a series of concentrations (e.g., two-fold serial dilutions). Each concentration is injected over the ligand surface and a reference surface at a constant flow rate (e.g., 30 µL/min) for a set association time (e.g., 180 seconds).
- Dissociation Monitoring: The flow is switched back to running buffer, and dissociation is monitored for a sufficient time (e.g., 600 seconds) to accurately determine the dissociation rate.
- Surface Regeneration: The ligand surface is regenerated by injecting a solution (e.g., 10 mM glycine, pH 2.0) that breaks the binding interaction without damaging the immobilized ligand. This allows for multiple analysis cycles on the same surface [56].
- Data Analysis: The resulting sensorgrams for all concentrations are aligned and reference-subtracted. The data is fitted to a suitable interaction model (e.g., 1:1 Langmuir binding) to calculate the kinetic rate constants (kon and koff) and the equilibrium dissociation constant (KD = koff/kon).
Protocol for ELISA-Based Affinity Measurement
This protocol, applicable for a sandwich or indirect ELISA, highlights steps where kinetic properties can influence the outcome [5] [54].
- Coating: A microplate is coated with the antigen (or capture antibody) in a suitable coating buffer and incubated overnight at 4°C.
- Blocking: The plate is washed and then blocked with a protein-based buffer (e.g., 1% BSA) for 1-2 hours to prevent non-specific binding.
- Sample Incubation (Critical Step): The antibody (analyte) is serially diluted in a suitable buffer. Dilutions are added to the plate in duplicate or triplicate. The plate is incubated for a defined period. As demonstrated in the case study, this time should be determined from SPR-derived tequil to ensure equilibrium is reached for accurate KD measurement [5].
- Washing: The plate is thoroughly washed multiple times to remove unbound analyte. This step is critical, as low-affinity binders can dissociate and be washed away, leading to false negatives [4] [7].
- Detection: An enzyme-conjugated detection antibody is added and incubated. After a further wash step, the enzyme substrate is added to develop a colorimetric or chemiluminescent signal.
- Data Analysis: The reaction is stopped, and the signal is measured. A standard curve is generated from the serial dilutions, and the affinity can be estimated, though without kinetic resolution.
The Scientist's Toolkit: Essential Reagent Solutions
Table 3: Key Research Reagents for SPR and ELISA Experiments.
| Reagent / Material | Function in Assay | Technical Considerations |
|---|---|---|
| Sensor Chips (SPR) | Provides the surface for ligand immobilization. | Available with various chemistries (e.g., carboxymethyl dextran for covalent coupling, streptavidin for capture). Choice depends on ligand properties and assay needs [58]. |
| Biotinylated Ligands | For efficient capture on streptavidin-coated sensor chips or ELISA plates. | Ensures uniform orientation, which can enhance binding activity and data quality. |
| High-Affinity Capture Antibodies (ELISA) | Immobilized on the plate to specifically capture the antigen from a sample. | Critical for assay specificity in sandwich ELISA. Must be paired with a non-competing detection antibody [54]. |
| Regeneration Solutions (SPR) | Removes bound analyte from the immobilized ligand without denaturing it. | Essential for reusing the sensor surface. Must be optimized for each specific molecular interaction (e.g., low pH, high salt) [58]. |
| Blocking Buffers | Reduces non-specific binding to the sensor chip or microplate surface. | Typically contain inert proteins (e.g., BSA, casein) or other polymers. Optimization is required for complex samples like serum [54]. |
The accurate characterization of biomolecular interactions—determining which molecules interact, how they interact, and why they interact—forms the cornerstone of modern drug development and life science research [59]. For decades, the enzyme-linked immunosorbent assay (ELISA) has stood as the undisputed gold standard for detecting and quantifying biomolecules, prized for its high sensitivity, specificity, and accessibility [1]. However, the increasing complexity of scientific questions, particularly in the realm of drug discovery, has exposed limitations in this traditional method. Over the past three decades, surface plasmon resonance (SPR) has emerged as a powerful, label-free alternative that provides real-time monitoring of molecular interactions [25] [9].
This technical analysis examines the critical advantages of SPR over ELISA, with a specific focus on three pivotal areas: the ability to extract detailed binding kinetics, the benefits of label-free detection, and the overall versatility of the platform. As we will demonstrate through experimental data and case studies, SPR technology provides researchers with a more comprehensive picture of molecular behavior, enabling more informed decisions in therapeutic antibody development, immunogenicity testing, and biomarker discovery.
Core Principles: A Tale of Two Methodologies
The SPR Mechanism: Real-Time, Label-Free Monitoring
Surface plasmon resonance is an optical phenomenon that occurs when a photon of incident light strikes a metal surface (typically gold) at a specific angle [25]. Under the right conditions, this light energy couples with electrons in the metal surface layer, causing them to oscillate—a phenomenon known as plasmon resonance [25]. These electron oscillations, or plasmons, generate an electric field that extends approximately 300 nanometers from the metal surface into the adjacent medium [25]. The critical observation is that the angle at which resonance occurs is exquisitely sensitive to changes in the refractive index at the metal surface [25].
In practice, SPR biosensors leverage this principle by immobilizing one binding partner (the ligand) on the sensor surface and flowing the other binding partner (the analyte) over it in solution [25] [1]. When binding occurs, the resulting increase in mass at the sensor surface alters the refractive index, causing a shift in the resonance angle that can be measured in real time [25]. This shift is quantified in resonance units (RU), where 1 RU is equivalent to a critical angle shift of 10⁻⁴ degree [25]. This setup enables researchers to monitor binding events as they happen, without the need for molecular labels.
Figure 1: SPR Operating Principle Using Kretschmann Configuration. The diagram illustrates how polarized light passes through a prism and interacts with a thin gold film, generating surface plasmons. Molecular binding events in the flow channel alter the refractive index, changing the resonance conditions detected by the optical sensor.
The ELISA Workflow: Endpoint Detection with Labels
In contrast to SPR, ELISA operates on fundamentally different principles. As an endpoint assay, ELISA detects antigen-antibody interactions using enzyme-labelled conjugates and substrates that generate measurable color changes [12]. The core methodology involves immobilizing a target biomolecule (antigen) to a solid surface, typically a 96-well microplate, and then complexing it with an antigen-specific antibody linked to an enzyme label [1] [12]. After multiple incubation and washing steps to remove unbound components, a substrate is added that reacts with the enzyme to produce a colored product [12]. The intensity of this color, measured spectrophotometrically at wavelengths between 400–600 nm (most commonly 450 nm), is proportional to the amount of analyte present in the sample [12].
Several ELISA formats exist, including direct, indirect, and competitive ELISA, each with specific applications [12]. The common thread, however, is the dependence on molecular labels (typically enzymes such as horseradish peroxidase or alkaline phosphatase) and the fact that binding is measured at a single endpoint rather than in real time [1] [12]. This fundamental difference in approach has profound implications for the type and quality of data generated by each method.
Figure 2: Typical Sandwich ELISA Workflow. The multi-step process involves sequential binding and washing steps, culminating in color development that is measured at endpoint. Multiple washing stages risk losing low-affinity interactions.
The Kinetic Advantage: Real-Time Insights Versus Snapshot Data
SPR's Comprehensive Kinetic Profile
The most significant advantage of SPR lies in its ability to monitor molecular interactions in real time, providing a complete kinetic profile of the binding event. As molecules associate and dissociate on the sensor surface, the SPR signal tracks these changes continuously, allowing researchers to directly determine the association rate constant (kₑₙ), dissociation rate constant (kₒff), and the overall equilibrium dissociation constant (K_D) [25] [1]. This kinetic information reveals not just whether molecules interact, but the dynamics of how they interact—how quickly they bind and how long they remain bound [1].
This real-time monitoring capability means SPR can establish when a binding reaction reaches equilibrium, a critical factor for accurate affinity measurements [5]. Research analyzing 100 binding studies revealed that 70% failed to confirm equilibrium, with nearly 90% using incubation times of one hour or less despite evidence that full equilibration for protein complexes can take many hours [5]. SPR directly addresses this problem by visually demonstrating when equilibrium is achieved.
ELISA's Limited Endpoint Measurement
ELISA, as an endpoint assay, provides only a snapshot of binding at a single time point [1]. It can quantify the amount of biomolecules present but offers no direct information about binding kinetics [1]. This limitation becomes particularly problematic when studying interactions with varying association and dissociation rates. Without knowledge of the time required to reach equilibrium (tₑqᵤᵢₗ), ELISA protocols may use insufficient incubation times, leading to significant underestimation of binding affinity [5].
A compelling case study illustrates this point well. In an alpaca antibody discovery project, clones R4 and R9 were analyzed by both ELISA and SPR [5]. ELISA reported K_D values that were 43.7-fold higher for R4 and 14.1-fold higher for R9 compared to SPR, dramatically underestimating binding affinity [5]. Subsequent SPR kinetic analysis revealed that the time to equilibrium was 5.34 hours for R4 and 2.29 hours for R9—times far exceeding typical ELISA incubation periods [5].
Table 1: Comparative Analysis of Affinity Measurements by SPR vs. ELISA
| Clone | SPR K_D (M) | ELISA K_D (M) | Fold Difference | Time to Equilibrium (hours) |
|---|---|---|---|---|
| R4 | 2.14 × 10⁻⁹ | 9.35 × 10⁻⁸ | 43.7 | 5.34 |
| R9 | 1.78 × 10⁻⁹ | 2.51 × 10⁻⁸ | 14.1 | 2.29 |
Detection Sensitivity: The Label-Free Paradigm Versus Steric Interference
The SPR Advantage: Preserving Native Molecular Structure
SPR's label-free detection approach eliminates the need for specialized tags or dyes, allowing sensitive measurement of target analytes using native biomolecules in their biologically relevant forms [25]. This is particularly valuable because molecular labels can cause steric hindrance or alter structural configurations, potentially affecting the labeled molecules' affinities for their target biomolecules [25]. By measuring binding through direct changes in refractive index, SPR maintains the intrinsic properties of the interacting molecules, providing more physiologically relevant data [25] [1].
The detection limit of a typical SPR biosensor is on the order of 10 pg/mL, making it highly sensitive for most applications [25]. Furthermore, SPR measurements are conducted with minimal sample processing, reducing opportunities for introducing artifacts and streamlining the experimental workflow [1].
ELISA's Label Dependency: Practical Convenience Versus Molecular Integrity
ELISA depends fundamentally on tagged antibodies and substrates to generate a measurable signal [1]. While this approach has proven highly sensitive and customizable through various assay formats, it introduces potential complications. The labeling process itself may modify molecular behavior, and the required multiple antibodies must be carefully selected and optimized to avoid cross-reactivity, adding complexity and time requirements to assay development [1].
Additionally, the enzyme-substrate reaction used for detection in ELISA represents an indirect measurement of binding, with signal generation dependent on the efficiency of the enzymatic reaction rather than directly on the binding event itself [12]. While high-quality ELISA kits demonstrate excellent performance characteristics, the fundamental requirement for labels remains a theoretical and practical limitation compared to direct detection methods.
Versatility and Applications: From Low-Affinity Interactions to High-Throughput Screening
Superior Performance in Challenging Applications
SPR demonstrates particular advantages in applications involving low-affinity interactions, which are increasingly recognized as scientifically and clinically relevant [1]. ELISA struggles with characterizing low-affinity binders because these interactions are often disrupted during the multiple washing steps in the protocol, potentially leading to false-negative results or significantly underestimated binding [1]. In contrast, SPR's real-time monitoring and minimized washing requirements make it exceptionally well-suited for detecting these challenging interactions.
A striking example comes from a study comparing SPR and ELISA for detecting anti-drug antibodies (ADA) in patients receiving infliximab [4]. All 14 samples identified as ADA-positive by ELISA were also positive by SPR, but the absolute ADA levels measured by SPR were 7 to 490 times higher [4]. Furthermore, SPR detected ADA in 8 additional patients who were considered ADA-negative by ELISA [4]. Analysis revealed that these ELISA-missed ADA had significantly faster dissociation rate constants, meaning they dissociated during ELISA's long incubation and washing steps [4]. This detection gap has direct clinical implications, as undetected ADA can affect drug efficacy and patient outcomes.
Throughput and Multiplexing Capabilities
While traditional SPR instruments with 3-4 flow cells presented throughput limitations, the development of SPR imaging (SPRI) has transformed this landscape [25]. SPRI systems use a coherent polarized light beam to cover a larger sensing area, with reflected light captured by a charge-coupled device (CCD) camera for simultaneous analysis of hundreds or thousands of spots in array format [25]. This advancement enables high-throughput screening of drugs and biomarkers while maintaining the benefits of label-free detection [25].
ELISA naturally lends itself to higher throughput through the standard 96-well plate format, and this represents one of its enduring strengths [12]. However, the requirement for individual calibration curves and multiple replicates reduces the effective throughput, and the multi-step manual processing introduces opportunities for error. Modern SPR systems with microfluidic automation and array capabilities are closing the throughput gap while providing richer data from each experiment.
Table 2: Comprehensive Technique Comparison: SPR vs. ELISA
| Parameter | SPR | ELISA |
|---|---|---|
| Detection Method | Label-free, refractive index change [25] [1] | Enzyme-labeled antibodies with colorimetric detection [1] [12] |
| Measurement Type | Real-time, continuous monitoring [25] [1] | Endpoint, single time point [1] |
| Kinetic Data | Direct measurement of kₑₙ, kₒff, and K_D [25] [1] | No kinetic data, only affinity at single time point [1] |
| Low-Affinity Interaction Detection | Excellent - minimal washing preserves complexes [1] [4] | Poor - washing steps disrupt weak complexes [1] [4] |
| Throughput | Moderate (conventional) to High (SPRI imaging) [25] | High (96-well plate format) [12] |
| Assay Development Time | Shorter - direct immobilization options [1] | Longer - antibody pairing and optimization needed [1] |
| Hands-On Time | Less - automated fluidics and regeneration [1] | More - multiple incubation and washing steps [1] |
| Sample Consumption | Low (microliter range) [59] | Moderate to High (milliliter range) |
| Molecular Weight Requirement | More flexible - detects mass change [25] | Dependent on antibody availability and quality |
| Cost Factors | Higher instrument cost, lower per-assay cost [1] | Lower instrument cost, higher reagent costs [1] |
The Scientist's Toolkit: Essential Materials and Methodologies
SPR Sensor Platforms and Immobilization Strategies
A key advantage of SPR technology is the diversity of sensor surfaces available for different applications. These sensors consist of a glass substrate, gold nanoparticles, and a functional chemical coating that facilitates ligand immobilization [60]. The choice of sensor depends largely on the characteristics of the ligand and the desired immobilization strategy:
Table 3: SPR Sensor Selection Guide
| Sensor Type | Immobilization Chemistry | Target Ligands | Key Advantages |
|---|---|---|---|
| Carboxyl | EDC/NHS amine coupling [60] | Proteins with available amine groups [60] | Versatile, consistent, stable attachment [60] |
| Biotin-Streptavidin | Biotin-streptavidin interaction [60] | Biotinylated ligands [60] | Controlled orientation, strong binding [60] |
| NTA | Ni²⁺-histidine coordination [60] | His-tagged proteins [60] | Reusable surface, convenient for purified proteins [60] |
| Protein A | Fc region binding [60] | IgG-based antibodies [60] | Proper antibody orientation [60] |
| Liposome | Hydrophobic capture [60] | Membrane proteins, liposomes [60] | Native membrane environment [60] |
Experimental Protocol: Comparative Analysis of Antibody Binding
Objective: Determine the binding kinetics and affinity of a therapeutic antibody candidate against its target antigen using SPR.
Materials:
- SPR instrument (e.g., Nicoya Alto, Biacore series)
- Carboxyl sensor chips
- EDC/NHS activation kit
- Running buffer (e.g., PBS with 0.005% surfactant P20)
- Ligand: Target antigen (0.5-1.0 mg/mL in 10 mM sodium acetate, pH 4.5-5.5)
- Analyte: Antibody candidate (serial dilutions from 100 nM to 0.78 nM in running buffer)
- Regeneration solution (e.g., 10 mM glycine-HCl, pH 2.0-3.0)
Methodology:
- Surface Preparation: Activate carboxyl sensor surface using EDC/NHS chemistry per manufacturer's protocol [60].
- Ligand Immobilization: Inject antigen solution over activated surface until desired immobilization level reached (typically 5,000-10,000 RU). Deactivate remaining active esters with ethanolamine [60].
- Kinetic Series: Inject antibody dilutions over ligand surface using multicycle kinetics approach. Use contact time of 3-5 minutes for association and 5-10 minutes for dissociation.
- Reference Subtraction: Include a blank flow cell or channel for reference subtraction to correct for bulk refractive index changes and non-specific binding.
- Regeneration: Remove bound analyte after each cycle using regeneration solution without damaging the immobilized ligand.
- Data Analysis: Fit resulting sensorgrams to appropriate binding models (1:1 Langmuir, two-state, or bivalent analyte) to extract kₑₙ, kₒff, and K_D values.
Quality Control: Include replicate injections and standard samples to ensure system performance and data reproducibility.
The verdict emerging from comparative studies is clear: SPR technology holds distinct advantages over ELISA in the critical areas of kinetics analysis, label-free detection, and methodological versatility. While ELISA remains a valuable tool for high-throughput quantification, particularly in established diagnostic applications, SPR provides a more comprehensive picture of molecular interactions—revealing not just that molecules bind, but the dynamic nature of how they bind.
For researchers and drug development professionals, the implications are significant. SPR's ability to detect low-affinity interactions, characterize kinetic parameters, and study molecules in their native states makes it particularly valuable for challenging applications like therapeutic antibody optimization, immunogenicity assessment, and membrane protein studies. The technology's capacity to guide and validate ELISA protocols further establishes its role as an essential orthogonal method in the analytical toolkit.
As SPR instruments continue to become more accessible, user-friendly, and higher-throughput, their adoption is likely to expand across basic research, drug discovery, and clinical diagnostics. The future of biomolecular interaction analysis undoubtedly lies in label-free, real-time technologies that provide richer data and deeper insights into the complex molecular interactions underlying biology and disease.
Conclusion
The choice between SPR and ELISA is not a simple matter of one being universally superior, but rather of selecting the right tool for the specific scientific question. ELISA remains a powerful, cost-effective, and accessible workhorse for high-throughput quantification where equilibrium affinity data is sufficient. In contrast, SPR provides a deeper, more dynamic understanding of molecular interactions by offering real-time kinetic data and superior performance in detecting low-affinity binders and complex samples, as evidenced in clinical studies on anti-drug antibodies. The future of biomolecular analysis lies in leveraging the strengths of both techniques, using SPR's detailed kinetic insights to validate and optimize ELISA protocols. For drug development and advanced clinical diagnostics, the richer data from SPR is increasingly critical for making informed decisions, ultimately driving more effective and safer therapeutics.
References
- 1. SPR vs ELISA | Comparing techniques for biomolecular ... [https://nicoyalife.com/blog/spr-vs-elisa-comparing-techniques-for-biomolecular-detection/]
- 2. ELISA Guide [https://www.creative-diagnostics.com/ELISA-guide.htm]
- 3. SPR Technology in Drug Discovery & Biologics [https://denovobiolabs.com/spr-technology/]
- 4. Surface plasmon resonance unveils important pitfalls of ... [https://www.nature.com/articles/s41598-021-94431-x]
- 5. SPR vs. ELISA: SPR Guides Accurate ELISA Results [https://www.rapidnovor.com/spr-vs-elisa/]
- 6. Real-Time SPR Biosensing to Detect and Characterize ... [https://pmc.ncbi.nlm.nih.gov/articles/PMC12190930/]
- 7. Advantages of SPR over ELISA [https://www.affiniteinstruments.com/post/advantages-of-spr-over-elisa]
- 8. Real-time and Label-free Bio-sensing of Molecular ... [https://pmc.ncbi.nlm.nih.gov/articles/PMC3529553/]
- 9. Surface plasmon resonance technology: Recent advances ... [https://www.sciencedirect.com/science/article/pii/S0165993623001668]
- 10. Use of Surface Plasmon Resonance (SPR) to Determine ... [https://pmc.ncbi.nlm.nih.gov/articles/PMC8489108/]
- 11. Advancements in surface plasmon resonance sensors for ... [https://pubs.rsc.org/en/content/articlelanding/2025/tc/d4tc04890c]
- 12. An overview of ELISA: a review and update on best laboratory ... [https://pmc.ncbi.nlm.nih.gov/articles/PMC11808753/]
- 13. ELISA Assay Technique | Thermo Fisher Scientific - US [https://www.thermofisher.com/us/en/home/life-science/protein-biology/protein-biology-learning-center/protein-biology-resource-library/pierce-protein-methods/overview-elisa.html]
- 14. Four Types of ELISA [https://www.cusabio.com/c-20659.html?srsltid=AfmBOoqUy1ItZLtzxmb3a5wXhrst7q4VVRBTLkJsJzac84ibndzFhpr4]
- 15. Explore ELISA Types: Direct, Indirect, Sandwich, and More [https://www.bosterbio.com/blog/post/elisa-types-indirect-direct-sandwich-competitive-multiplex-elisa?srsltid=AfmBOopwRdr2pj4qU9DRlT6ZIxD9KeK40FvVjqROT9IWFq2YyIZ4wRyF]
- 16. ELISA Kit Selection Guide: Sandwich vs Competitive ... [https://synapse.patsnap.com/article/elisa-kit-selection-guide-sandwich-vs-competitive-vs-direct-methods]
- 17. Phase-Sensitive Surface Plasmon Resonance Imaging ... [https://pubmed.ncbi.nlm.nih.gov/41035361/]
- 18. Highly sensitive simultaneous measurement of refractive ... [https://www.sciencedirect.com/science/article/pii/S2211379725000737]
- 19. Electrochemical surface plasmon resonance based ... [https://www.nature.com/articles/s41598-025-99351-8]
- 20. Surface plasmon resonance biosensors and their medical ... [https://www.sciencedirect.com/science/article/pii/S0956566325001824]
- 21. ELISA Unlocked: A Visual Guide for Effective ... [https://www.labmanager.com/elisa-unlocked-a-visual-guide-for-effective-experimentation-32232]
- 22. Surface Plasmon Resonance-Based Biodetection Systems [https://pmc.ncbi.nlm.nih.gov/articles/PMC11763797/]
- 23. High-throughput ELISA using SimpleStep [https://www.bmglabtech.com/en/application-notes/high-throughput-elisa-ready-to-analyse-in-90-minutes-384-well-simplestep-elisa-with-the-pherastar-fsx/]
- 24. High-throughput screening and validation of antibodies ... [https://www.nature.com/articles/s42003-021-01744-8]
- 25. Surface Plasmon Resonance: A Versatile Technique for ... [https://pmc.ncbi.nlm.nih.gov/articles/PMC4481982/]
- 26. Enzyme Linked Immunosorbent Assay - StatPearls - NCBI - NIH [https://www.ncbi.nlm.nih.gov/books/NBK555922/]
- 27. 6 Advantages of Surface Plasmon Resonance Technology [https://www.affiniteinstruments.com/post/6-advantages-of-surface-plasmon-resonance-technology]
- 28. Surface Plasmon Resonance (SPR)-Principles, Advantages ... [https://www.iaanalysis.com/surface-plasmon-resonance-spr-principles-advantages-analysis-process-and-applications.html]
- 29. Interpretating SPR-Derived Reaction Kinetics via Self ... [https://pubmed.ncbi.nlm.nih.gov/40998404/]
- 30. Recent Advances in Surface Plasmon Resonance Sensors ... [https://pmc.ncbi.nlm.nih.gov/articles/PMC8946561/]
- 31. A protein detection technique by using surface plasmon ... [https://www.sciencedirect.com/science/article/abs/pii/S0956566306001898]
- 32. A SPR biosensor based on signal amplification using ... [https://www.nature.com/articles/srep33140]
- 33. Recent Advances in Surface Plasmon Resonance (SPR) ... [https://pmc.ncbi.nlm.nih.gov/articles/PMC10705257/]
- 34. a review of new surface plasmon resonance technologies [https://www.sciencedirect.com/science/article/abs/pii/S0958166906000966]
- 35. Characterization and quantification of therapeutic ... [https://www.sciencedirect.com/science/article/abs/pii/S0165993625002535]
- 36. What Factors Could Affect ELISA Results? [https://www.cusabio.com/c-15109.html?srsltid=AfmBOooxhF7yaWB2PkVr7Y0DbTbjGx3-y1Si3gxi1-FEEkeH-DDhPaL4]
- 37. Development of a surface plasmon resonance biosensor ... [https://pubmed.ncbi.nlm.nih.gov/41246833/]
- 38. Optimizing your ELISA Assays [https://www.bmglabtech.com/en/blog/optimizing-your-elisa-assays/]
- 39. Surface plasmon resonance as a high throughput method ... [https://pmc.ncbi.nlm.nih.gov/articles/PMC4656072/]
- 40. ELISA Guide; Part 3: ELISA Optimization [https://www.jacksonimmuno.com/secondary-antibody-resource/immuno-techniques/elisa-guide-part-3-elisa-optimization/]
- 41. ELISA Development and Optimization [https://www.thermofisher.com/us/en/home/life-science/protein-biology/protein-biology-learning-center/protein-biology-resource-library/pierce-protein-methods/overview-elisa/elisa-development-optimization.html]
- 42. Kinetic characterization of SPR-based biomarker assays ... [https://www.sciencedirect.com/science/article/pii/S0003269722003785]
- 43. Enhancing ELISA Sensitivity: From Surface Engineering to ... [https://pmc.ncbi.nlm.nih.gov/articles/PMC12293621/]
- 44. Antibody-nanoparticle conjugates to enhance the sensitivity of ... [https://journals.plos.org/plosone/article?id=10.1371/journal.pone.0177592]
- 45. Advances in paper-based ELISA techniques [https://www.sciencedirect.com/science/article/abs/pii/S016599362400606X]
- 46. Latest surface plasmon resonance advances for G protein- ... [https://www.sciencedirect.com/science/article/pii/S2095177925001984]
- 47. On the sensing performance improvement in SPR ... [https://www.nature.com/articles/s41598-025-14131-8]
- 48. Enhancing Shiga toxin detection using surface plasmon ... [https://www.nature.com/articles/s41598-025-01686-9]
- 49. Comparison of Surface Plasmon Resonance, ... [https://www.mdpi.com/2079-6374/3/3/297]
- 50. Comparative study of SPR and ELISA methods based on ... [https://www.sciencedirect.com/science/article/abs/pii/S0956566308006143]
- 51. Approaches for the Detection and Analysis of Anti-Drug ... [https://pmc.ncbi.nlm.nih.gov/articles/PMC9520450/]
- 52. Advances in Anti-Drug Antibody Detection [https://www.sciencedirect.com/science/article/pii/S2949771X2500043X]
- 53. Cross-validation of ELISA and a portable surface plasmon ... [https://pubmed.ncbi.nlm.nih.gov/34250530/]
- 54. What Factors Could Affect ELISA Results? [https://www.cusabio.com/c-15109.html?srsltid=AfmBOopAOJbrVeX8-yXtwjRY40alQn74HkkxzMlmf8odri3wc7VSLjrV]
- 55. Comparative study of SPR and ELISA methods based on ... [https://pubmed.ncbi.nlm.nih.gov/19157844/]
- 56. Cross-validation of ELISA and a portable surface plasmon ... [https://pubs.rsc.org/en/content/articlehtml/2021/an/d1an00893e]
- 57. Cross-validation of ELISA and a portable surface plasmon resonance... [https://pubs.rsc.org/en/content/articlelanding/2021/an/d1an00893e]
- 58. Surrogate potency assays: Comparison of binding profiles ... [https://pmc.ncbi.nlm.nih.gov/articles/PMC5934736/]
- 59. Surface Plasmon Resonance basics [https://biosensingusa.com/technologies/surface-plasmon-resonance/]
- 60. Surface Plasmon Resonance Sensors: A Guide for Scientists [https://nicoyalife.com/blog/spr-sensor-guide/]