Systematic Optimization of Biosensor Response Time Using Response Surface Methodology: A Guide for Biomedical Researchers
This article provides a comprehensive guide for researchers and drug development professionals on applying Response Surface Methodology (RSM) to optimize biosensor response time.
Systematic Optimization of Biosensor Response Time Using Response Surface Methodology: A Guide for Biomedical Researchers
Abstract
This article provides a comprehensive guide for researchers and drug development professionals on applying Response Surface Methodology (RSM) to optimize biosensor response time. It covers foundational principles, contrasting the limitations of traditional one-variable-at-a-time approaches with the efficiency of multivariate RSM designs like Central Composite Design (CCD) and Box-Behnken. The content details methodological steps for implementing RSM, from factor screening to model building, illustrated with case studies from electrochemical and optical biosensors. It further addresses troubleshooting common optimization challenges and presents frameworks for validating RSM models and comparing its performance against other optimization strategies, such as artificial neural networks. The goal is to equip scientists with a systematic framework to enhance biosensor kinetics for more effective point-of-care diagnostics and clinical testing.
Beyond One-Variable-at-a-Time: Foundational Principles of RSM for Biosensor Optimization
Core Concepts of Response Surface Methodology
Response Surface Methodology (RSM) is a collection of statistical and mathematical techniques for empirical model building and process optimization. The core objective is to model the relationship between several explanatory variables (factors) and one or more response variables to find the factor settings that optimize the response[s] [1] [2] [3].
This methodology was introduced by Box and Wilson in the 1950s and is particularly valuable when the functional relationship between the variables and the response is unknown or complex [1] [2]. It is widely applied in engineering, science, manufacturing, and notably, in the optimization of analytical methods and biosensors in chemical and pharmaceutical research [4] [5] [6].
RSM operates by using a sequence of designed experiments, often aiming to fit a polynomial model, most commonly a second-order (quadratic) model, which is easy to estimate and apply [1] [7]. The general form of a quadratic model for k independent variables is shown below, illustrating the components that account for linear, interaction, and curvature effects:
- Formula for a Quadratic Model:
Y = β₀ + ∑ᵢ βᵢ Xᵢ + ∑ᵢ ∑ⱼ βᵢⱼ Xᵢ Xⱼ + εY: The predicted response.β₀: The constant or intercept term.βᵢ: The coefficients for the linear terms.βᵢⱼ: The coefficients for the interaction terms.Xᵢ,Xⱼ: The independent variables (factors).ε: The random error term [4].
The following diagram illustrates the typical workflow for implementing RSM, from problem definition to validation.
Frequently Asked Questions (FAQs) & Troubleshooting
Experimental Design
Q1: When should I use RSM instead of a simpler factorial design? Use RSM when you suspect curvature in your response surface and your goal is optimization (finding a maximum, minimum, or target value). Simple two-level factorial designs can only estimate linear effects. If the response is believed to have a peak or valley within the experimental region, RSM designs that include at least three levels for each continuous factor are necessary to model this curvature [3].
Q2: How do I choose between a Central Composite Design (CCD) and a Box-Behnken Design (BBD)? The choice depends on your experimental constraints and the region of interest. The table below summarizes the key differences.
- Table: Comparison of Common RSM Designs
| Feature | Central Composite Design (CCD) | Box-Behnken Design (BBD) |
|---|---|---|
| Runs | More runs; includes factorial, axial (star), and center points [4]. | Fewer runs for the same number of factors; uses combinations of midpoints of edges [4] [6]. |
| Experimental Region | Can explore a spherical or cuboidal region. The axial points may lie outside the factorial cube [4]. | Spherical region; all points lie within a hypersphere inscribed in the factorial cube. No corner points [4]. |
| When to Use | When you need to estimate curvature precisely and are willing to perform more runs. Useful when the region of interest includes extreme (corner) points [4]. | When performing experiments at the factorial extremes (corners) is impractical, expensive, or dangerous. Preferable when seeking efficiency with fewer runs [4] [6]. |
Q3: What is the most common mistake in planning an RSM experiment? A common mistake is an inappropriate screening of independent variables or an improper selection of levels [6]. Before embarking on an RSM study, it is crucial to clearly define the project's scope and objectives and use prior knowledge or screening designs to identify the factors that truly influence the response. Selecting levels that are too close together may not capture the curvature, while levels that are too far apart might make the quadratic model a poor approximation [4] [2].
Model Fitting and Analysis
Q4: My model has a high R-squared value, but the predictions are poor. What could be wrong? A high R-squared alone does not guarantee a good model. This issue often stems from model inadequacy. You should perform a lack-of-fit test and conduct residual analysis. A significant lack-of-fit indicates that the model (e.g., a quadratic polynomial) does not adequately describe the relationship in the data. Residual plots can reveal patterns that suggest the model is missing important terms or that there is non-constant variance [2] [7]. Always validate the model with confirmation runs at the predicted optimal conditions [2].
Q5: How do I handle multiple responses, like when optimizing for both high sensitivity and short response time in a biosensor? Optimizing multiple, potentially conflicting responses is a common challenge. Strategies include:
- Overlaid Contour Plots: Superimposing contour plots for each response to visually identify a region where all goals are simultaneously met [4] [3].
- Desirability Function Approach: This method converts each response into an individual desirability function (ranging from 0 to 1) and then combines them into a single composite desirability function that is maximized. This allows you to assign different importance levels to each response [4] [2].
Optimization and Validation
Q6: The optimization algorithm suggests factor settings that are impractical or unsafe to implement. How should I proceed? The mathematical optimum may lie outside practical operating limits. To address this, you should incorporate constraints into your optimization formulation. Most statistical software allows you to set lower and upper bounds for factors. You can use the models and contour plots to find a set of factor settings within your practical, safe, and economical operating window that still provides a near-optimal and robust response [4] [2].
Q7: After validation runs, the observed response at the predicted optimum is significantly different from the prediction. What are the next steps? This indicates that the model may not be a reliable predictor in that region. You should:
- Verify Experimental Error: Ensure the validation runs were conducted with the same precision as the original experiments.
- Check for Outliers: Re-examine your original data for any influential points.
- Iterate the Process: The optimal point from the first RSM study may guide you to a new region of interest. You may need to conduct a new RSM experiment centered around this new region to build a more accurate local model [2].
Practical Research Toolkit
Key Research Reagent Solutions
The following table lists materials commonly used in experiments where RSM is applied for optimization, such as in biosensor development or analytical method optimization.
- Table: Essential Materials for Biosensor and Analytical Optimization Studies
| Item | Function/Description | Example from Research |
|---|---|---|
| Multi-walled Carbon Nanotubes (MWCNTs) | Used to modify electrode surfaces; enhance electrical conductivity and surface area [5]. | MWCNTs with an ionic liquid were used to modify a glassy carbon electrode for alkaline phosphatase detection [5]. |
| Ionic Liquids (IL) | Often used in composite materials to improve electrochemical stability and electron transfer kinetics [5]. | Combined with MWCNTs to create a modified electrode for a biosensor [5]. |
| Enzyme Substrates (e.g., pNPP) | A molecule that is acted upon by an enzyme. The reaction product generates a measurable signal (e.g., electrochemical, colorimetric) [5]. | para-Nitrophenylphosphate (pNPP) was used as the substrate for the enzyme alkaline phosphatase in a biosensor design [5]. |
| Electrochemical Probes (e.g., [Ru(NH₃)₅Cl]²⁺) | A redox-active molecule used to generate an amperometric signal in electrochemical biosensors [5]. | Used to detect the negative charges generated from the enzymatic hydrolysis of pNPP [5]. |
| Nanocomposite Adsorbents (e.g., Fe₃O₄/rGO/Ag) | Used in sample preparation for pollutant removal or pre-concentration of analytes; properties like magnetism allow for easy separation [8]. | Synthesized and used as an adsorbent for the removal of tetracycline and dyes from water; optimized using RSM [8]. |
| Britton-Robinson (BR) Buffer | A universal buffer solution used in electrochemistry to maintain a specific pH for the analyte's redox reaction [9]. | Used as the supporting electrolyte for the voltammetric determination of 2-nitrophenol [9]. |
Example Experimental Protocol: Optimizing Voltammetric Parameters
The following workflow details a published methodology for optimizing square wave voltammetry (SWV) parameters using RSM to detect an environmental pollutant [9]. This serves as a practical template for similar analytical optimizations.
Detailed Steps:
- Sensor Preparation: A glassy carbon (GC) electrode is modified, for example, via the electropolymerization of 2-amino nicotinamide (2-AN). The optimum number of deposition cycles is determined beforehand (e.g., 5 cycles) [9].
- Experimental Design: A Box-Behnken Design (BBD) is selected to optimize the three key SWV parameters: pulse amplitude, frequency, and potential step. This design efficiently requires a limited number of experimental runs [9].
- Data Collection and Modeling: The amperometric response (e.g., peak current) for a target analyte (e.g., 2-nitrophenol) is measured for each combination of parameters in the BBD matrix. The data is then used to build a predictive model. Advanced algorithms like Least Squares-Support Vector Machine (LS-SVM) or a standard quadratic polynomial can be employed for this purpose [5] [9].
- Optimization and Validation: The fitted model is used to pinpoint the combination of SWV parameters that predicts the maximum peak current (response). These optimal settings are then validated experimentally to confirm the predicted enhancement in sensor sensitivity [9].
This specific application resulted in a sensor with a wide linear range (9.9 nM - 52.5 μM and 52.5 μM - 603 μM) and a very low detection limit of 2.92 nM for 2-nitrophenol [9].
Limitations of One-Factor-at-a-Time (OFAT) Optimization in Complex Biosensor Systems
FAQs: Understanding OFAT and its Limitations
1. What is the fundamental weakness of the OFAT method in biosensor development? The primary weakness is that OFAT fails to account for interactions between factors. It optimizes one variable while keeping all others constant, which can lead to identifying a local optimum rather than the true, global best performance for the biosensor. It cannot detect when the effect of one factor (e.g., enzyme concentration) depends on the level of another (e.g., immobilization time) [10] [11].
2. How does OFAT impact the efficiency and cost of biosensor optimization? OFAT is an inefficient and resource-intensive process. It requires a significant number of experiments to explore each variable individually, leading to increased consumption of costly reagents, nanomaterials, and biorecognition elements (like enzymes or DNA probes), as well as substantial researcher time [10] [12].
3. My OFAT-optimized biosensor has unstable performance. Why might this be? This is a common consequence of un-detected factor interactions. An OFAT protocol may settle on a combination of conditions that is highly sensitive to minor variations in a factor that was not properly co-optimized, resulting in poor robustness and reproducibility [11].
4. Is there a scenario where using OFAT is acceptable? OFAT can be a preliminary tool for initial, rough estimates of factor ranges. However, for the final optimization of any complex biosensor system with multiple, potentially interacting variables, it is considered a suboptimal and outdated approach compared to multivariate methods [10].
Troubleshooting Guide: OFAT-Related Experimental Problems
Problem: Suboptimal Biosensor Performance After OFAT Optimization
Description: After a lengthy OFAT optimization process, the biosensor's sensitivity, detection limit, or response time does not meet expectations or is inferior to results reported in similar studies.
Possible Causes & Solutions:
- Cause 1: Unidentified Factor Interactions.
- Cause 2: The "Optimum" is Only Local.
- Solution: Abandon the OFAT results as a final answer. Use the knowledge gained from OFAT to define the initial factor ranges for a proper multivariate DoE, which is designed to explore the entire experimental domain globally [11].
Problem: Irreproducible Results Between Batches
Description: Biosensors fabricated based on OFAT-optimized conditions show high variability in performance from one production batch to another.
Possible Causes & Solutions:
- Cause: The Process is Not Robust.
- Solution: The OFAT method does not build a predictive model that accounts for how variations in one factor affect others. Implementing RSM creates a mathematical model that describes the response surface, allowing you to understand the process robustness and identify a "sweet spot" where performance is less sensitive to small, inevitable variations in manufacturing [11].
Case Studies: The Transition from OFAT to Multivariate Optimization
The following examples from recent literature demonstrate how moving beyond OFAT led to successful biosensor development.
Case Study 1: DNA Biosensor for Mycobacterium tuberculosis
- Challenge: Sensitive and specific detection of a tuberculosis DNA sequence.
- OFAT Limitation Overcome: The researchers explicitly stated that the conventional OFAT approach is incapable of investigating the combined effects of all factors and is time and resource-intensive [12].
- Multivariate Solution: They employed a Plackett-Burman design to screen 11 different factors and identify the most significant ones. This was followed by a Central Composite Design (CCD) under RSM to model the interactions and find the optimal conditions for probe concentration and immobilization time [12].
- Outcome: This systematic approach resulted in a biosensor with a wide detection range and a very low detection limit (0.141 nM) [12].
Case Study 2: Label-free DNA Nanobiosensor for Mycobacterium simiae
- Challenge: Creating the first diagnostic test for a specific Nontuberculous mycobacterium.
- OFAT Limitation Overcome: The authors noted that the conventional univariate (OFAT) method cannot evaluate the combined effect of variables and is time-consuming [13].
- Multivariate Solution: They used a Plackett-Burman screening design to select key factors from a large set, then applied RSM to optimize them. This allowed for a cost-effective and statistically sound optimization process [13].
- Outcome: The developed biosensor achieved an exceptionally low detection limit (1.40 fM) and high selectivity, demonstrating the power of a well-designed optimization strategy [13].
Comparative Data: OFAT vs. Multivariate Optimization
The table below summarizes the core limitations of the OFAT method and the corresponding advantages offered by multivariate optimization using Design of Experiments (DoE).
| OFAT Limitations | Multivariate DoE Advantages |
|---|---|
| Fails to detect interactions between factors [10]. | Models factor interactions to find a true global optimum [11]. |
| Inefficient, requiring many experiments for limited information [10]. | High efficiency, obtaining more information with fewer experiments [12] [13]. |
| Leads only to a local optimum, potentially missing the best performance [11]. | Maps the entire experimental domain to find the global optimum [11]. |
| Provides no predictive model of the system [11]. | Creates a mathematical model to predict performance within the factor space [11]. |
| Does not assess process robustness [11]. | Helps identify robust operating conditions that are less sensitive to noise [11]. |
The Scientist's Toolkit: Essential Research Reagents & Materials
The following table lists key materials frequently used in the development and optimization of electrochemical biosensors, as cited in the research.
| Item | Function in Biosensor Development |
|---|---|
| Screen-Printed Electrodes (SPEs) | Disposable, portable electrode platforms often made of carbon, gold, or platinum. Serve as the solid support and transducer [14]. |
| Electroactive Polymers (e.g., Polypyrrole (PPy)) | Used to modify electrode surfaces. Enhance conductivity, provide a matrix for biomolecule entrapment, and improve stability [12]. |
| Nanomaterials (e.g., MWCNTs, Graphene Oxide, Au Nanoparticles) | Increase electrode surface area, enhance electron transfer, and act as immobilization matrices to significantly boost sensitivity [10] [12]. |
| Biorecognition Elements (e.g., Glucose Oxidase, DNA probes) | The core of the biosensor. Provides specificity to the target analyte (e.g., glucose, a specific DNA sequence) [10] [14] [12]. |
| Dendrimers (e.g., PAMAM) | Highly branched molecules with many functional groups. Used to amplify the electrochemical response and increase the amount of probe DNA that can be immobilized [13]. |
Experimental Workflow: From Problem to Optimized Biosensor
The diagram below outlines a logical pathway for diagnosing OFAT-related issues and implementing a superior multivariate optimization strategy.
Recommended Experimental Protocol: Implementing RSM with CCD
For researchers looking to replace OFAT, here is a generalized protocol based on the cited successful applications [14] [12] [13]:
- Factor Selection & Range Definition: Use prior knowledge or a screening design to select 2-4 critical factors (e.g., enzyme concentration, probe immobilization time, nanomaterial loading). Define a practical range (low and high level) for each.
- Design the Experiment: Create a Central Composite Design (CCD) matrix using statistical software (e.g., Minitab, Design-Expert). This design includes factorial points, axial points, and center points to efficiently fit a quadratic model.
- Run Experiments & Record Response: Fabricate biosensors and perform measurements according to the CCD matrix. Record your key response variable (e.g., sensitivity, peak current, detection limit).
- Model Fitting & Statistical Analysis: Input the data into the software to perform multiple least square regression. Use Analysis of Variance (ANOVA) to assess the model's significance and the importance of each term.
- Validation and Prediction: Use the software's optimization function to find the factor settings that predict the best performance. Conduct validation experiments at these predicted optimum conditions to confirm the model's accuracy.
Frequently Asked Questions (FAQs)
1. What is Response Surface Methodology (RSM) and when should I use it for biosensor optimization? Response Surface Methodology (RSM) is a collection of statistical, graphical, and mathematical techniques used to develop, improve, and optimize products and processes where the response of interest is influenced by several variables [4] [3]. You should use RSM when you need to find the factor settings that optimize your biosensor's response (e.g., maximize sensitivity, minimize response time) after you have identified the important factors through initial screening experiments [15] [3]. It is particularly useful when you suspect curvature in the response surface, meaning the optimum lies somewhere within the range of your factors, not just at their extremes [3].
2. My initial model shows a lack of fit. What does this indicate? A significant lack of fit in a first-order (linear) model often indicates that you have reached the vicinity of the optimum and that curvature is present in the system [15]. This is a key signal to move from initial factorial designs to a more elaborate RSM design, such as a Central Composite Design (CCD) or Box-Behnken Design (BBD), which can fit a second-order model and accurately map the optimal region [15] [16].
3. What is the difference between Central Composite Design (CCD) and Box-Behnken Design (BBD)? Both CCD and BBD are used to fit second-order models, but they differ in structure and application. A CCD contains a factorial or fractional factorial design, augmented with center points and axial (star) points, allowing it to estimate curvature [4] [15]. A BBD is an independent quadratic design where treatment combinations are at the midpoints of the edges of the process space and at the center; it does not contain an embedded factorial design and often requires fewer runs than a CCD for the same number of factors [4] [16]. The choice between them depends on your experimental region and resource constraints [16].
4. How do I handle optimizing multiple biosensor responses at once? When multiple responses (e.g., response time, sensitivity, and stability) need to be optimized simultaneously, the desirability function approach is very useful [15]. This method converts each response into an individual desirability function and then combines them into a single composite metric. This allows you to find a balanced setting for your factors that provides the most appropriate values for all responses, even if their individual optimums would lead to conflicting factor settings [15] [3].
Troubleshooting Guides
Poor Model Fit or Low Predictive Power
- Symptoms: Low R-squared or Adjusted R-squared values, significant lack of fit, poor agreement between predicted and actual values in validation experiments.
- Potential Causes & Solutions:
- Insufficient Model Complexity: If the relationship between factors and the response is curved, a linear model will be inadequate. Solution: Use an RSM design (CCD or BBD) to fit a second-order (quadratic) model that can capture curvature [16] [3].
- Incorrect Factor Ranges: The experimental region may not encompass the true optimum. Solution: Use the method of steepest ascent/descent to sequentially move the experimental region toward the optimum before performing a detailed RSM study [15].
- Violated Model Assumptions: The statistical analysis assumes normality, independence, and constant variance of residuals. Solution: Perform residual analysis and consider transforming the response variable (e.g., logarithmic transformation) if diagnostics show violated assumptions [16].
Failure to Reach the Optimum
- Symptoms: The optimization process stalls, or the predicted optimum is at the edge of the experimental region.
- Potential Causes & Solutions:
- Incorrect Search Direction: The path of steepest ascent/descent was miscalculated. Solution: Recalculate the path using the coefficients from the first-order model, ensuring the steps taken for each factor are proportional to their regression coefficients [15].
- Presence of Interactions or Curvature: The steepest ascent method assumes a linear, rising ridge. Solution: If the response stops improving, fit a new first-order model. If it shows lack of fit, you are near the optimum and should switch to an RSM design [15].
- Critical Factors Omitted: Important variables may not have been included in the experimental design. Solution: Return to the screening phase to ensure all influential factors have been identified [4] [16].
High Variability in Experimental Results
- Symptoms: Large confidence intervals for coefficient estimates, poor reproducibility of the optimal conditions.
- Potential Causes & Solutions:
- Insufficient Replication: Experimental error is not well quantified. Solution: Include replicate runs, especially center points, to obtain a pure estimate of experimental error and check for model adequacy [4] [15].
- Uncontrolled External Factors: Environmental conditions or measurement techniques may not be standardized. Solution: Carefully control all non-experimental factors and randomize the run order of your experiments to avoid confounding [16].
The table below summarizes the core characteristics of the most common RSM designs to help you select the appropriate one for your biosensor optimization.
Table 1: Comparison of Common Response Surface Methodology Designs
| Design Type | Key Characteristics | Number of Runs (for k factors) | Best Use Case |
|---|---|---|---|
| Central Composite Design (CCD) [4] [15] [16] | Contains factorial points, center points, and axial (star) points. Can be rotatable. | Varies with type; e.g., a circumscribed CCD for 3 factors requires 16-20 runs. | The most general and widely used design for full RSM optimization; provides excellent overall coverage of the experimental region. |
| Box-Behnken Design (BBD) [4] [16] | Treats combinations at the midpoints of edges; requires only 3 levels per factor. Does not have axial points. | For k=3 factors: 13 runs (with 1 center point) [4]. | An efficient choice when looking to minimize the number of runs, especially when one-factor-at-a-time experiments are impractical at extreme (star) points. |
| 3-Level Full Factorial Design [16] | Every combination of all factors at all three levels. | 3k (e.g., for k=3, 27 runs). | Provides extensive data but becomes prohibitively large and expensive as the number of factors increases. |
Essential Research Reagent Solutions
The table below lists key materials and their functions relevant to conducting a robust RSM study, particularly in a biochemical context like biosensor development.
Table 2: Key Research Reagents and Materials for RSM Experiments
| Item | Function/Application in RSM |
|---|---|
| Carrier Agents (e.g., Maltodextrin) [17] | Used in process optimization to improve the yield and physical properties of spray-dried products (e.g., stabilizing sensitive bioactive compounds). |
| Buffering Agents (e.g., Phosphate, Acetate) [18] | Critical for maintaining consistent pH, a common continuous factor in biosensor and biochemical optimization studies. |
| Blocking Additives (e.g., BSA) [18] | Used to reduce non-specific binding on sensor surfaces, a key step in assay development and optimization for biosensors. |
| Non-ionic Surfactants (e.g., Tween 20) [18] | Added to running buffers to mitigate non-specific binding caused by hydrophobic interactions, improving data quality. |
| Sensor Chips (e.g., NTA, Carboxyl) [18] | The solid support for ligand immobilization; selecting the correct chemistry is fundamental to assay performance. |
RSM Workflow and Optimization Process
The following diagram illustrates the logical workflow for a typical RSM-based optimization project, from initial screening to final validation.
Diagram 1: RSM Optimization Workflow
Experimental Protocol: Central Composite Design for Biosensor Optimization
This protocol outlines the key steps for implementing a Central Composite Design (CCD) to optimize your biosensor's performance.
1. Identification of Inputs and Their Levels
- Based on prior screening experiments or literature, select the critical continuous factors (e.g., pH, temperature, ligand density) you wish to optimize [16].
- Define a feasible and relevant range for each factor (low and high levels). The center point will be the midpoint of this range [3].
2. Selection and Setup of the CCD
- Choose the type of CCD (e.g., circumscribed, face-centered) based on your experimental region and the desire for properties like rotatability [15] [16].
- Use statistical software to generate the run order, randomizing it to minimize the effects of uncontrolled variables.
- The standard CCD consists of three parts [4] [15]:
- Factorial Points: A full or fractional factorial design from the high and low levels.
- Center Points: Several replicates at the center of the design space to estimate pure error.
- Axial Points: Points located at a distance ±α from the center along each factor axis, while other factors are held at their center point.
3. Execution and Data Collection
- Execute the experiments precisely in the randomized order.
- For each run, meticulously record the response variable (e.g., biosensor response time, signal intensity).
4. Mathematical Modeling and Analysis
- Use multiple linear regression to fit a second-order polynomial model to the data [4] [16]. The model has the form: Y = β₀ + ∑βᵢXᵢ + ∑βᵢᵢXᵢ² + ∑βᵢⱼXᵢXⱼ + ε where Y is the predicted response, β₀ is the constant, βᵢ are linear coefficients, βᵢᵢ are quadratic coefficients, βᵢⱼ are interaction coefficients, and Xᵢ, Xⱼ are the factor levels [4].
- Analyze the variance (ANOVA) of the fitted model to check the significance of the model terms and the overall model adequacy (using R-squared, Adjusted R-squared, and lack-of-fit test) [16].
5. Optimization and Validation
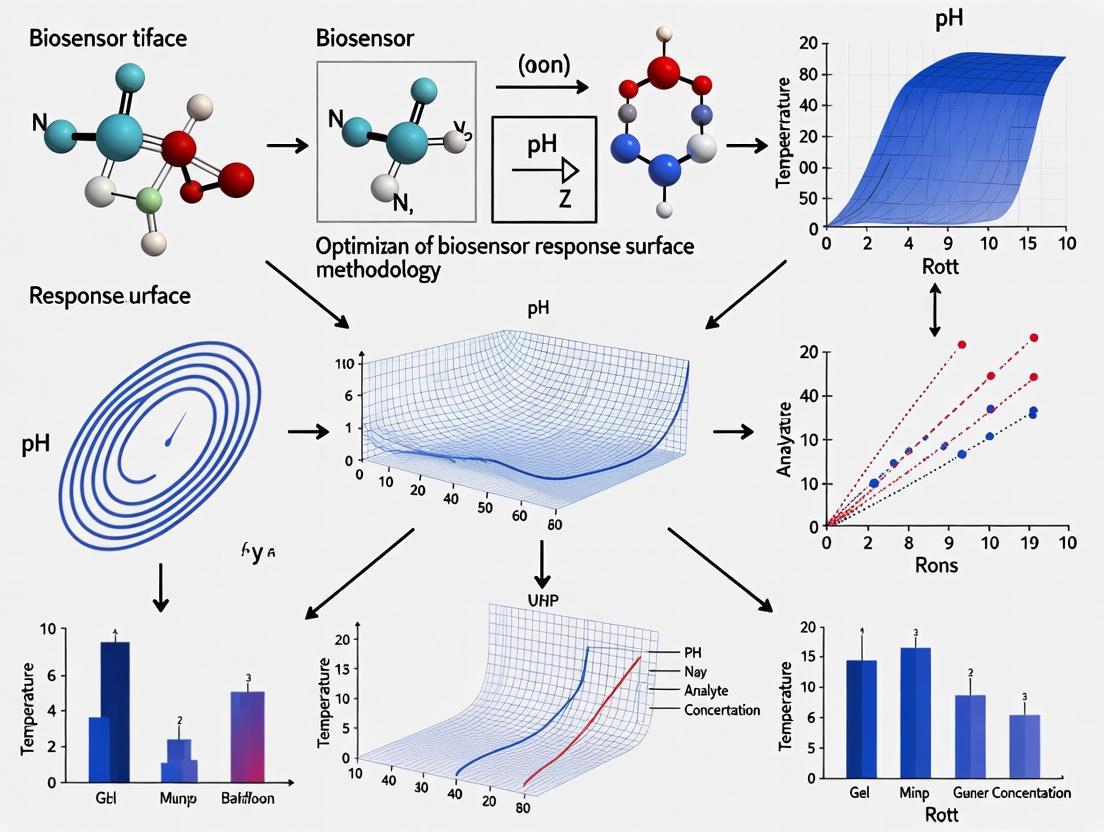
- Use the fitted model to generate contour plots and 3D surface plots to visualize the relationship between factors and the response [4] [3].
- Use numerical optimization techniques or the desirability function approach to find the factor settings that produce the optimal response [15] [3].
- Conduct confirmation experiments at the predicted optimal conditions to validate the model's accuracy. Compare the observed response with the model's prediction [16].
Frequently Asked Questions (FAQs)
Q1: What is the core advantage of using RSM over the traditional "one variable at a time" (OVAT) approach for optimizing my biosensor?
RSM's primary advantage is its ability to efficiently model complex interactions between multiple factors simultaneously, which the OVAT method misses entirely. While OVAT changes one parameter at a time while holding others constant, RSM uses structured experimental designs to vary all factors at once. This not only reveals how factors interact but also drastically reduces the number of experiments needed to find an optimum. For instance, one study optimized a paper-based electrochemical biosensor for miRNA detection: RSM found the optimum conditions with only 30 experiments, whereas the OVAT approach would have required 486 experiments [19].
Q2: My biosensor response is influenced by many variables. How does RSM help me identify which ones are most important?
RSM is often implemented in a sequential process. The first step typically involves screening designs, such as a Plackett-Burman (PB) design, to efficiently identify the factors that have significant effects on your response (e.g., biosensor sensitivity or response time). This allows you to filter out less important variables, saving time and resources for the subsequent optimization phase where you focus only on the critical few factors using more detailed RSM designs like Central Composite Design (CCD) [2] [12].
Q3: What kind of experimental designs are commonly used in RSM for biosensor development?
Two of the most prevalent designs are Central Composite Design (CCD) and Box-Behnken Design (BBD). Both are used to fit second-order (quadratic) models, which can capture curvature in the response surface—essential for finding a true optimum. The choice between them depends on your specific experimental constraints and the region of the factor space you wish to explore [2] [20] [21].
Q4: The model I get from RSM is an approximation. How can I check if it is reliable and accurate?
Model validation is a critical step in RSM. You can check your model's adequacy using several statistical methods provided by RSM software, including [2]:
- Analysis of Variance (ANOVA): To determine the statistical significance of the model and its terms.
- Lack-of-fit tests: To check if the model form is adequate.
- R-squared (R²) values: To see how much variation in the response is explained by the model.
- Residual analysis: To check the model's underlying assumptions.
- Confirmation runs: Conducting a small number of additional experiments at the predicted optimal conditions to verify the model's accuracy [2].
Troubleshooting Common RSM Challenges
Problem: Non-Specific Binding in Biosensor is Skimming My RSM Results
Scenario: You are using SPR technology to characterize binding kinetics as a response in your RSM study. You observe binding signals, but they may be inflated or inaccurate due to non-specific binding of the analyte to the sensor surface itself, rather than just the target ligand [22].
Solutions:
- Modify Running Buffer: Supplement your running buffer with additives like surfactants, Bovine Serum Albumin (BSA), dextran, or polyethylene glycol (PEG) to block non-specific sites [22].
- Optimize Reference Channel: Ensure your reference surface is appropriate. Test a high analyte concentration over a native or BSA-coated surface to check for non-specific binding to the reference [22].
- Change Sensor Chip Type: Switching to a different sensor chip chemistry (e.g., one with a different matrix or coating) can sometimes reduce non-specific interactions [22].
Problem: Inadequate Model or Failure to Locate an Optimum
Scenario: After analyzing your experimental data, the resulting model has a poor fit (low R²), or the predicted optimum seems unrealistic or is not found within your experimental region.
Solutions:
- Verify Factor Levels: Ensure your experimental range for factors is wide enough to capture the response variation, including any potential curvature. The optimum may lie outside your initial design space [23].
- Check for Transformation: Your response variable might require a mathematical transformation (e.g., log, square root) to meet the assumptions of the model.
- Iterate the Process: RSM is often an iterative methodology. If the initial experimental region is unsatisfactory, use the information gained to plan a new set of experiments in a more promising region of the factor space [2].
- Incorporate Prior Knowledge: Advanced techniques can use prior knowledge (e.g., the response is known to increase monotonically with a factor) to constrain the model during regression, leading to a more accurate and physically meaningful representation of the system [21].
Quantitative Data on RSM Efficiency
The table below summarizes data from real biosensor development studies, illustrating the dramatic reduction in experimental effort achieved by using RSM.
Table 1: Comparative Experimental Effort: RSM vs. OVAT Approach
| Biosensor Type / Target | Number of Variables | Estimated OVAT Experiments | RSM Experiments Actually Performed | RSM Design Used | Key Outcome |
|---|---|---|---|---|---|
| Paper-based electrochemical biosensor for miRNA-29c [19] | 6 | 486 | 30 | D-optimal | 5-fold improvement in detection limit |
| Electrochemical DNA biosensor for Mycobacterium tuberculosis [12] | Information missing | Information missing | Information missing | CCD & Plackett-Burman | Wide detection range (0.25–200.0 nM) with low LOD (0.141 nM) |
| Electrochemical sensor for heavy metal detection [19] | Information missing | Information missing | 13 | CCD | Detection limit improved from 12 nM to 1 nM |
Experimental Protocol: Optimizing a DNA Biosensor using RSM
This protocol is adapted from a study that developed a PCR-free electrochemical DNA biosensor for detecting Mycobacterium tuberculosis [12].
1. Define the Problem and Responses:
- Objective: Maximize the sensitivity (minimize the detection limit) of an electrochemical DNA biosensor.
- Response Variable (Y): The electrochemical signal (e.g., current from a redox indicator like Methylene Blue) after hybridization.
2. Screen and Select Factors:
- Use a Plackett-Burman (PB) screening design to identify which of many potential factors significantly affect the response. Factors can include [12]:
- Probe concentration
- Probe immobilization time
- Scan rate for electrodeposition of nanocomposite
- Target hybridization time
- Ionic strength/pH of the buffer
- Incubation temperature
3. Code Factor Levels and Select RSM Design:
- For the significant factors identified in Step 2, define high (+1) and low (-1) levels.
- Choose a Central Composite Design (CCD) to explore the factor space and fit a quadratic model. The CCD will define the specific combinations of factor levels for each experimental run [12].
4. Conduct Experiments and Develop the Model:
- Perform the hybridization assays according to the run order specified by the CCD.
- Measure the electrochemical response for each run.
- Use statistical software (e.g., Minitab, Design-Expert) to perform multiple regression analysis and fit a second-order polynomial model of the form [2] [21]:
Y = β₀ + β₁A + β₂B + β₃C + β₁₂AB + β₁₃AC + β₂₃BC + β₁₁A² + β₂₂B² + β₃₃C²(Where Y is the predicted response, A, B, C are the factors, and β are the coefficients.)
5. Model Validation and Optimization:
- Analyze the fitted model using ANOVA to check its significance.
- Use the model's response surfaces and contour plots to visually identify the optimal factor settings that yield the maximum signal.
- Perform confirmation experiments at the predicted optimal conditions to validate the model's accuracy [2].
Diagram: RSM Workflow for Biosensor Optimization
The Scientist's Toolkit: Key Reagents and Materials
The table below lists essential materials used in RSM-optimized biosensor studies, along with their functions.
Table 2: Essential Research Reagent Solutions for Biosensor Development
| Material / Reagent | Function in Biosensor Development | Example from Literature |
|---|---|---|
| Multi-Walled Carbon Nanotubes (MWCNTs) | Enhance electrical conductivity and provide a high surface-to-volume ratio for biomolecule immobilization, amplifying the electrochemical signal [12]. | Used in a nanocomposite with PPy and HAPNPs for tuberculosis detection [12]. |
| Polypyrrole (PPy) | An organic polymer that increases biocompatibility, conductivity, and chemical stability of the sensor surface while reducing toxicity [12]. | Part of the HAPNPs/PPy/MWCNTs nanocomposite [12]. |
| Hydroxyapatite Nanoparticles (HAPNPs) | A biomaterial used as a substrate for immobilizing biomolecules due to its excellent biocompatibility, non-toxicity, and multiple adsorption sites [12]. | Used to covalently attach the ssDNA probe in the M. tb biosensor [12]. |
| Gold Nanoparticles (AuNPs) | Often used to modify electrode surfaces to improve electron transfer and provide a stable platform for functionalizing biomolecules like DNA or antibodies [19]. | A variable optimized in a D-optimal design for a paper-based miRNA biosensor [19]. |
| Central Composite Design (CCD) | A statistical experimental design that allows for efficient estimation of a second-order (quadratic) model, crucial for finding optimal conditions [2] [12]. | Applied to optimize probe immobilization and target hybridization parameters [12]. |
The Critical Link Between Biosensor Response Time and Clinical Utility
Response time is a critical performance parameter for biosensors, defined as the speed at which the biosensor reacts to changes in the concentration of the target analyte. In clinical and research settings, a slow response time can hinder controllability, introducing dangerous delays in processes ranging from real-time patient monitoring to high-throughput drug screening. For therapeutic applications, such as engineered cell-based therapies, dynamic regulation is even more critical, as genetic circuits must respond precisely to disease-relevant signals and control therapeutic output temporally [24].
Frequently Asked Questions on Response Time
Q1: What is considered a "good" response time for a clinical biosensor? The acceptable response time depends entirely on the clinical application. For continuous glucose monitoring, response times must be fast enough to detect rapid glycemic shifts, typically in the range of seconds to a few minutes. For detection of low-concentration analytes like specific proteins or miRNAs, the response time may be longer due to the kinetics of the binding reaction. The key is that the response time must be fast enough to enable clinical decision-making before the patient's condition changes significantly [24] [25].
Q2: Why has the response time of my biosensor suddenly increased? Increased response time can result from several factors:
- Biofouling: Accumulation of nonspecific proteins or cells on the sensor surface can create a diffusion barrier, slowing analyte access. This is particularly problematic in complex serum matrices [26].
- Sensor Degradation: Physical damage to the biorecognition element or transducer can impair binding efficiency and signal generation.
- Environmental Factors: Changes in temperature, pH, or ionic strength can alter binding kinetics and electron transfer rates in electrochemical biosensors. Regular calibration and appropriate surface regeneration protocols can help identify and mitigate these issues.
Q3: How can I reduce false results without sacrificing response time? Traditional approaches often create a trade-off between accuracy and speed. However, emerging methodologies that integrate machine learning with biosensor data can complement and improve biosensor accuracy and speed simultaneously. By analyzing the initial transient response of the biosensor rather than waiting for steady-state signals, these approaches can reduce both false results and time delays [25].
Q4: Can the choice of biorecognition element affect response time? Absolutely. Different biorecognition elements have characteristic binding kinetics:
- Antibodies: Typically have high specificity but may have slower binding kinetics (minutes to hours).
- Aptamers: Often have faster binding kinetics than antibodies (seconds to minutes).
- Peptides: Generally offer the fastest binding kinetics (seconds) and can be engineered for specific variants, as demonstrated in SARS-CoV-2 antibody detection platforms [26].
- Enzymes: Response depends on catalytic conversion rates, typically very fast (seconds).
Q5: How does Response Surface Methodology help optimize response time? Response Surface Methodology (RSM) is a statistical technique that models and optimizes multiple process parameters simultaneously. For biosensor optimization, RSM can identify optimal conditions that balance response time with other critical parameters like sensitivity and signal-to-noise ratio. For example, ChatGPT-4.0 recently assisted in determining an appropriate RSM design (face-centered central composite design) to optimize culture conditions for a diatom, demonstrating how AI can enhance this experimental approach [27].
Troubleshooting Guides
Problem: Unacceptably Slow Response Time
Potential Causes and Solutions:
Suboptimal Biosensor Design
- Cause: Inefficient mass transfer of analyte to the sensing surface.
- Solution: Redesign the flow cell or microfluidic channels to enhance convective transport. Consider nanostructuring the surface to increase binding site density.
Non-optimized Binding Chemistry
- Cause: Poor orientation or density of biorecognition elements.
- Solution: Systematically vary immobilization conditions (pH, concentration, time) using RSM to find the optimal balance between density and activity.
Signal Processing Limitations
- Cause: Conventional data analysis waiting for steady-state response.
- Solution: Implement machine learning algorithms that can accurately predict final concentration from the initial transient response, potentially reducing required data acquisition time by 50% or more [25].
Problem: Inconsistent Response Times Between Sensor Replicates
Potential Causes and Solutions:
Manufacturing Variability
- Cause: Inconsistent fabrication of sensor surfaces or biorecognition element immobilization.
- Solution: Implement stricter quality control measures and use theory-guided feature engineering to identify and compensate for performance variances among different biosensors [25].
Environmental Fluctuations
- Cause: Uncontrolled temperature, pH, or flow rate variations.
- Solution: Implement environmental monitoring and control systems. Use RSM to quantify the effect of these parameters on response time and establish robust operating ranges.
Quantitative Data on Biosensor Response Time Factors
Table 1: Factors Affecting Biosensor Response Time and Optimization Strategies
| Factor | Impact on Response Time | Optimization Approach | Typical Optimization Range |
|---|---|---|---|
| Temperature | Increases kinetic rates; 2-3x faster per 10°C rise | RSM with temperature as variable | 20-37°C (biological systems) |
| Flow Rate | Enhances mass transfer; reduces stagnation layers | CFD modeling coupled with RSM | 5-100 μL/min (microfluidics) |
| Bioreceptor Density | Optimal range exists; too high causes steric hindrance | Immobilization chemistry optimization | 10¹²-10¹⁴ molecules/cm² |
| Sample Volume | Smaller volumes reach equilibrium faster | Microfluidic design optimization | 1-100 μL (point-of-care) |
| Surface Chemistry | Affects binding kinetics and nonspecific binding | SAM composition variation | Alkanethiol chain length C6-C16 |
Table 2: Performance Comparison of Biosensor Types by Typical Response Time
| Biosensor Type | Biorecognition Element | Typical Response Time | Best Clinical Application |
|---|---|---|---|
| Electrochemical | Enzymes, antibodies | Seconds to minutes | Continuous monitoring (e.g., glucose) |
| Optical (SPR) | Antibodies, peptides | Minutes | Label-free protein interaction studies |
| Piezoelectric | DNA, proteins | 10-30 minutes | miRNA detection, mass-sensitive applications |
| SERS-based | Peptides, aptamers | <5 minutes | Ultrasensitive pathogen detection [26] |
Experimental Protocols
Protocol 1: Response Time Optimization Using Response Surface Methodology
Purpose: To systematically optimize biosensor response time while maintaining sensitivity and specificity.
Materials:
- Functionalized biosensors
- Target analyte solutions of known concentration
- Flow control system (e.g., syringe pump)
- Data acquisition system
- Statistical software (e.g., Minitab, R)
Methodology:
- Identify Critical Factors: Select 3-4 independent variables that potentially affect response time (e.g., temperature, flow rate, bioreceptor density, pH).
- Experimental Design: Implement a face-centered central composite design (FCCCD) as suggested in recent research [27]. This comprises factorial, axial, and center points.
- Response Measurement: For each experimental run, measure:
- Time to reach 90% of steady-state signal (Response Time)
- Signal magnitude at steady state (Sensitivity)
- Signal-to-noise ratio (Specificity indicator)
- Model Fitting: Fit the data to a quadratic model: Y = β₀ + β₁X₁ + β₂X₂ + β₃X₃ + β₁₁X₁² + β₂₂X₂² + β₃₃X₃² + β₁₂X₁X₂ + β₁₃X₁X₂ + β₂₃X₂X₃
- Optimization: Use response optimizer to find parameter settings that minimize response time while maintaining acceptable sensitivity and specificity.
- Validation: Conduct confirmation experiments at the predicted optimal conditions.
Protocol 2: Machine Learning-Enhanced Response Time Reduction
Purpose: To reduce effective response time through analysis of initial transient signals.
Materials:
- Cantilever, electrochemical, or optical biosensors
- Time-series data acquisition system
- Python with scikit-learn, TSFRESH packages
- Augmented dataset of biosensor dynamic responses [25]
Methodology:
- Data Collection: Collect dynamic biosensor responses (normalized signal change vs. time) across full concentration range.
- Data Augmentation: Address data sparsity using jittering, scaling, magnitude warping, and time warping techniques [25].
- Feature Engineering:
- Extract theory-based features from biosensor binding kinetics
- Generate additional features using TSFRESH algorithm
- Model Training: Train classification models (Random Forest, SVM) to predict analyte concentration from early transient response.
- Validation: Compare time to accurate classification using initial transient vs. full steady-state response.
Research Reagent Solutions
Table 3: Essential Materials for Biosensor Response Time Optimization
| Reagent/Material | Function | Example Applications |
|---|---|---|
| 4-mercaptobenzoic acid (MBA) | Raman reporter molecule; forms self-assembled monolayers | SERS-based biosensors for antibody detection [26] |
| Gold nanoparticles (30nm) | Signal amplification; enhance electromagnetic field | Optical and electrochemical biosensors [26] |
| Synthetic peptides (e.g., P44) | Biorecognition elements with tunable kinetics | Variant-specific pathogen detection [26] |
| Carboxylated/aminated surfaces | Controlled immobilization of biorecognition elements | Optimal orientation for enhanced binding kinetics |
| Theory-guided feature sets | Machine learning inputs for early concentration prediction | Reducing effective response time by >50% [25] |
Signaling Pathways and Experimental Workflows
A Step-by-Step Methodology: Applying RSM to Accelerate Biosensor Response
Frequently Asked Questions
1. What are the most common factors that affect biosensor response time? The response time of a biosensor is primarily influenced by factors related to mass transport and the binding reaction kinetics. Key factors often include:
- Flow Conditions: The velocity and flow rate of the sample fluid. Slow flow can lead to thicker diffusion boundary layers, while very high flow may not allow sufficient time for analyte-binding reactions [28] [29].
- Sensor Geometry: The physical design of the sensing area, such as the arrangement (e.g., inline vs. staggered) and shape of micro-features like micropillar electrodes, can enhance surface area and induce fluid mixing, significantly improving response times [28].
- Analyte Concentration: The initial concentration of the target molecule in the sample influences how quickly the binding sites on the sensor surface are occupied [29].
- Binding Kinetics: The intrinsic rates of the association and dissociation between the analyte and the immobilized biorecognition element are fundamental [30].
2. How can I systematically identify the most critical factors for my biosensor optimization? Instead of testing one factor at a time, use a systematic approach like Design of Experiments (DoE). DoE is a chemometric tool that allows you to efficiently screen multiple factors simultaneously. It helps identify not only the individual effect of each factor but also how they interact with each other, which is often missed in traditional methods [31] [11]. For instance, a factorial design can be used as a first step to screen which factors (e.g., flow velocity, pillar spacing, analyte concentration) have a significant impact on your response variable (response time) [11].
3. I've identified key factors, but my response time model is inaccurate. What could be wrong? Your model might be failing to account for underlying physical or biochemical phenomena. For example:
- Molecular Rearrangement: The adsorption of biomolecules is sometimes followed by a change in their structure or orientation, a process known as rearrangement. This can alter the binding kinetics, leading to a two-step response that simple models cannot accurately describe [30].
- Inadequate Model Validation: The fitted model must be rigorously checked for accuracy. Use statistical validation like Analysis of Variance (ANOVA), lack-of-fit tests, and residual analysis to ensure the model is a good representation of the true process [2].
4. What is a major advantage of using Response Surface Methodology over one-factor-at-a-time experiments? The primary advantage is the ability to detect interactions between factors. In a one-factor-at-a-time approach, you might find a "best" level for one factor, but this level may not be optimal when another factor is changed. RSM, through its structured designs, can model these complex interactions and curvature in the response, leading to the identification of a true optimum [31] [11] [2].
5. How can I improve a biosensor's response time using passive fluid dynamics? Integrating micro-obstacles within the microfluidic channel is an effective passive method. Placing a strategically located obstacle, like a cylinder or a parallelepiped, deforms the fluid stream. This deformation enhances mixing, disrupts the diffusion boundary layer, and increases the transport of analytes to the sensing surface, thereby reducing the response time [28] [29]. One study showed that a staggered arrangement of micropillars can improve response time by 25% compared to an inline arrangement [28].
Troubleshooting Guides
Problem: Slow Response Time During Association Phase A slow response time indicates that the analyte is taking too long to bind to the ligands on the sensor surface. This is often a mass transport limitation.
| Possible Cause | Diagnostic Steps | Solution |
|---|---|---|
| Thick Diffusion Boundary Layer | Check if response is faster at higher flow velocities. Visually inspect (via simulation or dye tests) for stagnant fluid regions above the sensor. | Introduce passive mixers (e.g., staggered micropillar arrays) into the flow channel to disrupt the boundary layer [28] [29]. |
| Sub-optimal Flow Velocity | Perform a DoE screening with flow velocity as a factor. Model the response to find if an optimum exists. | Systematically optimize the flow rate using RSM. The goal is to find a velocity that balances rapid analyte delivery with sufficient reaction time [28]. |
| Low Analyte Concentration | Verify the concentration of the prepared sample. Check if the signal increases proportionally with concentration in calibration tests. | Increase the analyte concentration if possible, or pre-concentrate the sample. Ensure the sensor's dynamic range is appropriate for the expected concentrations [29]. |
Problem: High Variability or Noise in Response Signal Fluctuations in the signal can mask the true binding response and affect the determination of response time.
| Possible Cause | Diagnostic Steps | Solution |
|---|---|---|
| Stochastic Binding/ Rearrangement | Analyze the power spectral density (PSD) of the signal noise. A model that includes rearrangement kinetics may better fit the data [30]. | Develop or use a more comprehensive noise model that accounts for processes like molecular rearrangement upon adsorption to correctly interpret signal fluctuations [30]. |
| Uncontrolled Experimental Conditions | Check for fluctuations in temperature, pressure, or flow rate from pumps and actuators. | Implement better environmental controls and use high-precision, calibrated equipment for fluid delivery. |
Problem: RSM Model Shows Poor Fit or Lack of Fit Your empirical model fails to adequately describe the relationship between your factors and the response time.
| Possible Cause | Diagnostic Steps | Solution |
|---|---|---|
| Important Factors Omitted | Use subject matter knowledge and literature review. Perform a factor screening DoE (e.g., Plackett-Burman) before a full RSM. | Re-specify the model by adding potentially critical factors identified in screening, such as specific geometric parameters (pillar diameter, spacing) or chemical conditions (pH, ionic strength) [28]. |
| Presence of Significant Curvature | Examine residual plots from a first-order model; a U-shaped pattern suggests curvature. | Move from a factorial design to a second-order RSM design like a Central Composite Design (CCD) or Box-Behnken Design, which can model curvature [2]. |
| Insufficient Data Points | Confirm the number of experimental runs meets the minimum required for the chosen model. | Augment the experimental design with additional runs, such as adding center points or axial points to a factorial design to create a CCD [11]. |
Critical Factors for Biosensor Response Time Optimization
The following table summarizes key factors that influence biosensor response time, as identified in experimental and numerical studies. These factors are critical to define in any optimization problem.
| Factor Category | Specific Factor | Influence on Response Time | Optimization Approach |
|---|---|---|---|
| Fluid Flow & Transport | Flow Velocity / Rate | Directly affects mass transport; low velocity increases boundary layer thickness, very high velocity may reduce binding efficiency [28] [29]. | Use RSM to find optimum velocity; one study suggested a ratio of flow's inertia to viscous forces < 0.1 [28]. |
| Flow Confinement | Focusing the sample stream into a thin layer over the sensor increases local velocity and enhances binding rate [29]. | Optimize the ratio of sample flow to sheath flow rates. | |
| Sensor Geometry | Micropillar Arrangement | A staggered arrangement induces better mixing and can improve response time by ~25% compared to an inline arrangement [28]. | Compare different geometric configurations (inline, staggered) via simulation or DoE. |
| Obstacle Position | The location of a mixing obstacle relative to the sensor surface and inlet is critical for maximizing its disruptive effect on the boundary layer [29]. | Systematically vary the obstacle position (e.g., distance from inlet) in a DoE to find the optimal location. | |
| Binding Chemistry | Analyte Concentration | Higher concentrations generally lead to faster surface saturation and shorter association times, but may slow dissociation [29]. | Calibrate for the expected concentration range and consider it as a factor in the DoE if it is a variable. |
| Biomolecular Rearrangement | Post-adsorption changes in analyte structure can slow the overall response kinetics, leading to two-step binding behavior [30]. | Incorporate kinetic models that account for rearrangement (e.g., two-step kinetics) for accurate interpretation. |
Experimental Protocol: Optimizing Flow and Geometry with DoE
This protocol outlines how to use Response Surface Methodology to optimize flow and geometric factors for improved response time.
1. Define the Problem and Response Variable
- Objective: Minimize the response time of the biosensor.
- Response Variable: The time (in seconds) for the sensor's signal to reach 90% of its steady-state value upon introduction of the analyte.
2. Select and Code the Critical Factors Based on prior knowledge and screening, select two key factors for a CCD optimization. The factors are scaled to coded levels (-1, 0, +1).
- Factor A (Flow Velocity): For example, from 100 μm/s (-1) to 300 μm/s (+1), with a center point at 200 μm/s.
- Factor B (Obstacle Position): The distance of a mixing obstacle from the channel inlet, e.g., from 2 mm (-1) to 6 mm (+1), with a center point at 4 mm.
3. Select an Experimental Design and Conduct Runs
- Design: A Central Composite Design (CCD) is suitable for fitting a second-order (quadratic) model. A full CCD for two factors requires 13 experimental runs (4 factorial points, 4 axial points, and 5 center points for replication) [2].
- Execution: Set up your microfluidic biosensor system. For each run in the randomized experimental matrix, set the flow velocity and obstacle position to the specified levels, introduce the analyte, and record the response time.
4. Develop and Validate the Response Surface Model
- Model Development: Use statistical software to fit a second-order polynomial model to the data (e.g., Response Time = β₀ + β₁A + β₂B + β₁₁A² + β₂₂B² + β₁₂AB).
- Model Validation: Check the model's Analysis of Variance (ANOVA). Key metrics include a high R² value (e.g., >0.9) and a non-significant lack-of-fit p-value (e.g., >0.05) [2]. Perform confirmation runs at the predicted optimum settings to validate the model.
5. Optimize and Interpret the Results
- Use the software's optimization function to find the factor settings (A and B) that minimize the predicted response time.
- Examine the response surface contour plot to understand the relationship between the factors and to identify a robust operating region.
The Scientist's Toolkit: Research Reagent Solutions
| Item | Function in Response Time Optimization |
|---|---|
| COMSOL Multiphysics Software | A finite-element-based simulation platform used to numerically model the effects of geometry and flow on biosensor performance before physical prototyping, saving time and resources [28]. |
| Microfluidic Chips with Micropillar Arrays | Sensor substrates, often made of PDMS or gold, featuring engineered microstructures that increase surface area and disrupt laminar flow to enhance analyte transport [28]. |
| C-reactive Protein (CRP) / Immunoglobulin G (IgG) Pair | A well-characterized model analyte-ligand (antibody) system used in benchmark studies to test and optimize biosensor performance under controlled conditions [29]. |
| Design of Experiments (DoE) Software | Statistical software (e.g., JMP, Minitab, Design-Expert) used to create experimental designs, fit response surface models, and find optimal factor settings [31] [2]. |
RSM Workflow for Biosensor Optimization
The following diagram illustrates the iterative, multi-stage workflow for applying Response Surface Methodology to biosensor optimization.
For researchers optimizing biosensor response time, selecting the proper Response Surface Methodology (RSM) design is critical for efficiently modeling curvature and identifying optimal operating conditions. Central Composite Design (CCD) and Box-Behnken Design (BBD) are the two most widely used RSM designs for this purpose [32]. This guide will help you choose the right design and troubleshoot common issues.
CCD vs. BBD: A Quick Comparison
The table below summarizes the core characteristics of each design to help you make an initial selection.
| Feature | Central Composite Design (CCD) | Box-Behnken Design (BBD) |
|---|---|---|
| Core Structure | Built on a two-level factorial or fractional factorial design, augmented with axial (star) points and center points [32] [33]. | A three-level design based on combining two-level factorial designs with incomplete block designs; does not contain an embedded factorial matrix [32] [34]. |
| Factor Levels | Typically 5 levels per factor (for rotatable designs), but can be 3 with a face-centered design (α=1) [32] [33]. | Always 3 levels per factor [32]. |
| Experimental Points | Includes factorial points (corners), axial points (outside the cube), and center points [33]. | Points are located at the midpoints of the edges of the experimental space and at the center; no corner points [32] [34]. |
| Sequential Experimentation | Excellent. You can build on a previous factorial experiment by adding axial and center points [32] [33]. | Not suited. It is an "all-or-nothing" design that cannot naturally include prior factorial experiments [32] [33]. |
| Key Advantage | High flexibility and ideal for sequential learning when the process is not well understood [33]. | High efficiency and safety; avoids extreme factor combinations and is often less expensive to run [32] [33]. |
How to Choose: A Decision Guide
The following workflow diagram visualizes the key questions to ask when selecting between a CCD and a BBD for your biosensor optimization research.
Detailed Experimental Protocols
Implementing a Central Composite Design (CCD)
A CCD is constructed from three distinct sets of experimental runs [35] [36]:
- Factorial Points: A full or fractional factorial design (2^k) that forms the "cube" of the design. These are the standard high (+1) and low (-1) settings.
- Axial (Star) Points: Points fixed axially at a distance α from the center of the design. This distance is defined for each factor and is used to estimate quadratic effects. The value of α can be chosen to achieve desired properties like rotatability. A common and practical choice is the face-centered design (α=1), which keeps all points within the original -1 to +1 range and requires only 3 factor levels [32].
- Center Points: Multiple replicate runs (typically 3-6) where all factors are set at their midpoint (coded 0). These are crucial for estimating pure experimental error and detecting curvature.
The total number of experiments (N) required for a CCD with k factors is: N = 2^k + 2k + n, where n is the number of center point replicates [35].
Workflow for Sequential Experimentation with CCD: This methodology is highly recommended for biosensor development where knowledge is built incrementally [37].
- Begin with a factorial design (full or fractional) to screen for significant factors affecting biosensor response time.
- Analyze the results. If curvature is suspected (e.g., from analysis of center points), augment the design by adding axial points.
- The combined set of runs (factorial + axial + center points) now constitutes a full CCD, allowing you to fit a highly accurate quadratic model for optimization.
Implementing a Box-Behnken Design (BBD)
A BBD is constructed differently, treating factors in separate blocks [34]:
- For a three-factor system, the design can be thought of as a set of two-factor full factorial designs (2^2), while the third factor is held constant at its center point.
- This process is rotated for all possible pairs of factors.
- Several center points are added to provide an estimate of error and model stability.
BBDs are noted for their run efficiency. For example, a 3-factor BBD requires only 15 experiments (including center points), while a comparable CCD requires 17-20 [33]. This efficiency becomes more pronounced with a higher number of factors.
Key Consideration for Biosensors: Because a BBD never includes experiments where all factors are at their extreme high or low settings simultaneously, it is exceptionally useful when testing such combinations could damage expensive biosensor components or produce unreliable data [32] [33].
Troubleshooting FAQs
1. I already ran a full factorial screening experiment. Can I use that data?
- Yes, if you choose a CCD. A major advantage of CCD is sequential experimentation. You can simply add the required axial points and additional center points to your existing factorial data to create a full response surface model [32] [33].
- No, if you choose a BBD. The BBD structure does not include a factorial design, so your previous data cannot be incorporated directly [32].
2. My model shows poor prediction capability. What went wrong?
- For CCD: Ensure your choice of α (alpha, the distance to axial points) is appropriate. A rotatable CCD (where α is calculated as (2^k)^0.25) provides constant prediction variance at all points equidistant from the center, leading to better prediction across the design space [32] [36]. If your experimental region is constrained, a face-centered CCD (α=1) might be a better, more practical choice.
- For both designs: Insufficient replication of center points is a common cause. Center points are essential for estimating pure error, which is used to test for model lack-of-fit. A minimum of 3-5 center points is generally recommended [36].
3. One of the optimum conditions suggested by the model is outside my safe operating zone. How can I prevent this?
- This is a key strength of the Box-Behnken Design. Since BBD does not include axial points that extend beyond the factorial cube or test all factors at their extreme settings simultaneously, all design points naturally fall within your defined safe operating zone [32] [33]. If you must use a CCD, opt for a face-centered design (α=1), which will keep all points within the -1 to +1 coded range, though you will still test the extreme corners [32].
4. I have more than 5 factors to optimize. The required runs are too high. What should I do?
- Neither CCD nor BBD is recommended for a high number of factors in RSM. The correct approach is to first use a screening design (like a fractional factorial or Plackett-Burman design) to identify the 3-5 most critical factors. Then, proceed with a CCD or BBD to optimize only those key factors [33] [35].
Research Reagent Solutions for Biosensor Optimization
When applying RSM to biosensor development, the key materials often revolve around the electrode and biorecognition elements [10].
| Material | Function in Biosensor Optimization |
|---|---|
| Glassy Carbon Electrode (GCE) | A common working electrode platform. Its surface is polished and modified to enhance electron transfer and provide a substrate for immobilization [10]. |
| Nanomaterials (e.g., Graphene Oxide, Carbon Nanotubes, Gold Nanoparticles) | Used to modify the electrode surface. They increase the effective surface area, improve electrocatalytic properties, and enhance the electron transfer rate, which can directly impact response time and sensitivity [10]. |
| Enzymes / Antibodies / Aptamers | The biorecognition elements. They are immobilized on the electrode to provide specificity to the target analyte. Their concentration, activity, and immobilization method are critical factors for optimization [10]. |
| Cross-linking Agents (e.g., Glutaraldehyde) | Used to create covalent bonds for immobilizing biorecognition elements onto the modified electrode surface, impacting biosensor stability and reproducibility [10]. |
| Self-Assembled Monolayer (SAM) Reagents | Used to create a highly ordered, thin organic film on electrode surfaces (especially gold), providing a well-defined platform for controlled immobilization of biomolecules [10]. |
Troubleshooting Guides & FAQs
Frequently Asked Questions
Q1: Why is my biosensor's hybridization signal low or inconsistent, even when using the optimized parameters from my RSM model? Low hybridization signals often stem from suboptimal local conditions at the sensor surface that are not fully captured by the initial RSM model [38]. First, verify the ionic strength (NaCl concentration) of your hybridization buffer, as this is frequently the most significant factor affecting hybridization efficiency and signal intensity [38]. Second, check the pH of the buffer, as it can influence the charge state of the DNA backbone and the redox indicator [38]. Finally, ensure your hybridization time and temperature are strictly controlled, as these also significantly impact the process [38].
Q2: My RSM model suggests an optimum, but the experimental response is not reproducible. What could be wrong? Poor reproducibility usually points to inconsistencies in the biosensor fabrication process prior to hybridization [12] [10]. Key areas to troubleshoot include:
- Electrode Modification: Ensure uniform dispersion of nanomaterials like MWCNTs and consistent electrodeposition parameters for polymers like polypyrrole (PPy) across all electrodes [12].
- Probe Immobilization: The concentration of the DNA probe and its immobilization time are critical [12]. Use the same immobilization protocol for all sensors and confirm successful immobilization using techniques like Electrochemical Impedance Spectroscopy (EIS) [38].
- RSM Model Validation: Confirm that your RSM model is statistically significant and that you are performing experiments at the optimum conditions with adequate replication to account for normal experimental variance [11].
Q3: The biosensor's detection limit is higher than predicted by the RSM optimization. How can I improve sensitivity? To enhance sensitivity, focus on the signal amplification strategy. Consider the following:
- Nanocomposite Performance: The synergistic effect of your nanocomposite (e.g., HAPNPs/PPY/MWCNTs) is crucial for signal amplification [12]. Verify the quality and proportion of these nanomaterials.
- Redox Indicator: The concentration and incubation time with the redox indicator (e.g., Methylene Blue) must be optimized, as this directly affects the current signal [12] [39].
- Advanced Modeling: If the basic RSM model is insufficient, consider applying constraints based on prior knowledge (e.g., a known monotonic relationship between probe concentration and signal) using advanced techniques like coefficient clipping to refine your model [21].
Q4: My biosensor lacks specificity and shows high response to non-complementary DNA sequences. What should I do? High non-specific binding is often related to the stringency of the hybridization conditions [38] [39].
- Increase Stringency: Introduce a washing step after hybridization with a buffer of lower ionic strength or at a slightly elevated temperature to disrupt weakly bound, non-specific sequences.
- Check Probe Design: Verify the specificity and uniqueness of your immobilized DNA probe sequence for the target.
- Optimize with RSM: Use RSM to explicitly optimize for selectivity by including the response to a non-complementary or mismatch DNA sequence as a secondary response variable to be minimized in your experimental design [38].
Troubleshooting Table: Common Experimental Issues and Solutions
| Problem | Potential Causes | Recommended Solutions |
|---|---|---|
| High Background Signal | Non-specific adsorption of redox indicator; incomplete washing. | Optimize washing steps post-hybridization; include a blocking agent (e.g., BSA) on the sensor surface [38]. |
| Signal Drift Over Time | Instability of the nanocomposite film; degradation of the immobilized DNA probe. | Ensure stable electropolymerization of PPy [12]; store biosensors in appropriate buffer at 4°C [14]. |
| Poor Linear Range | Saturation of available probe sites on the electrode surface. | Use RSM to find the optimal probe concentration that offers a wide dynamic range without saturation at expected target concentrations [12]. |
| Large Error in RSM Model Prediction | High measurement noise; overlooked factor interactions. | Increase replicates at the center point of your experimental design to better estimate pure error; consider a more comprehensive design like Central Composite Design (CCD) to capture complex interactions [12] [11]. |
Experimental Protocols & Data
Detailed Protocol: RSM-Optimized Fabrication of an Electrochemical DNA Biosensor
This protocol is adapted from the work on detecting Mycobacterium tuberculosis, which utilized a HAPNPs/PPY/MWCNTs nanocomposite [12].
1. Electrode Pre-treatment:
- Polish a glassy carbon electrode (GCE) successively with alumina slurry (e.g., 1.0, 0.3, and 0.05 µm) on a microcloth.
- Rinse thoroughly with deionized water and then with ethanol.
- Perform electrochemical cleaning by cycling the potential in a 0.5 M H₂SO₄ solution until a stable cyclic voltammogram is obtained.
2. Nanocomposite Modification:
- Prepare a dispersion of MWCNTs in a suitable solvent (e.g., DMF).
- Drop-cast a specific volume of the MWCNTs dispersion onto the clean GCE surface and allow it to dry.
- Electropolymerize pyrrole onto the MWCNTs/GCE from a solution containing pyrrole monomer and a supporting electrolyte using Cyclic Voltammetry (CV).
- Immobilize Hydroxyapatite Nanoparticles (HAPNPs) onto the PPY/MWCNTs/GCE surface.
3. DNA Probe Immobilization:
- Covalently attach the amino-modified ssDNA probe to the HAPNPs/PPY/MWCNTs/GCE surface using a cross-linker like glutaraldehyde or EDC/NHS chemistry.
- Rinse the modified electrode to remove unbound probes.
4. DNA Hybridization and Detection:
- Incubate the biosensor with the sample containing the target DNA sequence under the RSM-optimized conditions (e.g., time, temperature, pH, ionic strength).
- After hybridization, rinse the electrode to remove unhybridized DNA.
- Incubate the biosensor with a Methylene Blue (MB) solution.
- Perform Differential Pulse Voltammetry (DPV) to measure the reduction current of MB, which is inversely related to the amount of double-stranded DNA formed.
Quantitative Data from RSM-Optimized Biosensors
The table below summarizes performance data from various RSM-optimized electrochemical DNA biosensors, demonstrating the effectiveness of this approach.
Table 1: Performance Metrics of RSM-Optimized Electrochemical DNA Biosensors
| Target Analyte | Nanomaterial Used | Optimized Parameters (Examples) | Detection Limit | Linear Range | Citation |
|---|---|---|---|---|---|
| Mycobacterium tuberculosis | HAPNPs/PPY/MWCNTs | Probe concentration, immobilization time, incubation time | 0.141 nM | 0.25 - 200.0 nM | [12] |
| Dengue Virus | SiNWs/AuNPs | pH, NaCl concentration, temperature, hybridization time | 10 pM (oligonucleotide) | Not Specified | [38] |
| Heavy Metal Ions (Bi³⁺, Al³⁺) | Pt/PPD/GOx | Enzyme concentration, flow rate, scan cycles | (Sensitivity optimized) | Wide working range | [14] |
| Infectious Bronchitis Virus (IBV) | MWCNTs/Gold Electrode | Not specified in detail | 2.6 nM | 2.0×10⁻¹² to 2.0×10⁻⁵ mol L⁻¹ | [39] |
The Scientist's Toolkit: Research Reagent Solutions
Table 2: Essential Materials for RSM-Optimized Electrochemical DNA Biosensors
| Reagent/Material | Function/Application | Key Characteristics |
|---|---|---|
| Multi-Walled Carbon Nanotubes (MWCNTs) | Electrode modifier to enhance conductivity and surface area [12] [39]. | High electrical conductivity, high surface-to-volume ratio. |
| Polypyrrole (PPy) | Conducting polymer for biocompatible matrix and stable film formation [12]. | Good conductivity, chemical stability, reduces toxicity. |
| Hydroxyapatite Nanoparticles (HAPNPs) | Biomaterial substrate for immobilizing biomolecules [12]. | High biocompatibility, good bioactivity, multi-adsorbing sites. |
| Gold Nanoparticles (AuNPs) | Electrode modifier to improve electron transfer and probe immobilization [38]. | Excellent conductivity, facile functionalization with thiolated DNA. |
| Methylene Blue (MB) | Electroactive redox indicator for DNA hybridization detection [12] [38] [39]. | Intercalates differently with ssDNA vs. dsDNA, generating a measurable current change. |
| Screen-Printed Electrodes (SPEs) | Disposable, portable electrochemical platforms for point-of-care applications [14] [38]. | Mass-producible, miniaturized, often made of gold or carbon. |
| Chitosan (CS) | Biopolymer for forming a stable film and functionalizing MWCNTs [39]. | Excellent film-forming ability, biocompatibility, amino groups for cross-linking. |
Workflow and Signaling Diagrams
RSM Biosensor Optimization Workflow
Electrochemical DNA Biosensor Mechanism
Technical Support Center: FAQs & Troubleshooting Guides
Frequently Asked Questions (FAQs)
Q1: What is the primary advantage of using Response Surface Methodology (RSM) over traditional "one-factor-at-a-time" (OFAT) optimization for biosensor development?
RSM is a multivariate chemometric tool that allows for the simultaneous study of multiple factors and their interactions on the biosensor's performance [10]. Unlike OFAT, which only provides local optima and requires significant experimental work, RSM maps the entire experimental domain with fewer experiments, leading to a more robust and accurate identification of optimal conditions [10] [11]. It also creates a mathematical model that can predict biosensor performance under various conditions [40] [11].
Q2: My biosensor signal is unstable under flow conditions. What could be the cause?
Unstable signals in flow-based systems can often be attributed to an improperly optimized flow rate [40] [41]. A flow rate that is too high can reduce the interaction time between the analyte and the biorecognition element, leading to a lower signal. Conversely, a very low flow rate might not efficiently refresh the electrode surface, causing signal drift. Furthermore, check for air bubbles in the flow system and ensure all fluidic connections are secure to prevent pressure fluctuations.
Q3: I am observing high background signals or non-specific binding. How can I resolve this?
Non-specific binding occurs when analytes or other sample matrix components bind to the sensor surface indiscriminately [22]. To minimize this:
- Supplement your running buffer with additives like bovine serum albumin (BSA), a surfactant, or polymers like polyethylene glycol (PEG) [22].
- Optimize the surface chemistry of your sensor chip or electrode. Coupling your biorecognition element via a different functional group (e.g., a thiol group instead of an amine) can sometimes make the binding pocket more accessible and reduce non-specific interactions [22].
- Include a proper reference surface in your experimental setup to account for and subtract non-specific binding effects [22].
Q4: The activity of my immobilized enzyme seems low. What factors should I investigate?
Low enzyme activity can stem from several preparation and operational parameters, which are ideal candidates for RSM optimization:
- Enzyme Concentration: The amount of enzyme used during immobilization must be optimized. Too little enzyme leads to low sensitivity, while too much can create a densely packed layer that hinders substrate diffusion [40] [14].
- Immobilization Efficiency: The method of immobilization (e.g., entrapment in a polymer, covalent binding) and the number of immobilization cycles (e.g., scan cycles in electrophysmerization) critically impact enzyme activity and stability [40] [14].
- Working pH and Buffer Composition: The pH of the carrier buffer must be compatible with the enzyme's optimal activity range [41].
Troubleshooting Common Experimental Problems
| Problem | Possible Causes | Suggested Solutions |
|---|---|---|
| Low Sensitivity | • Sub-optimal enzyme concentration [40] [14]• Inefficient electron transfer• Incorrect applied potential | • Use RSM to optimize enzyme loading and electrode modification [40].• Incorporate mediators or nanomaterials like carbon nanotubes to enhance electron transfer [42]. |
| Poor Reproducibility | • Inconsistent electrode preparation [40]• Fluctuations in flow rate or temperature | • Standardize immobilization protocols (e.g., precise control of scan cycles) [40] [14].• Use a high-precision peristaltic pump and maintain constant temperature. |
| Slow Response Time | • Excessive flow cell volume• Slow electron transfer kinetics | • Miniaturize the flow cell reactor chamber (e.g., to 10 μL) to reduce dead volume [41].• Optimize flow rate to balance analysis speed and signal intensity [40] [41]. |
| Surface Fouling/Regeneration Issues | • Accumulation of reaction products or sample matrix components | • Identify a robust regeneration solution (e.g., 10 mM Glycine pH 2.0, 10 mM NaOH, 2 M NaCl); adding 10% glycerol can help preserve target stability [22].• Consider using electrode materials resistant to fouling, like boron-doped diamond [43]. |
Experimental Protocols & Data Presentation
Detailed Protocol: RSM-Optimized Amperometric Biosensor for Metal Ion Detection
This protocol is adapted from a study optimizing a Pt/PPD/GOx (Platinum/o-Phenylenediamine polymer/Glucose Oxidase) biosensor for heavy metal detection using Flow Injection Analysis (FIA) [40] [14].
1. Apparatus and Materials
- Potentiostat: Computer-controlled (e.g., PalmSens) [40].
- Electrode: Disposable screen-printed platinum electrode (SPPtE) [40].
- Flow System: Peristaltic pump (e.g., Gilson MiniPuls 3), injection valve with 200-μL loop, and a plexiglass flow cell [40].
- Chemicals: Glucose oxidase (GOx) from Aspergillus niger, o-phenylenediamine (oPD), D-(+)-glucose, acetate buffer (50 mM, pH 5.2), and metal ion standards (e.g., Bi³⁺, Al³⁺) [40] [14].
2. Biosensor Preparation (Pt/PPD/GOx) a. Condition the platinum screen-printed electrode by cyclic voltammetry (CV) in 10 mM K₃Fe(CN)₆ between -0.3 V and +0.5 V until a steady state is reached [40] [14]. b. Cast 50 μL of a solution containing a variable concentration of GOx (e.g., 50-800 U·mL⁻¹) and 5 mmol/L oPD onto the electrode surface [40] [14]. c. Perform cyclic voltammetry between -0.07 V and +0.77 V for a variable number of cycles (e.g., 10-30 cycles) to electrophysmerize the PPD film and entrap the enzyme [40] [14]. d. Rinse the electrode thoroughly with acetate buffer and mount it in the flow cell [40].
3. Experimental Design and Optimization via RSM a. Define Factors and Responses: Select independent variables (e.g., Enzyme Concentration, Number of Scan Cycles, Flow Rate) and the response (e.g., biosensor Sensitivity (S, μA·mM⁻¹) towards a target metal ion) [40]. b. Select a Design: A Central Composite Design (CCD) is commonly used. For 3 factors, this involves 20 experiments (8 factorial points, 8 axial points, 4-6 center point replicates) [40] [14]. c. Conduct Experiments: Run the experiments in the order defined by the design matrix, measuring the biosensor's sensitivity for each set of conditions. d. Model and Analyze: Fit the data to a second-order polynomial model (Equation 1) and use Analysis of Variance (ANOVA) to determine the significance of each factor and their interactions [40] [14]. e. Validate Model: Confirm the optimal parameters predicted by the model with experimental validation runs [40].
4. Analysis of Metal Ions a. Operate the FIA system with an applied potential of +0.47 V vs. Ag/AgCl in acetate buffer (50 mM, pH 5.2) at the optimized flow rate [40] [14]. b. Inject 200 μL of glucose solution containing different concentrations of metal ions. c. Calculate the percentage of enzyme inhibition caused by the metal ion using the formula: Inhibition % = (I₀ - I) / I₀ × 100 where I₀ and I are the biosensor currents for glucose without and with the metal ion, respectively [40] [14].
Quantitative Data from RSM Optimization Studies
Table 1: Optimal Conditions from RSM Studies on Different Biosensors
| Biosensor System | Analyte | Optimal Factors from RSM | Key Optimized Response | Citation |
|---|---|---|---|---|
| Pt/PPD/GOx | Bi³⁺, Al³⁺ | • Enzyme: 50 U·mL⁻¹• Scan Cycles: 30• Flow Rate: 0.3 mL·min⁻¹ | Sensitivity (S, µA·mM⁻¹) | [40] [14] |
| Uricase/SPE-Flow Cell | Uric Acid | • pH: 8.0• Flow Rate: 0.2 mL·min⁻¹• Enzyme: 5 U/reactor | LOD: 4 nM; Linear Range: 10 nM - 20 µM | [41] |
| AChE/CNT/GC | Paraoxon | • Inhibition Time: 6 min | LOD: 0.4 pM | [42] |
Table 2: Summary of Common Experimental Design (DoE) Types
| Design Type | Best Used For | Key Characteristics | Example Application in Biosensors |
|---|---|---|---|
| Full Factorial (2^k) | Screening a limited number of factors to identify main effects and interactions. | Requires 2^k experiments; each factor at two levels (-1, +1). Orthogonal. | Initial screening of factors like pH, temperature, and concentration [11]. |
| Central Composite (CCD) | Response Surface Methodology; building a quadratic model for optimization. | Augments factorial points with axial and center points to estimate curvature. | Optimizing enzyme concentration, scan cycles, and flow rate for maximum sensitivity [40] [11]. |
| Mixture Design | Optimizing the proportions of components in a mixture (summing to 100%). | Components cannot be varied independently. | Optimizing the ratio of different materials in an electrode ink or a composite film [11]. |
The Scientist's Toolkit: Research Reagent Solutions
Table 3: Essential Materials for Developing Flow-Based Amperometric Biosensors
| Reagent / Material | Function in Biosensor Development | Example from Literature |
|---|---|---|
| Glucose Oxidase (GOx) | Model enzyme for inhibition-based biosensors; catalyzes glucose oxidation, a process inhibitable by heavy metals. | Used as the biorecognition element in a Pt/PPD/GOx biosensor for Bi³⁺ and Al³⁺ [40] [14]. |
| Screen-Printed Electrodes (SPEs) | Low-cost, disposable, and miniaturizable transducer platforms. Enable mass production and on-site analysis. | Used as the base transducer for Pt/PPD/GOx and uric acid biosensors [40] [41]. |
| o-Phenylenediamine (oPD) | Monomer for electrophysmerization; forms a non-conducting poly(o-phenylenediamine) (PPD) film that entraps enzymes and rejects interferents. | Used to create the enzyme-entrapping membrane on a Pt electrode [40] [14]. |
| Carbon Nanotubes (CNTs) | Nanomaterial for electrode modification; enhances surface area, facilitates electron transfer, and provides a scaffold for enzyme immobilization. | Self-assembled with Acetylcholinesterase (AChE) for ultrasensitive detection of paraoxon [42]. |
| PAMAM-Calix-Dendrimers | Hyperbranched polymers; used in electrode coatings to increase effective surface area and enhance redox currents. | Implementation in a phenothiazine polymer coating boosted the signal for H₂O₂ detection by over 1.5 times [41]. |
| Pillar[5]arene | Synthetic macrocyclic host molecule; can be incorporated into sensor coatings for "guest-host" recognition and to impart mediator properties. | Used in a composite electrode coating for uric acid detection to improve performance [41]. |
Workflow and Signaling Pathway Diagrams
Experimental Optimization Workflow
Biosensor Signaling Pathway
Frequently Asked Questions (FAQs)
Q1: What is the primary advantage of using Response Surface Methodology (RSM) over a "one-factor-at-a-time" (OFAT) approach for optimizing biosensor response time?
RSM is a powerful chemometric tool that allows for the systematic optimization of multiple parameters simultaneously. Unlike OFAT, which varies one factor while holding others constant, RSM is designed to evaluate the interaction effects between factors (e.g., enzyme concentration, pH, temperature) on the response (e.g., response time, sensitivity) [40] [31]. This is critical because factors in a biosensor system often do not act independently; the optimal level of one factor may depend on the level of another. RSM not only identifies these interactions but also builds a quantitative mathematical model (typically a second-order polynomial) that predicts the response across the experimental domain, thereby reducing the total number of experiments required to find the global optimum [44] [31].
Q2: My RSM model has a high R-squared (R²) value, but its predictions are poor. What could be the cause of this, and how can I fix it?
A high R² alone does not guarantee a good model. This discrepancy often arises from overfitting, where the model fits the noise in your specific dataset rather than the underlying relationship. Key steps to diagnose and fix this include [45] [46]:
- Check Adjusted R² and Predicted R²: The adjusted R² penalizes the model for adding unnecessary terms. The predicted R² (R²pred), calculated from PRESS (Predicted Residual Error Sum of Squares), indicates how well the model predicts new data. A large difference between R² and predicted R² (e.g., greater than 0.2) is a sign of overfitting [46].
- Perform Backward Elimination: Use statistical tests (like t-tests on coefficient p-values) to remove non-significant terms from the full model (the complete quadratic equation). Retaining only statistically significant linear, interaction, and quadratic terms creates a more robust and reliable model [45] [46].
- Validate the Model: Always perform confirmation experiments using the optimal conditions predicted by your model. A significant deviation between the predicted and experimental values suggests the model is not adequate [40].
Q3: How do I choose the right experimental design (e.g., Central Composite Design vs. Box-Behnken Design) for my biosensor study?
The choice depends on your experimental goals and constraints [45] [44] [31].
- Central Composite Design (CCD): This is the most popular design for fitting a full second-order model. It consists of factorial points, axial points (outside the factorial range), and center points. CCD is ideal when you need to predict behavior at the extremes of your experimental domain or when you suspect the optimum may lie near a boundary. It requires a higher number of experimental runs [40] [31].
- Box-Behnken Design (BBD): This design is also used for second-order models but does not include "corner" points (factorial points at the extremes). Instead, it combines two factors at their midpoints with the third at its extremes. BBD is more efficient (requires fewer runs than a CCD for the same number of factors) and is advantageous when testing at the extreme corners of the experimental space is expensive, difficult, or impossible [44].
Q4: What are the critical steps to ensure my regression analysis for the RSM model is statistically sound?
A comprehensive regression analysis should include [45] [46]:
- Significance Testing of Model Terms: Use backward elimination or p-values to remove non-significant variables.
- Model Adequacy Checking: Analyze the residuals (the difference between observed and predicted values). They should be normally distributed and exhibit constant variance.
- Check for Lack-of-Fit: A significant lack-of-fit test indicates the model is not sufficiently explaining the variation in the data and a more complex model may be needed.
- Use Modern Regression Diagnostics: Check for influential data points that disproportionately affect the model's coefficients and test for multicollinearity using the Variance Inflation Factor (VIF).
Troubleshooting Guides
Table 1: Common RSM Modeling Issues and Solutions
| Problem | Potential Cause | Diagnostic Steps | Solution |
|---|---|---|---|
| Poor Model Fit | Incorrect model (e.g., using linear model for a curved surface), significant factors not included. | Check residual plots for patterns. Perform a lack-of-fit test. | Switch to a quadratic model. Re-evaluate and include potentially relevant factors. |
| High Prediction Error | Overfitting, influential outliers, incorrect factor levels. | Compare R², adjusted R², and predicted R². Check Cook's distance for outliers. | Simplify the model by removing non-significant terms. Re-examine experimental data for errors. |
| Failure to Find an Optimum | Experimental range is too narrow, true optimum is outside the studied domain. | Observe if the model indicates a saddle point or a rising ridge. | Expand the upper and lower limits of key factors in a subsequent DOE iteration. |
| Non-Normal Residuals | Underlying data distribution is not normal, presence of outliers. | Create a normal probability plot of the residuals. | Apply data transformation (e.g., log, square root) to the response variable. |
Guide: Addressing Non-Constant Variance (Heteroscedasticity) in Residuals
Symptoms: When you plot the residuals vs. predicted values, the spread of the residuals increases or decreases with the magnitude of the prediction, forming a funnel shape. Impact: The standard errors of the model coefficients are unreliable, leading to invalid conclusions about the significance of factors. Solutions:
- Transform the Response Variable: Apply a power transformation (e.g., log, square root, inverse) to stabilize the variance across the range of predictions [46].
- Use Weighted Regression: Assign a higher weight to observations that have a smaller variance. This requires prior knowledge or an estimate of the variance structure.
Experimental Protocols
Protocol: Optimizing an Electrochemical Biosensor using RSM
This protocol outlines the key steps for applying RSM to optimize the performance of an electrochemical biosensor, based on a published study [40].
1. Define Objective and Identify Responses:
- Objective: Minimize the response time of a glucose oxidase-based amperometric biosensor.
- Primary Response (Y1): Response Time (seconds) - time to reach 95% of steady-state current.
- Secondary Response (Y2): Sensitivity (µA·mM⁻¹) - slope of the calibration curve.
2. Select Critical Factors and Ranges: Based on preliminary experiments and literature, select factors and their levels.
- Factor A (X1): Enzyme (GOx) Concentration (50 - 800 U·mL⁻¹)
- Factor B (X2): Number of Electropolymerization Cycles (10 - 30 cycles)
- Factor C (X3): Flow Rate in Flow-Cell (0.3 - 1.0 mL·min⁻¹)
3. Select and Execute Experimental Design:
- Design: A Central Composite Design (CCD) is suitable for building a quadratic model with three factors. This design typically requires 20 experimental runs, including factorial points, axial points, and center points (for error estimation) [40].
- Execution: Randomize the run order to minimize the effects of uncontrolled variables. Prepare the biosensor and perform amperometric measurements according to the 20 combinations specified by the CCD matrix.
4. Build and Validate the Regression Model:
- Data Collection: Record the response time and sensitivity for each experimental run.
- Regression Analysis: Input the data into statistical software (e.g., Minitab, Design-Expert). Fit a second-order polynomial model:
Y = β₀ + β₁X₁ + β₂X₂ + β₃X₃ + β₁₁X₁² + β₂₂X₂² + β₃₃X₃² + β₁₂X₁X₂ + β₁₃X₁X₃ + β₂₃X₂X₃ - Model Validation: Use statistical criteria (p-value, lack-of-fit test) to eliminate non-significant terms. Check residual plots and confirm the model with additional experiments at the predicted optimum.
5. Locate the Optimum and Confirm:
- Use the software's optimization function to find the factor levels (A, B, C) that provide the desired minimum response time and maximum sensitivity.
- Fabricate the biosensor using these optimized conditions and perform at least three independent measurements to validate the predicted performance.
Workflow Diagram: RSM Optimization for Biosensors
The Scientist's Toolkit: Research Reagent Solutions
Table 2: Essential Materials for Biosensor Development and Optimization
| Item | Function in Biosensor Development | Example in Context |
|---|---|---|
| Glucose Oxidase (GOx) | A common biorecognition element that catalyzes the oxidation of glucose, producing a measurable signal. Used as a model enzyme in many optimization studies. | The primary enzyme in an amperometric biosensor for glucose; its concentration is a key factor optimized via RSM [40]. |
| o-Phenylenediamine (oPD) | An electrophymerizable monomer. Used to form a polymer film (PPD) on the electrode surface that entraps enzymes and can offer selectivity. | Used to create a Pt/PPD/GOx biosensor; the number of electropolymerization cycles is a critical design parameter [40]. |
| Redox Mediators (e.g., Ferricyanide) | Molecules that shuttle electrons between the enzyme's active site and the electrode surface, enhancing signal and often reducing the operating potential. | Included in a hydrogel cartridge with Lactate Oxidase to facilitate electron transfer in a theoretical lactate biosensor model [47]. |
| Lactate Oxidase (LOx) | The biorecognition element for lactate detection, catalyzing the oxidation of lactate to pyruvate. Critical for biosensors targeting a key metabolic biomarker. | Immobilized in a PEGDA hydrogel in a modular, model-guided biosensor design for point-of-care lactate testing [47]. |
| Noble Metal Catalysts (e.g., Pd-Pt/C) | Electrocatalysts that enhance the electro-oxidation of fuels (like glycerol) in catalytic biosensors or fuel cell-based sensors, improving sensitivity. | Used as an anode electrocatalyst (Pd-Pt/CAB) in a glycerol microfluidic fuel cell, with loading optimized via RSM for max power density [44]. |
Interpreting 3D Response Surface Plots to Locate Optimal Conditions
FAQ: Fundamentals of 3D Response Surface Plots
What is a 3D Response Surface Plot and what does it represent? A 3D surface plot is a three-dimensional graph used to visualize the relationship between a response variable and two predictor variables [48]. In the context of optimizing biosensor response time, the x and y-axes typically represent two critical process factors you are investigating (such as temperature and pH), while the z-axis represents the measured response you wish to optimize (such as biosensor response time or sensitivity) [4]. The plot displays a continuous surface where peaks correspond to local maxima (e.g., highest sensitivity) and valleys correspond to local minima (e.g., shortest response time) for your biosensor [48].
How do I identify the optimal conditions from the plot? To locate the optimum, visually inspect the plot for the highest point (if maximizing response) or the lowest point (if minimizing response) [49]. For a biosensor, if you are maximizing sensitivity, you would look for the highest peak on the surface. If you are minimizing response time, you would seek the lowest valley [49]. The coordinates of this peak or valley on the x and y-axes give you the optimal levels for the two factors. Rotating the plot and adjusting light settings can significantly help in better visualizing the exact location of these peaks and valleys [48].
What does the shape of the surface tell me about my process? The steepness and curvature of the surface provide critical information about the robustness of your biosensor's performance. A steep, sharply peaked surface indicates that the response is very sensitive to small changes in the factors—your process is not robust, and optimal performance requires precise control of conditions [49]. A flatter, broader peak is ideal; it suggests that you can achieve near-optimal biosensor response even if the factor levels vary slightly, which is desirable for robust operation and manufacturing [49].
Troubleshooting Guide: Common Interpretation Issues
The plot shows a saddle point instead of a clear peak or valley. What does this mean? A saddle point, or a "mini-max," occurs when the surface curves upward in one direction and downward in the other [49]. This indicates that the optimal level for one factor depends on the level of the other factor—there is a significant interaction effect. In this case, a single "best" combination might not exist; instead, you must choose a compromise that satisfies your multiple goals for the biosensor. You will need to use multi-response optimization techniques to find the best balance [49].
The optimal point appears to be outside the boundaries of my graph. What should I do? If the surface suggests the response continues to improve beyond the experimental region you tested, it means the true optimum likely lies outside your current design space [49]. It is critical to avoid extrapolating from your model, as predictions outside the tested domain are unreliable [49]. The solution is to conduct a new round of experiments (a "steepest ascent" procedure) to explore the factor space in the direction the response is improving, and then create a new response surface model in that new, promising region [50].
How can I be sure that the model behind the plot is reliable? An attractive plot is useless if the model is a poor fit. To validate your model, check the following:
- R-squared (R²) Value: This indicates how much of the variability in the response is explained by the model. A value closer to 1 is better.
- Lack-of-Fit Test: A non-significant p-value for the lack-of-fit test is desirable, indicating the model fits the data well and there is no unexplained structure left in the residuals [49].
- Residual Analysis: Examine plots of the residuals (differences between observed and predicted values). They should show no obvious patterns [49]. If the model is inadequate, you may need to transform your response data or collect more experimental data points.
Experimental Protocol: Generating a 3D Response Surface Plot for Biosensor Optimization
This protocol outlines the key steps for using Response Surface Methodology (RSM) to optimize biosensor response time, culminating in the creation of a 3D surface plot.
1. Define the Problem and Screen Factors
- Objective: Clearly state the goal (e.g., "Minimize the response time of a glucose biosensor").
- Response Variable: Quantify the property to optimize (e.g.,
Response Time (seconds)). - Factor Screening: Use a screening design (e.g., Plackett-Burman) to identify the two or three most influential factors from a larger pool of potential variables (e.g., pH, temperature, enzyme concentration, membrane thickness) [51].
2. Select an Experimental Design Choose an RSM design that efficiently explores the factor space around the suspected optimum. For two factors, a Central Composite Design (CCD) or Box-Behnken Design (BBD) is standard [4] [52].
- Central Composite Design (CCD): Composed of factorial points, center points, and axial points, allowing for the estimation of curvature [53].
- Box-Behnken Design (BBD): An alternative that is often more efficient than CCD, as it avoids extreme factor combinations and uses fewer runs for three factors [4].
3. Execute Experiments and Collect Data
- Randomize the run order of the experiments specified by your design matrix to minimize the effects of confounding variables.
- Prepare your biosensor prototypes and test them according to the factor levels defined for each run.
- Precisely measure and record the response time for each experimental run.
4. Perform Regression Analysis and Generate the 3D Plot
- Using statistical software (e.g., Minitab, Design-Expert), fit a second-order polynomial model to your experimental data [49]. The model for two factors (X₁, X₂) has the form:
Response = b₀ + b₁X₁ + b₂X₂ + b₁₂X₁X₂ + b₁₁X₁² + b₂₂X₂² - The software will use this fitted model to generate the 3D surface plot, predicting the response for all combinations of the two factors within your experimental range [49].
5. Interpret the Plot and Confirm Optimum
- Visually locate the coordinates of the peak or valley on the plot corresponding to the optimal factor levels [48].
- Conduct one or more confirmation experiments at these predicted optimal conditions to verify that the observed response matches the model's prediction.
The workflow below summarizes the key steps in this process.
Research Reagent Solutions for Biosensor Optimization
The following table details key materials and reagents commonly used in the experimental optimization of biosensors, based on analogous RSM studies.
| Item | Function in Experiment | Example from Research Context |
|---|---|---|
| Mouse IgG | Target analyte used to validate the sensing performance and calculate the limit of detection (LOD) of an optimized immunosensor [54]. | Used to validate an optimized SPR biosensor, achieving a LOD of 54 ag/mL [54]. |
| Aflatoxin B1 (AFB1) | Model carcinogenic toxin used as an analyte to develop and optimize rapid detection immunoassays in food safety [51]. | Detection optimized in yellow rice wine using Time-Resolved Fluorescence Immunoassay (TRFIA) [51]. |
| Gadolinium Oxide (Gd₂O₃) | Precursor material for synthesizing nanoparticles that can be functionalized for use in biosensor platforms [52]. | Optimized as a starting material for synthesizing sub-20 nm nanoparticles via the hydrothermal method [52]. |
| Polyethylene Glycol (PEG) | A stabilizer or passivating agent used in nanomaterial synthesis to control particle size, prevent aggregation, and improve biocompatibility [52]. | PEG-6000 was used to form uniformly sized gadolinium nanoparticles [52]. |
| Methanol-Water Solution | Extraction solvent used to prepare analyte samples from complex matrices for quantitative analysis [51]. | The volume fraction was a key factor optimized for extracting AFB1 from yellow rice wine [51]. |
Workflow for Multi-Response Optimization
When optimizing a biosensor, you often need to balance multiple responses simultaneously (e.g., minimizing response time while maximizing sensitivity and stability). The diagram below illustrates the logical workflow for tackling this challenge using the overlay of contour plots, a standard multi-response optimization method [49].
Troubleshooting the RSM Workflow: Overcoming Common Optimization Challenges
FAQs on Model Fit, Residuals, and ANOVA
Q1: What does an "inadequate model fit" mean in the context of optimizing a biosensor with RSM? An inadequate model fit indicates that the statistical model derived from your Response Surface Methodology (RSM) experiments does not sufficiently explain the relationship between your input factors (e.g., design parameters) and the biosensor's response (e.g., response time or output voltage). This means the model's predictions may be unreliable for optimization. In RSM, this is often revealed through a combination of analyzing the lack-of-fit test in ANOVA and visualizing the pattern of residuals (the differences between observed and predicted values) [55] [56].
Q2: My ANOVA shows a significant lack-of-fit. What should I do next? A significant lack-of-fit (where the p-value is less than your significance level, typically 0.05) suggests your model is missing important terms or there is unaccounted variation in the data. Follow this troubleshooting guide [55] [56]:
- Analyze Residual Plots: This is the most critical diagnostic step. Generate and inspect the following plots of the residuals:
- Residuals vs. Fitted Values: Look for a random scatter of points. A non-random pattern (e.g., a curve, funnel shape) suggests the model is missing a higher-order term (like a quadratic) or there is non-constant variance.
- Normal Q-Q Plot: Check if the residuals follow a straight line. Significant deviations indicate non-normality in the error distribution, which can invalidate ANOVA results.
- Residuals vs. Run Order: If points show a trend over time, it may indicate an uncontrolled external factor or drift in the biosensor's performance.
- Consider Model Transformation: If residual plots show non-constant variance, applying a transformation (e.g., log, square root) to your response data may help.
- Expand the Model: A significant lack-of-fit often means you need to add higher-order polynomial terms (e.g., quadratic terms) to your RSM model to capture curvature in the response surface.
- Investigate Outliers: Check if the model's inaccuracy is concentrated in a few experimental runs. These potential outliers should be investigated for experimental error.
- Re-evaluate Factors: Ensure all relevant factors that affect biosensor response time are included in your experimental design.
Q3: The residuals for my biosensor response time model show a clear curved pattern. What does this mean? A curved pattern in the residuals vs. fitted values plot is a strong indicator that your linear model is insufficient. The relationship between your factors and the biosensor's response time likely involves curvature. To address this, you should refine your RSM model by incorporating quadratic terms (e.g., X₁²). This transforms the model from a first-order to a second-order model, which is standard for capturing the optimal point in a response surface [55].
Q4: How is ANOVA used to validate an RSM model for a biosensor? Analysis of Variance (ANOVA) is used to statistically validate the significance and adequacy of the RSM model. It breaks down the total variability in your data into components [56]:
- Model Significance: The ANOVA F-test checks if the overall model is significant relative to the noise. A low p-value (e.g., < 0.05) indicates the model explains a meaningful amount of variation in the response.
- Lack-of-Fit Test: This test compares the residual error from your model to the pure error obtained from replicated experimental runs. A non-significant lack-of-fit (p-value > 0.05) is desired, as it means the model fits the data well.
- Factor Significance: The p-values for individual model terms (linear, interaction, quadratic) help you identify which factors have a significant impact on the biosensor's response time.
Experimental Protocol: Diagnosing Model Inadequacy
This protocol provides a step-by-step methodology for diagnosing the root cause of an inadequate model fit after conducting an RSM experiment.
1. Objective To systematically diagnose the cause of an inadequate model fit in RSM analysis by performing residual analysis and interpreting ANOVA results.
2. Materials and Equipment
- Statistical software (e.g., R, Python with
statsmodels, Minitab, Design-Expert) - Your experimental dataset from the RSM design (e.g., Box-Behnken, Central Composite Design)
3. Procedure
- Step 1: Generate the Initial Model. Fit your experimental data to a first-order or second-order polynomial model using regression analysis in your statistical software.
- Step 2: Perform ANOVA. Run the ANOVA procedure on the fitted model. Record the F-statistic and p-value for the overall model and the lack-of-fit test.
- Step 3: Calculate and Plot Residuals. For each experimental run, calculate the residual (Residual = Observed Value - Predicted Value). Create the following diagnostic plots [56]:
- Residuals vs. Fitted Values Plot
- Normal Q-Q Plot of the Residuals
- Residuals vs. Run Order Plot
- Step 4: Interpret Results. Use the table below to interpret the combined evidence from the ANOVA and residual plots.
| Observation | Indication | Recommended Action |
|---|---|---|
| Significant lack-of-fit (p < 0.05) & curved pattern in residuals | Model is missing terms; system has curvature | Add quadratic terms (e.g., X₁²) to create a second-order model [55]. |
| Significant lack-of-fit & funnel shape in residuals | Non-constant variance (heteroscedasticity) | Apply a transformation (e.g., log) to the response variable or use weighted regression. |
| Non-significant model (p > 0.05) & random scatter in residuals | The selected factors have no significant effect | Re-evaluate the choice of factors and their ranges; consider screening experiments. |
| Significant model, non-significant lack-of-fit, & random/normal residuals | Model is adequate | Proceed with optimization using the model. |
The Scientist's Toolkit: Research Reagent Solutions
| Item | Function in Biosensor RSM Optimization |
|---|---|
| Piezoelectric Cantilever Biosensor | The core transducer; its resonant frequency change is the measured response to target analyte binding [25]. |
| PZT-5H Piezoelectric Ceramic | A common core sensitive component in ultrasonic sensors; converts electrical energy to mechanical vibrations and vice versa, crucial for signal generation [55]. |
| Functionalization Reagents | Chemicals (e.g., DNA probes) used to modify the biosensor surface for specific recognition of the target analyte [25]. |
| Target Analyte (e.g., microRNA) | The molecule of interest being detected; its concentration is the primary variable correlated with the biosensor's signal output [25]. |
| Statistical Software | Used for designing the RSM experiment, performing regression analysis, conducting ANOVA, and generating residual plots for diagnosis. |
Workflow for Diagnosing Model Fit
The following diagram illustrates the logical decision process for addressing inadequate model fit.
Frequently Asked Questions (FAQs) on Experimental Domain Refinement
FAQ 1: Why is a one-factor-at-a-time (OFAT) approach insufficient for optimizing complex biosensors?
The one-factor-at-a-time (OFAT) method is inadequate because it overlooks critical interaction effects between variables (e.g., between pH and temperature) and fails to capture the curvature of the true response surface, potentially leading to false optimal conditions [11]. Modern biosensor optimization requires a systemic approach. For instance, in electrochemical biosensors, parameters like enzyme concentration, immobilization time, and flow rate can interact in non-linear ways; changing one without considering the others provides an incomplete picture and can hinder the achievement of true optimal performance [14] [12].
FAQ 2: What is the core philosophical difference between a traditional univariate approach and an iterative Design of Experiments (DoE) workflow?
The traditional approach is sequential and localized, where each experiment is defined by the outcome of the previous one. In contrast, an iterative DoE workflow is based on global, a priori knowledge [11]. A predetermined set of experiments is conducted across the entire experimental domain. The results are used to build a data-driven model that predicts the response for any point within the domain, providing a comprehensive understanding of the system and guiding subsequent, more refined experimental rounds [11].
FAQ 3: How much of my research resources should I commit to the first iteration of an experimental design?
It is advisable not to allocate more than 40% of available resources to the initial set of experiments [11]. The data from this first design is typically used to refine the problem—for example, by eliminating insignificant variables, redefining the experimental domain, or adjusting the hypothesized model—before executing a new, more informed DoE [11].
FAQ 4: My initial model does not fit the data well. What should be my next step?
Poor model fit indicates that the provisional model (e.g., a first-order linear model) is insufficient to capture the system's complexity, often due to significant curvature. The solution is to devise a new design to better approximate the system [11]. This often involves moving from a simple factorial design to a more complex Central Composite Design (CCD), which adds axial points to a factorial base, allowing for the estimation of quadratic terms and a more accurate representation of the response surface [11] [14].
FAQ 5: How can I use DoE to improve the dynamic response time of a metabolic engineering biosensor?
Beyond traditional steady-state metrics, optimizing for dynamic performance requires characterizing parameters like rise time within the DoE framework [24]. Engineering approaches involve tuning genetic components such as promoters, ribosome binding sites, and the operator region position [24]. A well-designed experiment can model the relationship between these tunable genetic parts and the resulting biosensor response time, enabling the systematic identification of constructs that achieve faster, more robust dynamic performance [24].
Troubleshooting Common Experimental Scenarios
Scenario 1: Low Signal-to-Noise Ratio in Ultrasensitive Detection
- Problem: The biosensor's output is unstable, making it difficult to distinguish the true signal from background noise, which is a critical issue for ultrasensitive detection targeting sub-femtomolar limits [11].
- Investigation & Solution:
- Check Bioreceptor Immobilization: Ensure a stable and oriented immobilization of bioreceptors (antibodies, DNA probes) on the transducer surface. A dense, well-organized layer minimizes non-specific binding and reduces noise [57].
- Characterize Surface Chemistry: Use surface characterization techniques to verify the homogeneity and stability of your functionalization layer. High signal noise can originate from a desorbing or denaturing bioreceptor layer [24] [57].
- Refine Detection Conditions: Systematically optimize physical parameters like flow rate, temperature, and incubation times using a screening design like Plackett-Burman. These factors can significantly impact binding kinetics and noise levels [12].
Scenario 2: Poor Reproducibility Between Sensor Batches
- Problem: Biosensors fabricated in different batches show unacceptably high variability in performance.
- Investigation & Solution:
- Control Functionalization Parameters: Inconsistent surface functionalization is a common culprit. Use a Mixture Design if your functionalization involves multiple components (e.g., polymers, cross-linkers) whose proportions must sum to 100% [11]. This design optimizes the formulation for maximum stability and reproducibility.
- Standardize Immobilization Protocol: Factors like probe concentration and immobilization time must be tightly controlled. Use a Response Surface Methodology (RSM) to find a robust operational window where the biosensor performance is consistently high, even with minor, unavoidable variations in these parameters [12].
- Verify Nanomaterial Consistency: If using nanomaterials like MWCNTs or gold nanoparticles, ensure their synthesis or sourcing is consistent, as variations in size, shape, and functionalization can lead to batch-to-batch differences [12].
Scenario 3: Model Failure and Inaccurate Predictions
- Problem: The mathematical model generated from your DoE has high residuals and makes poor predictions.
- Investigation & Solution:
- Check for Curvature: Your first-order model may be failing because the system exhibits significant curvature. Augment your initial factorial design with axial points to create a Central Composite Design (CCD), enabling you to fit a more accurate second-order polynomial model [11] [14].
- Re-evaluate Factor Ranges: The chosen range for your independent variables might be too narrow or might miss the optimal region entirely. Use the results from the initial DoE to redefine the experimental domain for a subsequent iteration [11].
- Consider Algorithm-Assisted Optimization: For highly complex systems (e.g., optimizing an SPR sensor's incident angle and multiple layer thicknesses simultaneously), consider multi-objective optimization algorithms like Particle Swarm Optimization (PSO). These algorithms can efficiently navigate complex search spaces to find optimal parameter combinations that improve multiple performance metrics (sensitivity, figure of merit) at once [54].
Essential Experimental Protocols
Protocol 1: Initial Factor Screening Using a Plackett-Burman (PB) Design
Purpose: To efficiently identify the most influential factors from a large set of potential variables before committing to a more resource-intensive optimization [12].
Methodology:
- Define Factors and Range: List all potential factors (e.g., pH, ionic strength, probe concentration, incubation time, temperature). Set a wide, reasonable low and high level for each.
- Generate Design Matrix: Use statistical software (e.g., Minitab, R, Python) to generate a PB design matrix. This creates an efficient set of experimental runs.
- Execute Experiments: Perform the experiments in a randomized order to avoid bias.
- Analyze Data: Subject the results to ANOVA. Factors with p-values below a chosen significance threshold (e.g., p < 0.05) are considered significant and should be included in subsequent optimization rounds.
Protocol 2: System Optimization Using Response Surface Methodology (RSM)
Purpose: To model the relationship between key factors and responses, locate the optimum settings, and understand the interaction effects [14] [12].
Methodology:
- Select Design: Based on the number of significant factors (k) from screening, choose a Central Composite Design (CCD). A CCD includes factorial points, axial points, and center points [14] [12].
- Run Experiments: Execute all experiments specified by the CCD in a randomized order. Replication of the center point is crucial for estimating pure error.
- Model Fitting: Fit the experimental data to a second-order polynomial model using multiple regression. The general form is:
y = β₀ + Σβᵢxᵢ + Σβᵢᵢxᵢ² + ΣΣβᵢⱼxᵢxⱼ + εwhere y is the response, β are regression coefficients, x are variables, and ε is error [14]. - Model Validation & Optimization: Check the model's adequacy (R², adjusted R², lack-of-fit test). Use contour plots and 3D response surfaces to visualize the relationship between factors and identify optimal conditions [12].
Key Research Reagent Solutions
Table 1: Essential materials and their functions in biosensor development and optimization.
| Research Reagent | Primary Function | Example Application in Biosensors |
|---|---|---|
| Multi-Walled Carbon Nanotubes (MWCNTs) [12] | Enhance electrical conductivity and provide a high surface-to-volume ratio for biomolecule immobilization. | Used in electrochemical DNA biosensors to improve signal strength and serve as a scaffold for probe attachment [12]. |
| Polypyrrole (PPy) [12] | An organic polymer that provides biocompatibility, conductivity, and a stable matrix for entrapping biomolecules. | Electropolymerized with enzymes or DNA probes to form a robust, conductive composite film on electrodes [12]. |
| Hydroxyapatite Nanoparticles (HAPNPs) [12] | A biomaterial with excellent biocompatibility and multiple adsorption sites for stable biomolecule immobilization. | Used as a substrate to covalently attach DNA probes, enhancing loading capacity and stability on the electrode surface [12]. |
| Graphene & Related 2D Materials [57] [54] | Offer exceptional electrical conductivity, large specific surface area, and tunable optical properties for signal amplification. | Integrated into optical (SPR) and electrochemical transducers to enhance sensitivity and facilitate bioreceptor anchoring [57] [54]. |
| Gold Nanoparticles (AuNPs) & Nanostars [58] | Act as excellent transducers for optical signals and facilitate electron transfer in electrochemical sensing. | Form the core of SERS platforms (nanostars) or are used to modify electrodes, significantly amplifying the detected signal [58]. |
Workflow Visualization for Iterative Refinement
The following diagram illustrates the core iterative cycle for refining the experimental domain, integrating key concepts from the troubleshooting guides and protocols.
Diagram 1: The iterative workflow for experimental domain refinement, showing the transition from screening to detailed optimization.
The next diagram contrasts the fundamental philosophical differences between the traditional OFAT approach and the systematic DoE approach, highlighting why the latter is more effective.
Diagram 2: A comparison of the OFAT and DoE methodologies, emphasizing the systemic advantages of the DoE approach.
Case Study: Optimizing an Electrochemical DNA Biosensor
This case study demonstrates the practical application of iterative experimental design as detailed in the protocols [12].
- Objective: Optimize the fabrication and operation of an electrochemical DNA biosensor for detecting Mycobacterium tuberculosis.
- Screening Phase: A Plackett-Burman design was first employed to screen eleven potential factors. This identified probe concentration, immobilization time, and scan rate as the most statistically significant parameters [12].
- Optimization Phase: A Central Composite Design (CCD) under the RSM framework was then used to model the interactions between these three key factors and the biosensor's sensitivity. This created a data-driven model that accurately predicted performance across the experimental domain [12].
- Outcome: The iterative approach successfully optimized the biosensor, which achieved a wide detection range and a low detection limit of 0.141 nM, demonstrating the power of this methodology for developing robust analytical devices [12].
Response Surface Methodology (RSM) is a powerful collection of statistical techniques for designing experiments, building models, evaluating the effects of multiple factors, and searching for optimal conditions for desirable responses. For biosensor development, where parameters like response time, sensitivity, and stability often conflict, RSM provides a systematic approach to balance these competing demands. Unlike traditional "one-variable-at-a-time" approaches, RSM investigates interaction effects between multiple variables simultaneously, enabling researchers to identify optimal compromises and significantly reduce development time and experimental costs [12] [11].
In the context of biosensor optimization, RSM has been successfully applied to enhance various sensing platforms. For instance, it has been used to optimize electrochemical DNA biosensors for detecting Mycobacterium tuberculosis, where multiple fabrication and operational parameters needed precise balancing [12]. Similarly, RSM has optimized hydrogel matrices for tyrosinase-based biosensors, systematically improving both sensitivity and response time [59]. The methodology is particularly valuable when working toward single-molecule detection, where extreme sensitivity must be maintained without sacrificing practical response characteristics [54].
Frequently Asked Questions: RSM for Biosensor Optimization
How does RSM specifically help balance conflicting biosensor performance parameters? RSM employs designed experiments to build mathematical models that describe how multiple input variables (e.g., enzyme concentration, immobilization time, flow rate) simultaneously affect various responses (e.g., sensitivity, response time, stability). These models can then be used to find optimal parameter combinations that balance trade-offs. For example, a central composite design might reveal that a moderate enzyme loading provides the best compromise between high sensitivity and acceptable response time, avoiding the limitations of both very high and very low loadings [14] [59].
What is the difference between RSM and simpler optimization approaches? Traditional one-variable-at-a-time approaches change a single factor while holding others constant, which can miss important interaction effects between variables. RSM, through factorial designs, systematically varies all factors simultaneously according to a predetermined plan. This enables researchers to not only understand the individual effect of each factor but also how factors interact—for instance, how the optimal enzyme concentration might change depending on the immobilization time used [11].
My biosensor response is unstable. Which factors should I investigate first using RSM? Instability often stems from suboptimal immobilization conditions. Key factors to initially investigate include bioreceptor concentration, immobilization time, cross-linker concentration (if used), and the composition of the immobilization matrix. For example, research on tyrosinase-based biosensors used RSM to optimize the chitosan-mucin hydrogel composition to maximize stability while maintaining sensitivity [59]. The matrix composition significantly impacted enzyme leaching and operational stability.
How many experimental runs are typically needed for a proper RSM study? The number of experiments depends on the number of factors being investigated. A three-factor central composite design (a common RSM design) typically requires 18-22 experimental runs, including center point replicates for error estimation. While this might seem more extensive than a minimal approach, the efficiency comes from obtaining a comprehensive model that predicts performance across the entire experimental domain, ultimately reducing the total number of experiments needed to find true optimal conditions [14] [12].
Can RSM be integrated with machine learning for biosensor optimization? Yes, the integration of RSM with machine learning (ML) represents a cutting-edge approach. RSM can provide the structured, high-quality experimental data needed to train ML models. These models can then predict biosensor performance with high accuracy and identify influential design parameters through explainable AI (XAI) techniques. This hybrid approach significantly accelerates sensor optimization and reduces computational costs compared to conventional methods alone [60].
Troubleshooting Common Experimental Challenges
Poor Model Fit or Lack of Fit
Problem: The mathematical model generated from RSM shows significant "lack of fit," meaning it poorly predicts experimental results.
Solution:
- Verify you are operating within the appropriate range for each factor. If you are too close to saturation effects or other nonlinearities, consider narrowing the experimental domain.
- Check for outliers in your experimental data that might be skewing the model.
- Consider adding quadratic terms to your model (using a Central Composite Design instead of a simple factorial design) to account for curvature in the response surface [11].
High Variability in Center Points
Problem: Replicate runs at the center point conditions show high variability, indicating poor experimental control or measurement error.
Solution:
- Standardize all preparation and measurement protocols meticulously.
- Ensure all reagents are fresh and properly stored.
- Verify the precision of your instrumentation.
- Investigate potential environmental factors like temperature or humidity fluctuations that might affect results.
- Increase the number of center point replicates to better estimate pure error [11].
Inability to Find a Compromise Between Sensitivity and Response Time
Problem: The optimization appears stuck where improving sensitivity drastically increases response time, and vice versa.
Solution:
- Use the desirability function approach, which mathematically transforms multiple responses into a single composite metric. This allows you to find the factor settings that provide the most acceptable compromise across all your critical responses [59].
- Re-evaluate your constraints for each response. You may need to relax the requirement for one parameter to achieve acceptable performance in another.
- Consider if there are additional factors not yet included in your experimental design that could break the trade-off, such as different immobilization chemistries or nanomaterials.
Quantitative Optimization Data from Recent Research
Table 1: RSM-Optimized Conditions for Different Biosensor Types
| Biosensor Type | Key Optimized Factors | Performance Outcomes | Reference |
|---|---|---|---|
| Electrochemical DNA Biosensor (for M. tuberculosis) | Probe concentration: 1.5 µMImmobilization time: 2.5 hHybridization time: 45 min | Detection limit: 0.141 nMWide linear range: 0.25-200 nM | [12] |
| Tyrosinase-Based Phenol Biosensor | Hydrogel matrix: 50% Chitosan, 50% MucinCrosslinker: 5% GlutaraldehydeEnzyme loading: 13 U/sensor | Optimized sensitivity and response timeApplication in tea infusion analysis | [59] |
| Amperometric Biosensor (for metal ions) | Enzyme concentration: 50 U/mLFlow rate: 0.3 mL/minScan cycles: 30 | High reproducibility (RSD = 0.72%)Optimized sensitivity for Bi³⁺ and Al³⁺ | [14] |
| SPR Biosensor (for single-molecule detection) | Incident angle, Cr thickness, Au thickness | Sensitivity enhancement: 230.22%Detection limit: 54 ag/mL (0.36 aM) | [54] |
Table 2: Essential Research Reagent Solutions for RSM-Optimized Biosensors
| Reagent / Material | Function in Biosensor Development | Example Application |
|---|---|---|
| Chitosan & Mucin Hydrogel | Provides a biocompatible, tunable matrix for enzyme immobilization. | Creating a stable, optimized environment for tyrosinase in phenol biosensors [59]. |
| HAPNPs/PPY/MWCNTs Nanocomposite | Enhances electrode conductivity, surface area, and biomolecule immobilization capacity. | Signal amplification in electrochemical DNA biosensors for M. tuberculosis [12]. |
| Gold Nanoparticles (AuNPs) | Serve as versatile platforms for functionalization in optical and electrochemical biosensors. | Functionalization with peptides for SARS-CoV-2 antibody detection in SERS and EIS biosensors [26]. |
| 4-Mercaptobenzoic Acid (MBA) | Acts as a Raman reporter molecule in Surface-Enhanced Raman Spectroscopy (SERS) biosensors. | Enabling sensitive detection in peptide-based optical biosensors [26]. |
| Synthetic Peptides (e.g., P44) | Act as specific, adaptable biorecognition elements for targets like antibodies. | Variant-specific detection of SARS-CoV-2 antibodies in affinity-based biosensors [26]. |
Experimental Protocols for Key Optimization Procedures
Protocol 1: Optimizing an Electrochemical Genosensor Using RSM
This protocol outlines the key steps for applying RSM to optimize a DNA biosensor, based on the work for detecting Mycobacterium tuberculosis [12].
Factor Screening with Plackett-Burman (PB) Design:
- Identify a wide range of potential factors (e.g., probe concentration, immobilization time, hybridization time, temperature, pH).
- Use a PB design to screen these factors and identify which have a statistically significant effect on your response (e.g., sensitivity, LOD).
- This step reduces the number of factors for more detailed RSM analysis.
In-Depth Optimization with RSM:
- Select the most significant factors (typically 2-4) identified from the PB screening.
- Choose your response variables (e.g., current signal, LOD, response time).
- Employ a Central Composite Design (CCD) to define the set of experimental runs.
- Prepare your biosensors and conduct measurements according to the CCD matrix.
Data Analysis and Model Building:
- Input the experimental response data into statistical software.
- Perform multiple regression analysis to build a quadratic model that relates the factors to the responses.
- Analyze the ANOVA table to check the model's significance and lack-of-fit.
- Use contour and 3D surface plots to visualize the relationship between factors and responses.
Validation of Optimal Conditions:
- Use the model's optimization function to predict the factor settings that yield the optimal response.
- Prepare new biosensors using these predicted optimal conditions and test them experimentally.
- Compare the experimental results with the model's predictions to validate the model's adequacy.
Protocol 2: Optimizing a Hydrogel-Based Enzyme Biosensor
This protocol is adapted from the optimization of a tyrosinase-based biosensor for phenols, highlighting the use of the desirability function [59].
Formulate the Experimental Design:
- Define the independent variables, such as the ratio of hydrogel components (e.g., chitosan vs. mucin) and crosslinker concentration.
- Define the multiple responses to be optimized, such as sensitivity to the target analyte and response time.
Execute Experimental Runs:
- Prepare the hydrogel matrices with different compositions as specified by the RSM design (e.g., a mixture design).
- Immobilize the enzyme within these matrices and construct the biosensors.
- Measure the sensitivity and response time for each biosensor variant.
Apply the Desirability Function:
- Individually normalize each response to a "desirability" value between 0 (undesirable) and 1 (fully desirable).
- Combine the individual desirabilities into a single composite metric (overall desirability, D).
- The statistical model then identifies the factor settings that maximize D, thereby finding the best compromise between all conflicting responses.
Select Final Operational Parameters:
- Based on the model, choose the hydrogel composition that provides the best overall performance.
- Further refine parameters like enzyme loading to fine-tune the trade-off between sensitivity, linear range, and cost, selecting the value that offers the most practical compromise.
Workflow Visualization for RSM Optimization
The following diagram illustrates the systematic, iterative workflow for applying RSM to biosensor optimization, from initial planning to final validation.
Figure 1: RSM Optimization Workflow for Biosensors
Experimental Factor Interaction Diagram
This diagram visualizes how different categories of experimental factors influence the key performance responses of a biosensor, often in conflicting ways.
Figure 2: Factor and Response Interactions in Biosensors
Frequently Asked Questions (FAQs)
1. Why does my biosensor's performance degrade significantly when moving from buffer solutions to complex real samples like serum or blood?
This is a classic symptom of matrix effects, where components in complex samples non-specifically bind to the sensor surface, a phenomenon known as biofouling. This can block active sites, alter the refractive index, and increase background noise [61] [26]. To mitigate this:
- Use Blocking Agents: Incubate the sensor with inert proteins like bovine serum albumin (BSA) or casein to cover non-specific binding sites before introducing the sample [61].
- Apply Anti-fouling Coatings: Modify the sensor surface with hydrophilic polymers (e.g., polyethylene glycol) or hydrogels to create a physical and energetic barrier against non-specific adsorption [61] [26].
- Implement Sample Pre-processing: For highly complex samples, incorporate dilution, filtration, or centrifugation steps to remove interfering particulates or macromolecules [61].
2. My optimized biosensor shows high sensitivity in theory, but the signal is weak and noisy in practice. What could be the cause?
Weak signals often stem from suboptimal transducer configuration or inefficient signal capture. Key areas to investigate include:
- Resonance Dip Characteristics: In SPR biosensors, a shallow resonance dip (low depth) can drastically reduce the signal-to-noise ratio. Multi-objective optimization that simultaneously considers Sensitivity, Figure of Merit (FOM), and Depth of Resonant Dip (DFOM) is crucial for a practically usable signal [54].
- Immobilization Efficiency: The biological recognition elements (e.g., antibodies, peptides) may be denatured, incorrectly oriented, or sparsely packed on the sensor surface. Re-evaluate your immobilization chemistry (e.g., using EDC/NHS for covalent bonding) and ensure the biorecognition layer is stable and active [61] [26].
- Transducer Design: For optical sensors, ensure the light source and detector are properly aligned. For electrochemical sensors, check the electrode surface for passivation or contamination [61].
3. How can I make my biosensor's performance more resilient to minor, inevitable variations in manufacturing and experimental conditions?
Robustness can be engineered into the system through design and data analysis:
- Incorporate Robustness in Optimization: During the Response Surface Methodology (RSM) phase, use clustering algorithms like k-means to identify a region of the parameter space that is less sensitive to processing errors, rather than a single, fragile optimum point [54].
- Leverage Machine Learning (ML) and Explainable AI (XAI): Train ML models to predict sensor performance based on design parameters. Use XAI methods like SHAP analysis to identify which parameters (e.g., metal layer thickness, wavelength) are most critical to control tightly for reproducible results [60].
- Build in Redundancy and Controls: Include internal controls or reference channels in your sensor design to correct for drift and environmental fluctuations like temperature [61].
Troubleshooting Guides
Issue 1: Poor Reproducibility and High Inter-Assay Variability
| Diagnosis Step | Possible Cause | Recommended Solution |
|---|---|---|
| Check biorecognition element activity. | Denaturation or instability of immobilized enzymes/antibodies. | Use fresh aliquots; optimize immobilization pH and time; employ more stable bioreceptors like aptamers [61]. |
| Inspect sensor surface uniformity. | Inconsistent nanomaterial deposition or metal film thickness. | Standardize fabrication protocols (e.g., spin-coating speed, time); use characterization tools (e.g., SEM, AFM) for batch QC [54] [60]. |
| Review environmental control. | Uncompensated temperature or pH sensitivity. | Perform experiments in a temperature-controlled environment; use buffers with high capacity; integrate a temperature compensation mechanism [61]. |
| Analyze calibration data. | Sensor drift or degradation between assays. | Implement frequent recalibration; use a standard reference material in each run to normalize data [61]. |
Issue 2: Failure to Detect Low-Concentration Analytes (Poor Limit of Detection)
| Diagnosis Step | Possible Cause | Recommended Solution |
|---|---|---|
| Evaluate signal amplification. | Lack of signal enhancement strategy. | Integrate nanomaterials (e.g., gold nanoparticles, graphene) to enhance plasmonic or electrochemical signals [54] [62]. |
| Check for non-specific binding. | High background noise masking the weak target signal. | Apply more stringent blocking and washing protocols; implement anti-fouling surface coatings [61] [26]. |
| Assess transducer's intrinsic sensitivity. | Design parameters are not optimized for ultimate performance. | Use multi-objective optimization algorithms (e.g., Particle Swarm Optimization) to refine parameters like incident angle and layer thicknesses for max Sensitivity and FOM [54]. |
| Verify sample integrity and volume. | Analyte loss due to adsorption to labware; insufficient sample. | Use low-binding tubes; ensure the sensor fluidics are designed to efficiently deliver analyte to the active surface [61]. |
Experimental Protocols for Critical Procedures
This protocol details the creation of a robust biorecognition layer using a synthetic peptide, ideal for variant-specific detection.
Key Reagent Solutions:
- Gold Nanoparticles (AuNPs) or gold film: Serves as the plasmonic substrate and anchoring surface.
- 4-mercaptobenzoic acid (MBA): A bifunctional linker that forms a self-assembled monolayer (SAM) on gold via its thiol group.
- Synthetic Peptide (e.g., P44 sequence): The biorecognition element, designed to contain a functional group for coupling.
- EDC and NHS: Cross-linking agents for activating carboxyl groups to form amide bonds.
Methodology:
- Surface Cleaning: Clean the gold sensor chip with oxygen plasma or piranha solution, followed by rinsing with ethanol and ultrapure water. (Caution: Piranha solution is extremely dangerous).
- SAM Formation: Incubate the clean gold surface with a 1-10 mM solution of MBA in ethanol for 12-24 hours to form a stable, carboxyl-terminated monolayer.
- Linker Activation: Rinse the chip with ethanol and water. Then, activate the carboxyl groups on the SAM by treating with a fresh mixture of EDC and NHS (e.g., 0.4 M EDC / 0.1 M NHS) for 30-60 minutes.
- Peptide Immobilization: Rinse off the excess EDC/NHS. Incubate the activated surface with a solution of the synthetic peptide (typical concentration 0.1-1.0 mg/mL) in a suitable buffer (e.g., phosphate buffer, pH 7.4) for 2-4 hours.
- Quenching and Washing: Block any remaining activated esters by incubating with 1M ethanolamine hydrochloride (pH 8.5) for 30 minutes. Finally, wash the sensor chip thoroughly with buffer to remove non-covalently bound peptides.
This protocol outlines a computational method to move beyond single-parameter tuning for a more robust sensor design.
Methodology:
- Define Objectives and Parameters: Identify the key performance metrics to optimize (e.g., Sensitivity (S), Figure of Merit (FOM), and Depth of Resonant Dip (DFOM)). Select the design variables to adjust (e.g., incident angle, adhesive Cr layer thickness, Au layer thickness).
- Set up the Simulation Model: Model the SPR sensor as a multi-layer system and use a method like the transfer matrix method to compute the reflectivity spectrum and extract the performance metrics for any given set of design parameters.
- Run the Optimization Algorithm: Implement a multi-objective Particle Swarm Optimization (PSO) algorithm. The algorithm will iteratively search the parameter space to find the combination that simultaneously maximizes all defined objectives over many iterations (e.g., 150 generations).
- Identify a Robust Solution Set: Apply a clustering method (e.g., k-means) to the set of optimal solutions found by the PSO. This identifies a region of good performance rather than a single point, making the final design less sensitive to manufacturing variances.
The Scientist's Toolkit: Key Research Reagent Solutions
| Item | Function in Biosensor Development | Example from Literature |
|---|---|---|
| Gold Nanoparticles (AuNPs) | Plasmonic nanomaterial that enhances signal in optical and electrochemical biosensors via large surface area and field enhancement. | Used as a core substrate functionalized with peptides for SERS and electrochemical detection [26]. |
| Synthetic Peptides | Stable, customizable biorecognition elements that can be engineered for variant-specific detection of antibodies or antigens. | P44 peptide from SARS-CoV-2 RBD used for specific antibody detection in serum [26]. |
| Graphene & 2D Materials | Enhances sensitivity on SPR platforms due to large surface area and strong adsorption of biomolecules. | Integrated into a THz SPR biosensor configuration to achieve high phase sensitivity [58]. |
| Machine Learning Models (RF, XGBoost) | Predicts optimal biosensor design parameters and performance, drastically reducing simulation time and cost. | Used to predict effective index and confinement loss in PCF-SPR sensors, with SHAP analysis identifying critical parameters [60]. |
| EDC/NHS Chemistry | Standard cross-linking chemistry for covalent immobilization of biomolecules (with primary amines) onto carboxylated surfaces. | Used to covalently attach anti-α-fetoprotein antibodies to a nanostar-based SERS platform [58]. |
Workflow and Relationship Diagrams
Diagram 1: Robust Biosensor Optimization Workflow
Diagram 2: Key Parameters Influencing SPR Biosensor Performance
Validation and Comparative Analysis: Ensuring and Benchmarking RSM Performance
FAQ: Troubleshooting Model Validation in Response Surface Methodology
Q1: My R-squared value is high (>0.95), but my model's predictions are inaccurate. What is wrong? A high R-squared indicates that the model explains a large portion of the variability in the data, but it does not guarantee predictive accuracy. This discrepancy often arises from overfitting, where the model is too complex and fits the experimental noise rather than the underlying relationship.
- Troubleshooting Steps:
- Check the Adjusted R-squared: Compare the R-squared and Adjusted R-squared values. If the Adjusted R-squared is significantly lower, it indicates that some model terms may not be significant, and the model is likely overfit [63].
- Analyze the Predicted R-squared: This statistic estimates the model's ability to predict new data. A large gap between the Adjusted R-squared and Predicted R-squared is a clear sign of overfitting. A model with a Predicted R² of 0.985 against an Adjusted R² of 0.989, for example, shows good agreement [63].
- Perform a Lack-of-Fit Test: A significant lack-of-fit (p-value < 0.05) means the model fails to represent the underlying relationship, despite a high R-squared [64] [65].
Q2: How do I interpret the ANOVA table for my Response Surface Model? The Analysis of Variance (ANOVA) table determines which model terms significantly affect your response. Key values to check are the F-value and p-value (Prob > F).
Interpretation Guide:
- Model F-value & p-value: A significant model (p-value < 0.05, e.g., 0.002144) implies the model explains more variation than noise [66] [64].
- Lack-of-Fit F-value & p-value: A non-significant lack-of-fit (p-value > 0.05) is desirable, indicating the model fits the data well compared to pure error [63].
- Individual Term p-values: Check the p-values for each model term (linear, interaction, quadratic). Terms with p-values less than 0.05 are considered significant.
ANOVA Summary Table Example (Quadratic Model):
Source Sum of Squares df Mean Square F-value p-value Model 857.88 2 428.94 95.97 < 0.0001 Residual 268.17 30 8.94 ∟ Lack-of-Fit [Value] [df] [Value] [Value] 0.0021 ∟ Pure Error [Value] [df] [Value] Cor Total 1126.05 32
Q3: What is a Lack-of-Fit Test, and how do I perform one in R? A Lack-of-Fit (LOF) test compares the residual error of your model to the "pure error" from replicated experimental data. It determines if a more complex model is needed [64] [65].
Hypotheses:
- Null (H₀): The model adequately fits the data.
- Alternative (H₁): The model does not fit the data well.
Step-by-Step Protocol in R:
- Ensure Replicated Data: Your dataset must have multiple observations at the same predictor values to calculate pure error. You may need to create these by rounding predictor values [65].
- Fit a Model with Replicates:
- Perform the ANOVA Lack-of-Fit Test:
- Interpret the Output: A p-value less than 0.05 for the Lack-of-Fit test suggests your model is inadequate, and you should consider a more complex one (e.g., adding quadratic or interaction terms) [64].
Key Validation Metrics for Your RSM Model
The table below summarizes the key metrics to report when validating your RSM model for biosensor optimization.
| Metric | Target Value / Condition | Interpretation in Biosensor Context |
|---|---|---|
| R-squared (R²) | Closer to 1.0 (e.g., > 0.90) | The proportion of variance in biosensor response time explained by your model factors (e.g., pH, temperature). |
| Adjusted R-squared | Close to R² | Adjusts R² for the number of model terms; confirms model terms are meaningful. |
| Predicted R-squared | Good agreement with Adjusted R² | Indicates the model's predictive power for new biosensor experiments. |
| Model p-value (ANOVA) | < 0.05 | The model is statistically significant; the factors have a real effect on response time. |
| Lack-of-Fit p-value | > 0.05 | The model is adequate; no need for more complex terms. |
| Coefficient of Variation (CV) | As low as possible | The model is precise and reliable. A CV of 1.11% is considered low [63]. |
Experimental Protocol: Validating Your Model with a Lack-of-Fit Test
This protocol allows you to statistically verify that your chosen RSM model (e.g., linear, quadratic) is appropriate.
- Experimental Design: Ensure your experimental design (e.g., Box-Behnken, Central Composite) includes replicate points at the center or other design points. These replicates are essential for calculating pure error [65].
- Data Collection: Run your biosensor experiments as designed and record the response time for each run.
- Model Fitting: Fit your proposed RSM model using statistical software.
- Execute Lack-of-Fit Test: Use the software's ANOVA function to perform the test. In R, the
anova()function on anlmobject with replicates will provide the result [64]. - Decision:
- If p-value > 0.05, you can conclude there is no significant lack-of-fit. Your model is adequate.
- If p-value < 0.05, your model shows significant lack-of-fit. You should consider transforming the response variable or adding higher-order terms (e.g., quadratic) to better capture the relationship [66].
Workflow Diagram: The Model Validation Process
The diagram below outlines the logical workflow for validating an RSM model.
| Item / Solution | Function in RSM Model Validation |
|---|---|
| Statistical Software (R, Design-Expert) | Used for fitting regression models, performing ANOVA, Lack-of-Fit tests, and generating diagnostic plots [64] [66]. |
| Replicated Experimental Points | Provides "pure error" essential for the Lack-of-Fit test to distinguish model inadequacy from random noise [65]. |
| Box-Behnken or Central Composite Design | Efficient experimental designs that allow for the fitting of quadratic models and include center points for testing curvature and pure error [66] [17]. |
| ANOVA (Analysis of Variance) | A statistical method to decompose the total variability in the data and test the significance of the model and its individual terms [66] [63]. |
| Pure Error | The variability in the response from replicated experimental runs. It is the benchmark against which the model's lack-of-fit is compared [65]. |
| Residual Plots | Graphical tools (e.g., residuals vs. predicted, normal probability plots) used to check the underlying assumptions of the model, such as constant variance and normality of errors. |
In research focused on optimizing biosensor response time using Response Surface Methodology (RSM), the statistical model generated is only a prediction. The critical step that validates the entire optimization process is the confirmatory experiment—a laboratory test conducted at the predicted optimal conditions to verify that the theoretical performance can be achieved in practice. This guide addresses the key challenges researchers face during this verification phase.
Frequently Asked Questions (FAQs)
Q1: My confirmatory experiment results do not match the model's prediction. What are the primary causes? A significant discrepancy between predicted and actual results often stems from several common issues:
- Model Inadequacy: The RSM model may not adequately capture the true relationship between factors and response, often due to an incorrectly specified model (e.g., using a first-order model when curvature is present) or an experimental region that is too large [67].
- Improper Factor Ranges: Preliminary work to establish suitable ranges for independent parameters was insufficient, meaning the true optimum may lie outside the studied experimental domain [67].
- Uncontrolled Noise Factors: Unaccounted-for external variables (e.g., ambient temperature fluctuations, reagent lot variations) are influencing the biosensor's response in a way the model cannot predict.
Q2: How many replicate runs are required for a reliable confirmatory experiment? While RSM designs themselves can be efficient without replicates, the confirmatory stage requires replication to account for experimental variability and provide a measure of confidence in the result. It is recommended to perform a minimum of three to five replicate runs at the predicted optimum conditions. This allows you to calculate a mean and standard deviation for the observed response and compare it statistically to the model's prediction [31].
Q3: What statistical metrics should I use to validate the model's accuracy? The key is to compare the predicted response from the model against the average observed response from your confirmatory runs. The model is considered validated if the observed results fall within a statistically acceptable range of the prediction. Key metrics and checks include:
- Confidence Intervals: Check if the mean of your confirmatory experimental results falls within the prediction interval of the model [31].
- Residual Analysis: Examine the residuals (the differences between observed and predicted values) for any non-random patterns, which would suggest model inadequacy [2] [31].
- Comparative Analysis: A well-fitted model will have a low probability value (e.g., Prob > F < 0.0001) and a high F-value from the analysis of variance (ANOVA), as demonstrated in a study optimizing reteplase expression [68].
Troubleshooting Guides
Poor Reproducibility in Confirmatory Runs
| Symptom | Possible Cause | Corrective Action |
|---|---|---|
| High variation between replicate confirmation runs. | Unstable biosensor biorecognition element. | Implement stricter quality control of reagents; ensure consistent immobilization protocols [69]. |
| Fluctuations in the sample matrix or environmental conditions. | Standardize sample preparation and conduct experiments in a controlled environment. | |
| Inconsistent operation of biosensor instrumentation. | Calibrate equipment before confirmation experiments; follow a standardized operating procedure. |
Confirmatory Result is Statistically Different from Prediction
| Symptom | Possible Cause | Corrective Action |
|---|---|---|
| The average response from lab experiments is significantly different from the RSM prediction. | The RSM model lacks curvature terms needed to accurately describe the response surface. | Augment your original design (e.g., with axial points to create a Central Composite Design) to fit a second-order model [31] [70]. |
| The true optimum lies outside the original experimental region you investigated. | Expand the factor ranges and perform a new RSM study, using the initial study to guide the new domain [67]. | |
| Significant interaction effects were not accounted for in the initial experimental design. | Verify that your initial screening included all potentially relevant factors and that your design can estimate interaction terms [2]. |
Experimental Protocol: Executing a Confirmatory Experiment
This protocol outlines the steps to validate the optimal conditions for biosensor response time, as predicted by an RSM model.
Objective: To experimentally verify that the biosensor performance (response time) achieved at the RSM-predicted optimum conditions matches the model's forecast.
Principles: The confirmatory experiment bridges statistical prediction and empirical validation. It is a critical checkpoint before proceeding to larger-scale validation studies [69].
Materials and Reagents:
- Biosensor platform
- Target analyte
- Immobilization reagents
- Assay buffer
Procedure:
- Define Optimal Conditions: From your finalized RSM model, identify the specific levels for each critical factor (e.g., pH, immobilization density, temperature) that are predicted to yield the fastest response time.
- Prepare Biosensors: Fabricate or prepare a set of biosensors (minimum of 3) strictly adhering to the optimal conditions for all factors.
- Run the Assay: Perform the biosensing assay using a standardized concentration of the target analyte. Precisely measure the response time for each biosensor.
- Record and Analyze Data: Document the response time for each replicate. Calculate the mean, standard deviation, and confidence interval for the observed results.
- Compare with Prediction: Statistically compare the mean observed response time against the model's predicted value and its associated prediction interval.
Interpretation of Results:
- Validation Success: If the mean observed response falls within the model's prediction interval, the model is considered validated. You can proceed with confidence in the optimized conditions.
- Validation Failure: If the result falls outside the prediction interval, the model is inadequate. Refer to the troubleshooting guide (Section 3.2) and consider refining the model or exploring a new experimental region.
Experimental Workflow for RSM Optimization and Confirmation
The following diagram illustrates the complete iterative workflow from initial RSM modeling to the final confirmatory experiment, highlighting the decision points based on the confirmation results.
Research Reagent Solutions
The following table details key materials and their critical functions in biosensor development and optimization experiments.
| Item | Function in Biosensor Optimization | Example Context |
|---|---|---|
| Biorecognition Elements | Binds the target analyte; the source of specificity. Choice directly impacts response time and sensitivity [71]. | Antibodies, aptamers, enzymes. |
| Immobilization Reagents | Anchor the biorecognition element to the transducer surface. Efficiency and orientation affect response time [71]. | Amine-coupling kits (e.g., EDC/NHS), glutaraldehyde. |
| Signal Transducers | Convert the biological binding event into a measurable signal. The type defines the biosensor (electrochemical, optical, etc.) [71]. | Gold film (SPR), carbon electrodes, fluorescent detectors. |
| Blocking Agents | Cover unused surface areas to minimize non-specific binding, which is critical for reducing noise and false signals [71]. | Bovine Serum Albumin (BSA), casein, synthetic blockers. |
| Regeneration Buffers | Gently remove bound analyte from the biosensor surface without damaging the biorecognition element, enabling re-use for multiple assays during optimization [69]. | Low pH buffers (e.g., Glycine-HCl), high salt solutions. |
In the pursuit of optimizing biosensor response time, researchers often face the challenge of modeling complex, non-linear relationships between multiple input parameters and the desired output. Two powerful methodologies frequently employed for this task are Response Surface Methodology (RSM) and Artificial Neural Networks (ANN). RSM is a classical statistical technique that uses experimental design and polynomial regression to build models and optimize processes [72]. In contrast, ANN is a machine learning approach inspired by biological neural systems, capable of learning complex patterns from data without requiring pre-specified mathematical relationships [73]. Understanding the relative strengths, limitations, and appropriate application contexts for each method is crucial for researchers aiming to develop faster, more sensitive biosensing platforms.
Technical Comparison: Predictive Performance
Quantitative Accuracy Metrics
Multiple studies across various scientific domains have directly compared the predictive accuracy of RSM and ANN models. The table below summarizes key performance metrics from recent research:
Table 1: Comparative Predictive Accuracy of RSM vs. ANN Models
| Application Domain | RSM R² Value | ANN R² Value | RSM RMSE | ANN RMSE | Reference |
|---|---|---|---|---|---|
| Wastewater Treatment (Coagulation-Dynamic Membrane System) | Lower than ANN | COD: 0.9996, TMP: 0.9498 | - | - | [74] |
| Dye Removal (Adsorption) | 0.8871 (LOOCV) | 0.9438 (LOOCV) | 7.3587 | 5.1917 | [72] |
| Biodiesel Yield Optimization | 0.9560 | Correlation: 0.9777 | 3.630 | 0.591 | [75] |
| Gas Refinery Energy Consumption | 0.930 | MLP: 0.986, RBF: 0.981 | - | MLP: 0.002, RBF: 0.0051 | [76] |
| Electricity Consumption (DRI Processes) | 0.9879 | MLP: 0.99601 | - | MLP: 0.00037 | [77] |
| Thrust Force Prediction | 0.9806 | 0.9897 | - | - | [78] |
Key Performance Differentiators
The consistency of ANN's superior predictive performance across diverse applications stems from several inherent advantages:
- Non-Linear Modeling Capability: ANN excels at capturing complex, non-linear relationships between variables without requiring pre-specification of the functional form [79]. This is particularly valuable for biosensor optimization where response surfaces may exhibit significant curvature and interaction effects.
- Data-Driven Adaptation: ANN models automatically adjust their internal parameters (weights and biases) to minimize prediction error during training [73]. This allows them to better represent irregular response surfaces that might challenge RSM's polynomial approximations.
- Handling Complex Variable Interactions: While RSM can model some interactions through cross terms in polynomial equations, ANN inherently captures higher-order interactions through its multi-layer network architecture [74] [77].
Experimental Design and Implementation
Workflow Comparison
The fundamental workflows for implementing RSM and ANN in optimization studies follow distinct pathways suited to their methodological foundations:
Detailed Methodological Protocols
RSM Implementation Protocol
For optimizing biosensor response time using RSM:
Factor Screening: Identify critical factors influencing biosensor response time (e.g., pH, temperature, immobilization density, substrate concentration) using Plackett-Burman design or fractional factorial approaches [74].
Experimental Design: Employ a Box-Behnken Design (BBD) or Central Composite Design (CCD) to efficiently explore the factor space. A typical BBD for 3 factors requires 15-17 experimental runs including center points [72] [79].
Model Development: Fit a second-order polynomial model to the experimental data:
Y = β₀ + ΣβᵢXᵢ + ΣβᵢᵢXᵢ² + ΣβᵢⱼXᵢXⱼ + εwhere Y is the predicted response (biosensor response time), Xᵢ and Xⱼ are input factors, β are regression coefficients, and ε is the error term [75].Model Validation: Check model adequacy using ANOVA with metrics including R², adjusted R², predicted R², and lack-of-fit test. A p-value < 0.05 indicates statistical significance [72].
ANN Implementation Protocol
For developing an ANN model for biosensor optimization:
Data Preparation: Normalize all input and output variables to a consistent range (typically 0-1 or -1 to 1) to ensure stable network training [73].
Network Architecture Selection: For biosensor applications, start with a feedforward network with one hidden layer containing 5-15 neurons. The input layer should have neurons corresponding to your optimization factors, while the output layer typically has a single neuron representing response time [77] [76].
Network Training: Utilize the Levenberg-Marquardt backpropagation algorithm for efficient training. Divide your experimental data into training (70-80%), validation (10-15%), and testing (10-15%) sets to prevent overfitting [73].
Performance Evaluation: Assess model performance using multiple metrics including Mean Square Error (MSE), Root Mean Square Error (RMSE), and correlation coefficient (R) between predicted and experimental values [75].
Research Reagent Solutions for Biosensor Optimization
Table 2: Essential Materials and Their Functions in Biosensor Optimization Studies
| Material/Reagent | Function in Optimization | Application Context |
|---|---|---|
| Aluminum Electrodes (Al-Al) | Electrode material for electrochemical systems | Electrocoagulation processes for wastewater treatment [79] |
| Spent Coffee Ground Biochar (SCGB) | Low-cost, sustainable adsorbent | Dye removal studies [72] |
| Polyaluminum Chloride (PAC) / Polyacrylamide (PAM) | Coagulants for particle aggregation | Coagulation-dynamic membrane systems [74] |
| Triethylene Glycol (TEG) | Liquid desiccant for gas dehydration | Gas sweetening processes [76] |
| Selenium-Enriched Rape Powder | Source for selenium-containing protein extraction | Bio-active compound optimization [73] |
| Potassium Hydroxide (KOH) Catalyst | Transesterification catalyst | Biodiesel production optimization [75] |
Troubleshooting Guide: Frequently Asked Questions
Model Selection and Application
Q: How do I choose between RSM and ANN for my specific biosensor optimization problem?
A: Consider these key factors:
- Choose RSM when: You have limited data (15-30 experimental runs), need highly interpretable models for factor effects, require straightforward optimization with clear mathematical relationships, or need to comply with regulatory requirements that favor statistically designed experiments [80] [72].
- Choose ANN when: You have larger datasets (>50 samples), the system exhibits strong non-linearity, prediction accuracy is the primary concern, or you can integrate with evolutionary algorithms for enhanced optimization [74] [77] [76].
Q: My RSM model shows high R² values but poor predictive performance. What might be wrong?
A: This discrepancy suggests potential overfitting or inadequate model specification:
- Check the difference between R² and adjusted R²; a large gap indicates potentially insignificant terms in your model [72].
- Verify that your experimental design adequately covers the factor space; consider adding center points if missing [75].
- Examine residual plots for patterns, which may indicate missing higher-order terms better captured by ANN [79].
Implementation Challenges
Q: My ANN model converges slowly during training. How can I improve training efficiency?
A: Several strategies can accelerate convergence:
- Ensure proper data normalization; standardize inputs to have zero mean and unit variance or scale to specific ranges [73].
- Increase network complexity gradually; start with fewer hidden neurons and increase until performance plateaus [77].
- Adjust learning parameters; consider adaptive learning rate algorithms or try different activation functions [76].
Q: How can I effectively optimize processes after developing RSM or ANN models?
A: Integration with optimization algorithms enhances both approaches:
- For RSM: Use desirability functions to handle multiple responses simultaneously [81].
- For ANN: Integrate with Genetic Algorithms (GA) for global optimization, as demonstrated in selenium-enriched rape protein extraction where GA identified optimal conditions yielding 57.69 mg/g protein [73].
- Hybrid approaches: Combine RSM for initial screening and ANN for final optimization to leverage the strengths of both methods [79].
Data-Related Issues
Q: What is the minimum dataset size required for developing reliable ANN models?
A: While requirements vary with problem complexity:
- For 3-5 input factors, aim for at least 20-30 experimental data points to capture fundamental relationships [73].
- With limited data, use leave-one-out cross-validation or bootstrap aggregation to maximize information utilization [72].
- Consider hybrid RSM-ANN approaches where RSM's structured design provides the initial data for ANN training [79].
Q: How does dataset complexity influence the performance difference between RSM and ANN?
A: Research demonstrates that dataset complexity significantly impacts the relative performance:
- For low-complexity relationships with minimal non-linearity, RSM and ANN perform similarly, with RSM sometimes preferred for interpretability [80].
- As complexity increases (strong interactions, significant curvature), ANN's superior non-linear mapping capability becomes increasingly advantageous [74] [77].
- In wind turbine airfoil design, ANN substantially outperformed RSM for predicting complex aerodynamic coefficients [80].
Integrated Methodology Selection Guide
The following decision framework synthesizes key considerations for selecting between RSM and ANN in biosensor optimization studies:
Concluding Recommendations
The comparison between RSM and ANN reveals a consistent pattern across multiple studies: while both methodologies provide valuable optimization frameworks, ANN generally delivers superior predictive accuracy for complex, non-linear systems. However, RSM maintains advantages in experimental efficiency, model interpretability, and performance with limited data.
For biosensor response time optimization specifically, a hybrid approach often proves most effective:
- Utilize RSM for initial factor screening and experimental design to efficiently explore the parameter space [74].
- Develop ANN models to capture the complex, non-linear relationships influencing biosensor performance [77] [76].
- Integrate with optimization algorithms like Genetic Algorithms to identify global optimum conditions for minimal response time [73].
This strategic integration leverages the complementary strengths of both methodologies, providing an efficient pathway to developing highly responsive biosensor systems while maximizing resource utilization in the optimization process.
Comparative Analysis of RSM Success Across Biosensor Platforms (Electrochemical, Optical, SPR)
Troubleshooting Guides
Electrochemical Biosensor Troubleshooting
Q1: My electrochemical biosensor shows inconsistent signals and a poor signal-to-noise ratio. What could be the cause and how can I resolve this?
A: Inconsistent signals in electrochemical biosensors are frequently caused by electrode fouling, chemical interferences from the complex sample matrix, or instability of biological recognition elements. This is a common challenge when transitioning from controlled lab settings to point-of-care applications [82].
- Step 1: Optimize Electrode Interface: Ensure your electrode modification is robust. For a glassy carbon electrode (GCE), a sequential modification with materials like nanodiamonds followed by gold nanoparticle (AuNP) electrodeposition can enhance conductivity and provide a more stable platform [83].
- Step 2: Employ Chemometrics: Integrate machine learning (ML) for advanced data analysis. Algorithms like Least Squares Support Vector Machine (LS-SVM) have proven effective in handling complex data, removing noise, and isolating the target analyte's signal from interfering compounds. This software-based approach can compensate for hardware limitations [5] [82].
- Step 3: Validate with Design of Experiments: Use a Central Composite Design (CCD) to systematically optimize experimental parameters (e.g., pH, incubation time, modifier concentration) instead of a one-variable-at-a-time approach. This identifies optimal conditions and reveals interacting factors that affect signal stability [5].
Q2: How can I improve the detection limit and sensitivity of my affinity-based electrochemical biosensor?
A: Enhancing sensitivity requires a multi-faceted approach focusing on the electrode surface and signal transduction.
- Action 1: Utilize Nanomaterials: Incorporate multi-walled carbon nanotubes (MWCNTs) and ionic liquids (ILs) to create a nanocomposite on the electrode surface. This combination provides a high surface area, excellent conductivity, and facilitates electron transfer, significantly boosting the signal [5].
- Action 2: Implement a Signal Amplification Strategy: Design a system where the biorecognition event triggers a secondary reaction. For example, an enzyme like alkaline phosphatase (ALP) can catalyze a substrate to generate a product that attracts redox molecules (e.g.,
[Ru(NH₃)₅Cl]²⁺), leading to a amplified amperometric response [5]. - Action 3: Functionalize with Specific Bioreceptors: Use synthetic peptides as biorecognition elements. For instance, the P44 (TGKIADYNYKLPDDF) peptide, derived from the SARS-CoV-2 Spike protein's RBD, can be immobilized on AuNPs. This allows for ultrasensitive detection of specific antibodies via electrochemical impedance spectroscopy (EIS), achieving detection limits as low as 0.43 ng mL⁻¹ [26].
Optical (SERS) Biosensor Troubleshooting
Q3: My Surface-Enhanced Raman Spectroscopy (SERS) biosensor produces variable results and high background noise. How can I improve its reliability?
A: Variability in SERS often stems from inconsistent nanoparticle aggregation or non-specific binding in complex biological samples.
- Solution 1: Standardize Nanoparticle Functionalization: Synthesize AuNPs (~30 nm) via the Turkevich method and functionalize them consistently with a Raman reporter molecule like 4-mercaptobenzoic acid (MBA) and your target peptide (e.g., P44). Confirm functionalization using UV-vis spectroscopy and Dynamic Light Scattering (DLS) to ensure a stable and uniform colloidal suspension [26].
- Solution 2: Apply Chemometric Analysis: Instead of relying on a single Raman peak, use Partial Least Squares Discriminant Analysis (PLS-DA) on the entire spectral dataset. This machine learning technique can differentiate between specific and non-specific binding events, achieving high sensitivity (100%) and specificity (76%) even in complex media like diluted serum [26].
- Solution 3: Control Sample Dilution: Dilute serum samples to at least 1:10,000 for SERS analysis. This critical step minimizes nanoparticle aggregation and reduces matrix interference that contributes to background noise [26].
SPR Biosensor Troubleshooting
Q4: The sensitivity of my Surface Plasmon Resonance (SPR) biosensor is insufficient for detecting low-abundance cancer biomarkers. How can I enhance its performance?
A: The sensitivity of an SPR biosensor is highly dependent on the architecture of the sensing layers. Improving the design can dramatically increase the shift in the resonance angle per refractive index unit (RIU).
- Step 1: Adopt an Advanced Layered Structure: Replace conventional single-metal (Au/Ag) films with a multi-layer configuration. A proposed high-performance structure is BK7/ZnO/Ag/Si₃N₄/WS₂/Sensing Medium. The 2D material WS₂ significantly enhances the local electric field and light-matter interaction [84].
- Step 2: Simulate and Optimize: Use Finite Element Method (FEM) simulations (e.g., with COMSOL) to model the electric field distribution and fine-tune the thickness of each layer (Ag, ZnO, Si₃N₄, WS₂) before fabrication. This predictive modeling is crucial for achieving maximum sensitivity [84].
- Step 3: Select the Right Prism and Metal: Ensure you are using a BK7 prism coupled with a silver (Ag) layer. Silver provides a sharper resonance curve than gold, which is key to achieving higher angular sensitivity, as demonstrated in designs reaching 342.14 deg/RIU for blood cancer cell detection [84].
Q5: What are the key material choices for building a high-sensitivity SPR biosensor for clinical samples?
A: The selection of materials directly governs the sensor's performance. The following layered structure is recommended for highly sensitive detection [84]:
- Prism: BK7 glass for efficient light coupling.
- Adhesion/Interface Layer: Zinc Oxide (ZnO) to improve the architecture and performance.
- Plasmonic Metal: Silver (Ag) for its superior plasmonic properties and sharper resonance.
- Dielectric Layer: Silicon Nitride (Si₃N₄) to help confine the electric field.
- 2D Material Enhancer: Tungsten Disulfide (WS₂) from the family of Transition Metal Dichalcogenides (TMDCs) to greatly enhance the electromagnetic field at the interface.
- Sensing Medium: The fluidic channel where the biological interaction occurs.
Frequently Asked Questions (FAQs)
Q1: What is the primary advantage of using machine learning with electrochemical biosensors? A: ML enhances electrochemical biosensors by improving data analysis from complex, noisy datasets typical of point-of-care testing. It effectively handles challenges like electrode fouling, chemical interferences, and sample variability. ML algorithms can "unscramble" data, perform noise removal, and isolate signals from multiple analytes in a single measurement, leading to more reliable and actionable results [82].
Q2: Why are synthetic peptides like P44 sometimes preferred over full antibodies or proteins in biosensors? A: Synthetic peptides offer superior adaptability and stability. Modifying a single amino acid residue in a peptide sequence is far simpler and faster than producing a new, mutated full-length protein. This makes peptide-based biosensors ideal for rapidly adapting to emerging viral variants while maintaining high specificity for their target antibodies [26].
Q3: For a researcher new to biosensors, which platform is more accessible: Electrochemical or SPR? A: Electrochemical biosensors are generally more accessible. They offer simplicity, low cost, and easy miniaturization, making them ideal for decentralized testing. SPR systems, while offering exceptional sensitivity and label-free detection, typically require more sophisticated and expensive instrumentation [26] [83].
Q4: How does the incorporation of ZnO and WS₂ in an SPR sensor improve its sensitivity? A: These materials enhance the sensor's performance by modifying the distribution of the electric field at the sensing interface. ZnO acts as an efficient dielectric layer, while WS₂, a 2D material, has a high surface-to-volume ratio and strong light-matter interaction. This architecture collectively enhances the evanescent field, leading to a greater shift in the resonance angle for a given change in the refractive index, thereby boosting sensitivity [84].
Quantitative Data Comparison
The table below summarizes key performance metrics for the biosensor platforms discussed in the troubleshooting guides.
Table 1: Comparative Performance Metrics of Biosensor Platforms
| Biosensor Platform | Detection Technique | Biorecognition Element | Target Analyte | Reported Sensitivity / LOD | Key Advantage |
|---|---|---|---|---|---|
| Electrochemical | Impedimetry (EIS) | P44-WT Peptide on AuNPs | SARS-CoV-2 Antibodies | 0.43 ng mL⁻¹ LOD [26] | Ultra-low detection limit |
| Electrochemical | Amperometry | MWCNTs-Ionic Liquid | Alkaline Phosphatase | Enhanced via LS-SVM [5] | Excellent for complex blood matrices |
| Optical (SERS) | Raman Spectroscopy | P44 Peptide on AuNPs | SARS-CoV-2 Antibodies | 100% Sensitivity [26] | High spectral specificity |
| SPR | Angular Interrogation | Layered Structure (WS₂) | Blood Cancer Cells (Jurkat) | 342.14 deg/RIU [84] | Extremely high sensitivity |
Experimental Protocols
Protocol: Peptide-Based Electrochemical Biosensor
This protocol details the construction of an ultrasensitive impedance biosensor for antibody detection [26].
- Synthesis of AuNPs: Use the Turkevich method. Boil 95 mL of HAuCl₄·3H₂O (23 mg) solution under constant stirring. Rapidly add 3.0 mL of preheated 1% (w/v) sodium citrate dihydrate. Heat until the solution turns deep red, indicating nanoparticle formation. Cool to room temperature.
- Electrode Modification: Clean a Glassy Carbon Electrode (GCE). Immerse it in a solution containing a stabilizer (e.g., 4-mercaptobenzoic acid) and the synthetic peptide (e.g., P44-WT, P44-T, or P44-N) to form a functionalized self-assembled monolayer on the electrode surface.
- Measurement via EIS: Perform Electrochemical Impedance Spectroscopy in a solution containing
[Fe(CN)₆]³⁻/⁴⁻as a redox probe. Measure the change in charge transfer resistance (Rₐₜ) before and after exposure to the sample containing the target antibody. - Data Analysis: The increase in Rₐₜ is proportional to the amount of antibody bound to the peptide. Generate a calibration curve to determine the concentration of the unknown analyte.
Protocol: SERS-Based Optical Biosensor
This protocol outlines the steps for serological analysis using a peptide-functionalized SERS platform [26].
- Nanoparticle Functionalization: Synthesize AuNPs as in 4.1. Functionalize them with the Raman reporter MBA and the specific peptide (P44-WT, P44-T, P44-N) to create the biosensing probe.
- Sample Incubation: Mix the functionalized AuNPs with the target serum sample. A recommended serum dilution is 1:10,000 to prevent nanoparticle aggregation and biofouling. Allow the antibody-peptide binding to occur.
- SERS Measurement: Use a Raman spectrometer (e.g., with a 785 nm laser). Record the SERS spectrum with a 15-second exposure time across the 300–2000 cm⁻¹ range.
- Chemometric Analysis: Analyze the full spectral data using Partial Least Squares Discriminant Analysis (PLS-DA). This machine learning model will classify the samples as positive or negative based on the spectral features resulting from the specific antibody-peptide interaction.
Experimental Workflow and Signaling Pathways
SPR Biosensor Layer Architecture
Electrochemical Peptide Biosensor Setup
Research Reagent Solutions
Table 2: Essential Materials for Advanced Biosensor Development
| Reagent / Material | Function / Application | Example Use Case |
|---|---|---|
| Gold Nanoparticles (AuNPs) | Signal amplification; platform for bioreceptor immobilization. | Core component in SERS and electrochemical biosensors [26] [83]. |
| Synthetic Peptides (e.g., P44) | Biorecognition element for specific antibody detection. | Used for variant-specific detection of SARS-CoV-2 antibodies [26]. |
| Multiwalled Carbon Nanotubes (MWCNTs) | Enhances electrode surface area and electron transfer. | Used with Ionic Liquid in amperometric biosensors to boost signal [5]. |
| Ionic Liquid (IL) | Electrolyte and dispersing agent for nanomaterials. | Combined with MWCNTs for modified electrode pastes [5]. |
| Transition Metal Dichalcogenides (WS₂) | 2D material that enhances electromagnetic field in SPR. | Integrated into layered SPR structures for extreme sensitivity [84]. |
| 4-Mercaptobenzoic Acid (MBA) | Raman reporter molecule for SERS biosensing. | Used on AuNPs to generate a strong, enhanced Raman signal [26]. |
Conclusion
Response Surface Methodology offers a powerful, systematic framework for optimizing biosensor response time, moving beyond the inefficiencies of traditional one-variable-at-a-time approaches. By enabling the simultaneous investigation of multiple interacting factors, RSM not only accelerates the development cycle but also provides deep, data-driven insights into the fundamental mechanisms governing biosensor kinetics. The successful application of RSM across various biosensor platforms—from electrochemical genosensors to catalytic biosensors—highlights its versatility and robustness. Looking forward, the integration of RSM with emerging machine learning and explainable AI (XAI) techniques presents a compelling future direction. This synergistic approach promises to further enhance predictive modeling, unlock new levels of optimization, and ultimately expedite the translation of high-performance biosensors from the laboratory to clinical point-of-care applications, thereby advancing personalized medicine and global health diagnostics.
References
- 1. Response surface methodology [https://en.wikipedia.org/wiki/Response_surface_methodology]
- 2. Response Surface Methodology (RSM) in Design of ... [https://www.6sigma.us/six-sigma-in-focus/response-surface-methodology-rsm/]
- 3. Response Surface Methodology | Statistics Knowledge Portal [https://www.jmp.com/en/statistics-knowledge-portal/design-of-experiments/response-surface-methodology]
- 4. Response Surface Methodology - Overview & Applications [https://www.neuralconcept.com/post/response-surface-methodology-overview-applications]
- 5. Smart chemometrics-assisted electrochemical biosensor ... [https://www.sciencedirect.com/science/article/pii/S1452398125002494]
- 6. Application of Response Surface Methodology for Food ... [https://www.mdpi.com/journal/chemosensors/special_issues/RSM_food]
- 7. Introductory Chapter: Response Surface Methodology in ... [https://www.intechopen.com/chapters/78972]
- 8. A chemometric approach based on response surface ... [https://bmcchem.biomedcentral.com/articles/10.1186/s13065-023-01107-w]
- 9. Optimization of voltammetric parameters and sensitive ... [https://www.sciencedirect.com/science/article/abs/pii/S2214714425012371]
- 10. Multivariate Optimization of Electrochemical Biosensors for the ... [https://pmc.ncbi.nlm.nih.gov/articles/PMC10377565/]
- 11. Perspectives on systematic optimization of ultrasensitive ... [https://pubs.rsc.org/en/content/articlehtml/2024/tc/d4tc02131b]
- 12. Response surface methodology optimized electrochemical ... [https://www.sciencedirect.com/science/article/abs/pii/S0039914021000205]
- 13. The first diagnostic test for specific detection of ... [https://www.sciencedirect.com/science/article/abs/pii/S0039914021009711]
- 14. Response Surface Methodology for the Optimisation of ... [https://pmc.ncbi.nlm.nih.gov/articles/PMC6468913/]
- 15. Response Surface Methods for Optimization [https://help.reliasoft.com/reference/experiment_design_and_analysis/doe/response_surface_methods_for_optimization.html]
- 16. Response Surface Methodology to Optimize the Extraction of ... [https://pmc.ncbi.nlm.nih.gov/articles/PMC10742715/]
- 17. Response Surface Methodology - an overview [https://www.sciencedirect.com/topics/agricultural-and-biological-sciences/response-surface-methodology]
- 18. Top 10 tips for high quality SPR data | SPR Guide [https://nicoyalife.com/blog/spr-tips/top-10-tips-for-high-quality-spr-data/]
- 19. Chemometrics-Assisted Enhancement of Electrochemical ... [https://pmc.ncbi.nlm.nih.gov/articles/PMC12019774/]
- 20. Applications of Response Surface Methodology (RSM) in ... [https://www.intechopen.com/chapters/83621]
- 21. Enhancing Response Surface Methodology through ... [https://www.mdpi.com/2227-9717/11/12/3392]
- 22. Surface Plasmon Resonance Troubleshooting - SPR ... [https://bitesizebio.com/31665/spr-instrument-troubleshooting-surface-plasmon-resonance-assay-technology/]
- 23. Response Surface Methodology - an overview [https://www.sciencedirect.com/topics/food-science/response-surface-methodology]
- 24. Challenges and Opportunities in Smart Biosensing for ... [https://pmc.ncbi.nlm.nih.gov/articles/PMC12455640/]
- 25. Reduction of Biosensor False Responses and Time Delay ... [https://pmc.ncbi.nlm.nih.gov/articles/PMC10683760/]
- 26. Peptide-based biosensors for variant-specific detection of ... [https://pubs.rsc.org/en/content/articlehtml/2025/ma/d5ma00485c]
- 27. AI-Assisted Response Surface Methodology for Growth ... [https://www.mdpi.com/2306-5354/12/11/1277]
- 28. A numerical study of geometric and flow factors influencing ... [https://link.springer.com/article/10.1007/s42452-024-06251-z]
- 29. Optimization of microfluidic biosensor efficiency by means ... [https://www.nature.com/articles/s41598-017-06204-0]
- 30. Biosensor Time Response and Noise Models That Take ... [https://www.mdpi.com/2673-4591/58/1/51]
- 31. Perspectives on systematic optimization of ultrasensitive ... [https://pmc.ncbi.nlm.nih.gov/articles/PMC11403992/]
- 32. What are response surface designs, central composite ... [https://support.minitab.com/en-us/minitab/help-and-how-to/statistical-modeling/doe/supporting-topics/response-surface-designs/response-surface-central-composite-and-box-behnken-designs/]
- 33. Central Composite Design vs. Box-Behnken Design [https://experimentaldesignhub.com/blog/doe_11/]
- 34. Box-Behnken Design - an overview [https://www.sciencedirect.com/topics/engineering/box-behnken-design]
- 35. A Comparison of Central Composite Design and Taguchi ... [https://pmc.ncbi.nlm.nih.gov/articles/PMC4167450/]
- 36. All Topic Response Surface Methodology [https://www.theopeneducator.com/doe/Response-Surface-Methodology/All-Topic-Response-Surface-Methodology]
- 37. Lesson 11: Response Surface Methods and Designs [https://online.stat.psu.edu/stat503/book/export/html/681]
- 38. Strategies in the optimization of DNA hybridization conditions ... [https://pmc.ncbi.nlm.nih.gov/articles/PMC10286818/]
- 39. Electrochemical DNA Biosensor for the Detection of ... [https://www.mdpi.com/2674-1164/4/1/12]
- 40. Response Surface Methodology for the Optimisation of Electrochemical Biosensors for Heavy Metals Detection [https://www.mdpi.com/2079-6374/9/1/26]
- 41. Flow-Through Amperometric Biosensor System Based on Functionalized Aryl Derivative of Phenothiazine and PAMAM-Calix-Dendrimers for the Determination of Uric Acid - PMC [https://pmc.ncbi.nlm.nih.gov/articles/PMC10968175/]
- 42. Biosensor based on self-assembling acetylcholinesterase on carbon nanotubes for flow injection/amperometric detection of organophosphate pesticides and nerve agents - PubMed [https://pubmed.ncbi.nlm.nih.gov/16448058/]
- 43. Novel Amperometric Sensor Based on Glassy Graphene for Flow Injection Analysis [https://www.mdpi.com/1424-8220/25/8/2454]
- 44. Optimization of process parameters using response ... [https://www.sciencedirect.com/science/article/abs/pii/S0360319920334121]
- 45. A Study of the Response Surface Methodology Model with ... [https://www.mdpi.com/2571-5577/8/4/99]
- 46. Importance of Using Modern Regression Analysis for ... [https://www.mdpi.com/2076-3417/15/13/7206]
- 47. A Theoretical Framework for the Design and Optimization ... [https://www.sciencedirect.com/science/article/abs/pii/S305047592500898X]
- 48. Interpret the key results for 3D Surface Plot - Support - Minitab [https://support.minitab.com/en-us/minitab/help-and-how-to/graphs/3d-surface-plot/interpret-the-results/key-results/]
- 49. Response Surface Designs (Part 2) — Data Analysis and ... [https://www.chromatographyonline.com/view/response-surface-designs-part-2-data-analysis-and-multiresponse-optimization]
- 50. Response Surface Methodology in Operational Research [https://airacad.com/response-surface-methodology-in-operational-research/]
- 51. Response Surface Methodology Optimization of Time ... [https://www.mdpi.com/2072-6651/17/5/248]
- 52. Response surface methodology box-behnken design to ... [https://www.sciencedirect.com/science/article/pii/S1872204023000907]
- 53. v25.0 » Tutorials » Response Surface [https://statease.com/docs/latest/tutorials/multifactor-rsm/]
- 54. Algorithm assisted comprehensive optimization of SPR ... [https://www.sciencedirect.com/science/article/abs/pii/S0956566325007225]
- 55. Response Surface Methodology for Optimizing the Design ... [https://www.mdpi.com/2072-666X/16/11/1281]
- 56. Application of the ANOVA method in the optimization of a ... [https://www.sciencedirect.com/science/article/pii/S2352484722016377]
- 57. AI-Enhanced Surface Functionalization in Biosensors [https://www.sciencedirect.com/science/article/abs/pii/S0165993625003887]
- 58. Biosensors, Volume 15, Issue 9 (September 2025) [https://www.mdpi.com/2079-6374/15/9]
- 59. Optimized hydrogel environment for a tyrosinase-based ... [https://pubmed.ncbi.nlm.nih.gov/41297449/]
- 60. Design optimization of high-sensitivity PCF-SPR biosensor ... [https://journals.plos.org/plosone/article?id=10.1371/journal.pone.0330944]
- 61. A Closer Look at Biosensors: A Practical Tutorial for ... [https://www.spectroscopyonline.com/view/a-closer-look-at-biosensors-a-practical-tutorial-for-spectroscopists]
- 62. The Role of Artificial Intelligence in Advancing Biosensor ... [https://pmc.ncbi.nlm.nih.gov/articles/PMC12392873/]
- 63. Response Methodology Optimization and Artificial Neural ... [https://pmc.ncbi.nlm.nih.gov/articles/PMC10343529/]
- 64. How to Perform a Lack of Fit Test in R (Step-by-Step) [https://www.statology.org/lack-of-fit-test-in-r/]
- 65. How to Perform a Lack of Fit Test in R [https://www.geeksforgeeks.org/r-language/how-to-perform-a-lack-of-fit-test-in-r/]
- 66. Utilization of Response Surface Methodology in ... [https://www.mdpi.com/2073-4344/12/9/1052]
- 67. Modeling and optimization I: Usability of response surface ... [https://www.sciencedirect.com/science/article/abs/pii/S0260877405007843]
- 68. Response Surface Methodology to Optimize the Expression ... [https://pmc.ncbi.nlm.nih.gov/articles/PMC10203180/]
- 69. Validation parameters for a novel biosensor assay which ... [https://www.sciencedirect.com/science/article/abs/pii/S0022175997001403]
- 70. Response Surface Modeling [https://sixsigmastudyguide.com/response-surface/]
- 71. Review Biosensors and lateral flow immunoassays [https://www.sciencedirect.com/science/article/abs/pii/S0009898125001512]
- 72. Optimization and comparative modelling of RSM and ANN ... [https://www.sciencedirect.com/science/article/abs/pii/S0045653525006575]
- 73. Comparison of an Artificial Neural Network and a ... [https://pmc.ncbi.nlm.nih.gov/articles/PMC9740868/]
- 74. ANN outperforms RSM and CNN in predictive accuracy [https://www.sciencedirect.com/science/article/abs/pii/S2213343725036942]
- 75. Response Surface Methodology and Artificial Neural ... [https://www.mdpi.com/2071-1050/14/10/6130]
- 76. Optimization of energy consumption in the gas refinery ... [https://www.nature.com/articles/s41598-025-22629-4]
- 77. Optimizing electricity consumption in direct reduction iron ... [https://www.nature.com/articles/s41598-025-18854-6]
- 78. Predictive modeling of thrust force in constrained turning ... [https://ojs.southfloridapublishing.com/ojs/index.php/jdev/article/view/5911]
- 79. Hybrid RSM–ANN Modeling for Optimization of ... [https://www.mdpi.com/2073-4441/17/20/3003]
- 80. Comparison of a Response Surface Method and Artificial ... [https://www.mdpi.com/2076-3417/10/18/6277]
- 81. Artificial intelligence based prediction and multi-objective ... [https://www.nature.com/articles/s41598-025-87640-1]
- 82. Machine‐Learning‐Aided Advanced Electrochemical ... [https://pmc.ncbi.nlm.nih.gov/articles/PMC12369699/]
- 83. Electrochemical and Optical Biosensors: Innovation in ... [https://www.preprints.org/manuscript/202506.0107/v1]
- 84. On the sensing performance improvement in SPR ... [https://www.nature.com/articles/s41598-025-14131-8]