Validating Biosensor Performance: A Strategic Guide to Chromatographic Correlation for Researchers
This article provides a comprehensive framework for researchers and drug development professionals on validating biosensor results using chromatography methods.
Validating Biosensor Performance: A Strategic Guide to Chromatographic Correlation for Researchers
Abstract
This article provides a comprehensive framework for researchers and drug development professionals on validating biosensor results using chromatography methods. It covers the foundational principles of biosensor technology and the gold-standard status of chromatographic techniques. The guide details methodological approaches for parallel testing, explores common challenges and optimization strategies using tools like Design of Experiments (DoE), and establishes robust protocols for statistical comparison and validation. By synthesizing current research and practical case studies, this resource aims to empower scientists to build confidence in their biosensor data, accelerating their integration into biomedical research and clinical applications.
Biosensors and Chromatography: Understanding the Fundamentals and Need for Validation
What are Biosensors? Principles of Biological Recognition and Signal Transduction
A biosensor is an analytical device that integrates a biological recognition element with a physicochemical transducer to detect a chemical substance [1]. This combination allows for the sensitive and selective detection of specific analytes, ranging from simple ions to complex proteins, cells, and pathogens. Biosensors have become indispensable tools across numerous fields, including biomedical diagnosis, environmental monitoring, food safety control, drug discovery, and bioprocess engineering [2] [3]. The fundamental principle governing all biosensors involves a bioreceptor that specifically interacts with the target analyte, leading to a change that a transducer converts into a measurable signal, typically optical or electrical, which is then processed for user interpretation [2].
The history of biosensors dates back to 1906 with M. Cremer's early work, but the field truly began with Leland C. Clark, Jr.'s development of the oxygen electrode (Clark electrode) in 1956, earning him the title "father of biosensors" [2]. His subsequent demonstration of an amperometric enzyme electrode for glucose detection in 1962 paved the way for the first commercial biosensor developed by Yellow Spring Instruments (YSI) in 1975 [2]. Since these early innovations, the field has expanded dramatically, evolving into a multidisciplinary area of research that bridges principles from physics, chemistry, biology, micro/nano-technology, and electronics [2].
Table 1: Key Historical Developments in Biosensors
| Year | Development | Key Innovator/Company |
|---|---|---|
| 1956 | First 'true' biosensor (Oxygen electrode) | Leland C. Clark, Jr. |
| 1962 | Amperometric enzyme electrode for glucose | Leland C. Clark |
| 1975 | First commercial biosensor | Yellow Spring Instruments (YSI) |
| 1983 | Surface Plasmon Resonance (SPR) immunosensor | Liedberg et al. |
| 1992 | Handheld blood biosensor | i-STAT |
Core Principles and Components of a Biosensor
A typical biosensor consists of four main components, working in sequence to detect and report the presence of an analyte.
The Bioreceptor
The bioreceptor is a biological or biomimetic element that provides the specificity for the biosensor. It is a molecule that specifically recognizes the analyte in a sample, even among other admixtures and contaminants [2] [4]. This bio-recognition event generates a signal in the form of light, heat, pH change, charge, or mass change [2]. Common types of bioreceptors include:
- Enzymes: Utilize specific binding capabilities and catalytic activity. The analyte may be converted into a detectable product, inhibit the enzyme's activity, or modify the enzyme's properties [1].
- Antibodies/Antigens: Exploit the highly specific binding affinity of an antibody for its target antigen, analogous to a lock and key fit [1].
- Nucleic Acids (DNA/RNA): Used in genosensors (based on complementary base pairing) or aptasensors (using synthetic aptamers that fold to recognize targets) [1] [5].
- Whole Cells & Tissues: Utilize microorganisms, organelles, or entire tissues as integrated sensing elements that can respond to stimulants like stress, toxicity, or metabolic changes [1] [5].
- Artificial Binding Proteins: Engineered protein scaffolds that mimic the binding function of antibodies but are smaller, more stable, and cheaper to produce [1].
The Transducer
The transducer is the element that converts the biological recognition event into a measurable signal [2]. This process of energy conversion is known as signalisation [2]. The primary transduction methods can be categorized as follows:
- Electrochemical: Measures changes in current (amperometric), potential (potentiometric), or impedance (impedimetric) resulting from the bio-recognition event [3]. These are dominant in clinical diagnostics due to their simplicity and sensitivity [3].
- Optical: Detects changes in light properties, such as absorbance, fluorescence, luminescence, or refractive index (e.g., Surface Plasmon Resonance) [4] [3]. These are favored in research for their superior multiplexing capabilities [3].
- Mechanical/Acoustic: Measures changes in mass or viscoelastic properties on a surface, often using piezoelectric crystals or microcantilevers, which results in a resonance frequency shift [3] [6].
- Thermal: Monitors the heat exchange (enthalpy change) produced by biochemical reactions [3].
Electronics and Display
This subsystem processes the transduced signal for interpretation. It includes complex electronic circuitry that performs signal conditioning—such as amplification and conversion from analog to digital form [2] [1]. The display unit then presents the results in a user-friendly format, such as a numeric, graphic, or tabular readout on a liquid crystal display [2]. This part often constitutes the most expensive component of the sensor device, though advancements in integrated systems, including CMOS-based microsensors, are helping to reduce costs and size [1].
Diagram 1: Fundamental Biosensor Architecture
Critical Performance Characteristics of Biosensors
The utility of a biosensor is gauged by several key performance characteristics, which must be optimized for reliable operation [2].
- Selectivity: This is the most critical feature. It is the ability of the bioreceptor to detect a specific analyte in a sample containing other admixtures and contaminants without interference [2]. For example, an antibody should interact only with its target antigen.
- Sensitivity and Limit of Detection (LOD): The sensitivity refers to the minimum amount of analyte that can be reliably detected by the biosensor. In many medical applications, biosensors are required to detect concentrations as low as nanograms or even femtograms per milliliter [2].
- Reproducibility: This is the ability of the biosensor to generate identical responses for a duplicated experimental setup. It encompasses both precision (the ability to produce alike results every time a sample is measured) and accuracy (the capacity to provide a mean value close to the true value) [2].
- Stability: This refers to the degree of susceptibility to ambient disturbances (e.g., temperature fluctuations) that can cause signal drift. It is crucial for applications requiring long incubation or continuous monitoring. Stability is influenced by the degradation of the biological element over time and the affinity of the bioreceptor for the analyte [2].
- Linearity: This attribute indicates the accuracy of the measured response for a set of measurements to a straight line, defined by y=mc (where c is the analyte concentration, y is the output, and m is the sensitivity). The linear range is the concentration range over which the biosensor response changes linearly, and it is associated with the sensor's resolution [2].
Table 2: Key Performance Characteristics of Biosensors
| Characteristic | Definition | Importance |
|---|---|---|
| Selectivity | Ability to detect a specific analyte in a complex sample matrix. | Prevents false positives from interfering substances. |
| Sensitivity (LOD) | Lowest concentration of analyte that can be reliably detected. | Enables detection of trace-level biomarkers or contaminants. |
| Reproducibility | Ability to generate identical responses for a duplicated setup. | Ensures reliability and robustness of the measurements. |
| Stability | Degree of susceptibility to ambient disturbances and signal drift. | Critical for long-term monitoring and shelf-life of the device. |
| Linearity | Accuracy of the response to a straight line over a concentration range. | Allows for accurate quantification of analyte concentration. |
Biosensor Validation: A Comparison with Chromatography Methods
Validating biosensor performance against established analytical techniques is a critical step in confirming their reliability, especially for environmental or clinical application [7] [5]. Conventional methods like high-performance liquid chromatography (HPLC) and gas chromatography (GC), often coupled with mass spectrometry (MS), are considered gold standards due to their high accuracy, sensitivity, and reliability [5]. However, these techniques have limitations: they require high-cost instruments, complex sample preparation, time-consuming protocols, and labor-intensive processes, hindering real-time, in-situ monitoring [5].
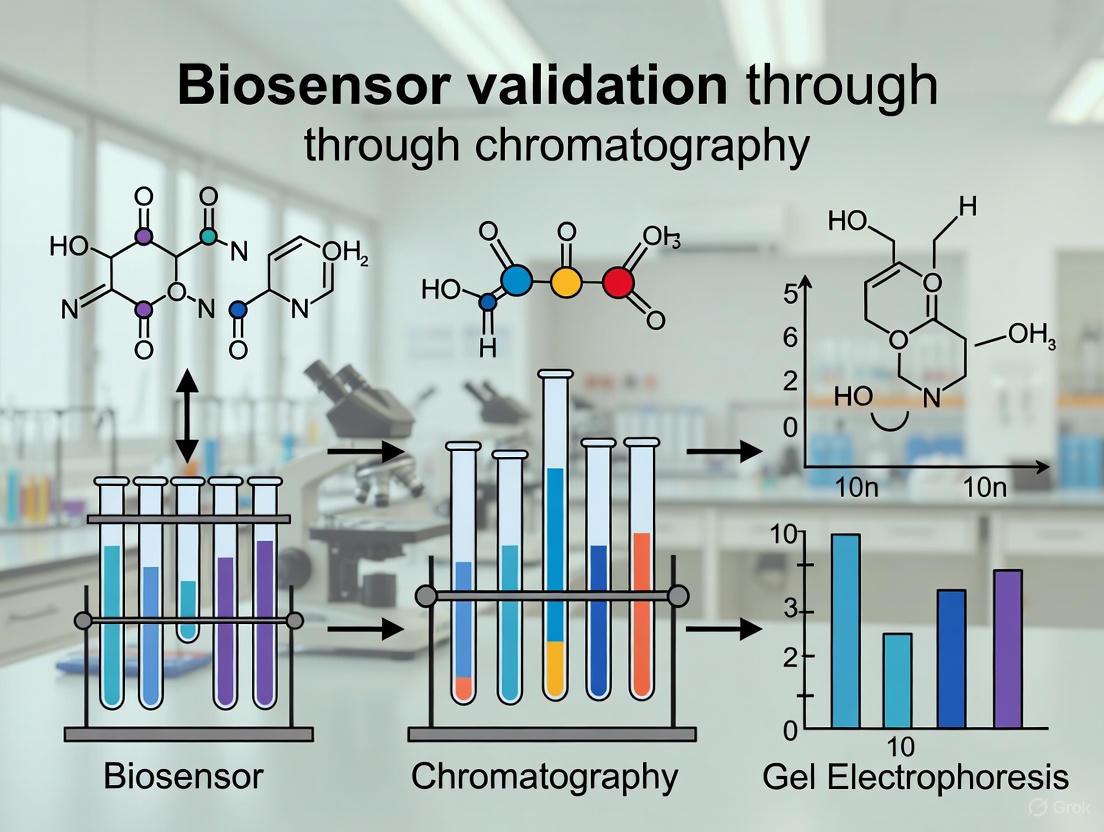
Biosensors offer a promising alternative, providing advantages in speed, cost, portability, and suitability for on-site testing [5]. A key study demonstrates this validation paradigm, where an enzymatic biosensor was compared with liquid chromatography for monitoring organophosphorus pesticides and carbaryl in water [7]. The biosensor provided a rapid, cumulative signal for the total pesticide content in a sample, successfully distinguishing between water containing 3.9 μg/L and 10.3 μg/L of total target pesticides [7]. This "total signal" could serve as a positive indication of contamination, triggering further, more specific analysis if needed. The chromatographic method, in a subsequent step, was used to unequivocally confirm and quantify the individual pesticides and their metabolites [7]. This hybrid approach leverages the speed and convenience of the biosensor for screening with the high specificity of chromatography for confirmation.
Diagram 2: Biosensor and Chromatography Validation Workflow
Experimental Protocol: Biosensor Validation for Pesticide Detection
The following methodology outlines the parallel analysis of water samples using biosensors and liquid chromatography, as derived from the validation study [7].
1. Biosensor Setup and Operation:
- Bioreceptor: The enzyme acetylcholinesterase (AChE) is immobilized on the transducer surface.
- Transducer Principle: The enzymatic reaction of AChE with its substrate (acetylthiocholine chloride) produces thiocholine, which dimerizes to a disulfide compound, generating a measurable electrochemical signal.
- Measurement: Organophosphorus pesticides and carbaryl act as AChE inhibitors. The sample is introduced to the biosensor, and the degree of enzyme inhibition is measured, which is proportional to the concentration of the pesticides present.
- Output: The biosensor provides a total signal corresponding to the cumulative inhibitory effect of all present pesticides.
2. Liquid Chromatography Analysis:
- Sample Preparation: The same water samples may undergo liquid-liquid extraction or solid-phase extraction to concentrate the analytes.
- Chromatographic Separation: The extract is injected into an HPLC system. A reversed-phase C18 column is typically used, and the pesticides are separated using a gradient of water and an organic solvent like acetonitrile or methanol as the mobile phase.
- Detection: A diode-array detector (DAD) or mass spectrometer (MS) is used for detection. The DAD captures the UV spectrum of each eluting compound, providing a unique fingerprint for confirmation [7].
- Quantification: The concentration of each individual pesticide and its metabolites is determined by comparing the peak area or mass spectral response to those of known standards.
3. Data Correlation:
- The total signal from the biosensor is correlated with the sum of concentrations of target pesticides obtained from HPLC.
- Statistical analysis (e.g., linear regression) is performed to establish the relationship between the two methods and determine the biosensor's accuracy and working range.
Advanced Developments and Future Perspectives
The field of biosensing is continuously evolving, driven by advancements in nanotechnology, material science, and data analytics.
The Role of Nanomaterials and Miniaturization
Reducing the size of biosensors to the micro- or nano-scale has proven beneficial for improving the signal-to-noise ratio and enabling the use of smaller sample volumes [2]. Nanomaterials, such as gold nanoparticles, graphene, and quantum dots, are extensively used to enhance sensitivity by increasing the effective surface area for bioreceptor immobilization and improving electron transfer in electrochemical sensors or optical properties in optical sensors [3] [8]. For instance, colloidal gold nanoparticles were the foundation for many rapid immunochromatographic tests (lateral flow assays) used globally during the COVID-19 pandemic [8].
CRISPR-Cas Integration
The convergence of CRISPR-Cas technology with biosensing presents a powerful new frontier for diagnostics. CRISPR systems can be programmed to detect specific nucleic acid sequences with exceptional specificity. When combined with nanomaterials for signal enhancement (leveraging catalytic, colorimetric, or fluorescent properties), CRISPR-based biosensors offer massive potential for advancing point-of-care clinical diagnostics [8].
Artificial Intelligence and Deep Learning
A significant challenge in biosensing is improving accuracy and reducing false results. Artificial intelligence (AI), particularly deep learning, is being applied to address this. One approach uses a theory-guided recurrent neural network (TGRNN) to classify the dynamic response of a biosensor, such as a DNA-functionalized cantilever detecting microRNA [6]. By training the model with data that is consistent with the theoretical principles of surface-based binding, researchers have achieved high prediction accuracy (~98.5%) and reduced the likelihood of false-positive and false-negative results, even when using only the initial transient response, thereby speeding up the assay time [6].
Systematic Optimization via Design of Experiments (DoE)
Optimizing the many parameters in biosensor fabrication (e.g., bioreceptor density, immobilization chemistry, detection conditions) is complex. The Design of Experiments (DoE) chemometric tool provides a systematic, statistically sound methodology for this purpose, moving beyond inefficient one-variable-at-a-time approaches [9]. DoE considers the interaction between variables and allows for the construction of a data-driven model to find the global optimum conditions, which is crucial for developing reliable and ultrasensitive biosensors for point-of-care diagnostics [9].
The Scientist's Toolkit: Essential Research Reagents and Materials
Table 3: Key Reagents and Materials for Biosensor Research and Development
| Item | Function/Application | Example Use Case |
|---|---|---|
| Acetylcholinesterase (AChE) | Enzyme bioreceptor for pesticide detection. | Inhibitor-based detection of organophosphates and carbamates in environmental water [7]. |
| Monoclonal Antibodies | High-specificity bioreceptors for immunosensors. | Capture and detection of protein biomarkers like IL-17A or C-Reactive Protein (CRP) in serum [4]. |
| DNA/Aptamer Probes | Nucleic acid-based bioreceptors for genosensors/aptasensors. | Detection of microRNA (e.g., let-7a) using thiolated-DNA probes on a cantilever or electrode surface [6] [1]. |
| Gold Nanoparticles | Nanomaterial for signal enhancement and labeling. | Colorimetric signal generation in lateral flow immunoassays; enhancing surface plasmon resonance [8]. |
| Isotype Control Antibodies | Critical negative control reagents for immunoassays. | Differentiating specific binding from nonspecific binding (NSB) in label-free optical biosensors [4]. |
| Photonic Ring Resonator (PhRR) Chips | Label-free optical transducer platform. | Silicon nitride chips fabricated via CMOS processes for highly sensitive refractive index-based detection [4]. |
| Screen-Printed Electrodes (SPEs) | Low-cost, disposable electrochemical transducer platform. | Base for amperometric or impedimetric biosensors; suitable for point-of-care testing [3]. |
Liquid chromatography techniques, particularly High-Performance Liquid Chromatography (HPLC) and Liquid Chromatography-Tandem Mass Spectrometry (LC-MS/MS), represent the cornerstone of modern quantitative bioanalysis. These methods provide the rigorous analytical validation necessary for pharmaceutical development, clinical monitoring, and environmental analysis. Within the context of emerging biosensor technologies, chromatographic methods serve as the reference standard for validating novel detection platforms, offering unparalleled specificity, sensitivity, and precision. The fundamental principle underlying chromatography's gold standard status is its physical separation of analytes prior to detection, which effectively eliminates matrix interference and enables definitive identification and quantification of target compounds in complex biological matrices. This article provides a comprehensive comparison of LC-MS/MS and HPLC methodologies, detailing their operational principles, performance characteristics, and essential role in verifying the accuracy of rapid screening technologies such as biosensors.
Fundamental Principles and Instrumentation
HPLC operates by pumping a liquid sample and mobile phase at high pressure through a column packed with solid adsorbent material, separating components based on their differential partitioning between the mobile and stationary phases. Detection is typically achieved via ultraviolet-visible (UV-Vis), photodiode array (PDA), or fluorescence detectors, which identify compounds based on their optical properties. The technique excels in resolving complex mixtures but requires analytes to possess specific chromophores or fluorophores for detection [10].
LC-MS/MS represents a more advanced hyphenated technique that couples the separation power of liquid chromatography with the exceptional detection capabilities of tandem mass spectrometry. After chromatographic separation, analytes are ionized (commonly via electrospray ionization), separated in the first mass analyzer based on their mass-to-charge ratio, fragmented through collision-induced dissociation, and the resulting product ions are analyzed in the second mass analyzer. This two-stage mass analysis provides structural information and significantly enhances specificity, making it ideal for complex matrices [11] [12].
Comparative Analytical Performance
The table below summarizes key performance parameters for HPLC and LC-MS/MS across critical analytical metrics, illustrating their respective strengths and appropriate applications.
Table 1: Performance Comparison Between HPLC and LC-MS/MS
| Analytical Parameter | HPLC with UV/PDA Detection | LC-MS/MS |
|---|---|---|
| Typical Sensitivity | ng to µg range | pg to fg range [11] [13] |
| Specificity | Moderate (based on retention time and spectral matching) | High (based on retention time, precursor ion, and fragment ions) [11] |
| Analysis Speed | Moderate to Fast (5-30 minutes) | Fast (2-8 minutes) [11] [13] |
| Matrix Effect Tolerance | Lower (susceptible to co-eluting interferents) | Higher (MRM overcomes many interferents) [10] |
| Structural Information | Limited (spectral libraries for identification) | Comprehensive (fragmentation patterns for structural elucidation) [12] |
| Applicability | Compounds with chromophores/fluorophores | Virtually all ionizable molecules [10] |
| Cost and Operational Complexity | Lower | Higher |
The evolution from HPLC to UPLC (Ultra-Performance Liquid Chromatography) with sub-2μm particles has further enhanced separation efficiency, reducing analysis times to 2-5 minutes per sample while maintaining resolution [12]. LC-MS/MS particularly excels in targeted quantitative applications using Multiple Reaction Monitoring (MRM) mode, where it monitors specific precursor-product ion transitions for each analyte, providing exceptional selectivity even in challenging matrices like plasma, serum, and tissue homogenates [11] [13].
Experimental Protocols and Methodologies
Standard LC-MS/MS Protocol for Antimicrobial Analysis in Serum
The following protocol, adapted from a validated method for detecting antimicrobials in human serum, exemplifies the rigorous approach required for reliable quantitative analysis [13]:
Sample Preparation (Solid Phase Extraction):
- Pipette 200 μL of serum sample into a microcentrifuge tube
- Add 10 μL of internal standard solution (stable isotope-labeled analogs)
- Add 190 μL of phosphoric acid for protein precipitation
- Vortex mixtures vigorously for 30 seconds
- Centrifuge at 13,000 × g for 10 minutes at 4°C
- Transfer 300 μL of supernatant to preconditioned Oasis HLB μElution SPE cartridge
- Wash twice with 150 μL water
- Elute with 150 μL of 60% (v/v) acetonitrile in water
- Collect eluate in clean test tube for analysis
Chromatographic Conditions:
- Column: CORTECS T3 (100 × 2.1 mm, 2.7 μm)
- Mobile Phase: A) 0.1% formic acid in water; B) 0.1% formic acid in acetonitrile
- Gradient: 5% B (0 min) → 60% B (5 min) → 90% B (5.5 min, hold 1 min) → 5% B (6.6-8 min)
- Flow Rate: 0.3 mL/min
- Column Temperature: 35°C
- Injection Volume: 2 μL
Mass Spectrometric Parameters:
- Ionization: Electrospray Ionization (ESI) positive mode
- Ion Spray Voltage: 4500 V
- Source Temperature: 500°C
- Curtain Gas: 20 psi
- Nebulizer Gas (GS1): 50 psi
- Auxiliary Gas (GS2): 50 psi
- Detection: Scheduled Multiple Reaction Monitoring (sMRM)
- Data Acquisition: Analyst 1.6.3 software
- Data Processing: MultiQuant software (version 3.0.2)
This method achieved excellent linearity (R² > 0.999) across 0.5-50 ng/mL range, with inter- and intra-assay precision <12.0% and accuracy of 86.1-109.0% for nine antimicrobial compounds [13].
HPLC Protocol for Traditional Medicine Quality Control
For quality control of complex natural products like Lonicera japonica Thunb., the following HPLC method provides reliable quantification of major active components [10]:
Sample Preparation:
- Accurately weigh 0.5 g of powdered plant material
- Add 50 mL of 70% methanol and extract via ultrasonication for 30 minutes
- Centrifuge at 5000 × g for 10 minutes
- Filter supernatant through 0.22 μm membrane prior to injection
Chromatographic Conditions:
- Column: Waters ACQUITY UPLC HSS T3 (2.1 × 50 mm, 1.8 μm)
- Mobile Phase: 0.1% formic acid in water (A) and acetonitrile (B) with gradient elution
- Flow Rate: 0.4 mL/min
- Column Temperature: 40°C
- Detection: PDA detector (330 nm for chlorogenic acid, 350 nm for flavonoids)
- Injection Volume: 2 μL
This method successfully quantified eleven analytes with limits of quantification reaching 0.005-0.56 μg/mL, demonstrating excellent linearity (regression coefficients >0.9991), recovery (98.78-105.13%), and precision (RSD < 3.91%) [10].
Chromatography as a Validation Tool for Biosensor Technologies
Correlation Studies Between Biosensor and Chromatographic Methods
The validation of biosensor performance against chromatographic reference methods is essential for establishing their reliability in analytical applications. The table below illustrates representative correlation data between biosensor platforms and their corresponding chromatographic validation methods.
Table 2: Biosensor Validation Against Chromatographic Methods
| Biosensor Type | Target Analyte | Chromatographic Validation Method | Correlation Coefficient (R²) | Reference |
|---|---|---|---|---|
| SPR-based biosensor | Chlorogenic acid (3-CQA) | UPLC-PDA-QDa | 0.9991 (for quantification) | [10] |
| Electrochemical DNA biosensor | Leuprolide | LC-MS/MS | Comparable results (full validation) | [11] |
| Whole-cell biosensor (E. coli) | Pyrethroid insecticide | LC-MS/MS | Detection limit: 3 ng/mL | [5] |
| Enzyme-based biosensor | Various pesticides | HPLC-UV | >0.995 for standard curves | [5] |
Surface Plasmon Resonance (SPR) biosensors have demonstrated particular utility in drug discovery applications, enabling real-time monitoring of biomolecular interactions without labeling requirements. In one study, SPR was employed to investigate the inhibitory activity of chlorogenic acid (3-CQA) from Lonicera japonica Thunb. against TNF-α, revealing a binding affinity (KD) of 1.38 × 10⁻⁶ M. These interaction results were subsequently validated using UPLC-MS quantification, confirming both the binding affinity and concentration of active compounds [10].
Addressing Biosensor Limitations Through Chromatographic Validation
Chromatographic methods play a crucial role in identifying and overcoming key limitations of biosensor technologies, including:
Matrix Interference: Biosensors frequently suffer from nonspecific binding and matrix effects in complex samples. LC-MS/MS validation helps identify these interferences through precise separation and detection of individual components [5]. For instance, in therapeutic drug monitoring of leuprolide, an LC-MS/MS method with solid phase microextraction (MEPS) clean-up achieved a lower limit of quantification of 0.0500 ng/mL in human plasma, significantly surpassing the performance of immunoassays which suffer from cross-reactivity issues [11].
Specificity Challenges: While biosensors utilizing enzymes, antibodies, or aptamers offer targeted recognition, they may exhibit cross-reactivity with structurally similar compounds. Chromatographic separation prior to detection definitively resolves individual analytes, as demonstrated in the simultaneous determination of nine antimicrobials in pregnant women's serum, where LC-MS/MS identified specific compounds that immunoassays could not distinguish [13].
Quantification Accuracy: Biosensor response can be affected by environmental conditions, sensor drift, and fouling. Chromatographic methods provide absolute quantification through calibration with certified reference materials and internal standards, such as stable isotope-labeled analogs in LC-MS/MS, which correct for extraction efficiency and ionization variations [11] [13].
Essential Research Reagent Solutions
The successful implementation of chromatographic methods requires specific high-quality reagents and materials. The following table details essential research solutions for method development and analysis.
Table 3: Essential Research Reagent Solutions for Chromatographic Analysis
| Reagent/Material | Function | Application Example |
|---|---|---|
| Stable Isotope-Labeled Internal Standards | Correct for variability in extraction and ionization; enable precise quantification | Leuprolide-¹³C₆-¹⁵N for LC-MS/MS assay of leuprolide in plasma [11] |
| Solid Phase Extraction Cartridges (Oasis HLB) | Sample clean-up and analyte preconcentration; remove matrix interferents | Extraction of antimicrobials from serum samples [13] |
| UPLC/HPLC Columns (C18, HSS T3) | Analytical separation of compounds based on hydrophobicity | Waters ACQUITY UPLC HSS T3 for separation of phenolic acids and flavonoids [10] |
| Mass Spectrometry Grade Solvents | High purity mobile phase components; minimize background noise and contamination | LC-MS grade acetonitrile and formic acid for antimicrobial analysis [13] |
| Ion Pairing Reagents (Formic Acid, Ammonium Acetate) | Enhance ionization efficiency in MS; improve chromatographic peak shape | 0.1% formic acid in mobile phase for positive ion mode ESI [13] |
Methodological Workflows and Technological Relationships
The following diagram illustrates the integrated workflow for validating biosensor results using chromatographic reference methods, highlighting the complementary nature of these technologies.
Biosensor Validation Workflow
The complementary relationship between emerging biosensor technologies and established chromatographic methods is further illustrated in the following diagram, which shows how these approaches serve different but interconnected roles in analytical science.
Analytical Technique Complementarity
Chromatographic methods, particularly LC-MS/MS and HPLC, maintain their position as gold standard techniques for quantitative analysis in pharmaceutical, clinical, and environmental applications. Their unparalleled specificity, sensitivity, and precision establish the necessary reference point for validating emerging biosensor technologies. While biosensors offer compelling advantages in speed, portability, and cost-effectiveness for rapid screening, they ultimately require correlation with chromatographic standards to verify analytical accuracy, especially in complex matrices. The future of bioanalysis lies not in the displacement of chromatography by biosensors, but in their strategic integration—utilizing biosensors for high-throughput preliminary screening and chromatographic methods for definitive confirmation and validation. This synergistic approach leverages the respective strengths of each technology, advancing analytical capabilities while maintaining the rigorous standards demanded by regulatory science and precision medicine.
Biosensors are compact analytical devices that transduce a biological response into a quantifiable signal, playing an increasingly vital role in environmental monitoring, point-of-care diagnostics, and drug development [14]. These devices leverage various biorecognition elements, including enzymes, antibodies, and nucleic acids, coupled with transducing elements such as electrochemical, optical, or piezoelectric systems to detect target analytes [14]. Despite their promise for portability and rapid analysis, biosensors face significant challenges in accuracy, specificity, and reproducibility that must be addressed through rigorous validation against established reference methods [7] [15] [6].
Liquid chromatography, particularly high-performance liquid chromatography (HPLC) and ultra-high-performance liquid chromatography (UPLC), represents the gold standard for analytical quantification in many fields. These methods provide high separation efficiency, sensitivity, and specificity through sophisticated physical separation of analytes prior to detection [16] [10]. The validation of biosensor performance against chromatographic methods is therefore critical for establishing analytical credibility, especially when biosensors are intended for deployment in field settings or point-of-care scenarios where conventional laboratory instrumentation is unavailable [7].
This guide objectively compares the performance characteristics of biosensor and chromatography platforms, providing researchers with experimental data and methodologies for conducting rigorous validation studies. By examining the strengths and limitations of each approach across multiple application domains, we aim to establish a framework for ensuring data reliability across analytical platforms.
Performance Comparison: Biosensors vs. Chromatographic Methods
Quantitative Performance Metrics
The table below summarizes key performance characteristics of biosensor and chromatographic methods based on experimental data from comparative studies:
Table 1: Performance comparison between biosensor and chromatographic methods
| Performance Characteristic | Biosensor Methods | Chromatographic Methods | Comparative Experimental Findings |
|---|---|---|---|
| Detection Limit | Varies by platform: Enzymatic biosensors detected organophosphorus pesticides at 0.1-5.7 μg/L [7] | Generally superior: UPLC-MS methods achieved LOD of 0.005-0.56 μg/mL for traditional Chinese medicine compounds [10] | Biosensors provided adequate detection for screening but generally higher LOD than chromatographic methods |
| Analysis Time | Minutes to <1 hour with potential for significant reduction using initial transient response [6] | Typically 10-30 minutes per sample, with complex separations requiring longer [16] | Biosensors demonstrated 3-5x faster analysis, with AI-guided approaches reducing time delay using early dynamic response [6] |
| Reproducibility | Meeting point-of-care standards requires optimized manufacturing and immobilization techniques [15] | High reproducibility with RSD typically <5% for retention time and peak area [10] | Semiconductor-manufactured biosensors with streptavidin biomediators showed highest reproducibility approaching chromatographic standards [15] |
| Multiplexing Capability | Strong potential for simultaneous detection of multiple analytes [14] | Limited to number of separable compounds with distinct retention times [16] | Biosensors demonstrated distinction between 3.9 and 10.3 μg/L of total target pesticides in water samples [7] |
| Specificity | High with optimized biorecognition elements; may cross-react with structurally similar compounds [14] [17] | Excellent with proper method development; diode-array detection provides spectral confirmation [7] [16] | Chromatography provided unequivocal confirmation of metabolites via UV spectra; biosensors showed positive indication of target class [7] |
Application-Specific Performance
The relative performance of these analytical platforms varies significantly across application domains, as evidenced by the following experimental findings:
Table 2: Application-specific performance comparison
| Application Domain | Biosensor Performance | Chromatography Performance | Validation Outcomes |
|---|---|---|---|
| Pesticide Monitoring (Environmental) | Enzymatic biosensor based on acetylthiocholine chloride reaction detected organophosphorus pesticides and carbaryl at 0.1-5.7 μg/L [7] | Liquid chromatography with diode-array detection provided unequivocal confirmation of various oxometabolites from UV spectra [7] | Biosensor signals correlated with chromatographic results (r = 0.89); suitable for screening with confirmation by chromatography [7] |
| Infectious Disease Diagnostics | Broad-spectrum biosensors using conserved-site PCR identified diverse microorganisms; potential for point-of-care use [17] | LC-MS/MS methods provide definitive quantification but require complex sample preparation and longer analysis time [17] | Biosensors showed 92-98% concordance with culture methods for common pathogens; limitations with complex microbiota [17] |
| Traditional Medicine Analysis | SPR biosensors measured TNF-α binding affinity (KD = 1.38 × 10⁻⁶ M for 3-CQA) [10] | UPLC-PDA and UPLC-QDa methods validated with excellent linearity (R² > 0.9991) and recovery (98.78-105.13%) [10] | SPR enabled rapid binding assessment; UPLC provided comprehensive quantification of multiple active compounds [10] |
| MicroRNA Detection | Cantilever biosensors detected let-7a from nM to fM range; AI-guided classification achieved 98.5% accuracy [6] | HPLC with fluorescence detection typically limited to nM range without pre-concentration | Biosensors showed superior sensitivity for low-abundance nucleic acids; chromatography provided better quantification at higher concentrations |
Experimental Protocols for Method Validation
Side-by-Side Comparison Protocol
To validate biosensor performance against chromatographic reference methods, researchers should implement the following experimental protocol adapted from pesticide monitoring studies [7]:
Sample Preparation:
- Prepare calibration standards spanning the expected concentration range (e.g., 0.1-100 μg/L for environmental contaminants)
- Include both pure analyte solutions and spiked real-world matrices (serum, water, soil extracts) to assess matrix effects
- For biosensors requiring specific buffer conditions, ensure compatibility with chromatographic analysis through buffer exchange when necessary
Instrumental Analysis:
- Analyze all samples using the biosensor platform in triplicate, recording both steady-state signals and dynamic response trajectories
- Immediately analyze the same samples using the chromatographic reference method
- For HPLC/UPLC: Utilize optimized separation conditions (column temperature: 25-40°C, mobile phase: gradient elution with 0.1% formic acid in water/acetonitrile, flow rate: 0.2-0.6 mL/min) [16] [10]
- Employ appropriate detection methods (UV-Vis, MS, fluorescence) based on analyte characteristics
Data Analysis:
- Plot biosensor response versus chromatographic quantification to establish correlation coefficients
- Calculate key validation parameters: limit of detection (LOD), limit of quantification (LOQ), linearity, precision, and accuracy
- Perform statistical analysis (t-tests, F-tests) to determine significant differences between methods
Biosensor-Calibration Protocol Using Chromatography
For validating biosensors intended for field deployment, the following protocol establishes traceability to chromatographic reference methods [7]:
- Initial Calibration: Use chromatographically quantified standards to calibrate biosensor response across the operational range
- Matrix Testing: Evaluate biosensor performance in real sample matrices (water, blood, food extracts) with confirmation by chromatography
- Stability Assessment: Monitor biosensor performance drift over time using periodic validation with chromatographic analysis
- Cross-Validation: For quantitative biosensors, analyze identical samples using both methods and compute Pearson correlation coefficients
The experimental workflow for method validation illustrates the parallel analysis and correlation assessment required for rigorous biosensor validation.
Advanced Validation Approaches
Theory-Guided Deep Learning for Enhanced Biosensor Accuracy
Recent advances in artificial intelligence have enabled significant improvements in biosensor performance through theory-guided deep learning approaches [6]. The implementation protocol includes:
Data Acquisition and Augmentation:
- Collect dynamic biosensor response curves across multiple analyte concentrations
- Apply data augmentation to address sparsity and class imbalance in calibration data
- Generate synthetic response curves through mathematical modeling of binding kinetics
Model Development:
- Implement recurrent neural networks (RNN) for time-series classification of biosensor responses
- Incorporate domain knowledge through cost function supervision based on biosensor theory
- Train models to predict analyte concentration from initial transient response to reduce time delay
Validation:
- Compare theory-guided RNN (TGRNN) classification against conventional data analysis methods
- Assess performance metrics (F1 score, precision, recall) with and without theory guidance
- Validate model predictions against chromatographic quantification
Experimental results demonstrate that theory-guided deep learning improves F1 scores, precision, and recall by an average of 13.8%, enabling quantification of target analyte concentration with 98.5% accuracy using initial transient biosensor response [6].
Fragment Screening Validation Using SPR Biosensors
Surface plasmon resonance (SPR) biosensors have emerged as powerful tools for fragment-based drug discovery, with specific validation protocols [18]:
- Library Design: Select 930 compounds from commercially available sources using physicochemical and medicinal chemistry filters
- Multi-Target Screening: Screen fragments against three prototypical drug targets (HIV-1 protease, thrombin, carbonic anhydrase) and one non-target (human serum albumin)
- Promiscuity Assessment: Identify and eliminate compounds with non-specific binding (stoichiometry ≥5:1 with all proteins)
- Kinetic Analysis: Characterize binding kinetics, focusing on slow-dissociating compounds that may indicate problematic binders
This approach confirmed that 35-97% of fragments showed detectable interactions depending on the target protein, with only 0.2% demonstrating promiscuous binding behavior [18].
Essential Research Reagent Solutions
Successful validation studies require carefully selected reagents and materials. The following table details key solutions used in biosensor-chromatography correlation studies:
Table 3: Essential research reagents for validation studies
| Reagent/Material | Function | Application Examples | Selection Criteria |
|---|---|---|---|
| Biorecognition Elements | Target capture and signal generation | Enzymes (acetylcholinesterase for pesticides), antibodies, nucleic acid probes [7] [14] | Specificity, stability, compatibility with immobilization method |
| Chromatography Columns | Analyte separation | HSS T3, BEH C18, Thermo Hypersil GOLD [10] | Separation efficiency, chemical stability, particle size (1.8 μm for UPLC) |
| Signal Labels | Detection and quantification | Metallic nanoparticles (gold, silver), fluorescent tags, enzymes [14] | High signal-to-noise, minimal non-specific binding, stability |
| Membranes | Fluidics and immobilization support | Nitrocellulose, PVDF with controlled pore size (5-15 μm) and protein holding capacity [14] | Wicking rate, protein binding capacity, uniformity, background signal |
| Mobile Phase Additives | Improve separation and peak shape | Triethylamine, formic acid, ammonium buffers [16] [19] | Peak symmetry enhancement, MS-compatibility, volatility |
| Immobilization Chemistries | Surface functionalization | NHS-EDC amine coupling, streptavidin-biotin systems, thiol-gold chemistry [15] [10] | Orientation control, binding capacity, stability under flow conditions |
Relationship between validation components and performance outcomes illustrates how proper reagent selection and methodology influence key biosensor performance metrics.
Validation remains a critical requirement for establishing the credibility of biosensor technologies, particularly as they transition from laboratory curiosities to field-deployable analytical tools. The experimental data and methodologies presented in this comparison guide demonstrate that while biosensors offer significant advantages in speed, portability, and potential for point-of-use testing, they generally require correlation with established chromatographic methods to verify accuracy and reliability.
Successful validation strategies incorporate multiple approaches: side-by-side comparison studies using identical samples, theory-guided data analysis to enhance biosensor performance, and rigorous statistical assessment of correlation coefficients and method agreement. Furthermore, the selection of appropriate research reagents—from biorecognition elements to separation materials—profoundly impacts the success of these validation efforts.
As biosensor technologies continue to evolve, incorporating advanced signal processing, artificial intelligence, and novel sensing modalities, the need for rigorous validation against reference methods will remain paramount. By adopting the comprehensive validation framework outlined in this guide, researchers can ensure that biosensor data meets the stringent requirements for scientific research, clinical decision-making, and regulatory compliance.
The validation of biosensor results against established chromatography methods represents a critical frontier in analytical science, particularly for pharmaceutical and clinical applications. As the demand for rapid, on-site testing grows, portable biosensors have emerged as powerful alternatives to traditional laboratory-bound techniques. This guide provides an objective comparison of these technologies, framing their performance characteristics within the rigorous context of analytical method validation. The core trade-off between the operational advantages of biosensors and the definitive accuracy of chromatographic methods is a fundamental consideration for researchers and drug development professionals designing analytical strategies. This comparison is grounded in experimental data and validation protocols, offering a practical framework for technology selection and method development.
Portable biosensors are analytical devices that integrate a biological recognition element with a physicochemical transducer to produce a measurable signal [20]. Their design is inherently geared toward speed, portability, and ease of use, making them ideal for point-of-care diagnostics, environmental monitoring, and rapid screening [21] [22]. In contrast, chromatographic methods, such as Gas Chromatography (GC) and High-Performance Liquid Chromatography (HPLC), are separation-based techniques that serve as the gold standard for ultimate accuracy, specificity, and precision in quantitative analysis [23]. They are typically laboratory-based, requiring sophisticated instrumentation and skilled operators.
The primary trade-off between these technologies is encapsulated in their core design philosophies. Biosensors sacrifice a degree of analytical rigor for operational advantages, while chromatography prioritizes definitive quantification at the cost of speed and accessibility. This relationship is not merely competitive but often complementary; biosensors are frequently validated and calibrated using chromatographic data as a reference [24]. Understanding this balance is essential for deploying the right tool for the right application, whether for rapid field screening or definitive regulatory analysis.
Table 1: Core Characteristics and Typical Applications
| Feature | Portable Biosensors | Chromatography Methods |
|---|---|---|
| Primary Strength | Speed, portability, on-site capability | Ultimate accuracy, specificity, and precision |
| Typical Analysis Time | Minutes to a few hours [21] [20] | Hours to days (including sample prep) |
| Portability | High; handheld and smartphone-integrated systems exist [21] | Low; confined to laboratory settings |
| Sample Throughput | Potential for high-throughput with multiplexing [21] | Generally low to medium |
| Operator Skill Required | Low to moderate | High |
| Ideal Application | Rapid disease diagnosis, on-site contaminant screening, therapeutic drug monitoring [21] [20] [22] | Drug quality control, regulatory compliance, pharmacokinetic studies [23] |
Comparative Performance Data
When evaluated against standard validation parameters, the performance disparities and convergences between biosensors and chromatography become clear. The following tables summarize quantitative data and validation benchmarks for both technologies.
Quantitative Performance Metrics
Experimental data from recent studies demonstrates that biosensors can achieve impressive sensitivity, often detecting analytes at nanomolar to femtomolar concentrations [6] [20]. For instance, a portable aptamer-based biosensor detected platelet-derived growth factor (PDGF) with a limit of detection (LOD) of 2.9 fM [20]. However, their precision, often measured by Relative Standard Deviation (RSD), can be more variable than chromatographic methods.
Table 2: Comparison of Experimental Performance Data
| Analyte | Technology | Limit of Detection (LOD) | Precision (RSD) | Dynamic Range | Analysis Time | Citation |
|---|---|---|---|---|---|---|
| MicroRNA (let-7a) | Cantilever Biosensor with AI | Femtomolar (fM) range | Precision of 98.5% (with AI guidance) [6] | nM to fM | Rapid (using initial transient response) [6] | [6] |
| Lactate | Electrochemical Biosensor (Screen-printed electrode) | 0.01 mM | Not Specified | 0.025–0.25 mM | < 60 seconds [20] | [20] |
| Cortisol | Surface Plasmon Resonance (SPR) Biosensor | 1.0 ng/mL | Not Specified | 1.5 ng/mL – 10 ng/mL | < 10 minutes [20] | [20] |
| Residual Solvents | Gas Chromatography (GC) | Determined by S/N (e.g., 3:1) [23] | RSD < 2% (Repeatability), RSD < 3% (Intermediate Precision) [23] | LOQ to 120% of working level | Typically 30+ minutes | [23] |
| Pharmaceutical Compounds | HPLC / GC | Determined by S/N [25] | Adheres to strict validation guidelines (e.g., ICH) [25] | Validated linear range [25] | Typically 30+ minutes | [25] |
Validation Parameter Benchmarks
The validation of any analytical method relies on a set of defined performance characteristics. Chromatography methods are validated against stringent, internationally recognized criteria [25] [23]. Biosensor validation, while following the same principles, often shows different performance profiles.
Table 3: Validation Benchmarks: Biosensors vs. Chromatography
| Validation Parameter | Portable Biosensors (Typical Performance) | Chromatography Methods (Acceptance Criteria) | Key Implication |
|---|---|---|---|
| Accuracy | Varies; can be high but susceptible to matrix effects [24]. Often demonstrated via recovery studies. | Recovery typically within 98-102% [23]. | Chromatography provides definitive quantification; biosensors may require extensive calibration. |
| Precision | Can be enhanced with advanced data processing (e.g., AI) to >98% [6]. | RSD < 2% (repeatability); RSD < 3% (intermediate precision) [23]. | Chromatography offers superior reproducibility, a critical factor for regulatory submission. |
| Specificity | High, due to specific biorecognition (enzymes, antibodies, aptamers) [21] [26]. Can be compromised by cross-reactivity. | No interference with analyte peaks; confirmed via peak purity tests (e.g., PDA, MS) [25]. | Chromatography with MS detection provides unmatched specificity for complex samples. |
| Linearity | Demonstrated over a defined concentration range relevant to the application [20]. | Correlation coefficient (r) ≥ 0.999 across the specified range [23]. | Chromatography is validated for a wide, defined linear range, essential for quantitative work. |
| LOD/LOQ | Extremely low (fM) possible [6] [20]. Often based on S/N or statistical methods. | LOD (S/N ≈ 3:1), LOQ (S/N ≈ 10:1) [25] [23]. | Both can be highly sensitive, but biosensors achieve this in a direct, label-free manner. |
| Robustness | An ongoing challenge; performance can be affected by environmental conditions, sample matrix, and bioreagent stability [21] [27]. | Consistent performance under deliberate, minor variations in method parameters [23]. | Chromatography is a mature, highly robust technology, whereas biosensor robustness is a key R&D focus. |
Detailed Experimental Protocols
To illustrate how performance data is generated and validated, below are detailed protocols for a key biosensor experiment and a standard chromatography validation procedure.
Protocol 1: Validating Biosensor Kinetics Using a Theory-Guided Deep Learning Approach
This protocol, adapted from Zhang et al., describes a method to enhance the accuracy and speed of a cantilever biosensor for microRNA detection using dynamic signal analysis, providing a robust framework for biosensor validation [6].
1. Biosensor Functionalization:
- Immobilization: Continuously flow a 3 μM solution of thiolated-DNA probe (e.g., HS–C6-5′ TTTTTTAACTATACAAC 3′) over a gold-coated cantilever sensor surface in a custom flow cell. This forms a self-assembled monolayer (SAM) as the biorecognition element [6].
- Blocking: After probe immobilization, flow a blocking solution (e.g., 6-mercapto-1-hexanol) to passivate unreacted gold surfaces and minimize non-specific binding.
2. Sample Preparation and Data Acquisition:
- Standard Solutions: Prepare a series of standard solutions of the target analyte (e.g., microRNA let-7a) across the desired concentration range (e.g., nanomolar to femtomolar).
- Data Collection: For each standard solution, perfuse the sample over the functionalized biosensor chip and record the dynamic response (e.g., resonant frequency shift, Δf, vs. time). This generates a sensorgram for each concentration [6] [24].
3. Data Preprocessing and Augmentation:
- Address Data Sparsity: To overcome limitations of small calibration datasets, employ data augmentation techniques. This involves creating synthetic data points from the existing experimental sensorgrams to improve the robustness of subsequent deep learning models [6].
- Categorical Structuring: Format the data for classification by treating each target analyte concentration level as a distinct category.
4. Theory-Guided Deep Learning (TGRNN) Analysis:
- Model Training: Train a Recurrent Neural Network (RNN) classifier to identify the target concentration category based on the dynamic biosensor response.
- Cost Function Supervision: Guide the RNN training by incorporating domain knowledge. This is done by adding a cost function that penalizes predictions inconsistent with the established theory of surface-based biosensor kinetics, ensuring explainable and physically plausible results [6].
- Performance Evaluation: Validate the TGRNN model using hold-out data. Metrics such as F1 score, precision, and recall are calculated, with modern studies achieving averages of 98.5% [6].
5. Validation and Cross-Checking:
- Concentration Prediction: Use the trained TGRNN model to predict the concentration of unknown samples from their dynamic sensor response.
- Independent Verification: Where possible, cross-validate biosensor results against a reference method, such as liquid chromatography, for critical applications [24].
Biosensor AI Validation Workflow
Protocol 2: GC Method Validation for Ultimate Accuracy
This protocol outlines the standard steps for validating a Gas Chromatography (GC) method, as defined by regulatory bodies like ICH and FDA, establishing the benchmark for analytical accuracy [25] [23].
1. Method Development and Optimization:
- Define and optimize all critical GC parameters: inlet temperature, detector temperature, oven temperature ramp, carrier gas type and flow rate, and column selection [23].
2. Specificity Testing:
- Procedure: Inject the target analyte standard, a blank sample (matrix without analyte), and a sample spiked with potential interferents.
- Acceptance Criterion: The analyte peak must be resolved from all other peaks with no interference, confirmed by comparing retention times and, ideally, using a peak purity test (e.g., Photodiode Array or Mass Spectrometry detection) [25] [23].
3. Linearity and Range Determination:
- Procedure: Prepare and analyze a minimum of 5 standard solutions covering the range from the LOQ to 120% of the expected sample concentration.
- Acceptance Criterion: The calibration curve must have a correlation coefficient (r) of ≥ 0.999 [23].
4. Limit of Detection (LOD) and Quantitation (LOQ) Determination:
- Procedure: Analyze progressively diluted standards and measure the signal-to-noise (S/N) ratio.
- Acceptance Criterion: LOD is typically defined as S/N ≥ 3:1, and LOQ as S/N ≥ 10:1. Alternatively, based on the standard deviation of the response and the slope of the calibration curve (LOD = 3.3σ/S, LOQ = 10σ/S) [25] [23].
5. Accuracy Evaluation via Recovery Study:
- Procedure: Spike the sample matrix with known quantities of the analyte at multiple levels (e.g., 80%, 100%, 120% of target). Calculate the percentage recovery of the measured value versus the known added amount.
- Acceptance Criterion: Recovery is typically within 98-102% [23].
6. Precision Assessment:
- Repeatability (Intra-assay): Perform multiple injections (n=6 or more) of a homogeneous sample on the same day by the same analyst using the same instrument.
- Intermediate Precision (Ruggedness): Have a second analyst repeat the analysis on a different day using a different instrument in the same laboratory.
- Acceptance Criterion: RSD for repeatability is typically < 2%; for intermediate precision, RSD < 3% [25] [23].
7. Robustness Testing:
- Procedure: Deliberately introduce small, deliberate variations in method parameters (e.g., carrier gas flow rate ±0.1 mL/min, oven temperature ±1°C).
- Acceptance Criterion: The method's performance (e.g., resolution, tailing factor) must remain consistent and within specified limits under all varied conditions [23].
GC Method Validation Protocol
The Scientist's Toolkit: Key Research Reagent Solutions
The performance of both biosensors and chromatography is heavily dependent on the quality and specificity of the reagents and materials used. The following table details essential components for developing and validating these analytical platforms.
Table 4: Essential Research Reagents and Materials
| Item | Function | Application Context |
|---|---|---|
| Biorecognition Elements (Antibodies, DNA probes, Aptamers, Enzymes) | Provides specificity by binding the target analyte. The choice of element directly impacts sensitivity and cross-reactivity. | Core to all biosensors. Aptamers, selected via SELEX, are popular for small molecules and toxins [21] [26]. |
| Surface Functionalization Reagents (e.g., Thiolated probes for gold surfaces, SAMs like 4-ATP, cross-linkers like Glutaraldehyde) | Enables stable immobilization of the biorecognition element onto the transducer surface, which is critical for assay reproducibility and minimizing noise. | Essential for surface-based biosensors (e.g., SPR, cantilevers, electrochemical) [21] [6] [28]. |
| High-Accuracy Standard Solutions | Used for instrument calibration and method validation. Their purity and traceability are fundamental for establishing accuracy and meeting regulatory standards. | Critical for chromatography method development and validation [23]. Also used as reference materials to calibrate and validate biosensors [24]. |
| Nanomaterials (Graphene, MXenes, Metal-Organic Frameworks (MOFs), Quantum Dots) | Enhance sensor performance by increasing surface area, improving electron transfer, and enabling signal amplification. This boosts sensitivity and can lower LOD. | Used to modify electrodes in electrochemical biosensors [28] or as labels in optical biosensors [21]. |
| Microfluidic Cartridges/Chips | Miniaturize and automate fluid handling, reducing sample and reagent volumes, improving assay speed, and enabling the integration of multiple processing steps. | Key for developing commercial, user-friendly, and disposable portable biosensors [27] [26]. |
| Chromatographic Columns and Phases | The heart of the separation process. The stationary phase chemistry dictates the selectivity and resolution of the analytes. | Core component of all GC and HPLC systems. Selection is analyte-dependent [23]. |
Integrated Data Analysis and Signaling Pathways
The final stage of analysis in both biosensors and chromatography involves interpreting complex data. For biosensors, this increasingly involves advanced computational tools to extract accurate information from dynamic signals.
Advanced Data Analysis for Complex Biosensor Data
A major challenge in biosensing is the reliable analysis of kinetic binding data, especially when interactions are complex and far from steady-state. A four-step strategy using the Adaptive Interaction Distribution Algorithm (AIDA) has been developed for this purpose [24]:
- Dissociation Graph Analysis: Plot ln[R(t)/R₀] against time for the dissociation phase. A non-linear, convex curve indicates heterogeneity (i.e., more than one type of analyte-ligand interaction) [24].
- Rate Constant Distribution (RCD) with AIDA: The AIDA algorithm is applied to the sensorgram data to calculate a distribution of possible association (kₐ) and dissociation (k_d) rate constants. This fast numerical tool identifies the number of distinct interactions without pre-selecting a model [24].
- Rate Constant Estimation: The peaks in the RCD plot provide initial estimates for the rate constants of each interaction type. These estimates are then used as inputs for a more precise fitting of the sensorgram data [24].
- Clustering and Validation: All estimated rate constants from multiple sensorgrams are plotted and clustered. Each cluster represents a distinct complex formation reaction, providing a robust and data-driven model of the system's interactions [24].
This methodology is more robust than standard global fitting to a simple 1:1 model, as it can reveal complex binding kinetics and handle system drift, leading to more reliable results [24].
A Step-by-Step Methodology for Correlating Biosensor and Chromatography Data
The increasing integration of biosensors in pharmaceutical research and environmental monitoring demands rigorous validation to ensure data reliability and regulatory compliance. Effective validation establishes that a biosensor is suitable for its intended purpose, providing confidence in its analytical results. This guide details the core components of a robust validation study, focusing on sample preparation, parallel testing against established methods like chromatography, and systematic data collection. The objective is to provide a clear framework for generating high-quality, comparable data that can objectively demonstrate biosensor performance against reference standards.
A typical biosensor consists of a biological recognition element (e.g., antibodies, enzymes, DNA) linked to a substrate and integrated with a transducer that converts a biological interaction into a measurable signal [29]. The validation of these devices is critical, as the number of publications featuring biosensor data has nearly doubled since 2009, yet critical methodological information is often poorly described, making replication difficult [30]. This guide, framed within the broader context of validating biosensor results against chromatography methods, provides actionable protocols for researchers, scientists, and drug development professionals.
Core Validation Study Design
Key Validation Parameters
A comprehensive validation study must evaluate several key analytical performance parameters. These parameters collectively define the operational boundaries and reliability of the biosensor for a specific application.
Table 1: Key Analytical Parameters for Biosensor Validation
| Parameter | Definition | Acceptance Criteria Example |
|---|---|---|
| Specificity | The ability to detect the target analyte in the presence of other components. | No significant cross-reactivity with similar compounds [31]. |
| Accuracy | The closeness of agreement between the biosensor value and an accepted reference value. | Recovery rates between 80-120% [32]. |
| Precision | The closeness of agreement between a series of measurements. | Intraday repeatability RSD < 1.5%; between-day precision RSD < 5% [32]. |
| Linearity | The ability to obtain results directly proportional to analyte concentration. | R² value ≥ 0.975 [33]. |
| Limit of Detection (LOD) | The lowest amount of analyte that can be detected. | Statistically determined signal-to-noise ratio (e.g., 3:1). |
| Limit of Quantification (LOQ) | The lowest amount of analyte that can be quantified with acceptable accuracy and precision. | Statistically determined signal-to-noise ratio (e.g., 10:1). |
| Robustness | A measure of capacity to remain unaffected by small, deliberate variations in method parameters. | Consistent performance across pH, temperature, or operator changes [33]. |
The Role of Sample Preparation
Sample preparation is a critical first step that can significantly impact the outcome of a validation study. Inconsistent or improper sample handling introduces variability before analysis even begins [34]. The overarching goal is to present the analyte in a form compatible with both the biosensor and the reference chromatography method, while minimizing interference.
Automation is increasingly used to enhance the reliability of this stage. Automated sample preparation systems can perform tasks such as dilution, filtration, solid-phase extraction (SPE), and derivatization, thereby reducing human error and improving consistency, especially in high-throughput environments [34]. For instance, standardized, ready-made kits for sample cleanup (e.g., for PFAS analysis or oligonucleotide extraction) provide optimized protocols that ensure accurate and reproducible results when moving to LC-MS analysis [34].
Table 2: Common Sample Types and Preparation Considerations
| Sample Matrix | Common Preparation Steps | Potential Interferences |
|---|---|---|
| Serum/Blood | Dilution, filtration, protein precipitation. | Lipids, proteins, endogenous biomarkers. |
| Water/Environmental | Filtration, pH adjustment, concentration (e.g., SPE). | Dissolved organic matter, particulate matter, other contaminants. |
| Food Products | Homogenization, extraction with solvent, cleanup. | Fats, carbohydrates, pigments. |
| Bacterial Cultures | Centrifugation, lysis, dilution. | Cellular debris, growth media components. |
Experimental Protocols for Parallel Testing
Protocol for Validating a Heavy Metal GEM Biosensor
This protocol is adapted from the validation of a Genetically Engineered Microbial (GEM) biosensor for detecting Cd²⁺, Zn²⁺, and Pb²⁺ [33].
Biosensor Cultivation and Preparation:
- Inoculate the GEM biosensor (e.g., E.coli-BL21:pJET1.2-CadA/CadR-eGFP) in a suitable growth medium.
- Incubate at 37°C with shaking until the culture reaches the mid-logarithmic growth phase.
- Dilute the bacterial cells to a standardized optical density (e.g., OD600 = 0.5) using fresh medium.
Sample Preparation and Treatment:
- Prepare stock solutions (e.g., 100 ppm) of the target analytes (Cd²⁺, Zn²⁺, Pb²⁺) and potential interfering ions (Ni²⁺, Fe³⁺, AsO₄³⁻) from certified reference materials.
- Spike the standardized biosensor culture with a series of known concentrations of the target analytes (e.g., 0.1 to 5.0 ppm). Include a negative control (no metal added) and a positive control if available.
- Incubate the treated cultures under optimal physiological conditions (e.g., 37°C, pH 7.0) for a predetermined period to allow for reporter gene expression.
Biosensor Signal Measurement:
- Measure the fluorescent signal (e.g., eGFP emission) using a fluorometer, microplate reader, or fluorescence microscopy.
- For quantitative analysis, calibrate the fluorescent intensity against the heavy metal concentration to generate a standard curve.
Parallel Analysis with Reference Method:
- Digest an aliquot of the same prepared samples with strong acids following conventional procedures for heavy metal analysis.
- Analyze the digested samples using a reference chromatographic or spectrometric method, such as Inductively Coupled Plasma Mass Spectrometry (ICP-MS) or Liquid Chromatography-Tandem Mass Spectrometry (LC-MS/MS).
- Confirm the actual concentration of metals in the samples using the reference method.
Data Comparison and Analysis:
- Plot the biosensor response (fluorescence intensity) against the reference method concentration values.
- Calculate key validation parameters: linearity (R²), limit of detection (LOD), limit of quantification (LOQ), and accuracy (recovery %).
Diagram 1: GEM Biosensor vs Reference Method Workflow
Protocol for Validating an Immunochromatographic Biosensor
This protocol is based on the development of a colloidal gold-based biosensor for quantifying S100B in serum [31].
Biosensor Strip Assembly and Principle:
- The biosensor utilizes a double-antibody sandwich format. A monoclonal antibody (e.g., 8C10) is conjugated to colloidal gold nanoparticles (the detector).
- A second monoclonal antibody (e.g., 6B8) is immobilized on the nitrocellulose membrane as the capture antibody at the test line (T-line). A control antibody is immobilized at the control line (C-line).
Sample Preparation and Application:
- Obtain or prepare clinical serum samples. Minimal dilution may be required.
- Apply a precise volume (e.g., 70-100 µL) of the serum sample to the sample pad of the biosensor strip.
- The sample migrates via capillary action, rehydrating the gold-conjugated antibodies.
Biosensor Signal Acquisition:
- Allow the test to develop for a fixed time (e.g., 15 minutes).
- Insert the strip into a dedicated optical reader that scans the intensity of the T-line and C-line.
- The reader calculates the T/C value (ratio of test line signal to control line signal), which is proportional to the analyte concentration.
Parallel Analysis with Reference Method:
- Analyze the same set of clinical serum samples using a validated reference immunoassay, such as a Chemiluminescence Immunoassay (CLIA) or Electrochemiluminescence Assay (ECLIA).
- Ensure the reference method is performed according to its standardized protocol.
Data Comparison and Analysis:
- Construct a calibration curve for the biosensor by plotting the T/C values against known concentrations of a purified S100B standard.
- Compare the quantitative results (S100B concentration) obtained from the biosensor and the reference method for all clinical samples (e.g., n=40).
- Perform correlation analysis (e.g., Pearson's correlation coefficient) and assess the agreement between the two methods using Bland-Altman analysis.
Data Collection, Analysis, and Reporting Standards
Structured Data Collection and Comparison
Data collection must be systematic to facilitate a direct and unbiased comparison. The following table provides a template for organizing primary data when comparing a biosensor to a reference chromatography method.
Table 3: Template for Parallel Testing Data Collection
| Sample ID | Theoretical Concentration | Biosensor Response (Raw) | Biosensor Calculated Concentration | Reference Method Concentration | Recovery (%) | Deviation (%) |
|---|---|---|---|---|---|---|
| Calibrator 1 | 0.1 ng/mL | 15.5 (T/C) | 0.095 ng/mL | 0.098 ng/mL | 96.9% | -3.1% |
| Calibrator 2 | 1.0 ng/mL | 85.2 (T/C) | 1.02 ng/mL | 1.05 ng/mL | 97.1% | -2.9% |
| Patient Serum A | Unknown | 45.1 (T/C) | 0.48 ng/mL | 0.50 ng/mL | 96.0% | -4.0% |
| Patient Serum B | Unknown | 120.5 (T/C) | 1.45 ng/mL | 1.40 ng/mL | 103.6% | 3.6% |
Essential Reporting Standards (STROBE)
To ensure reproducibility and transparency, the scientific community is moving towards standardized reporting. The Standards for Reporting Optical Biosensor Experiments (STROBE) guideline is a key initiative in this direction [30]. When publishing validation data, the following must be clearly reported:
- Sample Preparation: Detailed description of the sample matrix, all processing steps, reagents, and storage conditions.
- Biosensor Description: Exact type of biosensor, biological recognition element, transducer principle, and instrument model.
- Method Settings: All critical instrument parameters (e.g., temperature, flow rates, gain settings, acquisition time).
- Data Evaluation: Software used, data processing steps, fitting models for calibration curves, and statistical methods for comparison.
- Reference Method: Full details of the reference chromatography or other method used for comparison, including any sample preparation specific to it.
The Scientist's Toolkit
A successful validation study relies on specific reagents and materials. The following table details key solutions used in the featured experiments.
Table 4: Key Research Reagent Solutions for Biosensor Validation
| Reagent / Material | Function in Validation | Example from Literature |
|---|---|---|
| Monoclonal Antibody Pairs | Serve as the capture and detection elements in immunosensors, defining specificity. | Anti-S100B mAbs 8C10 and 6B8 for sandwich immunoassay [31]. |
| Colloidal Gold Nanoparticles | Act as a colorimetric label for detection in lateral flow biosensors, enabling visual and optical quantification. | Used as the detector conjugate in the S100B immunochromatographic biosensor [31]. |
| Genetically Engineered Circuit | The core sensing element in whole-cell biosensors, encoding the response to a specific analyte. | The CadA/CadR-eGFP gene circuit for heavy metal detection in E. coli [33]. |
| Certified Reference Materials | Provide a traceable standard for preparing known analyte concentrations for calibration and accuracy checks. | Certified heavy metal salts (CdCl₂, Pb(NO₃)₂) for GEM biosensor calibration [33]. |
| Solid-Phase Extraction (SPE) Kits | Purify and concentrate analytes from complex samples, reducing matrix effects before analysis. | Stacked cartridges for PFAS isolation in environmental samples prior to LC-MS [34]. |
Diagram 2: Validation Study Logical Flow
The validation of novel biosensors against established analytical techniques is a critical step in ensuring their reliability and adoption in research and industrial applications. This process is particularly critical in life sciences and drug development, where the accuracy of measurements can directly impact scientific conclusions and product quality. Fluorescent biosensors offer the potential for rapid, sensitive, and high-throughput analysis, but require rigorous benchmarking against gold-standard methods to verify their performance. High-Performance Liquid Chromatography (HPLC) represents one such benchmark in the quantification of small molecules, prized for its robustness, sensitivity, and specificity. This case study examines the specific validation of a GFP-based fluorescent biosensor (Tre‑C04) for the quantification of trehalose in insect hemolymph, providing a template for the validation paradigms essential for accrediting new biosensor technologies within the broader context of analytical chemistry [35] [36].
The Tre-C04 Biosensor: Principle and Design
The Tre‑C04 biosensor is engineered for high-sensitivity detection of trehalose. Its core mechanism relies on a single fluorescent protein that integrates a trehalose-binding protein with a circularly permuted Green Fluorescent Protein (cpGFP) [35].
In the absence of trehalose, the cpGFP emits only weak fluorescence. When trehalose binds to the biosensor, it induces a conformational change that enhances the green fluorescence emission. The intensity of this fluorescence correlates directly with the concentration of trehalose, enabling quantitative measurements. This design allows for sensitive detection in minimal sample volumes, making it ideal for applications where material is scarce, such as single-insect analysis [35].
The following diagram illustrates the conformational change that occurs upon trehalose binding, which is the basis of the biosensor's signal generation.
Experimental Protocol for Method Comparison
A direct comparison was conducted to benchmark the performance of the Tre-C04 biosensor against a traditional HPLC method for quantifying trehalose in aphid hemolymph [35].
Biosensor Assay with Tre-C04
- Biosensor Purification: The Tre-C04 biosensor was expressed in E. coli BL21 (DE3) cells using the pTKEI-Tre-C04 plasmid. Expression was induced, and the recombinant protein was purified via Ni–NTA affinity chromatography [35].
- Sample Preparation: Hemolymph was collected from individual aphids and diluted with distilled water to ensure the trehalose concentration fell within the biosensor's dynamic range (below 1,000 nM) [35].
- Fluorescence Measurement: Diluted hemolymph samples were mixed with the purified Tre-C04 biosensor. Fluorescence was measured using a Qubit 3 Fluorometer. The trehalose concentration was calculated from a standard curve generated with a 50 nM trehalose calibration standard [35].
HPLC Reference Method
- Chromatography System: HPLC analysis was performed using an Aminex HPX-87C column, a specialized column for sugar separation [35].
- Sample Preparation: For HPLC, a larger volume of hemolymph (100 nL) was required. This volume typically necessitated pooling samples from at least 10 adult aphids to exceed the method's detection limit. The hemolymph was diluted in 80% ethanol containing 1% sorbitol as an internal standard, completely dried, and then reconstituted in distilled water for injection [35].
- Separation and Detection: The analysis relied on isocratic elution (a constant mobile phase composition) to separate trehalose from other components. Detection was based on the intrinsic properties of the sugar, without the need for derivatization, confirming trehalose as the dominant hemolymph sugar [35].
Critical Comparison of Analytical Performance
The side-by-side application of both methods to the same biological system allows for a clear comparison of their analytical performance and practical utility.
Table 1: Quantitative Comparison of Tre-C04 Biosensor and HPLC for Trehalose Measurement in Aphid Hemolymph
| Parameter | Tre-C04 Fluorescent Biosensor | HPLC with Aminex HPX-87C Column |
|---|---|---|
| Measured Trehalose (A. pisum) | 227.3 ± 10.0 mM (mean ± SD) [35] | 218.9 ± 34.4 mM (mean ± SD) [35] |
| Detection Range | 183.5 - 261.7 mM (in individual adults) [35] | N/A (Pooled samples required) [35] |
| Sample Throughput | Rapid, suitable for high-throughput [35] | Slower, limited by run time and sample prep [35] |
| Sample Volume | Single-insect level (very small volume) [35] | ≥ 100 nL, requires pooling from ~10 insects [35] |
| Key Advantage | Single-insect resolution, rapid measurement [35] | Gold-standard reference, high specificity [35] |
| Primary Limitation | Potential for optical interference | Lower sensitivity, requires sample pooling [35] |
The data showed no significant difference (Welch’s t-test, p = 0.66) between the mean trehalose concentrations measured by the two methods, providing strong evidence for the accuracy of the Tre-C04 biosensor [35]. The biosensor's major advantage is its ability to perform measurements on single insects, revealing individual-level variation that is obscured by the pooling required for HPLC analysis [35].
Expanded Application: Cross-Species and Morphological Analysis
Leveraging its capacity for single-insect analysis, the Tre-C04 biosensor was used to investigate trehalose levels across nine aphid species and between different wing morphs.
Table 2: Trehalose Concentrations Across Aphid Species Measured with the Tre-C04 Biosensor
| Aphid Species | Mean Trehalose Concentration (mM ± SD) |
|---|---|
| Megoura crassicauda | 220.6 ± 12.5 [35] |
| Aphis gossypii | 204.7 ± 11.9 [35] |
| Sitobion ibarae | 191.7 ± 16.3 [35] |
| Uroleucon sonchi | 217.2 ± 9.0 [35] |
| Macrosiphoniella sanborni | 202.8 ± 6.0 [35] |
| Lachnus tropicalis | 229.9 ± 18.3 [35] |
The results demonstrated that hemolymph trehalose levels are conserved at approximately 200 mM across most species, which contradicted earlier studies that reported much higher values (e.g., >600 mM for A. gossypii). This discrepancy was attributed to tissue contamination in the pooled samples required by the previously used 'H-NMR method [35]. Furthermore, the study found that differences in trehalose concentration between winged and wingless morphs were species-dependent, highlighting the value of single-insect analysis for uncovering nuanced physiological responses [35].
The Scientist's Toolkit: Essential Research Reagents
The development and validation of such analytical methods rely on a set of key reagents and tools.
Table 3: Essential Research Reagents for Biosensor Development and Validation
| Reagent / Tool | Function in the Research Context |
|---|---|
| cpGFP-based Biosensor (e.g., Tre-C04) | The core sensing element; changes fluorescence upon binding the target analyte [35]. |
| Affinity Chromatography Resin (e.g., Ni–NTA) | Purifies recombinant biosensor proteins, ensuring assay consistency and sensitivity [35]. |
| Specialized HPLC Columns (e.g., Aminex HPX-87C) | Provides high-resolution separation of sugars for gold-standard quantification and validation [35]. |
| Fluorometer / Plate Reader | Precisely measures the fluorescence signal output of the biosensor for quantification [35]. |
| Positive/Negative Regulator Proteins | Used in validation to saturate or inhibit the biosensor, testing its dynamic range and specificity [37]. |
| Ligand-Specific Binding Protein | The recognition domain (e.g., trehalose-binding protein) that confers specificity to the biosensor [35]. |
This case study demonstrates a successful validation of a fluorescent biosensor against a chromatographic standard. The Tre-C04 biosensor was shown to be statistically equivalent to HPLC for quantifying trehalose while offering superior sensitivity and single-entity resolution. The workflow below summarizes the key stages in this validation process.
The findings underscore that a rigorous, data-driven validation framework is essential for establishing new biosensors as trustworthy tools. This builds a foundation for their use in advanced applications, from basic physiological research to high-throughput screening in drug discovery, ultimately accelerating scientific discovery by providing more accessible and versatile analytical methods [35] [38].
Aflatoxins (AFs), potent mycotoxins produced by Aspergillus species, pose a significant global health risk due to their severe carcinogenic and hepatotoxic effects. Regulatory bodies worldwide have established strict maximum limits for aflatoxin levels in food and feed, creating an urgent need for reliable, sensitive, and accessible detection methods [39]. While conventional techniques like liquid chromatography-tandem mass spectrometry (LC-MS/MS) offer high sensitivity and specificity, they require sophisticated instrumentation, skilled personnel, and are often unsuitable for rapid screening [39] [40].
Electrochemical immunosensors have emerged as promising alternatives, leveraging the specificity of antibody-antigen interactions with the sensitivity and portability of electrochemical transducers [39]. However, to gain acceptance for regulatory and diagnostic applications, these novel biosensors require rigorous validation against established reference methods. This case study examines a comprehensive cross-validation of a novel electrochemical immunosensor for total aflatoxins against the LC-MS/MS reference method, focusing on performance metrics, methodological workflows, and practical applicability in analyzing pistachio samples [41].
Methodology and Experimental Protocols
Electrochemical Immunosensor Workflow
The validated immunosensor employed a competitive assay format on screen-printed carbon electrodes (SPCEs), a design chosen for its disposability and suitability for point-of-need analysis [41].
- Assay Principle: A competitive format was implemented, where free aflatoxins from the sample compete with a fixed concentration of aflatoxin-bovine serum albumin (AF-BSA) conjugate for binding sites on immobilized anti-aflatoxin antibodies [41] [42]. The degree of signal reduction is inversely proportional to the aflatoxin concentration in the sample.
- Electrode Modification: Screen-printed carbon electrodes served as the foundational platform. The surface was functionalized to enable efficient and stable immobilization of the capture antibodies [41].
- Detection Technique: The specific electrochemical technique used was not explicitly detailed in the search results, but common approaches for such sensors include amperometry or electrochemical impedance spectroscopy (EIS) [43]. The sensor's response was measured after the immunocomplex formation.
- Matrix Effect Mitigation: To address the complex pistachio matrix, the study employed matrix-matched calibrators. This critical step involves preparing calibration standards in a blank pistachio extract, which corrects for signal suppression or enhancement caused by matrix components, ensuring accurate quantification [41].
LC-MS/MS Reference Method
The confirmatory analysis was conducted using LC-MS/MS, a benchmark technique for mycotoxin quantification due to its high specificity and sensitivity [41] [40].
- Extraction and Cleanup: Aflatoxins were extracted from the pistachio matrix using immunoaffinity columns (IACs). These columns contain antibodies specific to aflatoxins, which selectively bind and concentrate the target analytes while removing interfering substances [41].
- Chromatographic Separation: The purified extract was separated using a reversed-phase C18 column. A binary mobile phase gradient, typically composed of water and methanol/acetonitrile mixtures with modifiers like formic acid or ammonium salts, was used to achieve optimal separation of AFB1, AFB2, AFG1, and AFG2 [40].
- Mass Spectrometric Detection: Detection was performed using a triple quadrupole mass spectrometer operating in Multiple Reaction Monitoring (MRM) mode. This mode enhances selectivity by monitoring specific precursor ion > product ion transitions for each aflatoxin, as illustrated in Table 3 [40].
Cross-Validation Protocol
Pistachio samples, both naturally contaminated and spiked with known aflatoxin concentrations, were analyzed in parallel using the developed electrochemical immunosensor and the reference LC-MS/MS method. The results were compared to evaluate the accuracy, precision, and correlation between the two platforms [41].
Diagram 1: Experimental workflow for cross-validation of immunosensor and LC-MS/MS.
Results and Performance Comparison
Analytical Performance Metrics
The electrochemical immunosensor demonstrated performance characteristics that are highly competitive with the LC-MS/MS reference method, as detailed in Table 1.
Table 1: Comparative Analytical Performance of the Immunosensor and LC-MS/MS
| Parameter | Electrochemical Immunosensor | LC-MS/MS (Reference) |
|---|---|---|
| Target Analyte | Total Aflatoxins (sum of AFB1, AFB2, AFG1, AFG2) | Total Aflatoxins (sum of AFB1, AFB2, AFG1, AFG2) [41] |
| Linear Range | 0.01 - 2 μg L⁻¹ (in buffer) [41] | Information not specified in search results |
| Limit of Detection (LOD) | 0.066 μg kg⁻¹ (in pistachio) [41] | Information not specified in search results |
| Reproducibility (RSD) | 2% (Good) [41] | Information not specified in search results |
| Analysis Time | Rapid (Implied) [41] | Longer (Implied, requires chromatographic run) |
| Cost & Portability | Lower cost, portable instrumentation [41] | High cost, laboratory-bound [39] |
| Recovery in Pistachio | 87 - 106% [41] | Information not specified in search results |
The immunosensor's LOD of 0.066 μg kg⁻¹ is well below the maximum levels for total aflatoxins in pistachios set by the European Union (15 μg kg⁻¹), confirming its suitability for regulatory compliance testing [41].
Cross-Validation and Correlation Data
The agreement between the two methods was evaluated by analyzing aflatoxin levels in a set of pistachio samples. The results, summarized in Table 2, show a strong correlation.
Table 2: Cross-Validation Results for Aflatoxin Concentration in Pistachio Samples
| Sample ID | Electrochemical Immunosensor Result (μg kg⁻¹) | LC-MS/MS Result (μg kg⁻¹) | Recovery (%) |
|---|---|---|---|
| Pistachio 1 | 4.56 | Not Specified | - |
| Pistachio 2 | 50.86 | Not Specified | - |
| Spiked/Contaminated Samples | Range Reported | Range Reported | 87 - 106 [41] |
| Overall Correlation | An excellent correlation was reported [41] |
The recovery rates between 87% and 106% indicate high accuracy and minimal matrix interference when using the immunosensor with matrix-matched calibration [41]. The study reported "an excellent correlation" between the two methods, validating the immunosensor's quantitative reliability [41].
Selectivity and Stability
The immunosensor exhibited excellent specificity for aflatoxins.
- Selectivity: It successfully differentiated aflatoxins from other mycotoxins such as zearalenone and ochratoxin A, as well as common food matrix interferents like glucose, Na⁺, and K⁺ [41]. This high selectivity is crucial for accurate analysis in complex food samples.
- Stability: The sensor maintained its performance for at least 30 days at room temperature, highlighting the robustness of the immobilized biorecognition layer and its potential for field deployment [41].
The Scientist's Toolkit: Key Research Reagents and Materials
Successful development and validation of such analytical platforms rely on critical reagents and materials. Table 3 lists essential components for the featured immunosensor and the reference LC-MS/MS method.
Table 3: Essential Research Reagents and Materials for Aflatoxin Analysis
| Item | Function / Role | Application in Method |
|---|---|---|
| Anti-Aflatoxin Antibodies | Biorecognition element; binds specifically to aflatoxin molecules. | Immunosensor, Immunoaffinity Cleanup [41] |
| Screen-Printed Carbon Electrodes (SPCEs) | Disposable, miniaturized electrochemical transduction platform. | Immunosensor [41] [44] |
| Aflatoxin-BSA Conjugate | Critical reagent for the competitive assay format on the sensor surface. | Immunosensor [42] |
| Immunoaffinity Columns (IACs) | Sample cleanup; selectively bind and concentrate aflatoxins from extracts. | LC-MS/MS, Immunosensor Sample Prep [41] |
| LC-MS/MS Grade Solvents | Mobile phase components; require high purity to avoid signal suppression. | LC-MS/MS [40] |
| Aflatoxin Isotopically Labeled Internal Standards | Added to sample to correct for matrix effects and losses during sample preparation. | LC-MS/MS [40] |
| Matrix-Matched Calibrators | Calibration standards prepared in blank matrix extract to correct for matrix effects. | Immunosensor, LC-MS/MS [41] |
Discussion
Technological Comparison of Detection Mechanisms
The fundamental principles of the two techniques are distinct, which explains their complementary strengths. The following diagram illustrates the core signaling mechanism of the electrochemical immunosensor.
Diagram 2: Core signaling mechanism of the competitive electrochemical immunosensor.
- Electrochemical Immunosensor: This platform relies on a biorecognition event (antibody-antigen binding) that is directly transduced into an electrical signal (current or impedance change) [39]. The competitive assay format, shown in Diagram 2, is ideal for detecting small molecules like aflatoxins. The signal is inversely proportional to the analyte concentration.
- LC-MS/MS: This technique separates compounds based on their physicochemical properties (chromatography) and identifies them based on their mass-to-charge ratio (mass spectrometry) [40]. Its superiority lies in its powerful confirmatory capability, as it can distinguish and individually quantify specific aflatoxin analogues (AFB1, AFB2, etc.) based on their unique molecular masses and fragmentation patterns, as shown in Table 4.
Table 4: LC-MS/MS MRM Transitions for Aflatoxin Analysis [40]
| Analyte | Precursor Ion (m/z) | Product Ion (m/z) |
|---|---|---|
| Aflatoxin B1 (AFB1) | 313.1 | 269, 285 |
| Aflatoxin B2 (AFB2) | 315 | 259, 287 |
| Aflatoxin G1 (AFG1) | 329 | 243, 283 |
| Aflatoxin G2 (AFG2) | 331 | 313, 245, 257 |
| Aflatoxin M1 (AFM1) | 329 | 273, 259, 301 |
| Aflatoxin M2 (AFM2) | 331 | 273 |
Strategic Application and Outlook
The cross-validation data firmly positions the electrochemical immunosensor as an excellent tool for rapid screening. Its speed, cost-effectiveness, and portability make it ideal for high-throughput analysis at points of need, such as food processing facilities or ports of entry [41]. Samples identified as contaminated by the screening can then be forwarded for confirmatory analysis using LC-MS/MS.
This tandem approach optimizes resource allocation: the immunosensor reduces the operational burden on expensive LC-MS/MS instrumentation, which is reserved for confirmatory testing and method development. Future developments will likely focus on multiplexing (detecting multiple mycotoxins simultaneously) and further integration of sensors with automated sample preparation and data handling systems [39] [45].
This case study demonstrates that the developed electrochemical immunosensor provides a simpler, cheaper, and more rapid alternative for aflatoxin screening, while exhibiting sensitivity and accuracy comparable to ELISA and LC-MS/MS when cross-validated [41]. The excellent correlation with the reference LC-MS/MS method, combined with its low LOD, high reproducibility, and robustness, makes the immunosensor a promising and reliable tool for the decentralized monitoring of total aflatoxins, effectively contributing to the enhancement of food safety protocols.
In the journey from drug discovery to clinical application, the reliability of analytical data is paramount. The integration of real-time biosensing and high-resolution chromatographic methods creates a robust framework for decision-making across the drug development pipeline. This guide objectively compares the performance of these complementary technologies, focusing on their specific applications in fermentation process monitoring and clinical biomarker validation. Biosensors provide rapid, on-line data critical for process control, while chromatography-mass spectrometry (MS) platforms deliver the definitive identification and validation required for clinical decision-making. The synergy between these methods enables researchers to move from macroscopic process observation to microscopic biomarker analysis with validated confidence, ultimately accelerating the development of safer, more effective therapeutics.
Fermentation Monitoring: Real-Time Biosensing vs. Chromatographic Analysis
Fermentation processes are crucial for producing a wide range of biopharmaceuticals, and their monitoring presents a classic trade-off between speed and comprehensiveness.
Performance Comparison of Monitoring Techniques
The table below summarizes the core performance characteristics of biosensor and chromatographic methods for monitoring key fermentation parameters.
Table 1: Performance Comparison of Analytical Techniques in Fermentation Monitoring
| Analyte/Parameter | Technology | Detection Range | Analysis Time | Key Performance Metrics | References |
|---|---|---|---|---|---|
| Glucose | Electrochemical Biosensor | Up to 150 mM | < 5 minutes | Robust in complex broth; minimal cross-talk | [46] |
| Glucose | HPLC with RI Detector | Not Specified | > 15 minutes | Resource and time-intensive; reference method | [46] |
| Ethanol | Benchtop NMR Spectroscopy | Not Specified | Real-time | Enables quantification of multiple components simultaneously | [47] |
| Ethanol | HPLC | Not Specified | Off-line | Requires sampling; slower turnaround | [48] |
| pH, Temp, DO, Conductivity | Nanostructured Microsensor Array | Not Specified | Real-time | Highly sensitive and specific; minimal cross-talk | [49] |
| Microbial Activity | Isothermal Microcalorimetry | Not Specified | 4.7 - 18.6 hours | Tracks metabolic activity (e.g., Lactobacillus plantarum) | [50] |
Experimental Protocols for Technology Evaluation
Protocol 1: Validating a Glucose Biosensor in Fed-Batch Fermentation This protocol is adapted from the application of a commercial electrochemical biosensor platform for yeast fermentation [46].
- Biosensor Platform: Utilize a flow-through-cell biosensor chip (e.g., B.LV5) with integrated Pt-working and counter electrodes, connected to a potentiostat.
- Integration: Connect the biosensor to the bioreactor via a pump and tubing (e.g., Ismatec, TYGON S3TM) with luer fittings.
- Measurement: For at-line analysis, pump the sample (cell-free or cell-containing) through the biosensor. For on-line monitoring, integrate the sensor into a continuous flow path from the bioreactor.
- Reference Analysis: Correlate biosensor readings with off-line measurements from a reference method such as HPLC (e.g., Agilent 1260) using a refractive index detector.
- Data Collection: Operate the biosensor via dedicated software (e.g., bioMON) to record amperometric signals, which are converted to glucose concentration.
Protocol 2: Monitoring Fermentation via Benchtop NMR This protocol outlines the use of benchtop NMR for real-time quantification of multiple fermentation metabolites [47].
- Setup: Use a benchtop NMR spectrometer equipped with an automated flow system connected to the bioreactor.
- Data Acquisition: Collect
1H NMRspectra continuously or at set intervals throughout the fermentation process (e.g., for both batch and fed-batch wine fermentations). - Quantitative Analysis: Process the complex spectral data using a model-based tool (e.g., "AutoWine-tool") that relies on quantum mechanical models to deconvolute overlapping signals and quantify specific compounds like ethanol, organic acids, and sugars.
- Validation: Validate the NMR quantification method against gravimetrically prepared test mixtures representing known fermentation stages.
Clinical Biomarker Analysis: Biosensor Screening and Chromatographic Validation
The transition from fermentation monitoring to clinical applications underscores the critical role of analytical validation in biomarker development.
Analytical Method Validation vs. Clinical Qualification
A key distinction in biomarker development is between analytical method validation and clinical qualification [51].
- Analytical Validation is the process of assessing an assay's performance characteristics, establishing the reproducibility and accuracy of the measurements it generates.
- Clinical Qualification is the evidentiary process of linking a biomarker with biological processes and clinical endpoints.
This "fit-for-purpose" approach ensures the analytical method is sufficiently validated for its intended use in the drug development process, whether for early research or definitive clinical decision-making [51].
Performance Comparison of Biomarker Analysis Techniques
The table below compares the capabilities of biosensors and LC-MS-based methods for biomarker analysis, highlighting their distinct yet complementary roles.
Table 2: Performance Comparison of Techniques in Clinical Biomarker Analysis
| Analyte/Parameter | Technology | Detection Principle | Throughput | Key Advantages | References |
|---|---|---|---|---|---|
| Pathogens (e.g., E. coli, Salmonella) | Electrochemical/Optical Biosensors | Biological recognition (antibodies, aptamers) | Minutes (e.g., 20 min for E. coli) | Rapid, real-time detection; portable platforms | [50] |
| Low-Abundance Protein Biomarkers | LC-MS with Stable Isotope Labeling (SILAC, iTRAQ, TMT) | Mass-to-charge ratio (m/z) | Hours (incl. sample prep) | High sensitivity & specificity; multiplexing; precise quantification | [52] |
| Low-Abundance Protein Biomarkers | Label-Free LC-MS | Spectral count or signal intensity | Hours (incl. sample prep) | Ability to analyze any number of samples; cost-effective | [52] |
| Cancer Biomarkers (Metabolites) | GC-MS, LC-MS, UPLC | Mass-to-charge ratio (m/z) | Hours (incl. sample prep) | Powerful for metabolic profiling and biomarker identification | [53] |
Experimental Protocol: LC-MS-Based Protein Biomarker Quantification
This protocol details a stable isotope labeling approach for robust quantification of low-abundance protein biomarkers, a common challenge in clinical proteomics [52].
- Sample Preparation: Extract proteins from clinical samples (e.g., plasma, tissue). Digest the proteins into peptides using an enzyme like trypsin.
- Chemical Labeling: Use isobaric tags (e.g., Tandem Mass Tags - TMT) to label peptides from different samples (e.g., healthy vs. disease). This allows for multiplexing, where up to 16 different samples can be pooled and analyzed simultaneously.
- LC-MS/MS Analysis:
- Chromatography: Separate the complex peptide mixture using ultra-high-performance liquid chromatography (UHPLC) on a reverse-phase column.
- Mass Spectrometry: Analyze the eluting peptides with a high-resolution mass spectrometer (e.g., Orbitrap analyzer). In MS2 mode, the TMT reporter ions are released, providing quantitative data.
- Data Analysis: Use specialized software to identify proteins based on peptide sequences and quantify their abundance across samples by integrating the signals from the TMT reporter ions. Account for potential "ratio compression" due to signal interference.
The Scientist's Toolkit: Essential Research Reagent Solutions
The following reagents and materials are fundamental to executing the experiments and protocols described in this guide.
Table 3: Key Research Reagent Solutions and Their Functions
| Reagent/Material | Function | Application Context |
|---|---|---|
| Stable Isotope Labels (SILAC, iTRAQ, TMT) | Enable precise, multiplexed quantification of proteins and peptides in complex mixtures by introducing a mass signature. | LC-MS-based Proteomics [52] |
| Isobaric Tags (TMT, iTRAQ) | Chemical labels that bind to peptides, allowing for simultaneous quantification of multiple samples in a single MS run. | Biomarker Discovery & Verification [52] |
| Nanostructured Platinum (nano-Pt) Electrodes | Enhance sensor sensitivity, specificity, and linear range by increasing the active surface area; enable reliable sensing at lower potentials. | Electrochemical Microsensors [49] |
| Glucose Oxidase (GOx) Enzyme | Serves as the biorecognition element in biosensors, catalyzing a reaction with glucose to produce a measurable electrochemical signal. | Glucose Biosensors [46] |
| Apoptosis/Cell Death Reagents | Not explicitly detailed in search results, but standard tools for measuring cytotoxicity and cell viability in drug safety assessment. | Preclinical Toxicity Evaluation [51] |
| Antibodies & Aptamers | Act as biological recognition elements for specific pathogens or biomarkers, providing high selectivity. | Optical/Electrochemical Biosensors [50] |
Integrated Workflows: From Process Monitoring to Clinical Validation
The true power of these analytical tools is realized when they are integrated into a cohesive workflow, bridging the gap between bioprocess development and clinical analysis. The following diagrams illustrate these interconnected pathways.
Workflow for Biosensor Validation in Drug Development
Workflow for Clinical Biomarker Analysis & Qualification
This comparison elucidates that the choice between biosensors and chromatographic methods is not a matter of superiority, but of strategic application aligned with the stage and requirement of the drug development process. Biosensors excel in providing immediate, actionable data for process control and rapid screening, while chromatographic methods provide the unassailable analytical validation required for clinical decision-making and regulatory approval. The ongoing integration of these platforms—where biosensors enable real-time control and chromatography provides definitive validation—creates a powerful, data-driven framework. This synergy is revolutionizing drug development, paving the way for more efficient bioprocesses, reliable biomarkers, and ultimately, safer and more effective personalized therapeutics.
Overcoming Challenges: Systematic Optimization of Biosensor Performance
The transition from biosensor-based screening to definitive confirmatory analysis represents a critical juncture in bioanalytical science, particularly in pharmaceutical development and clinical diagnostics. Biosensors offer compelling advantages for rapid, cost-effective analysis, yet their results must be validated against established reference methods to ensure accuracy and regulatory acceptance. This guide objectively compares the performance of biosensor technologies with gold-standard chromatography and mass spectrometry methods, focusing on three pervasive analytical pitfalls: matrix effects, cross-reactivity, and signal drift. Within the broader thesis of validating biosensor results with chromatography methods, this comparison provides researchers and drug development professionals with the experimental data and protocols necessary to critically assess analytical performance and implement robust cross-validation strategies.
Matrix Effects: Biosensor versus Chromatographic Mitigation Strategies
Matrix effects—where sample components interfere with analyte detection—represent a fundamental challenge across analytical platforms. The approaches to combat these effects, however, differ significantly between biosensors and chromatographic systems, leading to distinct performance profiles.
Table 1: Comparison of Matrix Effect Handling Across Platforms
| Analytical Platform | Primary Mitigation Strategy | Key Experimental Findings | Residual Challenges |
|---|---|---|---|
| Biosensors | Bioreceptor specificity, sample dilution, membrane filtration | Up to 43% signal suppression reported in complex matrices like meat extracts [54]; Cross-reactive bioreceptors can exacerbate interference. | Limited capacity for full matrix separation; Specificity is analyte-dependent. |
| LC-MS/MS | Stable Isotope-Labeled Internal Standards (SIL-IS), chromatographic separation | SIL-IS corrects for both ionization suppression and variable extraction efficiency, improving accuracy by 70-95% in clinical samples [55]. | High cost of SIL-IS; Commutability of calibrator matrix [55]. |
| ICP-MS | Common Analyte Internal Standardization (CAIS), collision/reaction cells | CAIS chemometry corrected errors as large as 43% from drift and non-spectroscopic matrix effects in geological/water samples [56]. | Requires sophisticated chemometric modeling. |
Experimental Protocol: Evaluating Matrix Effects
A standard protocol to quantify matrix effects involves a spike-and-recovery experiment [55].
- Sample Preparation: Prepare three sets of samples:
- Set A (Standard in Solvent): Spiked analyte standards in a pure, matrix-free solvent.
- Set B (Spiked Matrix): The same analyte standards spiked into a pre-processed sample of the biological matrix (e.g., plasma, urine, tissue homogenate).
- Set C (Native Matrix): The unspiked biological matrix to determine the baseline.
- Analysis: Analyze all sets using both the biosensor and the reference chromatographic method (e.g., LC-MS/MS).
- Calculation: Calculate the percent recovery for each platform:
- % Recovery = (Measured Concentration in Set B – Measured Concentration in Set C) / Known Concentration Spiked into Set B × 100%.
- Interpretation: Recoveries of 85-115% are typically acceptable. Significant deviation indicates substantial matrix interference. For LC-MS/MS, the use of a SIL-IS should result in recoveries close to 100%, demonstrating effective compensation [55].
Figure 1: Experimental workflow for evaluating matrix effects via spike-and-recovery.
Cross-Reactivity: Specificity in Recognition versus Separation
Cross-reactivity occurs when an analytical system mistakenly responds to structurally similar compounds instead of only the target analyte. Biosensors and chromatographic methods manage this risk through fundamentally different principles.
Experimental Protocol: Assessing Cross-Reactivity
The standard method is a interferent challenge test [54].
- Select Interferents: Compile a list of structurally analogous compounds, common metabolites, and concomitant medications likely to be present in the sample.
- Prepare Solutions: Prepare separate solutions of the target analyte and each potential interferent at physiologically relevant high concentrations (e.g., 10-100x the expected level of the analyte).
- Individual Analysis: Analyze each solution individually using the biosensor and LC-MS/MS.
- Calculate Cross-Reactivity: For any interferent producing a signal, calculate the cross-reactivity percentage:
- % Cross-Reactivity = (Measured Concentration of Interferent / Actual Concentration of Interferent) × 100%.
- Chromatographic Resolution: In LC-MS/MS, cross-reactivity is assessed by the resolution of chromatographic peaks. The lack of a signal at the target's specific retention time confirms specificity.
Table 2: Cross-Reactivity Management in Analytical Platforms
| Feature | Biosensors | Chromatography/Mass Spectrometry |
|---|---|---|
| Specificity Basis | Molecular recognition (e.g., antibody, aptamer) [54] | Physical separation (chromatography) & mass filtering (MS) |
| Typical % Cross-Reactivity | Can be >5% for close structural analogs, depending on bioreceptor quality [57] | Effectively 0% when analyte and interferent are separated in retention time and/or mass |
| Key Advantage | High specificity is "built-in" to the bioreceptor | Specificity is a function of the method's physical parameters |
| Key Disadvantage | Must be re-verified for each new analyte/interferent pair | Requires method development to achieve separation |
Signal Drift: Temporal Instability and Correction Techniques
Signal drift—the change in instrument response over time without change in analyte concentration—compromises the accuracy of long-term and multi-batch studies. Correction strategies range from hardware-based to computational.
Experimental Protocol: Quantifying and Correcting Signal Drift
The standard practice for quantifying drift involves the repeated analysis of a quality control (QC) sample [58].
- QC Sample Preparation: Prepare a large, homogeneous pool of the sample matrix (e.g., pooled plasma) containing the target analyte at a mid-range concentration. Aliquot and store frozen at -80°C.
- Experimental Design: Analyze the QC sample repeatedly at regular intervals (e.g., after every 5-10 experimental samples) throughout the entire analytical run or batch.
- Data Collection: Record the instrument response (e.g., peak area in LC-MS, current in biosensor) for the QC sample at each interval.
- Drift Modeling: Plot the QC response against the injection sequence or time. Model the drift pattern using algorithms like LOESS (Locally Estimated Scatterplot Smoothing) or quadratic regression [58].
- Data Correction: Apply the inverse of the drift model to the raw data from the experimental samples to correct their values.
Figure 2: Workflow for quantifying and correcting signal drift using QC samples.
Table 3: Signal Drift Correction Across Analytical Platforms
| Method | Primary Drift Correction Approach | Performance Data | Limitations |
|---|---|---|---|
| FET Biosensor Arrays with ML | Machine Learning (e.g., Deep Neural Networks) on multi-sensor array data [59] | 73% reduction in RMSE over standard calibration in continuous pH monitoring over 90 days [59] | Requires large initial dataset for model training. |
| ICP-MS | Common Analyte Internal Standardization (CAIS) [56] | Corrected up to 25% drift error for 15 analytes across different geological matrices [56] | Application is dependent on internal standard behavior. |
| LC-MS Metabolomics | QC-Sample based correction (e.g., LOESS, Quadratic) [58] | QC-based correction significantly improved correlation with isotope-standard normalized data [58] | Requires interruption of analysis for QC runs. |
The Scientist's Toolkit: Essential Research Reagents and Materials
Successful validation requires specific, high-quality materials. The following table details key reagents and their critical functions in mitigating the discussed pitfalls.
Table 4: Essential Research Reagents for Method Validation
| Reagent / Material | Function & Rationale | Application Context |
|---|---|---|
| Stable Isotope-Labeled Internal Standard (SIL-IS) | Gold-standard for compensating matrix effects and signal drift in MS; corrects for analyte loss during preparation and ionization suppression/enhancement [55]. | LC-MS/MS, ICP-MS |
| Quality Control (QC) Sample Pool | A homogeneous sample used to monitor and correct for signal drift and long-term reproducibility over an analytical sequence [58]. | All platforms (Biosensors, LC-MS, ICP-MS) |
| Matrix-Matched Calibrators | Calibration standards prepared in a matrix similar to the sample to minimize bias from differential matrix effects [55]. | All platforms |
| Stripped/Blank Matrix | A matrix depleted of the target analyte, used to prepare calibration standards for endogenous compounds [55]. | LC-MS/MS, Biosensor development |
| Cross-Reactivity Panel | A set of pure compound solutions for challenging the assay to establish specificity and quantify % cross-reactivity [54]. | Biosensor development, Immunoassays |
| Collision/Reaction Cell Gases | Gases (e.g., He, H2, NH3) used in ICP-MS to remove polyatomic spectral interferences via chemical reactions or kinetic energy discrimination [60]. | ICP-MS |
This comparison guide underscores that while biosensors and chromatographic methods share common analytical pitfalls, their mitigation strategies and resultant performance are distinct. Biosensors, leveraging biological recognition and increasingly supported by machine learning, offer rapid and integrated correction, particularly for drift [59]. In contrast, chromatographic and mass spectrometric methods rely on physical separation, internal standardization, and robust calibration practices to achieve high accuracy and specificity [55] [56]. The validation of biosensor results within a chromatography framework is therefore not a simple substitution but a complementary process. It requires a careful, evidence-based assessment of how each technology handles matrix effects, cross-reactivity, and signal drift in the specific sample matrix of interest. The experimental protocols and data summarized here provide a foundation for researchers in drug development and beyond to design these critical validation studies, ensuring that the speed of biosensors can be confidently paired with the proven accuracy of chromatographic gold standards.
Leveraging Design of Experiments (DoE) for Efficient Biosensor Optimization
The development of robust, high-performance biosensors is a multidimensional challenge that requires careful balancing of numerous fabrication and operational parameters. Traditional one-factor-at-a-time (OFAT) optimization approaches, while straightforward, require significant experimental work and only provide local optima without considering possible interactions among factors [61]. For biosensors intended to deliver reliable results in point-of-care diagnostics, drug development, and environmental monitoring, this suboptimal approach can hinder widespread adoption [62] [9].
Design of Experiments (DoE) has emerged as a powerful chemometric tool that enables systematic, statistically sound optimization of biosensor platforms. This methodology employs a model-based optimization approach, developing a data-driven model that connects variations in input variables to sensor outputs while accounting for interaction effects [62]. The application of DoE is particularly crucial for ultrasensitive biosensing platforms with sub-femtomolar detection limits, where challenges like enhancing signal-to-noise ratio, improving selectivity, and ensuring reproducibility are most pronounced [62] [9].
Framed within the broader context of validating biosensor results against chromatography methods, proper optimization through DoE provides the foundational reliability needed for such comparative analyses. This review explores the application of DoE methodologies across diverse biosensor platforms, provides detailed experimental protocols, and demonstrates how optimized biosensors can deliver performance characteristics that rival traditional analytical techniques.
DoE Versus Traditional Approaches: A Methodological Comparison
Fundamental Limitations of One-Factor-at-a-Time Optimization
The conventional OFAT approach varies a single parameter while holding all others constant, creating a limited, localized understanding of the biosensor's operational landscape. This method fails to detect factor interactions, which occur when one independent variable exerts varying effects on the response based on the values of another independent variable [62]. Such interactions consistently elude detection in OFAT approaches but are critical in complex biosensor systems where materials, biological components, and detection conditions interact in non-linear ways [9].
Additionally, OFAT optimization requires a larger number of experiments to explore the same experimental space and provides no mathematical model to predict behavior under untested conditions [61]. This results in a resource-intensive process that may miss the true global optimum configuration for maximum biosensor performance.
Advantages of Multivariate Optimization Through DoE
Design of Experiments employs structured, statistical approaches to simultaneously vary multiple factors according to predetermined experimental plans. This enables researchers to:
- Capture interaction effects between multiple variables using efficient experimental designs [61]
- Develop predictive mathematical models that describe the relationship between factors and responses [62]
- Reduce total experimental effort by exploring multiple factors in parallel rather than sequentially [9]
- Identify optimal conditions with comprehensive coverage of the experimental domain [62]
- Assign statistical significance to each factor's effect on biosensor performance [63]
The resulting data-driven models not only guide optimization but can also offer insights into the fundamental mechanisms underlying transduction and amplification processes [9].
Table 1: Comparison of OFAT versus DoE Optimization Approaches
| Characteristic | One-Factor-at-a-Time | Design of Experiments |
|---|---|---|
| Factor Interactions | Not detectable | Measured and quantified |
| Experimental Efficiency | Low (many experiments required) | High (efficient experimental layouts) |
| Model Output | No predictive model | Mathematical model of system behavior |
| Optimum Identification | Local optimum likely | Global optimum possible |
| Statistical Power | Limited | Formal significance testing |
Experimental Designs for Biosensor Optimization
Key DoE Methodologies and Applications
Various experimental designs serve different purposes in the biosensor optimization workflow, from initial screening to final optimization:
Factorial Designs are first-order orthogonal designs used for screening important factors and identifying interactions. In a 2^k factorial design, each of k factors is investigated at two levels (coded as -1 and +1), requiring 2^k experiments [62] [9]. For example, a 2^2 factorial design investigating incubation time and temperature would include four experiments: both factors at low levels, both at high levels, and one factor high while the other low [9].
Definitive Screening Designs (DSD) allow efficient examination of multiple factors with minimal experimental runs. For instance, Aw et al. used iterative rounds of DSD to optimize an RNA integrity biosensor, achieving a 4.1-fold increase in dynamic range and reducing RNA concentration requirements by one-third [64].
Central Composite Designs (CCD) are second-order designs used for optimization when response curvature is suspected. These designs augment factorial designs with additional points to estimate quadratic terms, enabling the modeling of non-linear relationships [63]. For example, researchers developing a solid-phase microextraction method for volatile methylsiloxanes used CCD after initial screening to optimize five key factors, resulting in a method with detection limits as low as 24 ng/L [63].
Mixture Designs are specialized for formulations where components must sum to 100%, such as preparing specific surface chemistry cocktails or hydrogel matrices for biosensor interfaces [62].
DoE Workflow Implementation
A typical DoE workflow for biosensor optimization involves multiple iterative phases [62] [9]:
- Screening Phase: Identify which of many potential factors significantly affect biosensor performance
- Optimization Phase: Determine optimal levels for significant factors identified in screening
- Robustness Testing: Verify that optimal conditions perform consistently under small variations
Throughout this process, it's advisable not to allocate more than 40% of available resources to the initial experimental set, preserving resources for subsequent optimization rounds [62].
Case Studies: Successful DoE Implementation in Biosensor Development
Optimization of Electrochemical Biosensors for Food Safety
Electrochemical biosensors represent a significant area where DoE has driven improvements in analytical performance. These biosensors typically involve multiple fabrication steps including electrode preparation, surface modification with nanostructures, and immobilization of biological recognition elements [61]. Each step introduces multiple variables that can interact in complex ways.
Researchers have employed multivariate optimization to construct electrochemical biosensors for detecting diverse analytes including mycotoxins, bacteria, pesticides, antibiotics, and heavy metals [61]. The systematic approach has proven particularly valuable when optimizing the interface between nanomaterials and biological recognition elements, where subtle changes in immobilization conditions can significantly impact biosensor sensitivity, selectivity, and stability [61].
Tuning Transcription Factor-Based Biosensors
A compelling example of DoE application comes from the development of transcriptional biosensors for terephthalic acid (TPA) detection. Researchers simultaneously engineered the core promoter and operator regions of a responsive promoter, employing a dual refactoring approach to explore an enhanced biosensor design space [65].
The DoE framework enabled efficient sampling of complex sequence-function relationships in genetic circuits, allowing the team to develop tailored biosensors with enhanced dynamic range, diverse signal output, sensitivity, and steepness [65]. The optimized biosensors were subsequently applied for primary screening of PET hydrolases and enzyme condition screening, demonstrating the practical utility of statistically-optimized biosensors in industrial and environmental applications [65].
Table 2: Performance Improvements Achieved Through DoE Optimization in Various Biosensors
| Biosensor Type | Target Analyte | Optimization Method | Performance Improvement |
|---|---|---|---|
| RNA Integrity Biosensor [64] | mRNA integrity | Definitive Screening Design | 4.1-fold increase in dynamic range, 33% reduction in sample requirement |
| Transcriptional Biosensor [65] | Terephthalic acid (TPA) | Custom DoE framework | Enhanced dynamic range, sensitivity, and steepness |
| GEM Biosensor [33] | Cd²⁺, Zn²⁺, Pb²⁺ | Systematic validation | Linear detection in 1-6 ppb range with R² > 0.97 |
| SPME-GC-FID [63] | Volatile methylsiloxanes | Central Composite Design | Detection limits up to 24 ng/L, RSD < 15% |
Experimental Protocols: Implementing DoE for Biosensor Optimization
Protocol 1: Screening Significant Factors Using Factorial Design
Objective: Identify which factors significantly influence biosensor performance metrics (e.g., sensitivity, signal-to-noise ratio, response time) [62].
Step-by-Step Procedure:
- Select Factors and Ranges: Choose k factors for investigation (e.g., probe concentration, incubation time, temperature, pH) based on prior knowledge or preliminary experiments
- Create Experimental Matrix: Construct a 2^k factorial design matrix with coded factor levels (-1 for low level, +1 for high level)
- Randomize Run Order: Randomize the execution order of experiments to minimize systematic bias
- Execute Experiments: Perform all 2^k experiments according to the randomized schedule
- Measure Responses: Record relevant performance metrics for each experimental run
- Calculate Factor Effects: Compute main effects and interaction effects using statistical software
- Identify Significant Factors: Determine statistically significant factors (typically p < 0.05) for further optimization
Example Implementation: A researcher developing an electrochemical aptasensor might investigate four factors: aptamer concentration (0.5-2.0 μM), incubation time (15-60 minutes), incubation temperature (25-37°C), and buffer pH (6.5-7.5) using a 2^4 factorial design (16 experiments). The analysis might reveal that aptamer concentration and incubation time have significant main effects, while an interaction exists between temperature and pH.
Protocol 2: Response Optimization Using Central Composite Design
Objective: Determine optimal levels of significant factors identified during screening to maximize biosensor performance [63].
Step-by-Step Procedure:
- Select Significant Factors: Choose 3-5 most significant factors from screening experiments
- Design CCD Matrix: Create a central composite design incorporating factorial points, axial points, and center points
- Execute Experiments: Perform all experimental runs in randomized order
- Fit Response Surface Model: Use regression analysis to fit a second-order polynomial model
- Validate Model: Check model adequacy through residual analysis and lack-of-fit tests
- Locate Optimum: Use contour plots and optimization algorithms to identify factor levels that maximize desirability function
- Confirm Predictions: Perform verification experiments at predicted optimum conditions
Example Implementation: Following the aptasensor example, the researcher might apply CCD to optimize the three most significant factors: aptamer concentration (0.5-2.0 μM), incubation time (15-60 minutes), and buffer pH (6.5-7.5). The fitted model might predict optimum performance at 1.2 μM aptamer concentration, 42-minute incubation, and pH 7.1, which would then be verified experimentally.
DoE-Optimized Biosensors Versus Chromatography Methods
Comparative Performance in Analytical Applications
The rigorous optimization enabled by DoE approaches allows biosensors to achieve performance characteristics that rival established chromatography methods in specific applications. For instance, a DoE-optimized solid-phase microextraction/gas chromatography with flame ionization detection method for volatile methylsiloxanes in water achieved detection limits up to 24 ng/L with good precision (RSD < 15%) and accuracy ranging from 62% to 104% across different water matrices [63]. These performance metrics make the optimized method suitable for screening applications before confirmation with more complex equipment like GC-MS [63].
Similarly, properly optimized biosensor assays can demonstrate excellent precision, as evidenced by a BIAcore 2000 biosensor assay which showed intra- and inter-assay coefficients of variation below 8% for measuring serum concentrations of a humanized monoclonal antibody while simultaneously detecting induced antibodies [66].
Validation Frameworks for Biosensor Methods
For biosensors intended as alternatives to chromatography methods, proper validation is essential. Key validation parameters for biosensor assays include [66]:
- Precision (repeatability and intermediate precision)
- Accuracy (through recovery studies or comparison with reference methods)
- Linearity and working range
- Limit of Detection (LOD) and Limit of Quantification (LOQ)
- Specificity and selectivity
- Robustness (using DoE to test small deliberate variations)
Broad spectrum biosensors capable of detecting multiple analytes present unique validation challenges. Rather than validating each potential analyte individually, a representative subset approach can demonstrate that the biosensor technology performs consistently across classes of analytes [17].
DoE-Driven Biosensor Optimization and Validation Workflow
Essential Research Reagent Solutions for DoE-Optimized Biosensors
Successful implementation of DoE for biosensor optimization requires access to high-quality reagents and materials. The following table details key research reagent solutions and their functions in biosensor development and optimization:
Table 3: Essential Research Reagent Solutions for Biosensor Development and Optimization
| Reagent/Material | Function in Biosensor Development | Representative Examples |
|---|---|---|
| Nanomaterial Modifiers | Enhance electrode surface area, electron transfer, and immobilization capacity | Multi-walled carbon nanotubes, graphene oxide, gold nanoparticles, copper oxide nanoparticles [61] |
| Immobilization Matrices | Provide stable environment for biological recognition elements | Carboxymethyl dextran hydrogels, self-assembled monolayers, conductive polymers [61] [66] |
| Biological Recognition Elements | Provide target specificity | Enzymes, antibodies, aptamers, whole cells, DNA probes [61] |
| Signal Transduction Reagents | Enable and enhance detection signals | Redox mediators, enzyme substrates, fluorescent dyes, electrochemical labels [61] |
| Regeneration Solutions | Remove bound analyte while maintaining activity | Low/high pH buffers, high salt solutions, mild detergents [66] |
Design of Experiments represents a paradigm shift in biosensor optimization, moving beyond traditional OFAT approaches to efficiently navigate complex multivariable spaces. Through structured experimental designs and statistical analysis, DoE enables researchers to develop biosensors with enhanced sensitivity, specificity, and robustness while reducing development time and resource requirements.
The systematic optimization facilitated by DoE approaches produces biosensors capable of performance that rivals established chromatography methods in specific applications, particularly when paired with appropriate validation frameworks. As biosensor technology continues to evolve, the integration of DoE methodologies will be increasingly essential for developing reliable point-of-care diagnostics, environmental monitoring tools, and bioprocess sensors that meet stringent analytical requirements.
For researchers validating biosensor results against chromatography methods, implementing DoE during biosensor development provides the statistical foundation needed for meaningful comparative studies and facilitates the adoption of biosensors as credible alternatives or complements to traditional analytical techniques.
The performance of biosensors is critically dependent on the precise optimization of three interconnected parameters: bioreceptor immobilization, surface chemistry, and detection conditions. Within the context of validating biosensor results against chromatography methods, this optimization becomes paramount to achieving the sensitivity, specificity, and reproducibility required for reliable analytical data. The robust functionalization of transducer surfaces governs the effectiveness of signal transduction and molecular interactions, directly influencing the biosensor's analytical accuracy when cross-validated with reference techniques like liquid chromatography-mass spectrometry (LC-MS/MS) [67] [41]. This guide systematically compares optimization strategies and their outcomes, providing a framework for researchers to develop biosensors whose results can stand alongside established chromatographic methods in drug development and clinical diagnostics.
Comparative Analysis of Immobilization Techniques
The method used to anchor bioreceptors (such as antibodies, enzymes, or nucleic acids) to the sensor surface is a foundational choice that impacts every aspect of performance. The following table compares the primary immobilization strategies.
Table 1: Comparison of Bioreceptor Immobilization Techniques
| Immobilization Technique | Mechanism | Key Advantages | Limitations | Representative Performance Data |
|---|---|---|---|---|
| Covalent Binding | Formation of stable covalent bonds (e.g., amide, imine) between functional groups on the surface and bioreceptor, often using linkers like EDC/NHS or glutaraldehyde [68]. | High stability; controlled orientation; reduced bioreceptor leaching [67]. | Requires surface activation; potential for denaturation of bioreceptors [67]. | Achieved LOD of 0.066 μg/kg for total aflatoxins in pistachio, validated vs. LC-MS/MS [41]. |
| Affinity-Based | Exploits high-affinity interactions such as avidin-biotin or Protein A/G antibody binding [69]. | Excellent orientation; ease of implementation; maintains bioactivity. | Higher cost; additional steps for biotinylation; stability dependent on the affinity pair. | -- |
| Hydrogen Bonding | Relies on non-covalent hydrogen bond interactions between the surface and bioreceptor [68]. | Simple, efficient, and low-cost; no additional reagents needed. | Stability can be lower than covalent methods, especially in complex matrices. | Achieved LOD of 0.14 ng/mL for HBsAg with 100% recovery in serum; good stability over 7 days [68]. |
| Physical Adsorption | Non-specific attachment via hydrophobic, ionic, or van der Waals interactions [69]. | Extremely simple; no chemical modification needed. | Random orientation; significant desorption and denaturation risk; high non-specific binding [67]. | -- |
| 3D Entrapment | Bioreceptors are confined within a porous 3D matrix like a hydrogel, polymer, or metal-organic framework (MOF) [70]. | High probe density; enhanced signal transduction; protects bioreceptors. | Can slow diffusion of analyte; more complex fabrication [70]. | -- |
Optimization of Surface Chemistry and Detection Conditions
Beyond the choice of immobilization, the finer details of the surface architecture and the operational parameters during detection are equally critical.
Surface Chemistry and Probe Density
A well-designed interface ensures not only stable immobilization but also optimal orientation and accessibility of the bioreceptor. Self-assembled monolayers (SAMs) of alkanethiols on gold are a classic and highly controlled method to create a well-defined interface for subsequent biomolecule attachment [69] [67]. Controlling probe density is essential, as overcrowding can cause steric hindrance, reducing hybridization efficiency and accessibility to the target analyte [69]. Furthermore, passivation of the electrode surface (e.g., with polyethylene glycol (PEG) or bovine serum albumin (BSA)) is a critical step to prevent non-specific binding and electrode fouling, thereby improving signal-to-noise ratio [69] [41].
Detection Conditions and Experimental Validation
The choice of detection technique and its associated conditions can significantly influence the analytical outcome. For example, a comparative study on hepatitis B virus (HBV) detection demonstrated that Differential Pulse Voltammetry (DPV) offered faster analysis, better repeatability, and lower interference in serum matrix compared to the more traditionally used Electrochemical Impedance Spectroscopy (EIS) [68].
Robust experimental validation is the cornerstone of establishing biosensor credibility. A prime example is the development of an electrochemical immunosensor for total aflatoxins in pistachio. The researchers used matrix-matched calibrators to minimize matrix effects and performed a thorough cross-validation with a reference LC-MS/MS method. The biosensor showed an excellent correlation with the chromatographic method, confirming its accuracy and establishing it as a reliable screening tool [41].
Systematic Optimization Strategies: DoE and AI
Traditional "one-factor-at-a-time" (OFAT) optimization is inefficient and often fails to reveal interactions between parameters. Systematic strategies offer a more powerful alternative.
Design of Experiments (DoE)
DoE is a chemometric approach that uses statistical models to efficiently explore the effects of multiple variables and their interactions simultaneously. This leads to a global optimum with fewer experiments [9] [61]. Common designs include:
- Full Factorial Designs: Used to screen and evaluate the main effects of multiple factors and their interactions [9].
- Central Composite Designs: Allow for the optimization of factors by modeling curvature in the response, fitting quadratic models [9].
Table 2: Key Experimental Protocols from Cited Research
| Biosensor Target / Study Focus | Immobilization & Surface Chemistry Protocol | Detection & Validation Protocol | Key Optimized Parameters |
|---|---|---|---|
| Total Aflatoxins [41] | Competitive immunoassay on screen-printed carbon electrode; antibody immobilization via covalent binding. | DPV detection in [Fe(CN)₆]³⁻/⁴⁻; cross-validation with LC-MS/MS; matrix-matched calibration in pistachio. | Antibody concentration, incubation time, electrochemical parameters. |
| Hepatitis B Surface Antigen (HBsAg) [68] | Cysteamine (CT) linker on Au electrode; antibody immobilization via Hydrogen Bonding (HB). | EIS and DPV comparison in [Fe(CN)₆]³⁻/⁴⁻; spike-and-recovery in 1/10 human serum. | Linker type (CT vs. CS), binding method (HB vs. CB), detection technique. |
| Systematic Optimization [9] | Application of DoE (e.g., factorial, central composite designs) to immobilization and fabrication steps. | Model-based prediction of sensor response (e.g., sensitivity, LOD) followed by experimental verification. | Multiple fabrication and operational variables and their interactions. |
| Surface Plasmon Resonance (SPR) [71] | N/A - Structural optimization of sensor chip. | Multi-objective PSO algorithm to optimize incident angle, Cr and Au film thickness. | Sensitivity, Figure of Merit (FOM), signal intensity. |
AI-Enhanced Optimization
Artificial intelligence (AI) and machine learning (ML) are transforming biosensor optimization. AI models can predict optimal material compositions and surface architectures by analyzing vast datasets, moving beyond traditional trial-and-error approaches [67]. For instance, multi-objective particle swarm optimization (PSO) has been used to enhance the performance of label-free SPR biosensors, simultaneously improving sensitivity, figure of merit (FOM), and depth of the resonant dip, which led to a detection limit as low as 54 ag/mL (0.36 aM) for mouse IgG [71].
The following diagram illustrates a generalized workflow for the systematic development and optimization of a biosensor, integrating the key stages from material selection to validation.
The Scientist's Toolkit: Essential Research Reagents and Materials
Table 3: Key Research Reagent Solutions for Biosensor Development
| Reagent / Material | Function in Development | Specific Application Example |
|---|---|---|
| Cysteamine (CT) / Cysteine (CS) | Short-chain linkers to form self-assembled monolayers (SAMs) on gold surfaces, providing terminal amine (~NH₂) or carboxyl (~COOH) groups for further functionalization [68]. | Immobilization of antibodies via hydrogen bonding or covalent conjugation for HBV detection [68]. |
| EDC / NHS | Crosslinking agents that activate carboxyl groups, enabling the formation of stable amide bonds with primary amines for covalent immobilization [68]. | Standard protocol for coupling antibodies or other biomolecules to functionalized surfaces. |
| Screen-Printed Electrodes (SPEs) | Low-cost, disposable, and mass-producible electrode platforms ideal for point-of-care biosensing [41]. | Working electrode for the detection of total aflatoxins in food samples [41]. |
| Gold Nanoparticles (AuNPs) | Nanomaterials used to create 3D immobilization surfaces, enhancing surface area and electron transfer, leading to signal amplification [70]. | Electrodeposition on electrodes to increase probe density for influenza virus detection [70]. |
| Design of Experiments (DoE) Software | Chemometric tools for multivariate optimization, reducing experimental effort and identifying factor interactions [9]. | Systematically optimizing multiple fabrication and operational parameters simultaneously [9] [61]. |
The journey toward validating biosensor results with gold-standard chromatography methods begins with meticulous optimization at the molecular and operational levels. The choice between immobilization techniques—whether covalent for maximum stability, hydrogen bonding for simplicity, or 3D entrapment for enhanced signal—establishes the foundation for a robust sensor. This must be coupled with sophisticated surface engineering to control probe orientation and minimize fouling. Finally, employing systematic optimization strategies like DoE and AI, and selecting the most appropriate detection scheme, are indispensable for achieving the high sensitivity and specificity required. As the case studies demonstrate, when these parameters are comprehensively controlled, biosensors can produce data that correlates excellently with LC-MS/MS, positioning them as powerful, reliable, and cost-effective tools for researchers and professionals in drug development and clinical diagnostics.
Enhancing Specificity and Sensitivity to Achieve Sub-Femtomolar Detection Limits
The ability to detect biological and chemical analytes at sub-femtomolar concentrations represents a significant frontier in analytical science, enabling the identification of minute quantities of biomarkers, pathogens, and contaminants that were previously undetectable. Achieving this level of sensitivity while maintaining high specificity presents substantial technical challenges, requiring innovative approaches to biosensor design and signal amplification. Within clinical diagnostics, food safety monitoring, and pharmaceutical development, the validation of these ultrasensitive biosensing technologies against established gold-standard methods like chromatography is paramount for scientific acceptance and regulatory approval. This guide objectively compares the performance of cutting-edge biosensor platforms capable of sub-femtomolar detection with traditional analytical techniques, providing researchers with experimental data and methodologies to advance the field of ultra-sensitive bioanalysis.
Experimental Protocols for Sub-Femtomolar Biosensing
Capacitance-Based Aptasensing Protocol
A recently developed ultrasensitive capacitance-based biosensor demonstrates the capability to detect kanamycin antibiotic at sub-femtomolar levels (0.3 fM) using a potential-pulse-assisted layer-by-layer deposition method [72]. The experimental workflow involves the following detailed steps:
- Electrode Modification: Screen-printed electrodes are first modified with gold nanoparticles (AuNPs) to enhance the electrochemical surface area and provide a stable substrate for polymer film formation.
- Polymeric Film Formation: A melanin-like polymeric film (MLPF) is formed on the AuNP-modified electrode through the electrochemical polymerization of dopamine mixed with a specific kanamycin aptamer. The potential-pulse technique allows precise control over the film's thickness and properties.
- Optimization of Parameters: Critical operating parameters including pulse potential, duration, dopamine-to-aptamer ratio, and polymerization cycles are systematically optimized to achieve maximal binding capacity and signal response.
- Label-Free Detection: Kanamycin detection is accomplished by monitoring variations in the pseudocapacitive properties of the MLPF-modified electrode using electrochemical impedance spectroscopy (EIS) without requiring additional labels or reagents.
- Sample Application: The biosensor is validated in real milk samples, where kanamycin recovery studies demonstrate the method's practical applicability for food safety testing [72].
This protocol leverages the synergistic combination of nanostructured materials, functional polymers, and affinity aptamers to achieve exceptional detection limits previously inaccessible with conventional biosensing approaches.
Validation Methodology with Chromatographic Techniques
To establish scientific credibility for sub-femtomolar biosensor results, rigorous validation against established chromatographic methods is essential. The comparative validation protocol includes:
- Sample Splitting: Identical samples are divided for parallel analysis using the biosensor platform and high-performance liquid chromatography (HPLC) methods specifically developed for the target analyte [72].
- Calibration Correlation: Standard curves generated from both techniques are statistically compared using regression analysis to evaluate consistency across the measurable concentration range.
- Recovery Studies: Spiked samples with known analyte concentrations are analyzed by both methods to calculate and compare percentage recovery rates, providing insight into method accuracy and matrix effects.
- Precision Assessment: Inter-day and intra-day reproducibility are evaluated for both techniques through repeated measurements, with results compared using statistical measures such as relative standard deviation (RSD).
- Limit of Detection Comparison: While the biosensor may achieve superior sensitivity, the correlation between detected values in the overlapping measurable range provides validation of the biosensor's quantitative accuracy.
This systematic comparison ensures that the enhanced sensitivity of novel biosensors does not come at the cost of analytical reliability, establishing their suitability for applications requiring ultra-sensitive detection.
Performance Comparison: Biosensors vs. Alternative Methods
The table below provides a systematic comparison of the performance characteristics between advanced biosensor technologies and conventional analytical methods for the detection of low-abundance analytes:
Table 1: Performance Comparison of Ultra-Sensitive Detection Methods
| Parameter | Capacitance-Based Aptasensor | Chromatography Methods (HPLC) | Fluorescent Aptasensor | Reduced Graphene Oxide Fluorescent Aptasensor |
|---|---|---|---|---|
| Limit of Detection | 0.3 fM [72] | Varies by analyte; standard methods typically in nM-μM range [72] | Varies by design; some achieving ultra-high sensitivity | Demonstrated for kanamycin detection [72] |
| Linear Range | 1 fM to 100 pM [72] | Typically wider dynamic range but at higher concentrations | Dependent on fluorophore-aptamer combination | Limited data in search results |
| Analysis Time | Minutes to hours | 30 minutes to several hours including sample preparation | Rapid (minutes) | Rapid (minutes) |
| Sample Volume | Microliters (μL) | Milliliters (mL) | Microliters (μL) | Microliters (μL) |
| Specificity | High (aptamer-based) [72] | High (separation-based) | High (aptamer-based) | High (aptamer-based) |
| Instrumentation Cost | Moderate | High | Moderate to low | Moderate to low |
| Applicability to Complex Matrices | Demonstrated in milk samples [72] | Extensive applications with sample cleanup | Potential but requires optimization | Limited data in search results |
| Multiplexing Capability | Developing | Limited with conventional detectors | High potential | Technically feasible |
The data reveals that capacitance-based aptasensors achieve remarkable sensitivity surpassing conventional methods by several orders of magnitude, while maintaining practical applicability to complex sample matrices like food products.
Biosensor Signaling Pathways and Experimental Workflows
The exceptional performance of advanced biosensors relies on carefully engineered signaling pathways and systematic experimental workflows. The following diagrams illustrate these critical processes:
Diagram 1: Biosensor Architecture and Validation Workflow. This diagram illustrates the core components of a typical biosensor system (bioreceptor, transducer, electronic system) and the parallel validation workflow comparing biosensor results with chromatography methods.
Diagram 2: Capacitance-Based Detection Mechanism. This workflow details the signal generation pathway in sub-femtomolar capacitance-based biosensors, highlighting the key signal amplification mechanisms that enable ultra-sensitive detection.
Essential Research Reagent Solutions
The development and implementation of ultra-sensitive biosensors requires specialized research reagents and materials. The following table details key solutions and their functions in experimental protocols:
Table 2: Essential Research Reagents for Ultra-Sensitive Biosensing
| Research Reagent | Function | Application Example |
|---|---|---|
| Kanamycin-specific Aptamer | Biological recognition element that binds kanamycin with high specificity and affinity | Aptasensor development for antibiotic detection [72] |
| Gold Nanoparticles (AuNPs) | Nanostructured material that increases electrode surface area and enhances signal transduction | Electrode modification in capacitance-based biosensors [72] |
| Dopamine Hydrochloride | Monomer for electrochemical polymerization creating melanin-like polymeric films (MLPF) | Formation of redox-active polymer matrix on electrode surfaces [72] |
| Screen-Printed Electrodes | Disposable, cost-effective electrochemical platforms with customizable designs | Biosensor substrate for food safety and clinical testing [72] |
| Electrochemical Impedance Spectroscopy (EIS) Reagents | Electrolyte solutions and redox probes for measuring capacitive and charge-transfer properties | Label-free detection of molecular binding events [72] |
| Chromatography Standards | Pure analyte references for method calibration and validation | HPLC quantification of antibiotics and biomarkers [72] |
| Milk Sample Matrix | Complex biological matrix for testing real-world applicability | Food safety validation studies [72] |
These specialized reagents form the foundation of ultra-sensitive biosensing platforms, each playing a critical role in the analytical chain from sample preparation to signal detection.
The emergence of biosensors capable of sub-femtomolar detection represents a paradigm shift in analytical science, offering sensitivity levels that significantly surpass traditional chromatographic methods while maintaining practical applicability to real-world samples. The validation of these biosensing platforms against established chromatographic techniques provides the scientific rigor necessary for adoption in regulated fields including clinical diagnostics, pharmaceutical development, and food safety monitoring. As research continues to enhance the specificity, reproducibility, and multiplexing capabilities of these ultra-sensitive platforms, their integration with traditional analytical methods will create a more comprehensive analytical framework capable of addressing increasingly complex detection challenges across multiple scientific disciplines.
Establishing Credibility: Statistical Measures and Regulatory Considerations for Validation
In analytical chemistry and biosensor development, demonstrating that a method is "fit for purpose" is paramount, as millions of critical decisions are made based on analytical results [73]. Method validation is the process that confirms, via objective evidence, that the performance characteristics of a procedure meet the requirements for its intended application [73]. Among the various performance characteristics, Limit of Detection (LOD), Limit of Quantification (LOQ), and Dynamic Range are fundamental for characterizing the capabilities of an analytical method at low analyte concentrations and over its working interval.
The LOD represents the smallest amount or concentration of analyte in a test sample that can be reliably distinguished from zero [73] [74]. It is a critical parameter for determining whether an analyte is present or absent. In contrast, the LOQ is the lowest concentration at which the analyte can not only be reliably detected but also quantified with acceptable precision and accuracy [74]. The dynamic range, also referred to as the measuring interval, encompasses the concentrations between the LOQ and the upper limit of quantification, where the method provides a linear response with acceptable reliability [75] [76]. Understanding the relationship and distinctions between these parameters is essential for proper method validation, especially when comparing emerging biosensing technologies with established chromatographic methods.
Definitions and Statistical Foundations
Core Definitions and Distinctions
- Limit of Blank (LoB): The LoB is a foundational concept defined as the highest apparent analyte concentration expected to be found when replicates of a blank sample containing no analyte are tested [74]. It characterizes the background noise of the analytical system. Statistically, the LoB is calculated as the mean blank signal plus 1.645 times its standard deviation (assuming a Gaussian distribution), establishing the threshold above which a measured signal has a 95% probability of not being just background noise [74].
- Limit of Detection (LOD): The LOD is the lowest analyte concentration that can be reliably distinguished from the LoB [74]. It is determined using both the measured LoB and test replicates of a sample containing a low concentration of analyte. The LOD is calculated as the LoB plus 1.645 times the standard deviation of the low concentration sample [74]. This ensures that a concentration at the LOD will produce a signal greater than the LoB with 95% confidence, minimizing false negatives. The International Union of Pure and Applied Chemistry (IUPAC) defines a similar relationship, where the LOD is expressed as a concentration, often calculated as ( k \times \sigma / S ), where ( \sigma ) is the standard deviation of the blank or the residual standard deviation of the calibration curve, ( S ) is the slope of the calibration curve (analytical sensitivity), and ( k ) is a numerical factor chosen based on the desired confidence level, typically 3 or 3.3 [75] [77].
- Limit of Quantification (LOQ): The LOQ is the lowest concentration at which the analyte can be quantified with acceptable precision and accuracy [74]. It is the limit for quantitative analyses and is always greater than or equal to the LOD [74]. According to ICH guidelines, the LOQ is often calculated using a similar formula to the LOD but with a higher multiplier to achieve greater confidence, typically ( 10 \times \sigma / S ) [77]. At the LOQ, the method must meet predefined goals for bias and imprecision.
The following diagram illustrates the statistical relationship between the LoB, LOD, and LOQ, showing how these limits are derived from the distribution of blank and low-concentration sample measurements.
Dynamic Range and Linearity
The dynamic range or measuring interval is the concentration range over which the analytical method provides a response that is a linear function of the analyte concentration, with suitable accuracy and precision [75] [76]. The lower end of the dynamic range is typically bounded by the LOQ, as concentrations below this can be detected (down to the LOD) but not reliably quantified. The upper end is the concentration at which the calibration curve is no longer linear or the detector response saturates.
A closely related term is linearity, which is the ability of the method to obtain measured results that are directly proportional to the concentration of the analyte within a given range [73]. It is recommended to use a minimum of five concentration levels to establish linearity [75]. The dynamic range is critical for practical applications, as it defines the span of concentrations that can be analyzed without sample dilution or pre-concentration.
Calculation Methods and Experimental Protocols
Standard Approaches for Determining LOD and LOQ
Regulatory bodies like the International Council for Harmonisation (ICH) describe several accepted approaches for determining LOD and LOQ [77].
Table 1: Standard Methods for Determining LOD and LOQ
| Method | Basis | LOD Calculation | LOQ Calculation | Typical Application |
|---|---|---|---|---|
| Visual Evaluation | Direct inspection of chromatograms or signals | Lowest concentration producing a detectable peak | Lowest concentration producing a quantifiable peak | Initial, rapid assessment [77] |
| Signal-to-Noise (S/N) | Instrumental baseline noise | S/N ratio of 3:1 | S/N ratio of 10:1 | Chromatography methods (HPLC) [78] |
| Calibration Curve (ICH Q2(R1)) | Standard deviation of response and slope of the curve | ( 3.3 \times \sigma / S ) | ( 10 \times \sigma / S ) | Standard validation for chromatography and biosensors [77] |
| CLSI EP17 Protocol | Statistical distributions of blank and low-level samples | ( LoB + 1.645 \times \sigma_{low concentration sample} ) | Lowest concentration meeting predefined bias/imprecision goals | Clinical laboratory methods, rigorous statistical foundation [74] |
Detailed Protocol: Calibration Curve Method
The calibration curve method, endorsed by ICH, is widely used for its scientific rigor. The following workflow outlines the steps for this method, which is applicable to both chromatographic and biosensor techniques.
Step-by-Step Procedure:
- Prepare Calibration Standards: A minimum of five concentrations across the expected range, including levels near the anticipated LOD/LOQ, should be prepared [75]. For an HPLC method simultaneously determining arsenic and mercury species, a range of 1–20 μg/L was used [79].
- Analyze Standards & Record Signals: The standards are analyzed using the full analytical procedure, and the instrument response (e.g., peak area, absorbance, current) is recorded for each concentration.
- Perform Linear Regression: A linear regression analysis (( y = S \times C + b ), where ( y ) is the response, ( S ) is the slope, ( C ) is the concentration, and ( b ) is the y-intercept) is performed on the data [75] [77]. This can be done using software like Microsoft Excel or specialized data systems.
- Extract Slope (S) and Standard Error (σ): From the linear regression output, the slope of the calibration curve (( S )) and the standard error of the regression (or the standard deviation of the y-intercept) are obtained. This standard error is used as the value for ( \sigma ) [77].
- Calculate LOD and LOQ: The LOD and LOQ are calculated using the formulas:
- ( LOD = 3.3 \times \sigma / S )
- ( LOQ = 10 \times \sigma / S ) [77]
- Experimental Verification: The calculated LOD and LOQ values are estimates and must be validated experimentally. This involves preparing and analyzing a suitable number of replicates (e.g., n=6) at the LOD and LOQ concentrations. The LOD should yield a detectable signal (e.g., S/N ≥ 3), and the LOQ should demonstrate acceptable precision (e.g., relative standard deviation ≤ 15%) and accuracy [77].
Comparative Performance: Biosensors vs. Chromatography
Performance Data from Literature
The following table summarizes typical LOD and LOQ values reported in recent research for various analytical techniques, highlighting differences between biosensors and chromatographic methods.
Table 2: Comparison of LOD and LOQ Values from Analytical Literature
| Analytical Technique | Analyte | Matrix | LOD | LOQ | Dynamic Range | Citation |
|---|---|---|---|---|---|---|
| Aptamer-based Electrochemical Biosensor | Endosulfan | Environmental samples | 0.60 ng/mL | 1.82 ng/mL | Not specified | [80] |
| HPLC-ICP-MS | Arsenic & Mercury species | Human urine | 0.030 - 0.086 μg/L | 0.10 - 0.29 μg/L | 1 - 20 μg/L | [79] |
| Validated RP-HPLC (UV detection) | Metoclopramide | Pharmaceutical dosage | 0.23 μg/mL | 0.35 μg/mL | 0.375 - 2.7 μg/mL | [78] |
| Validated RP-HPLC (UV detection) | Camylofin | Pharmaceutical dosage | 0.15 μg/mL | 0.42 μg/mL | 0.625 - 4.5 μg/mL | [78] |
The "LOD Paradox" in Biosensor Development
A critical consideration in biosensor research is the "LOD paradox," where the drive to achieve ultra-low LODs can overshadow other crucial performance metrics and practical utility [81]. While a low LOD is technically impressive, it may not always be clinically or analytically relevant. For example, a biosensor capable of detecting picomolar concentrations of a biomarker is of little practical value if the biomarker's clinically relevant range is in the nanomolar region [81]. This intense focus on sensitivity can come at the expense of the dynamic range, robustness, ease of use, and cost-effectiveness, which are vital for real-world deployment [81]. In contrast, chromatographic methods are typically developed and validated with a specific application in mind, ensuring that their dynamic range and LOD/LOQ are fit-for-purpose for tasks like therapeutic drug monitoring or toxicological analysis [73] [79].
Essential Research Reagent Solutions
The following table lists key reagents and materials commonly required for experiments focused on determining LOD, LOQ, and dynamic range in analytical method development.
Table 3: Essential Research Reagents and Materials for Analytical Validation
| Reagent / Material | Function in Validation | Example from Literature |
|---|---|---|
| High-Purity Analytical Standards | Used to prepare calibration curves and spiked samples for accuracy/recovery studies; purity is critical for correct concentration calculations. | Metoclopramide and Camylofin dihydrochloride standards [78]; Arsenic and Mercury species standard solutions [79]. |
| HPLC-Grade Solvents & Buffers | Form the mobile phase; purity minimizes background noise and unwanted peaks, directly impacting baseline stability and S/N ratio. | Methanol, acetonitrile, and ammonium acetate buffer [79] [78]. |
| Certified Reference Materials (CRMs) | Independent, certified samples used to verify method accuracy and trueness during validation. | Standard Reference Material 2669 (NIST) used for urine analysis [79]. |
| Stationary Phases / Columns | The heart of chromatographic separation; selection (e.g., C18, phenyl-hexyl) is critical for resolving analytes from interference. | Hepu AR 5 μm C18 column [79]; Phenyl-hexyl column [78]. |
| Recognition Elements (for Biosensors) | Biomolecules (antibodies, aptamers) or synthetic polymers (MIPs) that provide selectivity and are immobilized on the transducer. | ESGO-251 aptamer for endosulfan detection [80]; Antibodies for C-reactive protein [76]. |
In the rigorous field of biosensor and chromatography validation, demonstrating that a new analytical method agrees with an established one is a fundamental requirement. Researchers and drug development professionals are often tasked with comparing a novel, high-throughput biosensor against a gold-standard chromatography method, such as UPLC-MS. This process extends beyond simply showing that the two methods are related; it must convincingly demonstrate that they can be used interchangeably within acceptable limits of agreement. The statistical tools of linear regression, the coefficient of determination (R²), and Bland-Altman analysis form the cornerstone of this validation effort. Each tool provides a unique and complementary perspective on the data, and together, they offer a comprehensive picture of method performance, highlighting strengths and pinpointing specific areas of discrepancy.
The consequences of relying on an inadequate statistical approach can be significant, potentially leading to the adoption of a method that produces systematically biased results. For instance, while a high correlation coefficient might suggest a strong linear relationship, it does not guarantee that the two methods agree. A new biosensor could consistently overestimate concentrations by 20% compared to HPLC, yet still show a perfect correlation. It is for this reason that regulatory authorities advocate for a holistic, fit-for-purpose approach to method validation, leveraging multiple statistical techniques to build a complete case for agreement [82] [83].
The following table summarizes the core statistical tools used in method comparison studies, outlining their primary purpose and key limitations.
Table 1: Key Statistical Methods for Method Comparison
| Statistical Method | Primary Purpose | Key Interpretation | Principal Limitations |
|---|---|---|---|
| Linear Regression | Models the linear relationship between two methods (e.g., Biosensor vs. UPLC). | The regression equation (y = mx + c) identifies constant (c) and proportional (m) differences. | Assumes no error in the reference method; does not directly assess agreement. |
| Coefficient of Determination (R²) | Quantifies the proportion of variance in one method explained by the other. | An R² close to 1.0 indicates a strong linear relationship. | Does not confirm agreement; can be high even when significant biases exist. |
| Bland-Altman Plot | Quantifies agreement by plotting differences between methods against their averages. | The mean difference (bias) and limits of agreement (LoA) indicate how well the methods agree. | Does not define acceptable limits; these must be based on clinical/analytical goals. |
Linear Regression Analysis
Linear regression, particularly through techniques like Passing and Bablok regression, is used to quantify the structural relationship between two measurement methods. This approach is robust against non-normal error distributions and can detect constant and proportional biases [84]. For example, in a study comparing four biosensor platforms for antibody-antigen binding kinetics, regression analysis was successfully used to establish that the rank orders of rate constants were highly correlated between instruments, providing crucial validation for the newer technologies [82].
Coefficient of Determination (R²)
The R² value is a widely reported metric that measures the strength of the linear association between two methods. In analytical chemistry, it is common to see methods with R² values exceeding 0.9991 for chromatographic assays, indicating exceptionally precise linear relationships [85] [83]. However, a high R² value alone can be misleading. It confirms that one method can predict the other, but not that their measurements are identical, underscoring the necessity of supplementary analyses like Bland-Altman plots [84].
The Bland-Altman Plot: A Deeper Dive
The Bland-Altman plot, also known as the difference plot, is the definitive statistical technique for assessing agreement between two quantitative methods. Its core strength lies in its focus on the differences between paired measurements, rather than their correlation [84].
The methodology involves a straightforward yet powerful graphical approach:
- For each sample, calculate the average of the measurements from the two methods (Method A and Method B): (A+B)/2. This average represents the best estimate of the true value.
- Calculate the difference between the two measurements (A - B).
- Create a scatter plot where the X-axis is the average from step 1, and the Y-axis is the difference from step 2 [84].
The plot is then interpreted by calculating the mean difference (which represents the average bias between methods) and the standard deviation (SD) of the differences. The 95% limits of agreement (LoA) are calculated as: Mean Difference ± 1.96 SD. It is expected that approximately 95% of the data points will lie within these limits [84].
A key principle is that the Bland-Altman method defines the intervals of agreement but does not judge whether these limits are clinically or analytically acceptable. The acceptability of the LoA must be defined a priori based on the specific requirements of the test, such as biological variation or clinical decision thresholds [84].
Experimental Protocols for Method Validation
Implementing a robust method comparison requires a structured experimental protocol. The following workflow outlines the key stages, from experimental design to data interpretation.
Sample Selection and Data Collection
The foundation of a valid comparison is the selection of an appropriate set of samples. The samples should cover the entire analytical range of interest, from low to high concentrations, to ensure the comparison is relevant across all potential measurement scenarios [84]. A minimum of 20-30 samples is often recommended to provide sufficient statistical power for a reliable analysis.
For each selected sample, measurements must be taken using both the reference method (e.g., HPLC) and the test method (e.g., the new biosensor) in a paired manner. This pairing is crucial for the subsequent statistical analysis.
Protocol for Bland-Altman Analysis
- Calculate Means and Differences: For each sample pair, compute the average of the two measurements ((A+B)/2) and their difference (A - B).
- Plot the Data: Create a scatter plot with the averages on the x-axis and the differences on the y-axis.
- Compute Mean Bias and LoA: Calculate the mean of all differences (the bias) and the standard deviation (SD) of the differences. The LoA are calculated as Mean Difference ± 1.96 SD.
- Visualize on Plot: Draw a solid horizontal line at the mean bias and dashed horizontal lines at the upper and lower LoA.
- Assess Patterns: Examine the plot for any systematic patterns, such as a trend where the differences increase with the average value (indicating a proportional bias) [84].
Protocol for Regression and R² Analysis
- Perform Regression: Fit a linear regression model (Y = mX + c), where Y is the test method and X is the reference method. Techniques like Passing and Bablok regression are advantageous as they account for errors in both methods [84].
- Calculate R²: The coefficient of determination is calculated as the square of the Pearson correlation coefficient. It represents the proportion of variance in the test method explained by the reference method.
- Analyze Parameters: Interpret the slope (m) for proportional differences (a slope of 1 indicates no proportional bias) and the intercept (c) for constant differences (an intercept of 0 indicates no constant bias).
Practical Applications in Biosensor and Chromatography Validation
The theoretical principles of method comparison are consistently applied in real-world research to validate new analytical technologies.
Table 2: Application of Statistical Methods in Validation Studies
| Study Context | Methods Compared | Key Statistical Tools Applied | Reported Outcome |
|---|---|---|---|
| SPR Biosensor for VEGF-R2 [86] | SPRi biosensor vs. ELISA | Linearity, Precision, Recovery | Linear range: 0.03-2 ng/mL; Precision: 1.4-2.2%; Recovery: 99-103% |
| UPLC-QDa for TCM Analysis [85] | UPLC-QDa vs. theoretical | Linearity, LOQ, Precision | Excellent linearity (R² > 0.9991); LOQ: 0.005-0.56 μg/mL; Precise inter-day results (RSD 2.51-4.54%) |
| Biosensor Platform Comparison [82] | Four biosensor platforms | Correlation of rank orders | High correlation of kinetics rankings between platforms, supporting a "fit-for-purpose" selection. |
In a study developing biosensors for vascular endothelial growth factor receptor 2 (VEGF-R2) in plasma, researchers used array SPRi and validated their results against a traditional ELISA method. The agreement between the two methods for 27 different plasma samples was reported as "very good," a conclusion supported by high precision (1.4-2.2%) and excellent recovery rates (99-103%) [86]. Similarly, when validating a UPLC-QDa method for the quality control of Lonicera japonica, researchers demonstrated excellent linearity with regression coefficients higher than 0.9991, confirming a strong predictive relationship between concentration and detector response [85].
The Scientist's Toolkit: Essential Reagents and Materials
The following table lists key materials and reagents commonly used in the development and validation of biosensors and chromatographic methods, as evidenced in the cited research.
Table 3: Key Research Reagents and Materials for Biosensor and Chromatography Validation
| Reagent / Material | Function in Research | Example Application |
|---|---|---|
| Cysteamine Linker | Forms a self-assembled monolayer on gold surfaces for antibody immobilization. | Used in SPRi biosensor development for VEGF-R2 detection [86]. |
| Carbodiimide (EDC) & N-hydroxysuccinimide (NHS) | Activates carboxyl groups for covalent coupling of biomolecules (e.g., antibodies) to sensor surfaces. | Standard chemistry for immobilizing ligands on biosensor chips [86]. |
| Monoclonal Antibodies | Provides high specificity as a capture ligand for the target analyte. | Immobilized on SPR chips for specific detection of VEGF-R2 [86]. |
| Graphene & MXene | 2D materials used to coat resonators, enhancing sensitivity and analyte interaction. | Integrated into plasmonic metasurface biosensors to boost performance [87]. |
| Mesoporous SiO₂ | Provides a high-surface-area platform for immobilizing recognition elements. | Used in electrochemical biosensors for E. coli detection [88]. |
| Phosphate Buffered Saline (PBS) | Standard medium for dilution and handling of biological samples and reagents. | Ubiquitously used in bioassays to maintain pH and osmotic pressure. |
| ForteBio Octet RED384 | Biosensor platform using Bio-Layer Interferometry (BLI) for high-throughput kinetic analysis. | One of four platforms compared for antibody-antigen binding kinetics [82]. |
The validation of a new biosensor against an established chromatography method is a multifaceted process that demands a statistical approach beyond a simple correlation. While regression analysis and the R² value are useful for identifying the nature of a relationship and the strength of a linear trend, they are insufficient on their own to prove agreement. The Bland-Altman plot is an indispensable tool that completes the picture by quantifying the bias and the range of expected differences between two methods.
A robust validation study must integrate all three techniques. The workflow begins with a well-designed experiment, employs regression to understand the functional relationship, uses R² to confirm a strong linear association, and relies on the Bland-Altman plot to objectively assess the level of agreement. For researchers and drug development professionals, this comprehensive statistical strategy provides the evidence needed to confidently implement new, efficient biosensor technologies, ensuring data quality and reliability in pharmaceutical development and clinical diagnostics.
Assessing Recovery, Precision, and Long-Term Stability
The validation of biosensor performance against established chromatographic methods is a critical step in translating novel diagnostic technologies from research laboratories to clinical and pharmaceutical settings. This guide provides a comparative analysis of key analytical performance criteria—recovery, precision, and long-term stability—between emerging biosensing platforms and conventional liquid chromatography-based approaches. As the demand for real-time monitoring intensifies with the growth of personalized medicine, understanding the performance characteristics and limitations of these complementary technologies becomes essential for researchers and drug development professionals [89] [90]. This assessment synthesizes experimental data and methodologies from recent studies to facilitate informed technology selection for specific applications.
Performance Comparison: Biosensors vs. Chromatography
The quantitative comparison of biosensors and chromatography reveals a complementary relationship where each technology excels in different operational domains. Table 1 summarizes key performance metrics across critical parameters, highlighting the trade-offs between analytical precision and operational functionality.
Table 1: Performance Comparison of Biosensors and Chromatography Methods
| Performance Parameter | Biosensors | Chromatography Methods | Comparative Analysis |
|---|---|---|---|
| Recovery | 85-110% (varies with sample matrix) [91] | Near 100% with proper calibration [92] | Chromatography offers superior recovery for complex matrices; biosensors require extensive matrix-specific validation |
| Precision (CV) | 3.05% (HbA1c LFIA) [91] to >13% in some platforms [91] | Typically <2% (HbA1c) [91] | Chromatography provides higher precision; biosensor precision is application-dependent |
| Long-Term Stability | Days to weeks; degradation from biofouling [93] [94] | Years with proper maintenance [95] | Chromatography systems offer superior long-term stability |
| Analysis Time | Minutes (e.g., 5.5 minutes for HbA1c) [91] | 4-12 minutes per sample [92] | Modern biosensors offer significantly faster results |
| Operational Mode | Continuous, real-time monitoring [89] [90] | Discrete sample analysis [92] | Fundamental operational difference; biosensors enable dynamic monitoring |
Biosensors demonstrate particular strength in rapid analysis and continuous monitoring capabilities, with some platforms achieving detection times as low as 5.5 minutes for diabetes-relevant HbA1c [91]. However, this operational advantage comes with compromises in precision and stability, where chromatography maintains a clear superiority with coefficients of variation (CV) typically below 2% for HbA1c analysis and instrument stability extending over years with proper maintenance [91] [95]. The recovery characteristics further highlight the maturity of chromatographic methods, which achieve near-complete recovery with proper calibration, while biosensors exhibit more variable performance (85-110%) depending on sample matrix and design [91] [92].
Experimental Protocols for Performance Assessment
Assessing Biosensor Recovery and Precision
Recent research on lateral flow immunoassay (LFIA) biosensors for HbA1c detection provides a robust protocol for evaluating biosensor performance. The methodology employs long afterglow nanocrystals (LANs) as immunoprobes to eliminate endogenous interference, with validation against standardized laboratory instrumentation [91].
Key Experimental Steps:
- Sensor Fabrication: Synthesize LAN immunoprobes and conjugate them with specific antibodies (e.g., anti-HbA1c)
- Sample Preparation: Spike known analyte concentrations into representative sample matrices (e.g., whole blood, serum)
- Detection Protocol: Apply samples to the biosensor and measure response using dual-signal acquisition (photonic signals and afterglow time-series images)
- Data Analysis: Process time-series images with a lightweight hybrid network model (LHNM) incorporating a global temporal hybrid attention module (GTHAM) for enhanced feature extraction
- Validation: Compare results with reference methods (e.g., HPLC) using correlation analysis and Bland-Altman plots
This protocol demonstrated a CV below 3.05% across the measurable range, approaching the precision required for clinical applications [91].
Evaluating Biosensor Long-Term Stability
Investigations into the molecular origins of biosensor signal degradation provide methodologies for assessing long-term stability. A foundational approach involves tethered particle motion (t-BPM) analysis to monitor single-molecule interactions over time [94].
Key Experimental Steps:
- Sensor Setup: Immobilize affinity-based recognition elements (e.g., antibodies, aptamers) on the sensor surface
- Continuous Monitoring: Use bright-field microscopy to track particle motion in real-time under controlled flow conditions
- Environmental Control: Employ precision microfluidic systems (e.g., LSPone syringe pump) to maintain consistent flow rates and minimize hydrodynamic variability
- Signal Acquisition: Record switching rates between bound and unbound states over several days of continuous operation
- Degradation Analysis: Quantify signal decay attributable to specific mechanisms (antibody loss, analogue dissociation, biofouling)
This methodology identified both particle aging and surface biofouling as primary contributors to signal degradation in continuous cortisol monitoring systems [94].
Chromatographic Method Validation for Biomarker Analysis
High-precision liquid chromatography with electrochemical detection (HPLC-ECD) provides a reference methodology for validating biosensor performance in neurotransmitter monitoring [92].
Key Experimental Steps:
- Sample Collection: Obtain microdialysates using flow rates of 0.5-1.5 μL/min with collection intervals tailored to the experimental design
- Chromatographic Separation: Utilize reverse-phase (RP) columns with mobile phases optimized for monoamine separation (e.g., catecholamines, indolamines)
- Electrochemical Detection: Employ glassy carbon (GC) working electrodes maintained through weekly polishing with alumina powder
- Quantification: Calculate analyte concentrations based on calibration curves with established linear ranges (L.R.), limits of detection (LOD), and quantification (LOQ)
- Quality Control: Include system suitability tests and reference standards in each run to ensure method reproducibility
This approach achieves sensitivity down to 0.5 fmol per sample for serotonin with high reproducibility, providing a robust benchmark for biosensor validation [92].
Signaling Pathways and Experimental Workflows
Biosensor-Centric Health Monitoring Pathway
The integration pathway for biosensors in modern healthcare demonstrates the sequence from molecular recognition to clinical decision-making, highlighting opportunities for chromatographic validation.
Diagram 1: Integrated monitoring pathway showing how chromatography validates biosensor performance.
This workflow illustrates how chromatographic methods provide essential validation at critical points in the biosensor operational pathway, establishing traceability to reference measurements and enabling calibration feedback loops that enhance long-term reliability.
Experimental Workflow for Stability Assessment
The systematic evaluation of biosensor stability requires a structured approach to isolate different degradation mechanisms and identify appropriate mitigation strategies.
Diagram 2: Stability assessment workflow mapping degradation mechanisms to mitigation strategies.
This systematic approach connects specific stability challenges with targeted solutions, providing a framework for developing enhanced biosensor platforms with improved long-term performance characteristics.
Research Reagent Solutions
The experimental methodologies discussed utilize specialized reagents and materials essential for implementing the described protocols. Table 2 catalogs these key research solutions with their specific functions in biosensor and chromatography applications.
Table 2: Essential Research Reagents and Materials
| Reagent/Material | Function | Application Context |
|---|---|---|
| Long Afterglow Nanocrystals (LANs) | Immunoprobes with persistent emission that reduces background interference [91] | Biosensor Signal Generation |
| Metal-Organic Frameworks (MOFs) | Porous materials with high surface area and tunable selectivity for target analytes [90] | Biosensor Sensing Element |
| Microfluidic Syringe Pumps (e.g., LSPone) | Precision fluid handling for consistent flow rates in continuous monitoring [94] | Biosensor Fluid Management |
| Glassy Carbon (GC) Electrodes | Working electrodes for sensitive electrochemical detection of redox-active analytes [92] | HPLC-ECD Detection |
| Reverse Phase (RP) Columns | Stationary phases for separating hydrophobic analytes based on partitioning [92] | HPLC Separation |
| Alumina Polishing Suspension | Abrasive material for maintaining electrode surface cleanliness and reactivity [92] | HPLC-ECD Maintenance |
These specialized reagents and materials enable the implementation of both biosensing and chromatographic methods, with each component playing a critical role in achieving the performance metrics outlined in the comparative analysis. The selection of appropriate reagents is essential for method validation and technology comparison studies.
This comparative analysis demonstrates that biosensors and chromatographic methods offer complementary capabilities for analytical applications in pharmaceutical research and clinical monitoring. Chromatography maintains superiority in precision, accuracy, and long-term stability, serving as an essential reference method for biosensor validation. Conversely, biosensors provide unique advantages in continuous, real-time monitoring capabilities with rapidly improving performance characteristics. The integration of advanced materials like MOFs and LANs, combined with microfluidic control systems and AI-enhanced data processing, is progressively addressing fundamental challenges in biosensor recovery, precision, and long-term stability. For researchers and drug development professionals, the technology selection should be guided by application-specific requirements—where the highest order of precision is required, chromatography remains indispensable; where dynamic, continuous monitoring provides critical insights, modern biosensors offer transformative potential. Future developments will likely focus on hybrid approaches that leverage the strengths of both technologies to create validated, continuous monitoring systems with traceability to reference methods.
The accurate detection and quantification of target analytes—from disease biomarkers to environmental contaminants and pharmaceutical compounds—are fundamental to advances in medical diagnostics, drug development, and food safety. For decades, the analytical landscape has been dominated by two established techniques: the immunoassay-based enzyme-linked immunosorbent assay (ELISA) and the chromatography-based liquid chromatography-tandem mass spectrometry (LC-MS/MS). The emergence of biosensors as a rapid, portable alternative has prompted a critical need for direct, objective performance comparisons to validate their results against those from traditional chromatography methods.
This guide provides a structured, data-driven comparison of these three key technologies, framing the evaluation within the broader context of analytical validation. It synthesizes findings from recent comparative studies to help researchers and drug development professionals make informed, context-appropriate choices for their specific applications.
To fairly benchmark these technologies, one must first understand their fundamental operational principles and standard experimental workflows.
Biosensors
A biosensor is an analytical device that integrates a biological recognition element (e.g., antibody, enzyme, nucleic acid) with a physicochemical transducer (e.g., electrochemical, optical, piezoelectric) to produce an electrical signal proportional to the target analyte concentration [96]. Recent advancements often employ novel materials like graphene to enhance sensitivity. For instance, a graphene field-effect transistor (GFET) biosensor for a neurological biomarker was functionalized by modifying the chip with pyrene butyric acid N-hydroxysuccinimide ester (PBASE) to immobilize specific antibodies [97].
ELISA (Enzyme-Linked Immunosorbent Assay)
ELISA is a well-plate-based immunoassay that uses enzyme-labeled antibodies or antigens and a colorimetric, fluorescent, or chemiluminescent substrate to detect an analyte. The intensity of the generated signal is measured spectrophotometrically. To enhance sensitivity for environmental analysis, ELISA is often coupled with solid-phase extraction (SPE) for sample pre-concentration and purification. A typical SPE-ELISA protocol involves passing a water sample through a conditioned SPE cartridge, eluting the captured analytes with an organic solvent like methanol, evaporating the solvent, and reconstituting the residue in buffer before performing the standard ELISA procedure [98].
LC-MS/MS (Liquid Chromatography-Tandem Mass Spectrometry)
LC-MS/MS is a powerful analytical technique that combines the physical separation capabilities of liquid chromatography (LC) with the high sensitivity and specificity of tandem mass spectrometry (MS/MS). The methodology generally involves sample extraction (e.g., using acids or organic solvents), purification (often via SPE), chromatographic separation on a column (e.g., C18), and detection via a mass spectrometer. The MS/MS operates in Multiple Reaction Monitoring (MRM) mode, where a specific precursor ion is selected, fragmented, and a specific product ion is measured, providing high selectivity. This technique often requires meticulous method development to overcome challenges like matrix effects [99] [100].
The following diagram illustrates the core procedural workflows for each of these key technologies.
Direct Performance Comparison
A direct, head-to-head challenge between biosensors and established techniques reveals a nuanced picture of their relative strengths. The following table summarizes key performance metrics from recent comparative studies.
Table 1: Direct Performance Comparison Across Analytical Platforms
| Analyte | Technology | Limit of Detection (LOD) | Analysis Time | Key Comparative Findings | Source |
|---|---|---|---|---|---|
| Glial Fibrillary Acidic Protein (GFAP) | Graphene FET Biosensor | 2.3 x 10² fg/mL | Several minutes | Outcompeted ELISA and Simoa in sensitivity and speed in patient plasma. | [97] |
| Traditional ELISA | Higher than biosensor | Hours | |||
| Simoa (State-of-the-art) | Higher than biosensor | Longer than biosensor | |||
| Clarithromycin (Antibiotic) | Electrochemical Immunosensor | 0.03 µg/mL | < 30 minutes | Achieved same LOD as LC-MS/MS with high selectivity in plasma. | [101] |
| LC-MS/MS | 0.03 µg/mL | Longer than biosensor | Robust and regulatory-aligned, but less rapid. | [101] | |
| Paralytic Shellfish Poisoning (PSP) Toxins | SPR Biosensor | Comparable to MBA/HPLC | Short | Reduced manual labor and simpler operation vs. ELISA. | [102] |
| ELISA | Comparable to MBA/HPLC | Longer than SPR | More manual labor involved. | [102] | |
| Mouse Bioassay (MBA) & HPLC | Reference standard | Long (MBA) | [102] | ||
| Hydrogen Peroxide (H₂O₂) | Chemiluminescence (CL) Biosensor | 4 pmol | Varies | CL and amperometric biosensors showed similar detectability. CL had wider dynamic range. | [103] |
| Amperometric Biosensor | 210 pmol | Varies | Better suited for real-time monitoring due to speed. | [103] | |
| Sulfamethoxazole (Antibiotic) in Water | SPE-ELISA | 0.3 μg/L (without pretreatment) | Hours (high throughput) | Achieved comparable accuracy and reliability to MS methods after rigorous optimization. | [98] |
| LC-MS/MS | Very low (sub-ng/L) | Longer per sample | Gold standard, but with high cost and complex operation. | [98] |
To provide a broader perspective, the table below synthesizes the general performance characteristics, advantages, and limitations of each technology.
Table 2: General Characteristics of Analytical Platforms
| Parameter | Biosensors | ELISA | LC-MS/MS |
|---|---|---|---|
| Typical Sensitivity | Ultra-high (fg/mL) to moderate | Moderate to high | Ultra-high (often sub-ng/mL) |
| Specificity | Good (depends on biorecognition element) | Good (can suffer from cross-reactivity) [100] | Excellent (based on mass and retention time) |
| Analysis Speed | Very fast (minutes) | Moderate to slow (hours) | Slow (includes lengthy run times) |
| Throughput | Low to moderate | High | Moderate |
| Portability / Suitability for POC | High | Low (lab-based) | Low (lab-based) |
| Sample Preparation | Minimal | Moderate | Extensive |
| Multi-analyte Capability | Limited | Moderate | High |
| Operational Complexity & Cost | Low to moderate | Moderate | High (expensive equipment, skilled operators) |
| Data Robustness & Regulatory Acceptance | Growing, but newer | Well-established | Gold standard, fully established |
Analysis of Application Contexts
The experimental data indicates that the choice of technology is highly dependent on the specific application requirements.
Point-of-Care (POC) and Rapid Clinical Diagnostics: Biosensors are unparalleled in this domain. Their combination of extreme sensitivity, speed (results in minutes), and portability makes them ideal for clinical settings. The GFET biosensor that detected GFAP at femtomolar levels in patient plasma demonstrates the potential for rapid diagnosis of traumatic brain injury at the hospital bedside [97]. Similarly, electrochemical immunosensors for therapeutic drug monitoring (e.g., clarithromycin) offer results in under 30 minutes, enabling dose adjustments during a single clinical visit [101].
High-Throughput, Centralized Laboratory Testing: When testing large batches of samples in a centralized lab, ELISA remains a dominant force due to its high throughput, well-understood protocols, and lower equipment cost compared to LC-MS/MS. Furthermore, SPE-ELISA has been shown to be a reliable and cost-effective alternative for quantifying trace-level environmental contaminants like antibiotics in water, achieving performance comparable to MS methods [98].
Method Validation and Unambiguous Identification: LC-MS/MS is the undisputed reference technique for method validation, providing unmatched specificity, accuracy, and multi-analyte capability. It is indispensable for confirming results obtained from other methods, especially in complex matrices, due to its ability to separate and uniquely identify compounds based on their mass and fragmentation pattern [100]. Its high startup and operational costs, however, relegate it primarily to specialized laboratories.
The following diagram synthesizes the comparative data to provide a strategic overview of how these technologies position against each other in terms of key operational parameters.
Essential Research Reagent Solutions
The successful implementation of any analytical method relies on a suite of specialized reagents and materials. The following table details key components used in the experiments cited in this guide.
Table 3: Key Research Reagents and Materials
| Reagent / Material | Function | Example Application in Featured Studies |
|---|---|---|
| GFET (Graphene Field-Effect Transistor) Chip | Signal transduction platform; electronic properties change upon biomolecule binding. | Ultralow detection of GFAP biomarker for neurology [97]. |
| PBASE (Pyrene Butyric Acid N-hydroxysuccinimide Ester) | A heterobifunctional crosslinker for non-covalent functionalization of graphene surfaces with biomolecules. | Used to immobilize GFAP antibodies onto the GFET surface [97]. |
| Magnetic Beads (functionalized) | Solid support for immobilizing antibodies or antigens; enable rapid separation and concentration of analytes using a magnet. | Used in electrochemical immunosensors for clarithromycin and testosterone to enhance sensitivity and simplify washing [101]. |
| Screen-Printed Carbon Electrodes (SPCE) | Disposable, low-cost electrochemical cell for signal measurement; ideal for portable biosensors. | Platform for the electrochemical immunosensor detection of clarithromycin [101]. |
| Horseradish Peroxidase (HRP) | Common enzyme label for antibodies; generates an amplified signal by catalyzing a chemiluminescent or colorimetric reaction. | Used as a label in comparative studies between electrochemical and optical biosensors [103]. |
| Hypercarb SPE Cartridge / LC Column | Porous graphitic carbon stationary phase for purification and separation; effective for polar compounds. | Used to separate ribavirin from a structurally similar interference (uridine) in chicken samples [100]. |
| Isotope-Labeled Internal Standards (e.g., ¹³C₅-ribavirin, HIS-d₄) | Added to samples prior to processing; corrects for analyte loss during preparation and ion suppression/enhancement in the MS source. | Critical for achieving accurate and precise quantification in LC-MS/MS methods [99] [100]. |
The comparative data clearly demonstrates that biosensors, ELISA, and LC-MS/MS are not mutually exclusive technologies but rather complementary tools in the modern analytical arsenal.
- Biosensors are the definitive choice for applications where speed, portability, and high sensitivity for a single or limited number of analytes are critical, such as point-of-care diagnostics and rapid on-site screening.
- ELISA remains a powerful, cost-effective workhorse for high-throughput, multiplexed screening in centralized laboratories, especially when coupled with pre-concentration techniques like SPE for trace analysis.
- LC-MS/MS continues to be the unassailable reference method for applications demanding the highest level of specificity, multi-analyte quantification, and definitive results validation, despite its higher operational complexity and cost.
The validation of biosensor results with chromatography methods remains a cornerstone of rigorous analytical science. As biosensor technology continues to evolve, its performance is reaching and even surpassing that of traditional methods in specific niches. The future of bioanalysis lies in a synergistic approach, strategically deploying each technology where it performs best, guided by objective, data-driven benchmarks.
Conclusion
The successful validation of biosensor data against established chromatographic methods is paramount for their adoption in rigorous research and drug development. This process, encompassing foundational understanding, meticulous methodological application, systematic troubleshooting, and robust statistical comparison, transforms biosensors from promising tools into reliable analytical instruments. The integration of optimization strategies like DoE is crucial for enhancing performance. Future directions point toward multiplexed detection, advanced microfluidic integration, and AI-assisted data analysis. As validation protocols become more standardized, biosensors are poised to become indispensable for real-time, point-of-care diagnostics and high-throughput screening, ultimately accelerating the discovery of novel therapeutics and improving clinical outcomes.
References
- 1. Biosensor [https://en.wikipedia.org/wiki/Biosensor]
- 2. Introduction to biosensors - PMC [https://pmc.ncbi.nlm.nih.gov/articles/PMC4986445/]
- 3. A Closer Look at Biosensors: A Practical Tutorial for ... [https://www.spectroscopyonline.com/view/a-closer-look-at-biosensors-a-practical-tutorial-for-spectroscopists]
- 4. Everything's under Control: Maximizing Biosensor ... [https://pmc.ncbi.nlm.nih.gov/articles/PMC11840803/]
- 5. A Review on the Application of Biosensors for Monitoring ... [https://pmc.ncbi.nlm.nih.gov/articles/PMC12390133/]
- 6. Improving biosensor accuracy and speed using dynamic ... [https://www.sciencedirect.com/science/article/abs/pii/S0956566323007716]
- 7. Validation of an enzymatic biosensor with liquid ... [https://www.sciencedirect.com/science/article/abs/pii/0165993695970615]
- 8. A push towards disruptive biosensing technologies [https://www.nature.com/articles/s41565-025-02050-8]
- 9. Perspectives on systematic optimization of ultrasensitive ... [https://pubs.rsc.org/en/content/articlehtml/2024/tc/d4tc02131b]
- 10. A Biosensor-Based Quantitative Analysis System of Major ... [https://pmc.ncbi.nlm.nih.gov/articles/PMC6540269/]
- 11. Development, validation and method stability study of a LC ... [https://www.sciencedirect.com/science/article/abs/pii/S1570023220304141]
- 12. Recent Advances in Liquid Chromatography–Mass ... [https://pmc.ncbi.nlm.nih.gov/articles/PMC12204688/]
- 13. Development and validation of an LC‐MS/MS method for ... [https://pmc.ncbi.nlm.nih.gov/articles/PMC7958000/]
- 14. Review Biosensors and lateral flow immunoassays [https://www.sciencedirect.com/science/article/abs/pii/S0009898125001512]
- 15. Improving the reproducibility, accuracy, and stability of an ... [https://pubmed.ncbi.nlm.nih.gov/32217334/]
- 16. Comparison Techniques for HPLC Column Performance [https://www.chromatographyonline.com/view/comparison-techniques-hplc-column-performance-0]
- 17. The value and validation of broad spectrum biosensors for ... [https://pmc.ncbi.nlm.nih.gov/articles/PMC3925709/]
- 18. Experimental Validation of a Fragment Library for Lead ... [https://www.sciencedirect.com/science/article/pii/S247255522207736X]
- 19. Comparison of high-performance liquid chromatographic ... [https://www.sciencedirect.com/science/article/pii/0021967392803607]
- 20. Recent Advances in Portable Biosensors for Biomarker ... [https://pmc.ncbi.nlm.nih.gov/articles/PMC7559030/]
- 21. Advances and challenges in portable optical biosensors for ... [https://www.sciencedirect.com/science/article/abs/pii/S0165993624001225]
- 22. Advancing biological investigations using portable sensors for ... [https://pmc.ncbi.nlm.nih.gov/articles/PMC10711145/]
- 23. Conducting GC Method Validation Using High Accuracy ... [https://www.environics.com/2024/08/23/gc-method-validation-high-accuracy-standards/]
- 24. Reliable Strategy for Analysis of Complex Biosensor Data [https://pmc.ncbi.nlm.nih.gov/articles/PMC6150654/]
- 25. Analytical Method Validation: Back to Basics, Part II [https://www.chromatographyonline.com/view/analytical-method-validation-back-basics-part-ii]
- 26. Biosensor Technologies for Water Quality: Detection of ... [https://www.mdpi.com/2079-6374/15/3/189]
- 27. Development and Applications of Portable Biosensors [https://www.sciencedirect.com/science/article/pii/S2472630322014935]
- 28. Engineered Intelligent Electrochemical Biosensors for ... [https://www.mdpi.com/2227-9040/13/4/146]
- 29. Updates on developing and applying biosensors for the detection of... [https://pmc.ncbi.nlm.nih.gov/articles/PMC10512422/]
- 30. Improving standards in the reporting of optical biosensor ... [https://www.sciencedirect.com/science/article/pii/S2472555224000546]
- 31. Colloidal gold-based immunochromatographic biosensor for... [https://pubs.rsc.org/en/content/articlehtml/2023/nh/d3nh00192j]
- 32. (PDF) Development and single laboratory validation ... - Academia.edu [https://www.academia.edu/74067935/Development_and_single_laboratory_validation_of_an_optical_biosensor_assay_for_tetrodotoxin_detection_as_a_tool_to_combat_emerging_risks_in_European_seafood]
- 33. Validation and calibration of a novel GEM biosensor for ... [https://bmcbiotechnol.biomedcentral.com/articles/10.1186/s12896-023-00820-7]
- 34. 2025: Chromatography Goes Automated Sample Preparation [https://www.sepscience.com/chromatography-2025-sample-preparation-goes-automated-11259]
- 35. A fluorescent biosensor enables high-sensitivity ... [https://pmc.ncbi.nlm.nih.gov/articles/PMC12639942/]
- 36. HPLC 2025 Preview: Fundamentally Speaking (Part 1) [https://www.chromatographyonline.com/view/hplc-2025-preview-fundamentally-speaking-part-1-]
- 37. A high content assay for biosensor validation and ... [https://pmc.ncbi.nlm.nih.gov/articles/PMC4324324/]
- 38. Biosensor technologies for natural medicine discovery [https://www.sciencedirect.com/science/article/abs/pii/S0165993625003668]
- 39. A comprehensive review of aflatoxin detection methods [https://www.sciencedirect.com/science/article/abs/pii/S0026265X25019290]
- 40. and improvement of the existing methods for the... Comparison [https://pubs.rsc.org/en/content/articlehtml/2010/ay/b9ay00316a]
- 41. Development, optimization and validation of an ... [https://www.sciencedirect.com/science/article/pii/S0956713523002591]
- 42. Electrochemical Immunosensor for Detection of Aflatoxin ... [https://pmc.ncbi.nlm.nih.gov/articles/PMC5983252/]
- 43. An Impedance Based Electrochemical Immunosensor for ... [https://www.mdpi.com/2227-9040/8/4/121]
- 44. Reliable and disposable quantum dot-based electrochemical ... [https://pubmed.ncbi.nlm.nih.gov/32856110/]
- 45. Emerging nano sensing technologies for the detection of ... [https://pubs.rsc.org/en/content/articlehtml/2025/ra/d5ra06960b?page=search]
- 46. Automated Electrochemical Glucose Biosensor Platform as ... [https://www.frontiersin.org/journals/bioengineering-and-biotechnology/articles/10.3389/fbioe.2020.00436/full]
- 47. Real-time monitoring of fermentation processes in wine ... [https://www.sciencedirect.com/science/article/pii/S096399692500078X]
- 48. Enhancing Fermentation Process Monitoring through Data ... [https://pmc.ncbi.nlm.nih.gov/articles/PMC11351132/]
- 49. Towards yeast fermentation monitoring: Enhanced sensing ... [https://www.sciencedirect.com/science/article/pii/S2214180424000916]
- 50. Biosensors in Microbial Ecology: Revolutionizing Food ... [https://pmc.ncbi.nlm.nih.gov/articles/PMC12300841/]
- 51. Validation of Analytical Methods for Biomarkers Employed ... [https://pmc.ncbi.nlm.nih.gov/articles/PMC2744124/]
- 52. LC–MS-Based Proteomics for Protein Biomarker ... [https://www.chromatographyonline.com/view/lc-ms-based-proteomics-for-protein-biomarker-quantification-for-both-prognosis-and-diagnosis-in-the-clinical-setting]
- 53. Current applications of chromatographic methods for ... [https://www.sciencedirect.com/science/article/abs/pii/S0165993614000144]
- 54. Biosensing Strategies to Monitor Contaminants and Additives ... [https://pmc.ncbi.nlm.nih.gov/articles/PMC12293825/]
- 55. Calibration Practices in Clinical Mass Spectrometry [https://pmc.ncbi.nlm.nih.gov/articles/PMC9467832/]
- 56. Simultaneous correction for drift and non-spectroscopic ... [https://www.sciencedirect.com/science/article/abs/pii/S0584854703000958]
- 57. Biosensors, Artificial Intelligence Biosensors, False Results ... [https://www.mdpi.com/2075-4418/15/8/1037]
- 58. Evaluation of intensity drift correction strategies using ... [https://pmc.ncbi.nlm.nih.gov/articles/PMC5788449/]
- 59. Cross-compensation of FET sensor drift and matrix effects ... [https://www.sciencedirect.com/science/article/pii/S0925400521016919]
- 60. Magnet or Cell? A Comparison of High-Resolution Sector ... [https://www.chromatographyonline.com/view/magnet-or-cell-comparison-high-resolution-sector-field-icp-ms-and-collision-reaction-cell-quadrupo-0]
- 61. Multivariate Optimization of Electrochemical Biosensors for the ... [https://pmc.ncbi.nlm.nih.gov/articles/PMC10377565/]
- 62. Perspectives on systematic optimization of ultrasensitive ... [https://pmc.ncbi.nlm.nih.gov/articles/PMC11403992/]
- 63. Using Design of Experiments to Optimize a Screening ... [https://www.mdpi.com/1420-3049/26/11/3429]
- 64. Enhancing the performance of an in vitro RNA biosensor ... [https://pubmed.ncbi.nlm.nih.gov/40071731/]
- 65. Tuning the performance of a TphR-based terephthalate ... [https://www.sciencedirect.com/science/article/pii/S2214030124000191]
- 66. Validation parameters for a novel biosensor assay which ... [https://www.sciencedirect.com/science/article/abs/pii/S0022175997001403]
- 67. AI-Enhanced Surface Functionalization in Biosensors [https://www.sciencedirect.com/science/article/abs/pii/S0165993625003887]
- 68. Bioreceptors' immobilization by hydrogen bonding ... [https://pmc.ncbi.nlm.nih.gov/articles/PMC11473665/]
- 69. Surface immobilization strategies for the development of ... [https://www.sciencedirect.com/science/article/abs/pii/S0956566323003822]
- 70. Electrochemical biosensors based on the 3D immobilization of ... [https://pubs.rsc.org/en/content/articlehtml/2025/ra/d5ra03744a]
- 71. Algorithm assisted comprehensive optimization of SPR ... [https://www.sciencedirect.com/science/article/abs/pii/S0956566325007225]
- 72. - Sub capacitance-based biosensing of kanamycin using... femtomolar [https://pubmed.ncbi.nlm.nih.gov/37821740/]
- 73. Limit of Detection and Limit of Quantification Determination in Gas Chromatography | IntechOpen [https://www.intechopen.com/chapters/46058]
- 74. Limit of Blank, Limit of Detection and Limit of Quantitation - PMC [https://pmc.ncbi.nlm.nih.gov/articles/PMC2556583/]
- 75. On the Determination of Uncertainty and Limit of Detection in ... [https://pmc.ncbi.nlm.nih.gov/articles/PMC6068557/]
- 76. Analytical evaluation of sensor measurements | Analytical and Bioanalytical Chemistry [https://link.springer.com/article/10.1007/s00216-017-0624-z]
- 77. Determining LOD and LOQ Based on the Calibration Curve [https://www.sepscience.com/hplc-solutions-126-chromatographic-measurements-part-5-determining-lod-and-loq-based-on-the-calibration-curve-6959]
- 78. Developing and Validating a Robust RP-HPLC Method for ... [https://pmc.ncbi.nlm.nih.gov/articles/PMC12543500/]
- 79. Development and Validation of a High-Performance Liquid ... [https://www.mdpi.com/2227-9040/13/3/78]
- 80. Guided biosensing to trace endosulfan via graphene oxide ... [https://www.sciencedirect.com/science/article/abs/pii/S0141813025088580]
- 81. When lower isn't always better in biosensor research and ... [https://www.sciencedirect.com/science/article/abs/pii/S0956566324006766]
- 82. Comparison of biosensor platforms in the evaluation ... [https://www.sciencedirect.com/science/article/pii/S0003269716301592]
- 83. Validation of Stability-Indicating HPLC Methods for ... [https://www.chromatographyonline.com/view/validation-of-stability-indicating-hplc-methods-for-pharmaceuticals-overview-methodologies-and-case-studies]
- 84. Understanding Bland Altman analysis - PMC [https://pmc.ncbi.nlm.nih.gov/articles/PMC4470095/]
- 85. A Biosensor-Based Quantitative Analysis System of Major ... [https://pubmed.ncbi.nlm.nih.gov/31072054/]
- 86. Two Biosensors for the Determination of VEGF-R2 in ... [https://www.mdpi.com/1420-3049/28/1/155]
- 87. Plasmonic SPR biosensor with bayesian regression for ... [https://www.nature.com/articles/s41598-025-22949-5]
- 88. Comparative Study of Electrochemical Biosensors Based ... [https://pmc.ncbi.nlm.nih.gov/articles/PMC7495462/]
- 89. Recent Advances in Micro- and Nano-Enhanced Intravascular ... [https://pmc.ncbi.nlm.nih.gov/articles/PMC12349352/]
- 90. Wearable MOF biosensors: A new frontier in real-time ... [https://www.sciencedirect.com/science/article/abs/pii/S016599362500024X]
- 91. A high-precision multimodal optoelectronic-graph ... [https://www.sciencedirect.com/science/article/abs/pii/S0263224125028568]
- 92. The High-Precision Liquid Chromatography with ... [https://pmc.ncbi.nlm.nih.gov/articles/PMC10818480/]
- 93. Stability in biosensors derived from domain map analysis of ... [https://pmc.ncbi.nlm.nih.gov/articles/PMC11077358/]
- 94. New research in continuous biosensing: Long-term stability [https://amf.ch/new-research-in-continuous-biosensing-long-term-stability/]
- 95. Chromatography 2025: The Trends Transforming ... [https://www.sepscience.com/chromatography-2025-the-trends-transforming-laboratories-11149]
- 96. Use of Biosensors as Alternatives to Current Regulatory ... [https://pmc.ncbi.nlm.nih.gov/articles/PMC3260648/]
- 97. Graphene biosensors outcompete ELISA and Simoa for ... [https://www.graphenea.com/blogs/graphene-news/graphene-biosensors-outcompete-elisa-and-simoa-for-point-of-care-diagnostics?srsltid=AfmBOopXJLXj1zG6v6QxtP9TmT9e0Fldn7kDZkTY3Af3rKQ3uQmjx1Vt]
- 98. Developing a standardized procedure for SPE-enzyme ... [https://www.sciencedirect.com/science/article/abs/pii/S1001074225004000]
- 99. A Rapid LC–MS/MS Method for Quantification of Biogenic ... [https://pmc.ncbi.nlm.nih.gov/articles/PMC12452713/]
- 100. – LC / MS separation and quantitation of ribavirin in chicken and... MS [https://bmcchem.biomedcentral.com/articles/10.1186/s13065-023-01010-4]
- 101. analysis of Comparative - LC / MS and electrochemical... MS [https://link.springer.com/article/10.1007/s00604-025-07652-6]
- 102. Comparison of ELISA and SPR biosensor technology for ... [https://pubmed.ncbi.nlm.nih.gov/19926541/]
- 103. A challenge in biosensors: Is it better to measure a photon ... [https://www.sciencedirect.com/science/article/abs/pii/S0956566320300907]